Winona, MN Map & Demographics
Winona Map
Winona Overview
$30,829
PER CAPITA INCOME
$89,052
AVG FAMILY INCOME
$52,500
AVG HOUSEHOLD INCOME
38.4%
WAGE / INCOME GAP [ % ]
61.6¢/ $1
WAGE / INCOME GAP [ $ ]
$10,456
FAMILY INCOME DEFICIT
0.45
INEQUALITY / GINI INDEX
26,083
TOTAL POPULATION
12,253
MALE POPULATION
13,830
FEMALE POPULATION
88.60
MALES / 100 FEMALES
112.87
FEMALES / 100 MALES
30.7
MEDIAN AGE
2.8
AVG FAMILY SIZE
2.1
AVG HOUSEHOLD SIZE
15,190
LABOR FORCE [ PEOPLE ]
65.6%
PERCENT IN LABOR FORCE
2.7%
UNEMPLOYMENT RATE
Winona Zip Codes
Winona Area Codes
Income in Winona
Income Overview in Winona
Per Capita Income in Winona is $30,829, while median incomes of families and households are $89,052 and $52,500 respectively.
| Characteristic | Number | Measure |
| Per Capita Income | 26,083 | $30,829 |
| Median Family Income | 4,577 | $89,052 |
| Mean Family Income | 4,577 | $103,133 |
| Median Household Income | 10,902 | $52,500 |
| Mean Household Income | 10,902 | $70,804 |
| Income Deficit | 4,577 | $10,456 |
| Wage / Income Gap (%) | 26,083 | 38.40% |
| Wage / Income Gap ($) | 26,083 | 61.60¢ per $1 |
| Gini / Inequality Index | 26,083 | 0.45 |
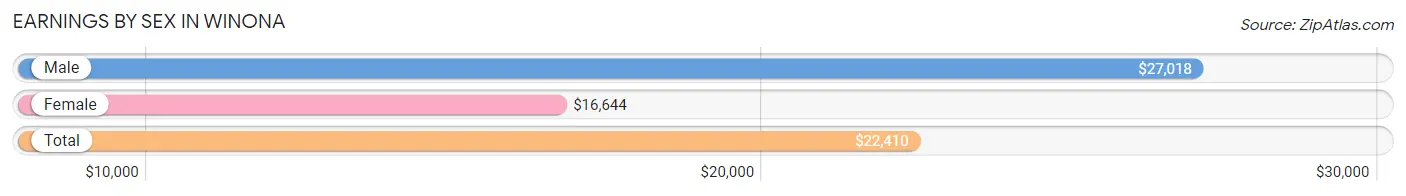
Earnings by Sex in Winona
Average Earnings in Winona are $22,410, $27,018 for men and $16,644 for women, a difference of 38.4%.
| Sex | Number | Average Earnings |
| Male | 8,463 (48.7%) | $27,018 |
| Female | 8,929 (51.3%) | $16,644 |
| Total | 17,392 (100.0%) | $22,410 |
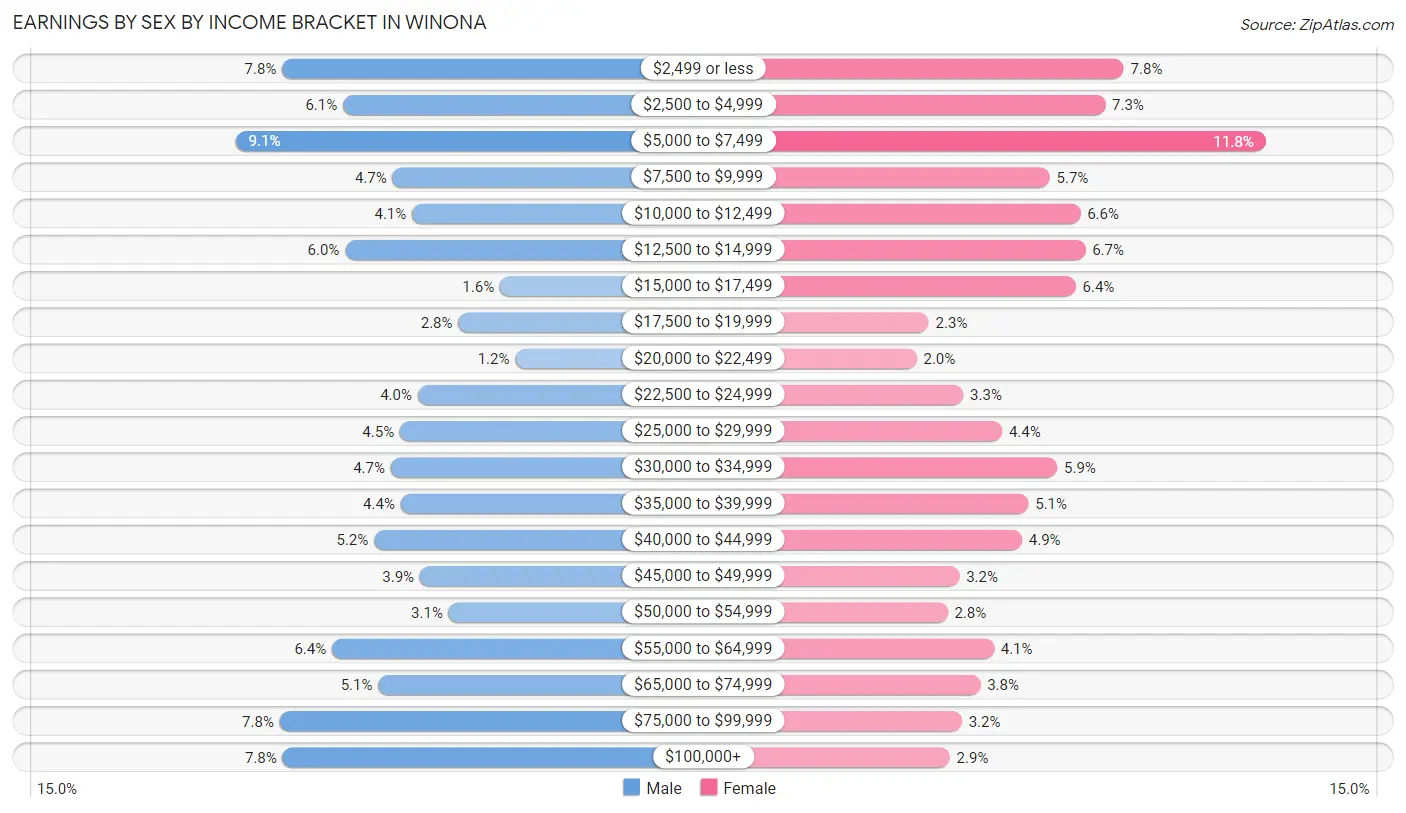
Earnings by Sex by Income Bracket in Winona
The most common earnings brackets in Winona are $5,000 to $7,499 for men (768 | 9.1%) and $5,000 to $7,499 for women (1,051 | 11.8%).
| Income | Male | Female |
| $2,499 or less | 657 (7.8%) | 695 (7.8%) |
| $2,500 to $4,999 | 512 (6.0%) | 648 (7.3%) |
| $5,000 to $7,499 | 768 (9.1%) | 1,051 (11.8%) |
| $7,500 to $9,999 | 394 (4.7%) | 509 (5.7%) |
| $10,000 to $12,499 | 348 (4.1%) | 586 (6.6%) |
| $12,500 to $14,999 | 507 (6.0%) | 598 (6.7%) |
| $15,000 to $17,499 | 139 (1.6%) | 574 (6.4%) |
| $17,500 to $19,999 | 238 (2.8%) | 205 (2.3%) |
| $20,000 to $22,499 | 102 (1.2%) | 175 (2.0%) |
| $22,500 to $24,999 | 334 (4.0%) | 292 (3.3%) |
| $25,000 to $29,999 | 377 (4.4%) | 389 (4.4%) |
| $30,000 to $34,999 | 399 (4.7%) | 528 (5.9%) |
| $35,000 to $39,999 | 375 (4.4%) | 455 (5.1%) |
| $40,000 to $44,999 | 438 (5.2%) | 439 (4.9%) |
| $45,000 to $49,999 | 329 (3.9%) | 282 (3.2%) |
| $50,000 to $54,999 | 261 (3.1%) | 253 (2.8%) |
| $55,000 to $64,999 | 538 (6.4%) | 369 (4.1%) |
| $65,000 to $74,999 | 428 (5.1%) | 335 (3.7%) |
| $75,000 to $99,999 | 663 (7.8%) | 288 (3.2%) |
| $100,000+ | 656 (7.7%) | 258 (2.9%) |
| Total | 8,463 (100.0%) | 8,929 (100.0%) |
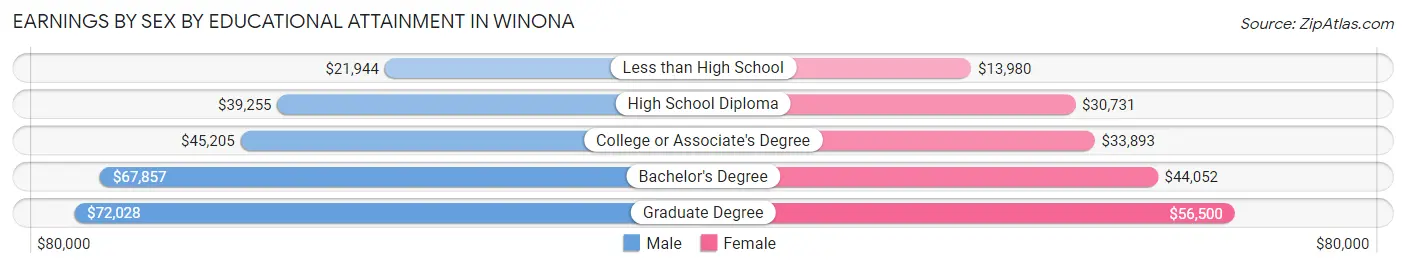
Earnings by Sex by Educational Attainment in Winona
Average earnings in Winona are $45,693 for men and $35,993 for women, a difference of 21.2%. Men with an educational attainment of graduate degree enjoy the highest average annual earnings of $72,028, while those with less than high school education earn the least with $21,944. Women with an educational attainment of graduate degree earn the most with the average annual earnings of $56,500, while those with less than high school education have the smallest earnings of $13,980.
| Educational Attainment | Male Income | Female Income |
| Less than High School | $21,944 | $13,980 |
| High School Diploma | $39,255 | $30,731 |
| College or Associate's Degree | $45,205 | $33,893 |
| Bachelor's Degree | $67,857 | $44,052 |
| Graduate Degree | $72,028 | $56,500 |
| Total | $45,693 | $35,993 |
Family Income in Winona
Family Income Brackets in Winona
According to the Winona family income data, there are 1,062 families falling into the $100,000 to $149,999 income range, which is the most common income bracket and makes up 23.2% of all families. Conversely, the $10,000 to $14,999 income bracket is the least frequent group with only 32 families (0.7%) belonging to this category.
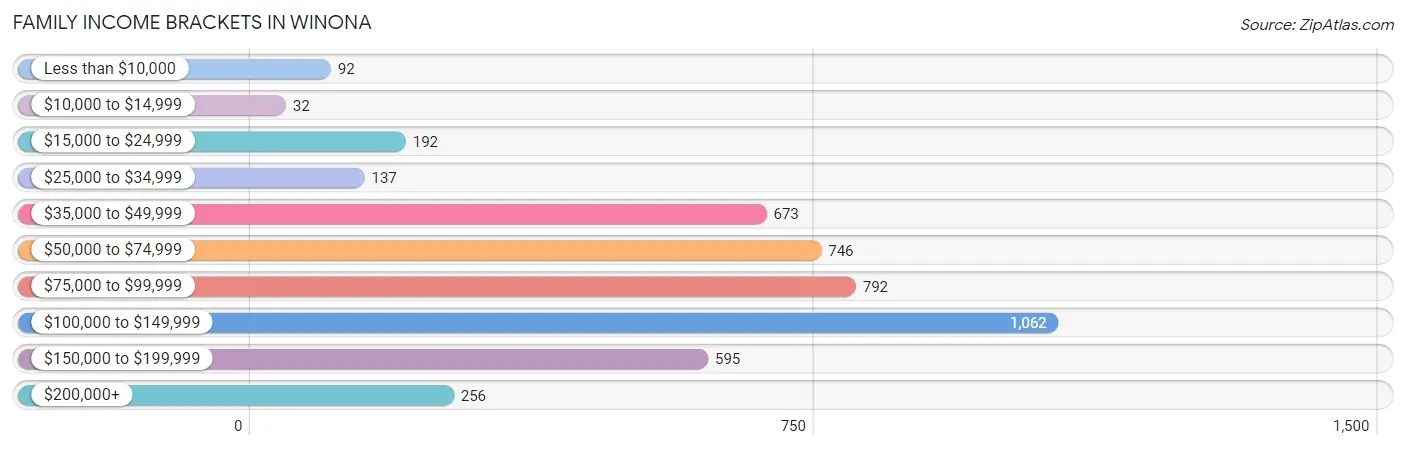
| Income Bracket | # Families | % Families |
| Less than $10,000 | 92 | 2.0% |
| $10,000 to $14,999 | 32 | 0.7% |
| $15,000 to $24,999 | 192 | 4.2% |
| $25,000 to $34,999 | 137 | 3.0% |
| $35,000 to $49,999 | 673 | 14.7% |
| $50,000 to $74,999 | 746 | 16.3% |
| $75,000 to $99,999 | 792 | 17.3% |
| $100,000 to $149,999 | 1,062 | 23.2% |
| $150,000 to $199,999 | 595 | 13.0% |
| $200,000+ | 256 | 5.6% |
Family Income by Famaliy Size in Winona
4-person families (419 | 9.1%) account for the highest median family income in Winona with $119,950 per family, while 2-person families (2,811 | 61.4%) have the highest median income of $38,767 per family member.
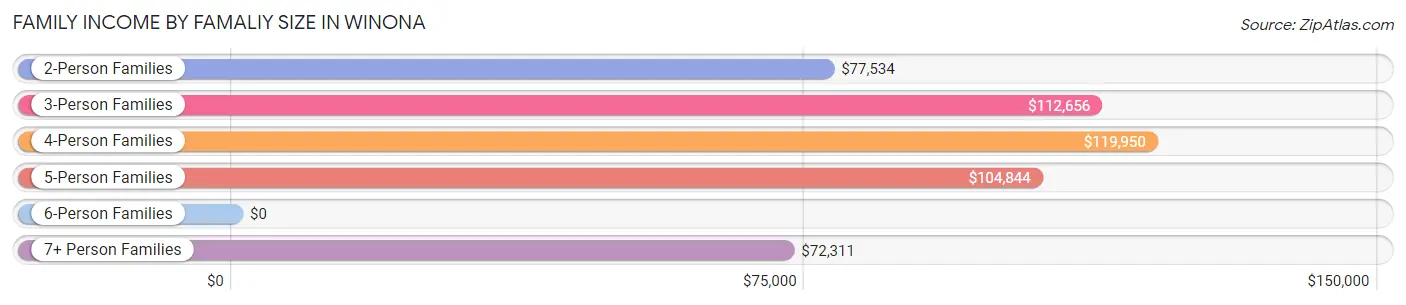
| Income Bracket | # Families | Median Income |
| 2-Person Families | 2,811 (61.4%) | $77,534 |
| 3-Person Families | 926 (20.2%) | $112,656 |
| 4-Person Families | 419 (9.1%) | $119,950 |
| 5-Person Families | 260 (5.7%) | $104,844 |
| 6-Person Families | 34 (0.7%) | $0 |
| 7+ Person Families | 127 (2.8%) | $72,311 |
| Total | 4,577 (100.0%) | $89,052 |
Family Income by Number of Earners in Winona
The median family income in Winona is $89,052, with families comprising 3+ earners (438) having the highest median family income of $133,824, while families with no earners (643) have the lowest median family income of $57,470, accounting for 9.6% and 14.1% of families, respectively.
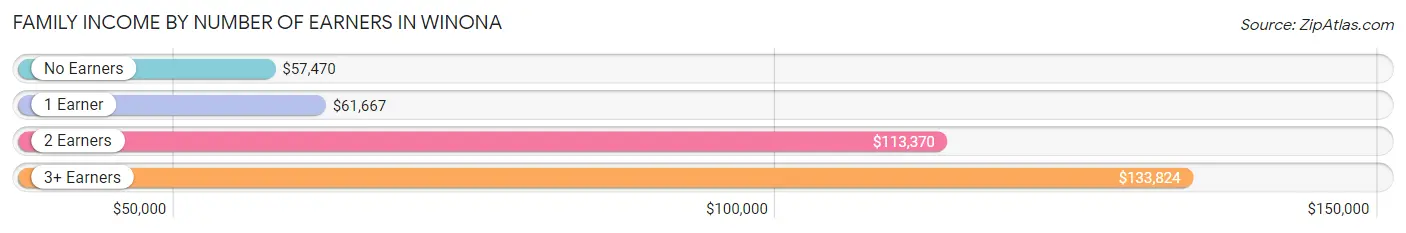
| Number of Earners | # Families | Median Income |
| No Earners | 643 (14.1%) | $57,470 |
| 1 Earner | 1,546 (33.8%) | $61,667 |
| 2 Earners | 1,950 (42.6%) | $113,370 |
| 3+ Earners | 438 (9.6%) | $133,824 |
| Total | 4,577 (100.0%) | $89,052 |
Household Income in Winona
Household Income Brackets in Winona
With 1,755 households falling in the category, the $50,000 to $74,999 income range is the most frequent in Winona, accounting for 16.1% of all households. In contrast, only 305 households (2.8%) fall into the $200,000+ income bracket, making it the least populous group.
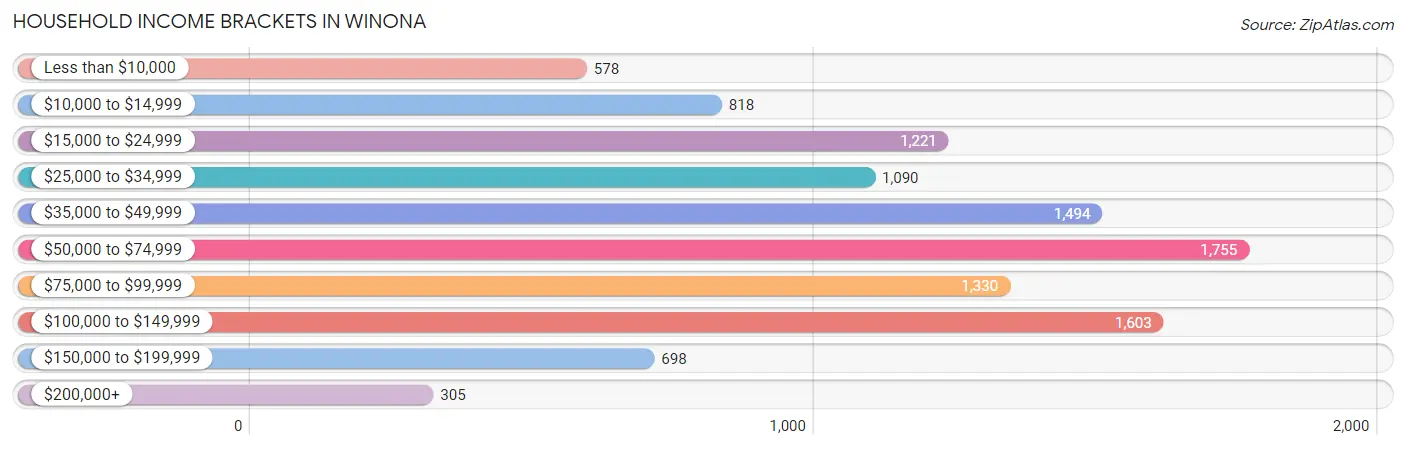
| Income Bracket | # Households | % Households |
| Less than $10,000 | 578 | 5.3% |
| $10,000 to $14,999 | 818 | 7.5% |
| $15,000 to $24,999 | 1,221 | 11.2% |
| $25,000 to $34,999 | 1,090 | 10.0% |
| $35,000 to $49,999 | 1,494 | 13.7% |
| $50,000 to $74,999 | 1,755 | 16.1% |
| $75,000 to $99,999 | 1,330 | 12.2% |
| $100,000 to $149,999 | 1,603 | 14.7% |
| $150,000 to $199,999 | 698 | 6.4% |
| $200,000+ | 305 | 2.8% |
Household Income by Householder Age in Winona
The median household income in Winona is $52,500, with the highest median household income of $70,655 found in the 45 to 64 years age bracket for the primary householder. A total of 2,987 households (27.4%) fall into this category. Meanwhile, the 15 to 24 years age bracket for the primary householder has the lowest median household income of $25,757, with 2,064 households (18.9%) in this group.
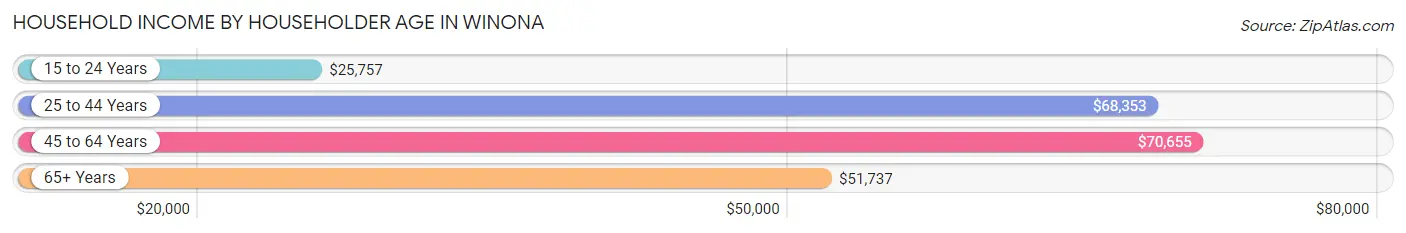
| Income Bracket | # Households | Median Income |
| 15 to 24 Years | 2,064 (18.9%) | $25,757 |
| 25 to 44 Years | 3,016 (27.7%) | $68,353 |
| 45 to 64 Years | 2,987 (27.4%) | $70,655 |
| 65+ Years | 2,835 (26.0%) | $51,737 |
| Total | 10,902 (100.0%) | $52,500 |
Poverty in Winona
Income Below Poverty by Sex and Age in Winona
With 19.0% poverty level for males and 23.4% for females among the residents of Winona, 18 to 24 year old males and 18 to 24 year old females are the most vulnerable to poverty, with 1,140 males (46.1%) and 1,510 females (53.9%) in their respective age groups living below the poverty level.
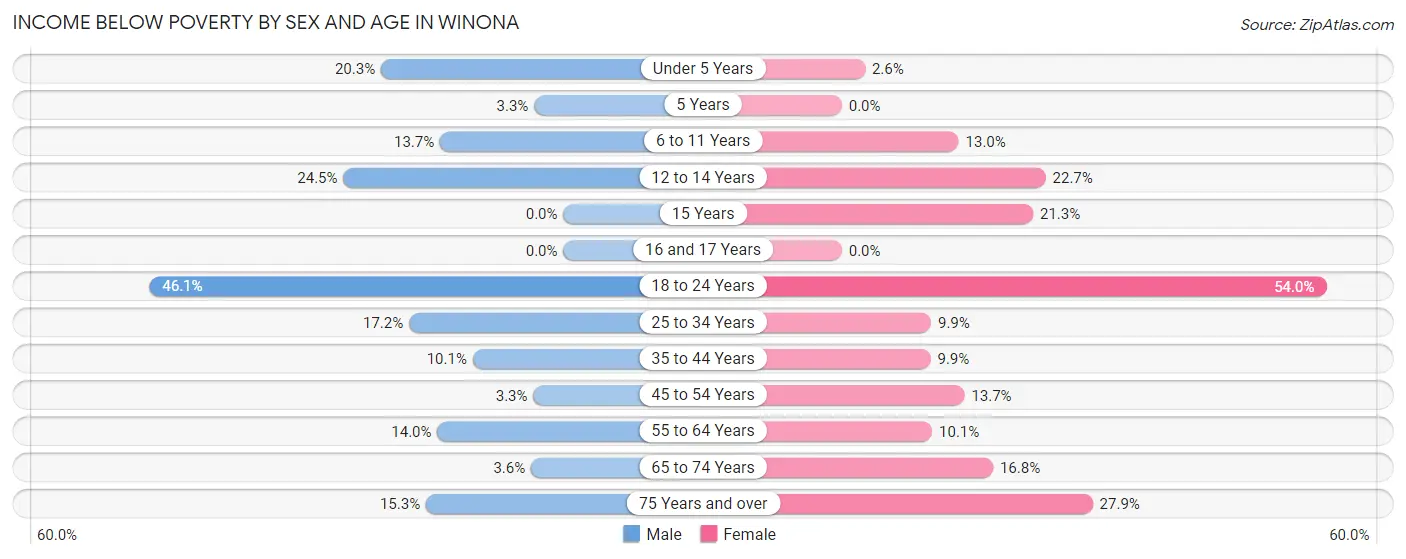
| Age Bracket | Male | Female |
| Under 5 Years | 79 (20.3%) | 11 (2.6%) |
| 5 Years | 5 (3.3%) | 0 (0.0%) |
| 6 to 11 Years | 81 (13.7%) | 64 (13.0%) |
| 12 to 14 Years | 37 (24.5%) | 64 (22.7%) |
| 15 Years | 0 (0.0%) | 36 (21.3%) |
| 16 and 17 Years | 0 (0.0%) | 0 (0.0%) |
| 18 to 24 Years | 1,140 (46.1%) | 1,510 (53.9%) |
| 25 to 34 Years | 286 (17.2%) | 134 (9.9%) |
| 35 to 44 Years | 124 (10.1%) | 99 (9.9%) |
| 45 to 54 Years | 37 (3.3%) | 138 (13.7%) |
| 55 to 64 Years | 165 (14.0%) | 160 (10.1%) |
| 65 to 74 Years | 43 (3.6%) | 212 (16.8%) |
| 75 Years and over | 123 (15.3%) | 342 (27.9%) |
| Total | 2,120 (19.0%) | 2,770 (23.4%) |
Income Above Poverty by Sex and Age in Winona
According to the poverty statistics in Winona, males aged 15 years and females aged 5 years are the age groups that are most secure financially, with 100.0% of males and 100.0% of females in these age groups living above the poverty line.
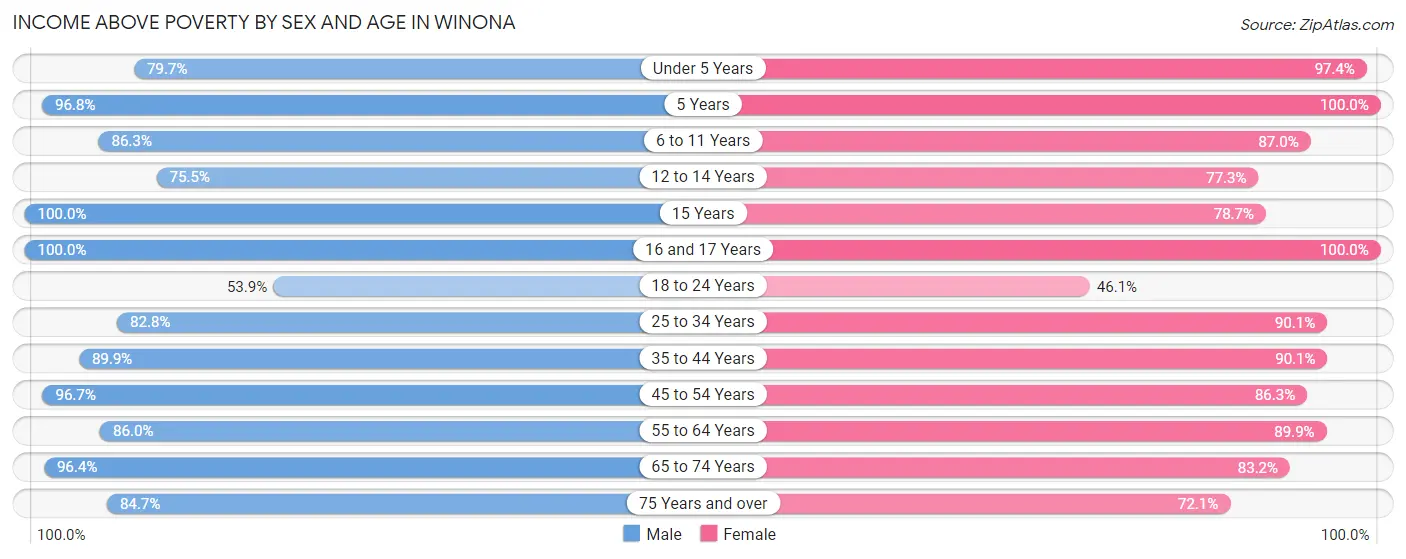
| Age Bracket | Male | Female |
| Under 5 Years | 310 (79.7%) | 415 (97.4%) |
| 5 Years | 149 (96.8%) | 121 (100.0%) |
| 6 to 11 Years | 509 (86.3%) | 428 (87.0%) |
| 12 to 14 Years | 114 (75.5%) | 218 (77.3%) |
| 15 Years | 90 (100.0%) | 133 (78.7%) |
| 16 and 17 Years | 142 (100.0%) | 100 (100.0%) |
| 18 to 24 Years | 1,333 (53.9%) | 1,289 (46.1%) |
| 25 to 34 Years | 1,379 (82.8%) | 1,214 (90.1%) |
| 35 to 44 Years | 1,105 (89.9%) | 903 (90.1%) |
| 45 to 54 Years | 1,071 (96.7%) | 872 (86.3%) |
| 55 to 64 Years | 1,011 (86.0%) | 1,430 (89.9%) |
| 65 to 74 Years | 1,150 (96.4%) | 1,047 (83.2%) |
| 75 Years and over | 681 (84.7%) | 882 (72.1%) |
| Total | 9,044 (81.0%) | 9,052 (76.6%) |
Income Below Poverty Among Married-Couple Families in Winona
The poverty statistics for married-couple families in Winona show that 3.4% or 116 of the total 3,437 families live below the poverty line. Families with 5 or more children have the highest poverty rate of 34.0%, comprising of 33 families. On the other hand, families with 1 or 2 children have the lowest poverty rate of 1.4%, which includes 9 families.
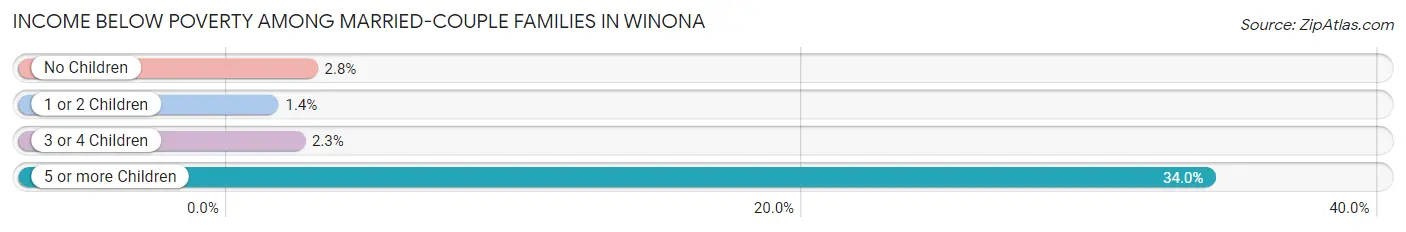
| Children | Above Poverty | Below Poverty |
| No Children | 2,419 (97.2%) | 69 (2.8%) |
| 1 or 2 Children | 628 (98.6%) | 9 (1.4%) |
| 3 or 4 Children | 210 (97.7%) | 5 (2.3%) |
| 5 or more Children | 64 (66.0%) | 33 (34.0%) |
| Total | 3,321 (96.6%) | 116 (3.4%) |
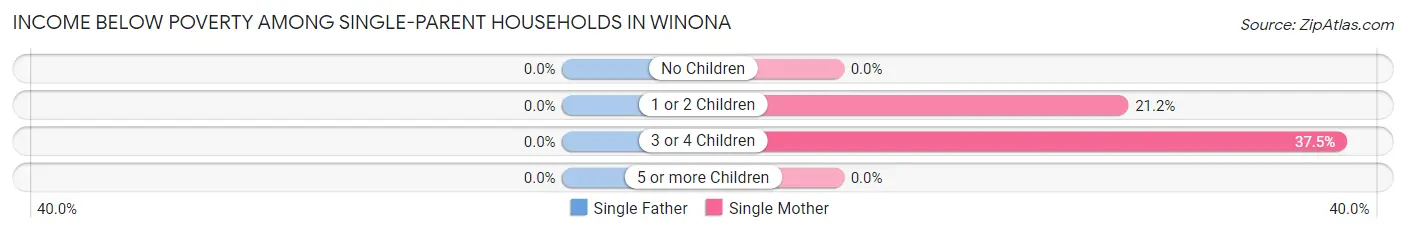
Income Below Poverty Among Single-Parent Households in Winona
| Children | Single Father | Single Mother |
| No Children | 0 (0.0%) | 0 (0.0%) |
| 1 or 2 Children | 0 (0.0%) | 85 (21.2%) |
| 3 or 4 Children | 0 (0.0%) | 18 (37.5%) |
| 5 or more Children | 0 (0.0%) | 0 (0.0%) |
| Total | 0 (0.0%) | 103 (14.0%) |
Income Below Poverty Among Married-Couple vs Single-Parent Households in Winona
The poverty data for Winona shows that 116 of the married-couple family households (3.4%) and 103 of the single-parent households (9.0%) are living below the poverty level. Within the married-couple family households, those with 5 or more children have the highest poverty rate, with 33 households (34.0%) falling below the poverty line. Among the single-parent households, those with 3 or 4 children have the highest poverty rate, with 18 household (22.0%) living below poverty.
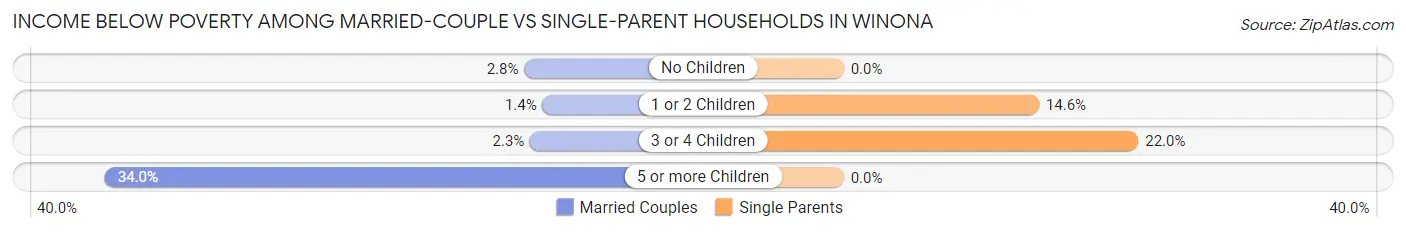
| Children | Married-Couple Families | Single-Parent Households |
| No Children | 69 (2.8%) | 0 (0.0%) |
| 1 or 2 Children | 9 (1.4%) | 85 (14.5%) |
| 3 or 4 Children | 5 (2.3%) | 18 (22.0%) |
| 5 or more Children | 33 (34.0%) | 0 (0.0%) |
| Total | 116 (3.4%) | 103 (9.0%) |
Race in Winona
The most populous races in Winona are White / Caucasian (23,656 | 90.7%), Hispanic or Latino (1,006 | 3.9%), and Two or more Races (777 | 3.0%).
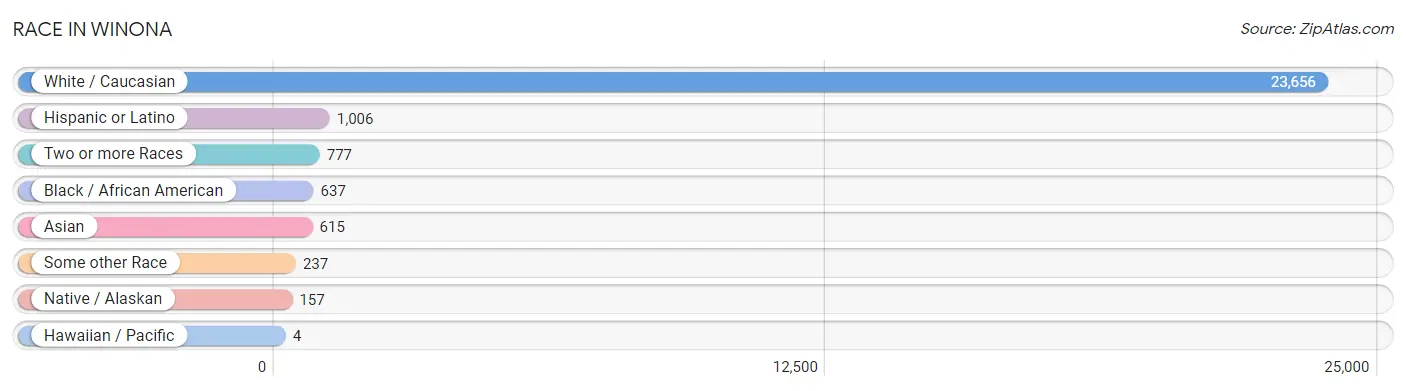
| Race | # Population | % Population |
| Asian | 615 | 2.4% |
| Black / African American | 637 | 2.4% |
| Hawaiian / Pacific | 4 | 0.0% |
| Hispanic or Latino | 1,006 | 3.9% |
| Native / Alaskan | 157 | 0.6% |
| White / Caucasian | 23,656 | 90.7% |
| Two or more Races | 777 | 3.0% |
| Some other Race | 237 | 0.9% |
| Total | 26,083 | 100.0% |
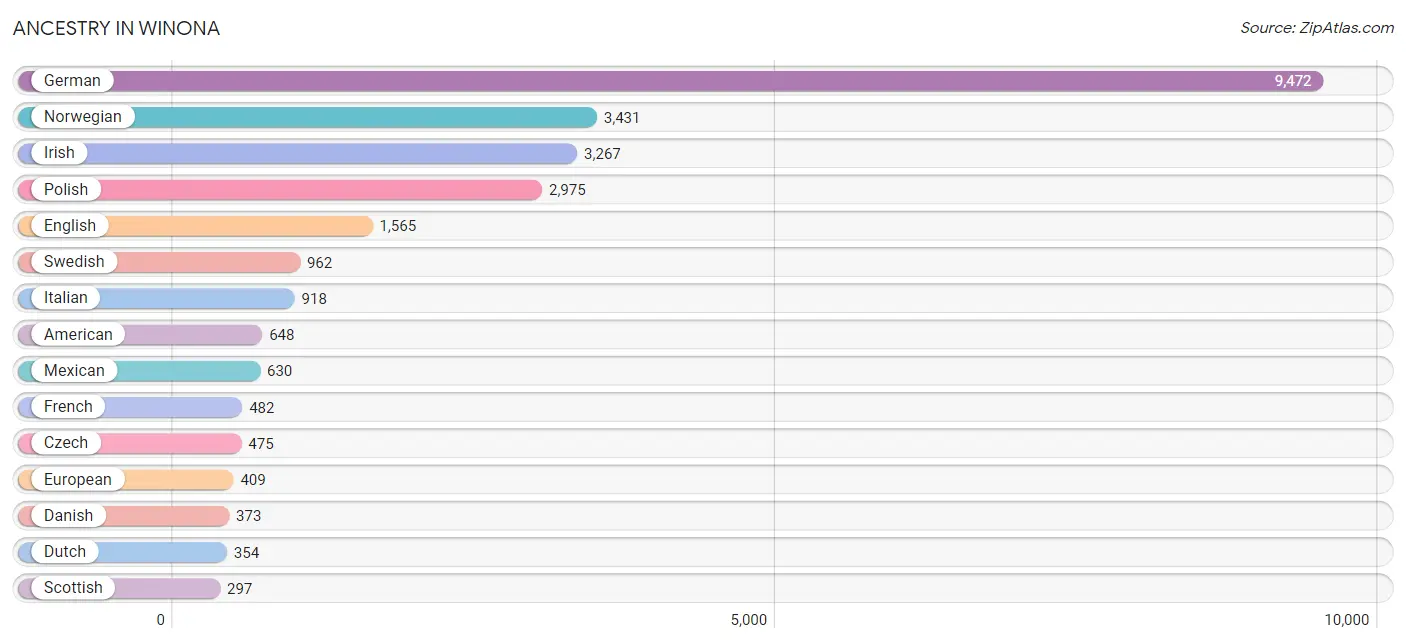
Ancestry in Winona
The most populous ancestries reported in Winona are German (9,472 | 36.3%), Norwegian (3,431 | 13.2%), Irish (3,267 | 12.5%), Polish (2,975 | 11.4%), and English (1,565 | 6.0%), together accounting for 79.4% of all Winona residents.
| Ancestry | # Population | % Population |
| African | 17 | 0.1% |
| American | 648 | 2.5% |
| Apache | 13 | 0.1% |
| Arab | 31 | 0.1% |
| Armenian | 13 | 0.1% |
| Austrian | 69 | 0.3% |
| Bangladeshi | 143 | 0.5% |
| Bhutanese | 13 | 0.1% |
| Blackfeet | 7 | 0.0% |
| British | 39 | 0.2% |
| British West Indian | 13 | 0.1% |
| Bulgarian | 10 | 0.0% |
| Burmese | 57 | 0.2% |
| Cajun | 28 | 0.1% |
| Canadian | 11 | 0.0% |
| Central American | 60 | 0.2% |
| Cherokee | 62 | 0.2% |
| Chippewa | 56 | 0.2% |
| Choctaw | 4 | 0.0% |
| Colombian | 59 | 0.2% |
| Czech | 475 | 1.8% |
| Czechoslovakian | 6 | 0.0% |
| Danish | 373 | 1.4% |
| Dutch | 354 | 1.4% |
| Eastern European | 43 | 0.2% |
| Egyptian | 19 | 0.1% |
| English | 1,565 | 6.0% |
| Ethiopian | 1 | 0.0% |
| European | 409 | 1.6% |
| Finnish | 245 | 0.9% |
| French | 482 | 1.8% |
| French American Indian | 18 | 0.1% |
| French Canadian | 125 | 0.5% |
| German | 9,472 | 36.3% |
| Greek | 20 | 0.1% |
| Guatemalan | 53 | 0.2% |
| Haitian | 62 | 0.2% |
| Hungarian | 111 | 0.4% |
| Indian (Asian) | 177 | 0.7% |
| Irish | 3,267 | 12.5% |
| Italian | 918 | 3.5% |
| Japanese | 77 | 0.3% |
| Kenyan | 53 | 0.2% |
| Korean | 122 | 0.5% |
| Liberian | 23 | 0.1% |
| Lithuanian | 30 | 0.1% |
| Luxembourger | 111 | 0.4% |
| Malaysian | 1 | 0.0% |
| Mexican | 630 | 2.4% |
| Mongolian | 43 | 0.2% |
| Native Hawaiian | 26 | 0.1% |
| Navajo | 59 | 0.2% |
| Norwegian | 3,431 | 13.2% |
| Peruvian | 48 | 0.2% |
| Polish | 2,975 | 11.4% |
| Portuguese | 41 | 0.2% |
| Puerto Rican | 91 | 0.4% |
| Romanian | 33 | 0.1% |
| Russian | 125 | 0.5% |
| Salvadoran | 7 | 0.0% |
| Scandinavian | 290 | 1.1% |
| Scotch-Irish | 214 | 0.8% |
| Scottish | 297 | 1.1% |
| Serbian | 2 | 0.0% |
| Sioux | 2 | 0.0% |
| Slavic | 13 | 0.1% |
| Slovak | 62 | 0.2% |
| Somali | 41 | 0.2% |
| South American | 131 | 0.5% |
| Spaniard | 49 | 0.2% |
| Sri Lankan | 77 | 0.3% |
| Subsaharan African | 183 | 0.7% |
| Swedish | 962 | 3.7% |
| Swiss | 220 | 0.8% |
| Syrian | 12 | 0.1% |
| Turkish | 18 | 0.1% |
| Ukrainian | 200 | 0.8% |
| Venezuelan | 24 | 0.1% |
| Welsh | 117 | 0.4% | View All 79 Rows |
Immigrants in Winona
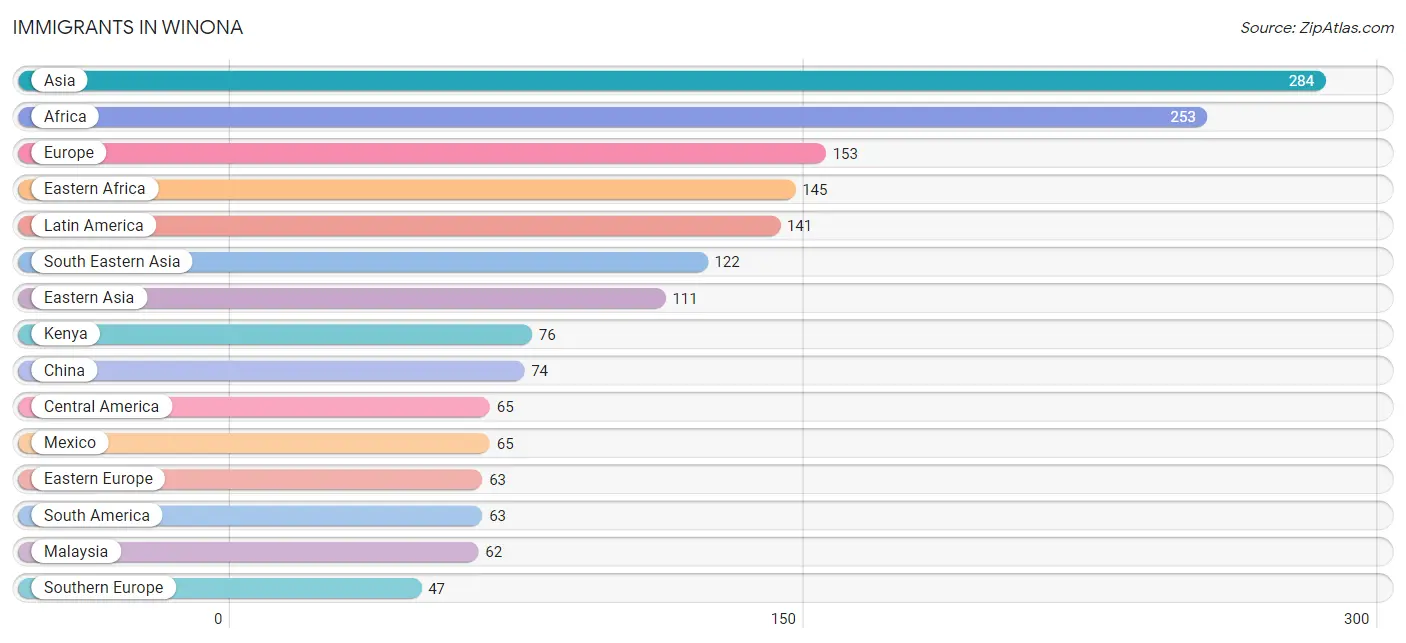
The most numerous immigrant groups reported in Winona came from Asia (284 | 1.1%), Africa (253 | 1.0%), Europe (153 | 0.6%), Eastern Africa (145 | 0.6%), and Latin America (141 | 0.5%), together accounting for 3.7% of all Winona residents.
| Immigration Origin | # Population | % Population |
| Africa | 253 | 1.0% |
| Asia | 284 | 1.1% |
| Bangladesh | 33 | 0.1% |
| Cameroon | 17 | 0.1% |
| Canada | 43 | 0.2% |
| Caribbean | 13 | 0.1% |
| Central America | 65 | 0.3% |
| China | 74 | 0.3% |
| Eastern Africa | 145 | 0.6% |
| Eastern Asia | 111 | 0.4% |
| Eastern Europe | 63 | 0.2% |
| Egypt | 16 | 0.1% |
| England | 10 | 0.0% |
| Ethiopia | 1 | 0.0% |
| Europe | 153 | 0.6% |
| Germany | 18 | 0.1% |
| Ireland | 15 | 0.1% |
| Italy | 32 | 0.1% |
| Japan | 13 | 0.1% |
| Kenya | 76 | 0.3% |
| Korea | 24 | 0.1% |
| Laos | 18 | 0.1% |
| Latin America | 141 | 0.5% |
| Malaysia | 62 | 0.2% |
| Mexico | 65 | 0.3% |
| Middle Africa | 17 | 0.1% |
| Nigeria | 15 | 0.1% |
| Northern Africa | 16 | 0.1% |
| Northern Europe | 25 | 0.1% |
| Peru | 39 | 0.2% |
| Philippines | 9 | 0.0% |
| Romania | 22 | 0.1% |
| Russia | 11 | 0.0% |
| Somalia | 30 | 0.1% |
| South America | 63 | 0.2% |
| South Central Asia | 33 | 0.1% |
| South Eastern Asia | 122 | 0.5% |
| Southern Europe | 47 | 0.2% |
| Spain | 15 | 0.1% |
| Taiwan | 12 | 0.1% |
| Thailand | 33 | 0.1% |
| Turkey | 18 | 0.1% |
| Ukraine | 30 | 0.1% |
| Venezuela | 24 | 0.1% |
| Western Africa | 15 | 0.1% |
| Western Asia | 18 | 0.1% |
| Western Europe | 18 | 0.1% | View All 47 Rows |
Sex and Age in Winona
Sex and Age in Winona
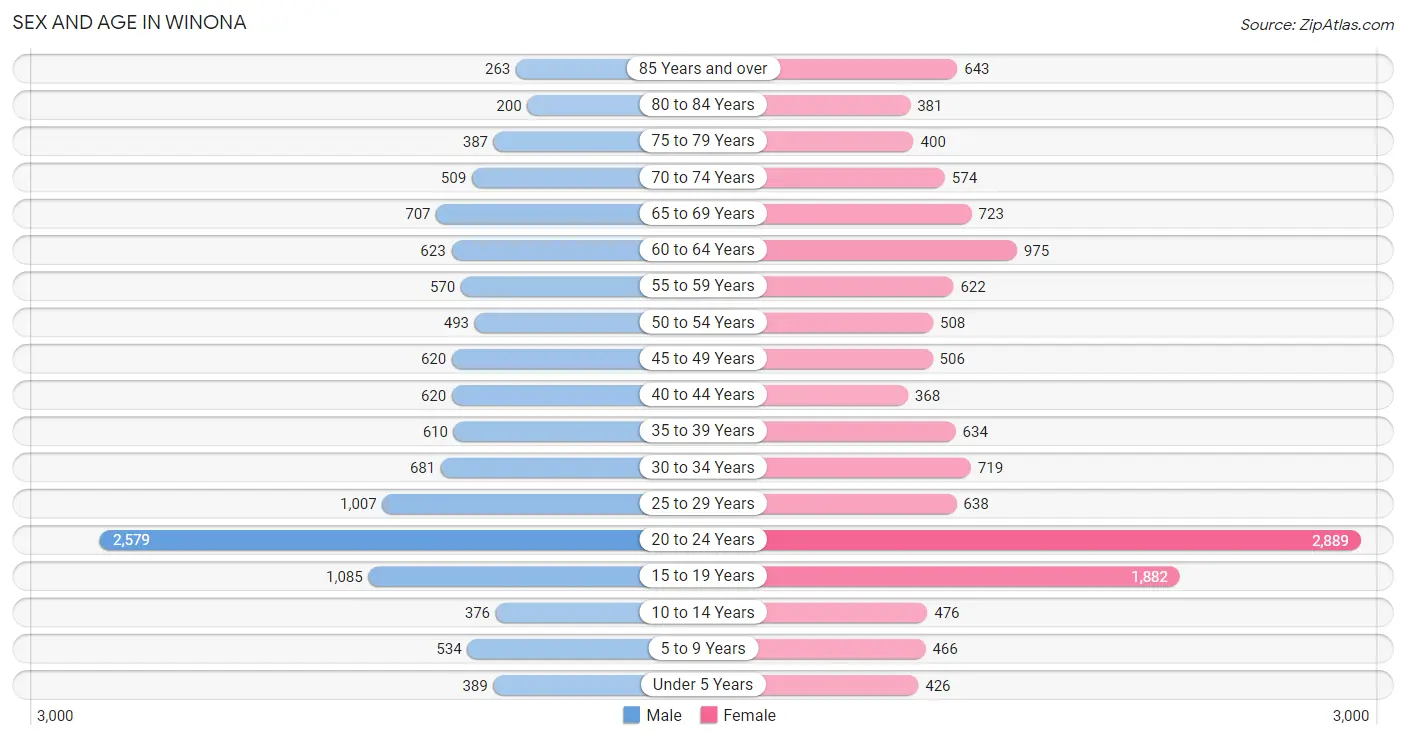
The most populous age groups in Winona are 20 to 24 Years (2,579 | 21.0%) for men and 20 to 24 Years (2,889 | 20.9%) for women.
| Age Bracket | Male | Female |
| Under 5 Years | 389 (3.2%) | 426 (3.1%) |
| 5 to 9 Years | 534 (4.4%) | 466 (3.4%) |
| 10 to 14 Years | 376 (3.1%) | 476 (3.4%) |
| 15 to 19 Years | 1,085 (8.8%) | 1,882 (13.6%) |
| 20 to 24 Years | 2,579 (21.0%) | 2,889 (20.9%) |
| 25 to 29 Years | 1,007 (8.2%) | 638 (4.6%) |
| 30 to 34 Years | 681 (5.6%) | 719 (5.2%) |
| 35 to 39 Years | 610 (5.0%) | 634 (4.6%) |
| 40 to 44 Years | 620 (5.1%) | 368 (2.7%) |
| 45 to 49 Years | 620 (5.1%) | 506 (3.7%) |
| 50 to 54 Years | 493 (4.0%) | 508 (3.7%) |
| 55 to 59 Years | 570 (4.6%) | 622 (4.5%) |
| 60 to 64 Years | 623 (5.1%) | 975 (7.0%) |
| 65 to 69 Years | 707 (5.8%) | 723 (5.2%) |
| 70 to 74 Years | 509 (4.2%) | 574 (4.2%) |
| 75 to 79 Years | 387 (3.2%) | 400 (2.9%) |
| 80 to 84 Years | 200 (1.6%) | 381 (2.8%) |
| 85 Years and over | 263 (2.1%) | 643 (4.6%) |
| Total | 12,253 (100.0%) | 13,830 (100.0%) |
Families and Households in Winona
Median Family Size in Winona
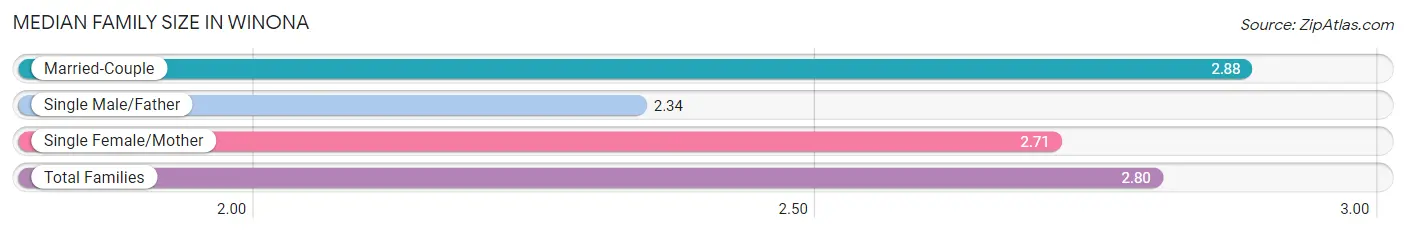
The median family size in Winona is 2.80 persons per family, with married-couple families (3,437 | 75.1%) accounting for the largest median family size of 2.88 persons per family. On the other hand, single male/father families (402 | 8.8%) represent the smallest median family size with 2.34 persons per family.
| Family Type | # Families | Family Size |
| Married-Couple | 3,437 (75.1%) | 2.88 |
| Single Male/Father | 402 (8.8%) | 2.34 |
| Single Female/Mother | 738 (16.1%) | 2.71 |
| Total Families | 4,577 (100.0%) | 2.80 |
Median Household Size in Winona
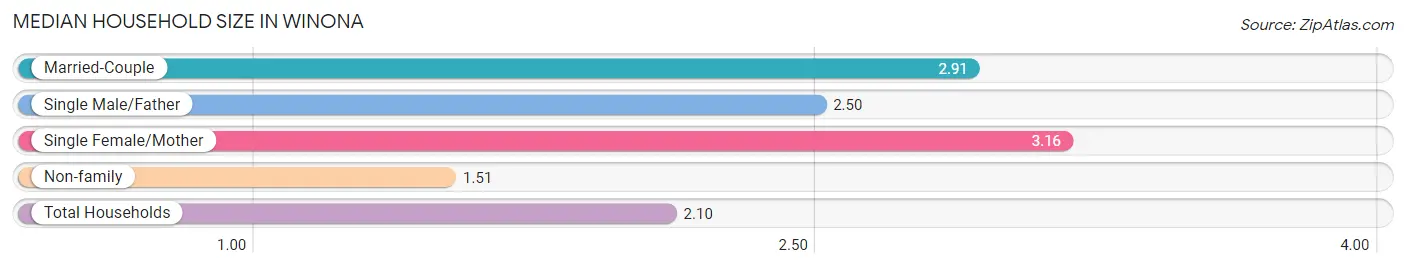
The median household size in Winona is 2.10 persons per household, with single female/mother households (738 | 6.8%) accounting for the largest median household size of 3.16 persons per household. non-family households (6,325 | 58.0%) represent the smallest median household size with 1.51 persons per household.
| Household Type | # Households | Household Size |
| Married-Couple | 3,437 (31.5%) | 2.91 |
| Single Male/Father | 402 (3.7%) | 2.50 |
| Single Female/Mother | 738 (6.8%) | 3.16 |
| Non-family | 6,325 (58.0%) | 1.51 |
| Total Households | 10,902 (100.0%) | 2.10 |
Household Size by Marriage Status in Winona
Out of a total of 10,902 households in Winona, 4,577 (42.0%) are family households, while 6,325 (58.0%) are nonfamily households. The most numerous type of family households are 2-person households, comprising 2,658, and the most common type of nonfamily households are 1-person households, comprising 4,551.
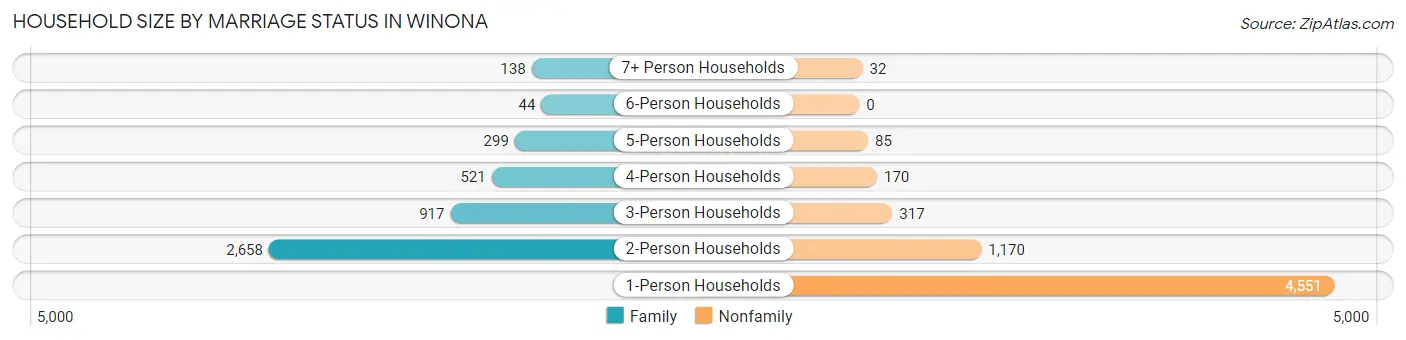
| Household Size | Family Households | Nonfamily Households |
| 1-Person Households | - | 4,551 (41.7%) |
| 2-Person Households | 2,658 (24.4%) | 1,170 (10.7%) |
| 3-Person Households | 917 (8.4%) | 317 (2.9%) |
| 4-Person Households | 521 (4.8%) | 170 (1.6%) |
| 5-Person Households | 299 (2.7%) | 85 (0.8%) |
| 6-Person Households | 44 (0.4%) | 0 (0.0%) |
| 7+ Person Households | 138 (1.3%) | 32 (0.3%) |
| Total | 4,577 (42.0%) | 6,325 (58.0%) |
Female Fertility in Winona
Fertility by Age in Winona
Average fertility rate in Winona is 15.0 births per 1,000 women. Women in the age bracket of 35 to 50 years have the highest fertility rate with 27.0 births per 1,000 women. Women in the age bracket of 20 to 34 years acount for 54.3% of all women with births.
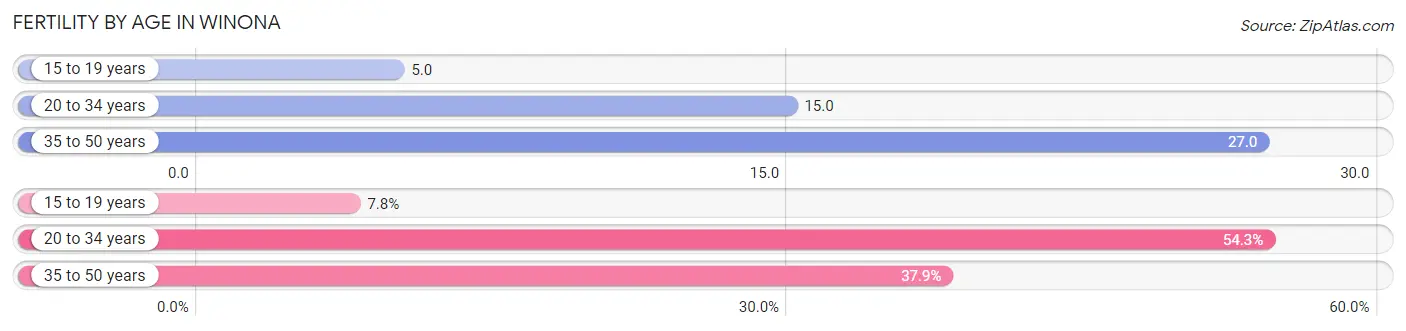
| Age Bracket | Women with Births | Births / 1,000 Women |
| 15 to 19 years | 9 (7.8%) | 5.0 |
| 20 to 34 years | 63 (54.3%) | 15.0 |
| 35 to 50 years | 44 (37.9%) | 27.0 |
| Total | 116 (100.0%) | 15.0 |
Fertility by Age by Marriage Status in Winona
80.2% of women with births (116) in Winona are married. The highest percentage of unmarried women with births falls into 15 to 19 years age bracket with 100.0% of them unmarried at the time of birth, while the lowest percentage of unmarried women with births belong to 35 to 50 years age bracket with 9.1% of them unmarried.
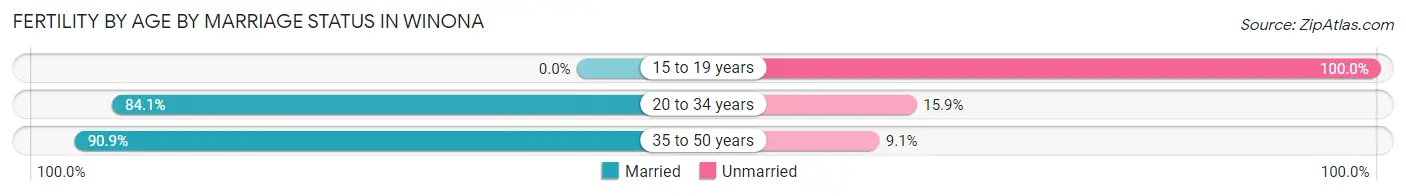
| Age Bracket | Married | Unmarried |
| 15 to 19 years | 0 (0.0%) | 9 (100.0%) |
| 20 to 34 years | 53 (84.1%) | 10 (15.9%) |
| 35 to 50 years | 40 (90.9%) | 4 (9.1%) |
| Total | 93 (80.2%) | 23 (19.8%) |
Fertility by Education in Winona
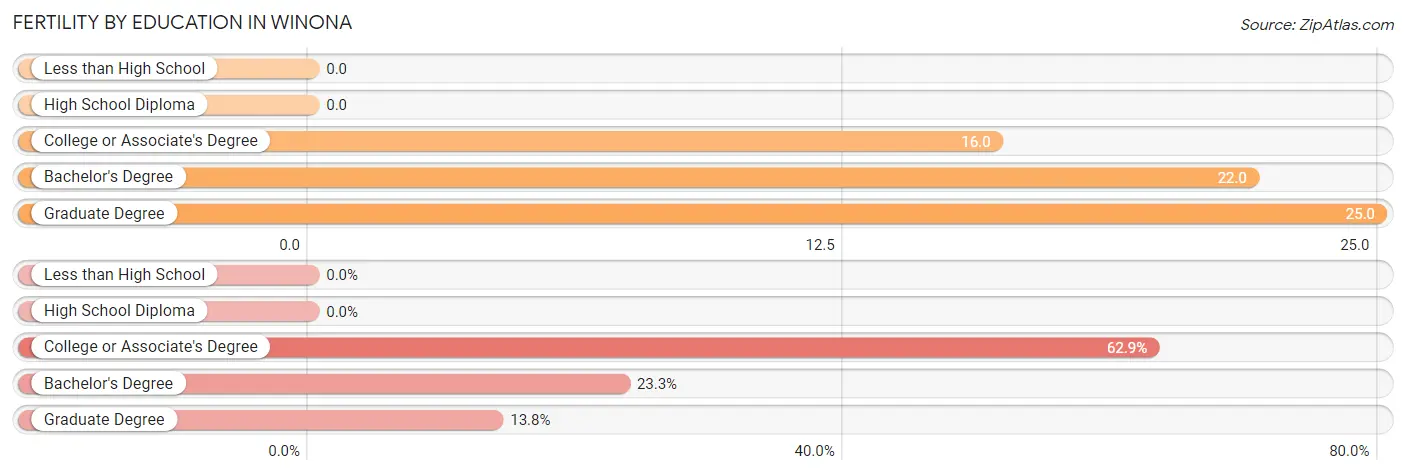
| Educational Attainment | Women with Births | Births / 1,000 Women |
| Less than High School | 0 (0.0%) | 0.0 |
| High School Diploma | 0 (0.0%) | 0.0 |
| College or Associate's Degree | 73 (62.9%) | 16.0 |
| Bachelor's Degree | 27 (23.3%) | 22.0 |
| Graduate Degree | 16 (13.8%) | 25.0 |
| Total | 116 (100.0%) | 15.0 |
Fertility by Education by Marriage Status in Winona
19.8% of women with births in Winona are unmarried. Women with the educational attainment of bachelor's degree are most likely to be married with 100.0% of them married at childbirth, while women with the educational attainment of college or associate's degree are least likely to be married with 31.5% of them unmarried at childbirth.
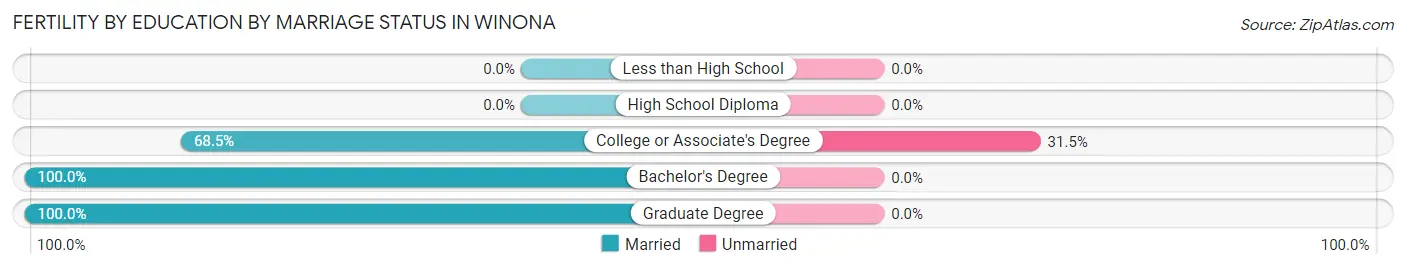
| Educational Attainment | Married | Unmarried |
| Less than High School | 0 (0.0%) | 0 (0.0%) |
| High School Diploma | 0 (0.0%) | 0 (0.0%) |
| College or Associate's Degree | 50 (68.5%) | 23 (31.5%) |
| Bachelor's Degree | 27 (100.0%) | 0 (0.0%) |
| Graduate Degree | 16 (100.0%) | 0 (0.0%) |
| Total | 93 (80.2%) | 23 (19.8%) |
Employment Characteristics in Winona
Employment by Class of Employer in Winona
Among the 14,345 employed individuals in Winona, private company employees (9,576 | 66.7%), not-for-profit organizations (2,024 | 14.1%), and state government employees (1,037 | 7.2%) make up the most common classes of employment.
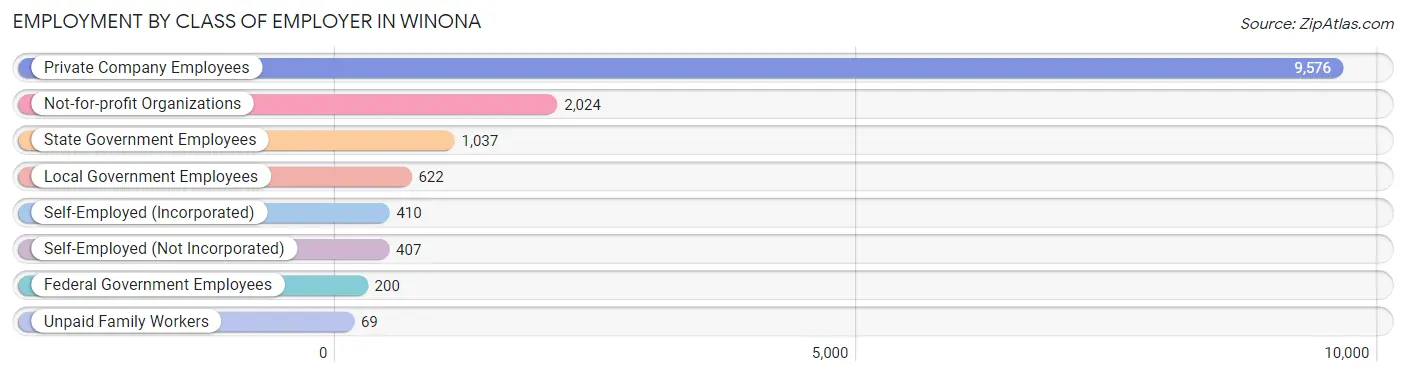
| Employer Class | # Employees | % Employees |
| Private Company Employees | 9,576 | 66.7% |
| Self-Employed (Incorporated) | 410 | 2.9% |
| Self-Employed (Not Incorporated) | 407 | 2.8% |
| Not-for-profit Organizations | 2,024 | 14.1% |
| Local Government Employees | 622 | 4.3% |
| State Government Employees | 1,037 | 7.2% |
| Federal Government Employees | 200 | 1.4% |
| Unpaid Family Workers | 69 | 0.5% |
| Total | 14,345 | 100.0% |
Employment Status by Age in Winona
According to the labor force statistics for Winona, out of the total population over 16 years of age (23,156), 65.6% or 15,190 individuals are in the labor force, with 2.7% or 410 of them unemployed. The age group with the highest labor force participation rate is 35 to 44 years, with 91.7% or 2,047 individuals in the labor force. Within the labor force, the 30 to 34 years age range has the highest percentage of unemployed individuals, with 5.0% or 61 of them being unemployed.
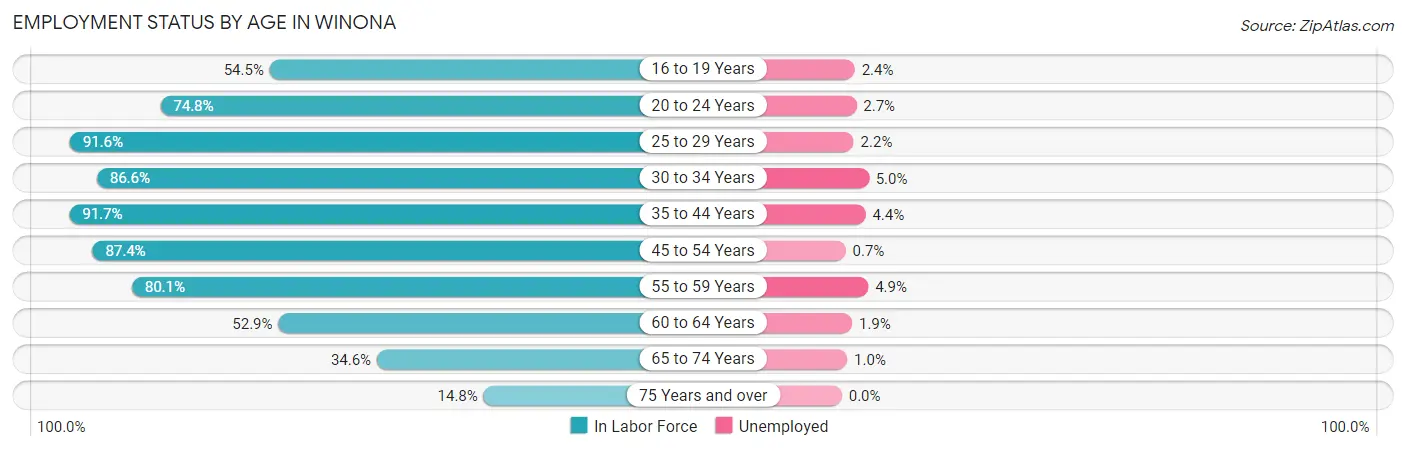
| Age Bracket | In Labor Force | Unemployed |
| 16 to 19 Years | 1,475 (54.5%) | 35 (2.4%) |
| 20 to 24 Years | 4,090 (74.8%) | 110 (2.7%) |
| 25 to 29 Years | 1,507 (91.6%) | 33 (2.2%) |
| 30 to 34 Years | 1,212 (86.6%) | 61 (5.0%) |
| 35 to 44 Years | 2,047 (91.7%) | 90 (4.4%) |
| 45 to 54 Years | 1,859 (87.4%) | 13 (0.7%) |
| 55 to 59 Years | 955 (80.1%) | 47 (4.9%) |
| 60 to 64 Years | 845 (52.9%) | 16 (1.9%) |
| 65 to 74 Years | 869 (34.6%) | 9 (1.0%) |
| 75 Years and over | 337 (14.8%) | 0 (0.0%) |
| Total | 15,190 (65.6%) | 410 (2.7%) |
Employment Status by Educational Attainment in Winona
According to labor force statistics for Winona, 82.6% of individuals (8,420) out of the total population between 25 and 64 years of age (10,194) are in the labor force, with 3.1% or 261 of them being unemployed. The group with the highest labor force participation rate are those with the educational attainment of college / associate degree, with 84.2% or 2,915 individuals in the labor force. Within the labor force, individuals with less than high school education have the highest percentage of unemployment, with 10.2% or 43 of them being unemployed.
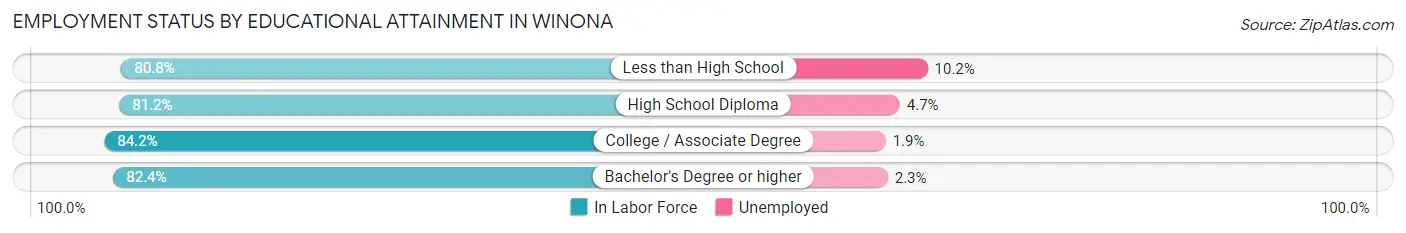
| Educational Attainment | In Labor Force | Unemployed |
| Less than High School | 422 (80.8%) | 53 (10.2%) |
| High School Diploma | 1,966 (81.2%) | 114 (4.7%) |
| College / Associate Degree | 2,915 (84.2%) | 66 (1.9%) |
| Bachelor's Degree or higher | 3,122 (82.4%) | 87 (2.3%) |
| Total | 8,420 (82.6%) | 316 (3.1%) |
Employment Occupations by Sex in Winona
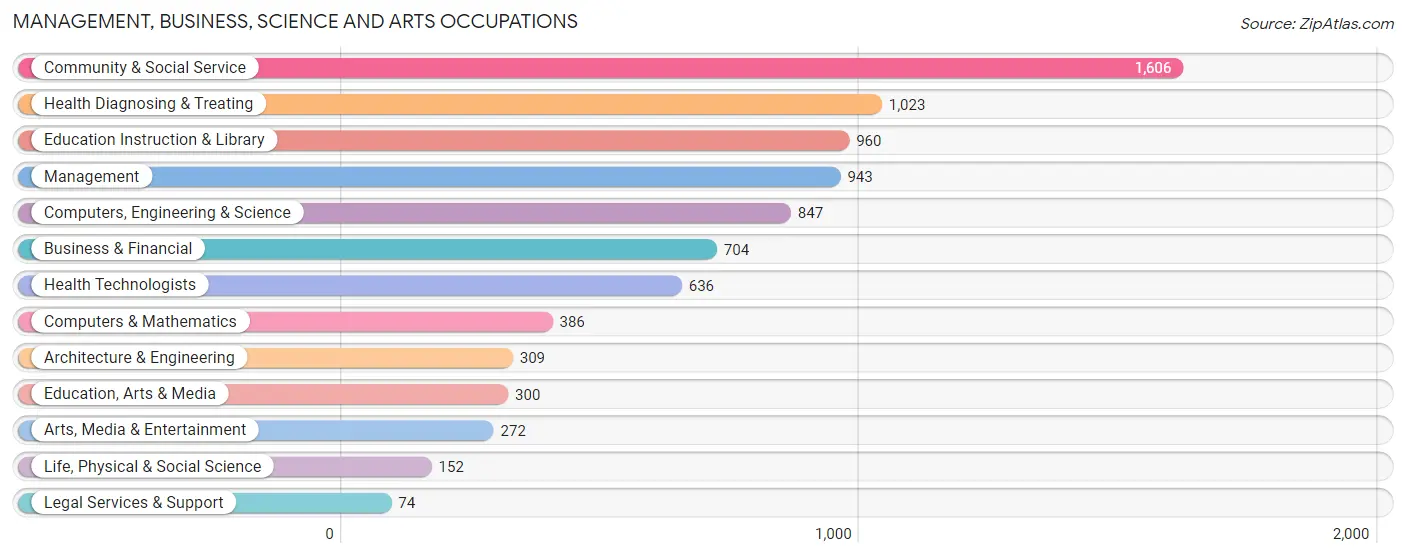
Management, Business, Science and Arts Occupations
The most common Management, Business, Science and Arts occupations in Winona are Community & Social Service (1,606 | 10.9%), Health Diagnosing & Treating (1,023 | 6.9%), Education Instruction & Library (960 | 6.5%), Management (943 | 6.4%), and Computers, Engineering & Science (847 | 5.7%).
Management, Business, Science and Arts Occupations by Sex
Within the Management, Business, Science and Arts occupations in Winona, the most male-oriented occupations are Architecture & Engineering (96.8%), Computers, Engineering & Science (79.3%), and Computers & Mathematics (74.4%), while the most female-oriented occupations are Education, Arts & Media (85.0%), Health Diagnosing & Treating (81.9%), and Health Technologists (80.8%).

| Occupation | Male | Female |
| Management | 440 (46.7%) | 503 (53.3%) |
| Business & Financial | 336 (47.7%) | 368 (52.3%) |
| Computers, Engineering & Science | 672 (79.3%) | 175 (20.7%) |
| Computers & Mathematics | 287 (74.4%) | 99 (25.7%) |
| Architecture & Engineering | 299 (96.8%) | 10 (3.2%) |
| Life, Physical & Social Science | 86 (56.6%) | 66 (43.4%) |
| Community & Social Service | 366 (22.8%) | 1,240 (77.2%) |
| Education, Arts & Media | 45 (15.0%) | 255 (85.0%) |
| Legal Services & Support | 23 (31.1%) | 51 (68.9%) |
| Education Instruction & Library | 228 (23.7%) | 732 (76.2%) |
| Arts, Media & Entertainment | 70 (25.7%) | 202 (74.3%) |
| Health Diagnosing & Treating | 185 (18.1%) | 838 (81.9%) |
| Health Technologists | 122 (19.2%) | 514 (80.8%) |
| Total (Category) | 1,999 (39.0%) | 3,124 (61.0%) |
| Total (Overall) | 7,105 (48.2%) | 7,645 (51.8%) |
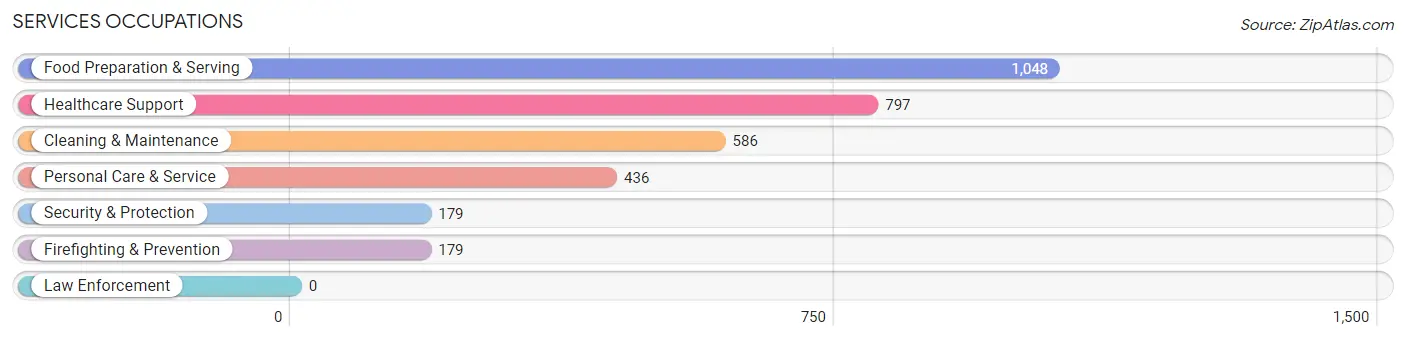
Services Occupations
The most common Services occupations in Winona are Food Preparation & Serving (1,048 | 7.1%), Healthcare Support (797 | 5.4%), Cleaning & Maintenance (586 | 4.0%), Personal Care & Service (436 | 3.0%), and Security & Protection (179 | 1.2%).
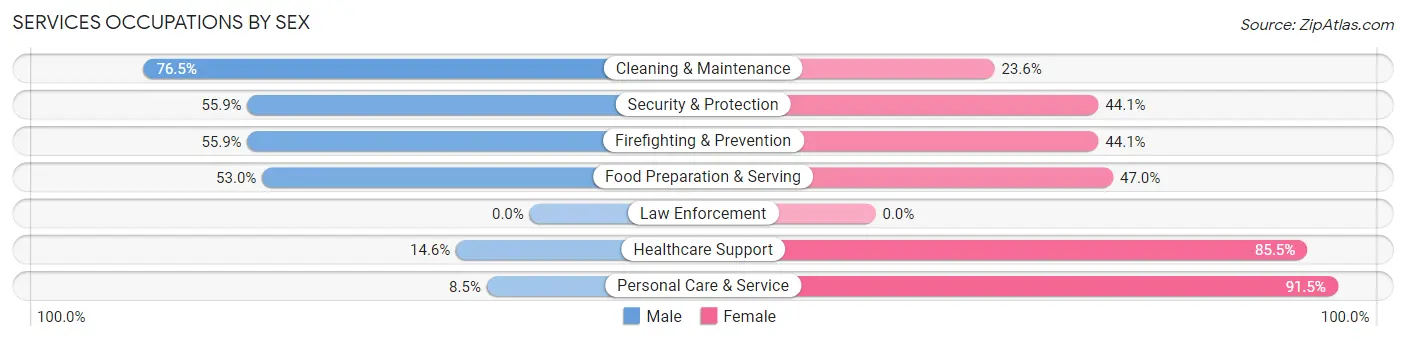
Services Occupations by Sex
Within the Services occupations in Winona, the most male-oriented occupations are Cleaning & Maintenance (76.4%), Security & Protection (55.9%), and Firefighting & Prevention (55.9%), while the most female-oriented occupations are Personal Care & Service (91.5%), Healthcare Support (85.5%), and Food Preparation & Serving (47.0%).
| Occupation | Male | Female |
| Healthcare Support | 116 (14.5%) | 681 (85.5%) |
| Security & Protection | 100 (55.9%) | 79 (44.1%) |
| Firefighting & Prevention | 100 (55.9%) | 79 (44.1%) |
| Law Enforcement | 0 (0.0%) | 0 (0.0%) |
| Food Preparation & Serving | 555 (53.0%) | 493 (47.0%) |
| Cleaning & Maintenance | 448 (76.4%) | 138 (23.5%) |
| Personal Care & Service | 37 (8.5%) | 399 (91.5%) |
| Total (Category) | 1,256 (41.2%) | 1,790 (58.8%) |
| Total (Overall) | 7,105 (48.2%) | 7,645 (51.8%) |
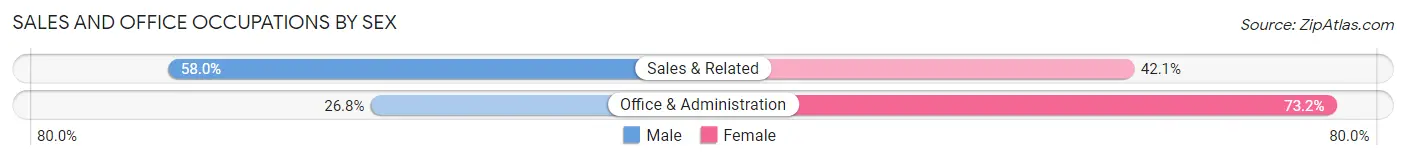
Sales and Office Occupations
The most common Sales and Office occupations in Winona are Office & Administration (2,152 | 14.6%), and Sales & Related (1,353 | 9.2%).

Sales and Office Occupations by Sex
| Occupation | Male | Female |
| Sales & Related | 784 (58.0%) | 569 (42.0%) |
| Office & Administration | 577 (26.8%) | 1,575 (73.2%) |
| Total (Category) | 1,361 (38.8%) | 2,144 (61.2%) |
| Total (Overall) | 7,105 (48.2%) | 7,645 (51.8%) |
Natural Resources, Construction and Maintenance Occupations
The most common Natural Resources, Construction and Maintenance occupations in Winona are Construction & Extraction (439 | 3.0%), Installation, Maintenance & Repair (422 | 2.9%), and Farming, Fishing & Forestry (75 | 0.5%).
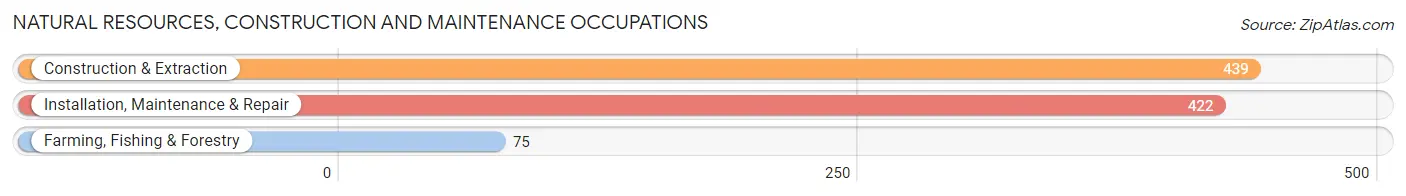
Natural Resources, Construction and Maintenance Occupations by Sex
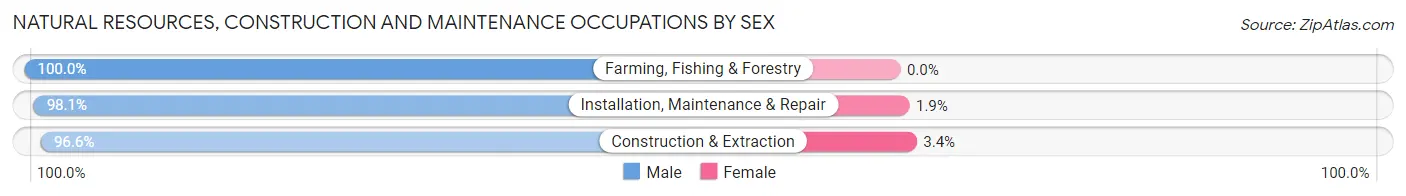
| Occupation | Male | Female |
| Farming, Fishing & Forestry | 75 (100.0%) | 0 (0.0%) |
| Construction & Extraction | 424 (96.6%) | 15 (3.4%) |
| Installation, Maintenance & Repair | 414 (98.1%) | 8 (1.9%) |
| Total (Category) | 913 (97.5%) | 23 (2.5%) |
| Total (Overall) | 7,105 (48.2%) | 7,645 (51.8%) |
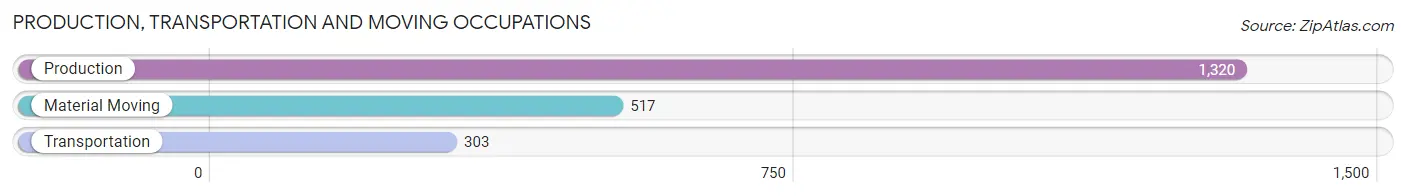
Production, Transportation and Moving Occupations
The most common Production, Transportation and Moving occupations in Winona are Production (1,320 | 8.9%), Material Moving (517 | 3.5%), and Transportation (303 | 2.1%).
Production, Transportation and Moving Occupations by Sex
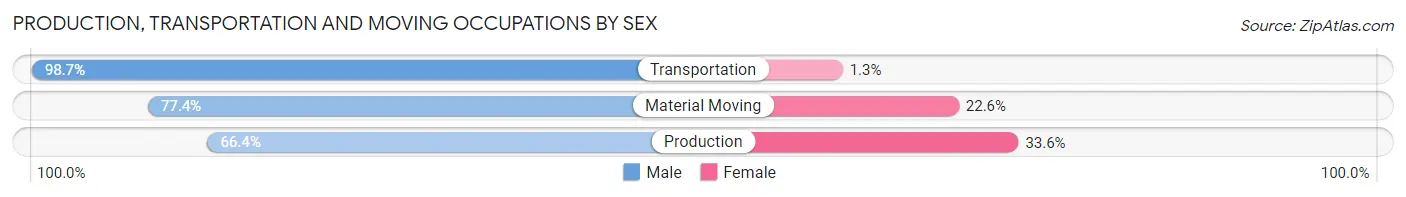
| Occupation | Male | Female |
| Production | 877 (66.4%) | 443 (33.6%) |
| Transportation | 299 (98.7%) | 4 (1.3%) |
| Material Moving | 400 (77.4%) | 117 (22.6%) |
| Total (Category) | 1,576 (73.6%) | 564 (26.4%) |
| Total (Overall) | 7,105 (48.2%) | 7,645 (51.8%) |
Employment Industries by Sex in Winona
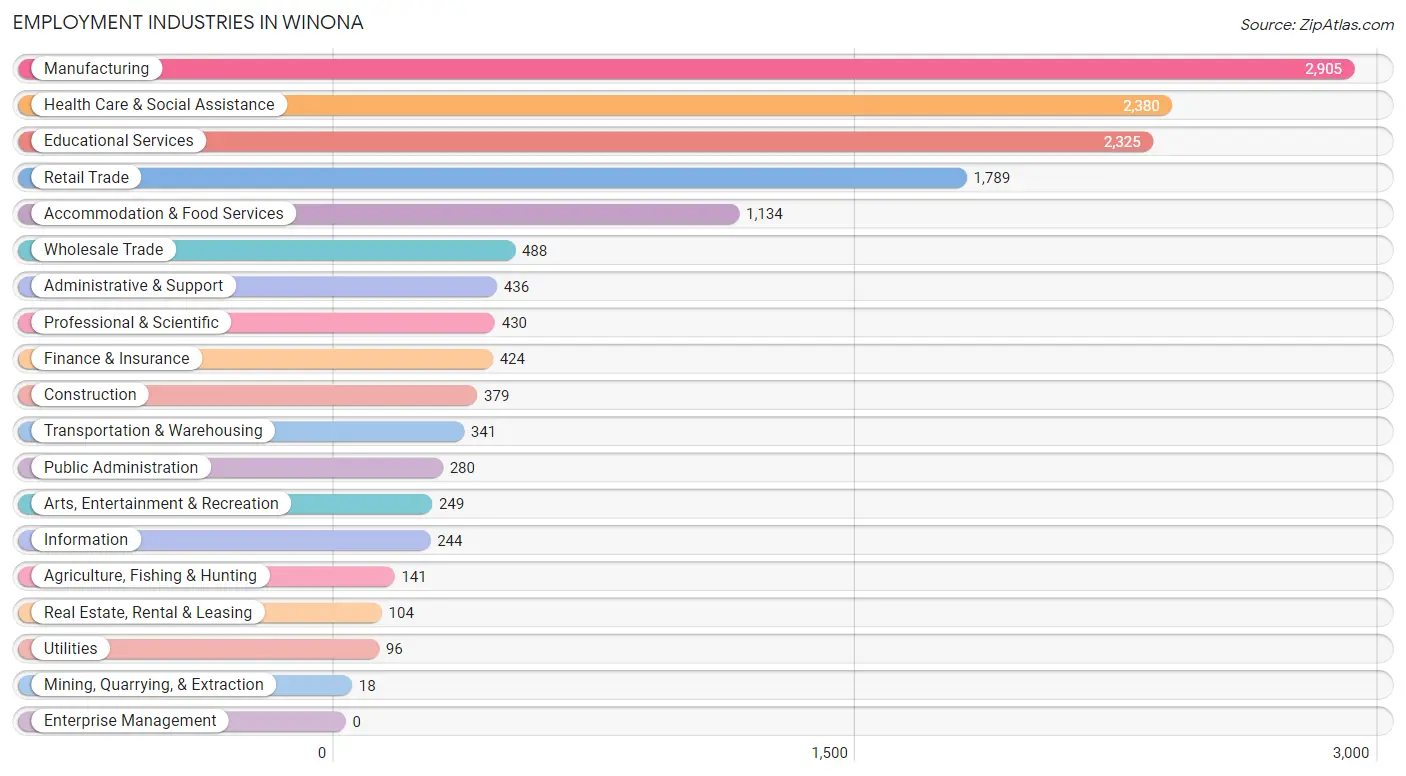
Employment Industries in Winona
The major employment industries in Winona include Manufacturing (2,905 | 19.7%), Health Care & Social Assistance (2,380 | 16.1%), Educational Services (2,325 | 15.8%), Retail Trade (1,789 | 12.1%), and Accommodation & Food Services (1,134 | 7.7%).
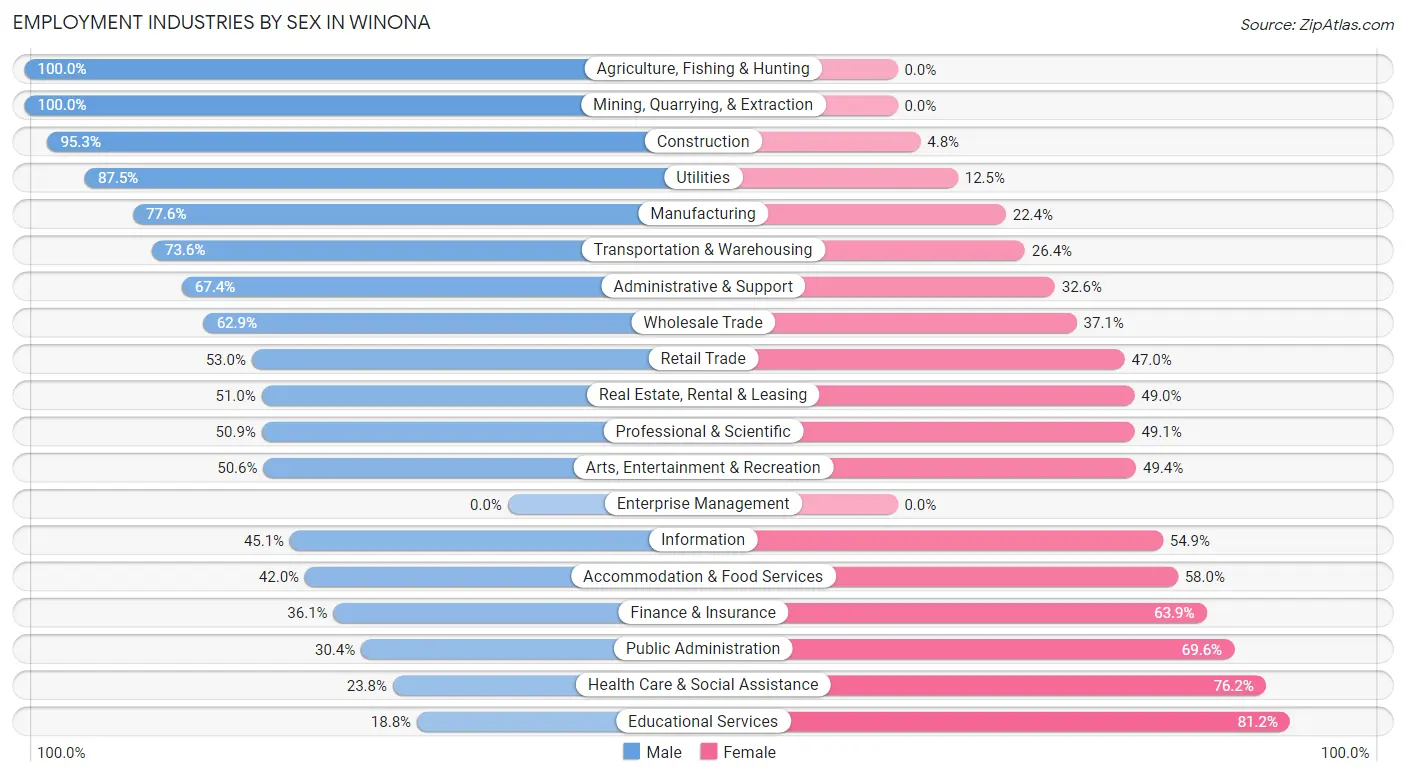
Employment Industries by Sex in Winona
The Winona industries that see more men than women are Agriculture, Fishing & Hunting (100.0%), Mining, Quarrying, & Extraction (100.0%), and Construction (95.3%), whereas the industries that tend to have a higher number of women are Educational Services (81.2%), Health Care & Social Assistance (76.2%), and Public Administration (69.6%).
| Industry | Male | Female |
| Agriculture, Fishing & Hunting | 141 (100.0%) | 0 (0.0%) |
| Mining, Quarrying, & Extraction | 18 (100.0%) | 0 (0.0%) |
| Construction | 361 (95.3%) | 18 (4.8%) |
| Manufacturing | 2,253 (77.6%) | 652 (22.4%) |
| Wholesale Trade | 307 (62.9%) | 181 (37.1%) |
| Retail Trade | 948 (53.0%) | 841 (47.0%) |
| Transportation & Warehousing | 251 (73.6%) | 90 (26.4%) |
| Utilities | 84 (87.5%) | 12 (12.5%) |
| Information | 110 (45.1%) | 134 (54.9%) |
| Finance & Insurance | 153 (36.1%) | 271 (63.9%) |
| Real Estate, Rental & Leasing | 53 (51.0%) | 51 (49.0%) |
| Professional & Scientific | 219 (50.9%) | 211 (49.1%) |
| Enterprise Management | 0 (0.0%) | 0 (0.0%) |
| Administrative & Support | 294 (67.4%) | 142 (32.6%) |
| Educational Services | 437 (18.8%) | 1,888 (81.2%) |
| Health Care & Social Assistance | 566 (23.8%) | 1,814 (76.2%) |
| Arts, Entertainment & Recreation | 126 (50.6%) | 123 (49.4%) |
| Accommodation & Food Services | 476 (42.0%) | 658 (58.0%) |
| Public Administration | 85 (30.4%) | 195 (69.6%) |
| Total | 7,105 (48.2%) | 7,645 (51.8%) |
Education in Winona
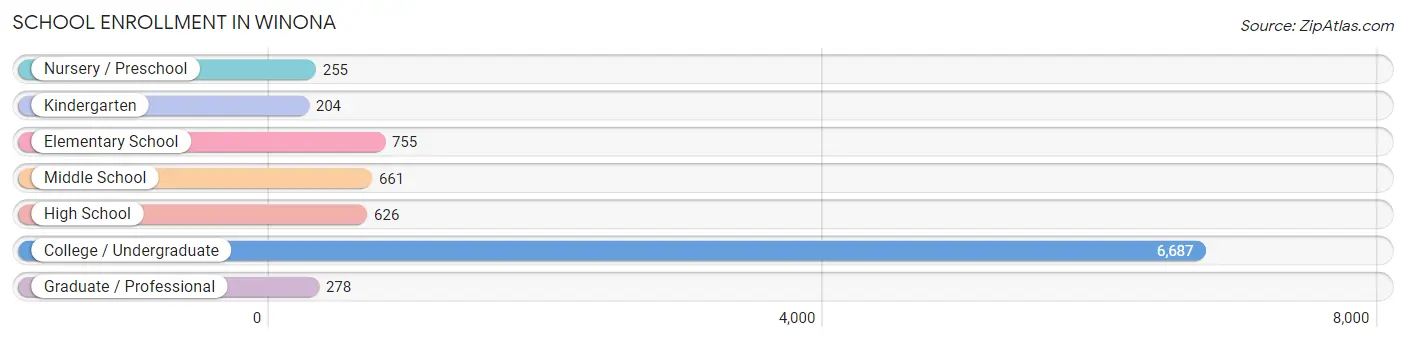
School Enrollment in Winona
The most common levels of schooling among the 9,466 students in Winona are college / undergraduate (6,687 | 70.6%), elementary school (755 | 8.0%), and middle school (661 | 7.0%).
| School Level | # Students | % Students |
| Nursery / Preschool | 255 | 2.7% |
| Kindergarten | 204 | 2.2% |
| Elementary School | 755 | 8.0% |
| Middle School | 661 | 7.0% |
| High School | 626 | 6.6% |
| College / Undergraduate | 6,687 | 70.6% |
| Graduate / Professional | 278 | 2.9% |
| Total | 9,466 | 100.0% |
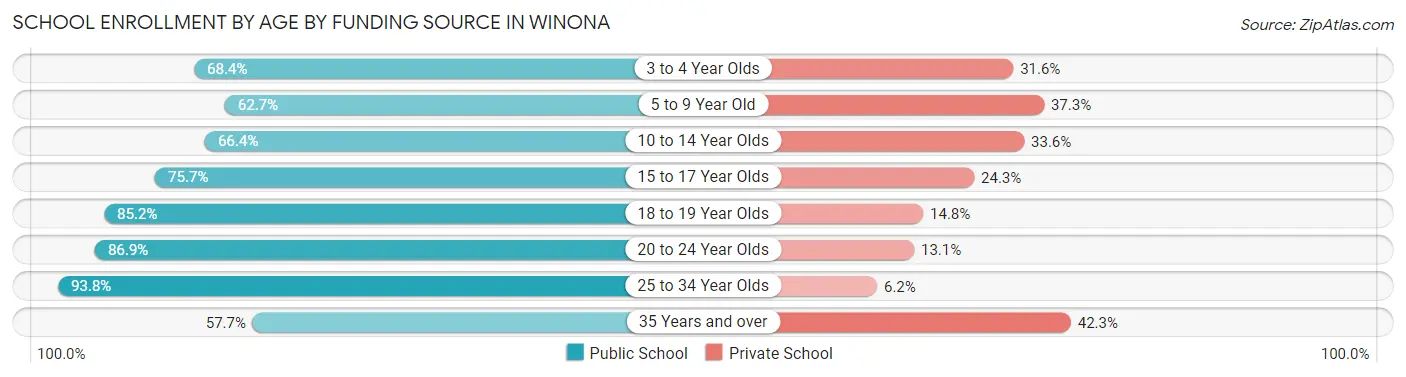
School Enrollment by Age by Funding Source in Winona
Out of a total of 9,466 students who are enrolled in schools in Winona, 1,770 (18.7%) attend a private institution, while the remaining 7,696 (81.3%) are enrolled in public schools. The age group of 35 years and over has the highest likelihood of being enrolled in private schools, with 55 (42.3% in the age bracket) enrolled. Conversely, the age group of 25 to 34 year olds has the lowest likelihood of being enrolled in a private school, with 392 (93.8% in the age bracket) attending a public institution.
| Age Bracket | Public School | Private School |
| 3 to 4 Year Olds | 117 (68.4%) | 54 (31.6%) |
| 5 to 9 Year Old | 568 (62.7%) | 338 (37.3%) |
| 10 to 14 Year Olds | 561 (66.4%) | 284 (33.6%) |
| 15 to 17 Year Olds | 377 (75.7%) | 121 (24.3%) |
| 18 to 19 Year Olds | 1,974 (85.2%) | 343 (14.8%) |
| 20 to 24 Year Olds | 3,633 (86.9%) | 548 (13.1%) |
| 25 to 34 Year Olds | 392 (93.8%) | 26 (6.2%) |
| 35 Years and over | 75 (57.7%) | 55 (42.3%) |
| Total | 7,696 (81.3%) | 1,770 (18.7%) |
Educational Attainment by Field of Study in Winona
Business (980 | 17.8%), education (830 | 15.0%), literature & languages (425 | 7.7%), science & technology (422 | 7.6%), and bio, nature & agricultural (396 | 7.2%) are the most common fields of study among 5,518 individuals in Winona who have obtained a bachelor's degree or higher.
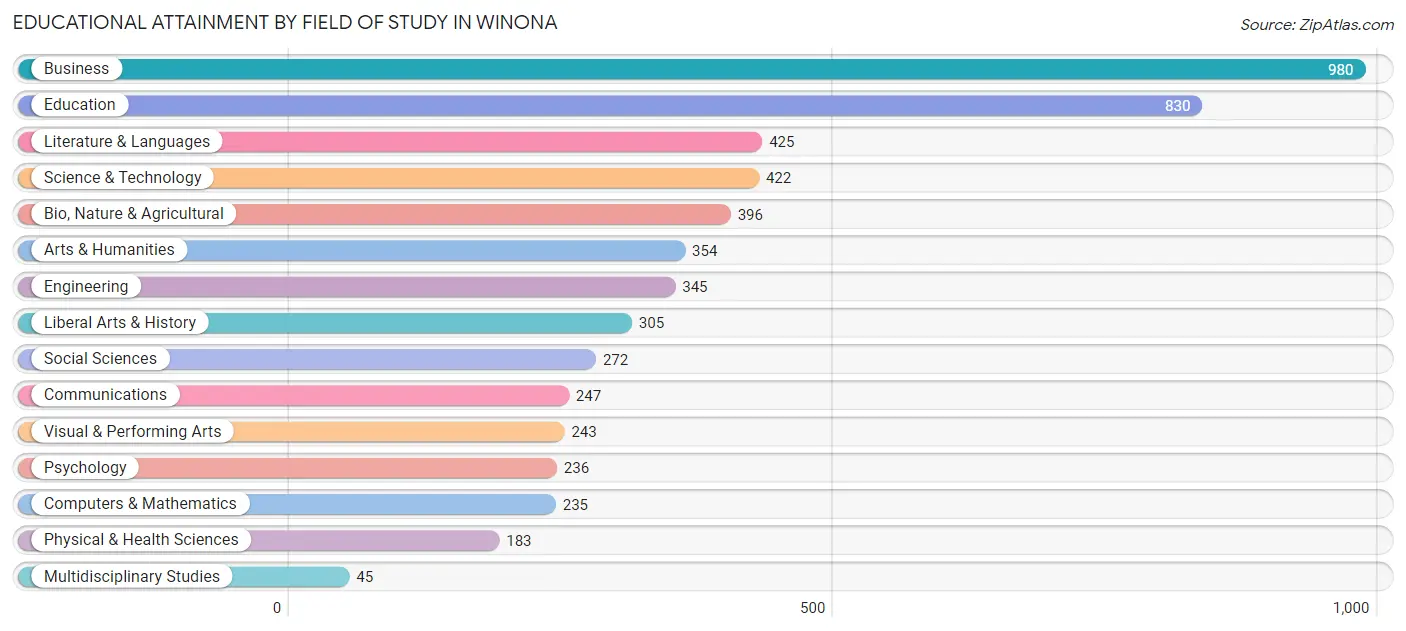
| Field of Study | # Graduates | % Graduates |
| Computers & Mathematics | 235 | 4.3% |
| Bio, Nature & Agricultural | 396 | 7.2% |
| Physical & Health Sciences | 183 | 3.3% |
| Psychology | 236 | 4.3% |
| Social Sciences | 272 | 4.9% |
| Engineering | 345 | 6.2% |
| Multidisciplinary Studies | 45 | 0.8% |
| Science & Technology | 422 | 7.6% |
| Business | 980 | 17.8% |
| Education | 830 | 15.0% |
| Literature & Languages | 425 | 7.7% |
| Liberal Arts & History | 305 | 5.5% |
| Visual & Performing Arts | 243 | 4.4% |
| Communications | 247 | 4.5% |
| Arts & Humanities | 354 | 6.4% |
| Total | 5,518 | 100.0% |
Transportation & Commute in Winona
Vehicle Availability by Sex in Winona
The most prevalent vehicle ownership categories in Winona are males with 2 vehicles (2,667, accounting for 41.2%) and females with 2 vehicles (3,103, making up 40.4%).
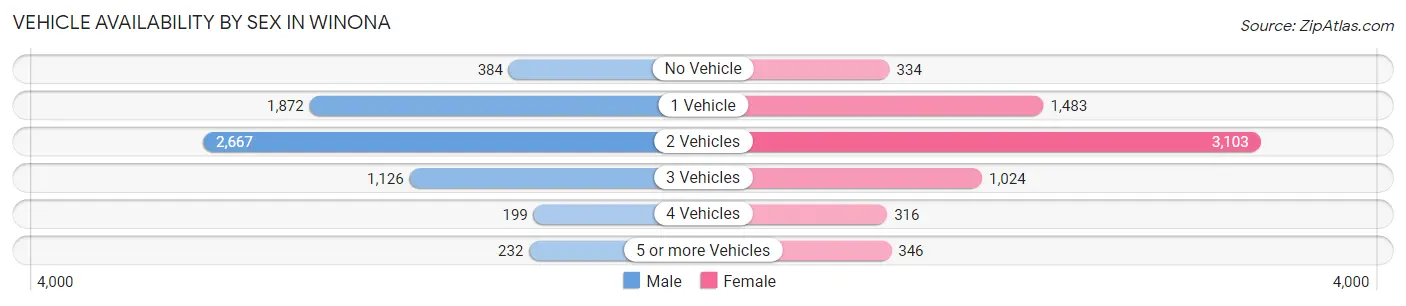
| Vehicles Available | Male | Female |
| No Vehicle | 384 (5.9%) | 334 (5.1%) |
| 1 Vehicle | 1,872 (28.9%) | 1,483 (22.5%) |
| 2 Vehicles | 2,667 (41.2%) | 3,103 (47.0%) |
| 3 Vehicles | 1,126 (17.4%) | 1,024 (15.5%) |
| 4 Vehicles | 199 (3.1%) | 316 (4.8%) |
| 5 or more Vehicles | 232 (3.6%) | 346 (5.2%) |
| Total | 6,480 (100.0%) | 6,606 (100.0%) |
Commute Time in Winona
The most frequently occuring commute durations in Winona are 5 to 9 minutes (4,357 commuters, 32.7%), 10 to 14 minutes (3,940 commuters, 29.6%), and 15 to 19 minutes (1,769 commuters, 13.3%).
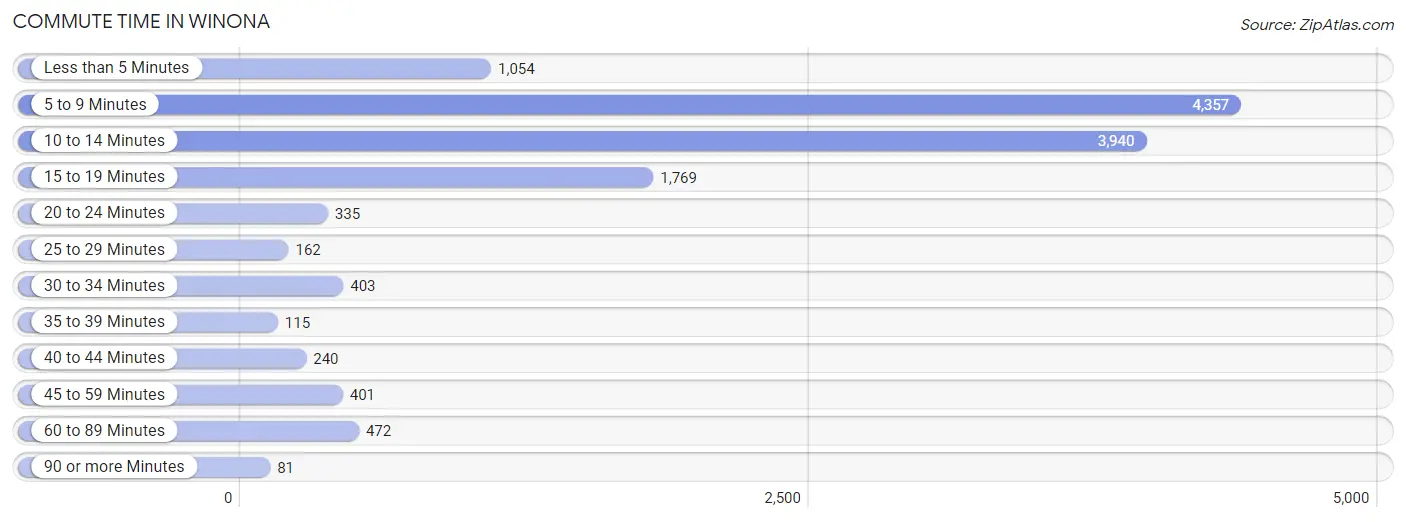
| Commute Time | # Commuters | % Commuters |
| Less than 5 Minutes | 1,054 | 7.9% |
| 5 to 9 Minutes | 4,357 | 32.7% |
| 10 to 14 Minutes | 3,940 | 29.6% |
| 15 to 19 Minutes | 1,769 | 13.3% |
| 20 to 24 Minutes | 335 | 2.5% |
| 25 to 29 Minutes | 162 | 1.2% |
| 30 to 34 Minutes | 403 | 3.0% |
| 35 to 39 Minutes | 115 | 0.9% |
| 40 to 44 Minutes | 240 | 1.8% |
| 45 to 59 Minutes | 401 | 3.0% |
| 60 to 89 Minutes | 472 | 3.5% |
| 90 or more Minutes | 81 | 0.6% |
Commute Time by Sex in Winona
The most common commute times in Winona are 5 to 9 minutes (2,119 commuters, 32.6%) for males and 5 to 9 minutes (2,238 commuters, 32.7%) for females.
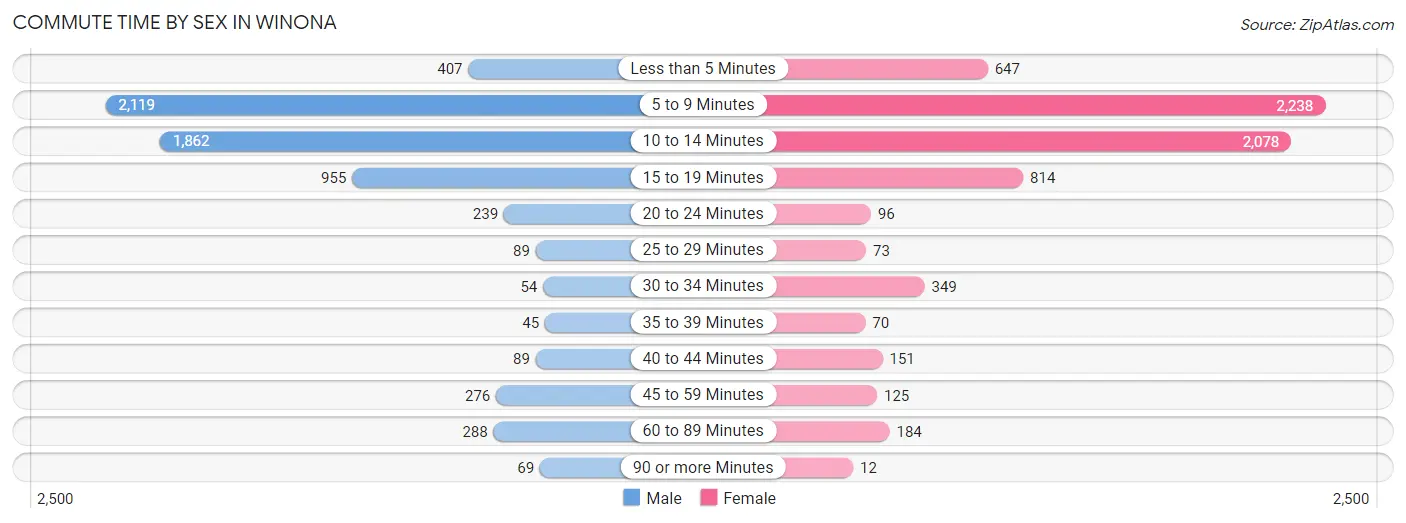
| Commute Time | Male | Female |
| Less than 5 Minutes | 407 (6.3%) | 647 (9.5%) |
| 5 to 9 Minutes | 2,119 (32.6%) | 2,238 (32.7%) |
| 10 to 14 Minutes | 1,862 (28.7%) | 2,078 (30.4%) |
| 15 to 19 Minutes | 955 (14.7%) | 814 (11.9%) |
| 20 to 24 Minutes | 239 (3.7%) | 96 (1.4%) |
| 25 to 29 Minutes | 89 (1.4%) | 73 (1.1%) |
| 30 to 34 Minutes | 54 (0.8%) | 349 (5.1%) |
| 35 to 39 Minutes | 45 (0.7%) | 70 (1.0%) |
| 40 to 44 Minutes | 89 (1.4%) | 151 (2.2%) |
| 45 to 59 Minutes | 276 (4.3%) | 125 (1.8%) |
| 60 to 89 Minutes | 288 (4.4%) | 184 (2.7%) |
| 90 or more Minutes | 69 (1.1%) | 12 (0.2%) |
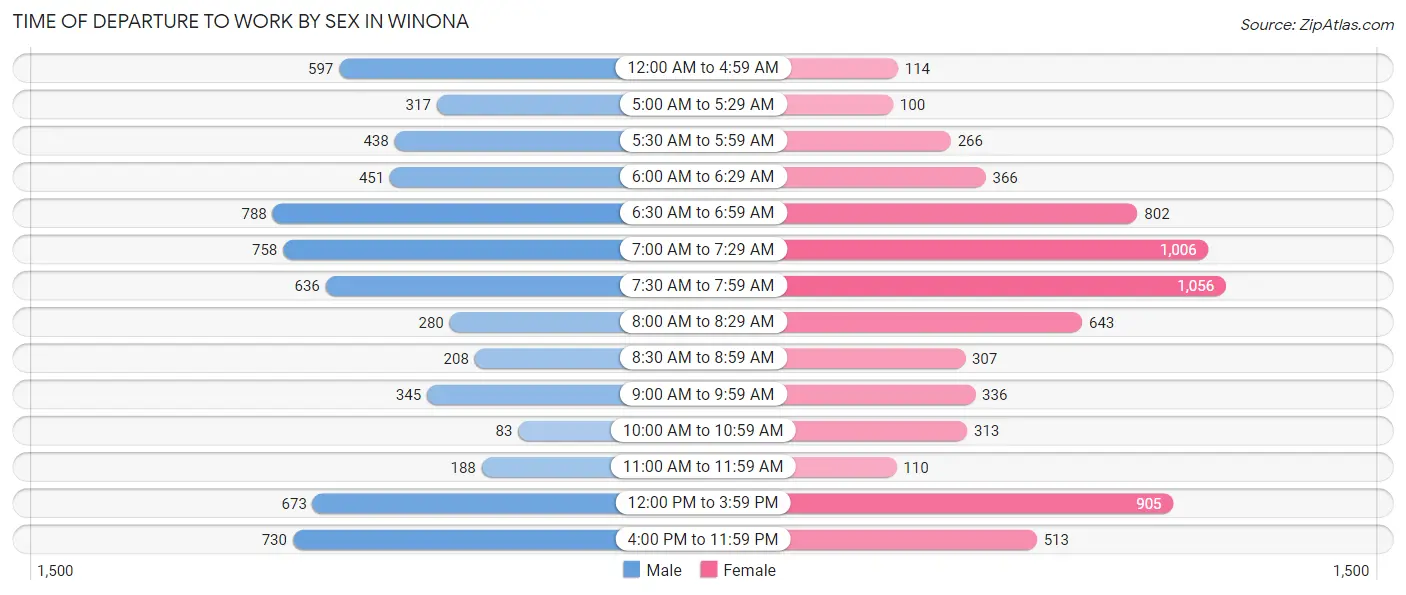
Time of Departure to Work by Sex in Winona
The most frequent times of departure to work in Winona are 6:30 AM to 6:59 AM (788, 12.1%) for males and 7:30 AM to 7:59 AM (1,056, 15.4%) for females.
| Time of Departure | Male | Female |
| 12:00 AM to 4:59 AM | 597 (9.2%) | 114 (1.7%) |
| 5:00 AM to 5:29 AM | 317 (4.9%) | 100 (1.5%) |
| 5:30 AM to 5:59 AM | 438 (6.8%) | 266 (3.9%) |
| 6:00 AM to 6:29 AM | 451 (7.0%) | 366 (5.3%) |
| 6:30 AM to 6:59 AM | 788 (12.1%) | 802 (11.7%) |
| 7:00 AM to 7:29 AM | 758 (11.7%) | 1,006 (14.7%) |
| 7:30 AM to 7:59 AM | 636 (9.8%) | 1,056 (15.4%) |
| 8:00 AM to 8:29 AM | 280 (4.3%) | 643 (9.4%) |
| 8:30 AM to 8:59 AM | 208 (3.2%) | 307 (4.5%) |
| 9:00 AM to 9:59 AM | 345 (5.3%) | 336 (4.9%) |
| 10:00 AM to 10:59 AM | 83 (1.3%) | 313 (4.6%) |
| 11:00 AM to 11:59 AM | 188 (2.9%) | 110 (1.6%) |
| 12:00 PM to 3:59 PM | 673 (10.4%) | 905 (13.2%) |
| 4:00 PM to 11:59 PM | 730 (11.2%) | 513 (7.5%) |
| Total | 6,492 (100.0%) | 6,837 (100.0%) |
Housing Occupancy in Winona
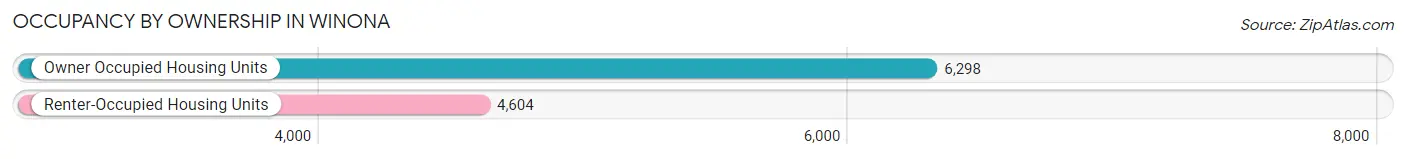
Occupancy by Ownership in Winona
Of the total 10,902 dwellings in Winona, owner-occupied units account for 6,298 (57.8%), while renter-occupied units make up 4,604 (42.2%).
| Occupancy | # Housing Units | % Housing Units |
| Owner Occupied Housing Units | 6,298 | 57.8% |
| Renter-Occupied Housing Units | 4,604 | 42.2% |
| Total Occupied Housing Units | 10,902 | 100.0% |
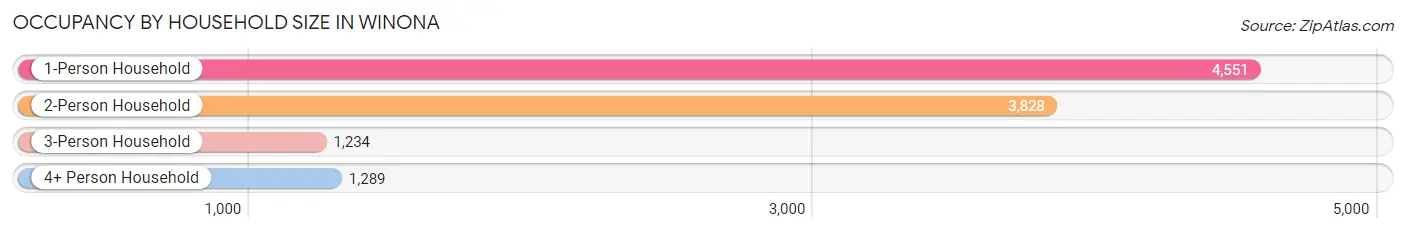
Occupancy by Household Size in Winona
| Household Size | # Housing Units | % Housing Units |
| 1-Person Household | 4,551 | 41.7% |
| 2-Person Household | 3,828 | 35.1% |
| 3-Person Household | 1,234 | 11.3% |
| 4+ Person Household | 1,289 | 11.8% |
| Total Housing Units | 10,902 | 100.0% |
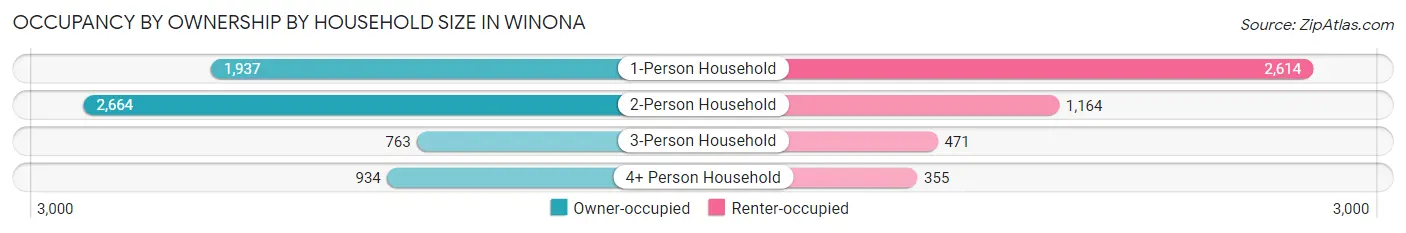
Occupancy by Ownership by Household Size in Winona
| Household Size | Owner-occupied | Renter-occupied |
| 1-Person Household | 1,937 (42.6%) | 2,614 (57.4%) |
| 2-Person Household | 2,664 (69.6%) | 1,164 (30.4%) |
| 3-Person Household | 763 (61.8%) | 471 (38.2%) |
| 4+ Person Household | 934 (72.5%) | 355 (27.5%) |
| Total Housing Units | 6,298 (57.8%) | 4,604 (42.2%) |
Occupancy by Educational Attainment in Winona
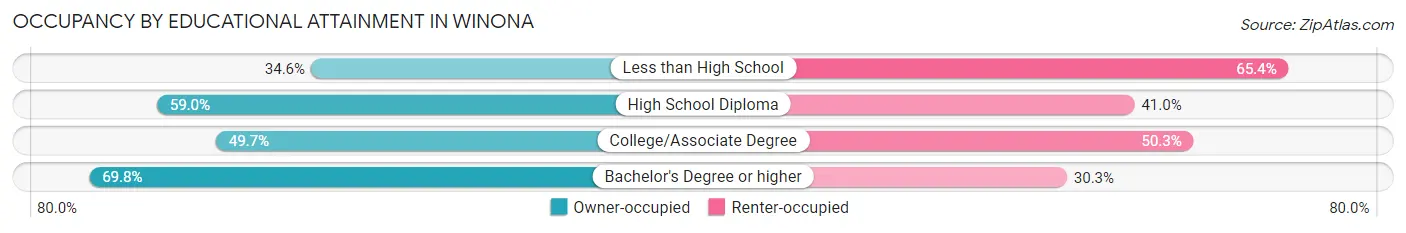
| Household Size | Owner-occupied | Renter-occupied |
| Less than High School | 200 (34.6%) | 378 (65.4%) |
| High School Diploma | 1,435 (59.0%) | 996 (41.0%) |
| College/Associate Degree | 2,083 (49.7%) | 2,111 (50.3%) |
| Bachelor's Degree or higher | 2,580 (69.8%) | 1,119 (30.2%) |
Occupancy by Age of Householder in Winona
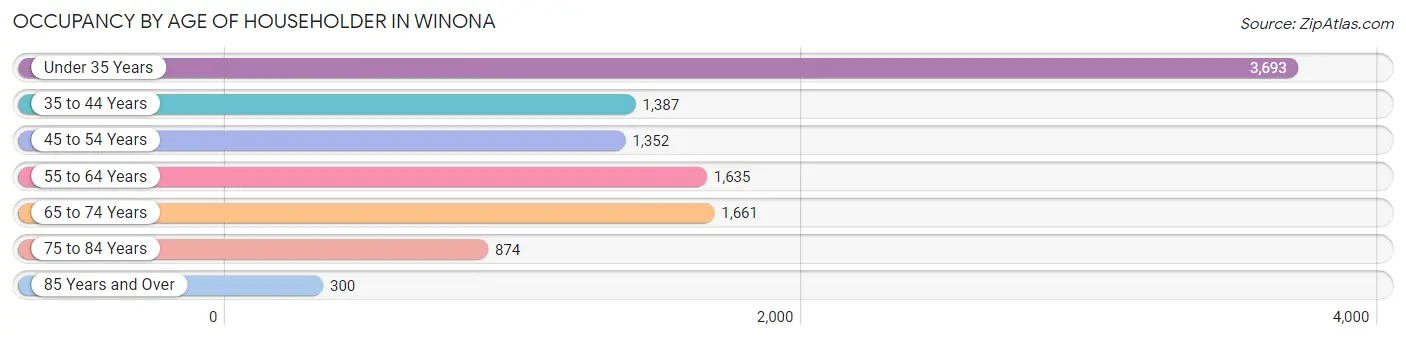
| Age Bracket | # Households | % Households |
| Under 35 Years | 3,693 | 33.9% |
| 35 to 44 Years | 1,387 | 12.7% |
| 45 to 54 Years | 1,352 | 12.4% |
| 55 to 64 Years | 1,635 | 15.0% |
| 65 to 74 Years | 1,661 | 15.2% |
| 75 to 84 Years | 874 | 8.0% |
| 85 Years and Over | 300 | 2.8% |
| Total | 10,902 | 100.0% |
Housing Finances in Winona
Median Income by Occupancy in Winona
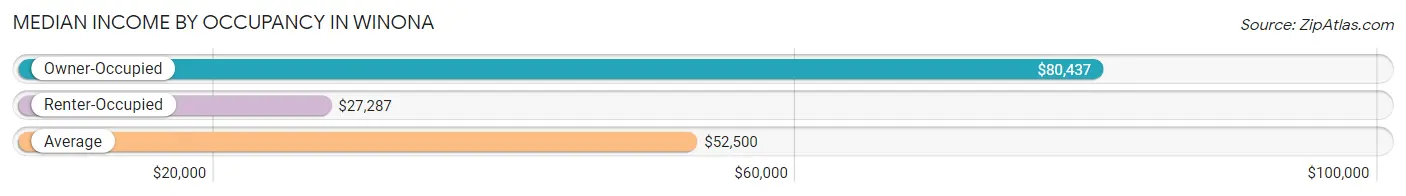
| Occupancy Type | # Households | Median Income |
| Owner-Occupied | 6,298 (57.8%) | $80,437 |
| Renter-Occupied | 4,604 (42.2%) | $27,287 |
| Average | 10,902 (100.0%) | $52,500 |
Occupancy by Householder Income Bracket in Winona
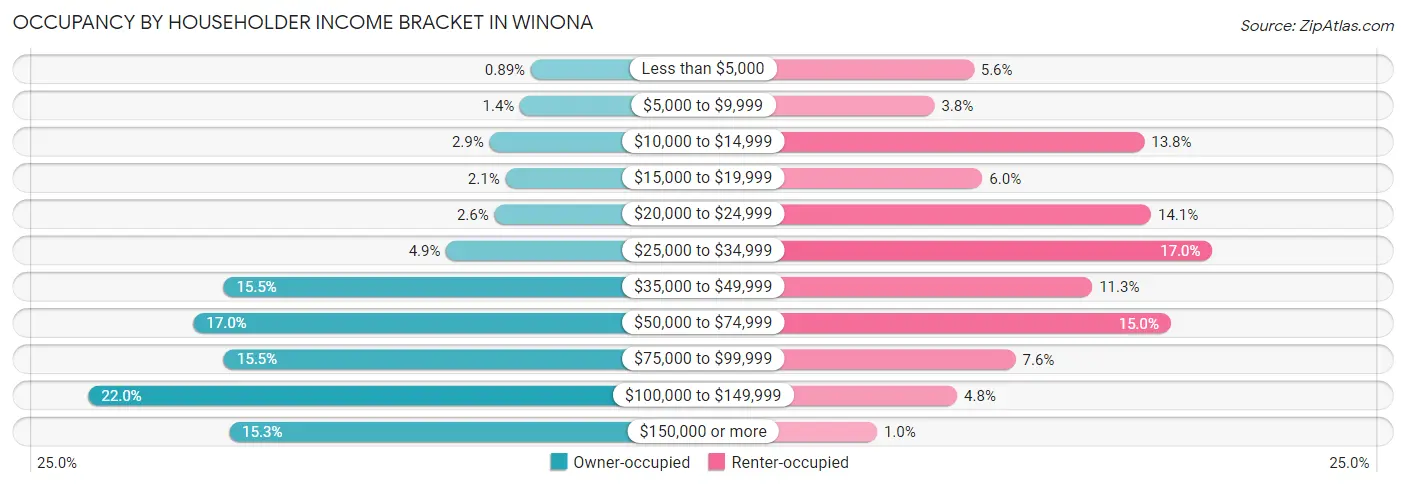
| Income Bracket | Owner-occupied | Renter-occupied |
| Less than $5,000 | 56 (0.9%) | 259 (5.6%) |
| $5,000 to $9,999 | 88 (1.4%) | 173 (3.8%) |
| $10,000 to $14,999 | 180 (2.9%) | 633 (13.8%) |
| $15,000 to $19,999 | 132 (2.1%) | 278 (6.0%) |
| $20,000 to $24,999 | 165 (2.6%) | 648 (14.1%) |
| $25,000 to $34,999 | 310 (4.9%) | 782 (17.0%) |
| $35,000 to $49,999 | 978 (15.5%) | 519 (11.3%) |
| $50,000 to $74,999 | 1,068 (17.0%) | 691 (15.0%) |
| $75,000 to $99,999 | 977 (15.5%) | 351 (7.6%) |
| $100,000 to $149,999 | 1,383 (22.0%) | 223 (4.8%) |
| $150,000 or more | 961 (15.3%) | 47 (1.0%) |
| Total | 6,298 (100.0%) | 4,604 (100.0%) |
Monthly Housing Cost Tiers in Winona
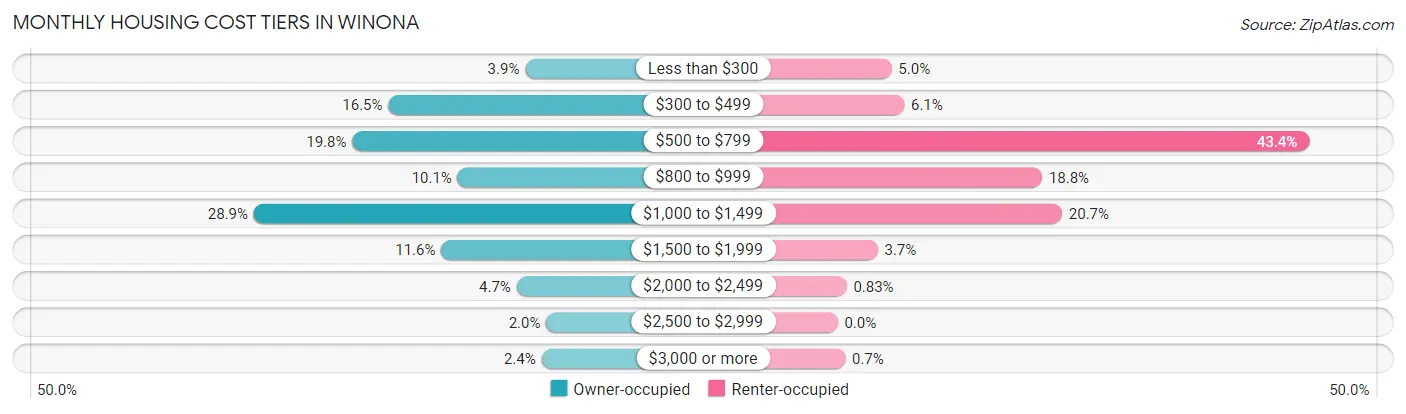
| Monthly Cost | Owner-occupied | Renter-occupied |
| Less than $300 | 246 (3.9%) | 229 (5.0%) |
| $300 to $499 | 1,040 (16.5%) | 282 (6.1%) |
| $500 to $799 | 1,249 (19.8%) | 1,999 (43.4%) |
| $800 to $999 | 638 (10.1%) | 867 (18.8%) |
| $1,000 to $1,499 | 1,820 (28.9%) | 951 (20.7%) |
| $1,500 to $1,999 | 733 (11.6%) | 170 (3.7%) |
| $2,000 to $2,499 | 296 (4.7%) | 38 (0.8%) |
| $2,500 to $2,999 | 124 (2.0%) | 0 (0.0%) |
| $3,000 or more | 152 (2.4%) | 32 (0.7%) |
| Total | 6,298 (100.0%) | 4,604 (100.0%) |
Physical Housing Characteristics in Winona
Housing Structures in Winona
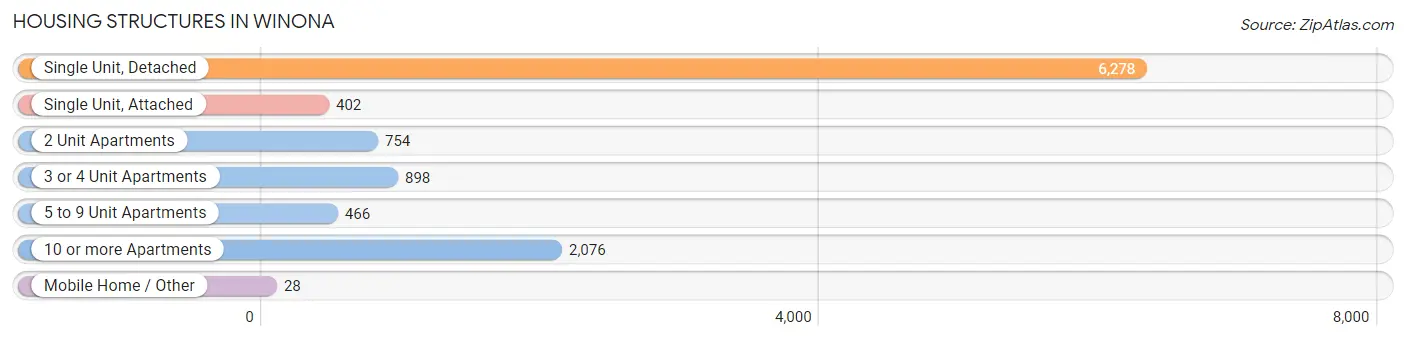
| Structure Type | # Housing Units | % Housing Units |
| Single Unit, Detached | 6,278 | 57.6% |
| Single Unit, Attached | 402 | 3.7% |
| 2 Unit Apartments | 754 | 6.9% |
| 3 or 4 Unit Apartments | 898 | 8.2% |
| 5 to 9 Unit Apartments | 466 | 4.3% |
| 10 or more Apartments | 2,076 | 19.0% |
| Mobile Home / Other | 28 | 0.3% |
| Total | 10,902 | 100.0% |
Housing Structures by Occupancy in Winona
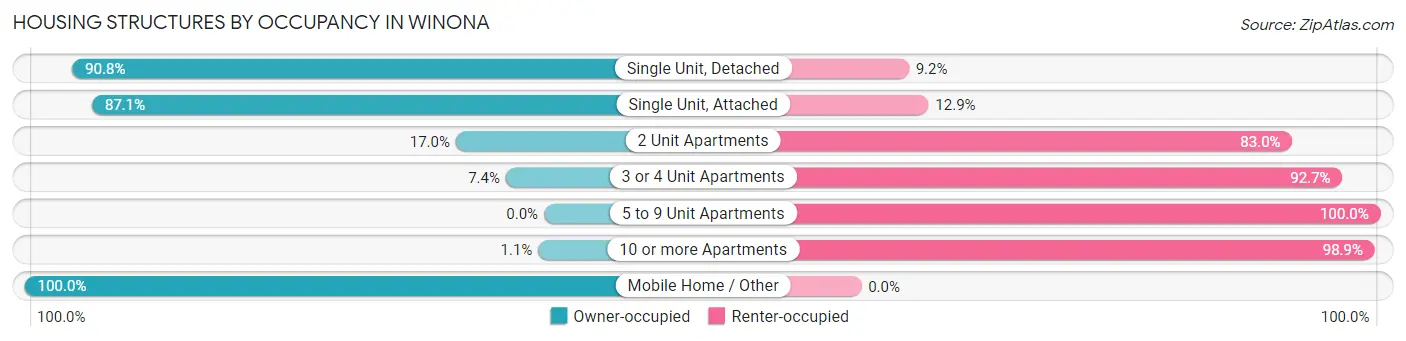
| Structure Type | Owner-occupied | Renter-occupied |
| Single Unit, Detached | 5,703 (90.8%) | 575 (9.2%) |
| Single Unit, Attached | 350 (87.1%) | 52 (12.9%) |
| 2 Unit Apartments | 128 (17.0%) | 626 (83.0%) |
| 3 or 4 Unit Apartments | 66 (7.3%) | 832 (92.6%) |
| 5 to 9 Unit Apartments | 0 (0.0%) | 466 (100.0%) |
| 10 or more Apartments | 23 (1.1%) | 2,053 (98.9%) |
| Mobile Home / Other | 28 (100.0%) | 0 (0.0%) |
| Total | 6,298 (57.8%) | 4,604 (42.2%) |
Housing Structures by Number of Rooms in Winona
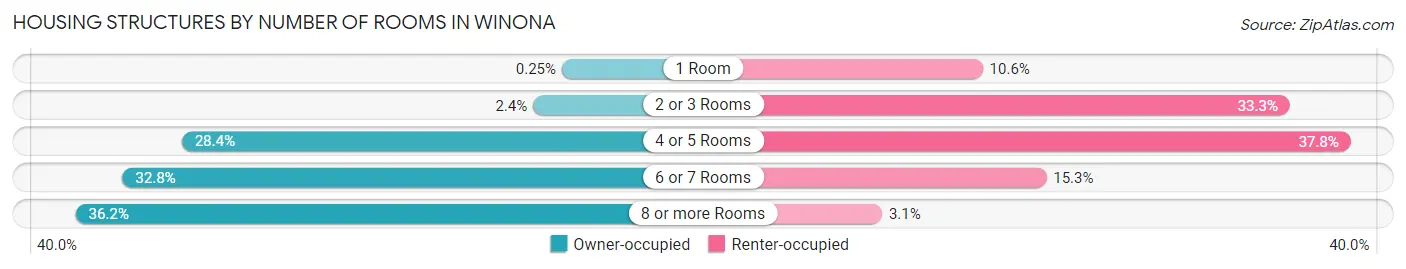
| Number of Rooms | Owner-occupied | Renter-occupied |
| 1 Room | 16 (0.3%) | 486 (10.6%) |
| 2 or 3 Rooms | 150 (2.4%) | 1,532 (33.3%) |
| 4 or 5 Rooms | 1,787 (28.4%) | 1,740 (37.8%) |
| 6 or 7 Rooms | 2,063 (32.8%) | 703 (15.3%) |
| 8 or more Rooms | 2,282 (36.2%) | 143 (3.1%) |
| Total | 6,298 (100.0%) | 4,604 (100.0%) |
Housing Structure by Heating Type in Winona
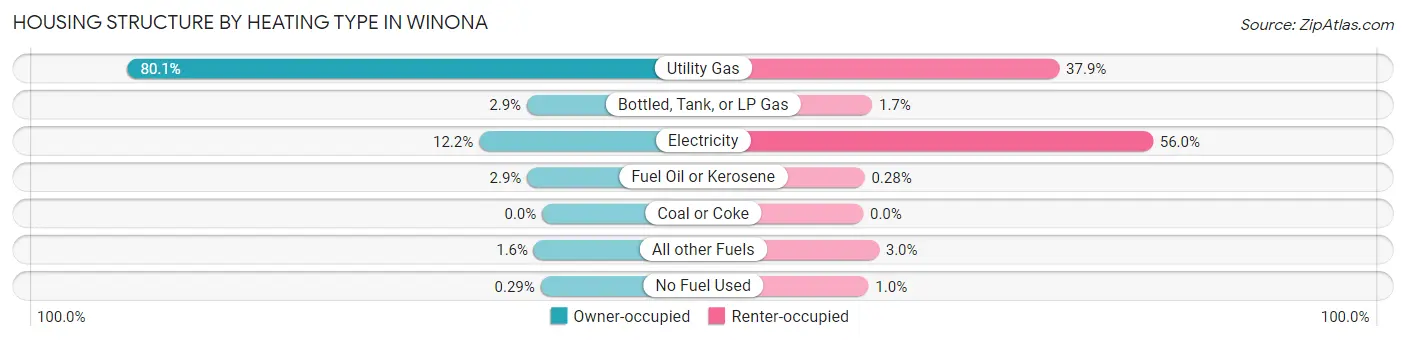
| Heating Type | Owner-occupied | Renter-occupied |
| Utility Gas | 5,046 (80.1%) | 1,745 (37.9%) |
| Bottled, Tank, or LP Gas | 185 (2.9%) | 80 (1.7%) |
| Electricity | 767 (12.2%) | 2,578 (56.0%) |
| Fuel Oil or Kerosene | 182 (2.9%) | 13 (0.3%) |
| Coal or Coke | 0 (0.0%) | 0 (0.0%) |
| All other Fuels | 100 (1.6%) | 140 (3.0%) |
| No Fuel Used | 18 (0.3%) | 48 (1.0%) |
| Total | 6,298 (100.0%) | 4,604 (100.0%) |
Household Vehicle Usage in Winona
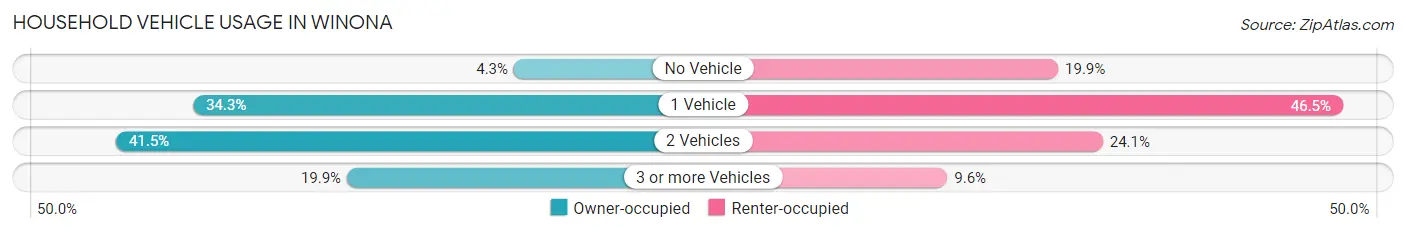
| Vehicles per Household | Owner-occupied | Renter-occupied |
| No Vehicle | 273 (4.3%) | 916 (19.9%) |
| 1 Vehicle | 2,159 (34.3%) | 2,140 (46.5%) |
| 2 Vehicles | 2,612 (41.5%) | 1,108 (24.1%) |
| 3 or more Vehicles | 1,254 (19.9%) | 440 (9.6%) |
| Total | 6,298 (100.0%) | 4,604 (100.0%) |
Real Estate & Mortgages in Winona
Real Estate and Mortgage Overview in Winona
| Characteristic | Without Mortgage | With Mortgage |
| Housing Units | 2,162 | 4,136 |
| Median Property Value | $178,200 | $175,600 |
| Median Household Income | $60,921 | $756 |
| Monthly Housing Costs | $479 | $144 |
| Real Estate Taxes | $1,922 | $34 |
Property Value by Mortgage Status in Winona
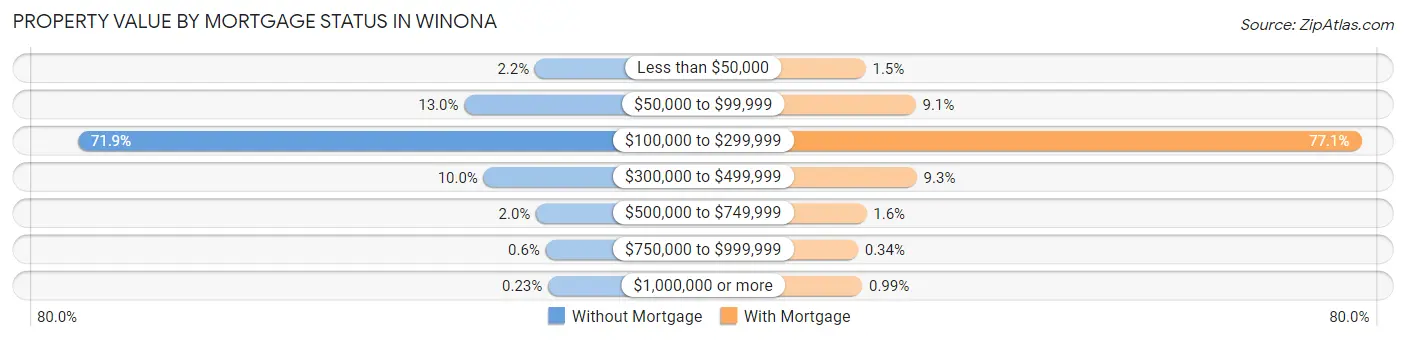
| Property Value | Without Mortgage | With Mortgage |
| Less than $50,000 | 48 (2.2%) | 63 (1.5%) |
| $50,000 to $99,999 | 281 (13.0%) | 378 (9.1%) |
| $100,000 to $299,999 | 1,554 (71.9%) | 3,187 (77.1%) |
| $300,000 to $499,999 | 217 (10.0%) | 385 (9.3%) |
| $500,000 to $749,999 | 44 (2.0%) | 68 (1.6%) |
| $750,000 to $999,999 | 13 (0.6%) | 14 (0.3%) |
| $1,000,000 or more | 5 (0.2%) | 41 (1.0%) |
| Total | 2,162 (100.0%) | 4,136 (100.0%) |
Household Income by Mortgage Status in Winona
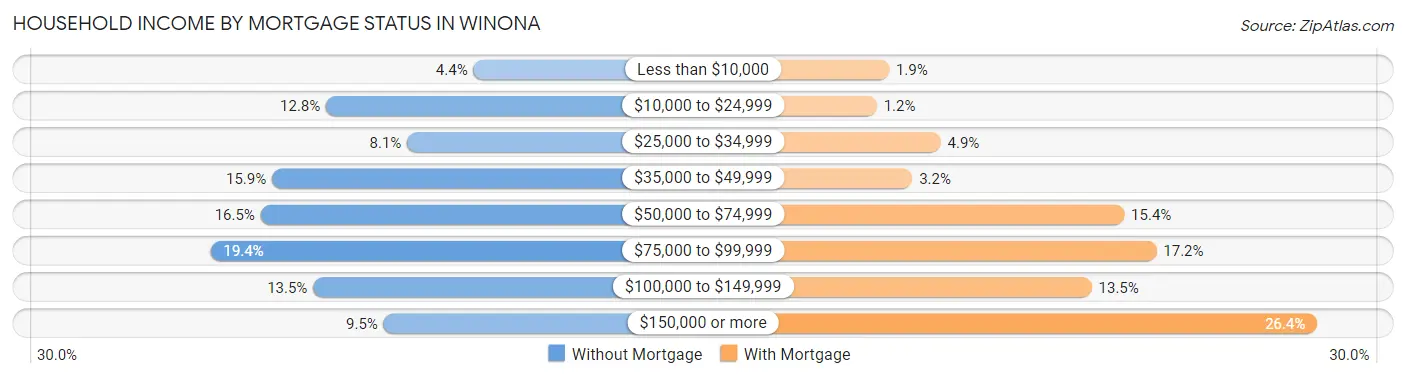
| Household Income | Without Mortgage | With Mortgage |
| Less than $10,000 | 94 (4.3%) | 79 (1.9%) |
| $10,000 to $24,999 | 276 (12.8%) | 50 (1.2%) |
| $25,000 to $34,999 | 176 (8.1%) | 201 (4.9%) |
| $35,000 to $49,999 | 343 (15.9%) | 134 (3.2%) |
| $50,000 to $74,999 | 357 (16.5%) | 635 (15.3%) |
| $75,000 to $99,999 | 419 (19.4%) | 711 (17.2%) |
| $100,000 to $149,999 | 292 (13.5%) | 558 (13.5%) |
| $150,000 or more | 205 (9.5%) | 1,091 (26.4%) |
| Total | 2,162 (100.0%) | 4,136 (100.0%) |
Property Value to Household Income Ratio in Winona
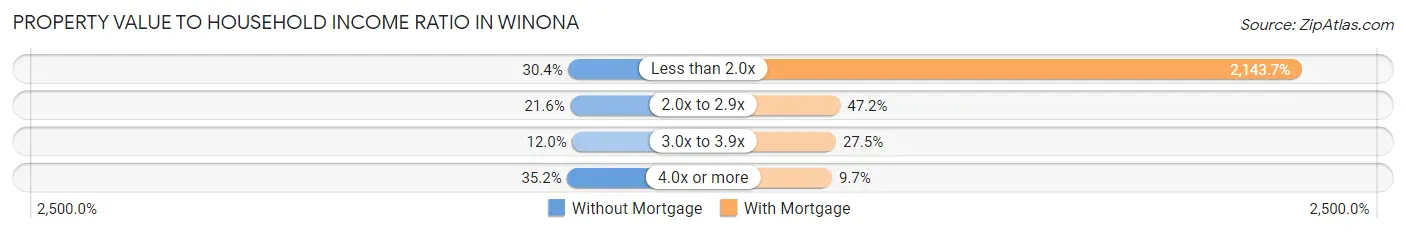
| Value-to-Income Ratio | Without Mortgage | With Mortgage |
| Less than 2.0x | 657 (30.4%) | 88,664 (2,143.7%) |
| 2.0x to 2.9x | 467 (21.6%) | 1,950 (47.1%) |
| 3.0x to 3.9x | 260 (12.0%) | 1,136 (27.5%) |
| 4.0x or more | 761 (35.2%) | 403 (9.7%) |
| Total | 2,162 (100.0%) | 4,136 (100.0%) |
Real Estate Taxes by Mortgage Status in Winona
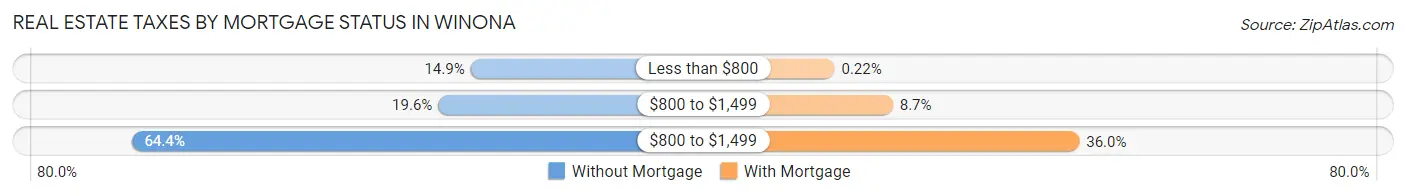
| Property Taxes | Without Mortgage | With Mortgage |
| Less than $800 | 321 (14.8%) | 9 (0.2%) |
| $800 to $1,499 | 423 (19.6%) | 361 (8.7%) |
| $800 to $1,499 | 1,392 (64.4%) | 1,488 (36.0%) |
| Total | 2,162 (100.0%) | 4,136 (100.0%) |
Health & Disability in Winona
Health Insurance Coverage by Age in Winona
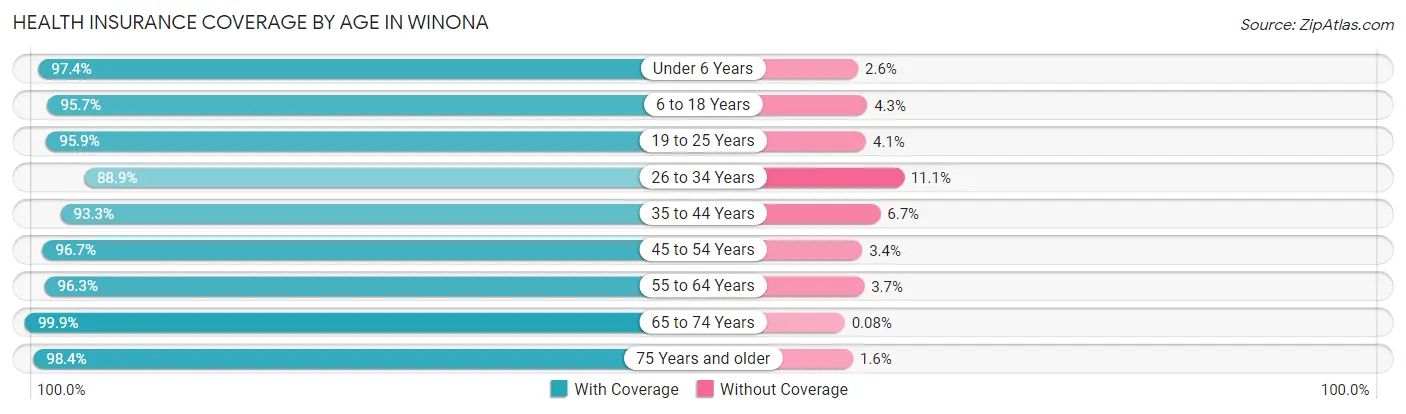
| Age Bracket | With Coverage | Without Coverage |
| Under 6 Years | 1,062 (97.4%) | 28 (2.6%) |
| 6 to 18 Years | 3,069 (95.7%) | 137 (4.3%) |
| 19 to 25 Years | 6,789 (95.9%) | 287 (4.1%) |
| 26 to 34 Years | 2,423 (88.9%) | 302 (11.1%) |
| 35 to 44 Years | 2,081 (93.3%) | 150 (6.7%) |
| 45 to 54 Years | 2,050 (96.7%) | 71 (3.4%) |
| 55 to 64 Years | 2,663 (96.3%) | 103 (3.7%) |
| 65 to 74 Years | 2,450 (99.9%) | 2 (0.1%) |
| 75 Years and older | 1,995 (98.4%) | 33 (1.6%) |
| Total | 24,582 (95.7%) | 1,113 (4.3%) |
Health Insurance Coverage by Citizenship Status in Winona
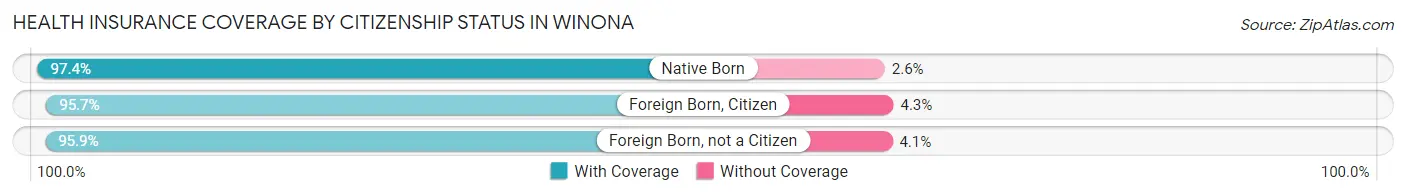
| Citizenship Status | With Coverage | Without Coverage |
| Native Born | 1,062 (97.4%) | 28 (2.6%) |
| Foreign Born, Citizen | 3,069 (95.7%) | 137 (4.3%) |
| Foreign Born, not a Citizen | 6,789 (95.9%) | 287 (4.1%) |
Health Insurance Coverage by Household Income in Winona
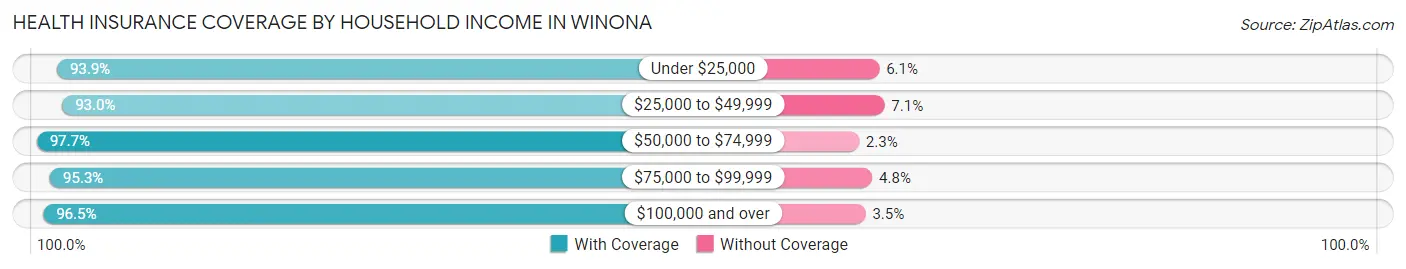
| Household Income | With Coverage | Without Coverage |
| Under $25,000 | 3,435 (93.9%) | 222 (6.1%) |
| $25,000 to $49,999 | 4,337 (92.9%) | 329 (7.0%) |
| $50,000 to $74,999 | 3,535 (97.7%) | 82 (2.3%) |
| $75,000 to $99,999 | 3,045 (95.3%) | 152 (4.8%) |
| $100,000 and over | 7,418 (96.5%) | 269 (3.5%) |
Public vs Private Health Insurance Coverage by Age in Winona
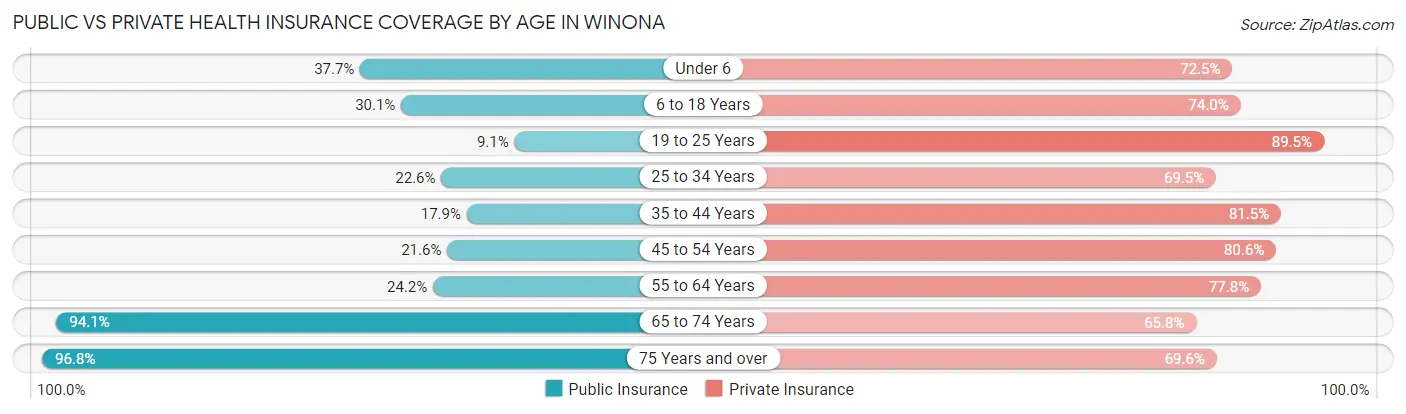
| Age Bracket | Public Insurance | Private Insurance |
| Under 6 | 411 (37.7%) | 790 (72.5%) |
| 6 to 18 Years | 965 (30.1%) | 2,373 (74.0%) |
| 19 to 25 Years | 641 (9.1%) | 6,330 (89.5%) |
| 25 to 34 Years | 617 (22.6%) | 1,893 (69.5%) |
| 35 to 44 Years | 400 (17.9%) | 1,819 (81.5%) |
| 45 to 54 Years | 457 (21.5%) | 1,710 (80.6%) |
| 55 to 64 Years | 669 (24.2%) | 2,152 (77.8%) |
| 65 to 74 Years | 2,307 (94.1%) | 1,613 (65.8%) |
| 75 Years and over | 1,962 (96.8%) | 1,411 (69.6%) |
| Total | 8,429 (32.8%) | 20,091 (78.2%) |
Disability Status by Sex by Age in Winona
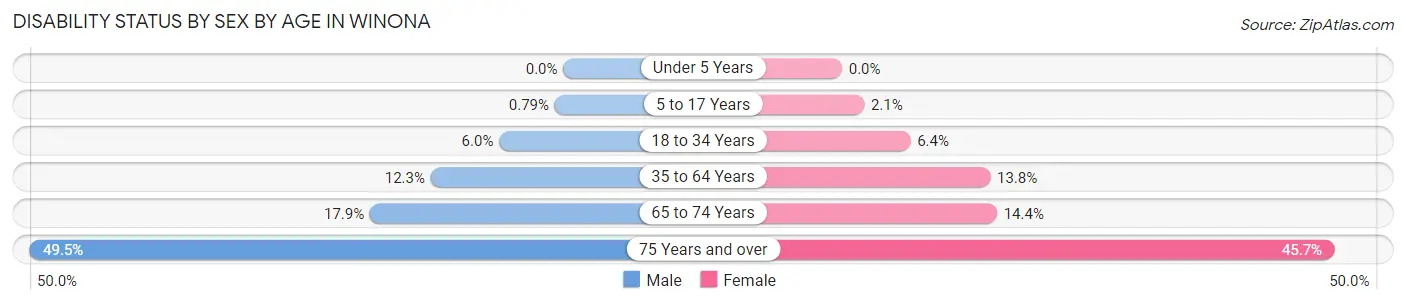
| Age Bracket | Male | Female |
| Under 5 Years | 0 (0.0%) | 0 (0.0%) |
| 5 to 17 Years | 9 (0.8%) | 25 (2.1%) |
| 18 to 34 Years | 302 (5.9%) | 372 (6.4%) |
| 35 to 64 Years | 432 (12.3%) | 496 (13.8%) |
| 65 to 74 Years | 214 (17.9%) | 181 (14.4%) |
| 75 Years and over | 398 (49.5%) | 559 (45.7%) |
Disability Class by Sex by Age in Winona
Disability Class: Hearing Difficulty
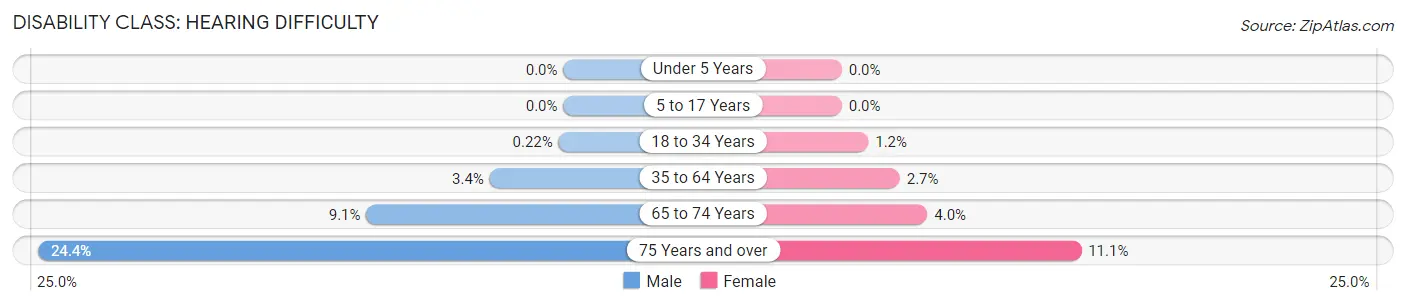
| Age Bracket | Male | Female |
| Under 5 Years | 0 (0.0%) | 0 (0.0%) |
| 5 to 17 Years | 0 (0.0%) | 0 (0.0%) |
| 18 to 34 Years | 11 (0.2%) | 72 (1.2%) |
| 35 to 64 Years | 120 (3.4%) | 97 (2.7%) |
| 65 to 74 Years | 109 (9.1%) | 50 (4.0%) |
| 75 Years and over | 196 (24.4%) | 136 (11.1%) |
Disability Class: Vision Difficulty
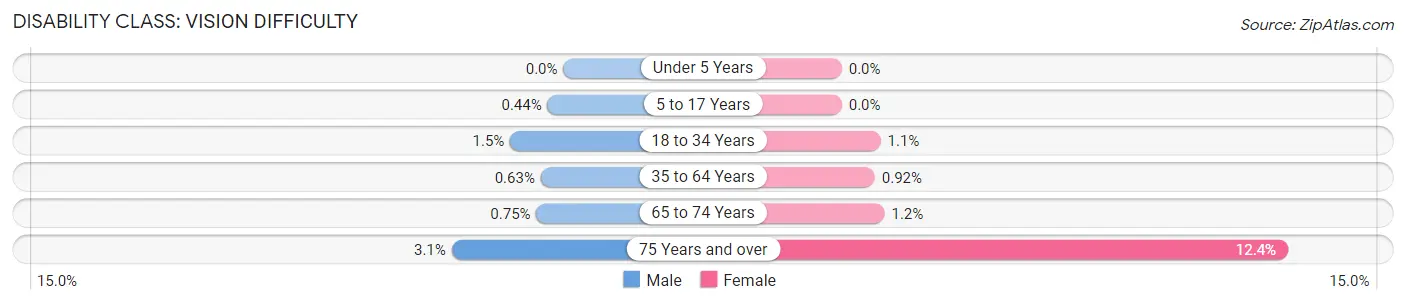
| Age Bracket | Male | Female |
| Under 5 Years | 0 (0.0%) | 0 (0.0%) |
| 5 to 17 Years | 5 (0.4%) | 0 (0.0%) |
| 18 to 34 Years | 75 (1.5%) | 63 (1.1%) |
| 35 to 64 Years | 22 (0.6%) | 33 (0.9%) |
| 65 to 74 Years | 9 (0.7%) | 15 (1.2%) |
| 75 Years and over | 25 (3.1%) | 152 (12.4%) |
Disability Class: Cognitive Difficulty
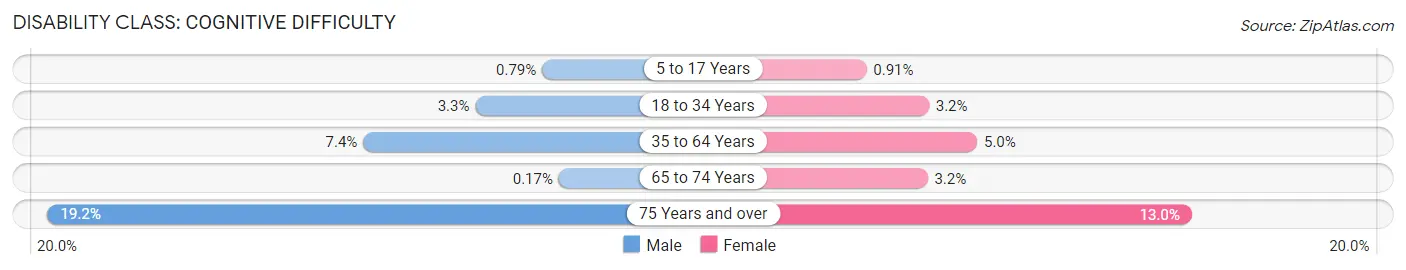
| Age Bracket | Male | Female |
| 5 to 17 Years | 9 (0.8%) | 11 (0.9%) |
| 18 to 34 Years | 166 (3.3%) | 189 (3.2%) |
| 35 to 64 Years | 261 (7.4%) | 181 (5.0%) |
| 65 to 74 Years | 2 (0.2%) | 40 (3.2%) |
| 75 Years and over | 154 (19.2%) | 159 (13.0%) |
Disability Class: Ambulatory Difficulty
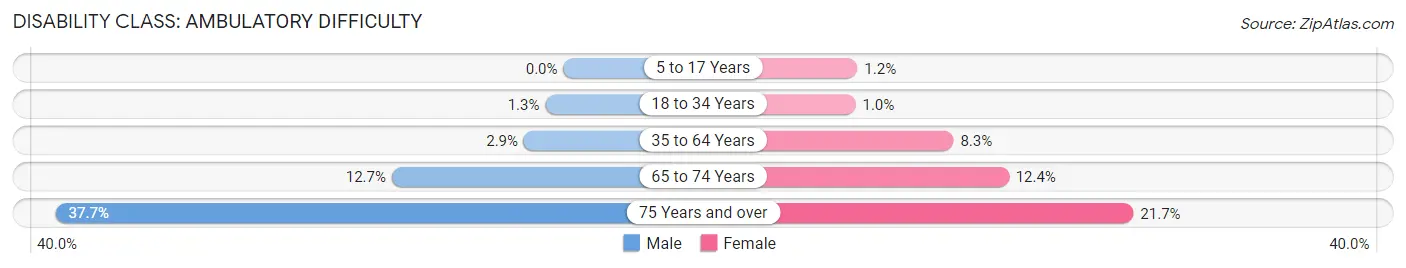
| Age Bracket | Male | Female |
| 5 to 17 Years | 0 (0.0%) | 14 (1.2%) |
| 18 to 34 Years | 68 (1.3%) | 60 (1.0%) |
| 35 to 64 Years | 103 (2.9%) | 299 (8.3%) |
| 65 to 74 Years | 152 (12.7%) | 156 (12.4%) |
| 75 Years and over | 303 (37.7%) | 265 (21.6%) |
Disability Class: Self-Care Difficulty
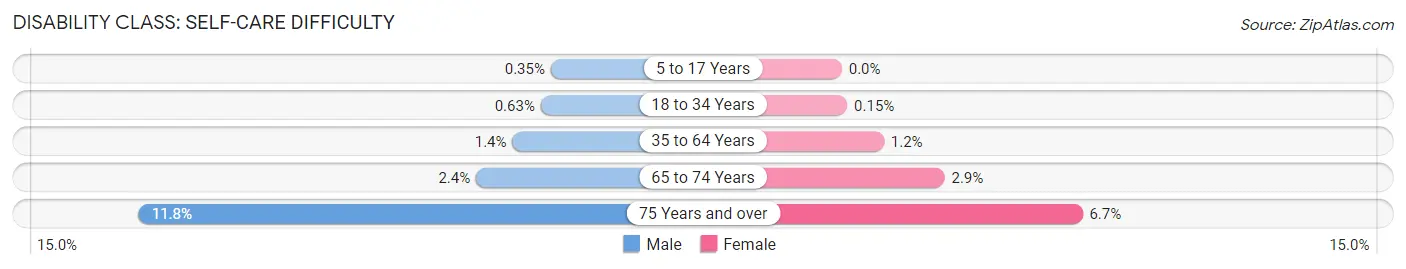
| Age Bracket | Male | Female |
| 5 to 17 Years | 4 (0.4%) | 0 (0.0%) |
| 18 to 34 Years | 32 (0.6%) | 9 (0.2%) |
| 35 to 64 Years | 50 (1.4%) | 42 (1.2%) |
| 65 to 74 Years | 29 (2.4%) | 36 (2.9%) |
| 75 Years and over | 95 (11.8%) | 82 (6.7%) |
Technology Access in Winona
Computing Device Access in Winona
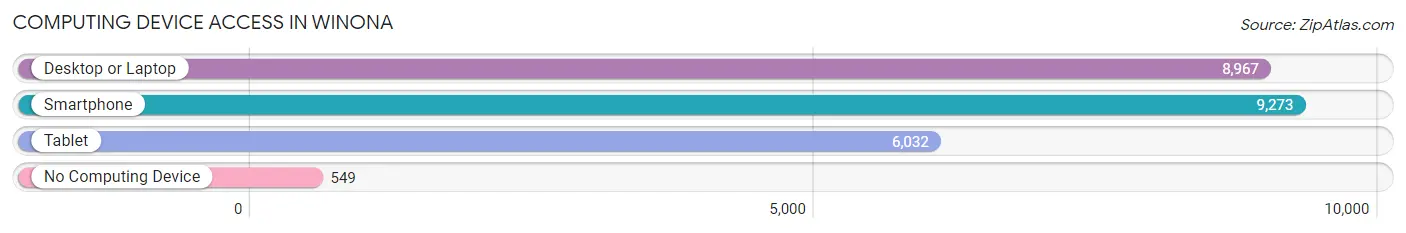
| Device Type | # Households | % Households |
| Desktop or Laptop | 8,967 | 82.3% |
| Smartphone | 9,273 | 85.1% |
| Tablet | 6,032 | 55.3% |
| No Computing Device | 549 | 5.0% |
| Total | 10,902 | 100.0% |
Internet Access in Winona
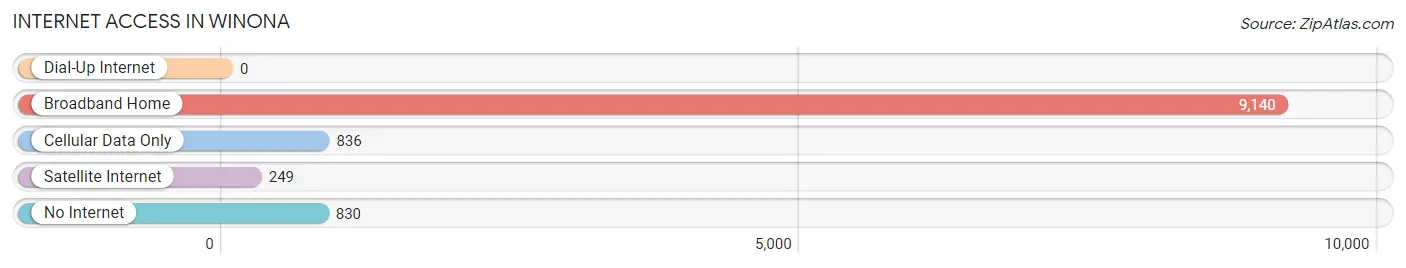
| Internet Type | # Households | % Households |
| Dial-Up Internet | 0 | 0.0% |
| Broadband Home | 9,140 | 83.8% |
| Cellular Data Only | 836 | 7.7% |
| Satellite Internet | 249 | 2.3% |
| No Internet | 830 | 7.6% |
| Total | 10,902 | 100.0% |
Winona Summary
Winona, Minnesota is a city located in the southeastern corner of the state, along the Mississippi River. It is the county seat of Winona County and is the largest city in the county. The city has a population of 27,592 as of the 2010 census, making it the fifth-largest city in Minnesota.
History
The area that is now Winona was first inhabited by the Sioux and Winnebago tribes. The first European settlers arrived in the area in the early 1800s, and the city was officially founded in 1851. The city was named after the Dakota Sioux chief Wapasha III, who was known as Winona.
The city quickly grew in the late 19th century, becoming an important port on the Mississippi River. It was also a major center for the lumber industry, with several sawmills located in the city. The city was also home to several manufacturing companies, including the Winona Wagon Works, which produced wagons and carriages.
Geography
Winona is located in southeastern Minnesota, along the Mississippi River. It is situated in the Driftless Area, a region of the Upper Midwest that was not glaciated during the last ice age. The city is located at the intersection of Interstate 90 and U.S. Route 61.
The city has a total area of 11.2 square miles, of which 10.9 square miles is land and 0.3 square miles is water. The city is located on a bluff overlooking the Mississippi River, and is surrounded by rolling hills and bluffs.
Economy
Winona has a diverse economy, with a mix of manufacturing, retail, and service industries. The city is home to several large employers, including Winona State University, Fastenal, and Winona Health.
The city is also home to several manufacturing companies, including Winona Wagon Works, which produces wagons and carriages, and Winona Foods, which produces food products. The city is also home to several retail stores, including Walmart, Target, and Kohl's.
Demographics
As of the 2010 census, Winona had a population of 27,592. The racial makeup of the city was 90.2% White, 4.2% African American, 0.7% Native American, 1.3% Asian, 0.1% Pacific Islander, 1.7% from other races, and 1.8% from two or more races. Hispanic or Latino of any race were 4.2% of the population.
The median income for a household in the city was $41,945, and the median income for a family was $54,945. The per capita income for the city was $21,945. About 11.2% of families and 15.7% of the population were below the poverty line, including 22.2% of those under age 18 and 8.2% of those age 65 or over.
Common Questions
What is Per Capita Income in Winona?
Per Capita income in Winona is $30,829.
What is the Median Family Income in Winona?
Median Family Income in Winona is $89,052.
What is the Median Household income in Winona?
Median Household Income in Winona is $52,500.
What is Income or Wage Gap in Winona?
Income or Wage Gap in Winona is 38.4%.
Women in Winona earn 61.6 cents for every dollar earned by a man.
What is Family Income Deficit in Winona?
Family Income Deficit in Winona is $10,456.
Families that are below poverty line in Winona earn $10,456 less on average than the poverty threshold level.
What is Inequality or Gini Index in Winona?
Inequality or Gini Index in Winona is 0.45.
What is the Total Population of Winona?
Total Population of Winona is 26,083.
What is the Total Male Population of Winona?
Total Male Population of Winona is 12,253.
What is the Total Female Population of Winona?
Total Female Population of Winona is 13,830.
What is the Ratio of Males per 100 Females in Winona?
There are 88.60 Males per 100 Females in Winona.
What is the Ratio of Females per 100 Males in Winona?
There are 112.87 Females per 100 Males in Winona.
What is the Median Population Age in Winona?
Median Population Age in Winona is 30.7 Years.
What is the Average Family Size in Winona
Average Family Size in Winona is 2.8 People.
What is the Average Household Size in Winona
Average Household Size in Winona is 2.1 People.
How Large is the Labor Force in Winona?
There are 15,190 People in the Labor Forcein in Winona.
What is the Percentage of People in the Labor Force in Winona?
65.6% of People are in the Labor Force in Winona.
What is the Unemployment Rate in Winona?
Unemployment Rate in Winona is 2.7%.