South St Paul, MN Map & Demographics
South St Paul Map
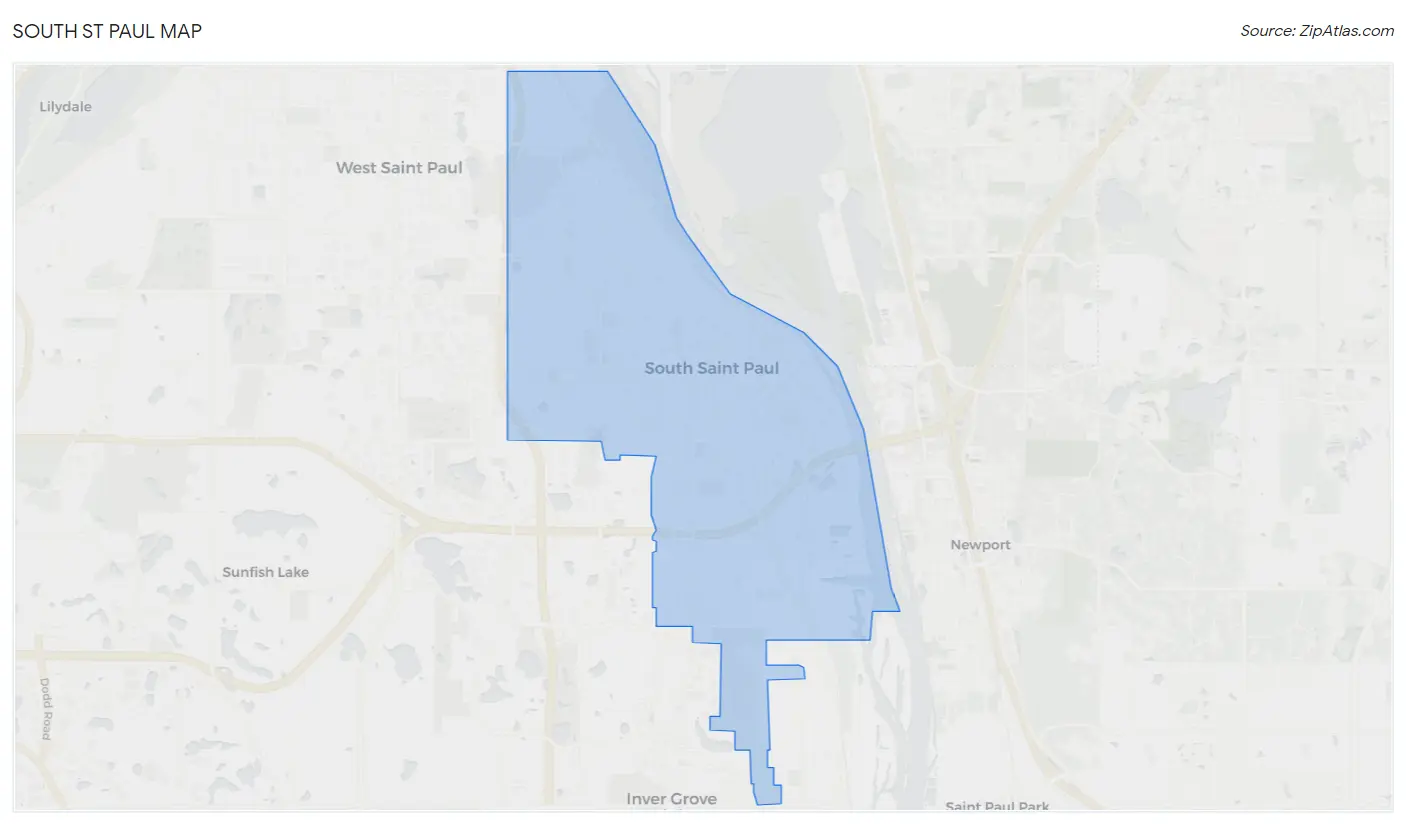
South St Paul Overview
$36,229
PER CAPITA INCOME
$99,049
AVG FAMILY INCOME
$82,644
AVG HOUSEHOLD INCOME
18.6%
WAGE / INCOME GAP [ % ]
81.4¢/ $1
WAGE / INCOME GAP [ $ ]
0.36
INEQUALITY / GINI INDEX
20,598
TOTAL POPULATION
10,169
MALE POPULATION
10,429
FEMALE POPULATION
97.51
MALES / 100 FEMALES
102.56
FEMALES / 100 MALES
36.9
MEDIAN AGE
3.1
AVG FAMILY SIZE
2.5
AVG HOUSEHOLD SIZE
12,094
LABOR FORCE [ PEOPLE ]
73.1%
PERCENT IN LABOR FORCE
5.7%
UNEMPLOYMENT RATE
South St Paul Area Codes
Income in South St Paul
Income Overview in South St Paul
Per Capita Income in South St Paul is $36,229, while median incomes of families and households are $99,049 and $82,644 respectively.
| Characteristic | Number | Measure |
| Per Capita Income | 20,598 | $36,229 |
| Median Family Income | 5,078 | $99,049 |
| Mean Family Income | 5,078 | $105,376 |
| Median Household Income | 8,263 | $82,644 |
| Mean Household Income | 8,263 | $88,855 |
| Income Deficit | 5,078 | $0 |
| Wage / Income Gap (%) | 20,598 | 18.55% |
| Wage / Income Gap ($) | 20,598 | 81.45¢ per $1 |
| Gini / Inequality Index | 20,598 | 0.36 |
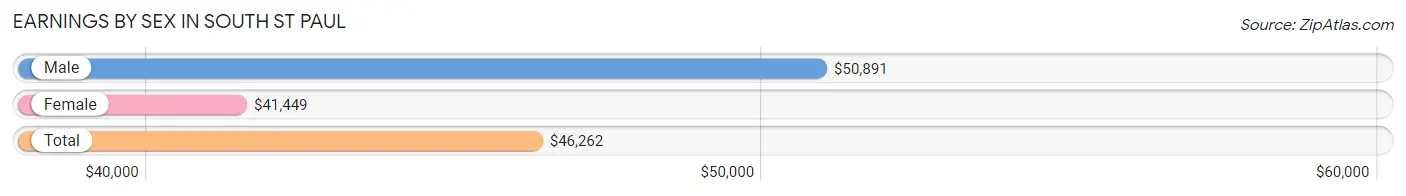
Earnings by Sex in South St Paul
Average Earnings in South St Paul are $46,262, $50,891 for men and $41,449 for women, a difference of 18.5%.
| Sex | Number | Average Earnings |
| Male | 6,370 (51.4%) | $50,891 |
| Female | 6,027 (48.6%) | $41,449 |
| Total | 12,397 (100.0%) | $46,262 |
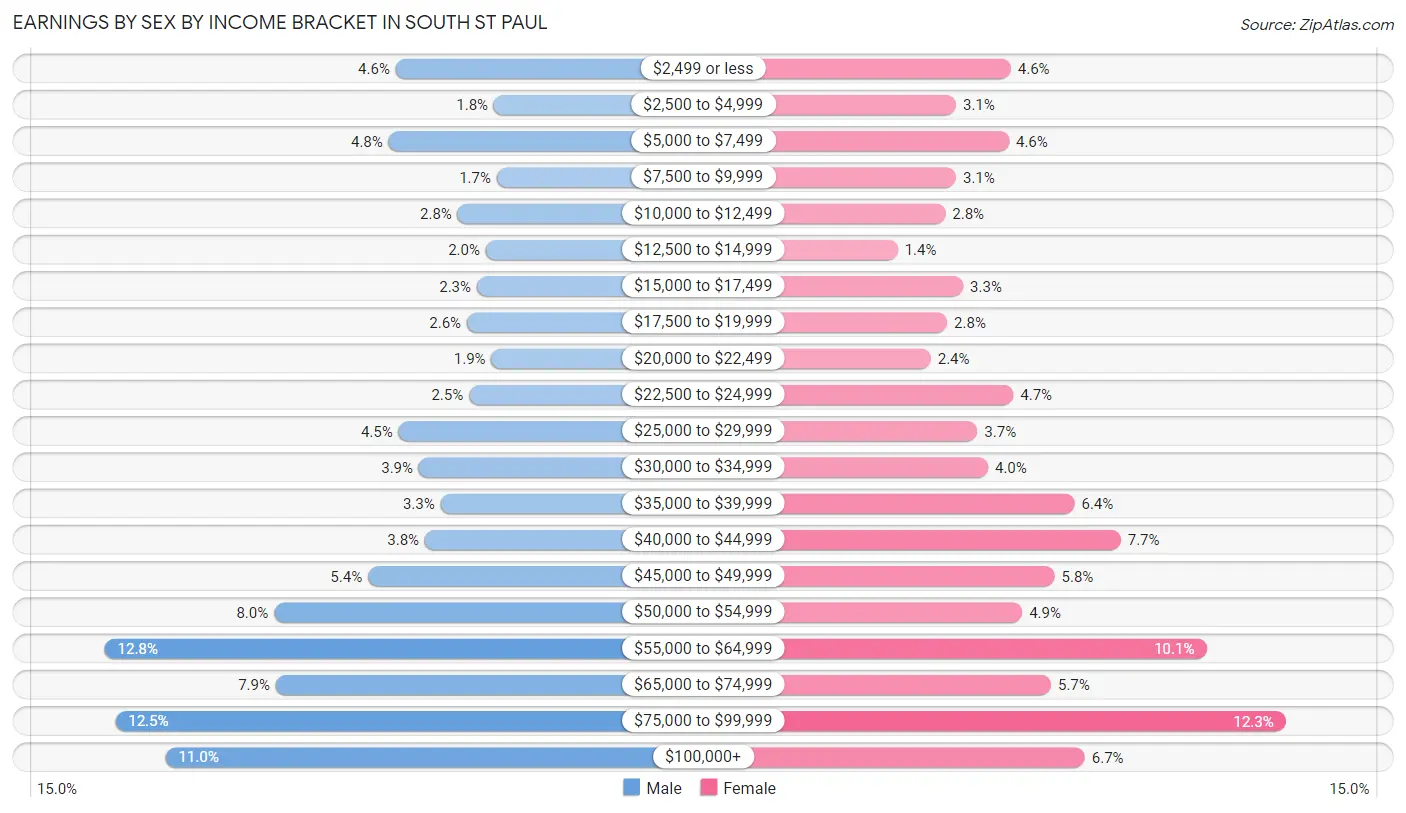
Earnings by Sex by Income Bracket in South St Paul
The most common earnings brackets in South St Paul are $55,000 to $64,999 for men (812 | 12.8%) and $75,000 to $99,999 for women (743 | 12.3%).
| Income | Male | Female |
| $2,499 or less | 291 (4.6%) | 278 (4.6%) |
| $2,500 to $4,999 | 115 (1.8%) | 185 (3.1%) |
| $5,000 to $7,499 | 304 (4.8%) | 275 (4.6%) |
| $7,500 to $9,999 | 110 (1.7%) | 185 (3.1%) |
| $10,000 to $12,499 | 180 (2.8%) | 167 (2.8%) |
| $12,500 to $14,999 | 130 (2.0%) | 86 (1.4%) |
| $15,000 to $17,499 | 146 (2.3%) | 197 (3.3%) |
| $17,500 to $19,999 | 164 (2.6%) | 170 (2.8%) |
| $20,000 to $22,499 | 120 (1.9%) | 142 (2.4%) |
| $22,500 to $24,999 | 160 (2.5%) | 282 (4.7%) |
| $25,000 to $29,999 | 286 (4.5%) | 221 (3.7%) |
| $30,000 to $34,999 | 250 (3.9%) | 239 (4.0%) |
| $35,000 to $39,999 | 211 (3.3%) | 386 (6.4%) |
| $40,000 to $44,999 | 239 (3.7%) | 464 (7.7%) |
| $45,000 to $49,999 | 341 (5.3%) | 352 (5.8%) |
| $50,000 to $54,999 | 509 (8.0%) | 297 (4.9%) |
| $55,000 to $64,999 | 812 (12.8%) | 609 (10.1%) |
| $65,000 to $74,999 | 506 (7.9%) | 346 (5.7%) |
| $75,000 to $99,999 | 793 (12.4%) | 743 (12.3%) |
| $100,000+ | 703 (11.0%) | 403 (6.7%) |
| Total | 6,370 (100.0%) | 6,027 (100.0%) |
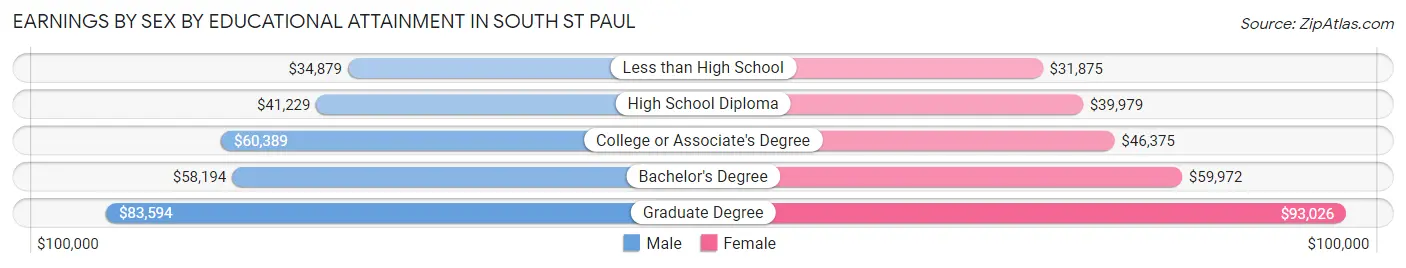
Earnings by Sex by Educational Attainment in South St Paul
Average earnings in South St Paul are $55,334 for men and $47,642 for women, a difference of 13.9%. Men with an educational attainment of graduate degree enjoy the highest average annual earnings of $83,594, while those with less than high school education earn the least with $34,879. Women with an educational attainment of graduate degree earn the most with the average annual earnings of $93,026, while those with less than high school education have the smallest earnings of $31,875.
| Educational Attainment | Male Income | Female Income |
| Less than High School | $34,879 | $31,875 |
| High School Diploma | $41,229 | $39,979 |
| College or Associate's Degree | $60,389 | $46,375 |
| Bachelor's Degree | $58,194 | $59,972 |
| Graduate Degree | $83,594 | $93,026 |
| Total | $55,334 | $47,642 |
Family Income in South St Paul
Family Income Brackets in South St Paul
According to the South St Paul family income data, there are 1,508 families falling into the $100,000 to $149,999 income range, which is the most common income bracket and makes up 29.7% of all families. Conversely, the less than $10,000 income bracket is the least frequent group with only 61 families (1.2%) belonging to this category.
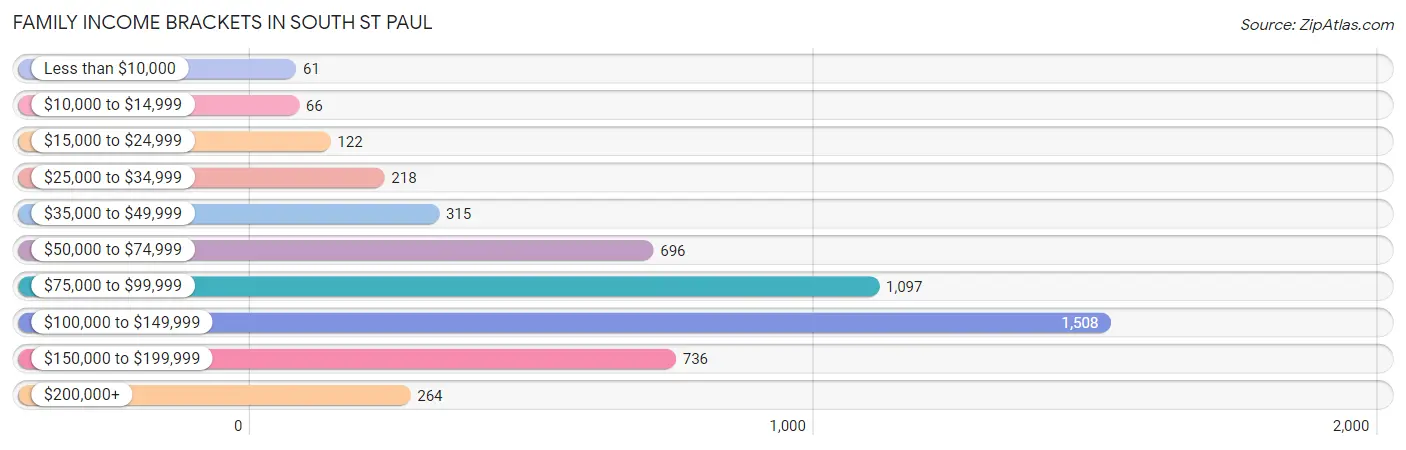
| Income Bracket | # Families | % Families |
| Less than $10,000 | 61 | 1.2% |
| $10,000 to $14,999 | 66 | 1.3% |
| $15,000 to $24,999 | 122 | 2.4% |
| $25,000 to $34,999 | 218 | 4.3% |
| $35,000 to $49,999 | 315 | 6.2% |
| $50,000 to $74,999 | 696 | 13.7% |
| $75,000 to $99,999 | 1,097 | 21.6% |
| $100,000 to $149,999 | 1,508 | 29.7% |
| $150,000 to $199,999 | 736 | 14.5% |
| $200,000+ | 264 | 5.2% |
Family Income by Famaliy Size in South St Paul
3-person families (1,195 | 23.5%) account for the highest median family income in South St Paul with $109,250 per family, while 2-person families (2,377 | 46.8%) have the highest median income of $47,016 per family member.
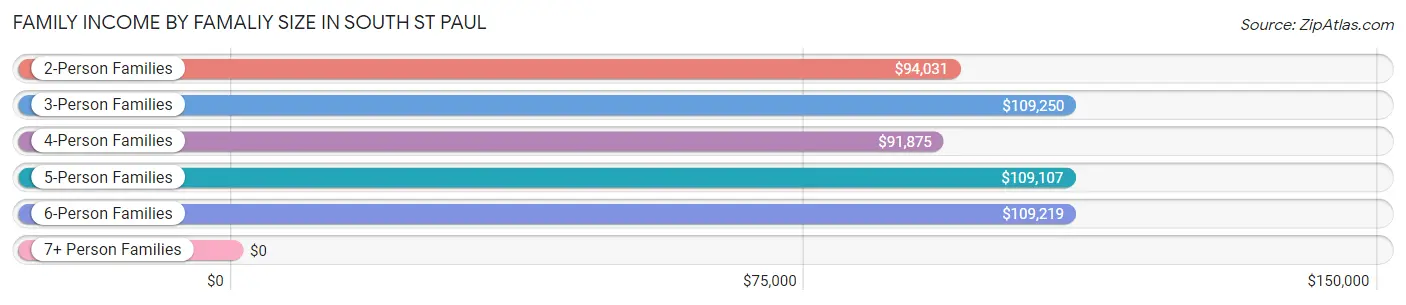
| Income Bracket | # Families | Median Income |
| 2-Person Families | 2,377 (46.8%) | $94,031 |
| 3-Person Families | 1,195 (23.5%) | $109,250 |
| 4-Person Families | 889 (17.5%) | $91,875 |
| 5-Person Families | 302 (5.9%) | $109,107 |
| 6-Person Families | 305 (6.0%) | $109,219 |
| 7+ Person Families | 10 (0.2%) | $0 |
| Total | 5,078 (100.0%) | $99,049 |
Family Income by Number of Earners in South St Paul
The median family income in South St Paul is $99,049, with families comprising 3+ earners (788) having the highest median family income of $135,119, while families with no earners (547) have the lowest median family income of $58,250, accounting for 15.5% and 10.8% of families, respectively.
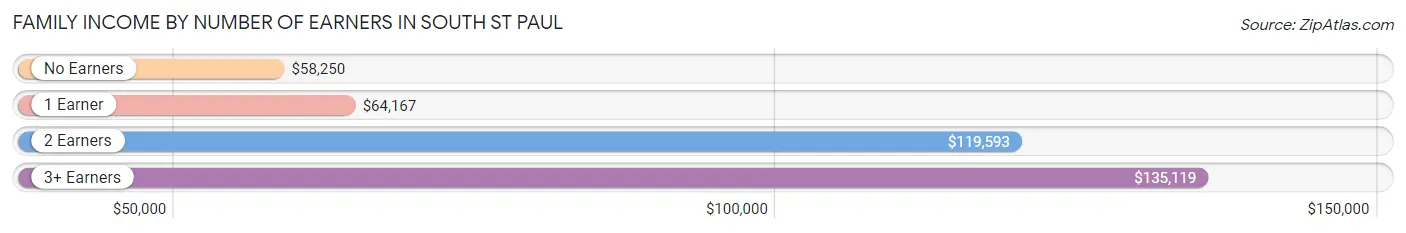
| Number of Earners | # Families | Median Income |
| No Earners | 547 (10.8%) | $58,250 |
| 1 Earner | 1,400 (27.6%) | $64,167 |
| 2 Earners | 2,343 (46.1%) | $119,593 |
| 3+ Earners | 788 (15.5%) | $135,119 |
| Total | 5,078 (100.0%) | $99,049 |
Household Income in South St Paul
Household Income Brackets in South St Paul
With 1,925 households falling in the category, the $100,000 to $149,999 income range is the most frequent in South St Paul, accounting for 23.3% of all households. In contrast, only 322 households (3.9%) fall into the $200,000+ income bracket, making it the least populous group.
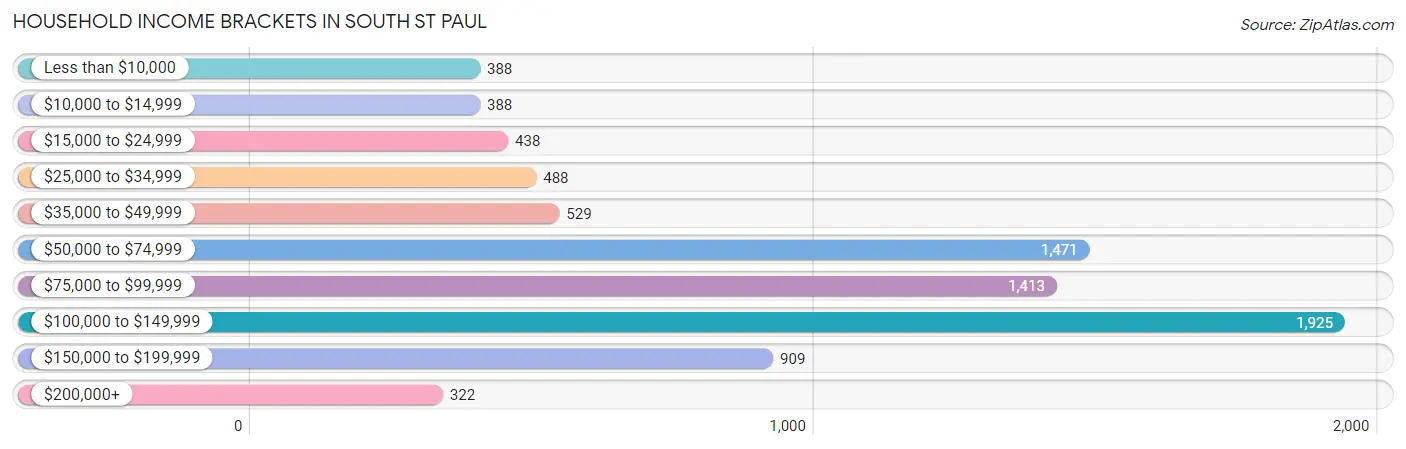
| Income Bracket | # Households | % Households |
| Less than $10,000 | 388 | 4.7% |
| $10,000 to $14,999 | 388 | 4.7% |
| $15,000 to $24,999 | 438 | 5.3% |
| $25,000 to $34,999 | 488 | 5.9% |
| $35,000 to $49,999 | 529 | 6.4% |
| $50,000 to $74,999 | 1,471 | 17.8% |
| $75,000 to $99,999 | 1,413 | 17.1% |
| $100,000 to $149,999 | 1,925 | 23.3% |
| $150,000 to $199,999 | 909 | 11.0% |
| $200,000+ | 322 | 3.9% |
Household Income by Householder Age in South St Paul
The median household income in South St Paul is $82,644, with the highest median household income of $97,332 found in the 45 to 64 years age bracket for the primary householder. A total of 2,989 households (36.2%) fall into this category. Meanwhile, the 65+ years age bracket for the primary householder has the lowest median household income of $52,240, with 1,903 households (23.0%) in this group.
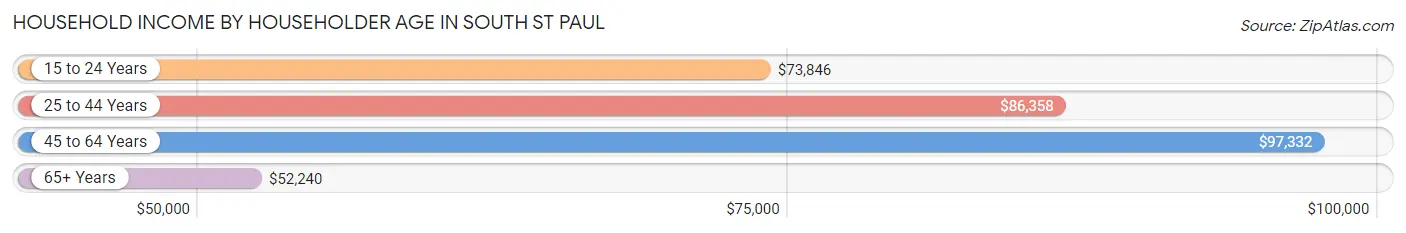
| Income Bracket | # Households | Median Income |
| 15 to 24 Years | 384 (4.6%) | $73,846 |
| 25 to 44 Years | 2,987 (36.1%) | $86,358 |
| 45 to 64 Years | 2,989 (36.2%) | $97,332 |
| 65+ Years | 1,903 (23.0%) | $52,240 |
| Total | 8,263 (100.0%) | $82,644 |
Poverty in South St Paul
Income Below Poverty by Sex and Age in South St Paul
With 9.4% poverty level for males and 10.1% for females among the residents of South St Paul, 15 year old males and 5 year old females are the most vulnerable to poverty, with 43 males (21.0%) and 30 females (22.9%) in their respective age groups living below the poverty level.
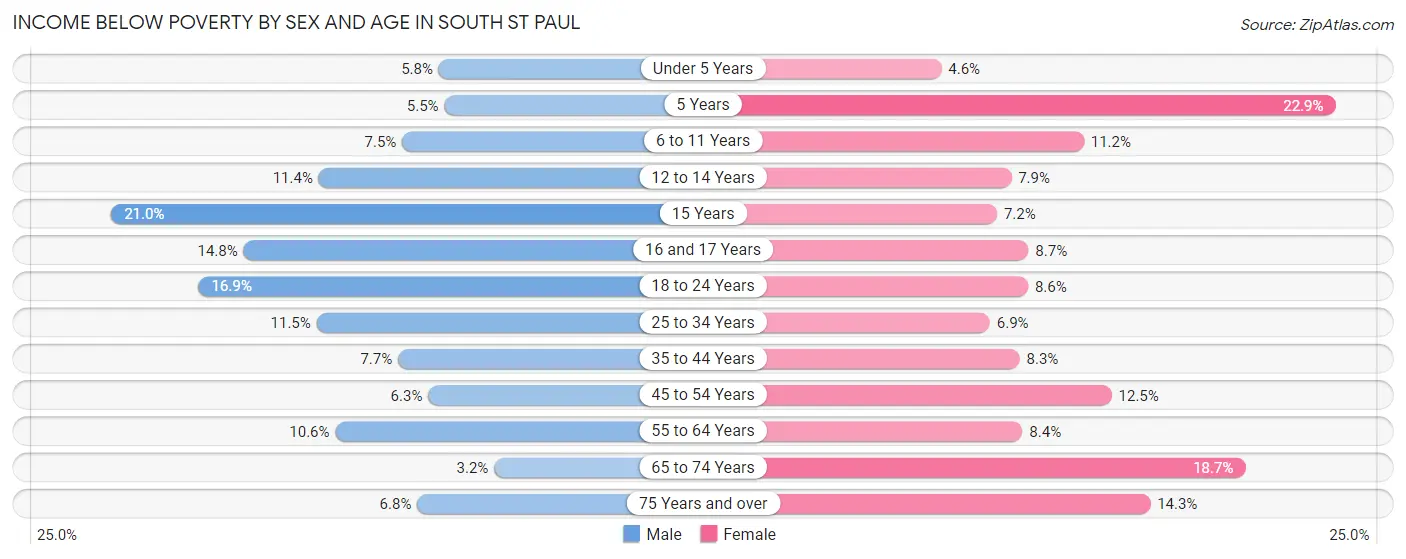
| Age Bracket | Male | Female |
| Under 5 Years | 29 (5.8%) | 26 (4.6%) |
| 5 Years | 8 (5.5%) | 30 (22.9%) |
| 6 to 11 Years | 60 (7.5%) | 75 (11.2%) |
| 12 to 14 Years | 48 (11.4%) | 33 (7.9%) |
| 15 Years | 43 (21.0%) | 9 (7.2%) |
| 16 and 17 Years | 46 (14.8%) | 24 (8.7%) |
| 18 to 24 Years | 159 (16.9%) | 94 (8.6%) |
| 25 to 34 Years | 170 (11.5%) | 110 (6.9%) |
| 35 to 44 Years | 116 (7.7%) | 116 (8.3%) |
| 45 to 54 Years | 79 (6.3%) | 137 (12.5%) |
| 55 to 64 Years | 139 (10.6%) | 114 (8.4%) |
| 65 to 74 Years | 25 (3.2%) | 173 (18.7%) |
| 75 Years and over | 31 (6.8%) | 104 (14.3%) |
| Total | 953 (9.4%) | 1,045 (10.1%) |
Income Above Poverty by Sex and Age in South St Paul
According to the poverty statistics in South St Paul, males aged 65 to 74 years and females aged under 5 years are the age groups that are most secure financially, with 96.8% of males and 95.4% of females in these age groups living above the poverty line.
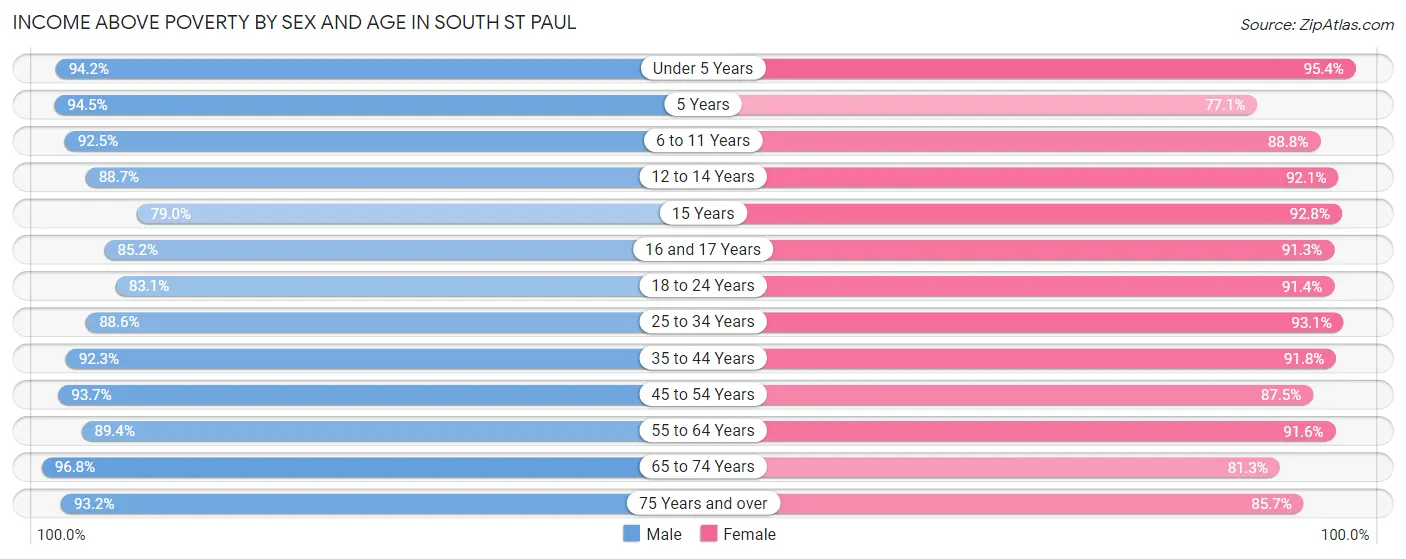
| Age Bracket | Male | Female |
| Under 5 Years | 473 (94.2%) | 537 (95.4%) |
| 5 Years | 137 (94.5%) | 101 (77.1%) |
| 6 to 11 Years | 742 (92.5%) | 593 (88.8%) |
| 12 to 14 Years | 375 (88.6%) | 387 (92.1%) |
| 15 Years | 162 (79.0%) | 116 (92.8%) |
| 16 and 17 Years | 264 (85.2%) | 253 (91.3%) |
| 18 to 24 Years | 780 (83.1%) | 994 (91.4%) |
| 25 to 34 Years | 1,315 (88.5%) | 1,491 (93.1%) |
| 35 to 44 Years | 1,397 (92.3%) | 1,290 (91.7%) |
| 45 to 54 Years | 1,180 (93.7%) | 957 (87.5%) |
| 55 to 64 Years | 1,175 (89.4%) | 1,246 (91.6%) |
| 65 to 74 Years | 755 (96.8%) | 751 (81.3%) |
| 75 Years and over | 426 (93.2%) | 623 (85.7%) |
| Total | 9,181 (90.6%) | 9,339 (89.9%) |
Income Below Poverty Among Married-Couple Families in South St Paul
The poverty statistics for married-couple families in South St Paul show that 2.9% or 100 of the total 3,497 families live below the poverty line. Families with 3 or 4 children have the highest poverty rate of 6.9%, comprising of 15 families. On the other hand, families with no children have the lowest poverty rate of 1.9%, which includes 41 families.
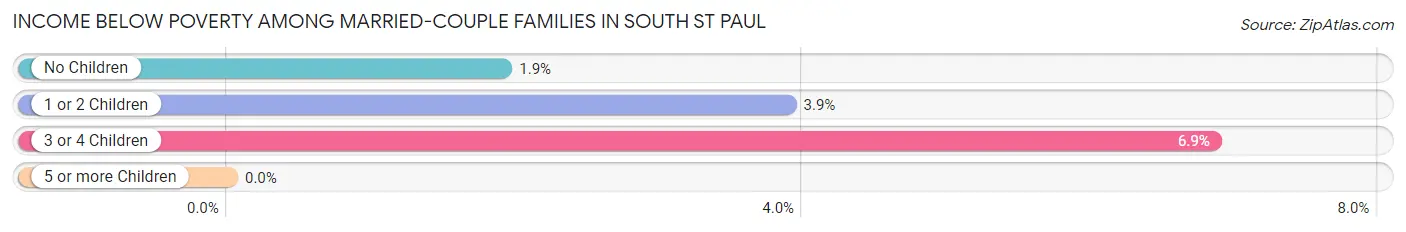
| Children | Above Poverty | Below Poverty |
| No Children | 2,107 (98.1%) | 41 (1.9%) |
| 1 or 2 Children | 1,086 (96.1%) | 44 (3.9%) |
| 3 or 4 Children | 204 (93.1%) | 15 (6.9%) |
| 5 or more Children | 0 (0.0%) | 0 (0.0%) |
| Total | 3,397 (97.1%) | 100 (2.9%) |
Income Below Poverty Among Single-Parent Households in South St Paul
According to the poverty data in South St Paul, 3.8% or 19 single-father households and 14.4% or 156 single-mother households are living below the poverty line. Among single-father households, those with 1 or 2 children have the highest poverty rate, with 13 households (4.7%) experiencing poverty. Likewise, among single-mother households, those with 3 or 4 children have the highest poverty rate, with 79 households (32.4%) falling below the poverty line.
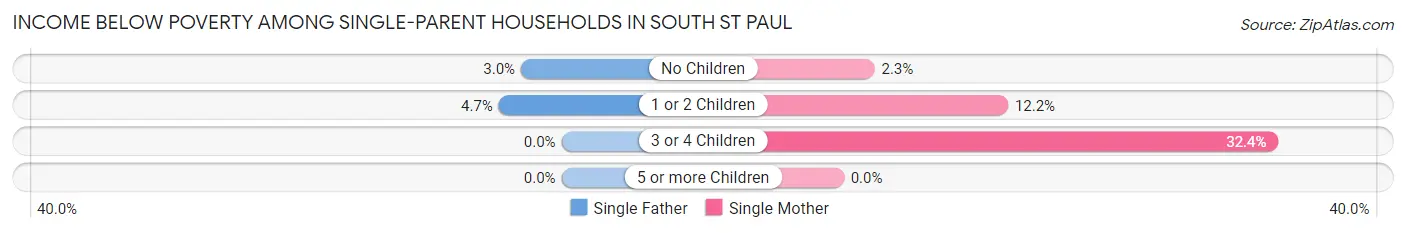
| Children | Single Father | Single Mother |
| No Children | 6 (3.0%) | 6 (2.3%) |
| 1 or 2 Children | 13 (4.7%) | 71 (12.2%) |
| 3 or 4 Children | 0 (0.0%) | 79 (32.4%) |
| 5 or more Children | 0 (0.0%) | 0 (0.0%) |
| Total | 19 (3.8%) | 156 (14.4%) |
Income Below Poverty Among Married-Couple vs Single-Parent Households in South St Paul
The poverty data for South St Paul shows that 100 of the married-couple family households (2.9%) and 175 of the single-parent households (11.1%) are living below the poverty level. Within the married-couple family households, those with 3 or 4 children have the highest poverty rate, with 15 households (6.9%) falling below the poverty line. Among the single-parent households, those with 3 or 4 children have the highest poverty rate, with 79 household (30.0%) living below poverty.
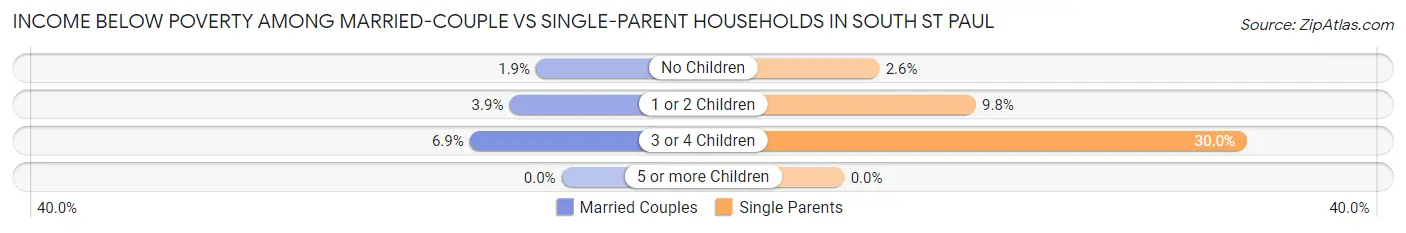
| Children | Married-Couple Families | Single-Parent Households |
| No Children | 41 (1.9%) | 12 (2.6%) |
| 1 or 2 Children | 44 (3.9%) | 84 (9.8%) |
| 3 or 4 Children | 15 (6.9%) | 79 (30.0%) |
| 5 or more Children | 0 (0.0%) | 0 (0.0%) |
| Total | 100 (2.9%) | 175 (11.1%) |
Race in South St Paul
The most populous races in South St Paul are White / Caucasian (15,549 | 75.5%), Hispanic or Latino (3,400 | 16.5%), and Two or more Races (1,827 | 8.9%).
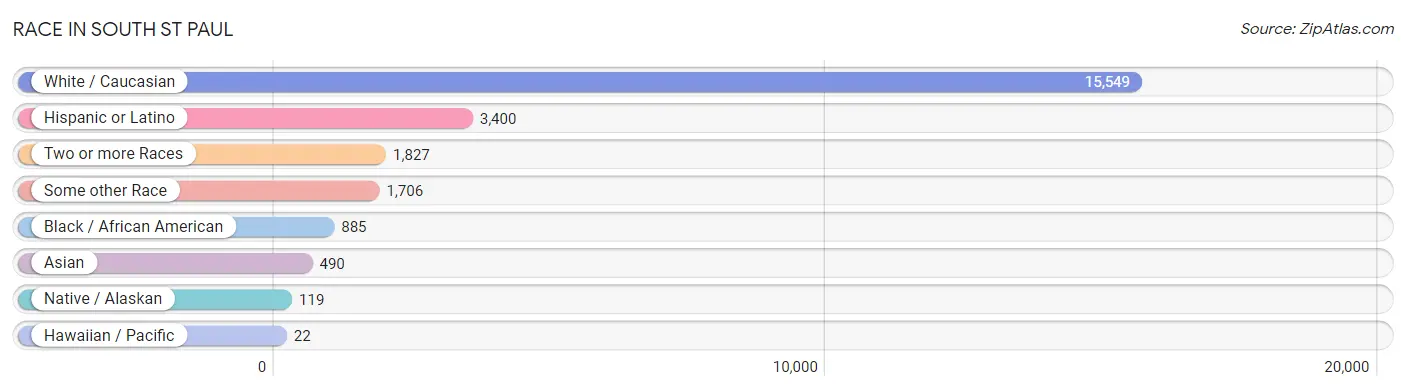
| Race | # Population | % Population |
| Asian | 490 | 2.4% |
| Black / African American | 885 | 4.3% |
| Hawaiian / Pacific | 22 | 0.1% |
| Hispanic or Latino | 3,400 | 16.5% |
| Native / Alaskan | 119 | 0.6% |
| White / Caucasian | 15,549 | 75.5% |
| Two or more Races | 1,827 | 8.9% |
| Some other Race | 1,706 | 8.3% |
| Total | 20,598 | 100.0% |
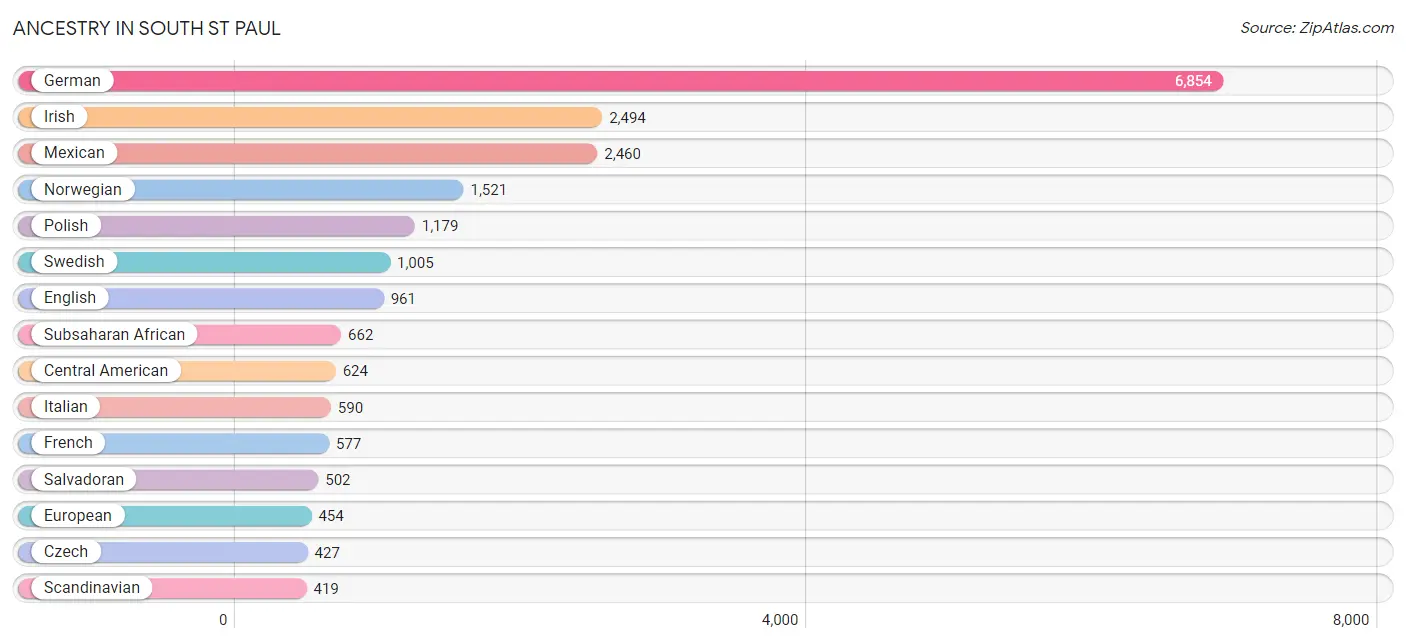
Ancestry in South St Paul
The most populous ancestries reported in South St Paul are German (6,854 | 33.3%), Irish (2,494 | 12.1%), Mexican (2,460 | 11.9%), Norwegian (1,521 | 7.4%), and Polish (1,179 | 5.7%), together accounting for 70.4% of all South St Paul residents.
| Ancestry | # Population | % Population |
| African | 262 | 1.3% |
| American | 300 | 1.5% |
| Arab | 167 | 0.8% |
| Argentinean | 14 | 0.1% |
| Austrian | 146 | 0.7% |
| Bangladeshi | 263 | 1.3% |
| Bhutanese | 8 | 0.0% |
| British | 30 | 0.2% |
| Burmese | 69 | 0.3% |
| Canadian | 12 | 0.1% |
| Celtic | 46 | 0.2% |
| Central American | 624 | 3.0% |
| Cherokee | 28 | 0.1% |
| Chickasaw | 4 | 0.0% |
| Chippewa | 153 | 0.7% |
| Colombian | 13 | 0.1% |
| Costa Rican | 31 | 0.2% |
| Croatian | 53 | 0.3% |
| Cuban | 27 | 0.1% |
| Czech | 427 | 2.1% |
| Czechoslovakian | 10 | 0.1% |
| Danish | 205 | 1.0% |
| Dutch | 117 | 0.6% |
| Eastern European | 138 | 0.7% |
| Ecuadorian | 46 | 0.2% |
| Egyptian | 42 | 0.2% |
| English | 961 | 4.7% |
| Estonian | 34 | 0.2% |
| Ethiopian | 93 | 0.4% |
| European | 454 | 2.2% |
| Finnish | 277 | 1.3% |
| French | 577 | 2.8% |
| French American Indian | 8 | 0.0% |
| French Canadian | 261 | 1.3% |
| German | 6,854 | 33.3% |
| Greek | 116 | 0.6% |
| Guamanian / Chamorro | 11 | 0.1% |
| Guatemalan | 43 | 0.2% |
| Honduran | 48 | 0.2% |
| Hungarian | 44 | 0.2% |
| Indian (Asian) | 15 | 0.1% |
| Irish | 2,494 | 12.1% |
| Italian | 590 | 2.9% |
| Japanese | 51 | 0.3% |
| Korean | 117 | 0.6% |
| Lebanese | 95 | 0.5% |
| Liberian | 43 | 0.2% |
| Lithuanian | 7 | 0.0% |
| Luxembourger | 8 | 0.0% |
| Mexican | 2,460 | 11.9% |
| Mexican American Indian | 6 | 0.0% |
| Native Hawaiian | 35 | 0.2% |
| Navajo | 9 | 0.0% |
| Nigerian | 32 | 0.2% |
| Northern European | 84 | 0.4% |
| Norwegian | 1,521 | 7.4% |
| Pakistani | 25 | 0.1% |
| Peruvian | 42 | 0.2% |
| Polish | 1,179 | 5.7% |
| Portuguese | 18 | 0.1% |
| Puerto Rican | 128 | 0.6% |
| Romanian | 16 | 0.1% |
| Russian | 171 | 0.8% |
| Salvadoran | 502 | 2.4% |
| Samoan | 11 | 0.1% |
| Scandinavian | 419 | 2.0% |
| Scotch-Irish | 112 | 0.5% |
| Scottish | 418 | 2.0% |
| Serbian | 18 | 0.1% |
| Sierra Leonean | 40 | 0.2% |
| Sioux | 77 | 0.4% |
| Slavic | 16 | 0.1% |
| Slovak | 71 | 0.3% |
| Slovene | 17 | 0.1% |
| Somali | 123 | 0.6% |
| South American | 115 | 0.6% |
| Spaniard | 6 | 0.0% |
| Sri Lankan | 36 | 0.2% |
| Subsaharan African | 662 | 3.2% |
| Swedish | 1,005 | 4.9% |
| Swiss | 132 | 0.6% |
| Syrian | 7 | 0.0% |
| Thai | 46 | 0.2% |
| Ukrainian | 39 | 0.2% |
| Welsh | 40 | 0.2% |
| West Indian | 11 | 0.1% | View All 86 Rows |
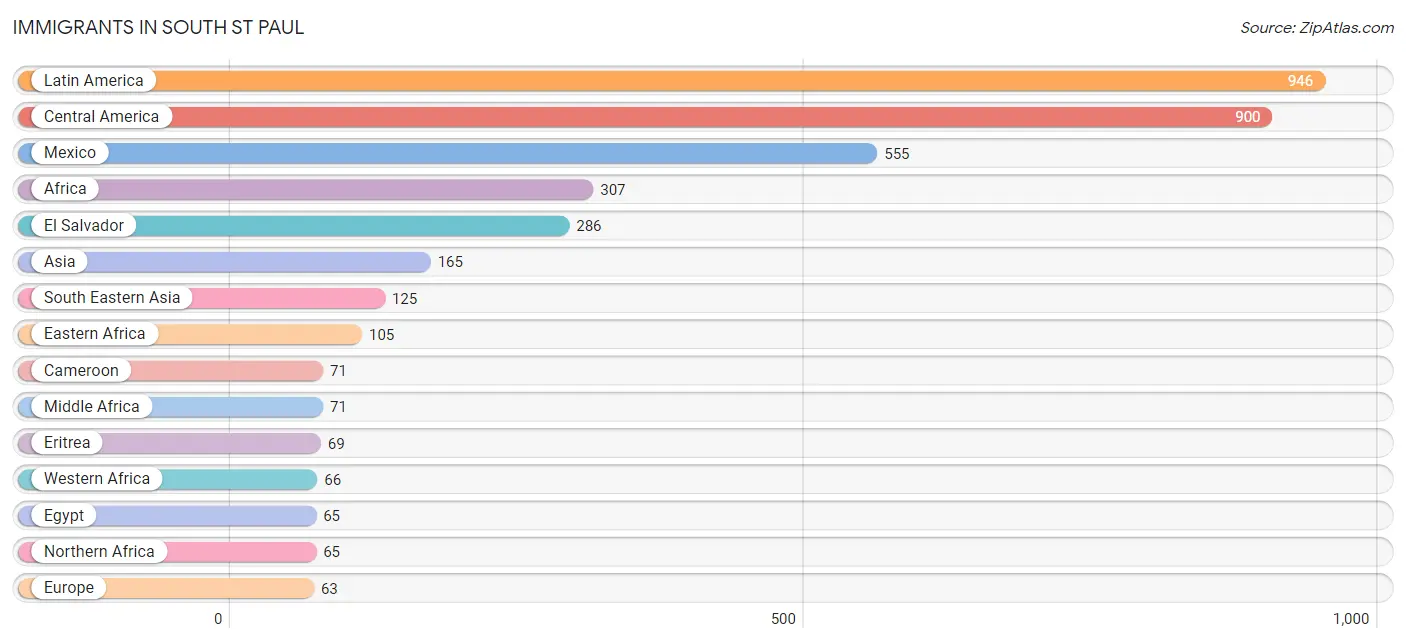
Immigrants in South St Paul
The most numerous immigrant groups reported in South St Paul came from Latin America (946 | 4.6%), Central America (900 | 4.4%), Mexico (555 | 2.7%), Africa (307 | 1.5%), and El Salvador (286 | 1.4%), together accounting for 14.5% of all South St Paul residents.
| Immigration Origin | # Population | % Population |
| Africa | 307 | 1.5% |
| Asia | 165 | 0.8% |
| Brazil | 10 | 0.1% |
| Cambodia | 27 | 0.1% |
| Cameroon | 71 | 0.3% |
| Canada | 5 | 0.0% |
| Central America | 900 | 4.4% |
| Costa Rica | 16 | 0.1% |
| Eastern Africa | 105 | 0.5% |
| Eastern Asia | 17 | 0.1% |
| Eastern Europe | 43 | 0.2% |
| Ecuador | 36 | 0.2% |
| Egypt | 65 | 0.3% |
| El Salvador | 286 | 1.4% |
| Eritrea | 69 | 0.3% |
| Ethiopia | 12 | 0.1% |
| Europe | 63 | 0.3% |
| Germany | 13 | 0.1% |
| Guatemala | 14 | 0.1% |
| Honduras | 29 | 0.1% |
| India | 23 | 0.1% |
| Ireland | 7 | 0.0% |
| Korea | 17 | 0.1% |
| Laos | 28 | 0.1% |
| Latin America | 946 | 4.6% |
| Liberia | 43 | 0.2% |
| Mexico | 555 | 2.7% |
| Middle Africa | 71 | 0.3% |
| Nigeria | 11 | 0.1% |
| Northern Africa | 65 | 0.3% |
| Northern Europe | 7 | 0.0% |
| Philippines | 35 | 0.2% |
| Romania | 9 | 0.0% |
| Sierra Leone | 12 | 0.1% |
| Somalia | 24 | 0.1% |
| South America | 46 | 0.2% |
| South Central Asia | 23 | 0.1% |
| South Eastern Asia | 125 | 0.6% |
| Thailand | 22 | 0.1% |
| Vietnam | 13 | 0.1% |
| Western Africa | 66 | 0.3% |
| Western Europe | 13 | 0.1% | View All 42 Rows |
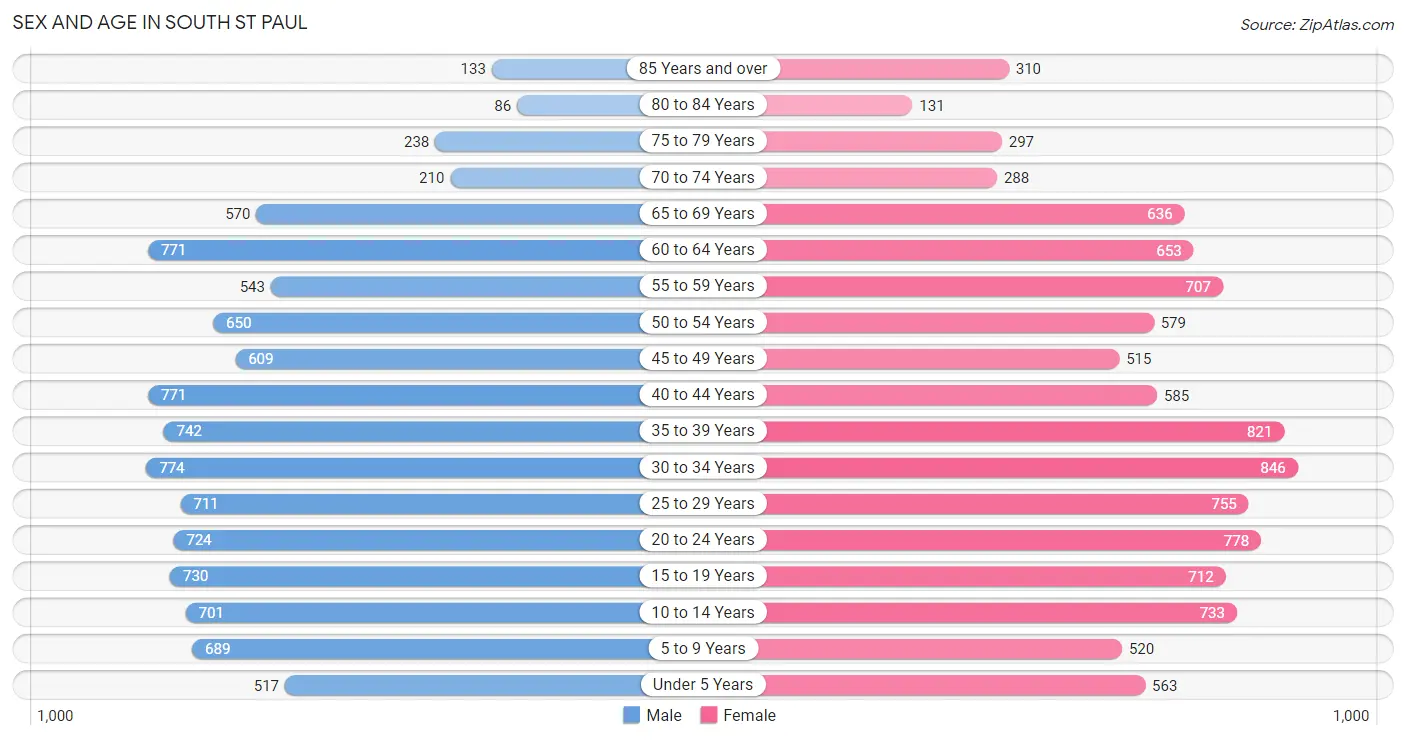
Sex and Age in South St Paul
Sex and Age in South St Paul
The most populous age groups in South St Paul are 30 to 34 Years (774 | 7.6%) for men and 30 to 34 Years (846 | 8.1%) for women.
| Age Bracket | Male | Female |
| Under 5 Years | 517 (5.1%) | 563 (5.4%) |
| 5 to 9 Years | 689 (6.8%) | 520 (5.0%) |
| 10 to 14 Years | 701 (6.9%) | 733 (7.0%) |
| 15 to 19 Years | 730 (7.2%) | 712 (6.8%) |
| 20 to 24 Years | 724 (7.1%) | 778 (7.5%) |
| 25 to 29 Years | 711 (7.0%) | 755 (7.2%) |
| 30 to 34 Years | 774 (7.6%) | 846 (8.1%) |
| 35 to 39 Years | 742 (7.3%) | 821 (7.9%) |
| 40 to 44 Years | 771 (7.6%) | 585 (5.6%) |
| 45 to 49 Years | 609 (6.0%) | 515 (4.9%) |
| 50 to 54 Years | 650 (6.4%) | 579 (5.6%) |
| 55 to 59 Years | 543 (5.3%) | 707 (6.8%) |
| 60 to 64 Years | 771 (7.6%) | 653 (6.3%) |
| 65 to 69 Years | 570 (5.6%) | 636 (6.1%) |
| 70 to 74 Years | 210 (2.1%) | 288 (2.8%) |
| 75 to 79 Years | 238 (2.3%) | 297 (2.9%) |
| 80 to 84 Years | 86 (0.9%) | 131 (1.3%) |
| 85 Years and over | 133 (1.3%) | 310 (3.0%) |
| Total | 10,169 (100.0%) | 10,429 (100.0%) |
Families and Households in South St Paul
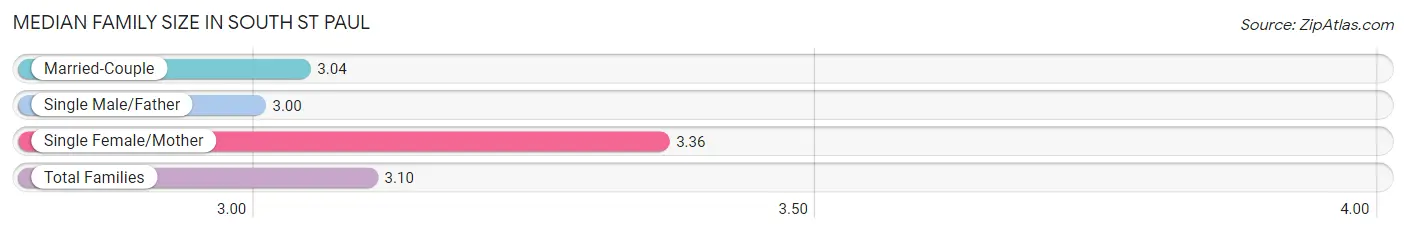
Median Family Size in South St Paul
The median family size in South St Paul is 3.10 persons per family, with single female/mother families (1,085 | 21.4%) accounting for the largest median family size of 3.36 persons per family. On the other hand, single male/father families (496 | 9.8%) represent the smallest median family size with 3.00 persons per family.
| Family Type | # Families | Family Size |
| Married-Couple | 3,497 (68.9%) | 3.04 |
| Single Male/Father | 496 (9.8%) | 3.00 |
| Single Female/Mother | 1,085 (21.4%) | 3.36 |
| Total Families | 5,078 (100.0%) | 3.10 |
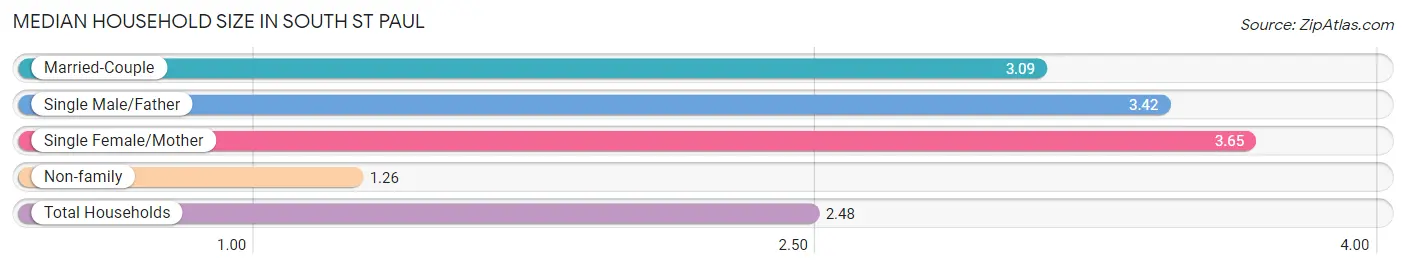
Median Household Size in South St Paul
The median household size in South St Paul is 2.48 persons per household, with single female/mother households (1,085 | 13.1%) accounting for the largest median household size of 3.65 persons per household. non-family households (3,185 | 38.6%) represent the smallest median household size with 1.26 persons per household.
| Household Type | # Households | Household Size |
| Married-Couple | 3,497 (42.3%) | 3.09 |
| Single Male/Father | 496 (6.0%) | 3.42 |
| Single Female/Mother | 1,085 (13.1%) | 3.65 |
| Non-family | 3,185 (38.6%) | 1.26 |
| Total Households | 8,263 (100.0%) | 2.48 |
Household Size by Marriage Status in South St Paul
Out of a total of 8,263 households in South St Paul, 5,078 (61.5%) are family households, while 3,185 (38.6%) are nonfamily households. The most numerous type of family households are 2-person households, comprising 2,215, and the most common type of nonfamily households are 1-person households, comprising 2,520.
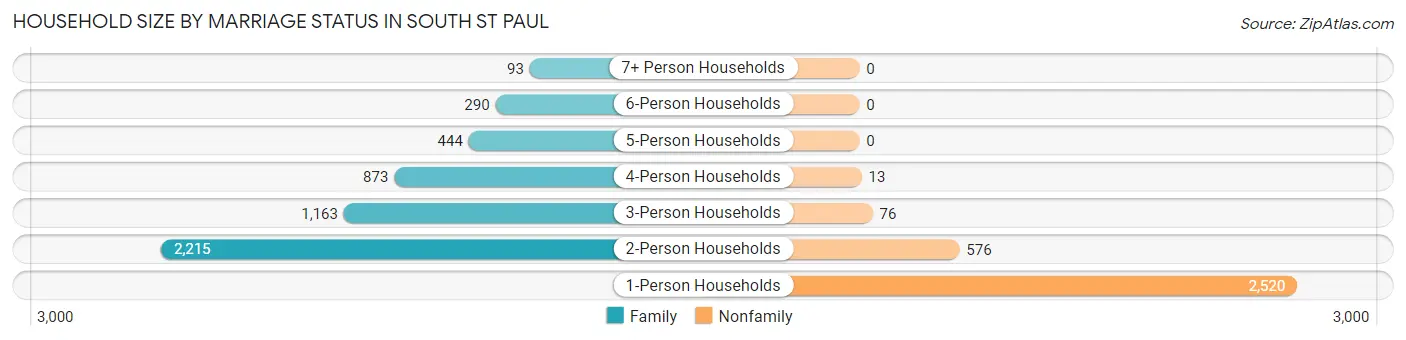
| Household Size | Family Households | Nonfamily Households |
| 1-Person Households | - | 2,520 (30.5%) |
| 2-Person Households | 2,215 (26.8%) | 576 (7.0%) |
| 3-Person Households | 1,163 (14.1%) | 76 (0.9%) |
| 4-Person Households | 873 (10.6%) | 13 (0.2%) |
| 5-Person Households | 444 (5.4%) | 0 (0.0%) |
| 6-Person Households | 290 (3.5%) | 0 (0.0%) |
| 7+ Person Households | 93 (1.1%) | 0 (0.0%) |
| Total | 5,078 (61.5%) | 3,185 (38.6%) |
Female Fertility in South St Paul
Fertility by Age in South St Paul
Average fertility rate in South St Paul is 51.0 births per 1,000 women. Women in the age bracket of 20 to 34 years have the highest fertility rate with 100.0 births per 1,000 women. Women in the age bracket of 20 to 34 years acount for 90.1% of all women with births.
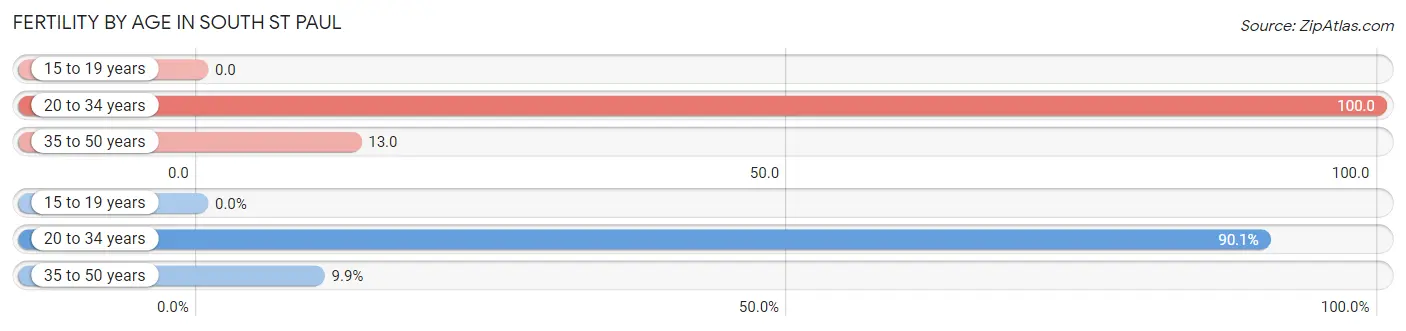
| Age Bracket | Women with Births | Births / 1,000 Women |
| 15 to 19 years | 0 (0.0%) | 0.0 |
| 20 to 34 years | 237 (90.1%) | 100.0 |
| 35 to 50 years | 26 (9.9%) | 13.0 |
| Total | 263 (100.0%) | 51.0 |
Fertility by Age by Marriage Status in South St Paul
57.8% of women with births (263) in South St Paul are married. The highest percentage of unmarried women with births falls into 35 to 50 years age bracket with 53.8% of them unmarried at the time of birth, while the lowest percentage of unmarried women with births belong to 20 to 34 years age bracket with 40.9% of them unmarried.
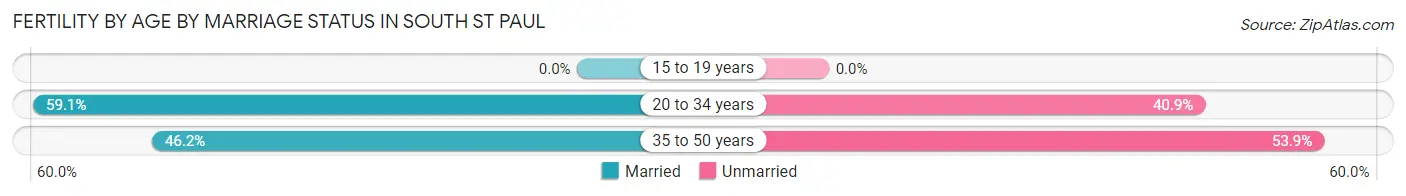
| Age Bracket | Married | Unmarried |
| 15 to 19 years | 0 (0.0%) | 0 (0.0%) |
| 20 to 34 years | 140 (59.1%) | 97 (40.9%) |
| 35 to 50 years | 12 (46.2%) | 14 (53.8%) |
| Total | 152 (57.8%) | 111 (42.2%) |
Fertility by Education in South St Paul
Average fertility rate in South St Paul is 51.0 births per 1,000 women. Women with the education attainment of graduate degree have the highest fertility rate of 101.0 births per 1,000 women, while women with the education attainment of less than high school have the lowest fertility at 17.0 births per 1,000 women. Women with the education attainment of bachelor's degree represent 41.1% of all women with births.
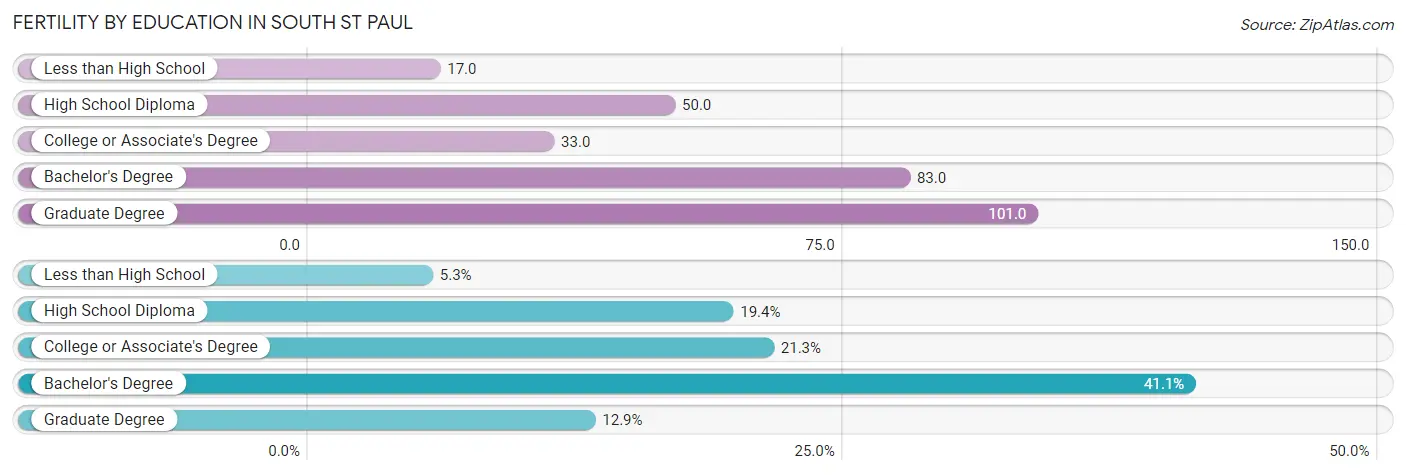
| Educational Attainment | Women with Births | Births / 1,000 Women |
| Less than High School | 14 (5.3%) | 17.0 |
| High School Diploma | 51 (19.4%) | 50.0 |
| College or Associate's Degree | 56 (21.3%) | 33.0 |
| Bachelor's Degree | 108 (41.1%) | 83.0 |
| Graduate Degree | 34 (12.9%) | 101.0 |
| Total | 263 (100.0%) | 51.0 |
Fertility by Education by Marriage Status in South St Paul
42.2% of women with births in South St Paul are unmarried. Women with the educational attainment of graduate degree are most likely to be married with 100.0% of them married at childbirth, while women with the educational attainment of less than high school are least likely to be married with 100.0% of them unmarried at childbirth.
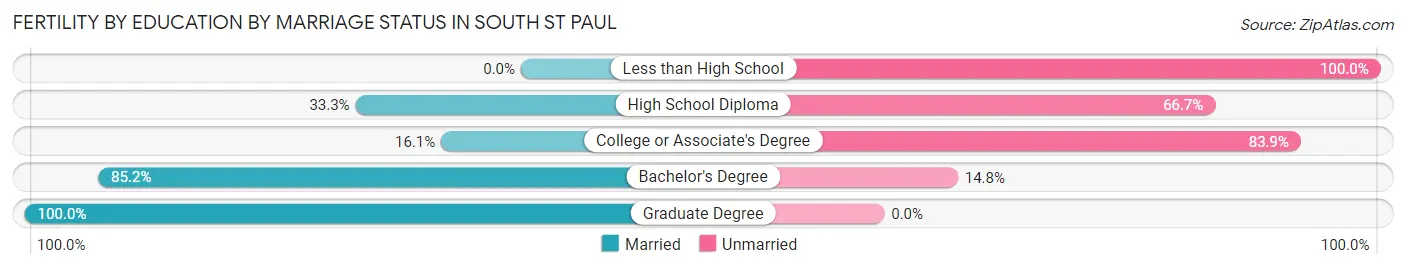
| Educational Attainment | Married | Unmarried |
| Less than High School | 0 (0.0%) | 14 (100.0%) |
| High School Diploma | 17 (33.3%) | 34 (66.7%) |
| College or Associate's Degree | 9 (16.1%) | 47 (83.9%) |
| Bachelor's Degree | 92 (85.2%) | 16 (14.8%) |
| Graduate Degree | 34 (100.0%) | 0 (0.0%) |
| Total | 152 (57.8%) | 111 (42.2%) |
Employment Characteristics in South St Paul
Employment by Class of Employer in South St Paul
Among the 11,182 employed individuals in South St Paul, private company employees (7,850 | 70.2%), not-for-profit organizations (1,193 | 10.7%), and local government employees (733 | 6.6%) make up the most common classes of employment.
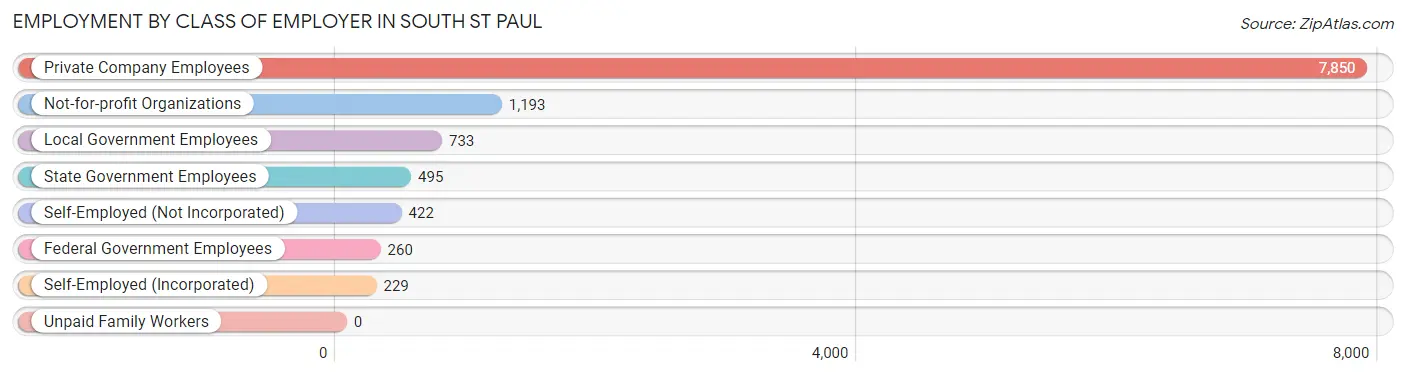
| Employer Class | # Employees | % Employees |
| Private Company Employees | 7,850 | 70.2% |
| Self-Employed (Incorporated) | 229 | 2.1% |
| Self-Employed (Not Incorporated) | 422 | 3.8% |
| Not-for-profit Organizations | 1,193 | 10.7% |
| Local Government Employees | 733 | 6.6% |
| State Government Employees | 495 | 4.4% |
| Federal Government Employees | 260 | 2.3% |
| Unpaid Family Workers | 0 | 0.0% |
| Total | 11,182 | 100.0% |
Employment Status by Age in South St Paul
According to the labor force statistics for South St Paul, out of the total population over 16 years of age (16,545), 73.1% or 12,094 individuals are in the labor force, with 5.7% or 689 of them unemployed. The age group with the highest labor force participation rate is 25 to 29 years, with 94.1% or 1,380 individuals in the labor force. Within the labor force, the 16 to 19 years age range has the highest percentage of unemployed individuals, with 11.5% or 86 of them being unemployed.
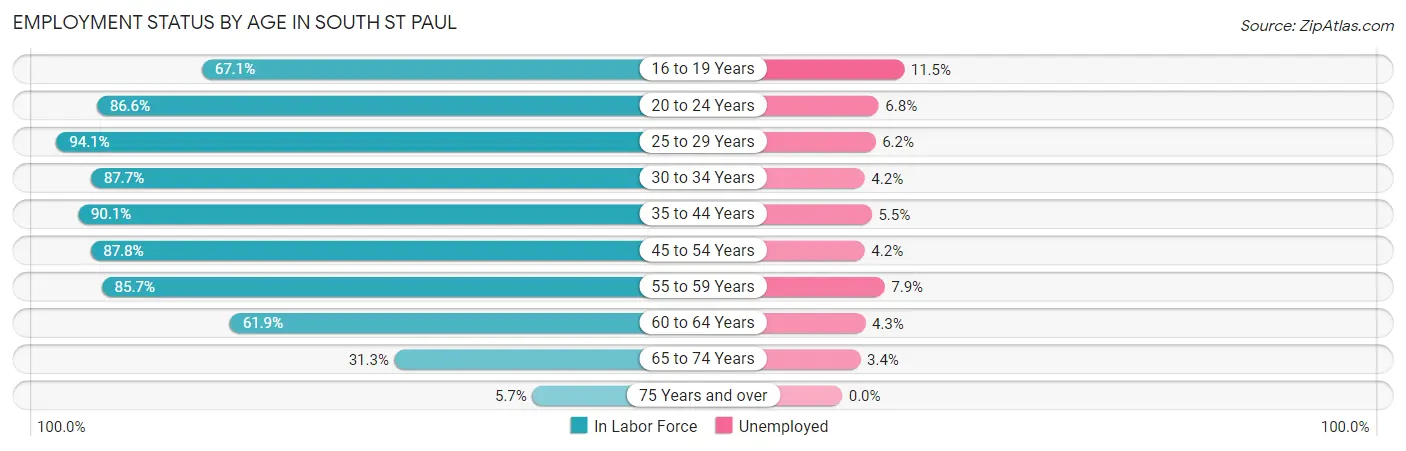
| Age Bracket | In Labor Force | Unemployed |
| 16 to 19 Years | 746 (67.1%) | 86 (11.5%) |
| 20 to 24 Years | 1,301 (86.6%) | 88 (6.8%) |
| 25 to 29 Years | 1,380 (94.1%) | 86 (6.2%) |
| 30 to 34 Years | 1,421 (87.7%) | 60 (4.2%) |
| 35 to 44 Years | 2,630 (90.1%) | 145 (5.5%) |
| 45 to 54 Years | 2,066 (87.8%) | 87 (4.2%) |
| 55 to 59 Years | 1,071 (85.7%) | 85 (7.9%) |
| 60 to 64 Years | 881 (61.9%) | 38 (4.3%) |
| 65 to 74 Years | 533 (31.3%) | 18 (3.4%) |
| 75 Years and over | 68 (5.7%) | 0 (0.0%) |
| Total | 12,094 (73.1%) | 689 (5.7%) |
Employment Status by Educational Attainment in South St Paul
According to labor force statistics for South St Paul, 85.6% of individuals (9,443) out of the total population between 25 and 64 years of age (11,032) are in the labor force, with 5.3% or 500 of them being unemployed. The group with the highest labor force participation rate are those with the educational attainment of bachelor's degree or higher, with 91.6% or 3,251 individuals in the labor force. Within the labor force, individuals with less than high school education have the highest percentage of unemployment, with 10.3% or 63 of them being unemployed.
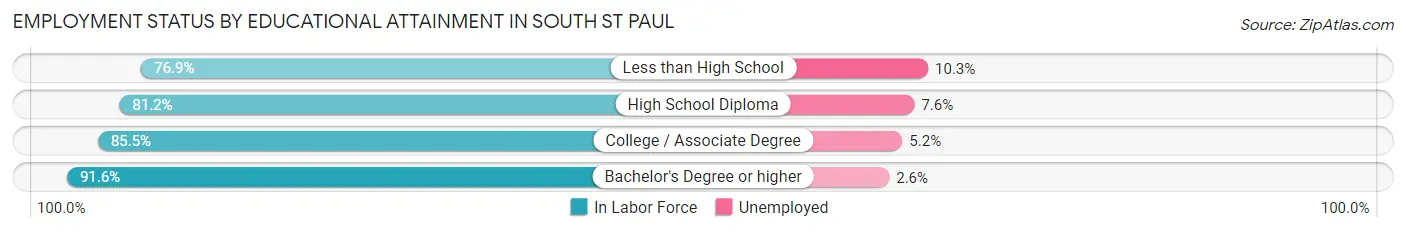
| Educational Attainment | In Labor Force | Unemployed |
| Less than High School | 611 (76.9%) | 82 (10.3%) |
| High School Diploma | 2,485 (81.2%) | 233 (7.6%) |
| College / Associate Degree | 3,102 (85.5%) | 189 (5.2%) |
| Bachelor's Degree or higher | 3,251 (91.6%) | 92 (2.6%) |
| Total | 9,443 (85.6%) | 585 (5.3%) |
Employment Occupations by Sex in South St Paul
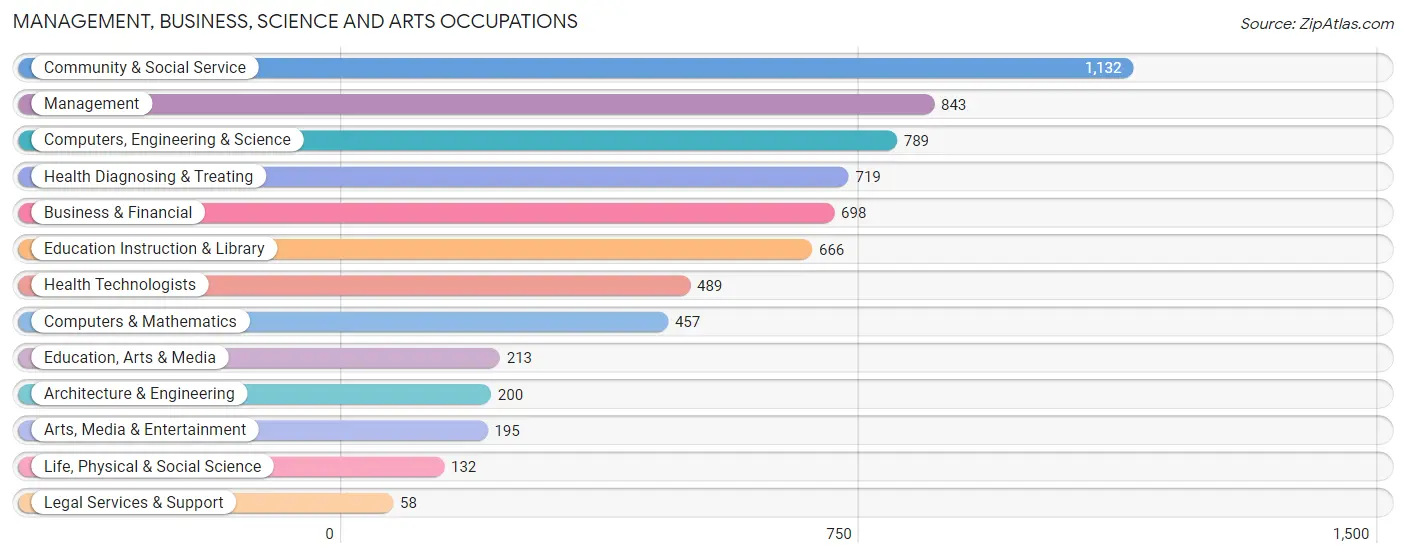
Management, Business, Science and Arts Occupations
The most common Management, Business, Science and Arts occupations in South St Paul are Community & Social Service (1,132 | 9.9%), Management (843 | 7.4%), Computers, Engineering & Science (789 | 6.9%), Health Diagnosing & Treating (719 | 6.3%), and Business & Financial (698 | 6.1%).
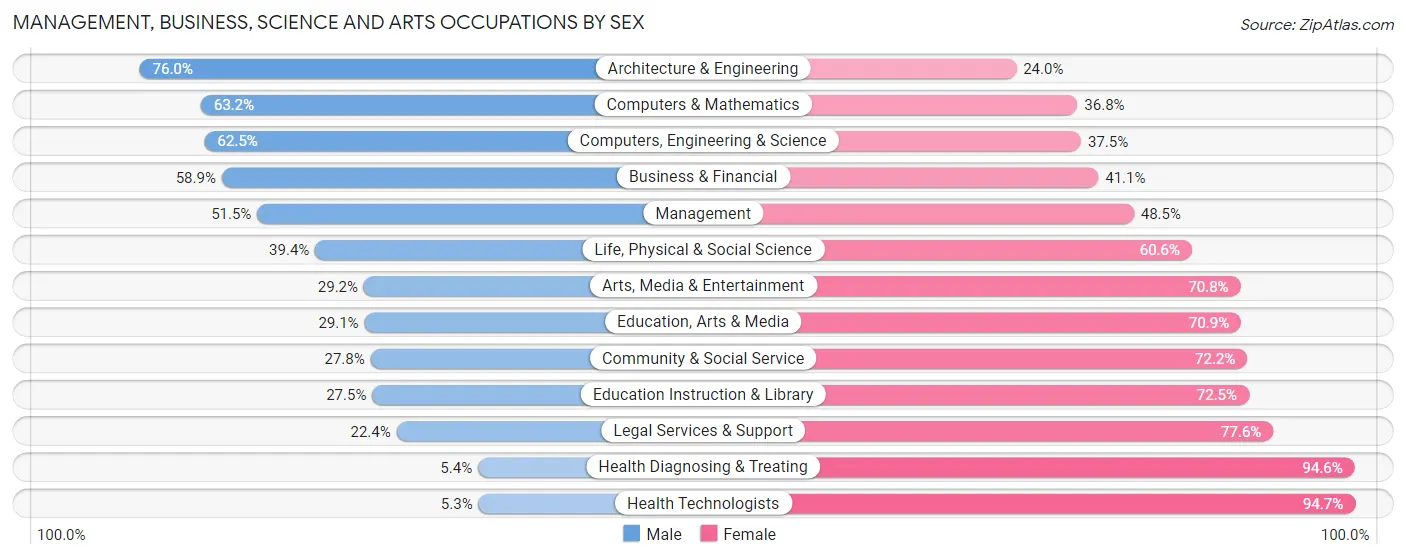
Management, Business, Science and Arts Occupations by Sex
Within the Management, Business, Science and Arts occupations in South St Paul, the most male-oriented occupations are Architecture & Engineering (76.0%), Computers & Mathematics (63.2%), and Computers, Engineering & Science (62.5%), while the most female-oriented occupations are Health Technologists (94.7%), Health Diagnosing & Treating (94.6%), and Legal Services & Support (77.6%).
| Occupation | Male | Female |
| Management | 434 (51.5%) | 409 (48.5%) |
| Business & Financial | 411 (58.9%) | 287 (41.1%) |
| Computers, Engineering & Science | 493 (62.5%) | 296 (37.5%) |
| Computers & Mathematics | 289 (63.2%) | 168 (36.8%) |
| Architecture & Engineering | 152 (76.0%) | 48 (24.0%) |
| Life, Physical & Social Science | 52 (39.4%) | 80 (60.6%) |
| Community & Social Service | 315 (27.8%) | 817 (72.2%) |
| Education, Arts & Media | 62 (29.1%) | 151 (70.9%) |
| Legal Services & Support | 13 (22.4%) | 45 (77.6%) |
| Education Instruction & Library | 183 (27.5%) | 483 (72.5%) |
| Arts, Media & Entertainment | 57 (29.2%) | 138 (70.8%) |
| Health Diagnosing & Treating | 39 (5.4%) | 680 (94.6%) |
| Health Technologists | 26 (5.3%) | 463 (94.7%) |
| Total (Category) | 1,692 (40.5%) | 2,489 (59.5%) |
| Total (Overall) | 5,743 (50.4%) | 5,645 (49.6%) |
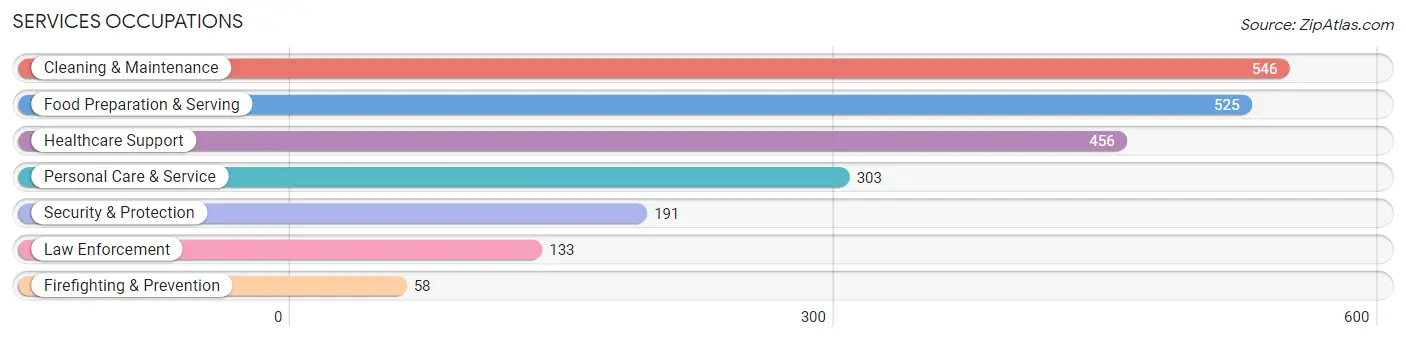
Services Occupations
The most common Services occupations in South St Paul are Cleaning & Maintenance (546 | 4.8%), Food Preparation & Serving (525 | 4.6%), Healthcare Support (456 | 4.0%), Personal Care & Service (303 | 2.7%), and Security & Protection (191 | 1.7%).
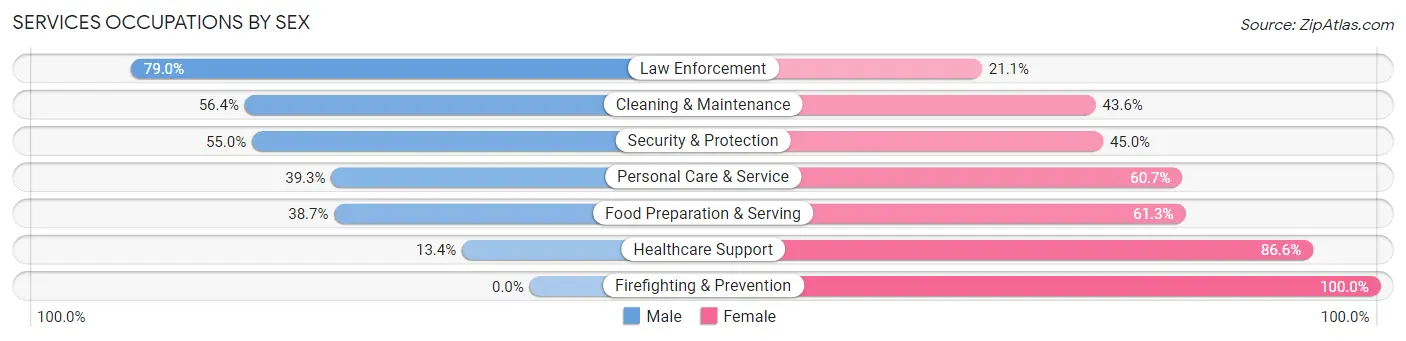
Services Occupations by Sex
Within the Services occupations in South St Paul, the most male-oriented occupations are Law Enforcement (78.9%), Cleaning & Maintenance (56.4%), and Security & Protection (55.0%), while the most female-oriented occupations are Firefighting & Prevention (100.0%), Healthcare Support (86.6%), and Food Preparation & Serving (61.3%).
| Occupation | Male | Female |
| Healthcare Support | 61 (13.4%) | 395 (86.6%) |
| Security & Protection | 105 (55.0%) | 86 (45.0%) |
| Firefighting & Prevention | 0 (0.0%) | 58 (100.0%) |
| Law Enforcement | 105 (78.9%) | 28 (21.0%) |
| Food Preparation & Serving | 203 (38.7%) | 322 (61.3%) |
| Cleaning & Maintenance | 308 (56.4%) | 238 (43.6%) |
| Personal Care & Service | 119 (39.3%) | 184 (60.7%) |
| Total (Category) | 796 (39.4%) | 1,225 (60.6%) |
| Total (Overall) | 5,743 (50.4%) | 5,645 (49.6%) |
Sales and Office Occupations
The most common Sales and Office occupations in South St Paul are Office & Administration (1,219 | 10.7%), and Sales & Related (1,048 | 9.2%).
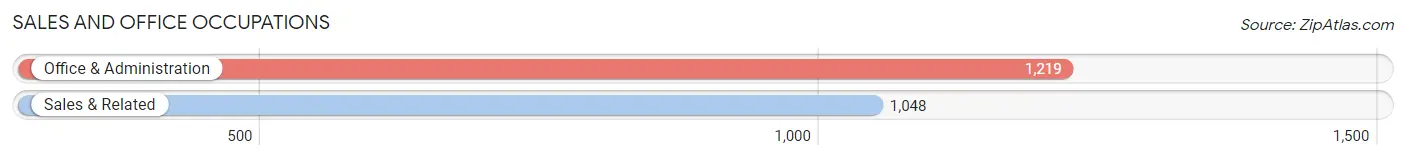
Sales and Office Occupations by Sex
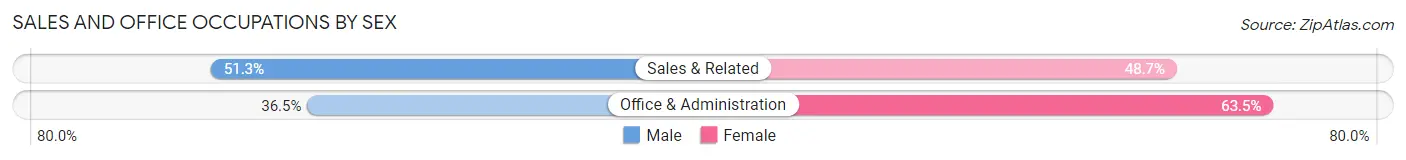
| Occupation | Male | Female |
| Sales & Related | 538 (51.3%) | 510 (48.7%) |
| Office & Administration | 445 (36.5%) | 774 (63.5%) |
| Total (Category) | 983 (43.4%) | 1,284 (56.6%) |
| Total (Overall) | 5,743 (50.4%) | 5,645 (49.6%) |
Natural Resources, Construction and Maintenance Occupations
The most common Natural Resources, Construction and Maintenance occupations in South St Paul are Construction & Extraction (472 | 4.1%), Installation, Maintenance & Repair (322 | 2.8%), and Farming, Fishing & Forestry (8 | 0.1%).
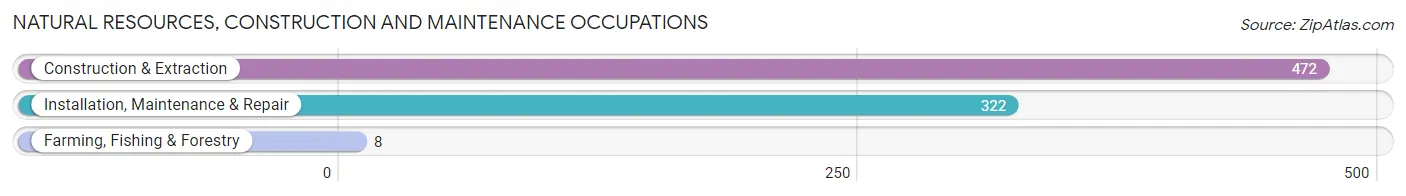
Natural Resources, Construction and Maintenance Occupations by Sex
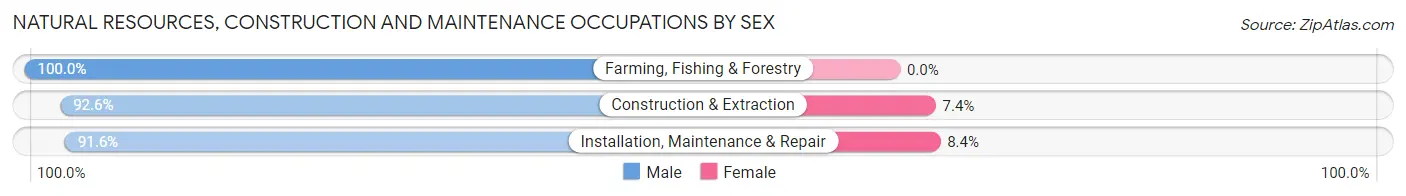
| Occupation | Male | Female |
| Farming, Fishing & Forestry | 8 (100.0%) | 0 (0.0%) |
| Construction & Extraction | 437 (92.6%) | 35 (7.4%) |
| Installation, Maintenance & Repair | 295 (91.6%) | 27 (8.4%) |
| Total (Category) | 740 (92.3%) | 62 (7.7%) |
| Total (Overall) | 5,743 (50.4%) | 5,645 (49.6%) |
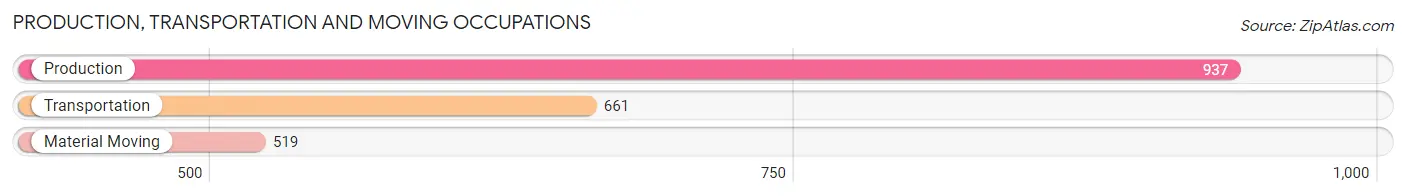
Production, Transportation and Moving Occupations
The most common Production, Transportation and Moving occupations in South St Paul are Production (937 | 8.2%), Transportation (661 | 5.8%), and Material Moving (519 | 4.6%).
Production, Transportation and Moving Occupations by Sex
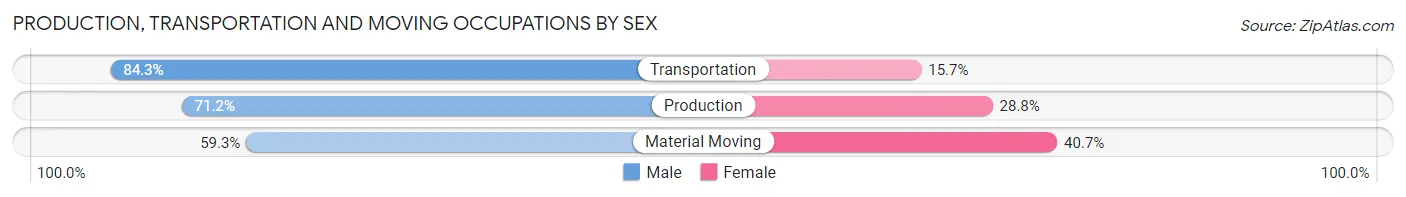
| Occupation | Male | Female |
| Production | 667 (71.2%) | 270 (28.8%) |
| Transportation | 557 (84.3%) | 104 (15.7%) |
| Material Moving | 308 (59.3%) | 211 (40.7%) |
| Total (Category) | 1,532 (72.4%) | 585 (27.6%) |
| Total (Overall) | 5,743 (50.4%) | 5,645 (49.6%) |
Employment Industries by Sex in South St Paul
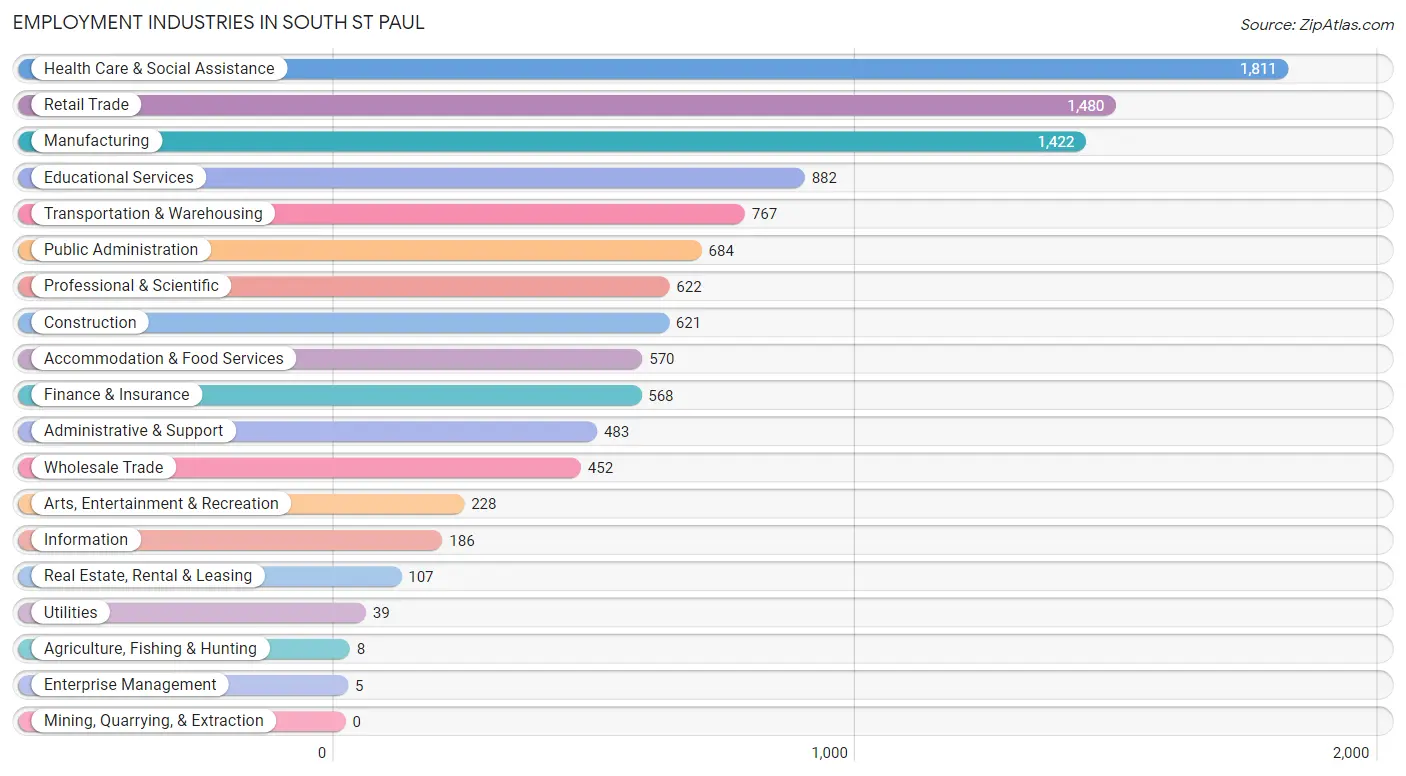
Employment Industries in South St Paul
The major employment industries in South St Paul include Health Care & Social Assistance (1,811 | 15.9%), Retail Trade (1,480 | 13.0%), Manufacturing (1,422 | 12.5%), Educational Services (882 | 7.7%), and Transportation & Warehousing (767 | 6.7%).
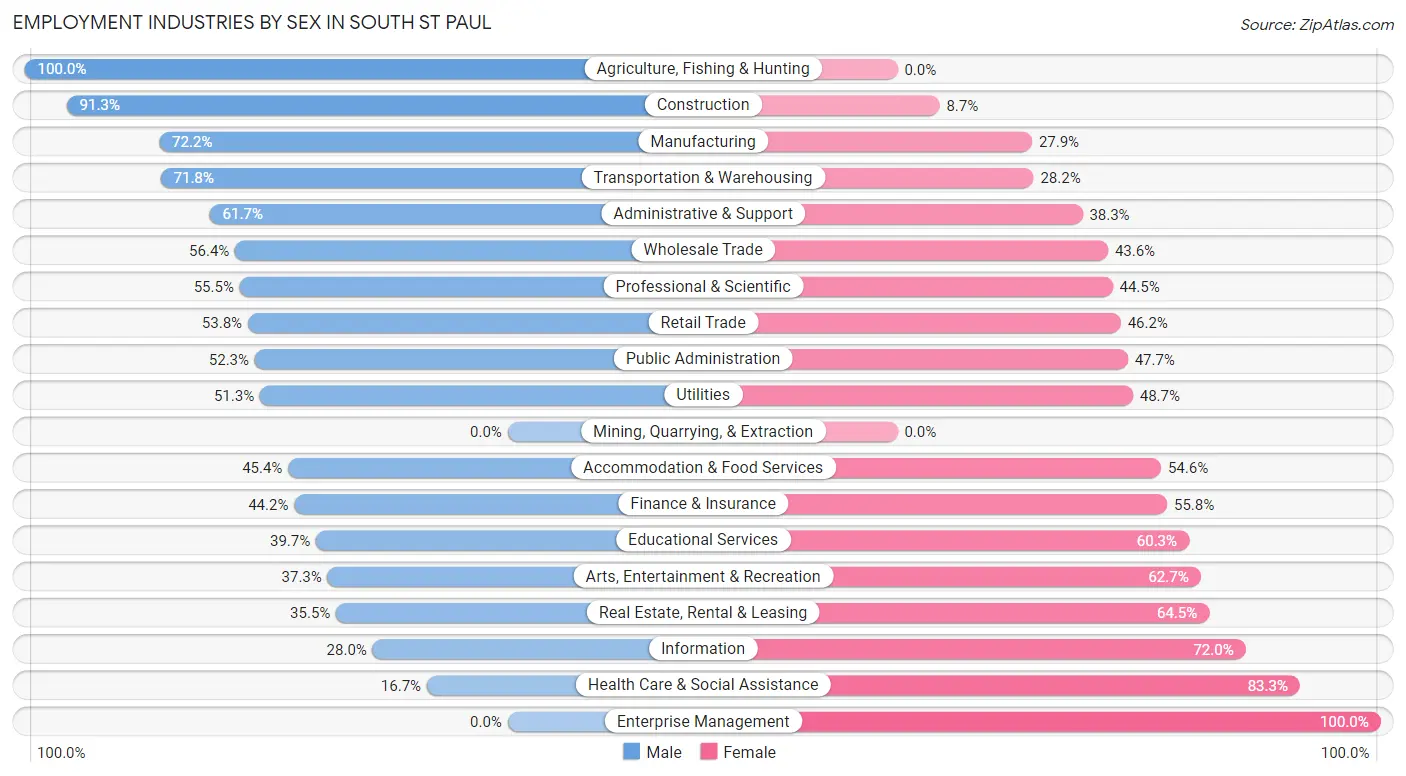
Employment Industries by Sex in South St Paul
The South St Paul industries that see more men than women are Agriculture, Fishing & Hunting (100.0%), Construction (91.3%), and Manufacturing (72.2%), whereas the industries that tend to have a higher number of women are Enterprise Management (100.0%), Health Care & Social Assistance (83.3%), and Information (72.0%).
| Industry | Male | Female |
| Agriculture, Fishing & Hunting | 8 (100.0%) | 0 (0.0%) |
| Mining, Quarrying, & Extraction | 0 (0.0%) | 0 (0.0%) |
| Construction | 567 (91.3%) | 54 (8.7%) |
| Manufacturing | 1,026 (72.2%) | 396 (27.9%) |
| Wholesale Trade | 255 (56.4%) | 197 (43.6%) |
| Retail Trade | 796 (53.8%) | 684 (46.2%) |
| Transportation & Warehousing | 551 (71.8%) | 216 (28.2%) |
| Utilities | 20 (51.3%) | 19 (48.7%) |
| Information | 52 (28.0%) | 134 (72.0%) |
| Finance & Insurance | 251 (44.2%) | 317 (55.8%) |
| Real Estate, Rental & Leasing | 38 (35.5%) | 69 (64.5%) |
| Professional & Scientific | 345 (55.5%) | 277 (44.5%) |
| Enterprise Management | 0 (0.0%) | 5 (100.0%) |
| Administrative & Support | 298 (61.7%) | 185 (38.3%) |
| Educational Services | 350 (39.7%) | 532 (60.3%) |
| Health Care & Social Assistance | 303 (16.7%) | 1,508 (83.3%) |
| Arts, Entertainment & Recreation | 85 (37.3%) | 143 (62.7%) |
| Accommodation & Food Services | 259 (45.4%) | 311 (54.6%) |
| Public Administration | 358 (52.3%) | 326 (47.7%) |
| Total | 5,743 (50.4%) | 5,645 (49.6%) |
Education in South St Paul
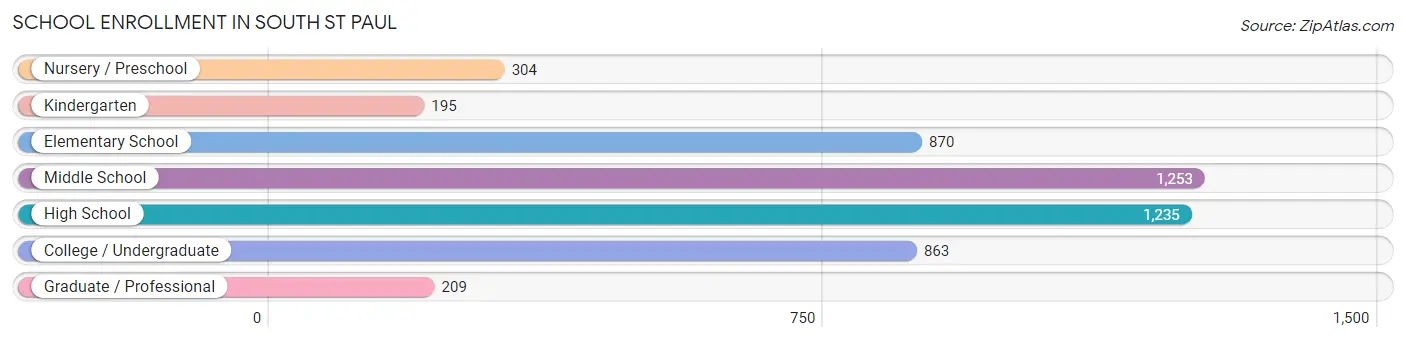
School Enrollment in South St Paul
The most common levels of schooling among the 4,929 students in South St Paul are middle school (1,253 | 25.4%), high school (1,235 | 25.1%), and elementary school (870 | 17.6%).
| School Level | # Students | % Students |
| Nursery / Preschool | 304 | 6.2% |
| Kindergarten | 195 | 4.0% |
| Elementary School | 870 | 17.6% |
| Middle School | 1,253 | 25.4% |
| High School | 1,235 | 25.1% |
| College / Undergraduate | 863 | 17.5% |
| Graduate / Professional | 209 | 4.2% |
| Total | 4,929 | 100.0% |
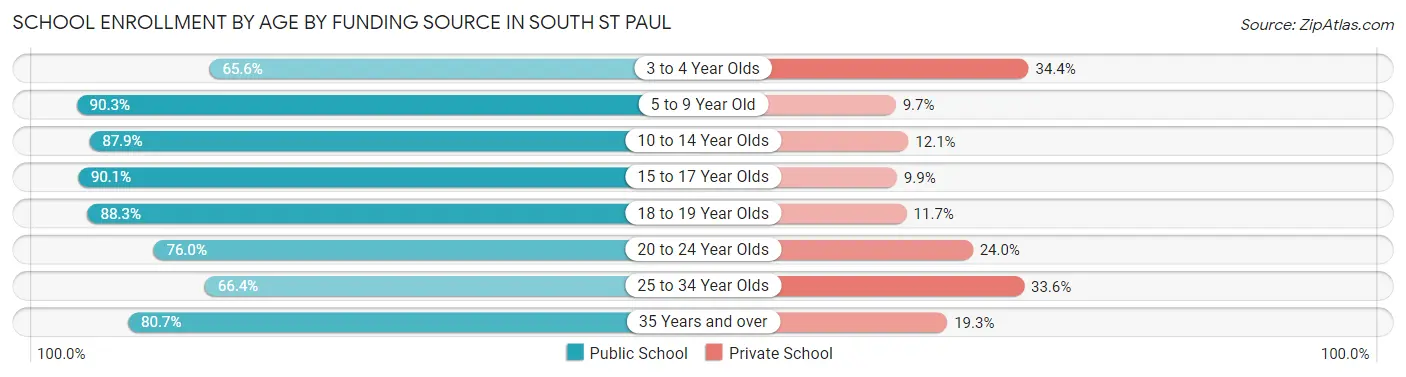
School Enrollment by Age by Funding Source in South St Paul
Out of a total of 4,929 students who are enrolled in schools in South St Paul, 705 (14.3%) attend a private institution, while the remaining 4,224 (85.7%) are enrolled in public schools. The age group of 3 to 4 year olds has the highest likelihood of being enrolled in private schools, with 52 (34.4% in the age bracket) enrolled. Conversely, the age group of 5 to 9 year old has the lowest likelihood of being enrolled in a private school, with 1,052 (90.3% in the age bracket) attending a public institution.
| Age Bracket | Public School | Private School |
| 3 to 4 Year Olds | 99 (65.6%) | 52 (34.4%) |
| 5 to 9 Year Old | 1,052 (90.3%) | 113 (9.7%) |
| 10 to 14 Year Olds | 1,261 (87.9%) | 173 (12.1%) |
| 15 to 17 Year Olds | 826 (90.1%) | 91 (9.9%) |
| 18 to 19 Year Olds | 301 (88.3%) | 40 (11.7%) |
| 20 to 24 Year Olds | 351 (76.0%) | 111 (24.0%) |
| 25 to 34 Year Olds | 174 (66.4%) | 88 (33.6%) |
| 35 Years and over | 159 (80.7%) | 38 (19.3%) |
| Total | 4,224 (85.7%) | 705 (14.3%) |
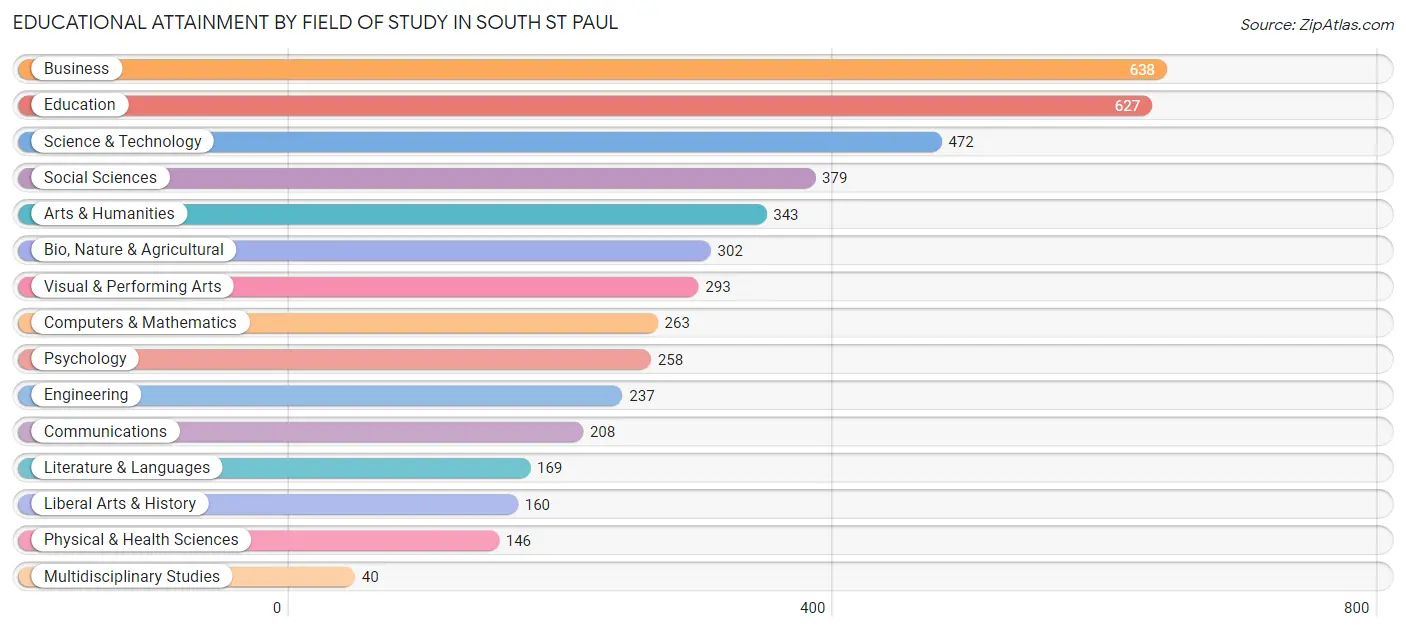
Educational Attainment by Field of Study in South St Paul
Business (638 | 14.1%), education (627 | 13.8%), science & technology (472 | 10.4%), social sciences (379 | 8.4%), and arts & humanities (343 | 7.6%) are the most common fields of study among 4,535 individuals in South St Paul who have obtained a bachelor's degree or higher.
| Field of Study | # Graduates | % Graduates |
| Computers & Mathematics | 263 | 5.8% |
| Bio, Nature & Agricultural | 302 | 6.7% |
| Physical & Health Sciences | 146 | 3.2% |
| Psychology | 258 | 5.7% |
| Social Sciences | 379 | 8.4% |
| Engineering | 237 | 5.2% |
| Multidisciplinary Studies | 40 | 0.9% |
| Science & Technology | 472 | 10.4% |
| Business | 638 | 14.1% |
| Education | 627 | 13.8% |
| Literature & Languages | 169 | 3.7% |
| Liberal Arts & History | 160 | 3.5% |
| Visual & Performing Arts | 293 | 6.5% |
| Communications | 208 | 4.6% |
| Arts & Humanities | 343 | 7.6% |
| Total | 4,535 | 100.0% |
Transportation & Commute in South St Paul
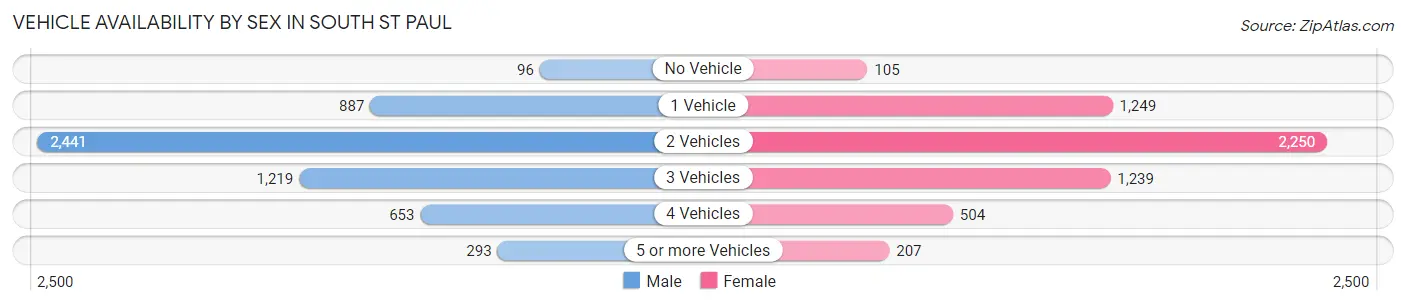
Vehicle Availability by Sex in South St Paul
The most prevalent vehicle ownership categories in South St Paul are males with 2 vehicles (2,441, accounting for 43.7%) and females with 2 vehicles (2,250, making up 44.0%).
| Vehicles Available | Male | Female |
| No Vehicle | 96 (1.7%) | 105 (1.9%) |
| 1 Vehicle | 887 (15.9%) | 1,249 (22.5%) |
| 2 Vehicles | 2,441 (43.7%) | 2,250 (40.5%) |
| 3 Vehicles | 1,219 (21.8%) | 1,239 (22.3%) |
| 4 Vehicles | 653 (11.7%) | 504 (9.1%) |
| 5 or more Vehicles | 293 (5.2%) | 207 (3.7%) |
| Total | 5,589 (100.0%) | 5,554 (100.0%) |
Commute Time in South St Paul
The most frequently occuring commute durations in South St Paul are 20 to 24 minutes (1,923 commuters, 19.1%), 15 to 19 minutes (1,876 commuters, 18.6%), and 10 to 14 minutes (1,542 commuters, 15.3%).
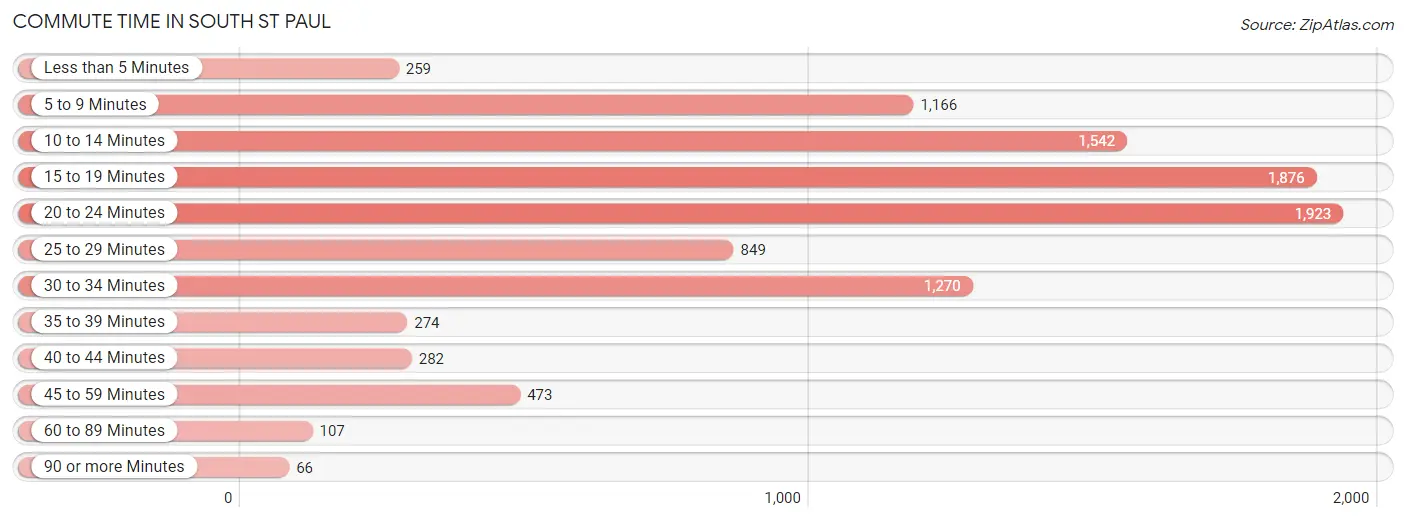
| Commute Time | # Commuters | % Commuters |
| Less than 5 Minutes | 259 | 2.6% |
| 5 to 9 Minutes | 1,166 | 11.6% |
| 10 to 14 Minutes | 1,542 | 15.3% |
| 15 to 19 Minutes | 1,876 | 18.6% |
| 20 to 24 Minutes | 1,923 | 19.1% |
| 25 to 29 Minutes | 849 | 8.4% |
| 30 to 34 Minutes | 1,270 | 12.6% |
| 35 to 39 Minutes | 274 | 2.7% |
| 40 to 44 Minutes | 282 | 2.8% |
| 45 to 59 Minutes | 473 | 4.7% |
| 60 to 89 Minutes | 107 | 1.1% |
| 90 or more Minutes | 66 | 0.6% |
Commute Time by Sex in South St Paul
The most common commute times in South St Paul are 15 to 19 minutes (893 commuters, 17.6%) for males and 20 to 24 minutes (1,086 commuters, 21.7%) for females.
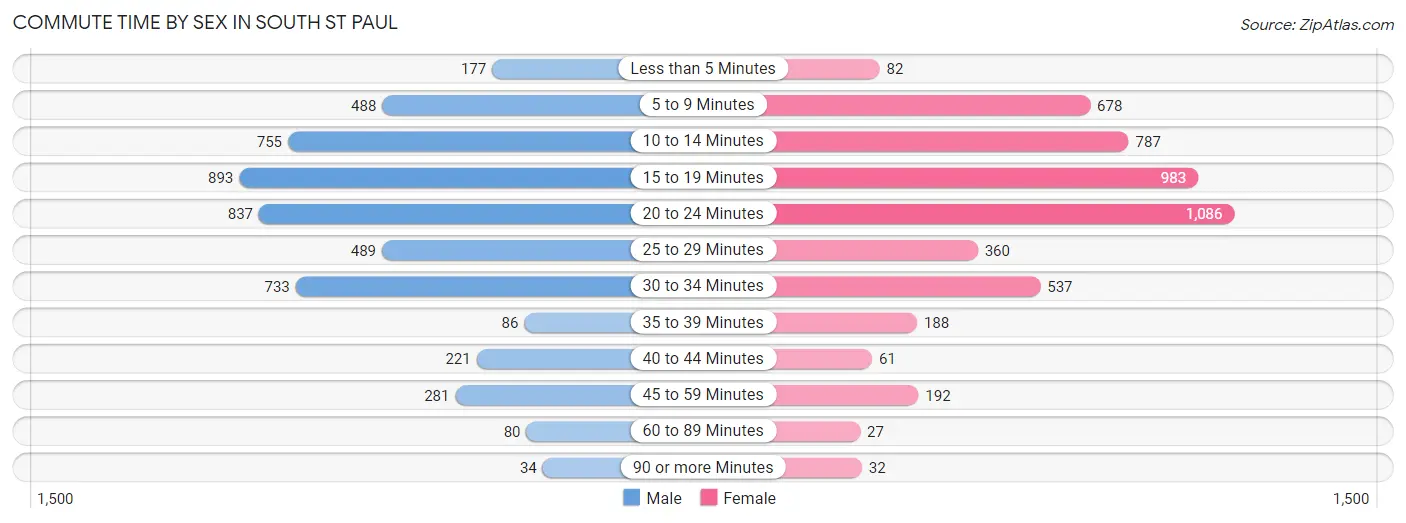
| Commute Time | Male | Female |
| Less than 5 Minutes | 177 (3.5%) | 82 (1.6%) |
| 5 to 9 Minutes | 488 (9.6%) | 678 (13.5%) |
| 10 to 14 Minutes | 755 (14.9%) | 787 (15.7%) |
| 15 to 19 Minutes | 893 (17.6%) | 983 (19.6%) |
| 20 to 24 Minutes | 837 (16.5%) | 1,086 (21.7%) |
| 25 to 29 Minutes | 489 (9.6%) | 360 (7.2%) |
| 30 to 34 Minutes | 733 (14.4%) | 537 (10.7%) |
| 35 to 39 Minutes | 86 (1.7%) | 188 (3.7%) |
| 40 to 44 Minutes | 221 (4.4%) | 61 (1.2%) |
| 45 to 59 Minutes | 281 (5.5%) | 192 (3.8%) |
| 60 to 89 Minutes | 80 (1.6%) | 27 (0.5%) |
| 90 or more Minutes | 34 (0.7%) | 32 (0.6%) |
Time of Departure to Work by Sex in South St Paul
The most frequent times of departure to work in South St Paul are 6:00 AM to 6:29 AM (636, 12.5%) for males and 7:00 AM to 7:29 AM (853, 17.0%) for females.
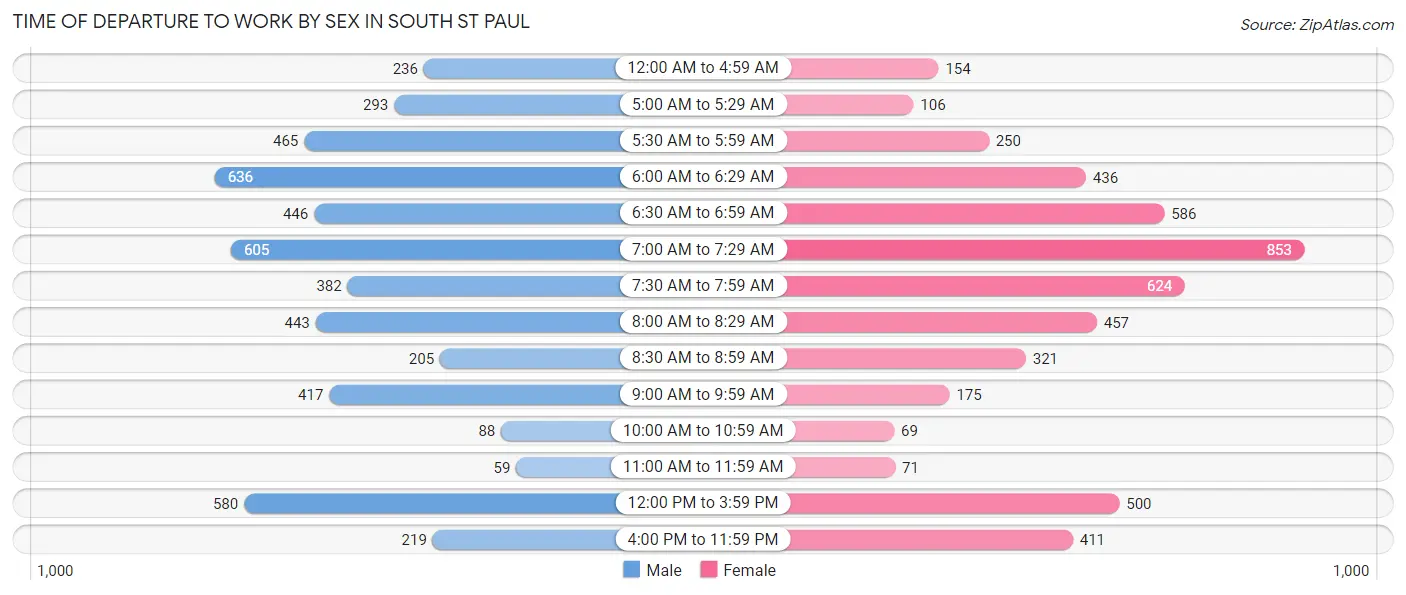
| Time of Departure | Male | Female |
| 12:00 AM to 4:59 AM | 236 (4.6%) | 154 (3.1%) |
| 5:00 AM to 5:29 AM | 293 (5.8%) | 106 (2.1%) |
| 5:30 AM to 5:59 AM | 465 (9.2%) | 250 (5.0%) |
| 6:00 AM to 6:29 AM | 636 (12.5%) | 436 (8.7%) |
| 6:30 AM to 6:59 AM | 446 (8.8%) | 586 (11.7%) |
| 7:00 AM to 7:29 AM | 605 (11.9%) | 853 (17.0%) |
| 7:30 AM to 7:59 AM | 382 (7.5%) | 624 (12.4%) |
| 8:00 AM to 8:29 AM | 443 (8.7%) | 457 (9.1%) |
| 8:30 AM to 8:59 AM | 205 (4.0%) | 321 (6.4%) |
| 9:00 AM to 9:59 AM | 417 (8.2%) | 175 (3.5%) |
| 10:00 AM to 10:59 AM | 88 (1.7%) | 69 (1.4%) |
| 11:00 AM to 11:59 AM | 59 (1.2%) | 71 (1.4%) |
| 12:00 PM to 3:59 PM | 580 (11.4%) | 500 (10.0%) |
| 4:00 PM to 11:59 PM | 219 (4.3%) | 411 (8.2%) |
| Total | 5,074 (100.0%) | 5,013 (100.0%) |
Housing Occupancy in South St Paul
Occupancy by Ownership in South St Paul
Of the total 8,263 dwellings in South St Paul, owner-occupied units account for 5,877 (71.1%), while renter-occupied units make up 2,386 (28.9%).
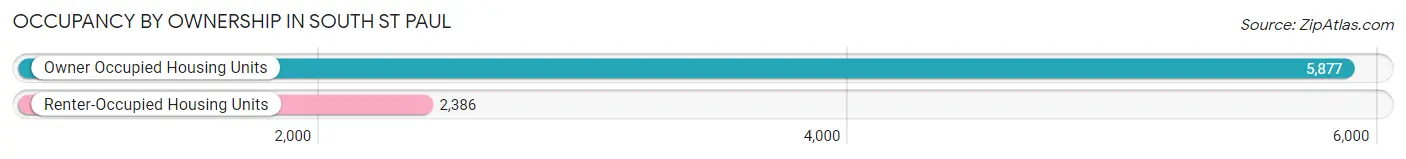
| Occupancy | # Housing Units | % Housing Units |
| Owner Occupied Housing Units | 5,877 | 71.1% |
| Renter-Occupied Housing Units | 2,386 | 28.9% |
| Total Occupied Housing Units | 8,263 | 100.0% |
Occupancy by Household Size in South St Paul
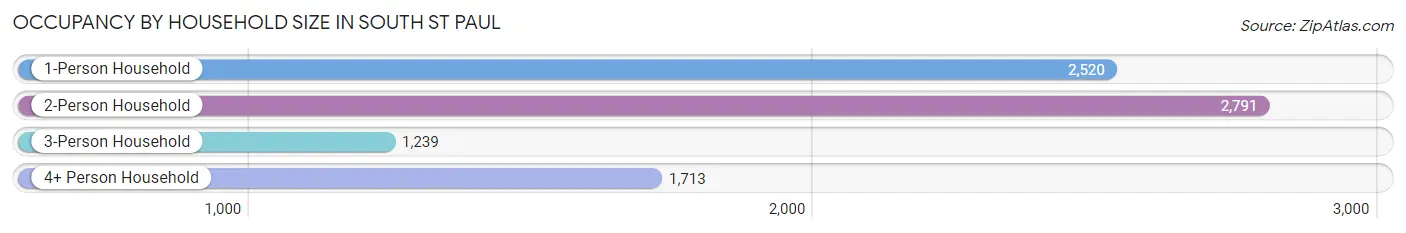
| Household Size | # Housing Units | % Housing Units |
| 1-Person Household | 2,520 | 30.5% |
| 2-Person Household | 2,791 | 33.8% |
| 3-Person Household | 1,239 | 15.0% |
| 4+ Person Household | 1,713 | 20.7% |
| Total Housing Units | 8,263 | 100.0% |
Occupancy by Ownership by Household Size in South St Paul
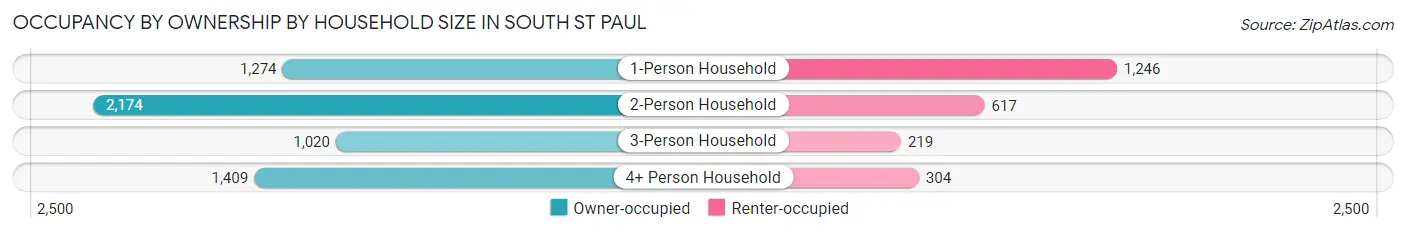
| Household Size | Owner-occupied | Renter-occupied |
| 1-Person Household | 1,274 (50.6%) | 1,246 (49.4%) |
| 2-Person Household | 2,174 (77.9%) | 617 (22.1%) |
| 3-Person Household | 1,020 (82.3%) | 219 (17.7%) |
| 4+ Person Household | 1,409 (82.3%) | 304 (17.7%) |
| Total Housing Units | 5,877 (71.1%) | 2,386 (28.9%) |
Occupancy by Educational Attainment in South St Paul
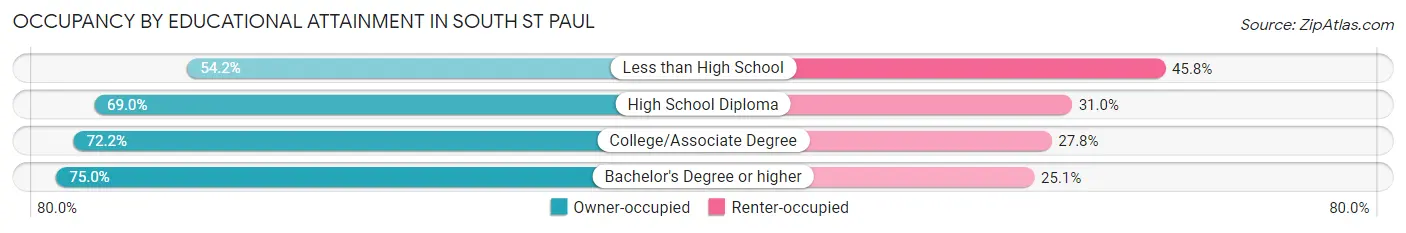
| Household Size | Owner-occupied | Renter-occupied |
| Less than High School | 273 (54.2%) | 231 (45.8%) |
| High School Diploma | 1,581 (69.0%) | 711 (31.0%) |
| College/Associate Degree | 1,970 (72.2%) | 758 (27.8%) |
| Bachelor's Degree or higher | 2,053 (75.0%) | 686 (25.1%) |
Occupancy by Age of Householder in South St Paul
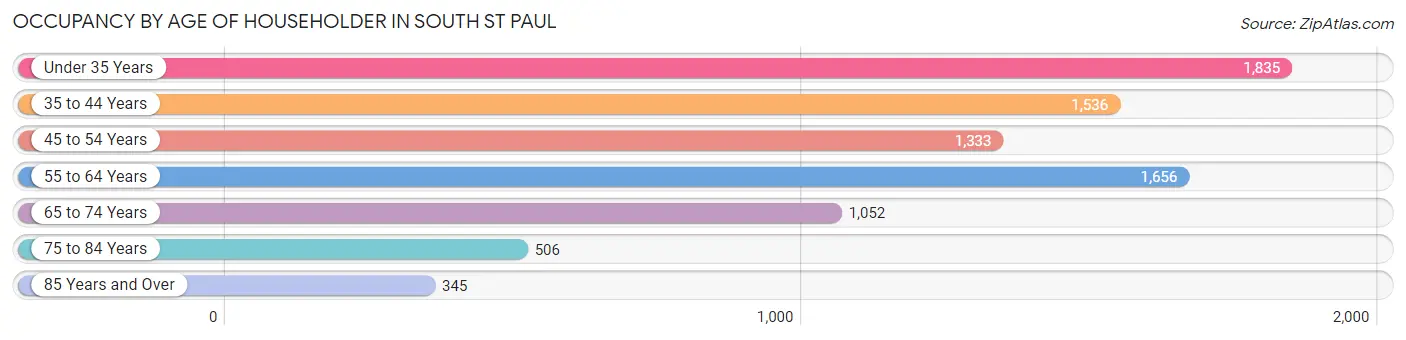
| Age Bracket | # Households | % Households |
| Under 35 Years | 1,835 | 22.2% |
| 35 to 44 Years | 1,536 | 18.6% |
| 45 to 54 Years | 1,333 | 16.1% |
| 55 to 64 Years | 1,656 | 20.0% |
| 65 to 74 Years | 1,052 | 12.7% |
| 75 to 84 Years | 506 | 6.1% |
| 85 Years and Over | 345 | 4.2% |
| Total | 8,263 | 100.0% |
Housing Finances in South St Paul
Median Income by Occupancy in South St Paul
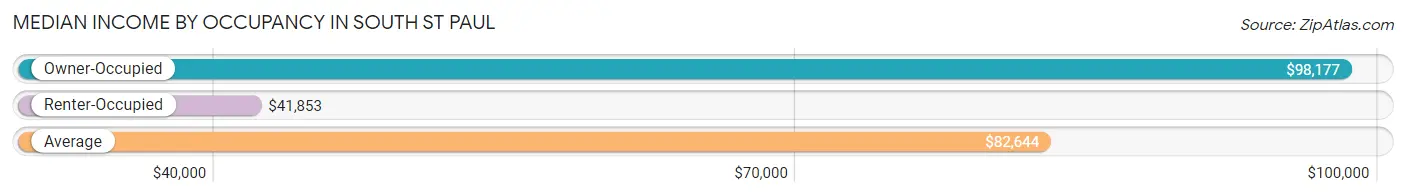
| Occupancy Type | # Households | Median Income |
| Owner-Occupied | 5,877 (71.1%) | $98,177 |
| Renter-Occupied | 2,386 (28.9%) | $41,853 |
| Average | 8,263 (100.0%) | $82,644 |
Occupancy by Householder Income Bracket in South St Paul
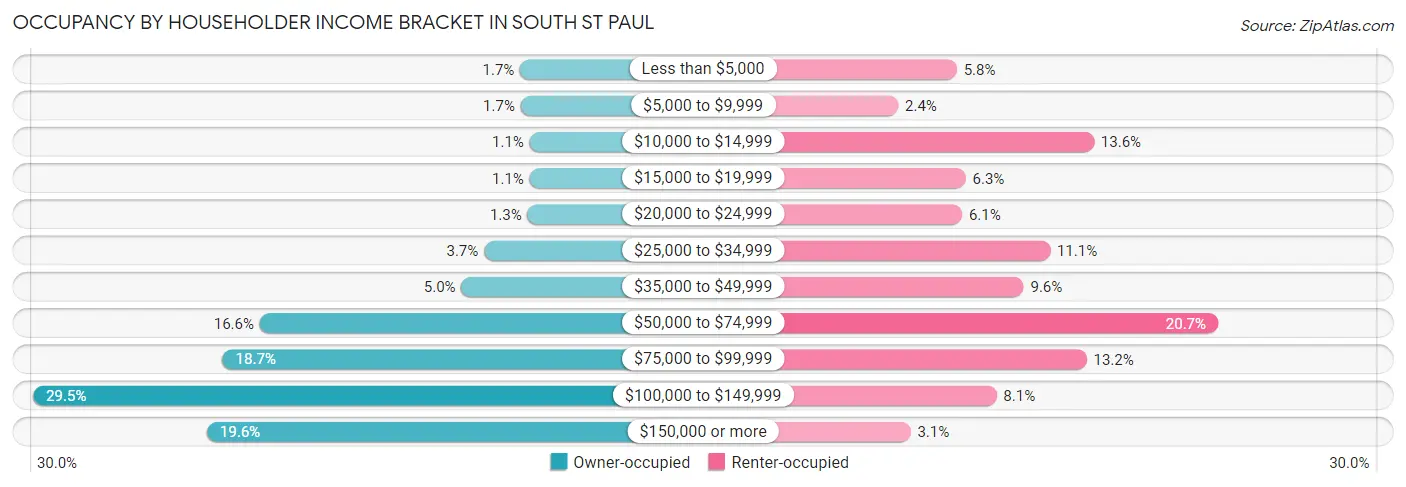
| Income Bracket | Owner-occupied | Renter-occupied |
| Less than $5,000 | 99 (1.7%) | 138 (5.8%) |
| $5,000 to $9,999 | 97 (1.7%) | 58 (2.4%) |
| $10,000 to $14,999 | 67 (1.1%) | 325 (13.6%) |
| $15,000 to $19,999 | 67 (1.1%) | 150 (6.3%) |
| $20,000 to $24,999 | 74 (1.3%) | 145 (6.1%) |
| $25,000 to $34,999 | 220 (3.7%) | 265 (11.1%) |
| $35,000 to $49,999 | 296 (5.0%) | 229 (9.6%) |
| $50,000 to $74,999 | 973 (16.6%) | 494 (20.7%) |
| $75,000 to $99,999 | 1,098 (18.7%) | 315 (13.2%) |
| $100,000 to $149,999 | 1,735 (29.5%) | 192 (8.1%) |
| $150,000 or more | 1,151 (19.6%) | 75 (3.1%) |
| Total | 5,877 (100.0%) | 2,386 (100.0%) |
Monthly Housing Cost Tiers in South St Paul
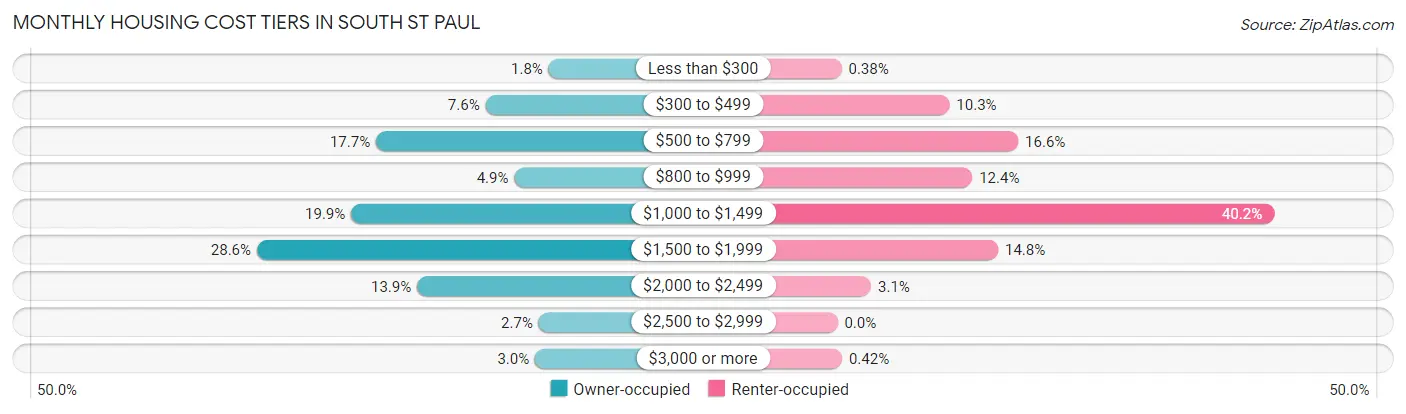
| Monthly Cost | Owner-occupied | Renter-occupied |
| Less than $300 | 103 (1.8%) | 9 (0.4%) |
| $300 to $499 | 445 (7.6%) | 246 (10.3%) |
| $500 to $799 | 1,037 (17.6%) | 397 (16.6%) |
| $800 to $999 | 289 (4.9%) | 296 (12.4%) |
| $1,000 to $1,499 | 1,172 (19.9%) | 959 (40.2%) |
| $1,500 to $1,999 | 1,682 (28.6%) | 353 (14.8%) |
| $2,000 to $2,499 | 815 (13.9%) | 74 (3.1%) |
| $2,500 to $2,999 | 157 (2.7%) | 0 (0.0%) |
| $3,000 or more | 177 (3.0%) | 10 (0.4%) |
| Total | 5,877 (100.0%) | 2,386 (100.0%) |
Physical Housing Characteristics in South St Paul
Housing Structures in South St Paul
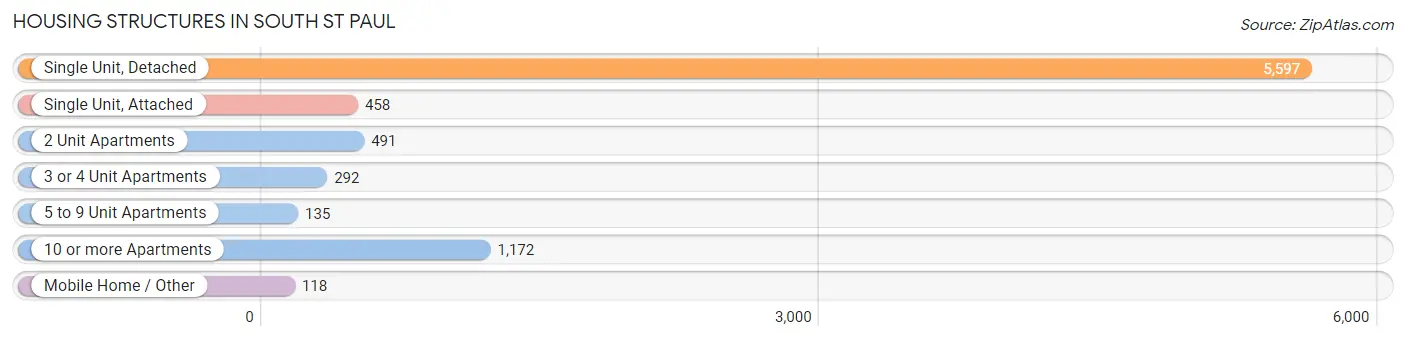
| Structure Type | # Housing Units | % Housing Units |
| Single Unit, Detached | 5,597 | 67.7% |
| Single Unit, Attached | 458 | 5.5% |
| 2 Unit Apartments | 491 | 5.9% |
| 3 or 4 Unit Apartments | 292 | 3.5% |
| 5 to 9 Unit Apartments | 135 | 1.6% |
| 10 or more Apartments | 1,172 | 14.2% |
| Mobile Home / Other | 118 | 1.4% |
| Total | 8,263 | 100.0% |
Housing Structures by Occupancy in South St Paul
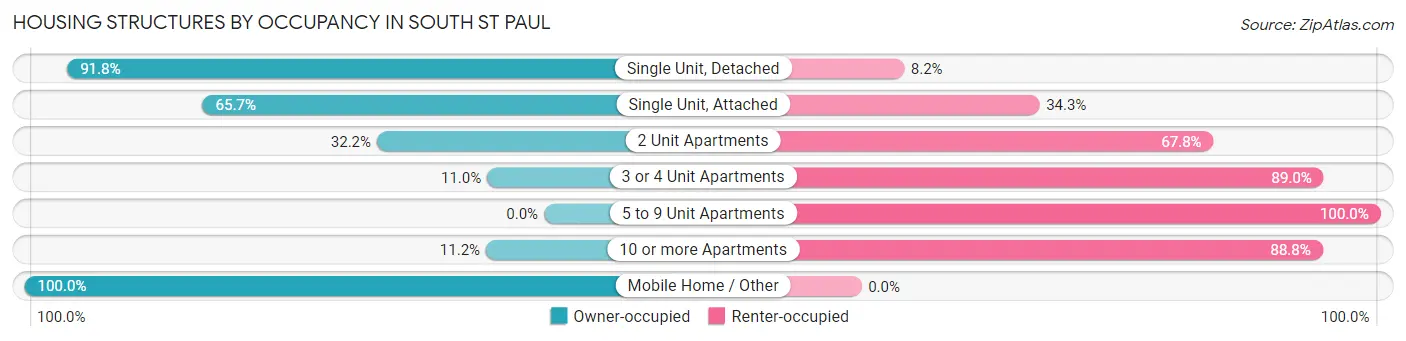
| Structure Type | Owner-occupied | Renter-occupied |
| Single Unit, Detached | 5,137 (91.8%) | 460 (8.2%) |
| Single Unit, Attached | 301 (65.7%) | 157 (34.3%) |
| 2 Unit Apartments | 158 (32.2%) | 333 (67.8%) |
| 3 or 4 Unit Apartments | 32 (11.0%) | 260 (89.0%) |
| 5 to 9 Unit Apartments | 0 (0.0%) | 135 (100.0%) |
| 10 or more Apartments | 131 (11.2%) | 1,041 (88.8%) |
| Mobile Home / Other | 118 (100.0%) | 0 (0.0%) |
| Total | 5,877 (71.1%) | 2,386 (28.9%) |
Housing Structures by Number of Rooms in South St Paul
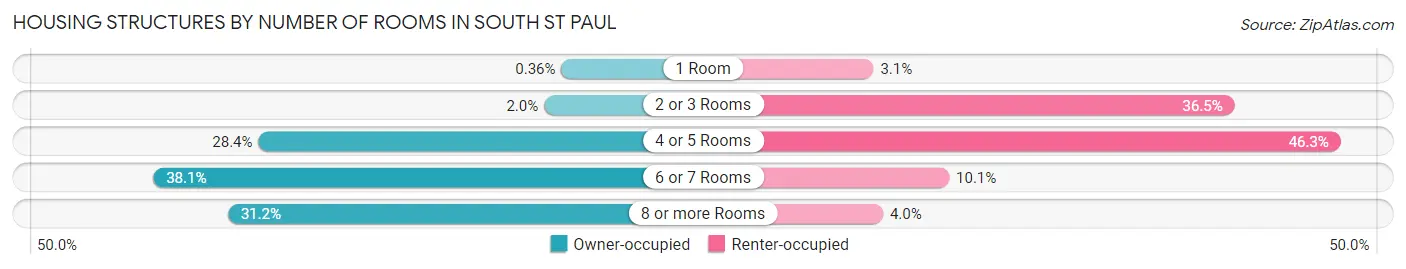
| Number of Rooms | Owner-occupied | Renter-occupied |
| 1 Room | 21 (0.4%) | 74 (3.1%) |
| 2 or 3 Rooms | 115 (2.0%) | 871 (36.5%) |
| 4 or 5 Rooms | 1,668 (28.4%) | 1,105 (46.3%) |
| 6 or 7 Rooms | 2,239 (38.1%) | 241 (10.1%) |
| 8 or more Rooms | 1,834 (31.2%) | 95 (4.0%) |
| Total | 5,877 (100.0%) | 2,386 (100.0%) |
Housing Structure by Heating Type in South St Paul
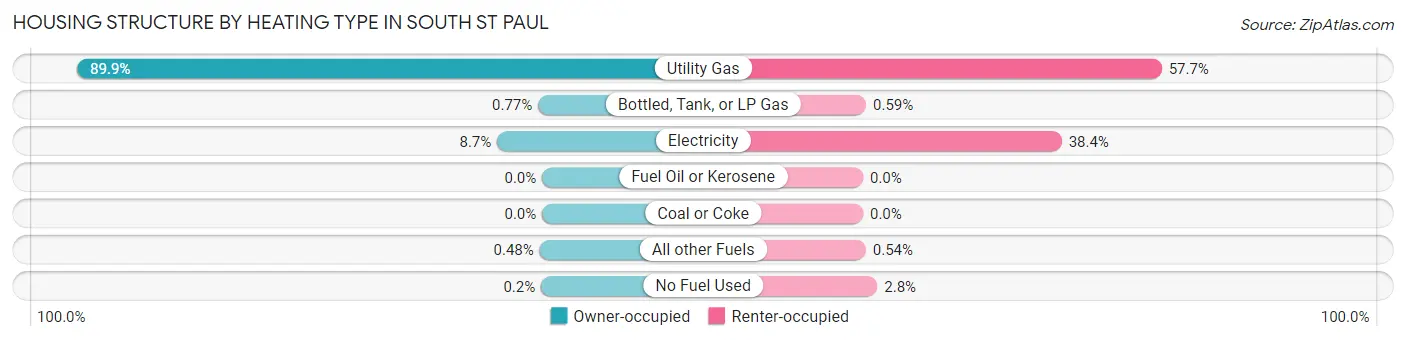
| Heating Type | Owner-occupied | Renter-occupied |
| Utility Gas | 5,281 (89.9%) | 1,377 (57.7%) |
| Bottled, Tank, or LP Gas | 45 (0.8%) | 14 (0.6%) |
| Electricity | 511 (8.7%) | 916 (38.4%) |
| Fuel Oil or Kerosene | 0 (0.0%) | 0 (0.0%) |
| Coal or Coke | 0 (0.0%) | 0 (0.0%) |
| All other Fuels | 28 (0.5%) | 13 (0.5%) |
| No Fuel Used | 12 (0.2%) | 66 (2.8%) |
| Total | 5,877 (100.0%) | 2,386 (100.0%) |
Household Vehicle Usage in South St Paul
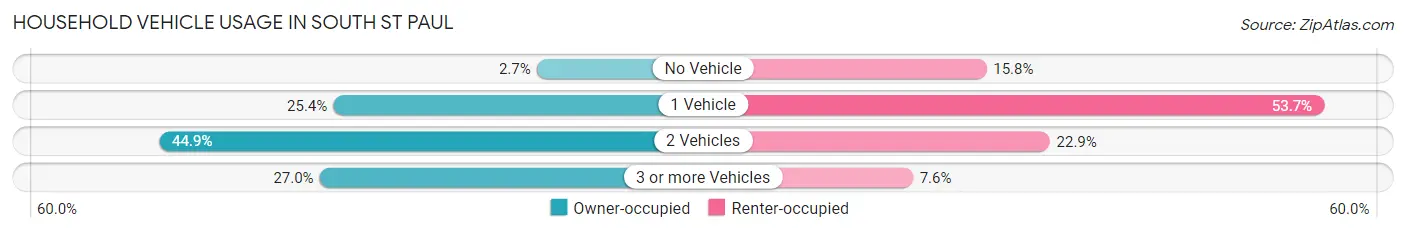
| Vehicles per Household | Owner-occupied | Renter-occupied |
| No Vehicle | 156 (2.6%) | 378 (15.8%) |
| 1 Vehicle | 1,495 (25.4%) | 1,280 (53.6%) |
| 2 Vehicles | 2,641 (44.9%) | 547 (22.9%) |
| 3 or more Vehicles | 1,585 (27.0%) | 181 (7.6%) |
| Total | 5,877 (100.0%) | 2,386 (100.0%) |
Real Estate & Mortgages in South St Paul
Real Estate and Mortgage Overview in South St Paul
| Characteristic | Without Mortgage | With Mortgage |
| Housing Units | 1,729 | 4,148 |
| Median Property Value | $237,700 | $254,200 |
| Median Household Income | $86,179 | $827 |
| Monthly Housing Costs | $587 | $177 |
| Real Estate Taxes | $2,771 | $107 |
Property Value by Mortgage Status in South St Paul
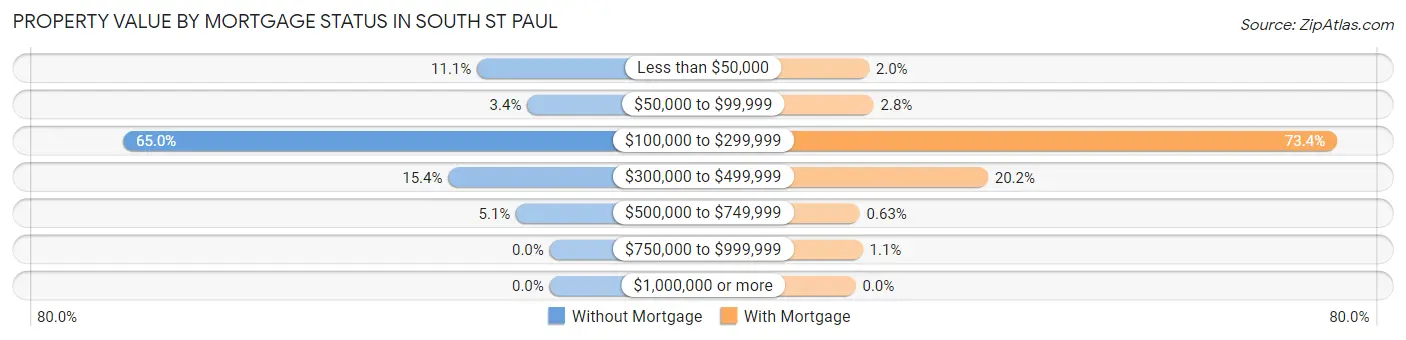
| Property Value | Without Mortgage | With Mortgage |
| Less than $50,000 | 191 (11.1%) | 84 (2.0%) |
| $50,000 to $99,999 | 59 (3.4%) | 114 (2.8%) |
| $100,000 to $299,999 | 1,124 (65.0%) | 3,043 (73.4%) |
| $300,000 to $499,999 | 267 (15.4%) | 836 (20.2%) |
| $500,000 to $749,999 | 88 (5.1%) | 26 (0.6%) |
| $750,000 to $999,999 | 0 (0.0%) | 45 (1.1%) |
| $1,000,000 or more | 0 (0.0%) | 0 (0.0%) |
| Total | 1,729 (100.0%) | 4,148 (100.0%) |
Household Income by Mortgage Status in South St Paul
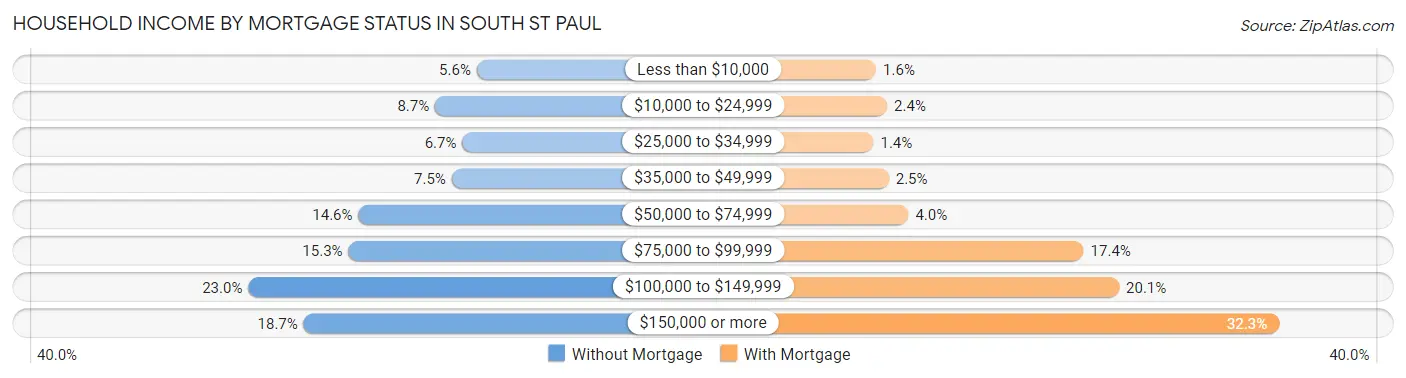
| Household Income | Without Mortgage | With Mortgage |
| Less than $10,000 | 96 (5.6%) | 65 (1.6%) |
| $10,000 to $24,999 | 151 (8.7%) | 100 (2.4%) |
| $25,000 to $34,999 | 115 (6.7%) | 57 (1.4%) |
| $35,000 to $49,999 | 129 (7.5%) | 105 (2.5%) |
| $50,000 to $74,999 | 252 (14.6%) | 167 (4.0%) |
| $75,000 to $99,999 | 265 (15.3%) | 721 (17.4%) |
| $100,000 to $149,999 | 397 (23.0%) | 833 (20.1%) |
| $150,000 or more | 324 (18.7%) | 1,338 (32.3%) |
| Total | 1,729 (100.0%) | 4,148 (100.0%) |
Property Value to Household Income Ratio in South St Paul
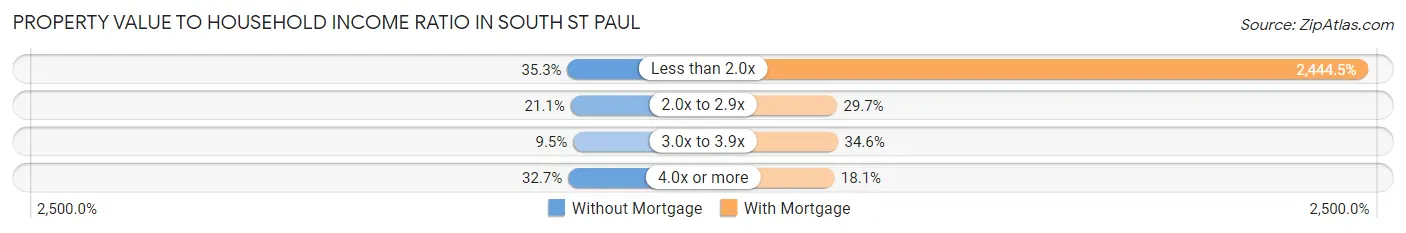
| Value-to-Income Ratio | Without Mortgage | With Mortgage |
| Less than 2.0x | 610 (35.3%) | 101,396 (2,444.5%) |
| 2.0x to 2.9x | 364 (21.0%) | 1,232 (29.7%) |
| 3.0x to 3.9x | 165 (9.5%) | 1,433 (34.5%) |
| 4.0x or more | 565 (32.7%) | 751 (18.1%) |
| Total | 1,729 (100.0%) | 4,148 (100.0%) |
Real Estate Taxes by Mortgage Status in South St Paul
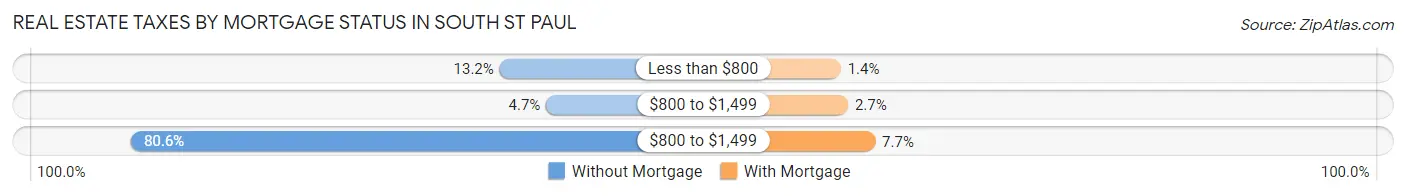
| Property Taxes | Without Mortgage | With Mortgage |
| Less than $800 | 229 (13.2%) | 58 (1.4%) |
| $800 to $1,499 | 82 (4.7%) | 113 (2.7%) |
| $800 to $1,499 | 1,393 (80.6%) | 319 (7.7%) |
| Total | 1,729 (100.0%) | 4,148 (100.0%) |
Health & Disability in South St Paul
Health Insurance Coverage by Age in South St Paul
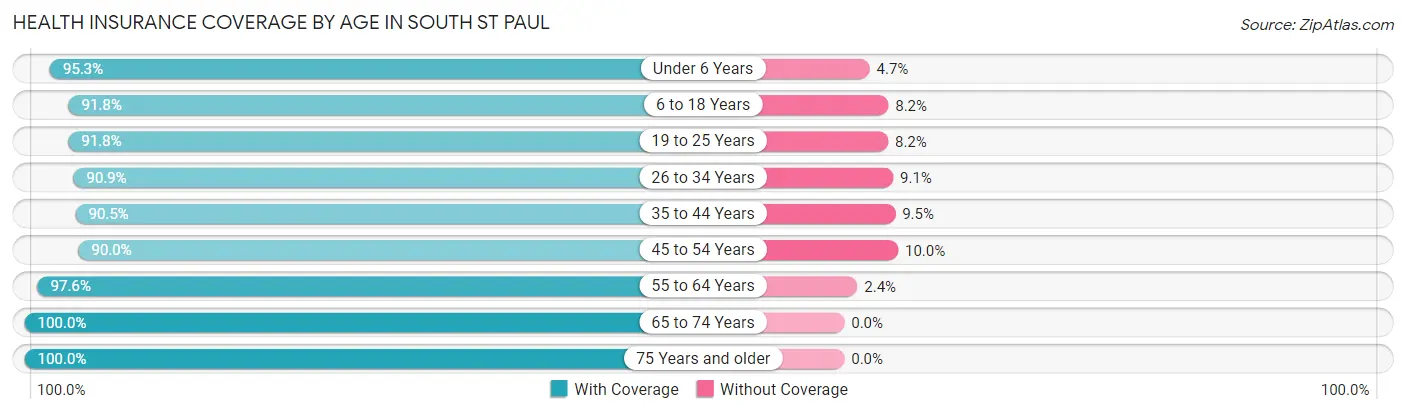
| Age Bracket | With Coverage | Without Coverage |
| Under 6 Years | 1,292 (95.3%) | 64 (4.7%) |
| 6 to 18 Years | 3,267 (91.8%) | 292 (8.2%) |
| 19 to 25 Years | 1,858 (91.8%) | 165 (8.2%) |
| 26 to 34 Years | 2,546 (90.9%) | 255 (9.1%) |
| 35 to 44 Years | 2,642 (90.5%) | 277 (9.5%) |
| 45 to 54 Years | 2,117 (90.0%) | 236 (10.0%) |
| 55 to 64 Years | 2,609 (97.6%) | 65 (2.4%) |
| 65 to 74 Years | 1,704 (100.0%) | 0 (0.0%) |
| 75 Years and older | 1,184 (100.0%) | 0 (0.0%) |
| Total | 19,219 (93.4%) | 1,354 (6.6%) |
Health Insurance Coverage by Citizenship Status in South St Paul
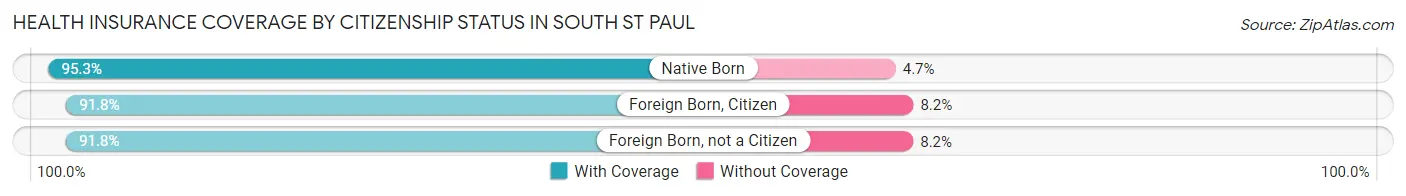
| Citizenship Status | With Coverage | Without Coverage |
| Native Born | 1,292 (95.3%) | 64 (4.7%) |
| Foreign Born, Citizen | 3,267 (91.8%) | 292 (8.2%) |
| Foreign Born, not a Citizen | 1,858 (91.8%) | 165 (8.2%) |
Health Insurance Coverage by Household Income in South St Paul
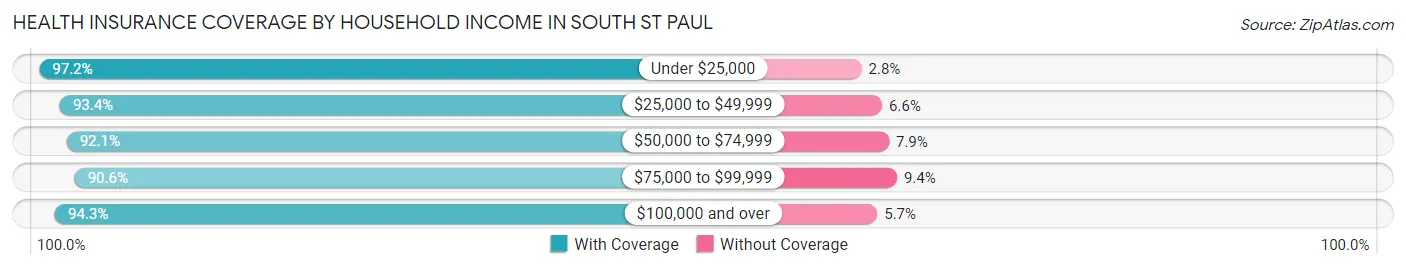
| Household Income | With Coverage | Without Coverage |
| Under $25,000 | 1,613 (97.2%) | 46 (2.8%) |
| $25,000 to $49,999 | 1,759 (93.4%) | 125 (6.6%) |
| $50,000 to $74,999 | 2,846 (92.1%) | 244 (7.9%) |
| $75,000 to $99,999 | 3,691 (90.6%) | 383 (9.4%) |
| $100,000 and over | 9,174 (94.3%) | 556 (5.7%) |
Public vs Private Health Insurance Coverage by Age in South St Paul
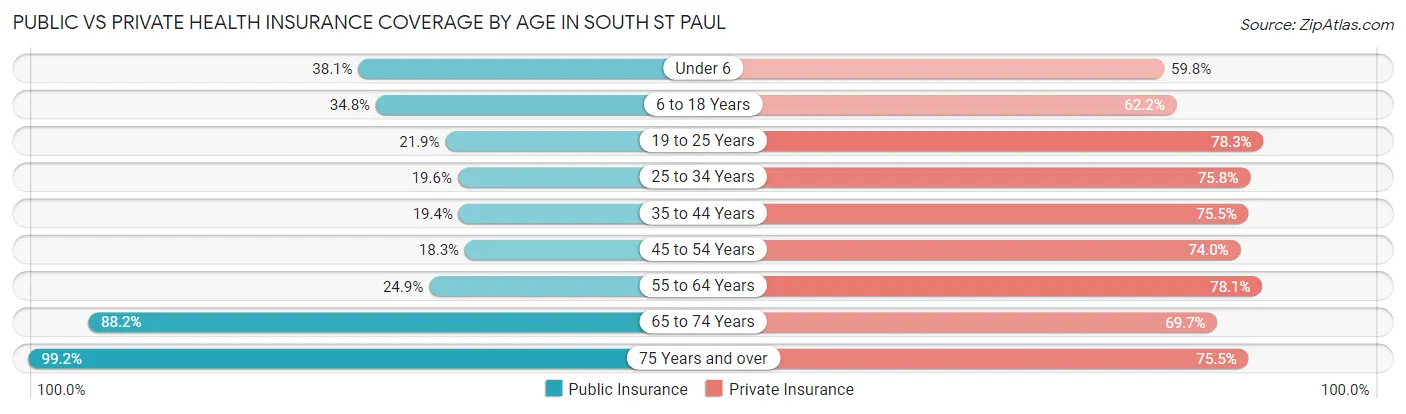
| Age Bracket | Public Insurance | Private Insurance |
| Under 6 | 516 (38.1%) | 811 (59.8%) |
| 6 to 18 Years | 1,238 (34.8%) | 2,212 (62.2%) |
| 19 to 25 Years | 443 (21.9%) | 1,583 (78.2%) |
| 25 to 34 Years | 549 (19.6%) | 2,122 (75.8%) |
| 35 to 44 Years | 567 (19.4%) | 2,204 (75.5%) |
| 45 to 54 Years | 430 (18.3%) | 1,741 (74.0%) |
| 55 to 64 Years | 667 (24.9%) | 2,087 (78.0%) |
| 65 to 74 Years | 1,503 (88.2%) | 1,188 (69.7%) |
| 75 Years and over | 1,175 (99.2%) | 894 (75.5%) |
| Total | 7,088 (34.4%) | 14,842 (72.1%) |
Disability Status by Sex by Age in South St Paul
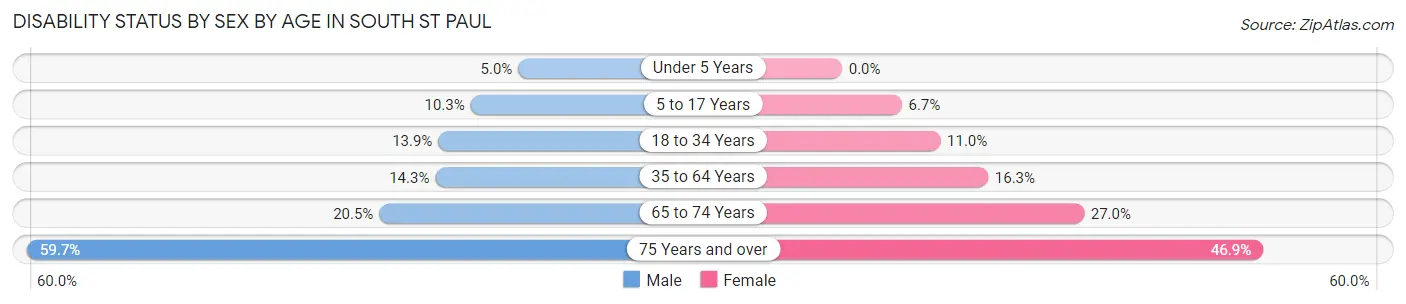
| Age Bracket | Male | Female |
| Under 5 Years | 26 (5.0%) | 0 (0.0%) |
| 5 to 17 Years | 197 (10.3%) | 110 (6.7%) |
| 18 to 34 Years | 338 (13.9%) | 293 (11.0%) |
| 35 to 64 Years | 583 (14.3%) | 628 (16.3%) |
| 65 to 74 Years | 160 (20.5%) | 249 (27.0%) |
| 75 Years and over | 273 (59.7%) | 341 (46.9%) |
Disability Class by Sex by Age in South St Paul
Disability Class: Hearing Difficulty
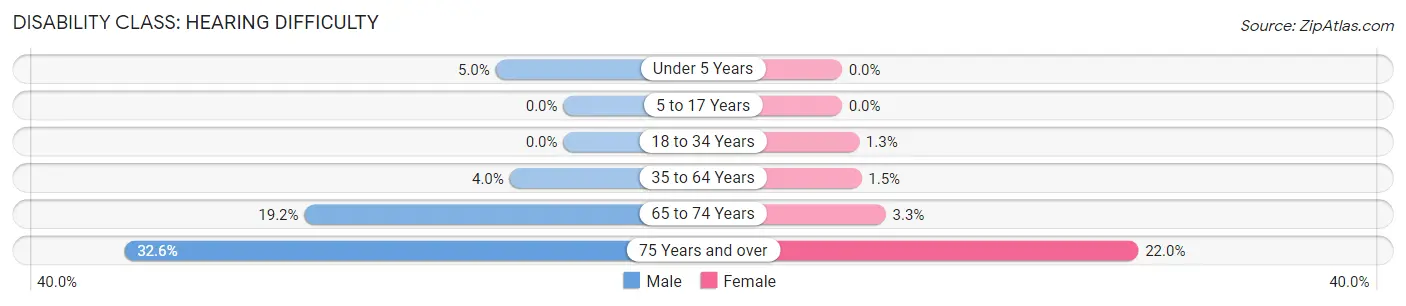
| Age Bracket | Male | Female |
| Under 5 Years | 26 (5.0%) | 0 (0.0%) |
| 5 to 17 Years | 0 (0.0%) | 0 (0.0%) |
| 18 to 34 Years | 0 (0.0%) | 34 (1.3%) |
| 35 to 64 Years | 163 (4.0%) | 56 (1.5%) |
| 65 to 74 Years | 150 (19.2%) | 30 (3.3%) |
| 75 Years and over | 149 (32.6%) | 160 (22.0%) |
Disability Class: Vision Difficulty
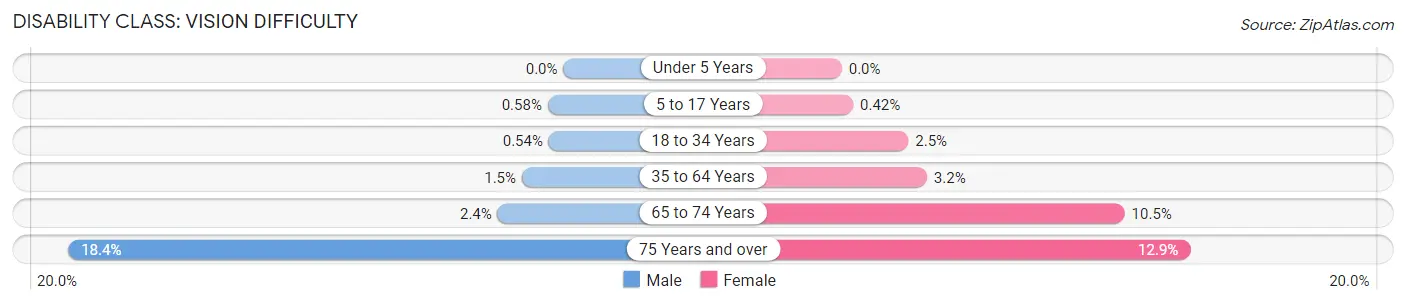
| Age Bracket | Male | Female |
| Under 5 Years | 0 (0.0%) | 0 (0.0%) |
| 5 to 17 Years | 11 (0.6%) | 7 (0.4%) |
| 18 to 34 Years | 13 (0.5%) | 66 (2.5%) |
| 35 to 64 Years | 63 (1.5%) | 122 (3.2%) |
| 65 to 74 Years | 19 (2.4%) | 97 (10.5%) |
| 75 Years and over | 84 (18.4%) | 94 (12.9%) |
Disability Class: Cognitive Difficulty
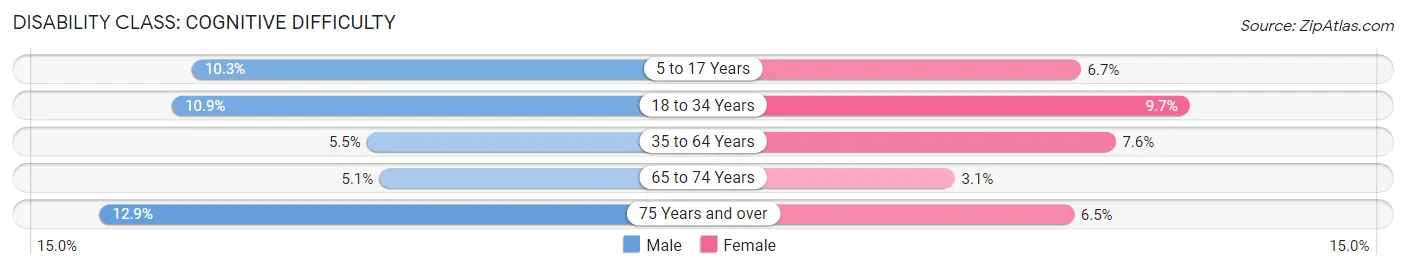
| Age Bracket | Male | Female |
| 5 to 17 Years | 197 (10.3%) | 110 (6.7%) |
| 18 to 34 Years | 264 (10.9%) | 259 (9.7%) |
| 35 to 64 Years | 224 (5.5%) | 294 (7.6%) |
| 65 to 74 Years | 40 (5.1%) | 29 (3.1%) |
| 75 Years and over | 59 (12.9%) | 47 (6.5%) |
Disability Class: Ambulatory Difficulty
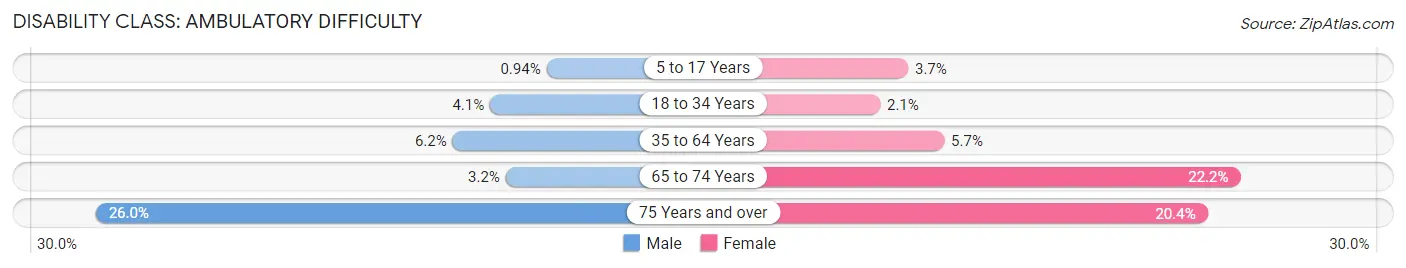
| Age Bracket | Male | Female |
| 5 to 17 Years | 18 (0.9%) | 61 (3.7%) |
| 18 to 34 Years | 99 (4.1%) | 57 (2.1%) |
| 35 to 64 Years | 252 (6.2%) | 220 (5.7%) |
| 65 to 74 Years | 25 (3.2%) | 205 (22.2%) |
| 75 Years and over | 119 (26.0%) | 148 (20.4%) |
Disability Class: Self-Care Difficulty
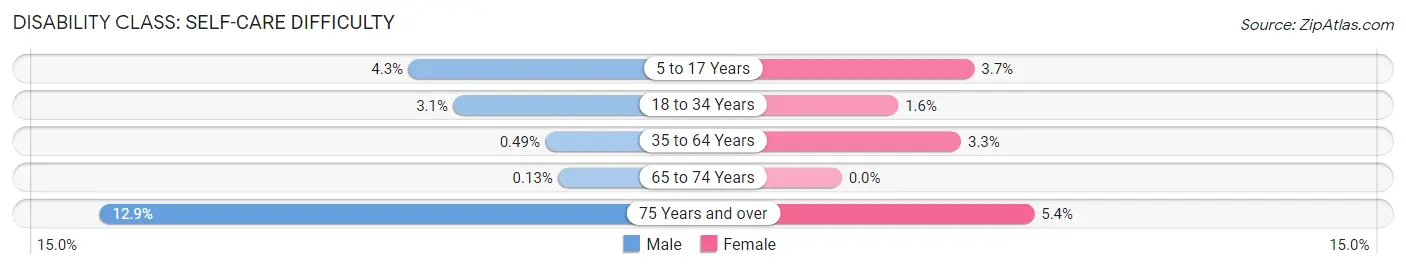
| Age Bracket | Male | Female |
| 5 to 17 Years | 82 (4.3%) | 61 (3.7%) |
| 18 to 34 Years | 74 (3.0%) | 42 (1.6%) |
| 35 to 64 Years | 20 (0.5%) | 128 (3.3%) |
| 65 to 74 Years | 1 (0.1%) | 0 (0.0%) |
| 75 Years and over | 59 (12.9%) | 39 (5.4%) |
Technology Access in South St Paul
Computing Device Access in South St Paul
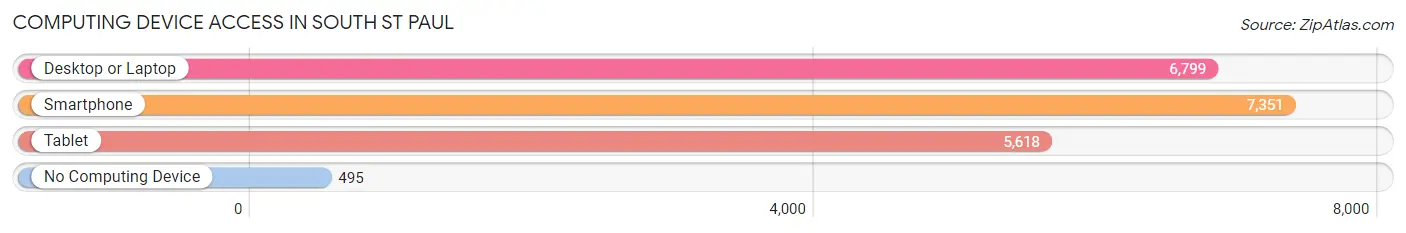
| Device Type | # Households | % Households |
| Desktop or Laptop | 6,799 | 82.3% |
| Smartphone | 7,351 | 89.0% |
| Tablet | 5,618 | 68.0% |
| No Computing Device | 495 | 6.0% |
| Total | 8,263 | 100.0% |
Internet Access in South St Paul
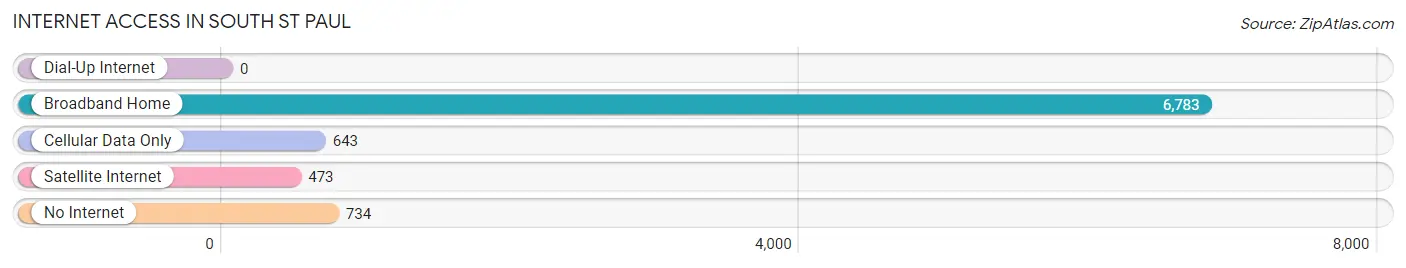
| Internet Type | # Households | % Households |
| Dial-Up Internet | 0 | 0.0% |
| Broadband Home | 6,783 | 82.1% |
| Cellular Data Only | 643 | 7.8% |
| Satellite Internet | 473 | 5.7% |
| No Internet | 734 | 8.9% |
| Total | 8,263 | 100.0% |
South St Paul Summary
South St. Paul is a city located in Dakota County, Minnesota, United States. It is situated on the Mississippi River, just south of the city of St. Paul. The population was 20,160 at the 2010 census.
History
South St. Paul was first settled in 1853 by a group of settlers from St. Paul. The city was incorporated in 1887. The city was originally known as "South St. Paul Township" and was later changed to "South St. Paul" in 1891.
The city was originally a farming community, but it soon became a major industrial center. The city was home to several large meatpacking plants, including Armour and Company, Swift and Company, and Wilson and Company. These companies employed thousands of workers and helped to make South St. Paul one of the most prosperous cities in the state.
The city was also home to several other industries, including a large paper mill, a brewery, and a brickyard. The city was also home to a large number of immigrants, mostly from Eastern Europe.
Geography
South St. Paul is located in the southeastern part of Dakota County, Minnesota. It is situated on the Mississippi River, just south of the city of St. Paul. The city is bordered by the cities of Inver Grove Heights to the north, West St. Paul to the east, and Mendota Heights to the south.
The city has a total area of 5.2 square miles, all of which is land. The city is located in the St. Croix River Valley, and is surrounded by rolling hills and bluffs.
Economy
South St. Paul is a major industrial center. The city is home to several large meatpacking plants, including Armour and Company, Swift and Company, and Wilson and Company. These companies employ thousands of workers and help to make South St. Paul one of the most prosperous cities in the state.
The city is also home to several other industries, including a large paper mill, a brewery, and a brickyard. The city is also home to a large number of immigrants, mostly from Eastern Europe.
Demographics
As of the 2010 census, there were 20,160 people, 8,717 households, and 5,072 families residing in the city. The population density was 3,890.3 people per square mile. The racial makeup of the city was 87.2% White, 5.2% African American, 0.5% Native American, 2.2% Asian, 0.1% Pacific Islander, 2.7% from other races, and 2.1% from two or more races. Hispanic or Latino of any race were 6.3% of the population.
The median income for a household in the city was $45,945, and the median income for a family was $56,945. The per capita income for the city was $22,945. About 8.2% of families and 10.3% of the population were below the poverty line, including 14.2% of those under age 18 and 6.2% of those age 65 or over.
Common Questions
What is Per Capita Income in South St Paul?
Per Capita income in South St Paul is $36,229.
What is the Median Family Income in South St Paul?
Median Family Income in South St Paul is $99,049.
What is the Median Household income in South St Paul?
Median Household Income in South St Paul is $82,644.
What is Income or Wage Gap in South St Paul?
Income or Wage Gap in South St Paul is 18.6%.
Women in South St Paul earn 81.4 cents for every dollar earned by a man.
What is Inequality or Gini Index in South St Paul?
Inequality or Gini Index in South St Paul is 0.36.
What is the Total Population of South St Paul?
Total Population of South St Paul is 20,598.
What is the Total Male Population of South St Paul?
Total Male Population of South St Paul is 10,169.
What is the Total Female Population of South St Paul?
Total Female Population of South St Paul is 10,429.
What is the Ratio of Males per 100 Females in South St Paul?
There are 97.51 Males per 100 Females in South St Paul.
What is the Ratio of Females per 100 Males in South St Paul?
There are 102.56 Females per 100 Males in South St Paul.
What is the Median Population Age in South St Paul?
Median Population Age in South St Paul is 36.9 Years.
What is the Average Family Size in South St Paul
Average Family Size in South St Paul is 3.1 People.
What is the Average Household Size in South St Paul
Average Household Size in South St Paul is 2.5 People.
How Large is the Labor Force in South St Paul?
There are 12,094 People in the Labor Forcein in South St Paul.
What is the Percentage of People in the Labor Force in South St Paul?
73.1% of People are in the Labor Force in South St Paul.
What is the Unemployment Rate in South St Paul?
Unemployment Rate in South St Paul is 5.7%.