Zip Codes with the Highest Percentage of Population with a Degree in Literature and Languages in Kentucky
RELATED REPORTS & OPTIONS
Literature and Languages
Kentucky
Compare Zip Codes
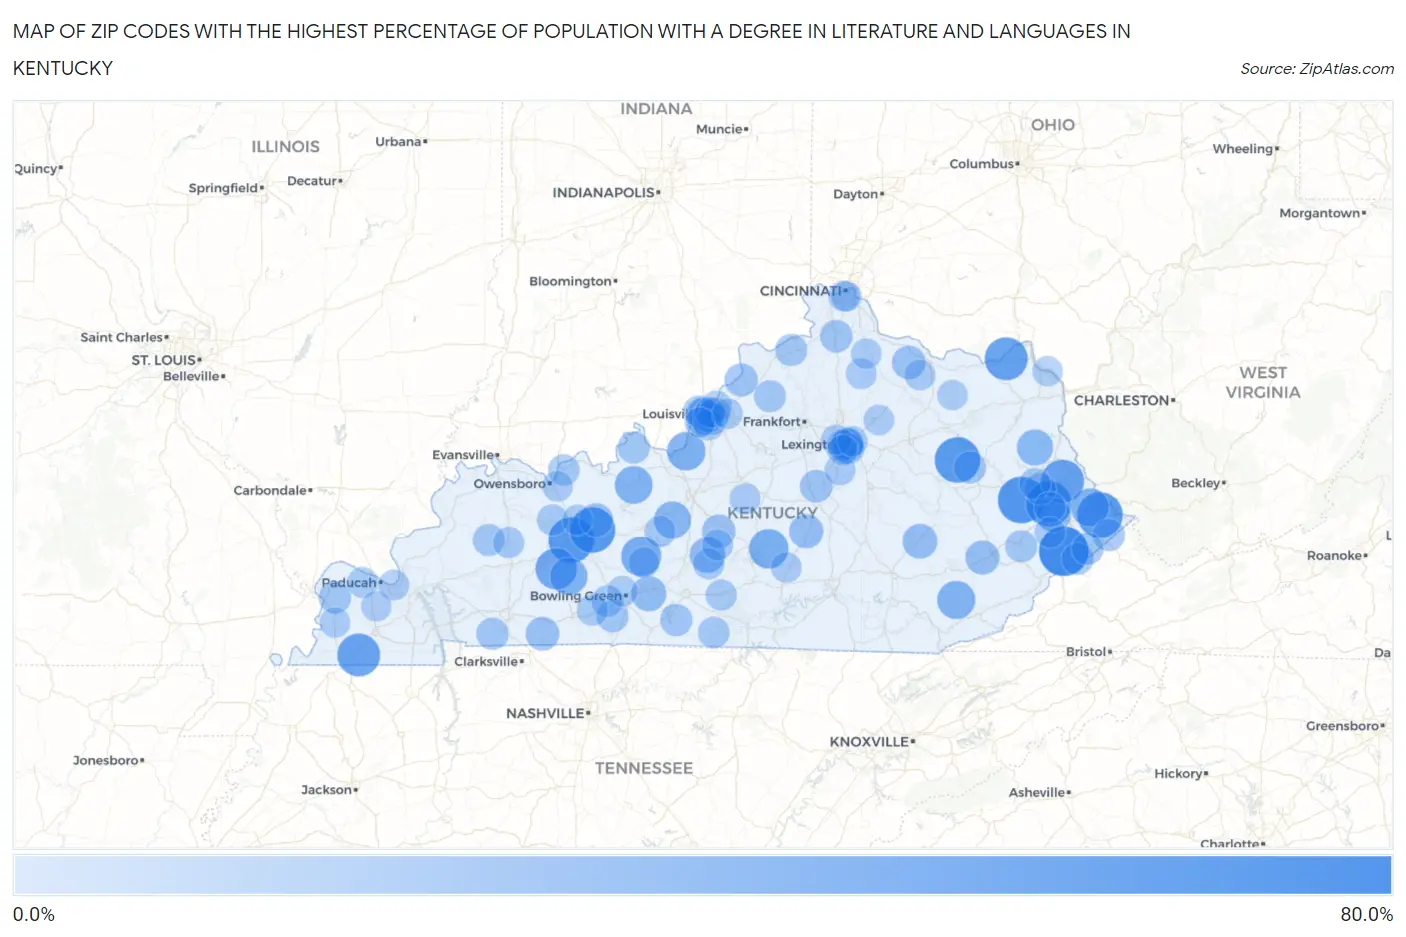
Map of Zip Codes with the Highest Percentage of Population with a Degree in Literature and Languages in Kentucky
0.0%
80.0%
Zip Codes with the Highest Percentage of Population with a Degree in Literature and Languages in Kentucky
| Zip Code | % Graduates | vs State | vs National | |
| 1. | 41538 | 61.9% | 3.8%(+58.1)#1 | 4.4%(+57.5)#39 |
| 2. | 41464 | 53.3% | 3.8%(+49.6)#2 | 4.4%(+48.9)#51 |
| 3. | 41543 | 50.0% | 3.8%(+46.2)#3 | 4.4%(+45.6)#61 |
| 4. | 40316 | 50.0% | 3.8%(+46.2)#4 | 4.4%(+45.6)#62 |
| 5. | 42354 | 50.0% | 3.8%(+46.2)#5 | 4.4%(+45.6)#65 |
| 6. | 41621 | 50.0% | 3.8%(+46.2)#6 | 4.4%(+45.6)#67 |
| 7. | 42370 | 50.0% | 3.8%(+46.2)#7 | 4.4%(+45.6)#72 |
| 8. | 41214 | 43.1% | 3.8%(+39.3)#8 | 4.4%(+38.6)#102 |
| 9. | 41166 | 42.3% | 3.8%(+38.5)#9 | 4.4%(+37.9)#108 |
| 10. | 42085 | 41.9% | 3.8%(+38.2)#10 | 4.4%(+37.5)#111 |
| 11. | 42321 | 37.5% | 3.8%(+33.7)#11 | 4.4%(+33.1)#134 |
| 12. | 42285 | 33.9% | 3.8%(+30.2)#12 | 4.4%(+29.5)#153 |
| 13. | 42733 | 31.7% | 3.8%(+27.9)#13 | 4.4%(+27.3)#187 |
| 14. | 40177 | 28.8% | 3.8%(+25.1)#14 | 4.4%(+24.4)#217 |
| 15. | 41564 | 27.9% | 3.8%(+24.1)#15 | 4.4%(+23.5)#234 |
| 16. | 40913 | 27.9% | 3.8%(+24.1)#16 | 4.4%(+23.5)#235 |
| 17. | 40144 | 27.2% | 3.8%(+23.4)#17 | 4.4%(+22.8)#253 |
| 18. | 42339 | 26.5% | 3.8%(+22.7)#18 | 4.4%(+22.1)#268 |
| 19. | 42788 | 25.0% | 3.8%(+21.2)#19 | 4.4%(+20.6)#311 |
| 20. | 41124 | 22.2% | 3.8%(+18.5)#20 | 4.4%(+17.8)#385 |
| 21. | 42722 | 20.5% | 3.8%(+16.8)#21 | 4.4%(+16.1)#454 |
| 22. | 42159 | 19.3% | 3.8%(+15.5)#22 | 4.4%(+14.9)#508 |
| 23. | 40486 | 18.2% | 3.8%(+14.5)#23 | 4.4%(+13.8)#562 |
| 24. | 41603 | 17.6% | 3.8%(+13.9)#24 | 4.4%(+13.2)#590 |
| 25. | 41723 | 16.3% | 3.8%(+12.5)#25 | 4.4%(+11.9)#688 |
| 26. | 40437 | 16.2% | 3.8%(+12.5)#26 | 4.4%(+11.8)#692 |
| 27. | 41044 | 15.0% | 3.8%(+11.2)#27 | 4.4%(+10.6)#811 |
| 28. | 42234 | 15.0% | 3.8%(+11.2)#28 | 4.4%(+10.6)#817 |
| 29. | 42361 | 14.9% | 3.8%(+11.1)#29 | 4.4%(+10.5)#823 |
| 30. | 42764 | 14.4% | 3.8%(+10.7)#30 | 4.4%(+10.0)#879 |
| 31. | 40077 | 13.6% | 3.8%(+9.87)#31 | 4.4%(+9.23)#959 |
| 32. | 40526 | 13.3% | 3.8%(+9.57)#32 | 4.4%(+8.92)#1,003 |
| 33. | 40310 | 12.2% | 3.8%(+8.48)#33 | 4.4%(+7.84)#1,181 |
| 34. | 41030 | 11.7% | 3.8%(+7.91)#34 | 4.4%(+7.26)#1,295 |
| 35. | 40203 | 11.2% | 3.8%(+7.42)#35 | 4.4%(+6.78)#1,412 |
| 36. | 42087 | 11.2% | 3.8%(+7.40)#36 | 4.4%(+6.75)#1,415 |
| 37. | 42236 | 11.1% | 3.8%(+7.35)#37 | 4.4%(+6.70)#1,432 |
| 38. | 41566 | 11.1% | 3.8%(+7.35)#38 | 4.4%(+6.70)#1,437 |
| 39. | 41425 | 11.0% | 3.8%(+7.24)#39 | 4.4%(+6.59)#1,471 |
| 40. | 42123 | 10.7% | 3.8%(+6.98)#40 | 4.4%(+6.33)#1,545 |
| 41. | 42170 | 10.7% | 3.8%(+6.92)#41 | 4.4%(+6.27)#1,564 |
| 42. | 40202 | 10.6% | 3.8%(+6.88)#42 | 4.4%(+6.23)#1,578 |
| 43. | 41512 | 10.6% | 3.8%(+6.88)#43 | 4.4%(+6.23)#1,579 |
| 44. | 40157 | 10.5% | 3.8%(+6.76)#44 | 4.4%(+6.12)#1,622 |
| 45. | 41083 | 10.3% | 3.8%(+6.58)#45 | 4.4%(+5.94)#1,696 |
| 46. | 41822 | 10.2% | 3.8%(+6.48)#46 | 4.4%(+5.84)#1,729 |
| 47. | 41216 | 10.2% | 3.8%(+6.41)#47 | 4.4%(+5.76)#1,752 |
| 48. | 41522 | 10.1% | 3.8%(+6.37)#48 | 4.4%(+5.72)#1,766 |
| 49. | 42441 | 10.1% | 3.8%(+6.30)#49 | 4.4%(+5.65)#1,792 |
| 50. | 40019 | 10.0% | 3.8%(+6.22)#50 | 4.4%(+5.57)#1,841 |
| 51. | 40507 | 9.4% | 3.8%(+5.61)#51 | 4.4%(+4.97)#2,099 |
| 52. | 40508 | 9.2% | 3.8%(+5.48)#52 | 4.4%(+4.84)#2,179 |
| 53. | 42274 | 9.2% | 3.8%(+5.42)#53 | 4.4%(+4.78)#2,216 |
| 54. | 41222 | 8.8% | 3.8%(+5.08)#54 | 4.4%(+4.43)#2,399 |
| 55. | 42355 | 8.7% | 3.8%(+4.95)#55 | 4.4%(+4.31)#2,466 |
| 56. | 42167 | 8.7% | 3.8%(+4.92)#56 | 4.4%(+4.27)#2,500 |
| 57. | 41601 | 8.6% | 3.8%(+4.84)#57 | 4.4%(+4.19)#2,543 |
| 58. | 40217 | 8.6% | 3.8%(+4.82)#58 | 4.4%(+4.18)#2,552 |
| 59. | 40208 | 8.3% | 3.8%(+4.51)#59 | 4.4%(+3.86)#2,764 |
| 60. | 42352 | 8.1% | 3.8%(+4.34)#60 | 4.4%(+3.70)#2,892 |
| 61. | 42206 | 8.1% | 3.8%(+4.32)#61 | 4.4%(+3.67)#2,917 |
| 62. | 42726 | 8.0% | 3.8%(+4.22)#62 | 4.4%(+3.57)#3,001 |
| 63. | 40212 | 7.8% | 3.8%(+4.08)#63 | 4.4%(+3.43)#3,119 |
| 64. | 42746 | 7.7% | 3.8%(+3.98)#64 | 4.4%(+3.34)#3,202 |
| 65. | 40205 | 7.7% | 3.8%(+3.98)#65 | 4.4%(+3.33)#3,213 |
| 66. | 40502 | 7.6% | 3.8%(+3.85)#66 | 4.4%(+3.21)#3,340 |
| 67. | 42129 | 7.5% | 3.8%(+3.78)#67 | 4.4%(+3.13)#3,401 |
| 68. | 40204 | 7.5% | 3.8%(+3.72)#68 | 4.4%(+3.07)#3,459 |
| 69. | 40025 | 7.4% | 3.8%(+3.67)#69 | 4.4%(+3.03)#3,513 |
| 70. | 42431 | 7.4% | 3.8%(+3.61)#70 | 4.4%(+2.96)#3,577 |
| 71. | 42782 | 7.1% | 3.8%(+3.38)#71 | 4.4%(+2.73)#3,816 |
| 72. | 41011 | 7.1% | 3.8%(+3.37)#72 | 4.4%(+2.72)#3,834 |
| 73. | 41647 | 7.1% | 3.8%(+3.32)#73 | 4.4%(+2.67)#3,903 |
| 74. | 41055 | 7.1% | 3.8%(+3.30)#74 | 4.4%(+2.65)#3,931 |
| 75. | 42058 | 6.9% | 3.8%(+3.12)#75 | 4.4%(+2.47)#4,134 |
| 76. | 41003 | 6.8% | 3.8%(+3.00)#76 | 4.4%(+2.36)#4,278 |
| 77. | 40049 | 6.8% | 3.8%(+2.99)#77 | 4.4%(+2.35)#4,295 |
| 78. | 40207 | 6.8% | 3.8%(+2.99)#78 | 4.4%(+2.34)#4,302 |
| 79. | 40504 | 6.6% | 3.8%(+2.86)#79 | 4.4%(+2.22)#4,462 |
| 80. | 42210 | 6.5% | 3.8%(+2.75)#80 | 4.4%(+2.11)#4,615 |
| 81. | 42303 | 6.5% | 3.8%(+2.73)#81 | 4.4%(+2.08)#4,656 |
| 82. | 42086 | 6.5% | 3.8%(+2.70)#82 | 4.4%(+2.05)#4,698 |
| 83. | 40213 | 6.4% | 3.8%(+2.66)#83 | 4.4%(+2.01)#4,767 |
| 84. | 42528 | 6.3% | 3.8%(+2.58)#84 | 4.4%(+1.93)#4,870 |
| 85. | 40356 | 6.3% | 3.8%(+2.56)#85 | 4.4%(+1.92)#4,896 |
| 86. | 40206 | 6.2% | 3.8%(+2.49)#86 | 4.4%(+1.84)#5,027 |
| 87. | 42101 | 6.2% | 3.8%(+2.39)#87 | 4.4%(+1.75)#5,159 |
| 88. | 40510 | 6.1% | 3.8%(+2.36)#88 | 4.4%(+1.71)#5,227 |
| 89. | 41040 | 6.1% | 3.8%(+2.32)#89 | 4.4%(+1.68)#5,290 |
| 90. | 42347 | 5.9% | 3.8%(+2.10)#90 | 4.4%(+1.46)#5,656 |
| 91. | 40505 | 5.8% | 3.8%(+2.05)#91 | 4.4%(+1.40)#5,734 |
| 92. | 41093 | 5.8% | 3.8%(+2.01)#92 | 4.4%(+1.37)#5,790 |
| 93. | 40361 | 5.7% | 3.8%(+1.92)#93 | 4.4%(+1.27)#5,976 |
| 94. | 40503 | 5.7% | 3.8%(+1.90)#94 | 4.4%(+1.25)#6,017 |
| 95. | 42021 | 5.6% | 3.8%(+1.87)#95 | 4.4%(+1.22)#6,062 |
| 96. | 41014 | 5.6% | 3.8%(+1.86)#96 | 4.4%(+1.21)#6,092 |
| 97. | 42027 | 5.6% | 3.8%(+1.83)#97 | 4.4%(+1.18)#6,139 |
| 98. | 40215 | 5.6% | 3.8%(+1.83)#98 | 4.4%(+1.18)#6,150 |
| 99. | 40223 | 5.5% | 3.8%(+1.74)#99 | 4.4%(+1.09)#6,307 |
| 100. | 41183 | 5.4% | 3.8%(+1.68)#100 | 4.4%(+1.03)#6,420 |
Common Questions
What are the Top 10 Zip Codes with the Highest Percentage of Population with a Degree in Literature and Languages in Kentucky?
Top 10 Zip Codes with the Highest Percentage of Population with a Degree in Literature and Languages in Kentucky are:
What zip code has the Highest Percentage of Population with a Degree in Literature and Languages in Kentucky?
41538 has the Highest Percentage of Population with a Degree in Literature and Languages in Kentucky with 61.9%.
What is the Percentage of Population with a Degree in Literature and Languages in the State of Kentucky?
Percentage of Population with a Degree in Literature and Languages in Kentucky is 3.8%.
What is the Percentage of Population with a Degree in Literature and Languages in the United States?
Percentage of Population with a Degree in Literature and Languages in the United States is 4.4%.