North High Shoals, GA Map & Demographics
North High Shoals Map
North High Shoals Overview
$35,902
PER CAPITA INCOME
$107,679
AVG FAMILY INCOME
$95,938
AVG HOUSEHOLD INCOME
1.3%
WAGE / INCOME GAP [ % ]
98.7¢/ $1
WAGE / INCOME GAP [ $ ]
0.40
INEQUALITY / GINI INDEX
725
TOTAL POPULATION
388
MALE POPULATION
337
FEMALE POPULATION
115.13
MALES / 100 FEMALES
86.86
FEMALES / 100 MALES
41.6
MEDIAN AGE
3.1
AVG FAMILY SIZE
3.0
AVG HOUSEHOLD SIZE
362
LABOR FORCE [ PEOPLE ]
61.7%
PERCENT IN LABOR FORCE
2.8%
UNEMPLOYMENT RATE
North High Shoals Area Codes
Income in North High Shoals
Income Overview in North High Shoals
Per Capita Income in North High Shoals is $35,902, while median incomes of families and households are $107,679 and $95,938 respectively.
| Characteristic | Number | Measure |
| Per Capita Income | 725 | $35,902 |
| Median Family Income | 203 | $107,679 |
| Mean Family Income | 203 | $113,175 |
| Median Household Income | 229 | $95,938 |
| Mean Household Income | 229 | $107,375 |
| Income Deficit | 203 | $0 |
| Wage / Income Gap (%) | 725 | 1.29% |
| Wage / Income Gap ($) | 725 | 98.71¢ per $1 |
| Gini / Inequality Index | 725 | 0.40 |
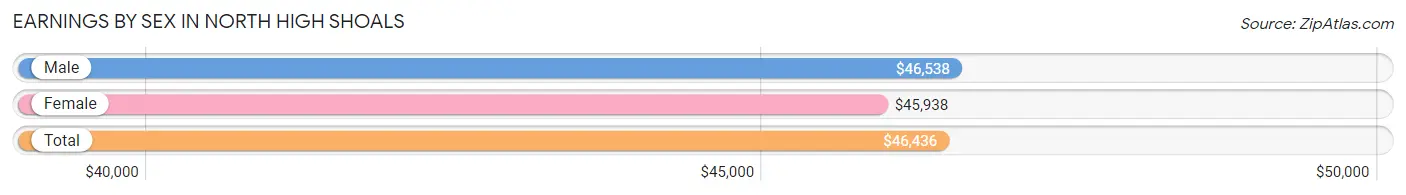
Earnings by Sex in North High Shoals
Average Earnings in North High Shoals are $46,436, $46,538 for men and $45,938 for women, a difference of 1.3%.
| Sex | Number | Average Earnings |
| Male | 266 (67.5%) | $46,538 |
| Female | 128 (32.5%) | $45,938 |
| Total | 394 (100.0%) | $46,436 |
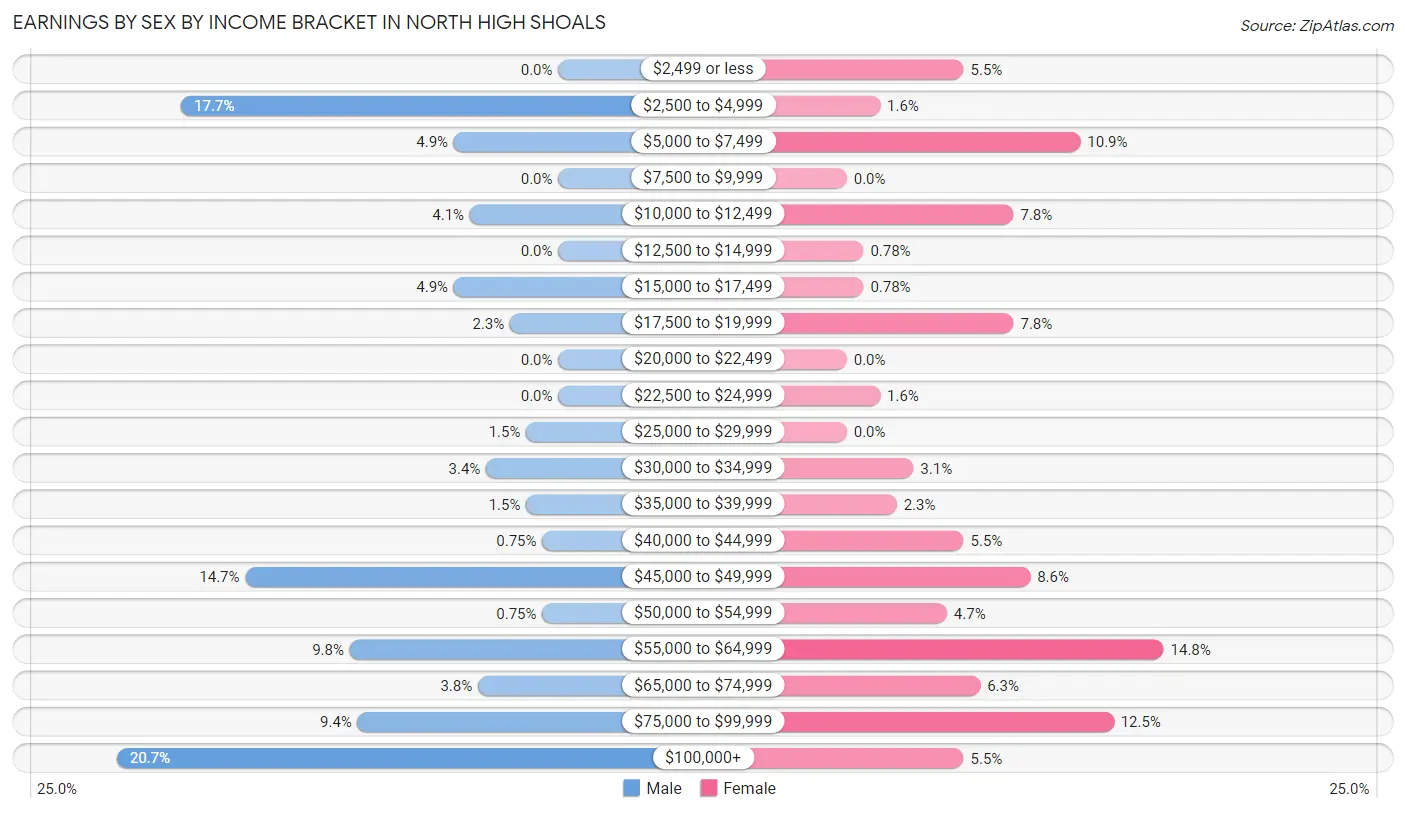
Earnings by Sex by Income Bracket in North High Shoals
The most common earnings brackets in North High Shoals are $100,000+ for men (55 | 20.7%) and $55,000 to $64,999 for women (19 | 14.8%).
| Income | Male | Female |
| $2,499 or less | 0 (0.0%) | 7 (5.5%) |
| $2,500 to $4,999 | 47 (17.7%) | 2 (1.6%) |
| $5,000 to $7,499 | 13 (4.9%) | 14 (10.9%) |
| $7,500 to $9,999 | 0 (0.0%) | 0 (0.0%) |
| $10,000 to $12,499 | 11 (4.1%) | 10 (7.8%) |
| $12,500 to $14,999 | 0 (0.0%) | 1 (0.8%) |
| $15,000 to $17,499 | 13 (4.9%) | 1 (0.8%) |
| $17,500 to $19,999 | 6 (2.3%) | 10 (7.8%) |
| $20,000 to $22,499 | 0 (0.0%) | 0 (0.0%) |
| $22,500 to $24,999 | 0 (0.0%) | 2 (1.6%) |
| $25,000 to $29,999 | 4 (1.5%) | 0 (0.0%) |
| $30,000 to $34,999 | 9 (3.4%) | 4 (3.1%) |
| $35,000 to $39,999 | 4 (1.5%) | 3 (2.3%) |
| $40,000 to $44,999 | 2 (0.7%) | 7 (5.5%) |
| $45,000 to $49,999 | 39 (14.7%) | 11 (8.6%) |
| $50,000 to $54,999 | 2 (0.7%) | 6 (4.7%) |
| $55,000 to $64,999 | 26 (9.8%) | 19 (14.8%) |
| $65,000 to $74,999 | 10 (3.8%) | 8 (6.2%) |
| $75,000 to $99,999 | 25 (9.4%) | 16 (12.5%) |
| $100,000+ | 55 (20.7%) | 7 (5.5%) |
| Total | 266 (100.0%) | 128 (100.0%) |
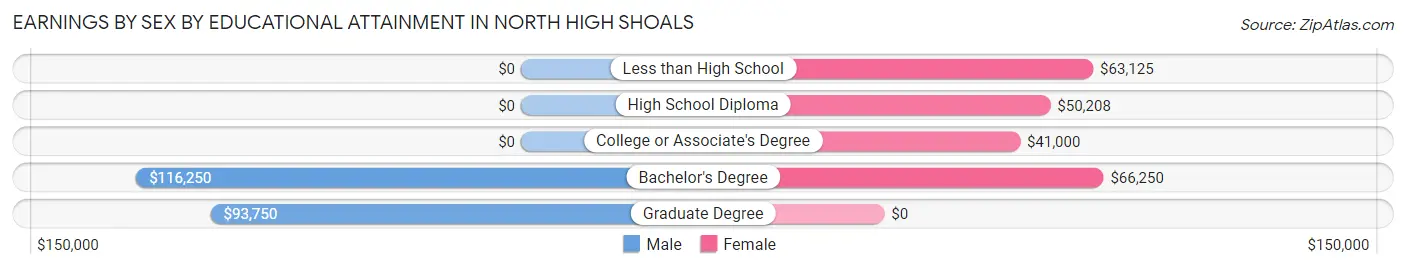
Earnings by Sex by Educational Attainment in North High Shoals
Average earnings in North High Shoals are $60,909 for men and $50,417 for women, a difference of 17.2%. Men with an educational attainment of bachelor's degree enjoy the highest average annual earnings of $116,250, while those with graduate degree education earn the least with $93,750. Women with an educational attainment of bachelor's degree earn the most with the average annual earnings of $66,250, while those with college or associate's degree education have the smallest earnings of $41,000.
| Educational Attainment | Male Income | Female Income |
| Less than High School | - | - |
| High School Diploma | - | - |
| College or Associate's Degree | - | - |
| Bachelor's Degree | $116,250 | $66,250 |
| Graduate Degree | $93,750 | $0 |
| Total | $60,909 | $50,417 |
Family Income in North High Shoals
Family Income Brackets in North High Shoals
According to the North High Shoals family income data, there are 54 families falling into the $100,000 to $149,999 income range, which is the most common income bracket and makes up 26.6% of all families.
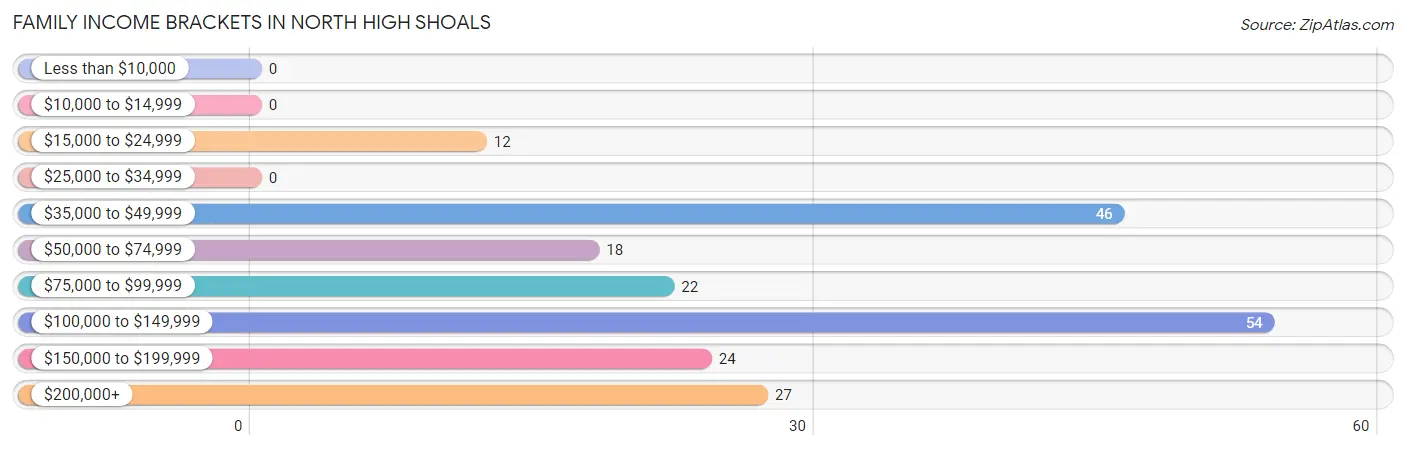
| Income Bracket | # Families | % Families |
| Less than $10,000 | 0 | 0.0% |
| $10,000 to $14,999 | 0 | 0.0% |
| $15,000 to $24,999 | 12 | 5.9% |
| $25,000 to $34,999 | 0 | 0.0% |
| $35,000 to $49,999 | 46 | 22.7% |
| $50,000 to $74,999 | 18 | 8.9% |
| $75,000 to $99,999 | 22 | 10.8% |
| $100,000 to $149,999 | 54 | 26.6% |
| $150,000 to $199,999 | 24 | 11.8% |
| $200,000+ | 27 | 13.3% |
Family Income by Famaliy Size in North High Shoals
3-person families (33 | 16.3%) account for the highest median family income in North High Shoals with $115,625 per family, while 2-person families (54 | 26.6%) have the highest median income of $38,654 per family member.
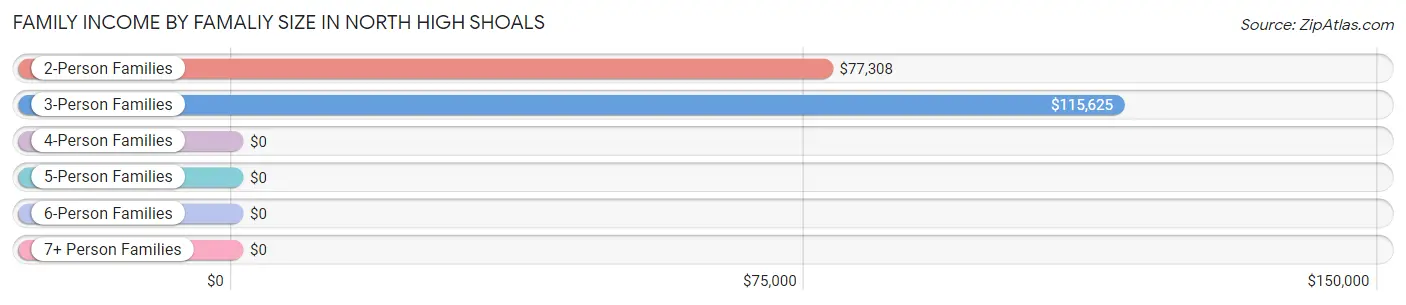
| Income Bracket | # Families | Median Income |
| 2-Person Families | 54 (26.6%) | $77,308 |
| 3-Person Families | 33 (16.3%) | $115,625 |
| 4-Person Families | 87 (42.9%) | $0 |
| 5-Person Families | 26 (12.8%) | $0 |
| 6-Person Families | 0 (0.0%) | $0 |
| 7+ Person Families | 3 (1.5%) | $0 |
| Total | 203 (100.0%) | $107,679 |
Family Income by Number of Earners in North High Shoals
The median family income in North High Shoals is $107,679, with families comprising 3+ earners (32) having the highest median family income of $139,500, while families with no earners (7) have the lowest median family income of $66,250, accounting for 15.8% and 3.5% of families, respectively.
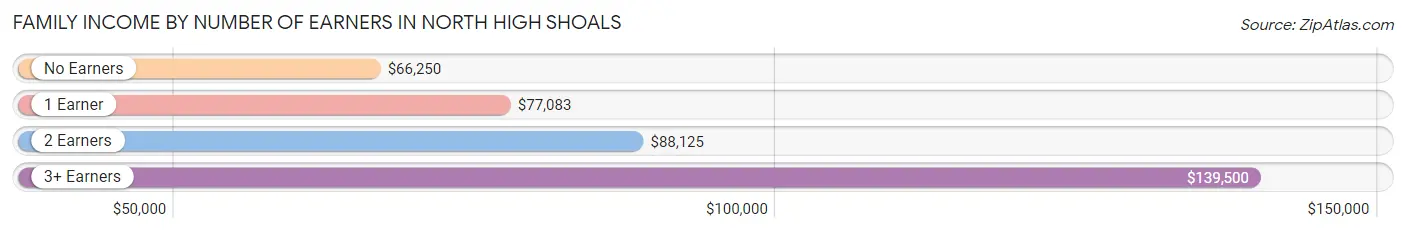
| Number of Earners | # Families | Median Income |
| No Earners | 7 (3.5%) | $66,250 |
| 1 Earner | 64 (31.5%) | $77,083 |
| 2 Earners | 100 (49.3%) | $88,125 |
| 3+ Earners | 32 (15.8%) | $139,500 |
| Total | 203 (100.0%) | $107,679 |
Household Income in North High Shoals
Household Income Brackets in North High Shoals
With 54 households falling in the category, the $100,000 to $149,999 income range is the most frequent in North High Shoals, accounting for 23.6% of all households.
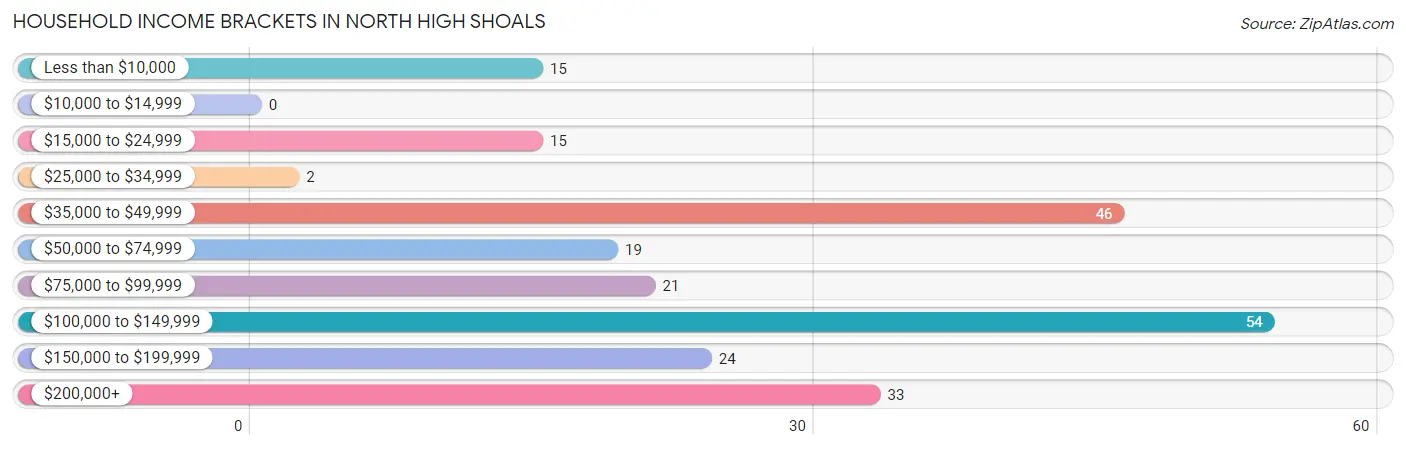
| Income Bracket | # Households | % Households |
| Less than $10,000 | 15 | 6.6% |
| $10,000 to $14,999 | 0 | 0.0% |
| $15,000 to $24,999 | 15 | 6.6% |
| $25,000 to $34,999 | 2 | 0.9% |
| $35,000 to $49,999 | 46 | 20.1% |
| $50,000 to $74,999 | 19 | 8.3% |
| $75,000 to $99,999 | 21 | 9.2% |
| $100,000 to $149,999 | 54 | 23.6% |
| $150,000 to $199,999 | 24 | 10.5% |
| $200,000+ | 33 | 14.4% |
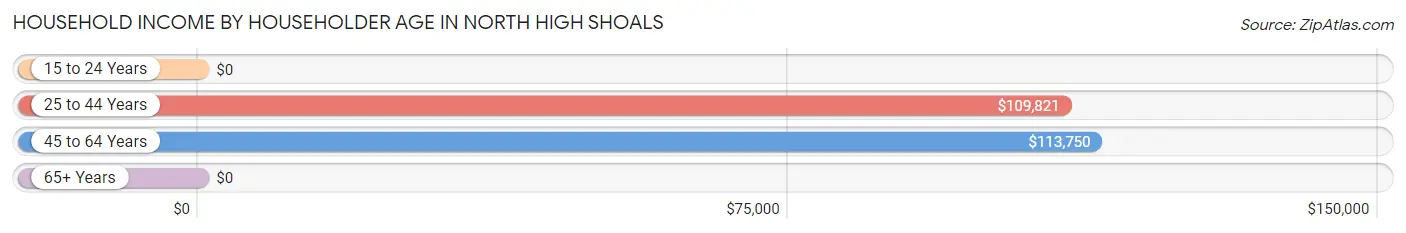
Household Income by Householder Age in North High Shoals
The median household income in North High Shoals is $95,938, with the highest median household income of $113,750 found in the 45 to 64 years age bracket for the primary householder. A total of 116 households (50.7%) fall into this category.
| Income Bracket | # Households | Median Income |
| 15 to 24 Years | 0 (0.0%) | $0 |
| 25 to 44 Years | 65 (28.4%) | $109,821 |
| 45 to 64 Years | 116 (50.7%) | $113,750 |
| 65+ Years | 48 (21.0%) | $0 |
| Total | 229 (100.0%) | $95,938 |
Poverty in North High Shoals
Income Below Poverty by Sex and Age in North High Shoals
With 8.5% poverty level for males and 9.2% for females among the residents of North High Shoals, 12 to 14 year old males and 75 year old and over females are the most vulnerable to poverty, with 11 males (37.9%) and 15 females (71.4%) in their respective age groups living below the poverty level.
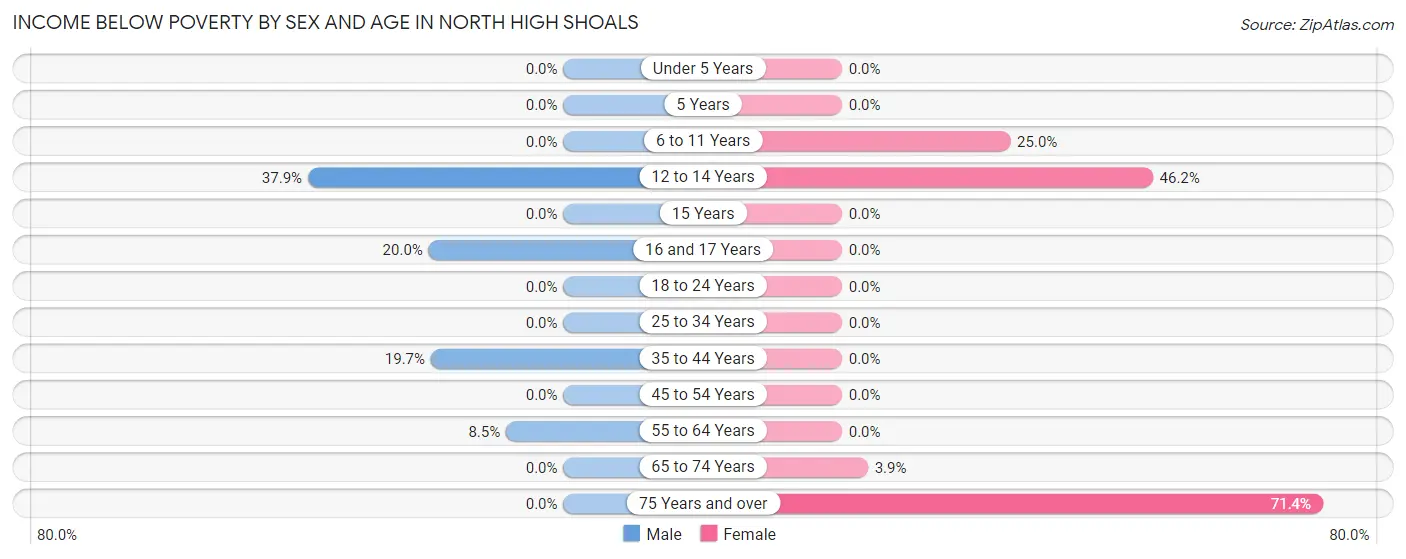
| Age Bracket | Male | Female |
| Under 5 Years | 0 (0.0%) | 0 (0.0%) |
| 5 Years | 0 (0.0%) | 0 (0.0%) |
| 6 to 11 Years | 0 (0.0%) | 6 (25.0%) |
| 12 to 14 Years | 11 (37.9%) | 6 (46.2%) |
| 15 Years | 0 (0.0%) | 0 (0.0%) |
| 16 and 17 Years | 5 (20.0%) | 0 (0.0%) |
| 18 to 24 Years | 0 (0.0%) | 0 (0.0%) |
| 25 to 34 Years | 0 (0.0%) | 0 (0.0%) |
| 35 to 44 Years | 12 (19.7%) | 0 (0.0%) |
| 45 to 54 Years | 0 (0.0%) | 0 (0.0%) |
| 55 to 64 Years | 4 (8.5%) | 0 (0.0%) |
| 65 to 74 Years | 0 (0.0%) | 1 (3.8%) |
| 75 Years and over | 0 (0.0%) | 15 (71.4%) |
| Total | 32 (8.5%) | 28 (9.2%) |
Income Above Poverty by Sex and Age in North High Shoals
According to the poverty statistics in North High Shoals, males aged under 5 years and females aged under 5 years are the age groups that are most secure financially, with 100.0% of males and 100.0% of females in these age groups living above the poverty line.
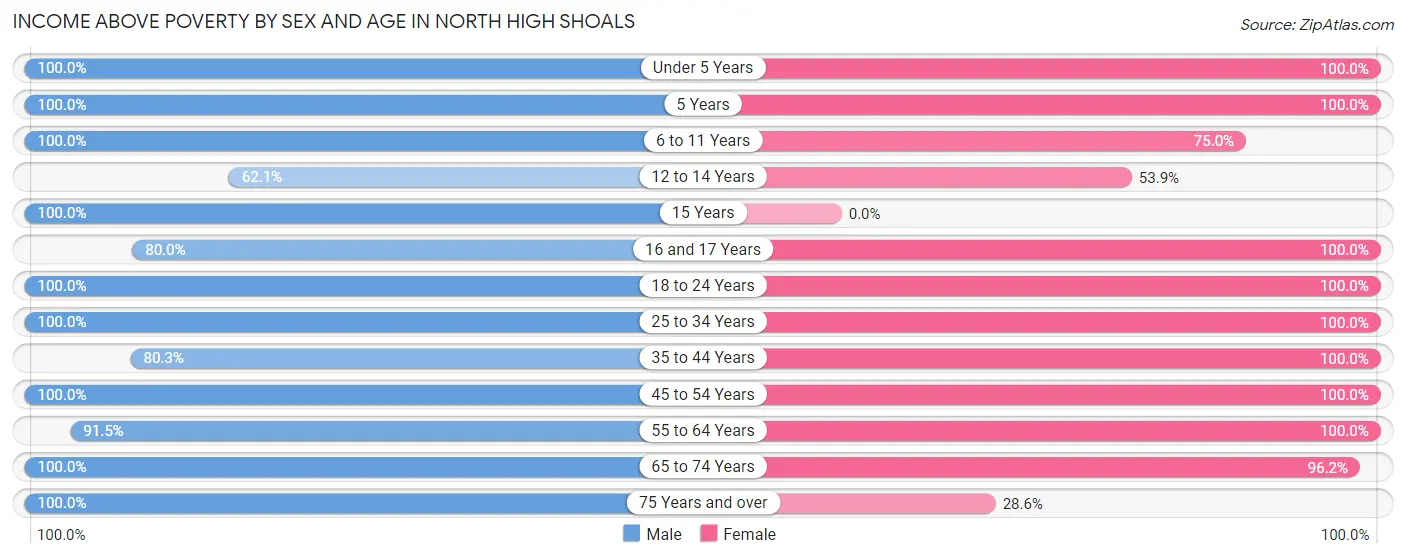
| Age Bracket | Male | Female |
| Under 5 Years | 4 (100.0%) | 14 (100.0%) |
| 5 Years | 2 (100.0%) | 7 (100.0%) |
| 6 to 11 Years | 28 (100.0%) | 18 (75.0%) |
| 12 to 14 Years | 18 (62.1%) | 7 (53.8%) |
| 15 Years | 17 (100.0%) | 0 (0.0%) |
| 16 and 17 Years | 20 (80.0%) | 27 (100.0%) |
| 18 to 24 Years | 59 (100.0%) | 33 (100.0%) |
| 25 to 34 Years | 26 (100.0%) | 14 (100.0%) |
| 35 to 44 Years | 49 (80.3%) | 40 (100.0%) |
| 45 to 54 Years | 63 (100.0%) | 52 (100.0%) |
| 55 to 64 Years | 43 (91.5%) | 32 (100.0%) |
| 65 to 74 Years | 12 (100.0%) | 25 (96.2%) |
| 75 Years and over | 3 (100.0%) | 6 (28.6%) |
| Total | 344 (91.5%) | 275 (90.8%) |
Income Below Poverty Among Married-Couple Families in North High Shoals
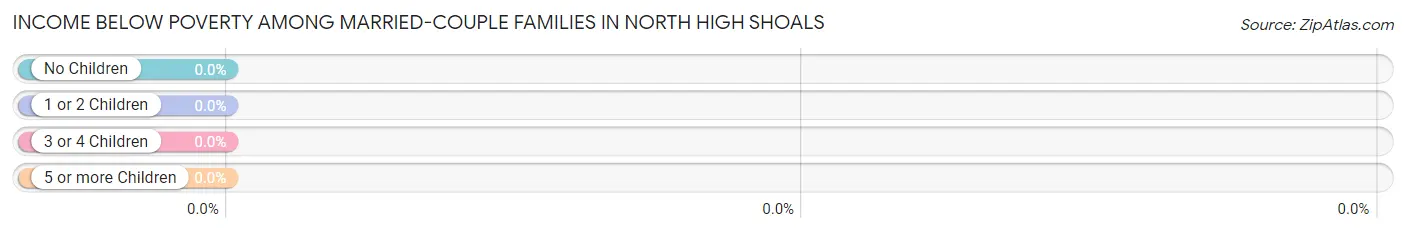
| Children | Above Poverty | Below Poverty |
| No Children | 55 (100.0%) | 0 (0.0%) |
| 1 or 2 Children | 105 (100.0%) | 0 (0.0%) |
| 3 or 4 Children | 8 (100.0%) | 0 (0.0%) |
| 5 or more Children | 3 (100.0%) | 0 (0.0%) |
| Total | 171 (100.0%) | 0 (0.0%) |
Income Below Poverty Among Single-Parent Households in North High Shoals
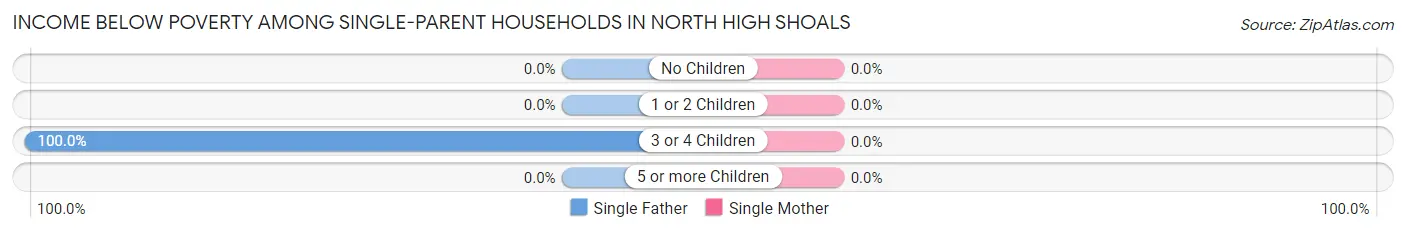
| Children | Single Father | Single Mother |
| No Children | 0 (0.0%) | 0 (0.0%) |
| 1 or 2 Children | 0 (0.0%) | 0 (0.0%) |
| 3 or 4 Children | 12 (100.0%) | 0 (0.0%) |
| 5 or more Children | 0 (0.0%) | 0 (0.0%) |
| Total | 12 (92.3%) | 0 (0.0%) |
Income Below Poverty Among Married-Couple vs Single-Parent Households in North High Shoals
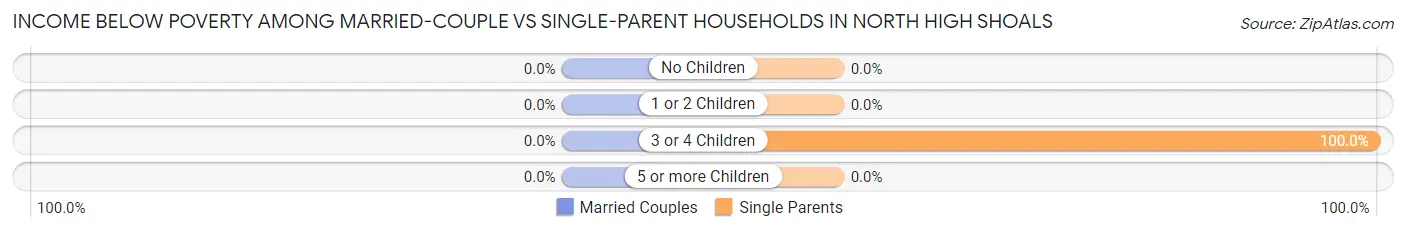
| Children | Married-Couple Families | Single-Parent Households |
| No Children | 0 (0.0%) | 0 (0.0%) |
| 1 or 2 Children | 0 (0.0%) | 0 (0.0%) |
| 3 or 4 Children | 0 (0.0%) | 12 (100.0%) |
| 5 or more Children | 0 (0.0%) | 0 (0.0%) |
| Total | 0 (0.0%) | 12 (37.5%) |
Race in North High Shoals
The most populous races in North High Shoals are White / Caucasian (529 | 73.0%), Two or more Races (157 | 21.7%), and Hispanic or Latino (105 | 14.5%).
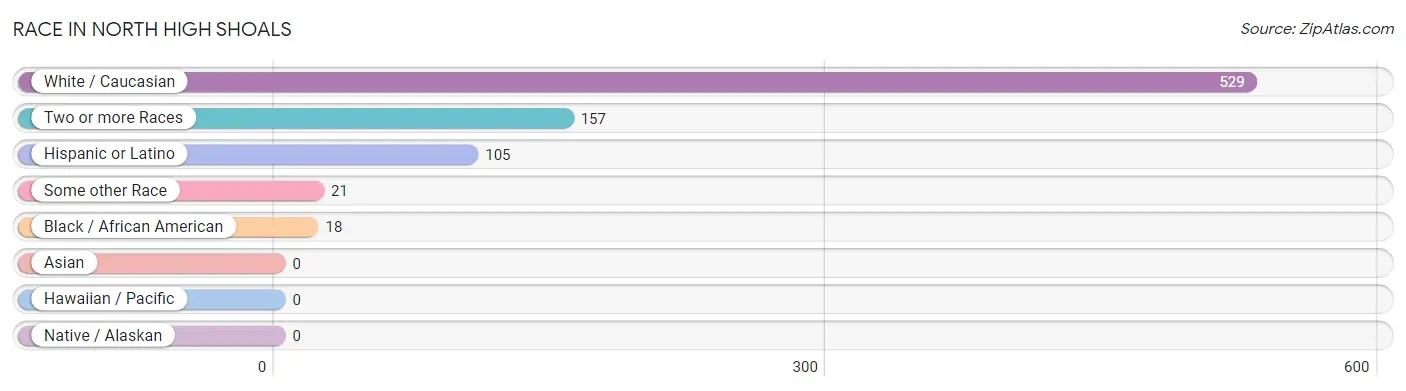
| Race | # Population | % Population |
| Asian | 0 | 0.0% |
| Black / African American | 18 | 2.5% |
| Hawaiian / Pacific | 0 | 0.0% |
| Hispanic or Latino | 105 | 14.5% |
| Native / Alaskan | 0 | 0.0% |
| White / Caucasian | 529 | 73.0% |
| Two or more Races | 157 | 21.7% |
| Some other Race | 21 | 2.9% |
| Total | 725 | 100.0% |
Ancestry in North High Shoals
The most populous ancestries reported in North High Shoals are English (115 | 15.9%), Mexican (104 | 14.3%), American (86 | 11.9%), Irish (84 | 11.6%), and German (74 | 10.2%), together accounting for 63.9% of all North High Shoals residents.
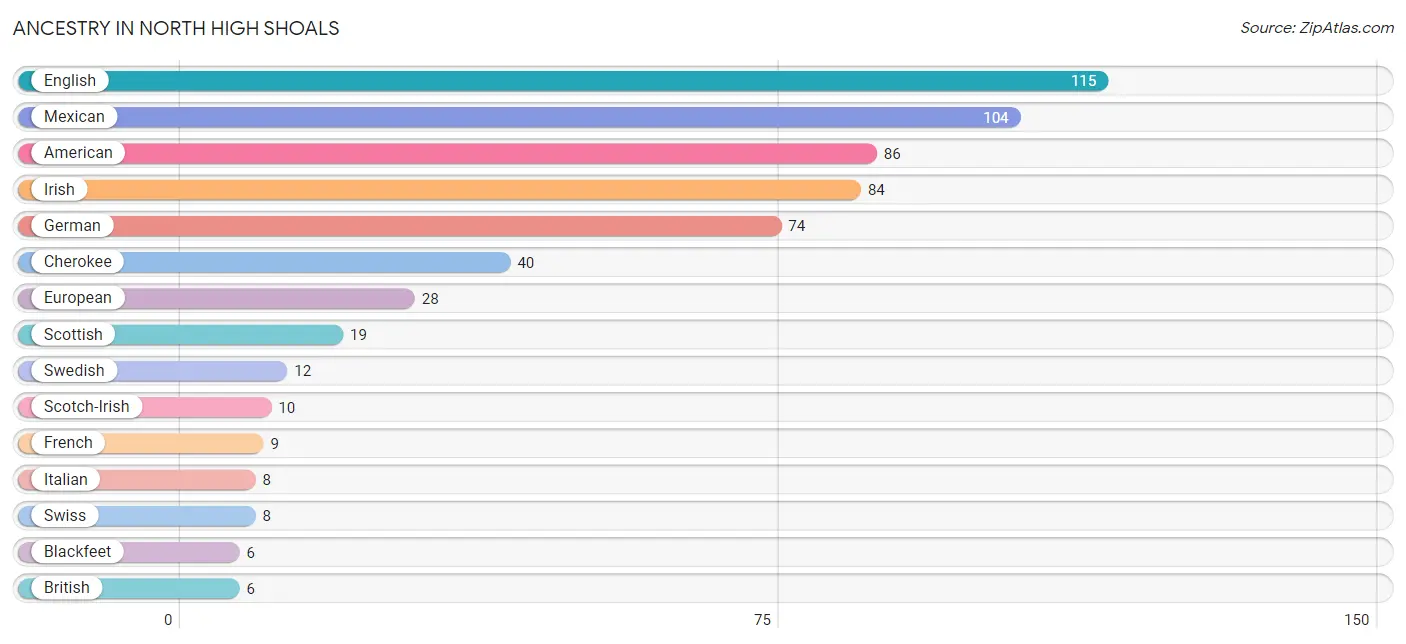
| Ancestry | # Population | % Population |
| American | 86 | 11.9% |
| Blackfeet | 6 | 0.8% |
| British | 6 | 0.8% |
| Cherokee | 40 | 5.5% |
| Dutch | 2 | 0.3% |
| Eastern European | 1 | 0.1% |
| English | 115 | 15.9% |
| European | 28 | 3.9% |
| French | 9 | 1.2% |
| German | 74 | 10.2% |
| Hungarian | 4 | 0.5% |
| Irish | 84 | 11.6% |
| Italian | 8 | 1.1% |
| Mexican | 104 | 14.3% |
| Northern European | 2 | 0.3% |
| Polish | 1 | 0.1% |
| Puerto Rican | 1 | 0.1% |
| Scandinavian | 1 | 0.1% |
| Scotch-Irish | 10 | 1.4% |
| Scottish | 19 | 2.6% |
| South African | 2 | 0.3% |
| Subsaharan African | 2 | 0.3% |
| Swedish | 12 | 1.7% |
| Swiss | 8 | 1.1% |
| Ukrainian | 6 | 0.8% | View All 25 Rows |
Immigrants in North High Shoals
The most numerous immigrant groups reported in North High Shoals came from Central America (43 | 5.9%), Latin America (43 | 5.9%), Mexico (43 | 5.9%), Europe (5 | 0.7%), and Germany (3 | 0.4%), together accounting for 18.9% of all North High Shoals residents.
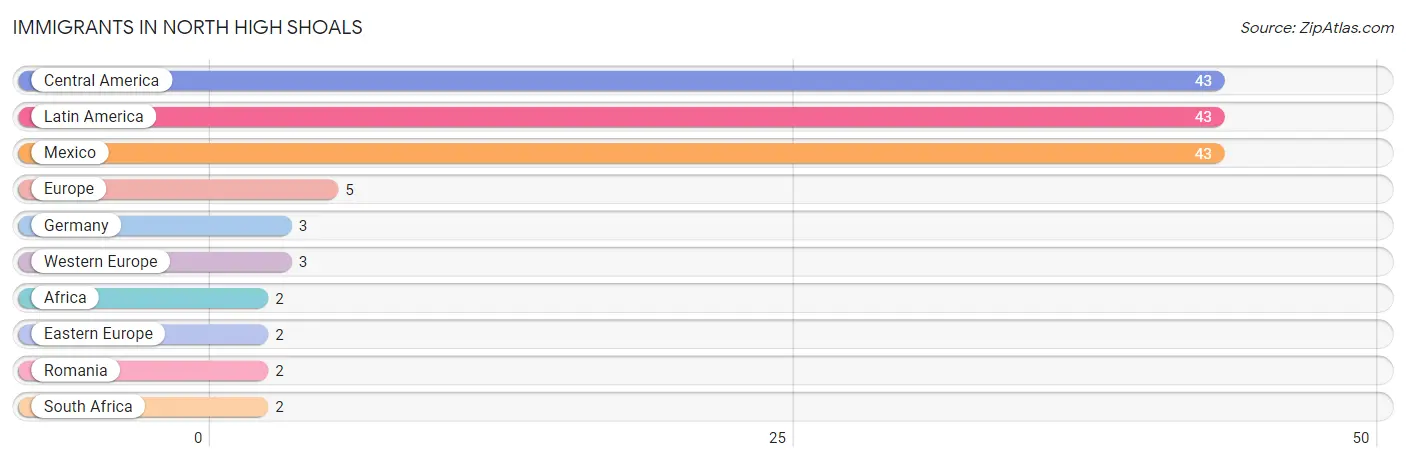
| Immigration Origin | # Population | % Population |
| Africa | 2 | 0.3% |
| Central America | 43 | 5.9% |
| Eastern Europe | 2 | 0.3% |
| Europe | 5 | 0.7% |
| Germany | 3 | 0.4% |
| Latin America | 43 | 5.9% |
| Mexico | 43 | 5.9% |
| Romania | 2 | 0.3% |
| South Africa | 2 | 0.3% |
| Western Europe | 3 | 0.4% | View All 10 Rows |
Sex and Age in North High Shoals
Sex and Age in North High Shoals
The most populous age groups in North High Shoals are 50 to 54 Years (53 | 13.7%) for men and 45 to 49 Years (39 | 11.6%) for women.
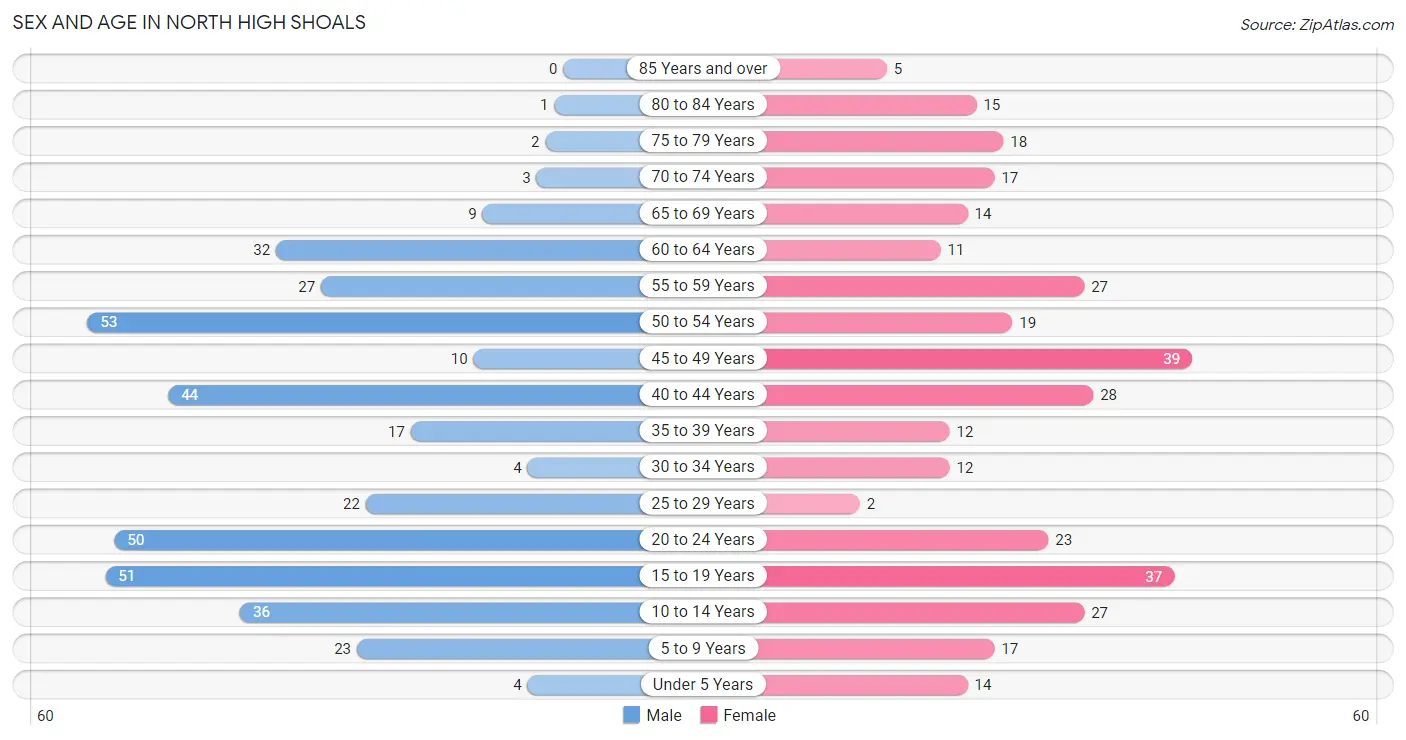
| Age Bracket | Male | Female |
| Under 5 Years | 4 (1.0%) | 14 (4.2%) |
| 5 to 9 Years | 23 (5.9%) | 17 (5.0%) |
| 10 to 14 Years | 36 (9.3%) | 27 (8.0%) |
| 15 to 19 Years | 51 (13.1%) | 37 (11.0%) |
| 20 to 24 Years | 50 (12.9%) | 23 (6.8%) |
| 25 to 29 Years | 22 (5.7%) | 2 (0.6%) |
| 30 to 34 Years | 4 (1.0%) | 12 (3.6%) |
| 35 to 39 Years | 17 (4.4%) | 12 (3.6%) |
| 40 to 44 Years | 44 (11.3%) | 28 (8.3%) |
| 45 to 49 Years | 10 (2.6%) | 39 (11.6%) |
| 50 to 54 Years | 53 (13.7%) | 19 (5.6%) |
| 55 to 59 Years | 27 (7.0%) | 27 (8.0%) |
| 60 to 64 Years | 32 (8.3%) | 11 (3.3%) |
| 65 to 69 Years | 9 (2.3%) | 14 (4.2%) |
| 70 to 74 Years | 3 (0.8%) | 17 (5.0%) |
| 75 to 79 Years | 2 (0.5%) | 18 (5.3%) |
| 80 to 84 Years | 1 (0.3%) | 15 (4.4%) |
| 85 Years and over | 0 (0.0%) | 5 (1.5%) |
| Total | 388 (100.0%) | 337 (100.0%) |
Families and Households in North High Shoals
Median Family Size in North High Shoals
The median family size in North High Shoals is 3.15 persons per family, with single male/father families (13 | 6.4%) accounting for the largest median family size of 3.31 persons per family. On the other hand, single female/mother families (19 | 9.4%) represent the smallest median family size with 2.58 persons per family.
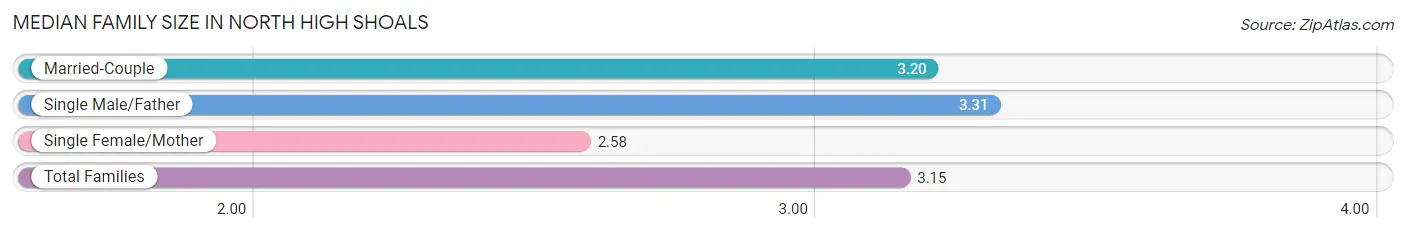
| Family Type | # Families | Family Size |
| Married-Couple | 171 (84.2%) | 3.20 |
| Single Male/Father | 13 (6.4%) | 3.31 |
| Single Female/Mother | 19 (9.4%) | 2.58 |
| Total Families | 203 (100.0%) | 3.15 |
Median Household Size in North High Shoals
The median household size in North High Shoals is 2.97 persons per household, with single male/father households (13 | 5.7%) accounting for the largest median household size of 3.31 persons per household. non-family households (26 | 11.4%) represent the smallest median household size with 1.08 persons per household.
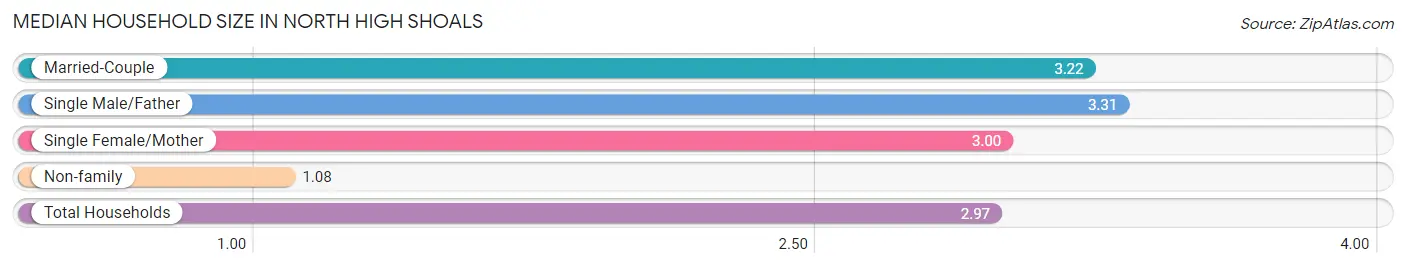
| Household Type | # Households | Household Size |
| Married-Couple | 171 (74.7%) | 3.22 |
| Single Male/Father | 13 (5.7%) | 3.31 |
| Single Female/Mother | 19 (8.3%) | 3.00 |
| Non-family | 26 (11.4%) | 1.08 |
| Total Households | 229 (100.0%) | 2.97 |
Household Size by Marriage Status in North High Shoals
Out of a total of 229 households in North High Shoals, 203 (88.6%) are family households, while 26 (11.4%) are nonfamily households. The most numerous type of family households are 4-person households, comprising 89, and the most common type of nonfamily households are 1-person households, comprising 25.
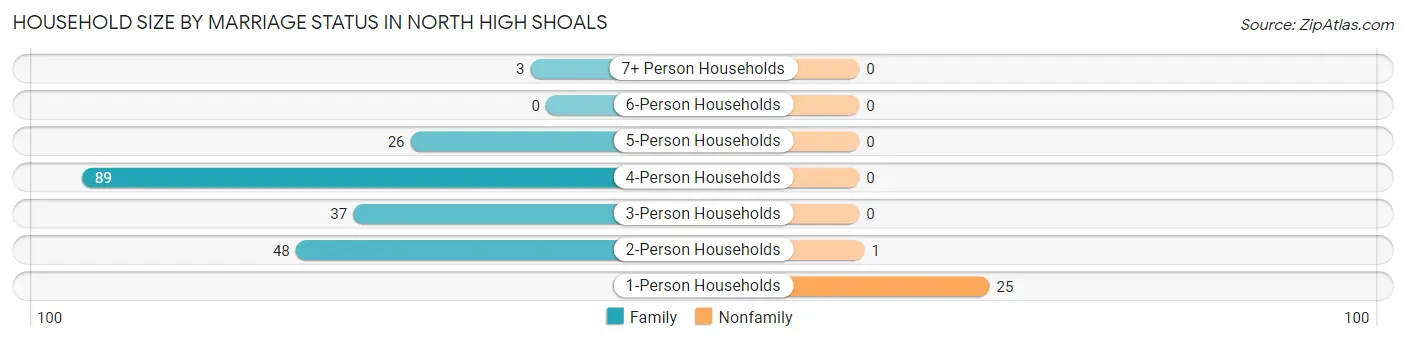
| Household Size | Family Households | Nonfamily Households |
| 1-Person Households | - | 25 (10.9%) |
| 2-Person Households | 48 (21.0%) | 1 (0.4%) |
| 3-Person Households | 37 (16.2%) | 0 (0.0%) |
| 4-Person Households | 89 (38.9%) | 0 (0.0%) |
| 5-Person Households | 26 (11.4%) | 0 (0.0%) |
| 6-Person Households | 0 (0.0%) | 0 (0.0%) |
| 7+ Person Households | 3 (1.3%) | 0 (0.0%) |
| Total | 203 (88.6%) | 26 (11.4%) |
Female Fertility in North High Shoals
Fertility by Age in North High Shoals
Average fertility rate in North High Shoals is 13.0 births per 1,000 women. Women in the age bracket of 35 to 50 years have the highest fertility rate with 25.0 births per 1,000 women. Women in the age bracket of 35 to 50 years acount for 100.0% of all women with births.
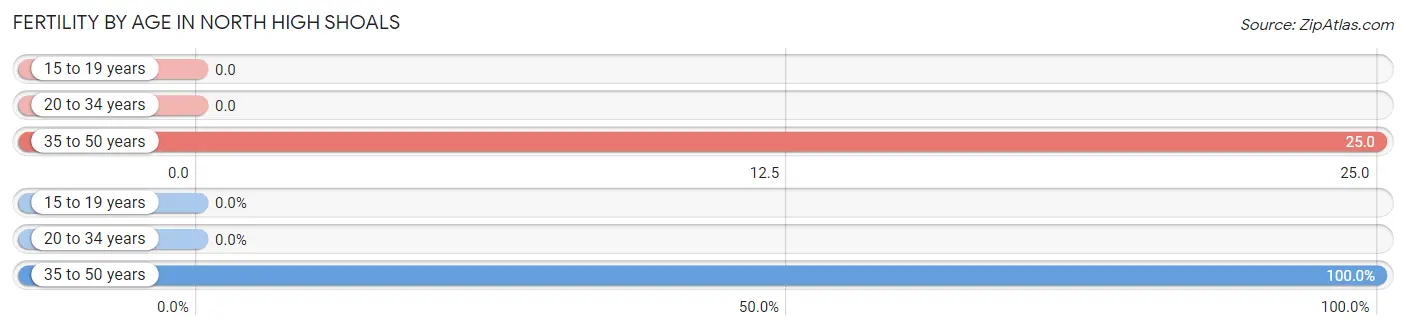
| Age Bracket | Women with Births | Births / 1,000 Women |
| 15 to 19 years | 0 (0.0%) | 0.0 |
| 20 to 34 years | 0 (0.0%) | 0.0 |
| 35 to 50 years | 2 (100.0%) | 25.0 |
| Total | 2 (100.0%) | 13.0 |
Fertility by Age by Marriage Status in North High Shoals
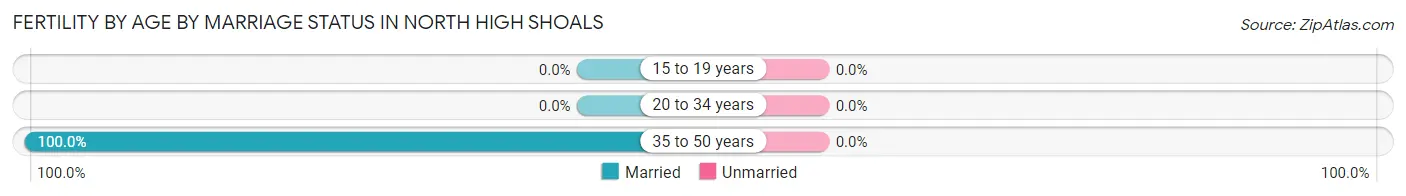
| Age Bracket | Married | Unmarried |
| 15 to 19 years | 0 (0.0%) | 0 (0.0%) |
| 20 to 34 years | 0 (0.0%) | 0 (0.0%) |
| 35 to 50 years | 2 (100.0%) | 0 (0.0%) |
| Total | 2 (100.0%) | 0 (0.0%) |
Fertility by Education in North High Shoals

| Educational Attainment | Women with Births | Births / 1,000 Women |
| Less than High School | 0 (0.0%) | 0.0 |
| High School Diploma | 0 (0.0%) | 0.0 |
| College or Associate's Degree | 0 (0.0%) | 0.0 |
| Bachelor's Degree | 0 (0.0%) | 0.0 |
| Graduate Degree | 2 (100.0%) | 91.0 |
| Total | 2 (100.0%) | 13.0 |
Fertility by Education by Marriage Status in North High Shoals
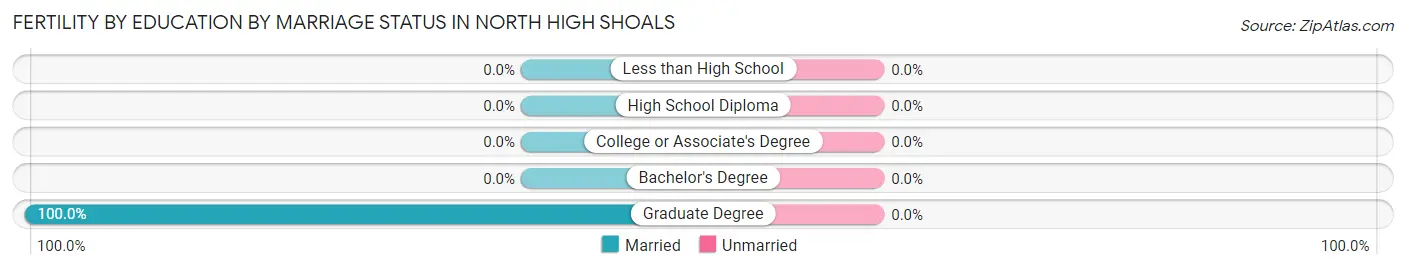
| Educational Attainment | Married | Unmarried |
| Less than High School | 0 (0.0%) | 0 (0.0%) |
| High School Diploma | 0 (0.0%) | 0 (0.0%) |
| College or Associate's Degree | 0 (0.0%) | 0 (0.0%) |
| Bachelor's Degree | 0 (0.0%) | 0 (0.0%) |
| Graduate Degree | 2 (100.0%) | 0 (0.0%) |
| Total | 2 (100.0%) | 0 (0.0%) |
Employment Characteristics in North High Shoals
Employment by Class of Employer in North High Shoals
Among the 352 employed individuals in North High Shoals, private company employees (246 | 69.9%), local government employees (35 | 9.9%), and state government employees (27 | 7.7%) make up the most common classes of employment.
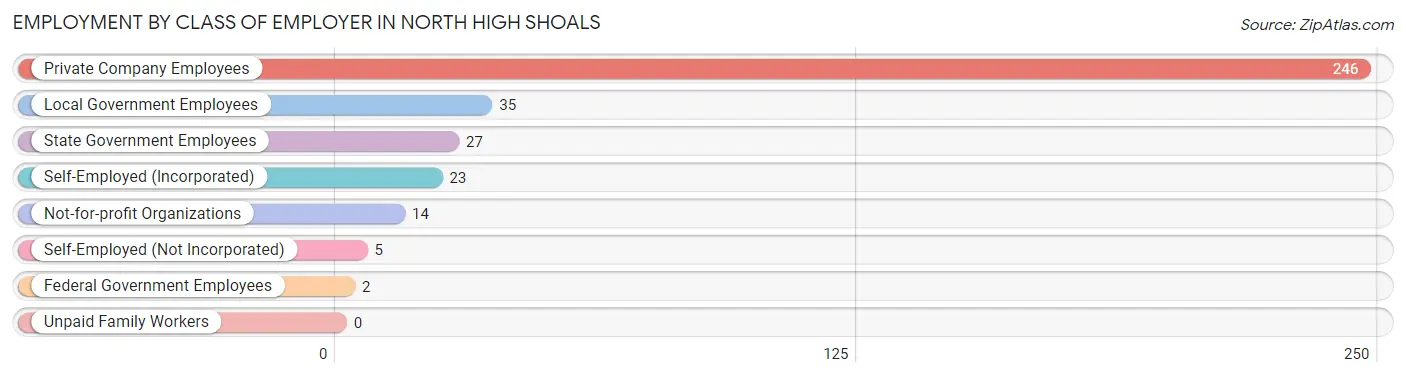
| Employer Class | # Employees | % Employees |
| Private Company Employees | 246 | 69.9% |
| Self-Employed (Incorporated) | 23 | 6.5% |
| Self-Employed (Not Incorporated) | 5 | 1.4% |
| Not-for-profit Organizations | 14 | 4.0% |
| Local Government Employees | 35 | 9.9% |
| State Government Employees | 27 | 7.7% |
| Federal Government Employees | 2 | 0.6% |
| Unpaid Family Workers | 0 | 0.0% |
| Total | 352 | 100.0% |
Employment Status by Age in North High Shoals
According to the labor force statistics for North High Shoals, out of the total population over 16 years of age (587), 61.7% or 362 individuals are in the labor force, with 2.8% or 10 of them unemployed. The age group with the highest labor force participation rate is 25 to 29 years, with 100.0% or 24 individuals in the labor force. Within the labor force, the 20 to 24 years age range has the highest percentage of unemployed individuals, with 12.9% or 9 of them being unemployed.
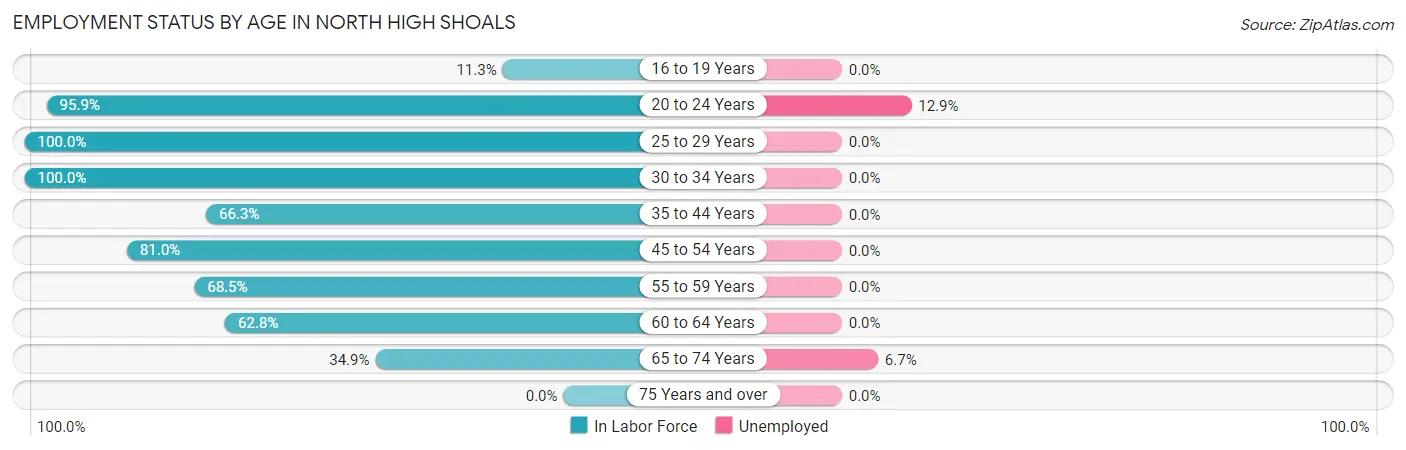
| Age Bracket | In Labor Force | Unemployed |
| 16 to 19 Years | 8 (11.3%) | 0 (0.0%) |
| 20 to 24 Years | 70 (95.9%) | 9 (12.9%) |
| 25 to 29 Years | 24 (100.0%) | 0 (0.0%) |
| 30 to 34 Years | 16 (100.0%) | 0 (0.0%) |
| 35 to 44 Years | 67 (66.3%) | 0 (0.0%) |
| 45 to 54 Years | 98 (81.0%) | 0 (0.0%) |
| 55 to 59 Years | 37 (68.5%) | 0 (0.0%) |
| 60 to 64 Years | 27 (62.8%) | 0 (0.0%) |
| 65 to 74 Years | 15 (34.9%) | 1 (6.7%) |
| 75 Years and over | 0 (0.0%) | 0 (0.0%) |
| Total | 362 (61.7%) | 10 (2.8%) |
Employment Status by Educational Attainment in North High Shoals
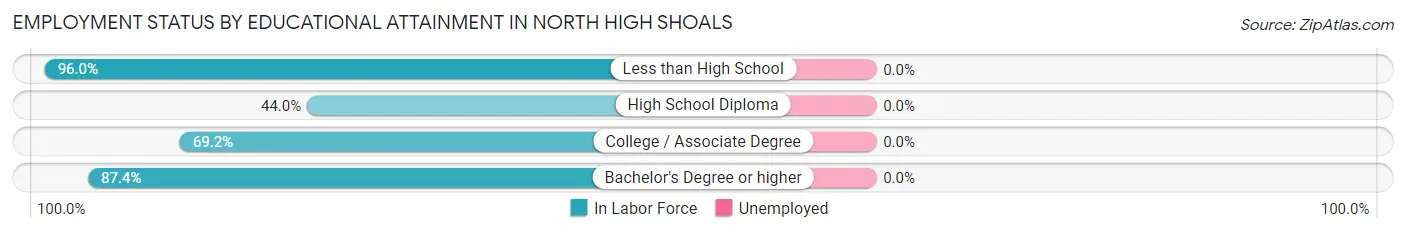
| Educational Attainment | In Labor Force | Unemployed |
| Less than High School | 48 (96.0%) | 0 (0.0%) |
| High School Diploma | 33 (44.0%) | 0 (0.0%) |
| College / Associate Degree | 63 (69.2%) | 0 (0.0%) |
| Bachelor's Degree or higher | 125 (87.4%) | 0 (0.0%) |
| Total | 269 (74.9%) | 0 (0.0%) |
Employment Occupations by Sex in North High Shoals
Management, Business, Science and Arts Occupations
The most common Management, Business, Science and Arts occupations in North High Shoals are Community & Social Service (44 | 12.5%), Management (43 | 12.2%), Business & Financial (29 | 8.2%), Education Instruction & Library (28 | 8.0%), and Health Diagnosing & Treating (18 | 5.1%).
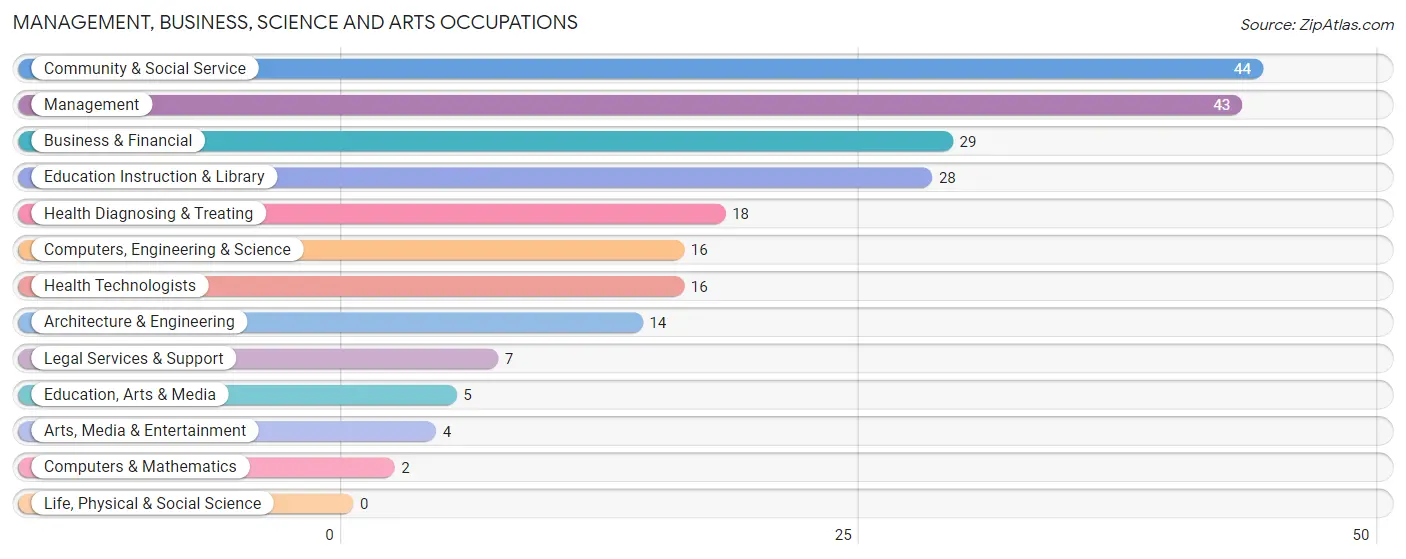
Management, Business, Science and Arts Occupations by Sex
Within the Management, Business, Science and Arts occupations in North High Shoals, the most male-oriented occupations are Architecture & Engineering (100.0%), Computers, Engineering & Science (87.5%), and Management (81.4%), while the most female-oriented occupations are Computers & Mathematics (100.0%), Legal Services & Support (100.0%), and Education Instruction & Library (64.3%).
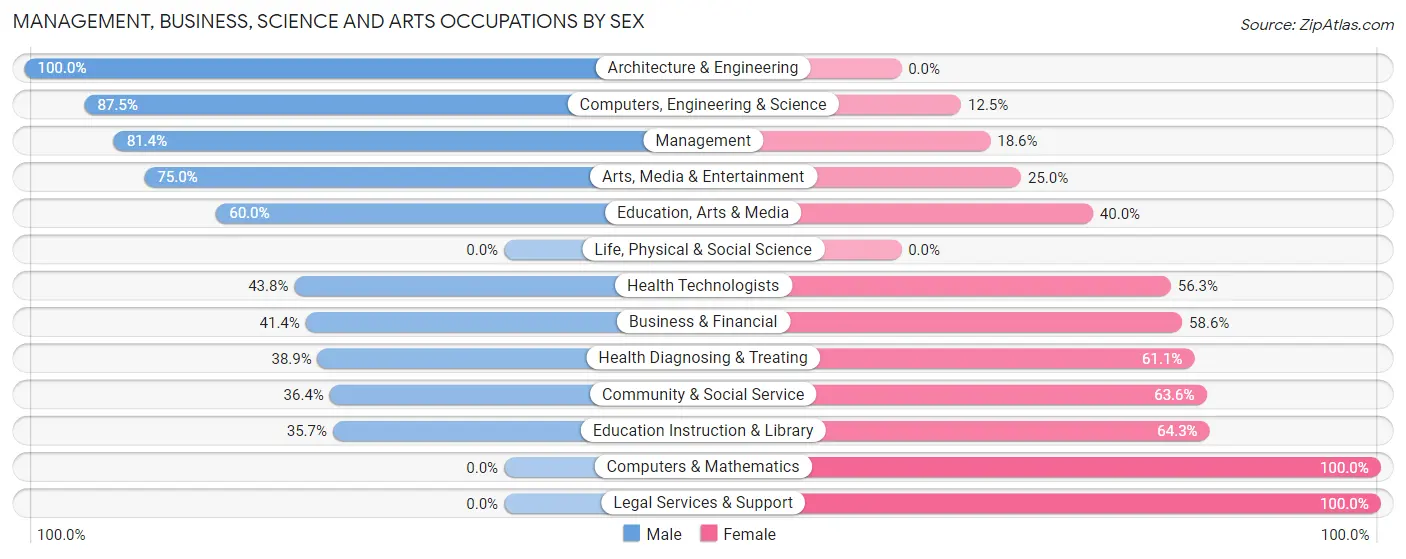
| Occupation | Male | Female |
| Management | 35 (81.4%) | 8 (18.6%) |
| Business & Financial | 12 (41.4%) | 17 (58.6%) |
| Computers, Engineering & Science | 14 (87.5%) | 2 (12.5%) |
| Computers & Mathematics | 0 (0.0%) | 2 (100.0%) |
| Architecture & Engineering | 14 (100.0%) | 0 (0.0%) |
| Life, Physical & Social Science | 0 (0.0%) | 0 (0.0%) |
| Community & Social Service | 16 (36.4%) | 28 (63.6%) |
| Education, Arts & Media | 3 (60.0%) | 2 (40.0%) |
| Legal Services & Support | 0 (0.0%) | 7 (100.0%) |
| Education Instruction & Library | 10 (35.7%) | 18 (64.3%) |
| Arts, Media & Entertainment | 3 (75.0%) | 1 (25.0%) |
| Health Diagnosing & Treating | 7 (38.9%) | 11 (61.1%) |
| Health Technologists | 7 (43.8%) | 9 (56.2%) |
| Total (Category) | 84 (56.0%) | 66 (44.0%) |
| Total (Overall) | 234 (66.5%) | 118 (33.5%) |
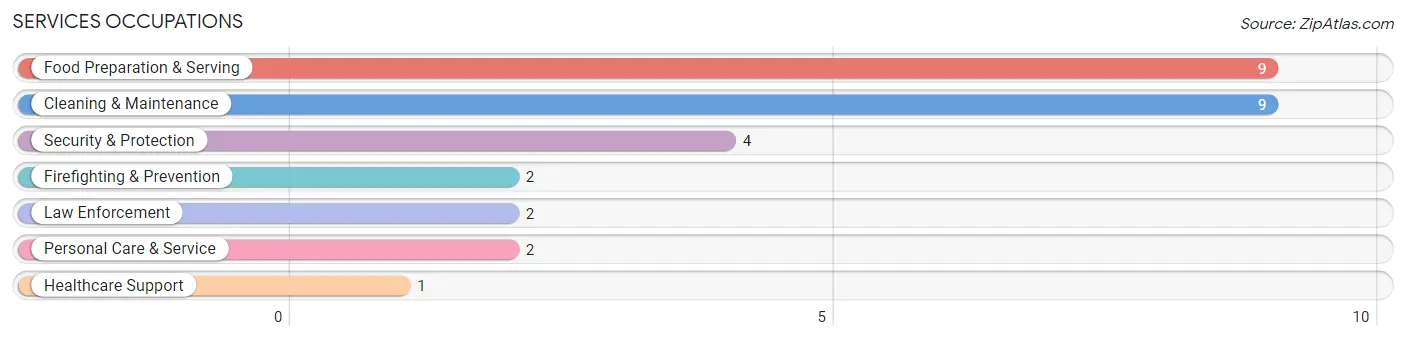
Services Occupations
The most common Services occupations in North High Shoals are Food Preparation & Serving (9 | 2.6%), Cleaning & Maintenance (9 | 2.6%), Security & Protection (4 | 1.1%), Firefighting & Prevention (2 | 0.6%), and Law Enforcement (2 | 0.6%).
Services Occupations by Sex
Within the Services occupations in North High Shoals, the most male-oriented occupations are Security & Protection (100.0%), Firefighting & Prevention (100.0%), and Law Enforcement (100.0%), while the most female-oriented occupations are Healthcare Support (100.0%), Personal Care & Service (100.0%), and Food Preparation & Serving (33.3%).
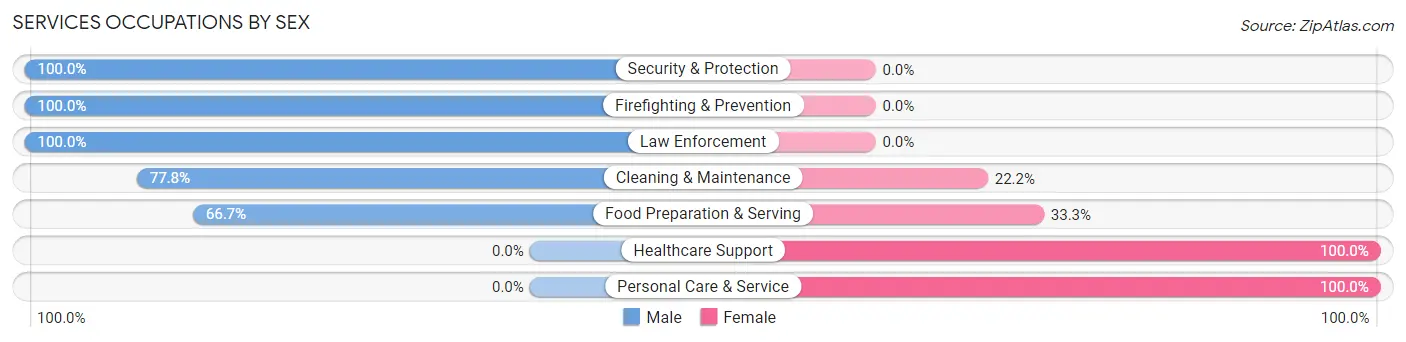
| Occupation | Male | Female |
| Healthcare Support | 0 (0.0%) | 1 (100.0%) |
| Security & Protection | 4 (100.0%) | 0 (0.0%) |
| Firefighting & Prevention | 2 (100.0%) | 0 (0.0%) |
| Law Enforcement | 2 (100.0%) | 0 (0.0%) |
| Food Preparation & Serving | 6 (66.7%) | 3 (33.3%) |
| Cleaning & Maintenance | 7 (77.8%) | 2 (22.2%) |
| Personal Care & Service | 0 (0.0%) | 2 (100.0%) |
| Total (Category) | 17 (68.0%) | 8 (32.0%) |
| Total (Overall) | 234 (66.5%) | 118 (33.5%) |
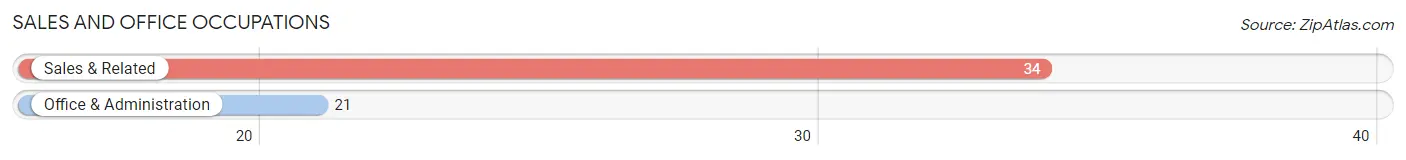
Sales and Office Occupations
The most common Sales and Office occupations in North High Shoals are Sales & Related (34 | 9.7%), and Office & Administration (21 | 6.0%).
Sales and Office Occupations by Sex
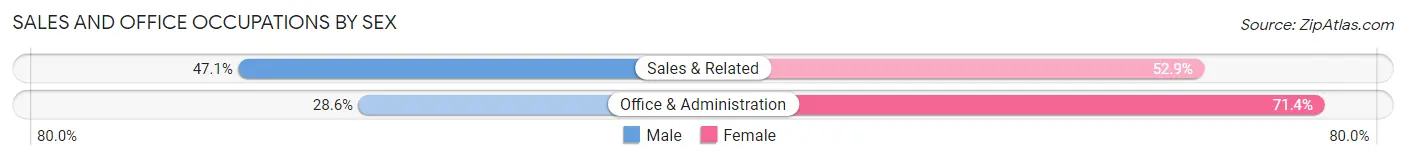
| Occupation | Male | Female |
| Sales & Related | 16 (47.1%) | 18 (52.9%) |
| Office & Administration | 6 (28.6%) | 15 (71.4%) |
| Total (Category) | 22 (40.0%) | 33 (60.0%) |
| Total (Overall) | 234 (66.5%) | 118 (33.5%) |
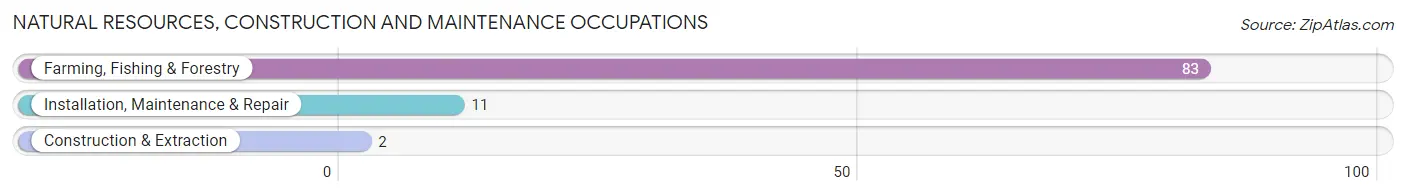
Natural Resources, Construction and Maintenance Occupations
The most common Natural Resources, Construction and Maintenance occupations in North High Shoals are Farming, Fishing & Forestry (83 | 23.6%), Installation, Maintenance & Repair (11 | 3.1%), and Construction & Extraction (2 | 0.6%).
Natural Resources, Construction and Maintenance Occupations by Sex
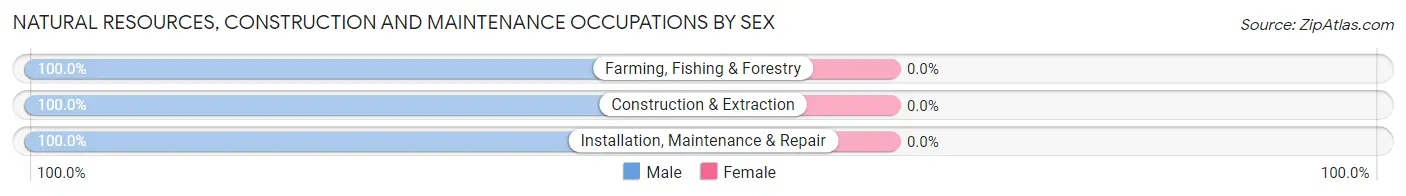
| Occupation | Male | Female |
| Farming, Fishing & Forestry | 83 (100.0%) | 0 (0.0%) |
| Construction & Extraction | 2 (100.0%) | 0 (0.0%) |
| Installation, Maintenance & Repair | 11 (100.0%) | 0 (0.0%) |
| Total (Category) | 96 (100.0%) | 0 (0.0%) |
| Total (Overall) | 234 (66.5%) | 118 (33.5%) |
Production, Transportation and Moving Occupations
The most common Production, Transportation and Moving occupations in North High Shoals are Production (17 | 4.8%), Transportation (7 | 2.0%), and Material Moving (2 | 0.6%).
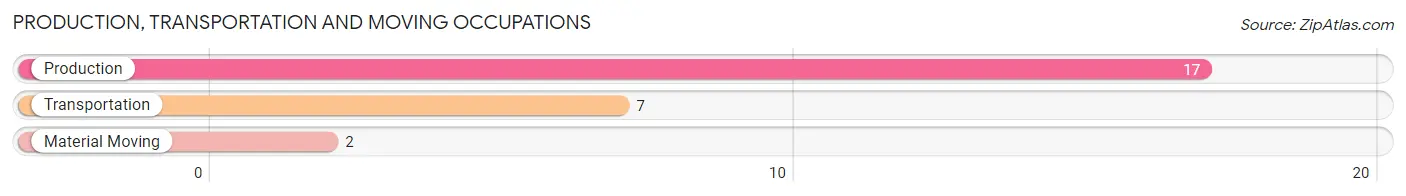
Production, Transportation and Moving Occupations by Sex
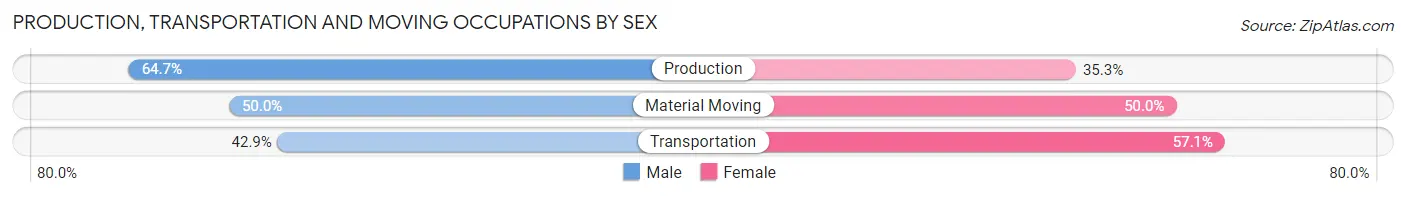
| Occupation | Male | Female |
| Production | 11 (64.7%) | 6 (35.3%) |
| Transportation | 3 (42.9%) | 4 (57.1%) |
| Material Moving | 1 (50.0%) | 1 (50.0%) |
| Total (Category) | 15 (57.7%) | 11 (42.3%) |
| Total (Overall) | 234 (66.5%) | 118 (33.5%) |
Employment Industries by Sex in North High Shoals
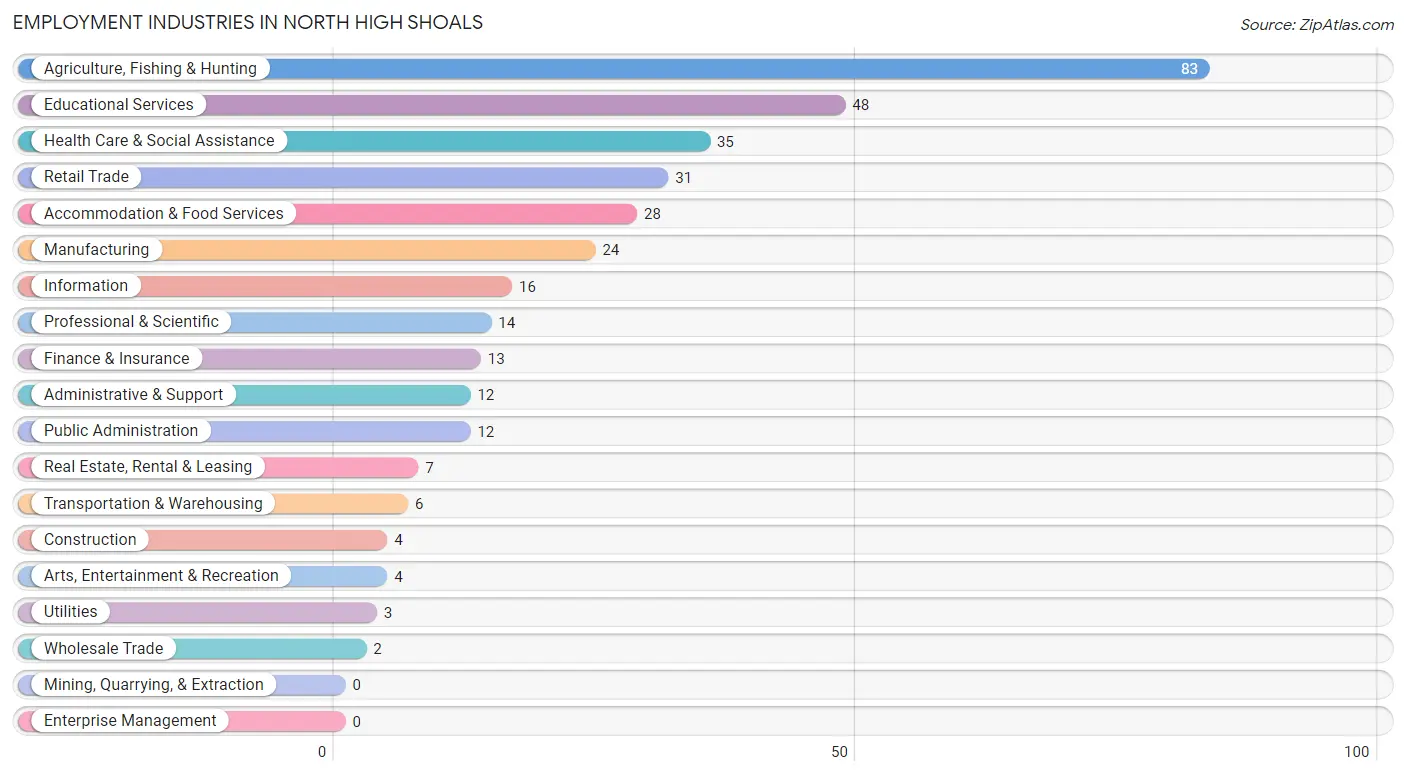
Employment Industries in North High Shoals
The major employment industries in North High Shoals include Agriculture, Fishing & Hunting (83 | 23.6%), Educational Services (48 | 13.6%), Health Care & Social Assistance (35 | 9.9%), Retail Trade (31 | 8.8%), and Accommodation & Food Services (28 | 8.0%).
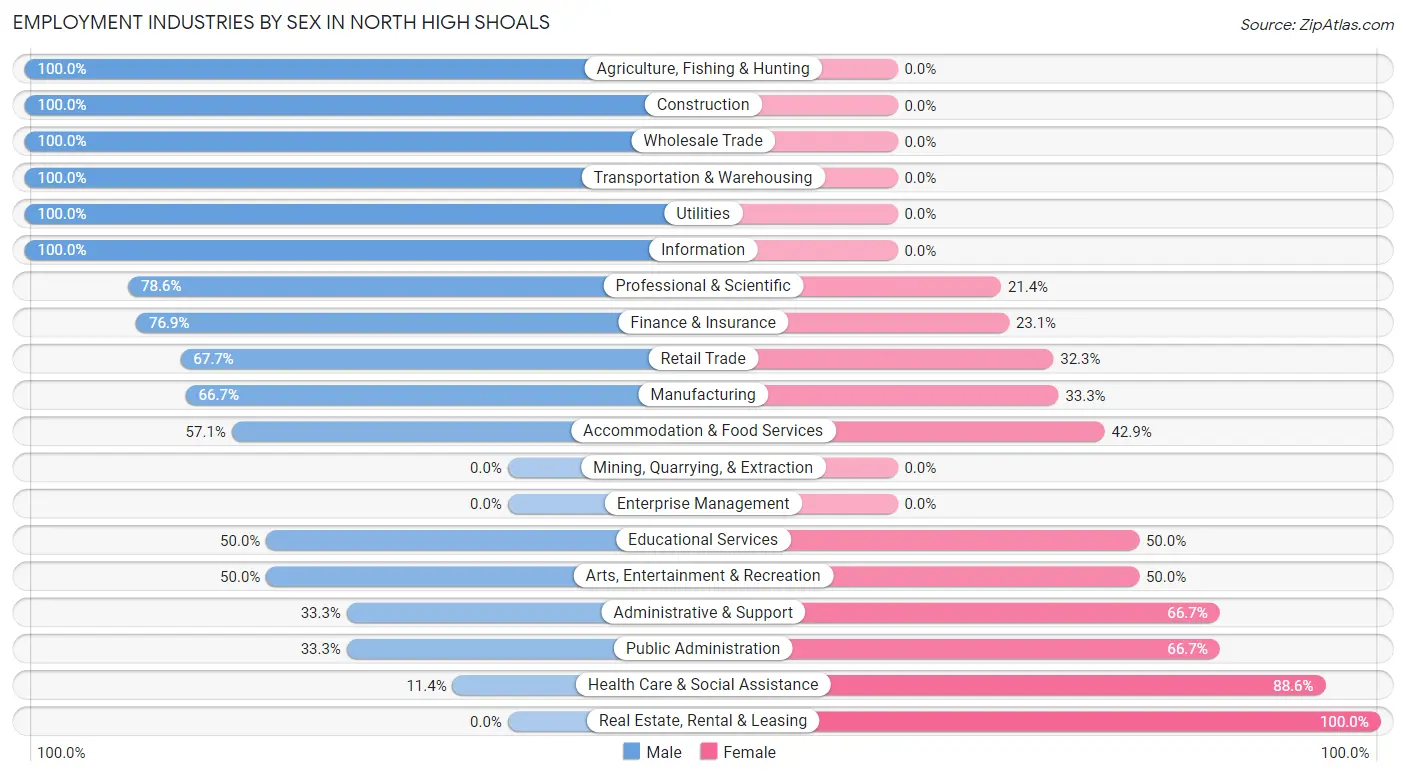
Employment Industries by Sex in North High Shoals
The North High Shoals industries that see more men than women are Agriculture, Fishing & Hunting (100.0%), Construction (100.0%), and Wholesale Trade (100.0%), whereas the industries that tend to have a higher number of women are Real Estate, Rental & Leasing (100.0%), Health Care & Social Assistance (88.6%), and Administrative & Support (66.7%).
| Industry | Male | Female |
| Agriculture, Fishing & Hunting | 83 (100.0%) | 0 (0.0%) |
| Mining, Quarrying, & Extraction | 0 (0.0%) | 0 (0.0%) |
| Construction | 4 (100.0%) | 0 (0.0%) |
| Manufacturing | 16 (66.7%) | 8 (33.3%) |
| Wholesale Trade | 2 (100.0%) | 0 (0.0%) |
| Retail Trade | 21 (67.7%) | 10 (32.3%) |
| Transportation & Warehousing | 6 (100.0%) | 0 (0.0%) |
| Utilities | 3 (100.0%) | 0 (0.0%) |
| Information | 16 (100.0%) | 0 (0.0%) |
| Finance & Insurance | 10 (76.9%) | 3 (23.1%) |
| Real Estate, Rental & Leasing | 0 (0.0%) | 7 (100.0%) |
| Professional & Scientific | 11 (78.6%) | 3 (21.4%) |
| Enterprise Management | 0 (0.0%) | 0 (0.0%) |
| Administrative & Support | 4 (33.3%) | 8 (66.7%) |
| Educational Services | 24 (50.0%) | 24 (50.0%) |
| Health Care & Social Assistance | 4 (11.4%) | 31 (88.6%) |
| Arts, Entertainment & Recreation | 2 (50.0%) | 2 (50.0%) |
| Accommodation & Food Services | 16 (57.1%) | 12 (42.9%) |
| Public Administration | 4 (33.3%) | 8 (66.7%) |
| Total | 234 (66.5%) | 118 (33.5%) |
Education in North High Shoals
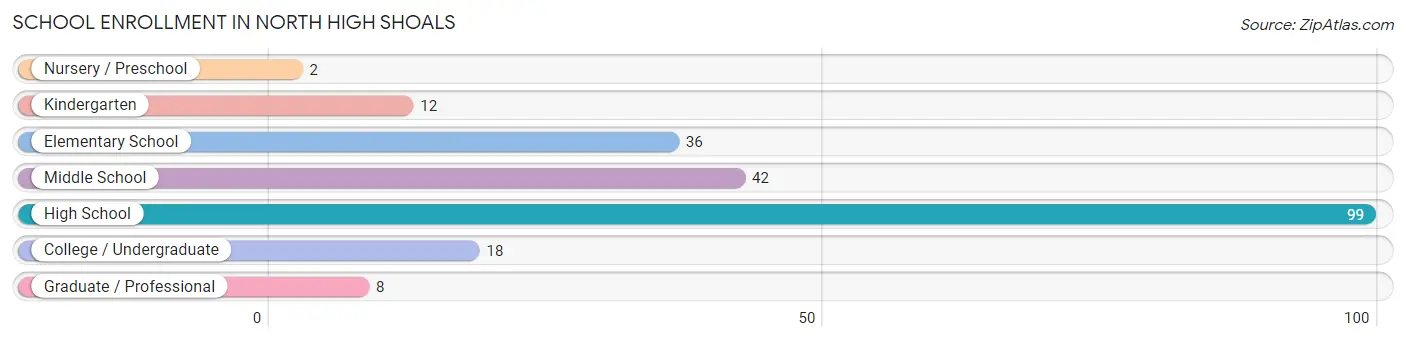
School Enrollment in North High Shoals
The most common levels of schooling among the 217 students in North High Shoals are high school (99 | 45.6%), middle school (42 | 19.4%), and elementary school (36 | 16.6%).
| School Level | # Students | % Students |
| Nursery / Preschool | 2 | 0.9% |
| Kindergarten | 12 | 5.5% |
| Elementary School | 36 | 16.6% |
| Middle School | 42 | 19.4% |
| High School | 99 | 45.6% |
| College / Undergraduate | 18 | 8.3% |
| Graduate / Professional | 8 | 3.7% |
| Total | 217 | 100.0% |
School Enrollment by Age by Funding Source in North High Shoals
Out of a total of 217 students who are enrolled in schools in North High Shoals, 15 (6.9%) attend a private institution, while the remaining 202 (93.1%) are enrolled in public schools. The age group of 3 to 4 year olds has the highest likelihood of being enrolled in private schools, with 2 (100.0% in the age bracket) enrolled. Conversely, the age group of 5 to 9 year old has the lowest likelihood of being enrolled in a private school, with 38 (100.0% in the age bracket) attending a public institution.
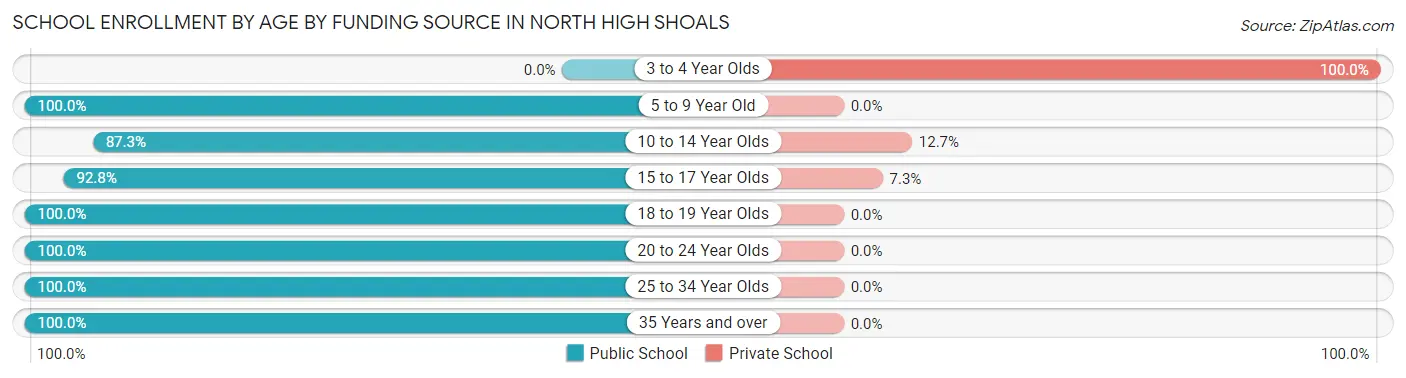
| Age Bracket | Public School | Private School |
| 3 to 4 Year Olds | 0 (0.0%) | 2 (100.0%) |
| 5 to 9 Year Old | 38 (100.0%) | 0 (0.0%) |
| 10 to 14 Year Olds | 55 (87.3%) | 8 (12.7%) |
| 15 to 17 Year Olds | 64 (92.7%) | 5 (7.2%) |
| 18 to 19 Year Olds | 19 (100.0%) | 0 (0.0%) |
| 20 to 24 Year Olds | 15 (100.0%) | 0 (0.0%) |
| 25 to 34 Year Olds | 4 (100.0%) | 0 (0.0%) |
| 35 Years and over | 7 (100.0%) | 0 (0.0%) |
| Total | 202 (93.1%) | 15 (6.9%) |
Educational Attainment by Field of Study in North High Shoals
Business (40 | 23.8%), education (38 | 22.6%), arts & humanities (17 | 10.1%), bio, nature & agricultural (16 | 9.5%), and science & technology (15 | 8.9%) are the most common fields of study among 168 individuals in North High Shoals who have obtained a bachelor's degree or higher.
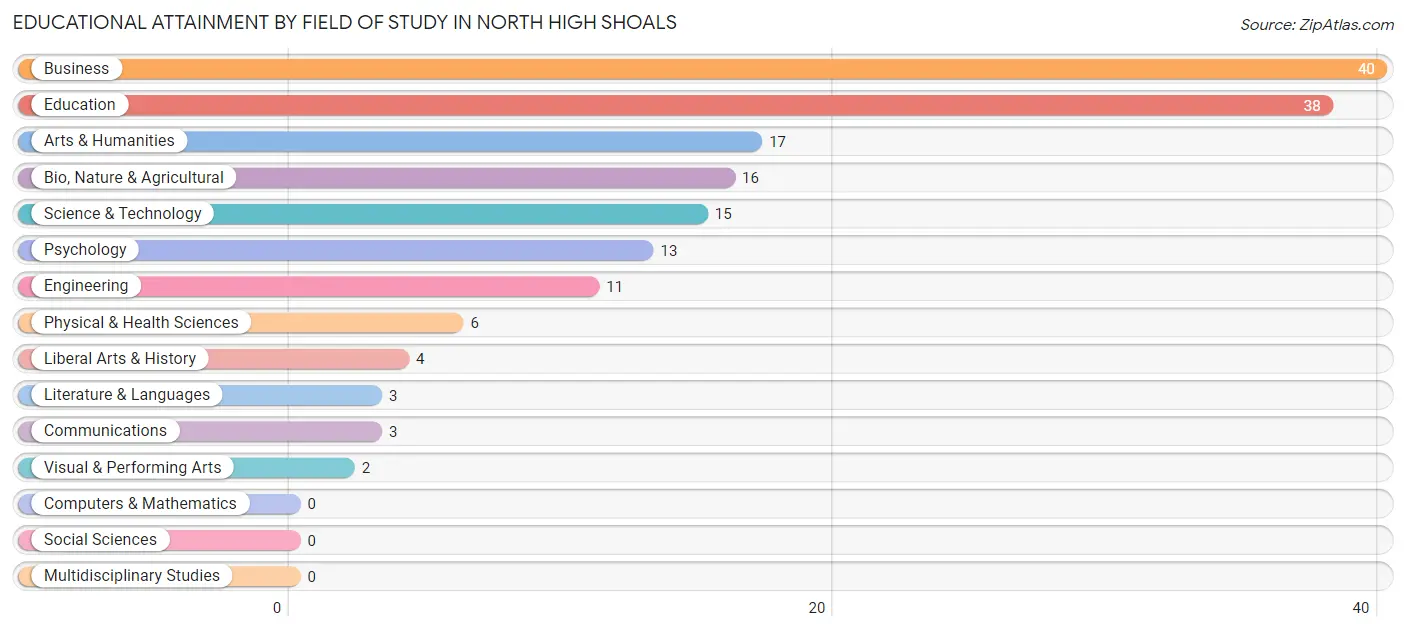
| Field of Study | # Graduates | % Graduates |
| Computers & Mathematics | 0 | 0.0% |
| Bio, Nature & Agricultural | 16 | 9.5% |
| Physical & Health Sciences | 6 | 3.6% |
| Psychology | 13 | 7.7% |
| Social Sciences | 0 | 0.0% |
| Engineering | 11 | 6.6% |
| Multidisciplinary Studies | 0 | 0.0% |
| Science & Technology | 15 | 8.9% |
| Business | 40 | 23.8% |
| Education | 38 | 22.6% |
| Literature & Languages | 3 | 1.8% |
| Liberal Arts & History | 4 | 2.4% |
| Visual & Performing Arts | 2 | 1.2% |
| Communications | 3 | 1.8% |
| Arts & Humanities | 17 | 10.1% |
| Total | 168 | 100.0% |
Transportation & Commute in North High Shoals
Vehicle Availability by Sex in North High Shoals
The most prevalent vehicle ownership categories in North High Shoals are males with 4 vehicles (113, accounting for 48.3%) and females with 4 vehicles (23, making up 95.8%).
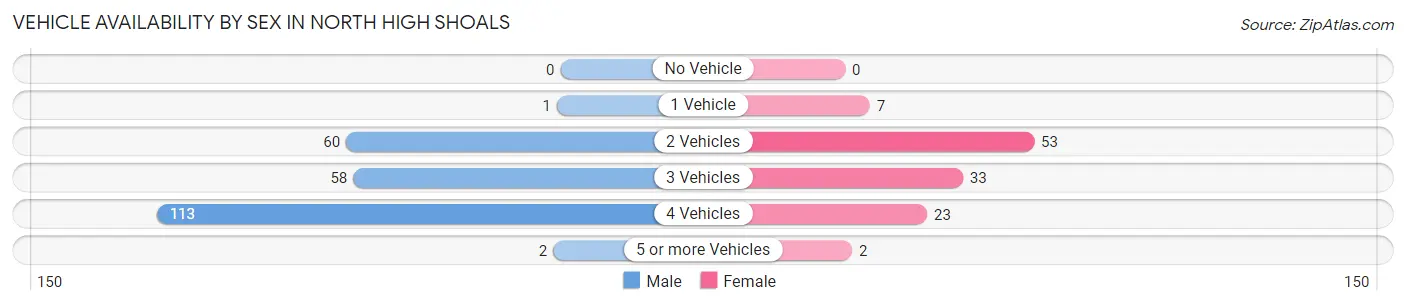
| Vehicles Available | Male | Female |
| No Vehicle | 0 (0.0%) | 0 (0.0%) |
| 1 Vehicle | 1 (0.4%) | 7 (5.9%) |
| 2 Vehicles | 60 (25.6%) | 53 (44.9%) |
| 3 Vehicles | 58 (24.8%) | 33 (28.0%) |
| 4 Vehicles | 113 (48.3%) | 23 (19.5%) |
| 5 or more Vehicles | 2 (0.9%) | 2 (1.7%) |
| Total | 234 (100.0%) | 118 (100.0%) |
Commute Time in North High Shoals
The most frequently occuring commute durations in North High Shoals are 15 to 19 minutes (79 commuters, 24.4%), 5 to 9 minutes (51 commuters, 15.7%), and 20 to 24 minutes (50 commuters, 15.4%).
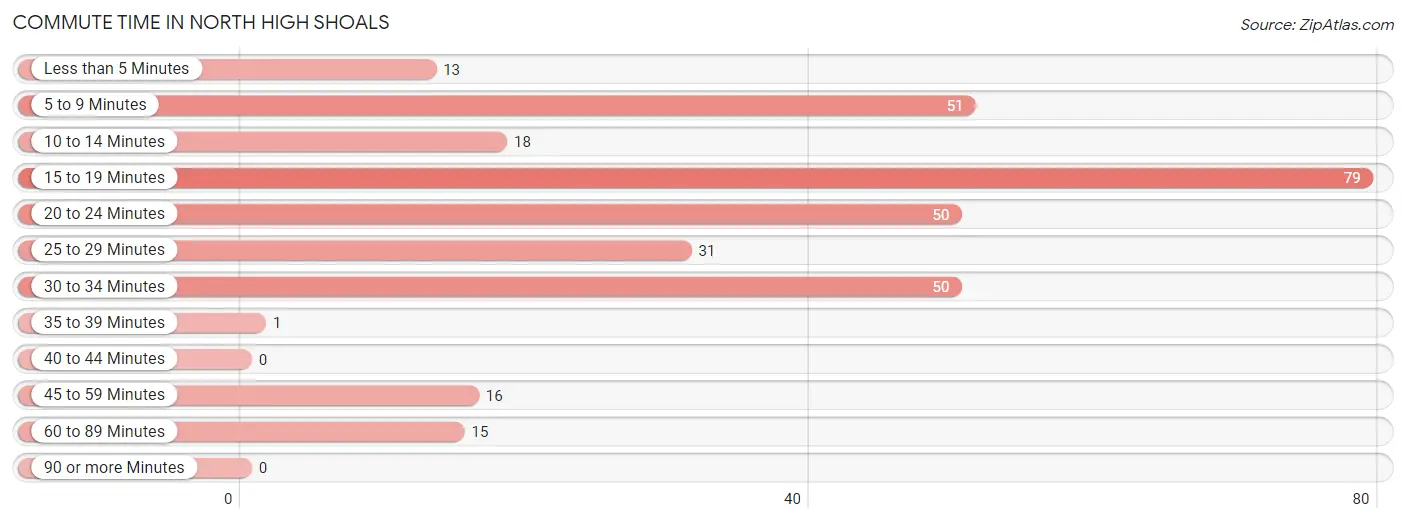
| Commute Time | # Commuters | % Commuters |
| Less than 5 Minutes | 13 | 4.0% |
| 5 to 9 Minutes | 51 | 15.7% |
| 10 to 14 Minutes | 18 | 5.6% |
| 15 to 19 Minutes | 79 | 24.4% |
| 20 to 24 Minutes | 50 | 15.4% |
| 25 to 29 Minutes | 31 | 9.6% |
| 30 to 34 Minutes | 50 | 15.4% |
| 35 to 39 Minutes | 1 | 0.3% |
| 40 to 44 Minutes | 0 | 0.0% |
| 45 to 59 Minutes | 16 | 4.9% |
| 60 to 89 Minutes | 15 | 4.6% |
| 90 or more Minutes | 0 | 0.0% |
Commute Time by Sex in North High Shoals
The most common commute times in North High Shoals are 15 to 19 minutes (55 commuters, 25.6%) for males and 30 to 34 minutes (28 commuters, 25.7%) for females.
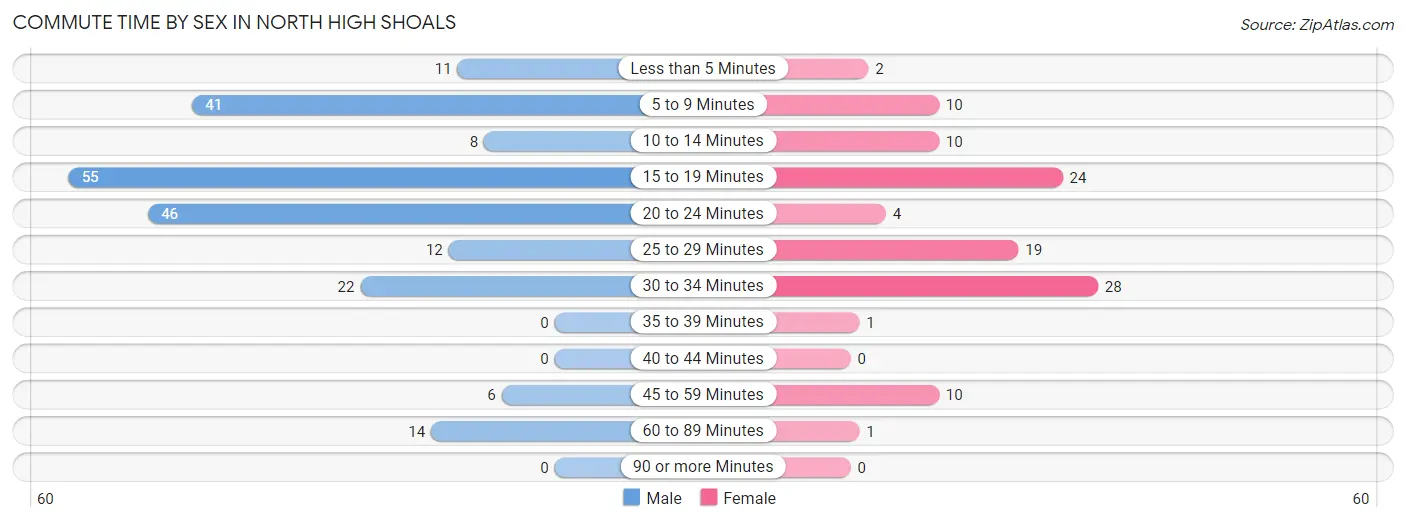
| Commute Time | Male | Female |
| Less than 5 Minutes | 11 (5.1%) | 2 (1.8%) |
| 5 to 9 Minutes | 41 (19.1%) | 10 (9.2%) |
| 10 to 14 Minutes | 8 (3.7%) | 10 (9.2%) |
| 15 to 19 Minutes | 55 (25.6%) | 24 (22.0%) |
| 20 to 24 Minutes | 46 (21.4%) | 4 (3.7%) |
| 25 to 29 Minutes | 12 (5.6%) | 19 (17.4%) |
| 30 to 34 Minutes | 22 (10.2%) | 28 (25.7%) |
| 35 to 39 Minutes | 0 (0.0%) | 1 (0.9%) |
| 40 to 44 Minutes | 0 (0.0%) | 0 (0.0%) |
| 45 to 59 Minutes | 6 (2.8%) | 10 (9.2%) |
| 60 to 89 Minutes | 14 (6.5%) | 1 (0.9%) |
| 90 or more Minutes | 0 (0.0%) | 0 (0.0%) |
Time of Departure to Work by Sex in North High Shoals
The most frequent times of departure to work in North High Shoals are 6:30 AM to 6:59 AM (75, 34.9%) for males and 8:00 AM to 8:29 AM (28, 25.7%) for females.
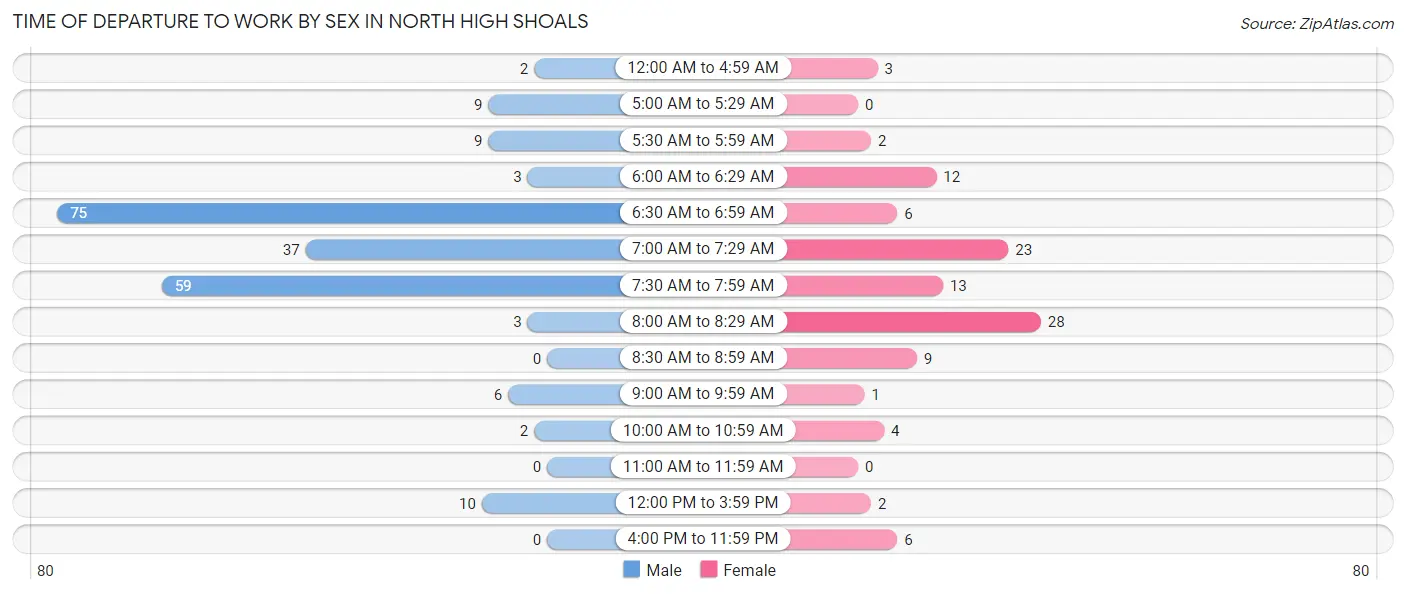
| Time of Departure | Male | Female |
| 12:00 AM to 4:59 AM | 2 (0.9%) | 3 (2.8%) |
| 5:00 AM to 5:29 AM | 9 (4.2%) | 0 (0.0%) |
| 5:30 AM to 5:59 AM | 9 (4.2%) | 2 (1.8%) |
| 6:00 AM to 6:29 AM | 3 (1.4%) | 12 (11.0%) |
| 6:30 AM to 6:59 AM | 75 (34.9%) | 6 (5.5%) |
| 7:00 AM to 7:29 AM | 37 (17.2%) | 23 (21.1%) |
| 7:30 AM to 7:59 AM | 59 (27.4%) | 13 (11.9%) |
| 8:00 AM to 8:29 AM | 3 (1.4%) | 28 (25.7%) |
| 8:30 AM to 8:59 AM | 0 (0.0%) | 9 (8.3%) |
| 9:00 AM to 9:59 AM | 6 (2.8%) | 1 (0.9%) |
| 10:00 AM to 10:59 AM | 2 (0.9%) | 4 (3.7%) |
| 11:00 AM to 11:59 AM | 0 (0.0%) | 0 (0.0%) |
| 12:00 PM to 3:59 PM | 10 (4.6%) | 2 (1.8%) |
| 4:00 PM to 11:59 PM | 0 (0.0%) | 6 (5.5%) |
| Total | 215 (100.0%) | 109 (100.0%) |
Housing Occupancy in North High Shoals
Occupancy by Ownership in North High Shoals
Of the total 229 dwellings in North High Shoals, owner-occupied units account for 220 (96.1%), while renter-occupied units make up 9 (3.9%).
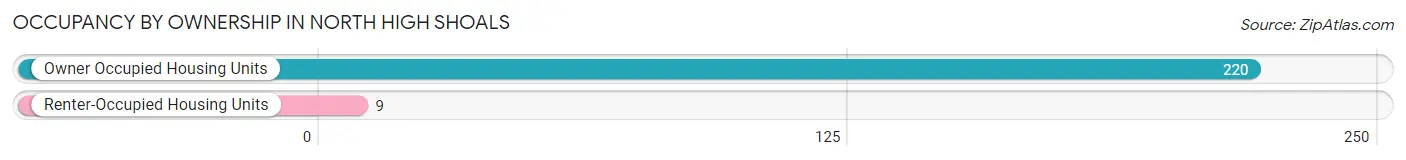
| Occupancy | # Housing Units | % Housing Units |
| Owner Occupied Housing Units | 220 | 96.1% |
| Renter-Occupied Housing Units | 9 | 3.9% |
| Total Occupied Housing Units | 229 | 100.0% |
Occupancy by Household Size in North High Shoals
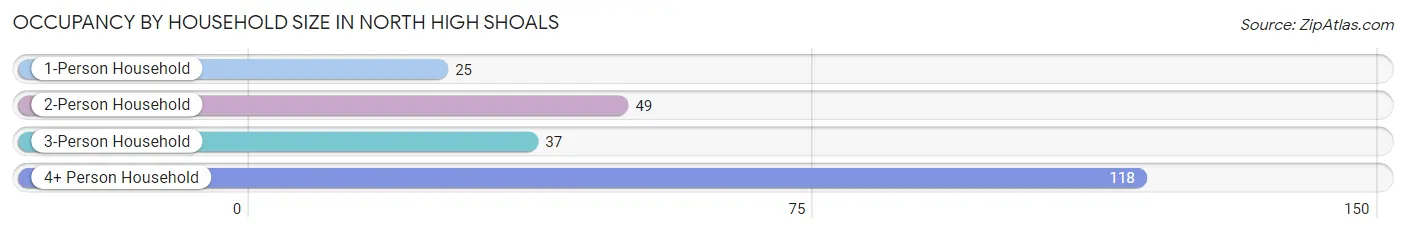
| Household Size | # Housing Units | % Housing Units |
| 1-Person Household | 25 | 10.9% |
| 2-Person Household | 49 | 21.4% |
| 3-Person Household | 37 | 16.2% |
| 4+ Person Household | 118 | 51.5% |
| Total Housing Units | 229 | 100.0% |
Occupancy by Ownership by Household Size in North High Shoals
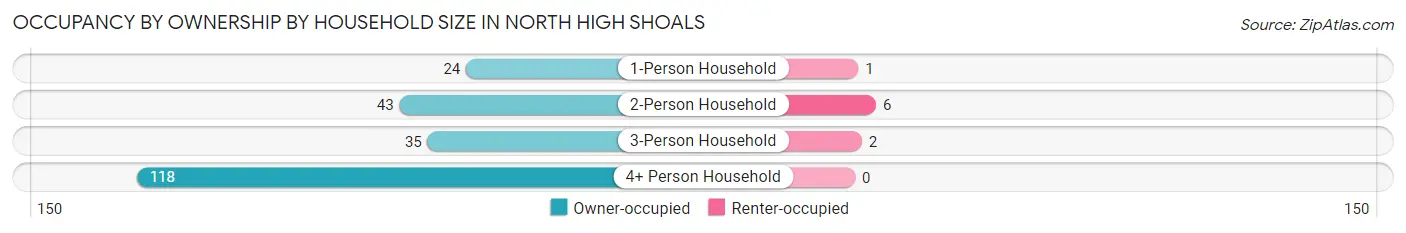
| Household Size | Owner-occupied | Renter-occupied |
| 1-Person Household | 24 (96.0%) | 1 (4.0%) |
| 2-Person Household | 43 (87.8%) | 6 (12.2%) |
| 3-Person Household | 35 (94.6%) | 2 (5.4%) |
| 4+ Person Household | 118 (100.0%) | 0 (0.0%) |
| Total Housing Units | 220 (96.1%) | 9 (3.9%) |
Occupancy by Educational Attainment in North High Shoals
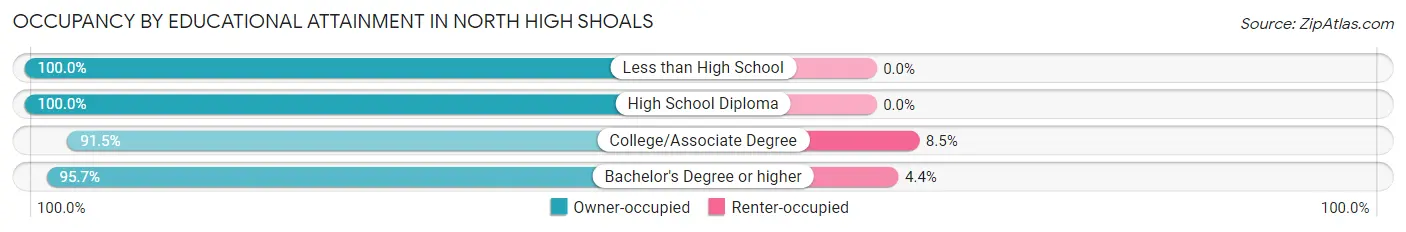
| Household Size | Owner-occupied | Renter-occupied |
| Less than High School | 44 (100.0%) | 0 (0.0%) |
| High School Diploma | 34 (100.0%) | 0 (0.0%) |
| College/Associate Degree | 54 (91.5%) | 5 (8.5%) |
| Bachelor's Degree or higher | 88 (95.7%) | 4 (4.3%) |
Occupancy by Age of Householder in North High Shoals
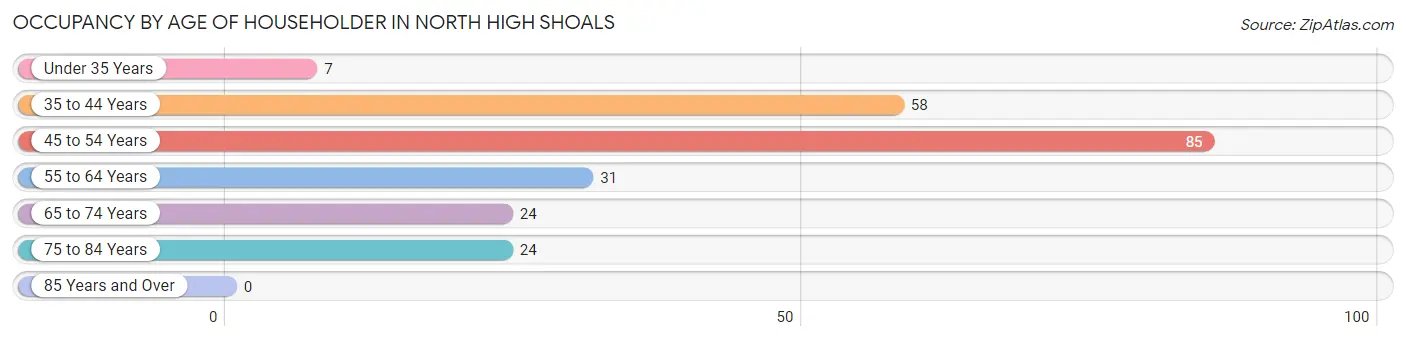
| Age Bracket | # Households | % Households |
| Under 35 Years | 7 | 3.1% |
| 35 to 44 Years | 58 | 25.3% |
| 45 to 54 Years | 85 | 37.1% |
| 55 to 64 Years | 31 | 13.5% |
| 65 to 74 Years | 24 | 10.5% |
| 75 to 84 Years | 24 | 10.5% |
| 85 Years and Over | 0 | 0.0% |
| Total | 229 | 100.0% |
Housing Finances in North High Shoals
Median Income by Occupancy in North High Shoals
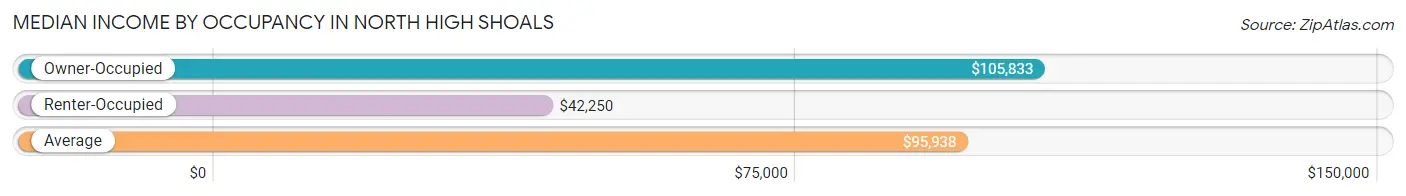
| Occupancy Type | # Households | Median Income |
| Owner-Occupied | 220 (96.1%) | $105,833 |
| Renter-Occupied | 9 (3.9%) | $42,250 |
| Average | 229 (100.0%) | $95,938 |
Occupancy by Householder Income Bracket in North High Shoals
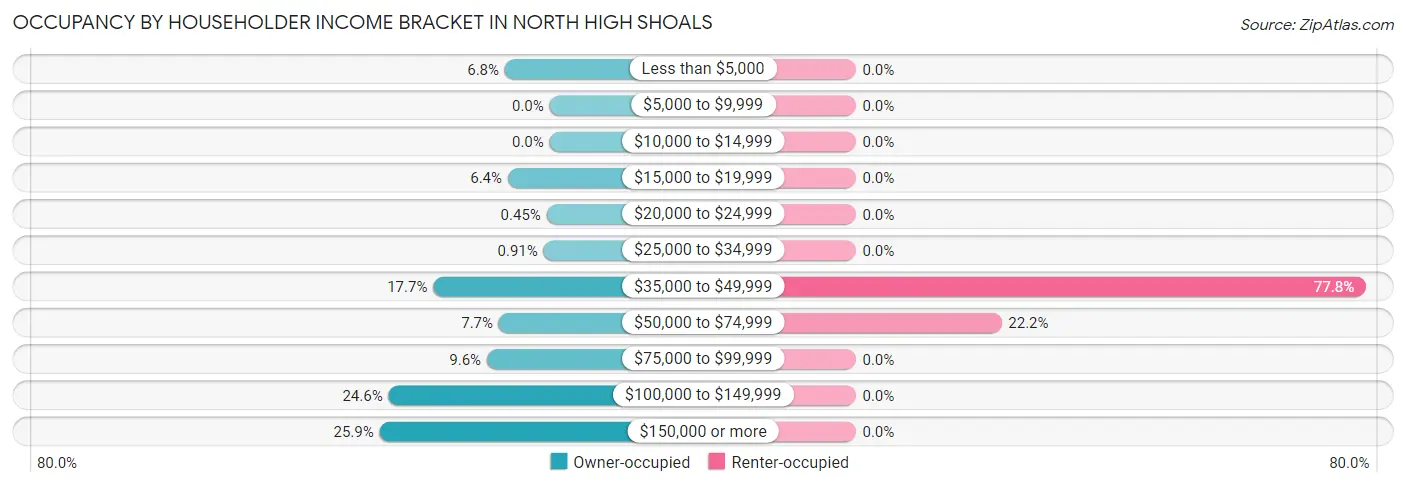
| Income Bracket | Owner-occupied | Renter-occupied |
| Less than $5,000 | 15 (6.8%) | 0 (0.0%) |
| $5,000 to $9,999 | 0 (0.0%) | 0 (0.0%) |
| $10,000 to $14,999 | 0 (0.0%) | 0 (0.0%) |
| $15,000 to $19,999 | 14 (6.4%) | 0 (0.0%) |
| $20,000 to $24,999 | 1 (0.4%) | 0 (0.0%) |
| $25,000 to $34,999 | 2 (0.9%) | 0 (0.0%) |
| $35,000 to $49,999 | 39 (17.7%) | 7 (77.8%) |
| $50,000 to $74,999 | 17 (7.7%) | 2 (22.2%) |
| $75,000 to $99,999 | 21 (9.6%) | 0 (0.0%) |
| $100,000 to $149,999 | 54 (24.5%) | 0 (0.0%) |
| $150,000 or more | 57 (25.9%) | 0 (0.0%) |
| Total | 220 (100.0%) | 9 (100.0%) |
Monthly Housing Cost Tiers in North High Shoals
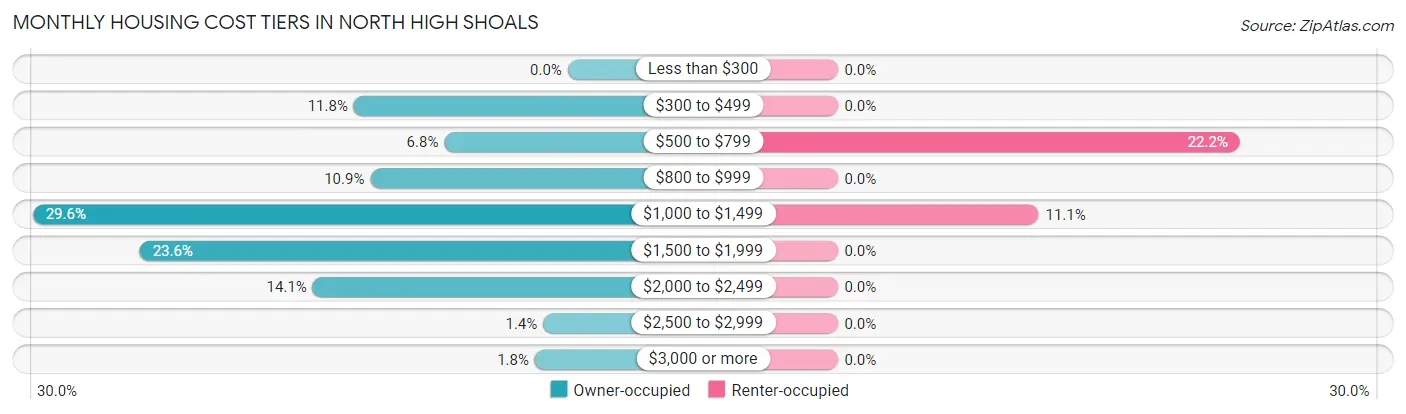
| Monthly Cost | Owner-occupied | Renter-occupied |
| Less than $300 | 0 (0.0%) | 0 (0.0%) |
| $300 to $499 | 26 (11.8%) | 0 (0.0%) |
| $500 to $799 | 15 (6.8%) | 2 (22.2%) |
| $800 to $999 | 24 (10.9%) | 0 (0.0%) |
| $1,000 to $1,499 | 65 (29.5%) | 1 (11.1%) |
| $1,500 to $1,999 | 52 (23.6%) | 0 (0.0%) |
| $2,000 to $2,499 | 31 (14.1%) | 0 (0.0%) |
| $2,500 to $2,999 | 3 (1.4%) | 0 (0.0%) |
| $3,000 or more | 4 (1.8%) | 0 (0.0%) |
| Total | 220 (100.0%) | 9 (100.0%) |
Physical Housing Characteristics in North High Shoals
Housing Structures in North High Shoals
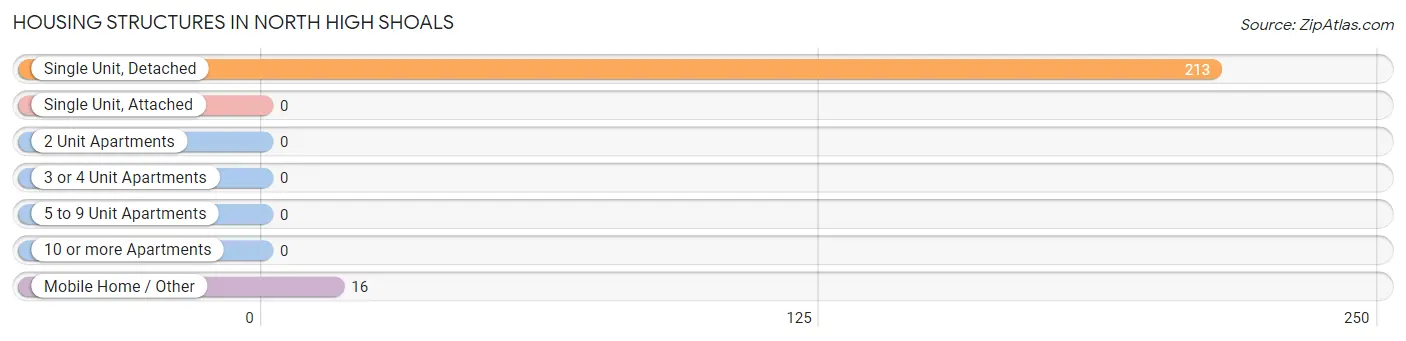
| Structure Type | # Housing Units | % Housing Units |
| Single Unit, Detached | 213 | 93.0% |
| Single Unit, Attached | 0 | 0.0% |
| 2 Unit Apartments | 0 | 0.0% |
| 3 or 4 Unit Apartments | 0 | 0.0% |
| 5 to 9 Unit Apartments | 0 | 0.0% |
| 10 or more Apartments | 0 | 0.0% |
| Mobile Home / Other | 16 | 7.0% |
| Total | 229 | 100.0% |
Housing Structures by Occupancy in North High Shoals
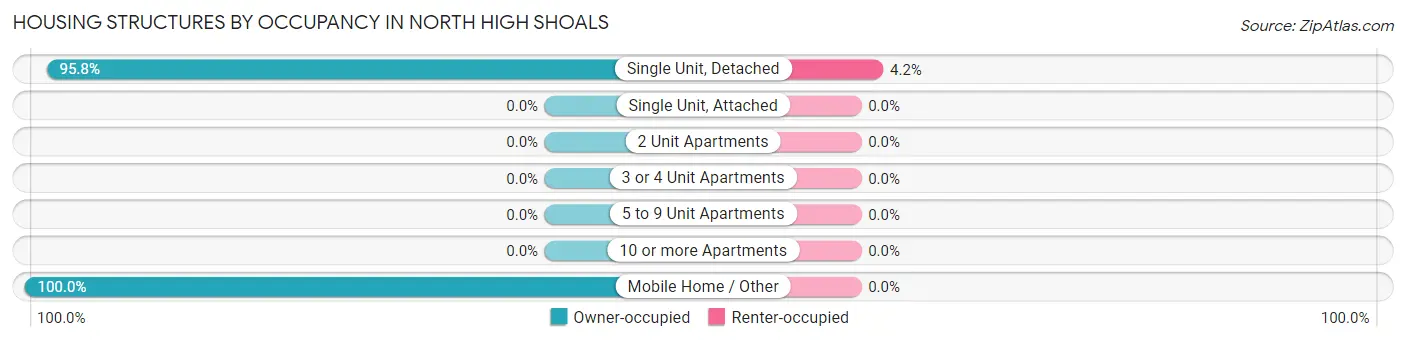
| Structure Type | Owner-occupied | Renter-occupied |
| Single Unit, Detached | 204 (95.8%) | 9 (4.2%) |
| Single Unit, Attached | 0 (0.0%) | 0 (0.0%) |
| 2 Unit Apartments | 0 (0.0%) | 0 (0.0%) |
| 3 or 4 Unit Apartments | 0 (0.0%) | 0 (0.0%) |
| 5 to 9 Unit Apartments | 0 (0.0%) | 0 (0.0%) |
| 10 or more Apartments | 0 (0.0%) | 0 (0.0%) |
| Mobile Home / Other | 16 (100.0%) | 0 (0.0%) |
| Total | 220 (96.1%) | 9 (3.9%) |
Housing Structures by Number of Rooms in North High Shoals
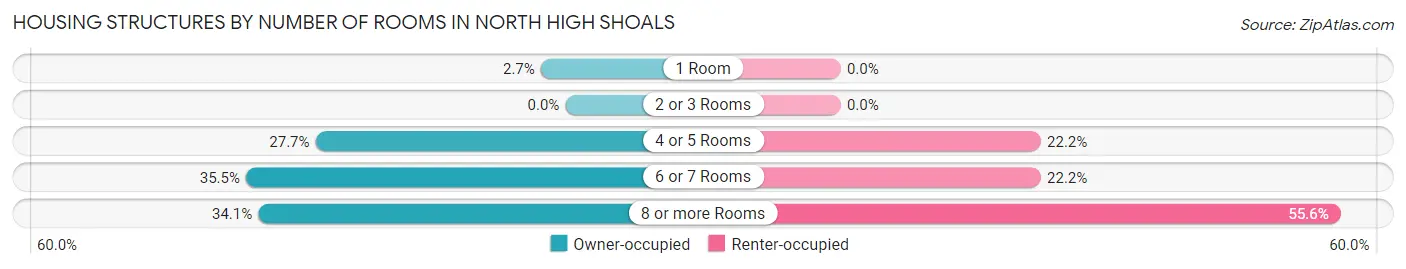
| Number of Rooms | Owner-occupied | Renter-occupied |
| 1 Room | 6 (2.7%) | 0 (0.0%) |
| 2 or 3 Rooms | 0 (0.0%) | 0 (0.0%) |
| 4 or 5 Rooms | 61 (27.7%) | 2 (22.2%) |
| 6 or 7 Rooms | 78 (35.4%) | 2 (22.2%) |
| 8 or more Rooms | 75 (34.1%) | 5 (55.6%) |
| Total | 220 (100.0%) | 9 (100.0%) |
Housing Structure by Heating Type in North High Shoals
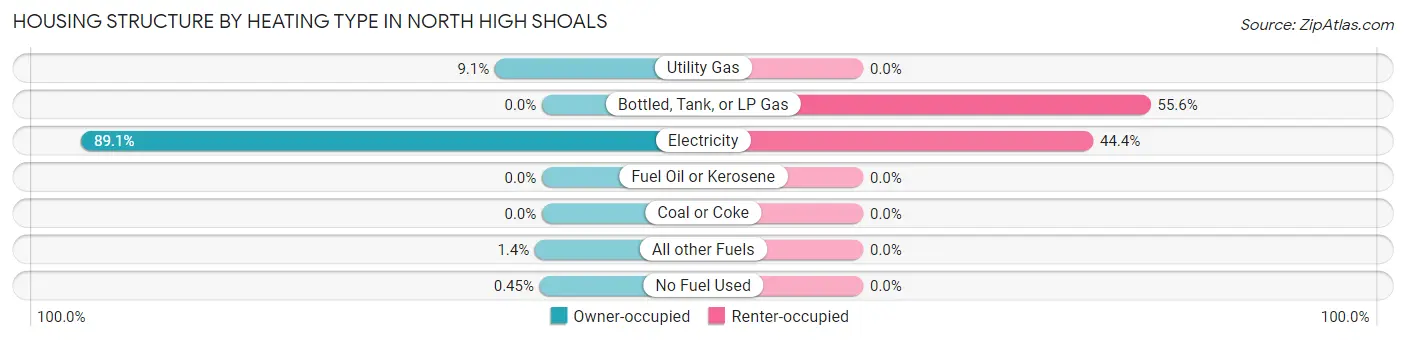
| Heating Type | Owner-occupied | Renter-occupied |
| Utility Gas | 20 (9.1%) | 0 (0.0%) |
| Bottled, Tank, or LP Gas | 0 (0.0%) | 5 (55.6%) |
| Electricity | 196 (89.1%) | 4 (44.4%) |
| Fuel Oil or Kerosene | 0 (0.0%) | 0 (0.0%) |
| Coal or Coke | 0 (0.0%) | 0 (0.0%) |
| All other Fuels | 3 (1.4%) | 0 (0.0%) |
| No Fuel Used | 1 (0.4%) | 0 (0.0%) |
| Total | 220 (100.0%) | 9 (100.0%) |
Household Vehicle Usage in North High Shoals
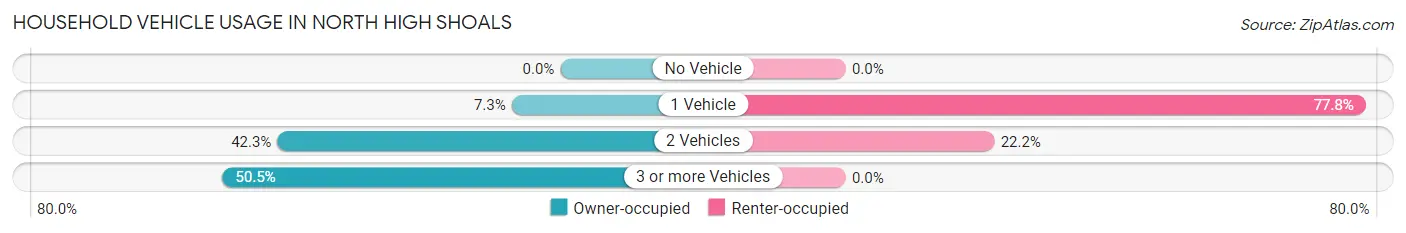
| Vehicles per Household | Owner-occupied | Renter-occupied |
| No Vehicle | 0 (0.0%) | 0 (0.0%) |
| 1 Vehicle | 16 (7.3%) | 7 (77.8%) |
| 2 Vehicles | 93 (42.3%) | 2 (22.2%) |
| 3 or more Vehicles | 111 (50.4%) | 0 (0.0%) |
| Total | 220 (100.0%) | 9 (100.0%) |
Real Estate & Mortgages in North High Shoals
Real Estate and Mortgage Overview in North High Shoals
| Characteristic | Without Mortgage | With Mortgage |
| Housing Units | 61 | 159 |
| Median Property Value | $350,000 | $279,700 |
| Median Household Income | - | - |
| Monthly Housing Costs | $692 | $4 |
| Real Estate Taxes | $1,905 | $37 |
Property Value by Mortgage Status in North High Shoals
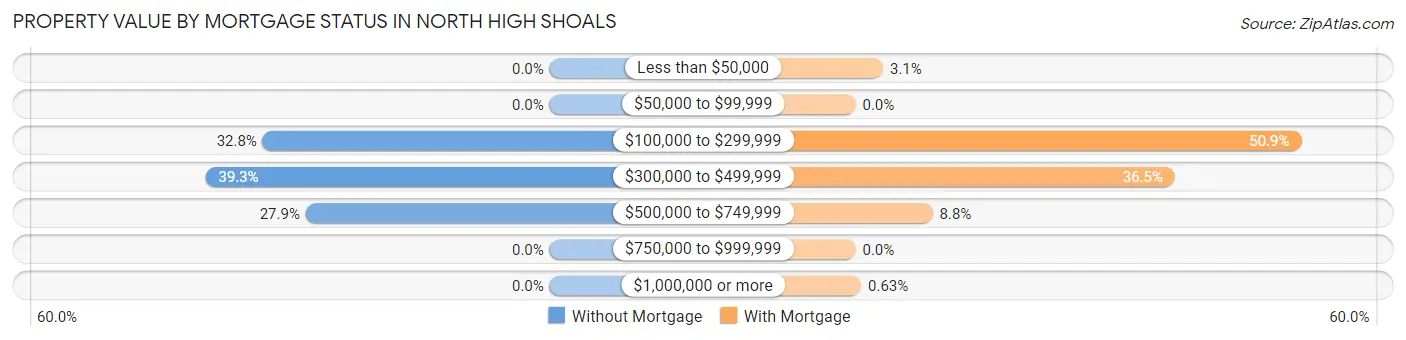
| Property Value | Without Mortgage | With Mortgage |
| Less than $50,000 | 0 (0.0%) | 5 (3.1%) |
| $50,000 to $99,999 | 0 (0.0%) | 0 (0.0%) |
| $100,000 to $299,999 | 20 (32.8%) | 81 (50.9%) |
| $300,000 to $499,999 | 24 (39.3%) | 58 (36.5%) |
| $500,000 to $749,999 | 17 (27.9%) | 14 (8.8%) |
| $750,000 to $999,999 | 0 (0.0%) | 0 (0.0%) |
| $1,000,000 or more | 0 (0.0%) | 1 (0.6%) |
| Total | 61 (100.0%) | 159 (100.0%) |
Household Income by Mortgage Status in North High Shoals
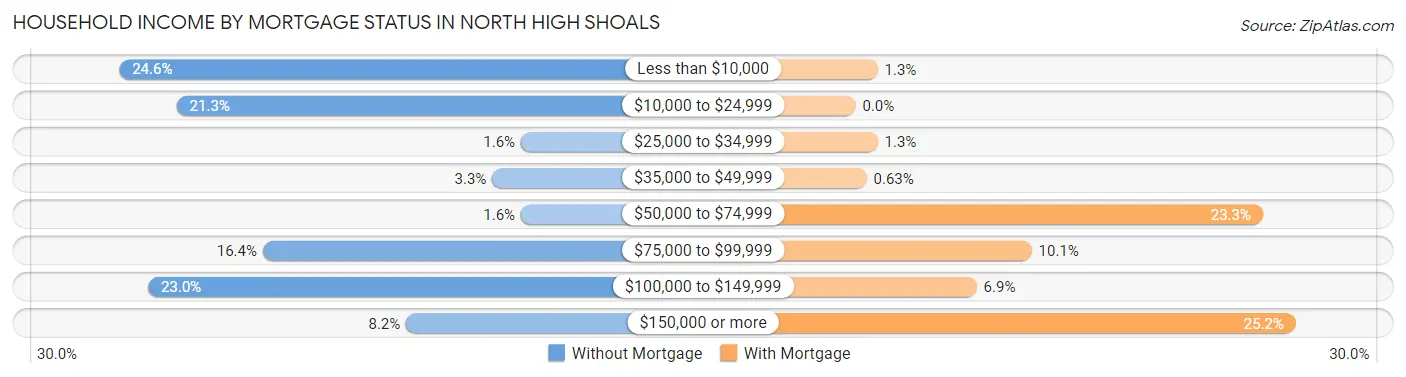
| Household Income | Without Mortgage | With Mortgage |
| Less than $10,000 | 15 (24.6%) | 2 (1.3%) |
| $10,000 to $24,999 | 13 (21.3%) | 0 (0.0%) |
| $25,000 to $34,999 | 1 (1.6%) | 2 (1.3%) |
| $35,000 to $49,999 | 2 (3.3%) | 1 (0.6%) |
| $50,000 to $74,999 | 1 (1.6%) | 37 (23.3%) |
| $75,000 to $99,999 | 10 (16.4%) | 16 (10.1%) |
| $100,000 to $149,999 | 14 (23.0%) | 11 (6.9%) |
| $150,000 or more | 5 (8.2%) | 40 (25.2%) |
| Total | 61 (100.0%) | 159 (100.0%) |
Property Value to Household Income Ratio in North High Shoals
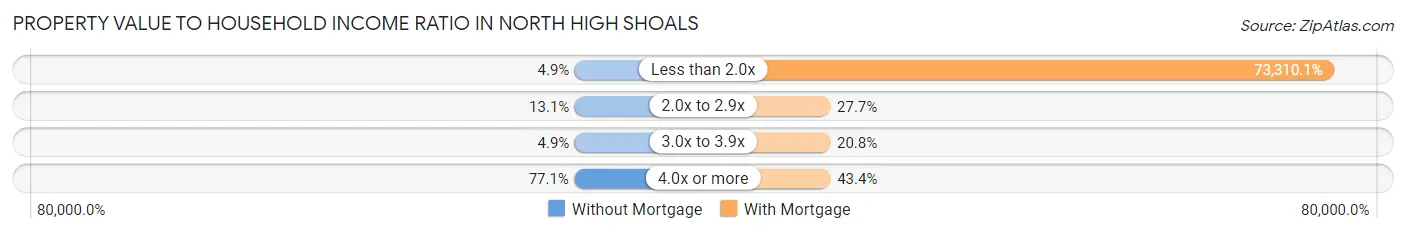
| Value-to-Income Ratio | Without Mortgage | With Mortgage |
| Less than 2.0x | 3 (4.9%) | 116,563 (73,310.1%) |
| 2.0x to 2.9x | 8 (13.1%) | 44 (27.7%) |
| 3.0x to 3.9x | 3 (4.9%) | 33 (20.7%) |
| 4.0x or more | 47 (77.0%) | 69 (43.4%) |
| Total | 61 (100.0%) | 159 (100.0%) |
Real Estate Taxes by Mortgage Status in North High Shoals
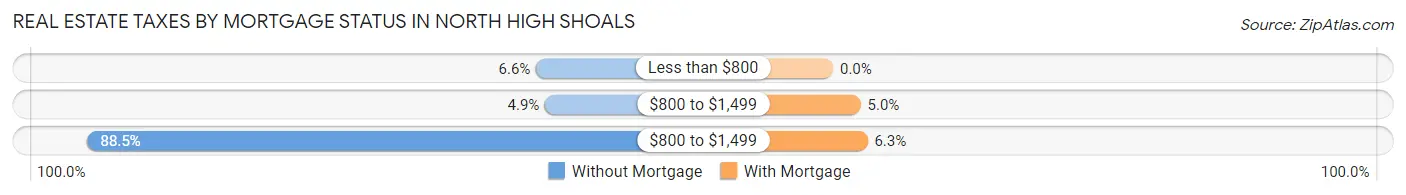
| Property Taxes | Without Mortgage | With Mortgage |
| Less than $800 | 4 (6.6%) | 0 (0.0%) |
| $800 to $1,499 | 3 (4.9%) | 8 (5.0%) |
| $800 to $1,499 | 54 (88.5%) | 10 (6.3%) |
| Total | 61 (100.0%) | 159 (100.0%) |
Health & Disability in North High Shoals
Health Insurance Coverage by Age in North High Shoals
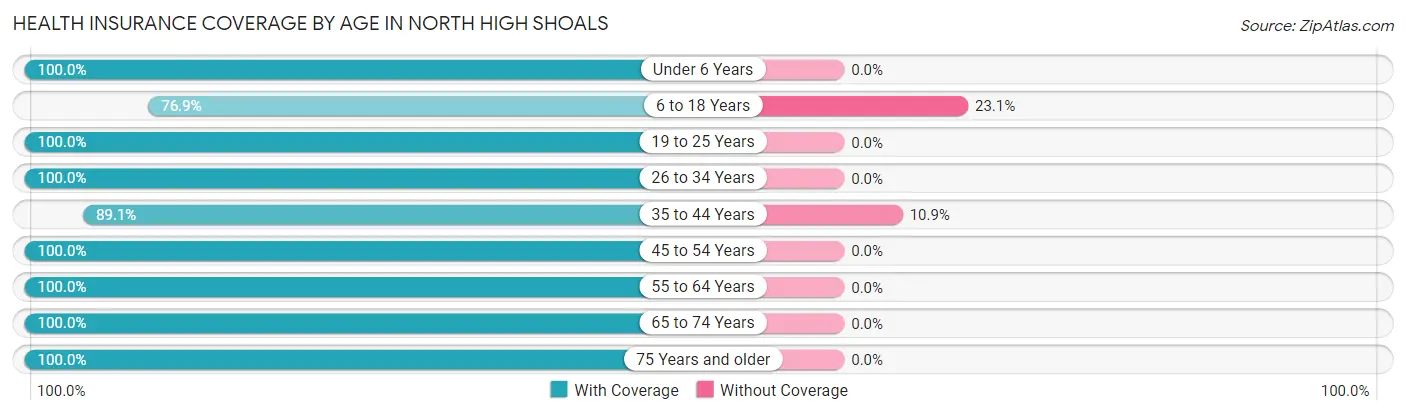
| Age Bracket | With Coverage | Without Coverage |
| Under 6 Years | 27 (100.0%) | 0 (0.0%) |
| 6 to 18 Years | 140 (76.9%) | 42 (23.1%) |
| 19 to 25 Years | 74 (100.0%) | 0 (0.0%) |
| 26 to 34 Years | 39 (100.0%) | 0 (0.0%) |
| 35 to 44 Years | 90 (89.1%) | 11 (10.9%) |
| 45 to 54 Years | 115 (100.0%) | 0 (0.0%) |
| 55 to 64 Years | 79 (100.0%) | 0 (0.0%) |
| 65 to 74 Years | 38 (100.0%) | 0 (0.0%) |
| 75 Years and older | 24 (100.0%) | 0 (0.0%) |
| Total | 626 (92.2%) | 53 (7.8%) |
Health Insurance Coverage by Citizenship Status in North High Shoals
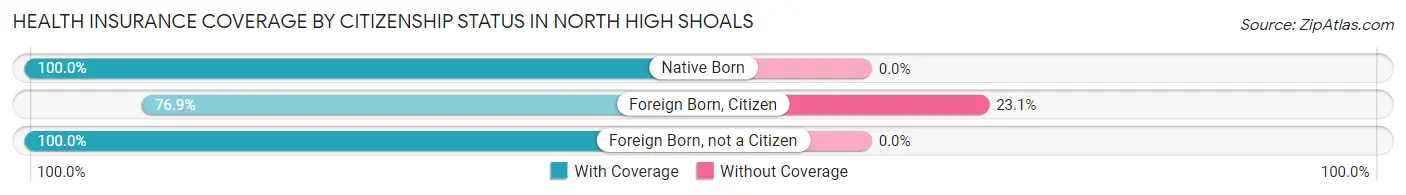
| Citizenship Status | With Coverage | Without Coverage |
| Native Born | 27 (100.0%) | 0 (0.0%) |
| Foreign Born, Citizen | 140 (76.9%) | 42 (23.1%) |
| Foreign Born, not a Citizen | 74 (100.0%) | 0 (0.0%) |
Health Insurance Coverage by Household Income in North High Shoals
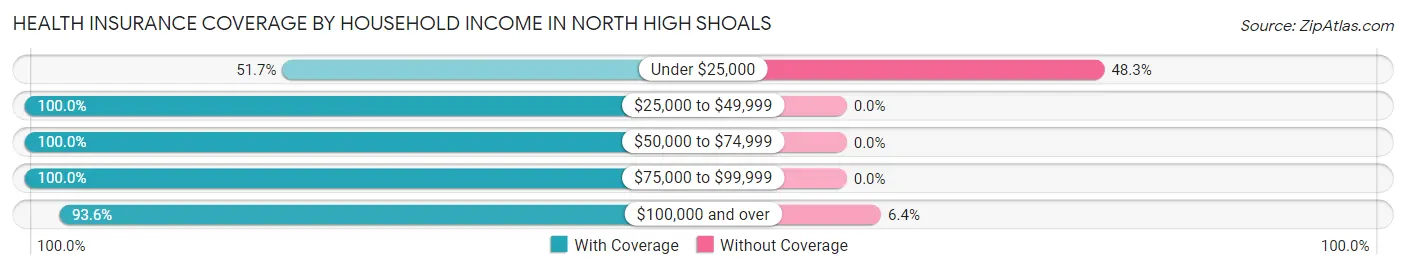
| Household Income | With Coverage | Without Coverage |
| Under $25,000 | 30 (51.7%) | 28 (48.3%) |
| $25,000 to $49,999 | 119 (100.0%) | 0 (0.0%) |
| $50,000 to $74,999 | 58 (100.0%) | 0 (0.0%) |
| $75,000 to $99,999 | 56 (100.0%) | 0 (0.0%) |
| $100,000 and over | 363 (93.6%) | 25 (6.4%) |
Public vs Private Health Insurance Coverage by Age in North High Shoals
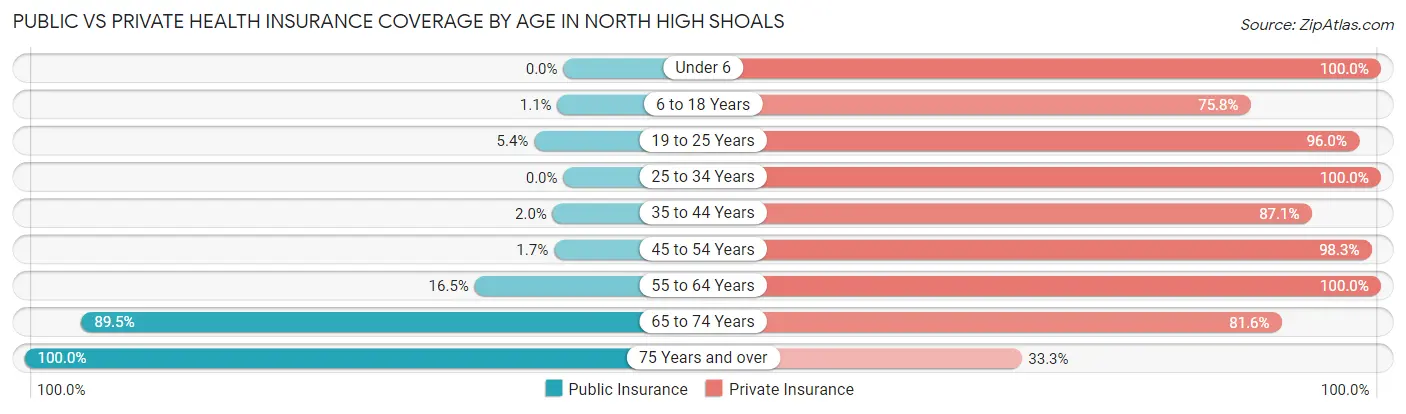
| Age Bracket | Public Insurance | Private Insurance |
| Under 6 | 0 (0.0%) | 27 (100.0%) |
| 6 to 18 Years | 2 (1.1%) | 138 (75.8%) |
| 19 to 25 Years | 4 (5.4%) | 71 (96.0%) |
| 25 to 34 Years | 0 (0.0%) | 39 (100.0%) |
| 35 to 44 Years | 2 (2.0%) | 88 (87.1%) |
| 45 to 54 Years | 2 (1.7%) | 113 (98.3%) |
| 55 to 64 Years | 13 (16.5%) | 79 (100.0%) |
| 65 to 74 Years | 34 (89.5%) | 31 (81.6%) |
| 75 Years and over | 24 (100.0%) | 8 (33.3%) |
| Total | 81 (11.9%) | 594 (87.5%) |
Disability Status by Sex by Age in North High Shoals
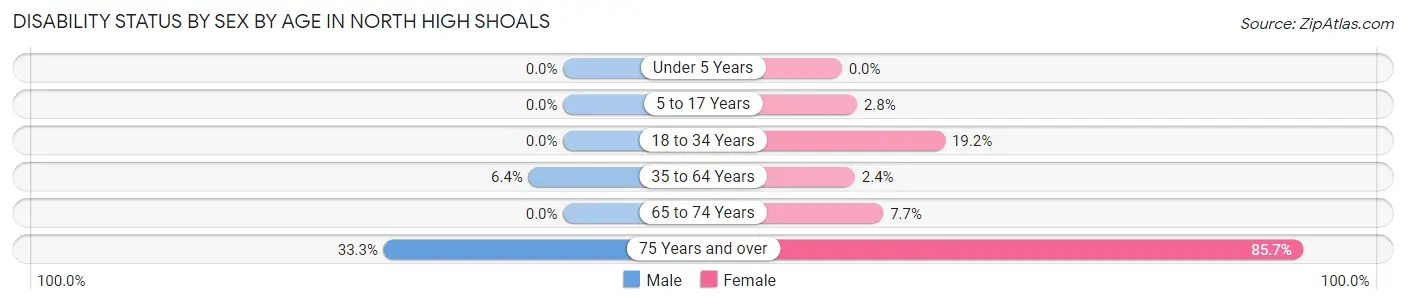
| Age Bracket | Male | Female |
| Under 5 Years | 0 (0.0%) | 0 (0.0%) |
| 5 to 17 Years | 0 (0.0%) | 2 (2.8%) |
| 18 to 34 Years | 0 (0.0%) | 9 (19.2%) |
| 35 to 64 Years | 11 (6.4%) | 3 (2.4%) |
| 65 to 74 Years | 0 (0.0%) | 2 (7.7%) |
| 75 Years and over | 1 (33.3%) | 18 (85.7%) |
Disability Class by Sex by Age in North High Shoals
Disability Class: Hearing Difficulty
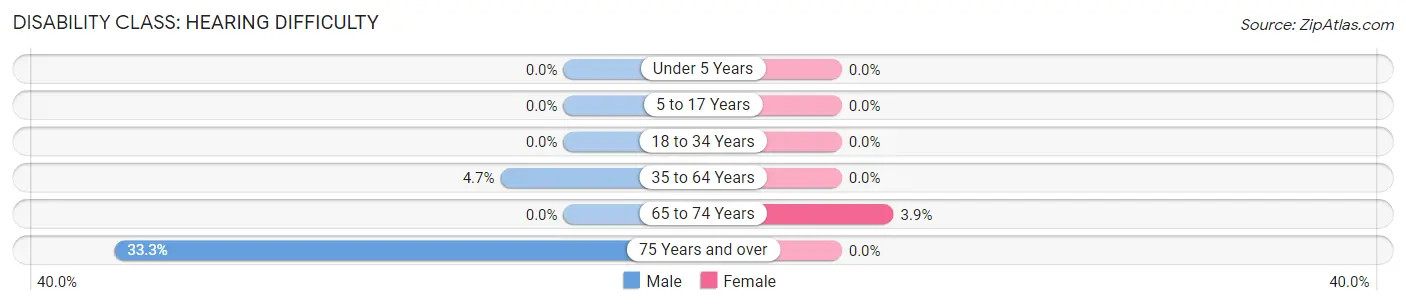
| Age Bracket | Male | Female |
| Under 5 Years | 0 (0.0%) | 0 (0.0%) |
| 5 to 17 Years | 0 (0.0%) | 0 (0.0%) |
| 18 to 34 Years | 0 (0.0%) | 0 (0.0%) |
| 35 to 64 Years | 8 (4.7%) | 0 (0.0%) |
| 65 to 74 Years | 0 (0.0%) | 1 (3.8%) |
| 75 Years and over | 1 (33.3%) | 0 (0.0%) |
Disability Class: Vision Difficulty
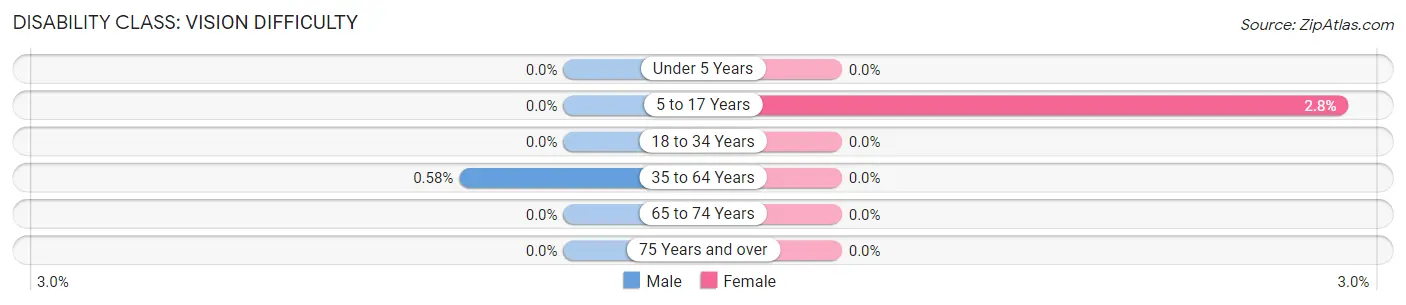
| Age Bracket | Male | Female |
| Under 5 Years | 0 (0.0%) | 0 (0.0%) |
| 5 to 17 Years | 0 (0.0%) | 2 (2.8%) |
| 18 to 34 Years | 0 (0.0%) | 0 (0.0%) |
| 35 to 64 Years | 1 (0.6%) | 0 (0.0%) |
| 65 to 74 Years | 0 (0.0%) | 0 (0.0%) |
| 75 Years and over | 0 (0.0%) | 0 (0.0%) |
Disability Class: Cognitive Difficulty
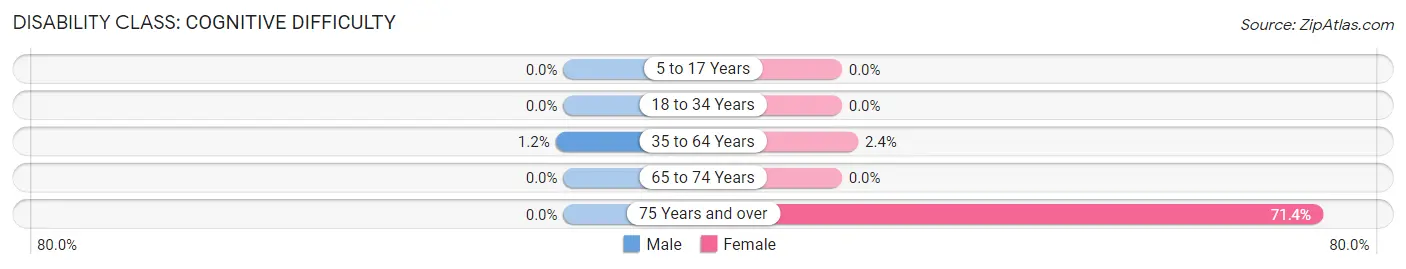
| Age Bracket | Male | Female |
| 5 to 17 Years | 0 (0.0%) | 0 (0.0%) |
| 18 to 34 Years | 0 (0.0%) | 0 (0.0%) |
| 35 to 64 Years | 2 (1.2%) | 3 (2.4%) |
| 65 to 74 Years | 0 (0.0%) | 0 (0.0%) |
| 75 Years and over | 0 (0.0%) | 15 (71.4%) |
Disability Class: Ambulatory Difficulty
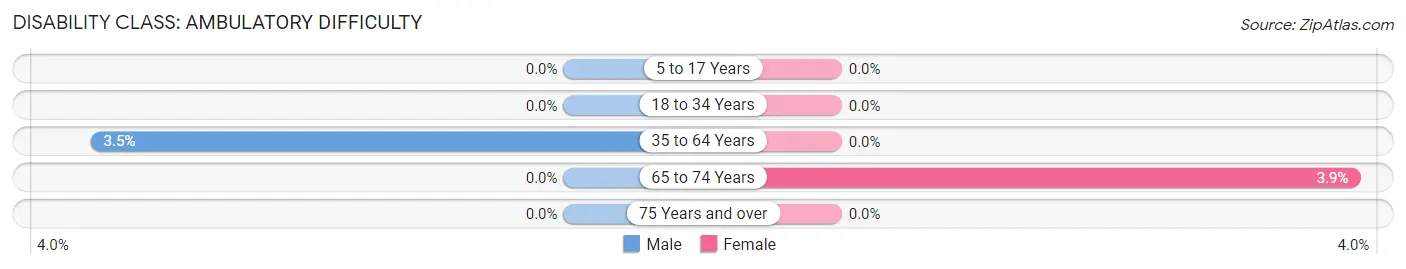
| Age Bracket | Male | Female |
| 5 to 17 Years | 0 (0.0%) | 0 (0.0%) |
| 18 to 34 Years | 0 (0.0%) | 0 (0.0%) |
| 35 to 64 Years | 6 (3.5%) | 0 (0.0%) |
| 65 to 74 Years | 0 (0.0%) | 1 (3.8%) |
| 75 Years and over | 0 (0.0%) | 0 (0.0%) |
Disability Class: Self-Care Difficulty
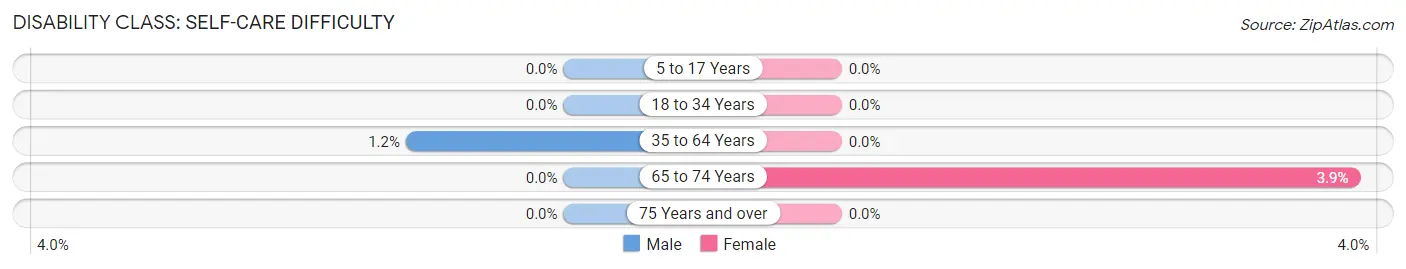
| Age Bracket | Male | Female |
| 5 to 17 Years | 0 (0.0%) | 0 (0.0%) |
| 18 to 34 Years | 0 (0.0%) | 0 (0.0%) |
| 35 to 64 Years | 2 (1.2%) | 0 (0.0%) |
| 65 to 74 Years | 0 (0.0%) | 1 (3.8%) |
| 75 Years and over | 0 (0.0%) | 0 (0.0%) |
Technology Access in North High Shoals
Computing Device Access in North High Shoals
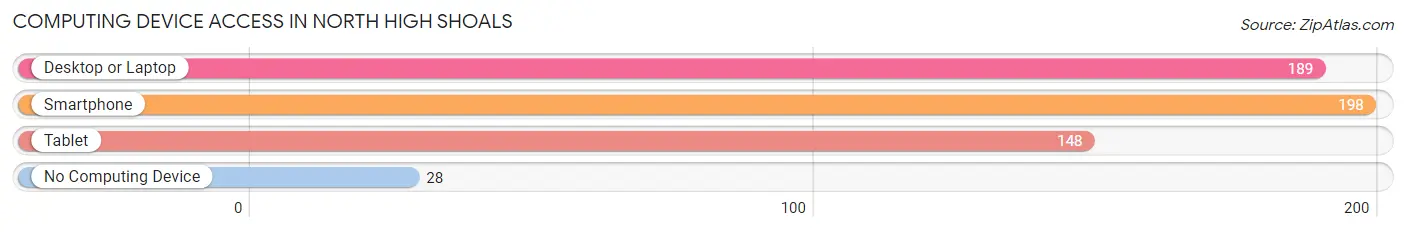
| Device Type | # Households | % Households |
| Desktop or Laptop | 189 | 82.5% |
| Smartphone | 198 | 86.5% |
| Tablet | 148 | 64.6% |
| No Computing Device | 28 | 12.2% |
| Total | 229 | 100.0% |
Internet Access in North High Shoals
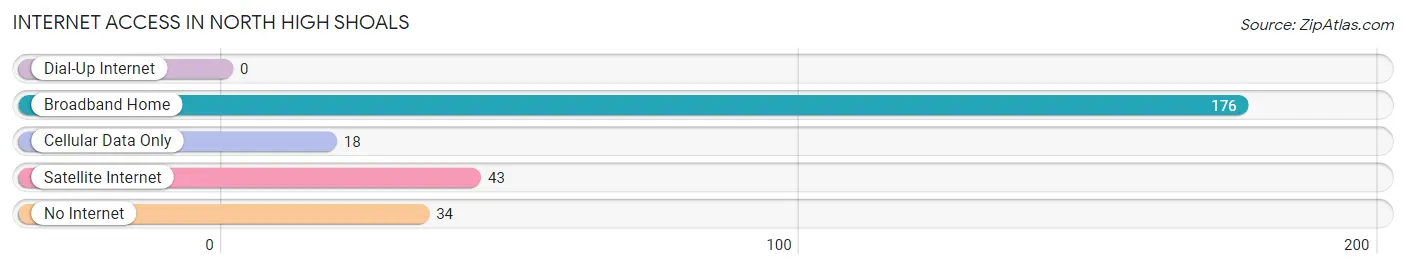
| Internet Type | # Households | % Households |
| Dial-Up Internet | 0 | 0.0% |
| Broadband Home | 176 | 76.9% |
| Cellular Data Only | 18 | 7.9% |
| Satellite Internet | 43 | 18.8% |
| No Internet | 34 | 14.8% |
| Total | 229 | 100.0% |
North High Shoals Summary
High Shoals is a small town located in the northeast corner of Georgia, in the foothills of the Appalachian Mountains. It is situated in the county of Oconee, and is part of the Athens-Clarke County Metropolitan Statistical Area. The town has a population of approximately 1,000 people, and is known for its rural charm and small-town atmosphere.
History
High Shoals was founded in 1820 by a group of settlers from North Carolina. The town was named after the nearby shoals of the Apalachee River, which were used by the settlers to power their grist mills. The town quickly grew, and by the mid-1800s, it was a thriving community with a variety of businesses, including a cotton gin, a sawmill, and a blacksmith shop.
In the late 1800s, the town began to decline as the railroad bypassed it and the local economy shifted away from agriculture. However, the town was revitalized in the early 1900s when the Georgia Power Company built a hydroelectric dam on the Apalachee River. This provided the town with a reliable source of electricity, and allowed it to become a center for manufacturing and industry.
Geography
High Shoals is located in the foothills of the Appalachian Mountains, in the northeast corner of Georgia. The town is situated in the county of Oconee, and is part of the Athens-Clarke County Metropolitan Statistical Area. The town is located at an elevation of 890 feet above sea level, and is surrounded by rolling hills and forests. The Apalachee River runs through the town, and is used to generate hydroelectric power.
Economy
High Shoals is a small, rural town, and the local economy is largely based on agriculture and tourism. The town is home to several small businesses, including a grocery store, a hardware store, and a few restaurants. The town is also home to a number of small manufacturing companies, which produce a variety of products, including furniture, textiles, and automotive parts.
The town is also home to the High Shoals Hydroelectric Plant, which is owned and operated by the Georgia Power Company. The plant generates electricity for the surrounding area, and provides jobs for many of the town’s residents.
Demographics
As of the 2010 census, High Shoals had a population of 1,000 people. The town is predominantly white, with a small African American population. The median household income is $37,000, and the median home value is $125,000. The town has a low unemployment rate, and a high rate of homeownership.
High Shoals is a small, rural town with a strong sense of community. The town is known for its friendly atmosphere and its commitment to preserving its rural character. The town is home to a variety of businesses, and is a popular destination for tourists and outdoor enthusiasts.
Common Questions
What is Per Capita Income in North High Shoals?
Per Capita income in North High Shoals is $35,902.
What is the Median Family Income in North High Shoals?
Median Family Income in North High Shoals is $107,679.
What is the Median Household income in North High Shoals?
Median Household Income in North High Shoals is $95,938.
What is Income or Wage Gap in North High Shoals?
Income or Wage Gap in North High Shoals is 1.3%.
Women in North High Shoals earn 98.7 cents for every dollar earned by a man.
What is Inequality or Gini Index in North High Shoals?
Inequality or Gini Index in North High Shoals is 0.40.
What is the Total Population of North High Shoals?
Total Population of North High Shoals is 725.
What is the Total Male Population of North High Shoals?
Total Male Population of North High Shoals is 388.
What is the Total Female Population of North High Shoals?
Total Female Population of North High Shoals is 337.
What is the Ratio of Males per 100 Females in North High Shoals?
There are 115.13 Males per 100 Females in North High Shoals.
What is the Ratio of Females per 100 Males in North High Shoals?
There are 86.86 Females per 100 Males in North High Shoals.
What is the Median Population Age in North High Shoals?
Median Population Age in North High Shoals is 41.6 Years.
What is the Average Family Size in North High Shoals
Average Family Size in North High Shoals is 3.1 People.
What is the Average Household Size in North High Shoals
Average Household Size in North High Shoals is 3.0 People.
How Large is the Labor Force in North High Shoals?
There are 362 People in the Labor Forcein in North High Shoals.
What is the Percentage of People in the Labor Force in North High Shoals?
61.7% of People are in the Labor Force in North High Shoals.
What is the Unemployment Rate in North High Shoals?
Unemployment Rate in North High Shoals is 2.8%.