Zip Codes with the Highest Percentage of Population Employed in Architecture & Engineering in Bainbridge, GA
RELATED REPORTS & OPTIONS
Architecture & Engineering
Bainbridge
Compare Zip Codes
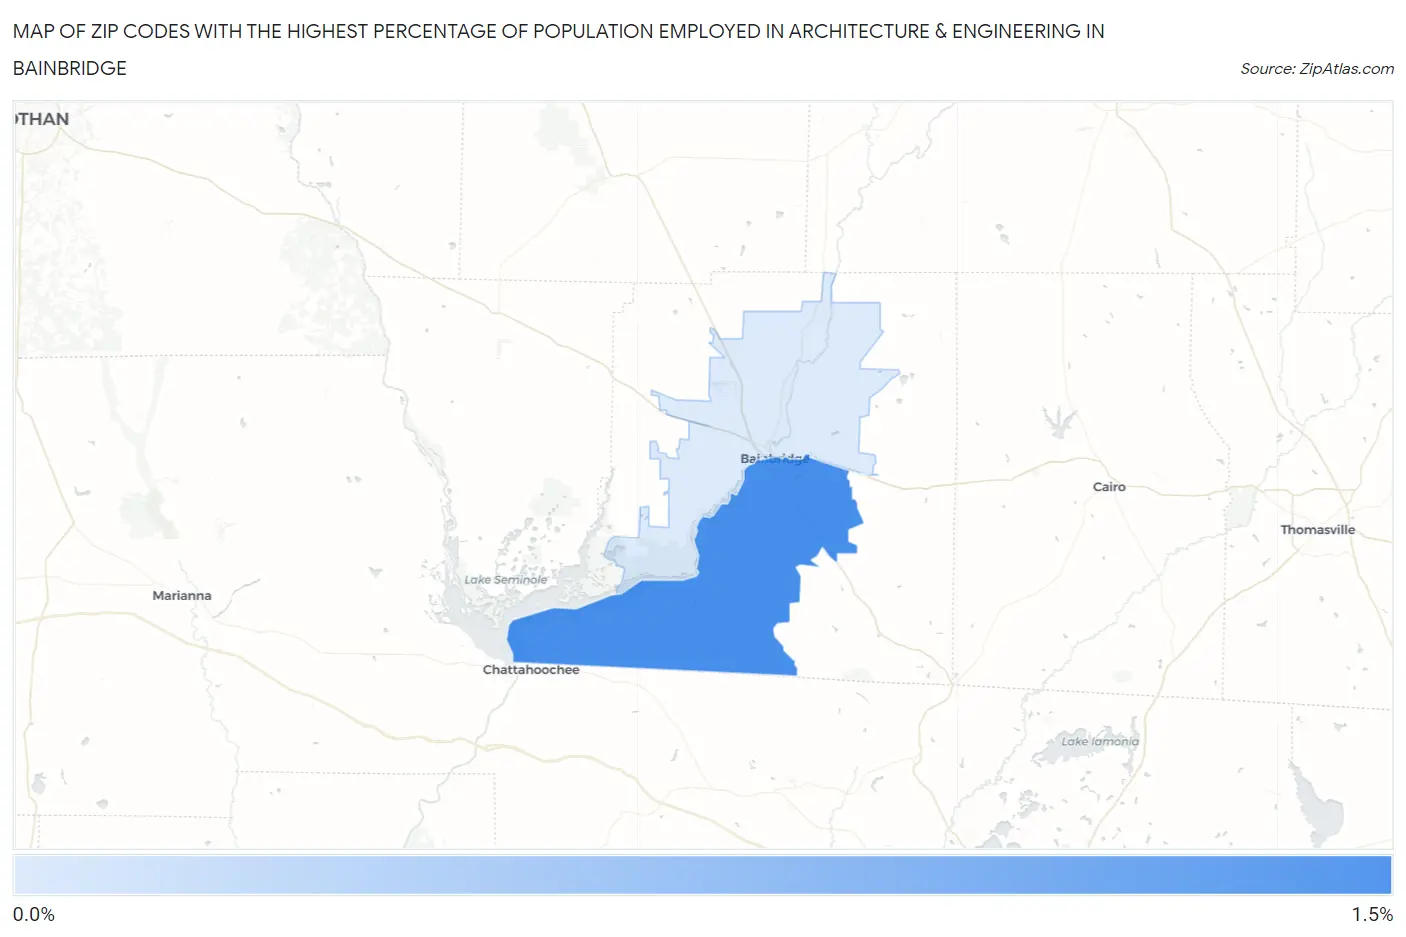
Map of Zip Codes with the Highest Percentage of Population Employed in Architecture & Engineering in Bainbridge
0.29%
1.1%
Zip Codes with the Highest Percentage of Population Employed in Architecture & Engineering in Bainbridge, GA
| Zip Code | % Employed | vs State | vs National | |
| 1. | 39819 | 1.1% | 1.8%(-0.674)#322 | 2.1%(-1.03)#15,683 |
| 2. | 39817 | 0.29% | 1.8%(-1.50)#480 | 2.1%(-1.86)#21,602 |
1
Common Questions
What are the Top Zip Codes with the Highest Percentage of Population Employed in Architecture & Engineering in Bainbridge, GA?
Top Zip Codes with the Highest Percentage of Population Employed in Architecture & Engineering in Bainbridge, GA are:
What zip code has the Highest Percentage of Population Employed in Architecture & Engineering in Bainbridge, GA?
39819 has the Highest Percentage of Population Employed in Architecture & Engineering in Bainbridge, GA with 1.1%.
What is the Percentage of Population Employed in Architecture & Engineering in Bainbridge, GA?
Percentage of Population Employed in Architecture & Engineering in Bainbridge is 1.3%.
What is the Percentage of Population Employed in Architecture & Engineering in Georgia?
Percentage of Population Employed in Architecture & Engineering in Georgia is 1.8%.
What is the Percentage of Population Employed in Architecture & Engineering in the United States?
Percentage of Population Employed in Architecture & Engineering in the United States is 2.1%.