Peachtree City, GA Map & Demographics
Peachtree City Map
Peachtree City Overview
$57,849
PER CAPITA INCOME
$139,152
AVG FAMILY INCOME
$111,850
AVG HOUSEHOLD INCOME
54.1%
WAGE / INCOME GAP [ % ]
45.9¢/ $1
WAGE / INCOME GAP [ $ ]
$13,908
FAMILY INCOME DEFICIT
0.43
INEQUALITY / GINI INDEX
38,414
TOTAL POPULATION
18,430
MALE POPULATION
19,984
FEMALE POPULATION
92.22
MALES / 100 FEMALES
108.43
FEMALES / 100 MALES
44.2
MEDIAN AGE
3.0
AVG FAMILY SIZE
2.6
AVG HOUSEHOLD SIZE
18,023
LABOR FORCE [ PEOPLE ]
59.1%
PERCENT IN LABOR FORCE
3.7%
UNEMPLOYMENT RATE
Peachtree City Zip Codes
Income in Peachtree City
Income Overview in Peachtree City
Per Capita Income in Peachtree City is $57,849, while median incomes of families and households are $139,152 and $111,850 respectively.
| Characteristic | Number | Measure |
| Per Capita Income | 38,414 | $57,849 |
| Median Family Income | 11,027 | $139,152 |
| Mean Family Income | 11,027 | $172,559 |
| Median Household Income | 14,598 | $111,850 |
| Mean Household Income | 14,598 | $148,887 |
| Income Deficit | 11,027 | $13,908 |
| Wage / Income Gap (%) | 38,414 | 54.09% |
| Wage / Income Gap ($) | 38,414 | 45.91¢ per $1 |
| Gini / Inequality Index | 38,414 | 0.43 |
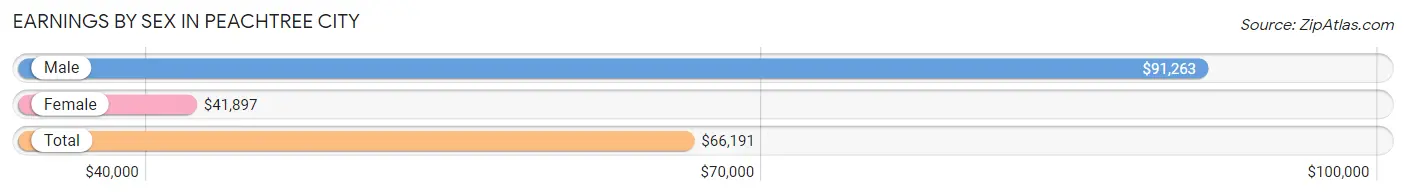
Earnings by Sex in Peachtree City
Average Earnings in Peachtree City are $66,191, $91,263 for men and $41,897 for women, a difference of 54.1%.
| Sex | Number | Average Earnings |
| Male | 10,505 (56.0%) | $91,263 |
| Female | 8,244 (44.0%) | $41,897 |
| Total | 18,749 (100.0%) | $66,191 |
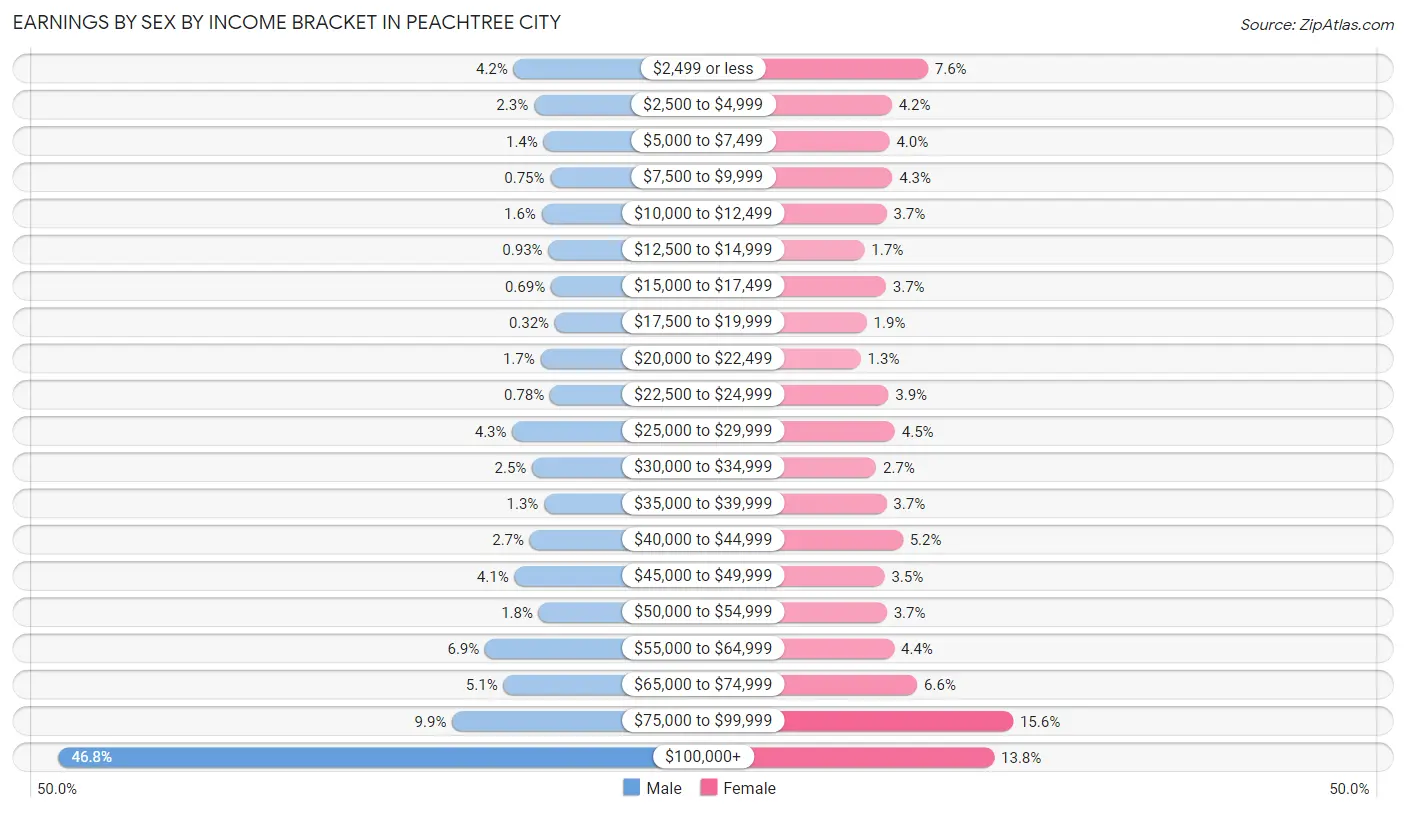
Earnings by Sex by Income Bracket in Peachtree City
The most common earnings brackets in Peachtree City are $100,000+ for men (4,917 | 46.8%) and $75,000 to $99,999 for women (1,284 | 15.6%).
| Income | Male | Female |
| $2,499 or less | 440 (4.2%) | 626 (7.6%) |
| $2,500 to $4,999 | 239 (2.3%) | 347 (4.2%) |
| $5,000 to $7,499 | 145 (1.4%) | 330 (4.0%) |
| $7,500 to $9,999 | 79 (0.7%) | 351 (4.3%) |
| $10,000 to $12,499 | 164 (1.6%) | 307 (3.7%) |
| $12,500 to $14,999 | 98 (0.9%) | 136 (1.7%) |
| $15,000 to $17,499 | 73 (0.7%) | 302 (3.7%) |
| $17,500 to $19,999 | 34 (0.3%) | 153 (1.9%) |
| $20,000 to $22,499 | 175 (1.7%) | 107 (1.3%) |
| $22,500 to $24,999 | 82 (0.8%) | 321 (3.9%) |
| $25,000 to $29,999 | 453 (4.3%) | 371 (4.5%) |
| $30,000 to $34,999 | 257 (2.5%) | 226 (2.7%) |
| $35,000 to $39,999 | 140 (1.3%) | 306 (3.7%) |
| $40,000 to $44,999 | 280 (2.7%) | 432 (5.2%) |
| $45,000 to $49,999 | 432 (4.1%) | 291 (3.5%) |
| $50,000 to $54,999 | 192 (1.8%) | 308 (3.7%) |
| $55,000 to $64,999 | 721 (6.9%) | 365 (4.4%) |
| $65,000 to $74,999 | 540 (5.1%) | 543 (6.6%) |
| $75,000 to $99,999 | 1,044 (9.9%) | 1,284 (15.6%) |
| $100,000+ | 4,917 (46.8%) | 1,138 (13.8%) |
| Total | 10,505 (100.0%) | 8,244 (100.0%) |
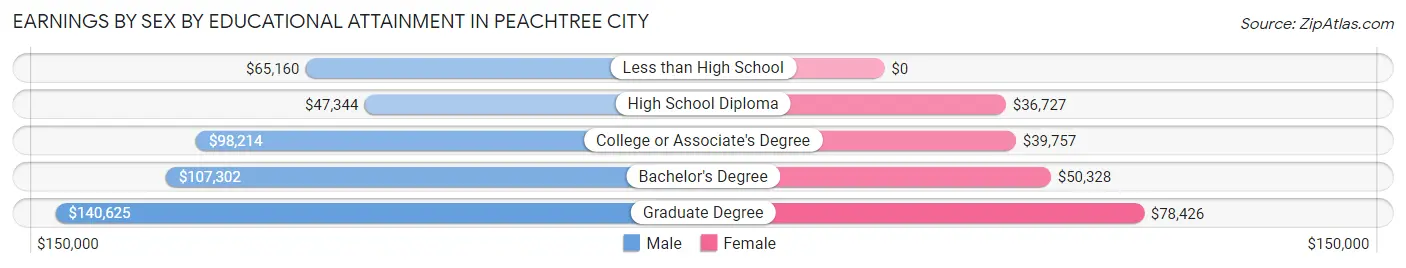
Earnings by Sex by Educational Attainment in Peachtree City
Average earnings in Peachtree City are $108,372 for men and $51,422 for women, a difference of 52.5%. Men with an educational attainment of graduate degree enjoy the highest average annual earnings of $140,625, while those with high school diploma education earn the least with $47,344. Women with an educational attainment of graduate degree earn the most with the average annual earnings of $78,426, while those with high school diploma education have the smallest earnings of $36,727.
| Educational Attainment | Male Income | Female Income |
| Less than High School | $65,160 | $0 |
| High School Diploma | $47,344 | $36,727 |
| College or Associate's Degree | $98,214 | $39,757 |
| Bachelor's Degree | $107,302 | $50,328 |
| Graduate Degree | $140,625 | $78,426 |
| Total | $108,372 | $51,422 |
Family Income in Peachtree City
Family Income Brackets in Peachtree City
According to the Peachtree City family income data, there are 3,661 families falling into the $200,000+ income range, which is the most common income bracket and makes up 33.2% of all families. Conversely, the $10,000 to $14,999 income bracket is the least frequent group with only 11 families (0.1%) belonging to this category.
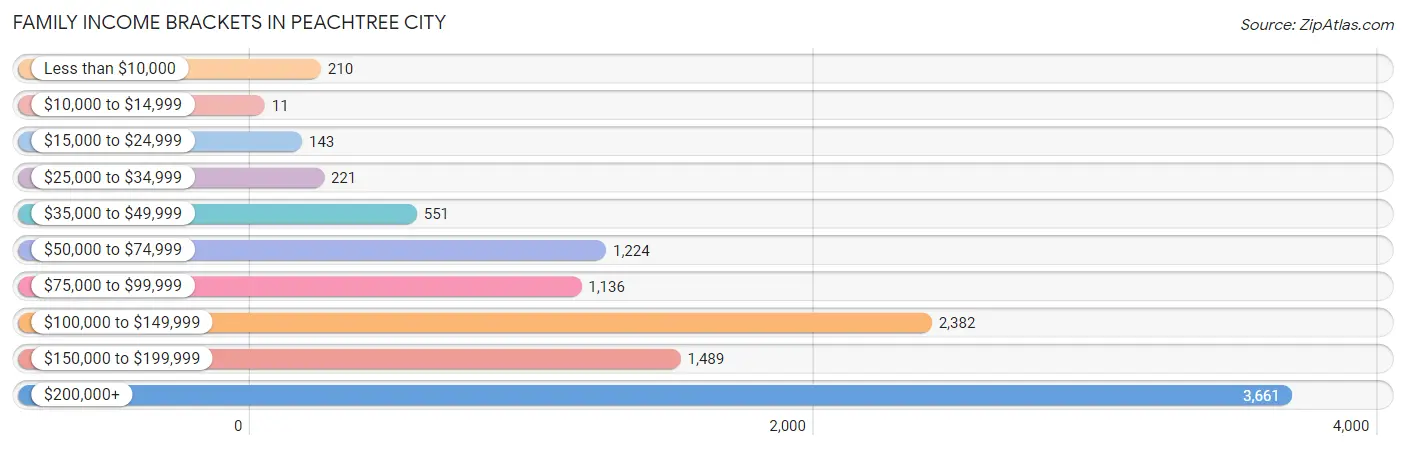
| Income Bracket | # Families | % Families |
| Less than $10,000 | 210 | 1.9% |
| $10,000 to $14,999 | 11 | 0.1% |
| $15,000 to $24,999 | 143 | 1.3% |
| $25,000 to $34,999 | 221 | 2.0% |
| $35,000 to $49,999 | 551 | 5.0% |
| $50,000 to $74,999 | 1,224 | 11.1% |
| $75,000 to $99,999 | 1,136 | 10.3% |
| $100,000 to $149,999 | 2,382 | 21.6% |
| $150,000 to $199,999 | 1,489 | 13.5% |
| $200,000+ | 3,661 | 33.2% |
Family Income by Famaliy Size in Peachtree City
6-person families (317 | 2.9%) account for the highest median family income in Peachtree City with $225,818 per family, while 2-person families (5,023 | 45.6%) have the highest median income of $61,993 per family member.
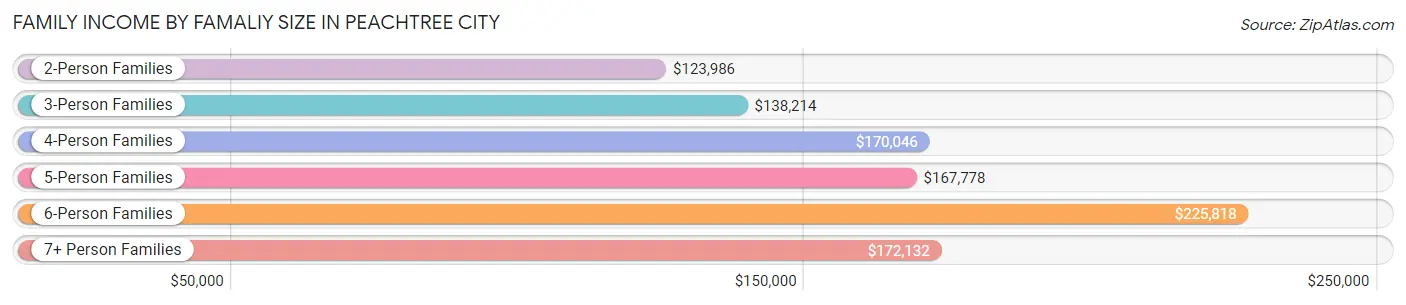
| Income Bracket | # Families | Median Income |
| 2-Person Families | 5,023 (45.6%) | $123,986 |
| 3-Person Families | 2,530 (22.9%) | $138,214 |
| 4-Person Families | 2,406 (21.8%) | $170,046 |
| 5-Person Families | 624 (5.7%) | $167,778 |
| 6-Person Families | 317 (2.9%) | $225,818 |
| 7+ Person Families | 127 (1.1%) | $172,132 |
| Total | 11,027 (100.0%) | $139,152 |
Family Income by Number of Earners in Peachtree City
The median family income in Peachtree City is $139,152, with families comprising 3+ earners (967) having the highest median family income of $197,313, while families with no earners (1,765) have the lowest median family income of $100,012, accounting for 8.8% and 16.0% of families, respectively.
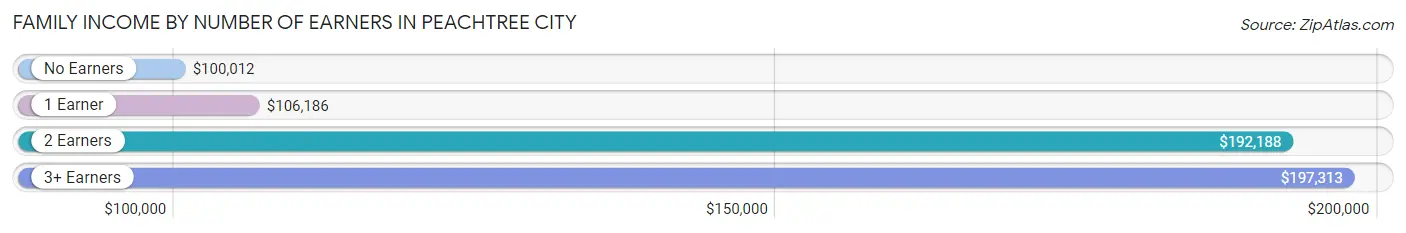
| Number of Earners | # Families | Median Income |
| No Earners | 1,765 (16.0%) | $100,012 |
| 1 Earner | 3,832 (34.7%) | $106,186 |
| 2 Earners | 4,463 (40.5%) | $192,188 |
| 3+ Earners | 967 (8.8%) | $197,313 |
| Total | 11,027 (100.0%) | $139,152 |
Household Income in Peachtree City
Household Income Brackets in Peachtree City
With 3,839 households falling in the category, the $200,000+ income range is the most frequent in Peachtree City, accounting for 26.3% of all households. In contrast, only 248 households (1.7%) fall into the $10,000 to $14,999 income bracket, making it the least populous group.
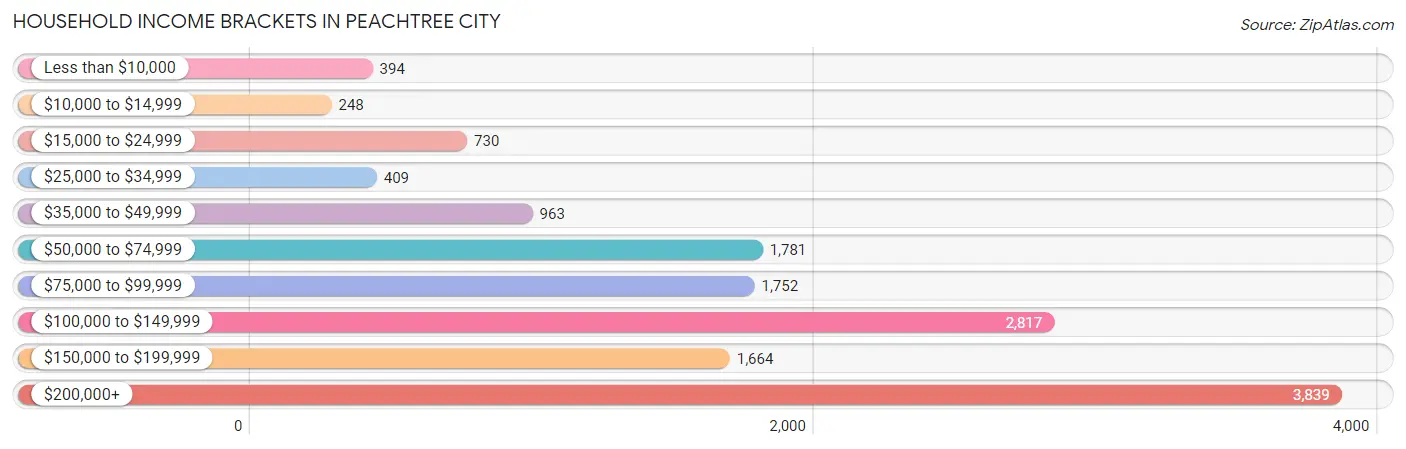
| Income Bracket | # Households | % Households |
| Less than $10,000 | 394 | 2.7% |
| $10,000 to $14,999 | 248 | 1.7% |
| $15,000 to $24,999 | 730 | 5.0% |
| $25,000 to $34,999 | 409 | 2.8% |
| $35,000 to $49,999 | 963 | 6.6% |
| $50,000 to $74,999 | 1,781 | 12.2% |
| $75,000 to $99,999 | 1,752 | 12.0% |
| $100,000 to $149,999 | 2,817 | 19.3% |
| $150,000 to $199,999 | 1,664 | 11.4% |
| $200,000+ | 3,839 | 26.3% |
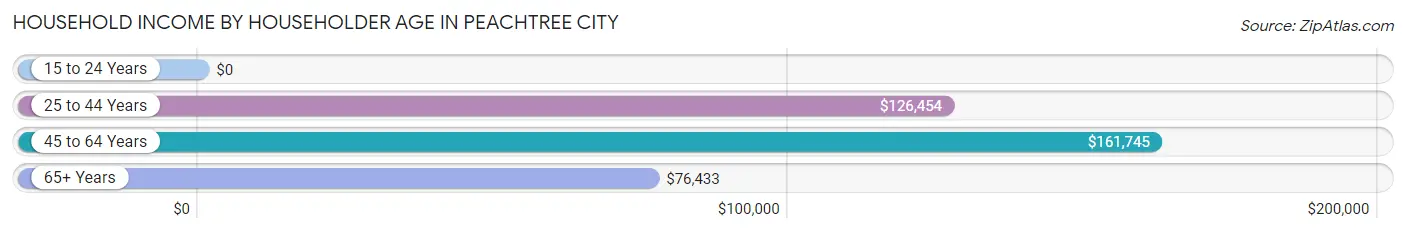
Household Income by Householder Age in Peachtree City
The median household income in Peachtree City is $111,850, with the highest median household income of $161,745 found in the 45 to 64 years age bracket for the primary householder. A total of 6,089 households (41.7%) fall into this category. Meanwhile, the 15 to 24 years age bracket for the primary householder has the lowest median household income of $0, with 528 households (3.6%) in this group.
| Income Bracket | # Households | Median Income |
| 15 to 24 Years | 528 (3.6%) | $0 |
| 25 to 44 Years | 3,287 (22.5%) | $126,454 |
| 45 to 64 Years | 6,089 (41.7%) | $161,745 |
| 65+ Years | 4,694 (32.2%) | $76,433 |
| Total | 14,598 (100.0%) | $111,850 |
Poverty in Peachtree City
Income Below Poverty by Sex and Age in Peachtree City
With 4.8% poverty level for males and 6.7% for females among the residents of Peachtree City, 16 and 17 year old males and 18 to 24 year old females are the most vulnerable to poverty, with 114 males (15.9%) and 286 females (20.5%) in their respective age groups living below the poverty level.
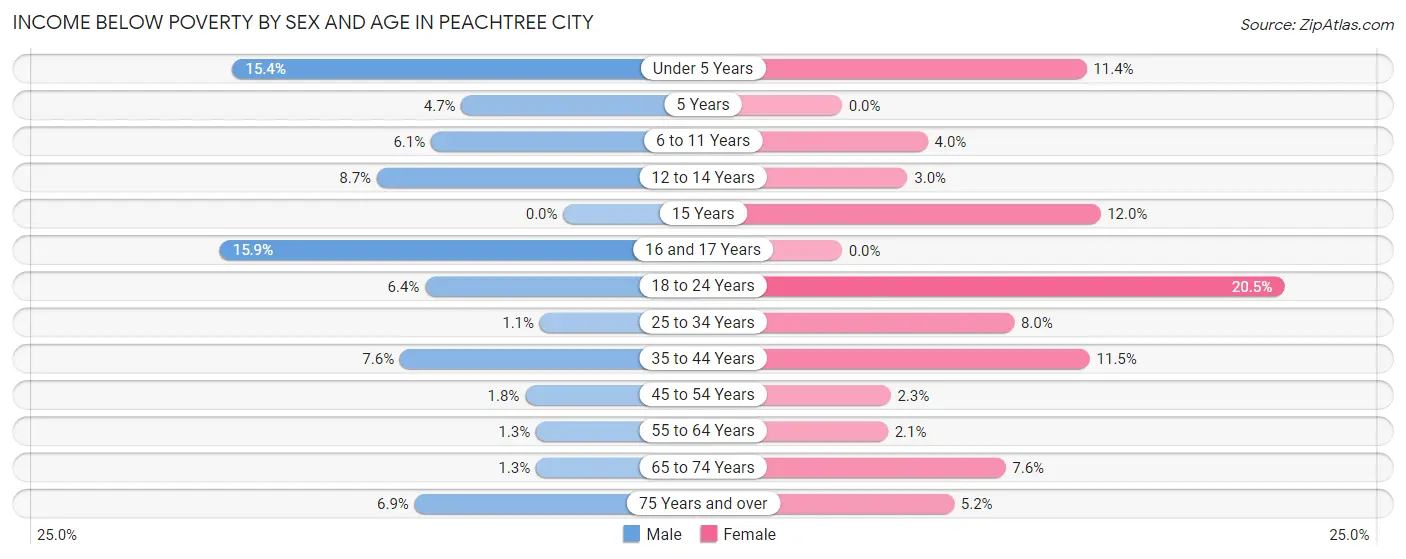
| Age Bracket | Male | Female |
| Under 5 Years | 93 (15.3%) | 79 (11.4%) |
| 5 Years | 14 (4.7%) | 0 (0.0%) |
| 6 to 11 Years | 93 (6.1%) | 58 (4.0%) |
| 12 to 14 Years | 90 (8.6%) | 34 (3.0%) |
| 15 Years | 0 (0.0%) | 71 (12.0%) |
| 16 and 17 Years | 114 (15.9%) | 0 (0.0%) |
| 18 to 24 Years | 98 (6.4%) | 286 (20.5%) |
| 25 to 34 Years | 15 (1.1%) | 113 (8.0%) |
| 35 to 44 Years | 175 (7.6%) | 282 (11.5%) |
| 45 to 54 Years | 51 (1.8%) | 67 (2.3%) |
| 55 to 64 Years | 33 (1.3%) | 57 (2.1%) |
| 65 to 74 Years | 24 (1.3%) | 179 (7.6%) |
| 75 Years and over | 87 (6.9%) | 98 (5.2%) |
| Total | 887 (4.8%) | 1,324 (6.7%) |
Income Above Poverty by Sex and Age in Peachtree City
According to the poverty statistics in Peachtree City, males aged 15 years and females aged 5 years are the age groups that are most secure financially, with 100.0% of males and 100.0% of females in these age groups living above the poverty line.
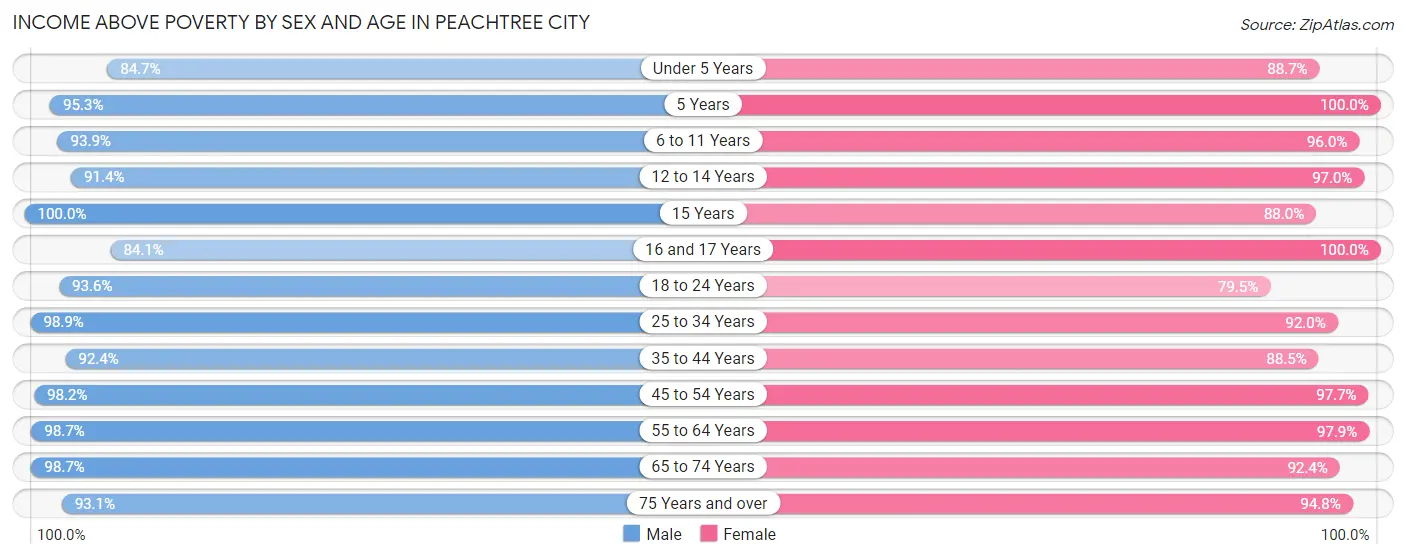
| Age Bracket | Male | Female |
| Under 5 Years | 513 (84.7%) | 617 (88.6%) |
| 5 Years | 282 (95.3%) | 131 (100.0%) |
| 6 to 11 Years | 1,421 (93.9%) | 1,400 (96.0%) |
| 12 to 14 Years | 950 (91.3%) | 1,085 (97.0%) |
| 15 Years | 312 (100.0%) | 521 (88.0%) |
| 16 and 17 Years | 601 (84.1%) | 556 (100.0%) |
| 18 to 24 Years | 1,431 (93.6%) | 1,108 (79.5%) |
| 25 to 34 Years | 1,358 (98.9%) | 1,301 (92.0%) |
| 35 to 44 Years | 2,135 (92.4%) | 2,171 (88.5%) |
| 45 to 54 Years | 2,825 (98.2%) | 2,894 (97.7%) |
| 55 to 64 Years | 2,563 (98.7%) | 2,621 (97.9%) |
| 65 to 74 Years | 1,860 (98.7%) | 2,178 (92.4%) |
| 75 Years and over | 1,173 (93.1%) | 1,788 (94.8%) |
| Total | 17,424 (95.2%) | 18,371 (93.3%) |
Income Below Poverty Among Married-Couple Families in Peachtree City
The poverty statistics for married-couple families in Peachtree City show that 1.3% or 117 of the total 9,391 families live below the poverty line. Families with 5 or more children have the highest poverty rate of 32.3%, comprising of 21 families. On the other hand, families with no children have the lowest poverty rate of 0.2%, which includes 10 families.
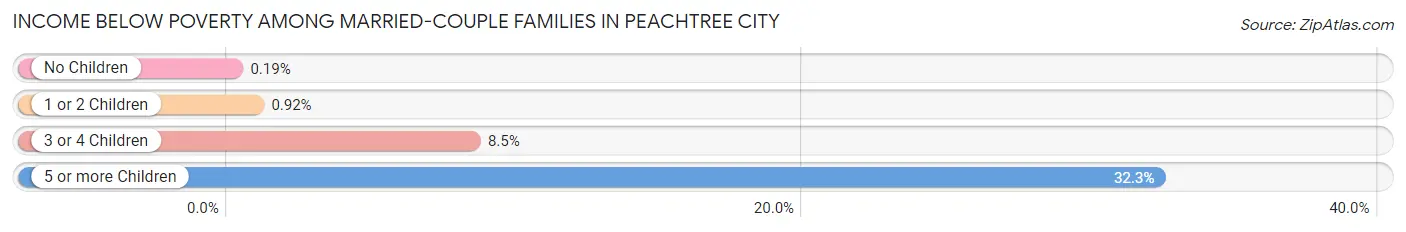
| Children | Above Poverty | Below Poverty |
| No Children | 5,198 (99.8%) | 10 (0.2%) |
| 1 or 2 Children | 3,448 (99.1%) | 32 (0.9%) |
| 3 or 4 Children | 584 (91.5%) | 54 (8.5%) |
| 5 or more Children | 44 (67.7%) | 21 (32.3%) |
| Total | 9,274 (98.8%) | 117 (1.3%) |
Income Below Poverty Among Single-Parent Households in Peachtree City
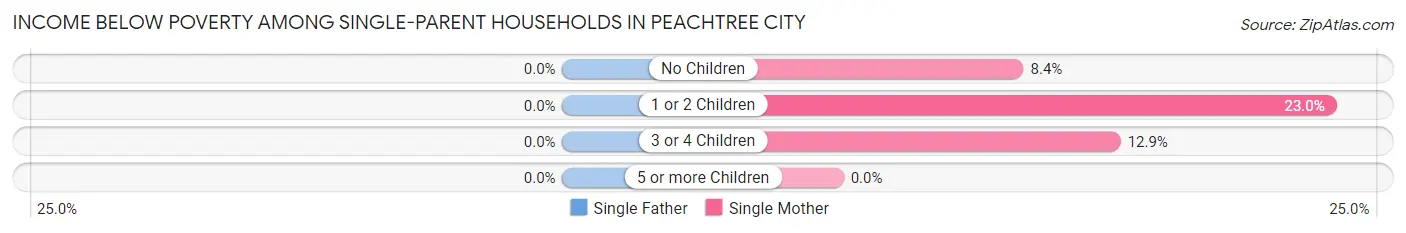
| Children | Single Father | Single Mother |
| No Children | 0 (0.0%) | 32 (8.4%) |
| 1 or 2 Children | 0 (0.0%) | 202 (23.0%) |
| 3 or 4 Children | 0 (0.0%) | 8 (12.9%) |
| 5 or more Children | 0 (0.0%) | 0 (0.0%) |
| Total | 0 (0.0%) | 242 (18.3%) |
Income Below Poverty Among Married-Couple vs Single-Parent Households in Peachtree City
The poverty data for Peachtree City shows that 117 of the married-couple family households (1.3%) and 242 of the single-parent households (14.8%) are living below the poverty level. Within the married-couple family households, those with 5 or more children have the highest poverty rate, with 21 households (32.3%) falling below the poverty line. Among the single-parent households, those with 1 or 2 children have the highest poverty rate, with 202 household (18.7%) living below poverty.
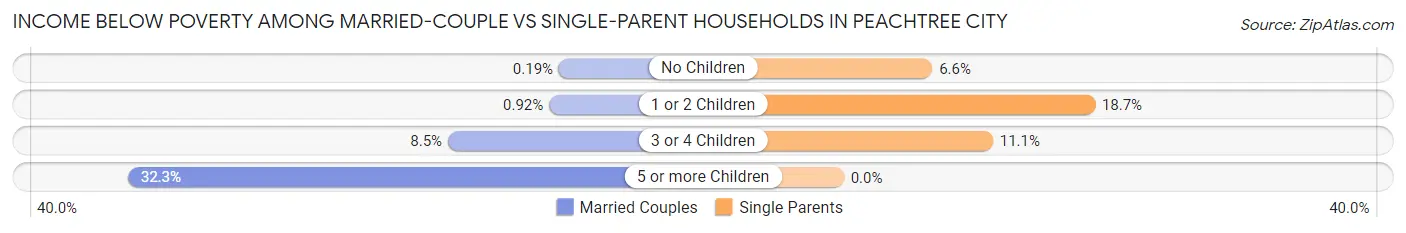
| Children | Married-Couple Families | Single-Parent Households |
| No Children | 10 (0.2%) | 32 (6.6%) |
| 1 or 2 Children | 32 (0.9%) | 202 (18.7%) |
| 3 or 4 Children | 54 (8.5%) | 8 (11.1%) |
| 5 or more Children | 21 (32.3%) | 0 (0.0%) |
| Total | 117 (1.3%) | 242 (14.8%) |
Race in Peachtree City
The most populous races in Peachtree City are White / Caucasian (28,549 | 74.3%), Black / African American (3,480 | 9.1%), and Asian (3,141 | 8.2%).
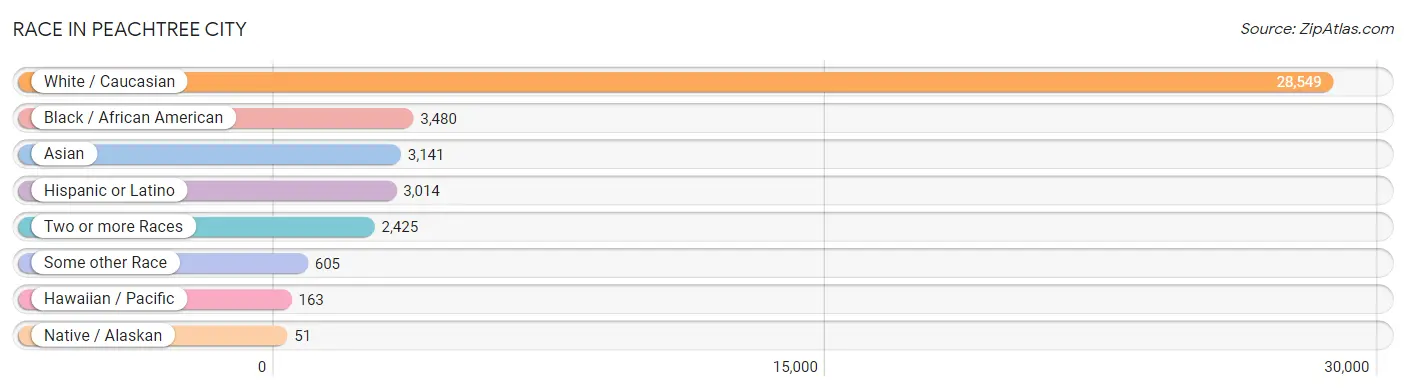
| Race | # Population | % Population |
| Asian | 3,141 | 8.2% |
| Black / African American | 3,480 | 9.1% |
| Hawaiian / Pacific | 163 | 0.4% |
| Hispanic or Latino | 3,014 | 7.9% |
| Native / Alaskan | 51 | 0.1% |
| White / Caucasian | 28,549 | 74.3% |
| Two or more Races | 2,425 | 6.3% |
| Some other Race | 605 | 1.6% |
| Total | 38,414 | 100.0% |
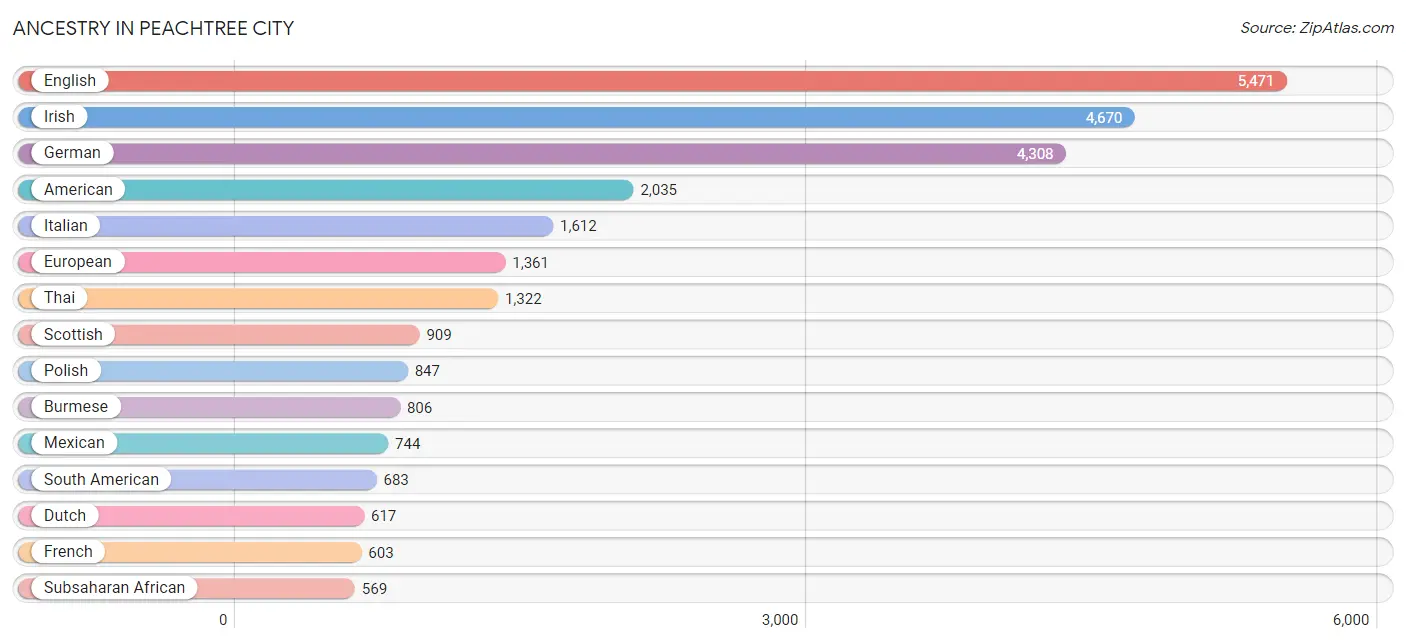
Ancestry in Peachtree City
The most populous ancestries reported in Peachtree City are English (5,471 | 14.2%), Irish (4,670 | 12.2%), German (4,308 | 11.2%), American (2,035 | 5.3%), and Italian (1,612 | 4.2%), together accounting for 47.1% of all Peachtree City residents.
| Ancestry | # Population | % Population |
| African | 194 | 0.5% |
| Albanian | 340 | 0.9% |
| American | 2,035 | 5.3% |
| Arab | 161 | 0.4% |
| Argentinean | 308 | 0.8% |
| Armenian | 16 | 0.0% |
| Austrian | 13 | 0.0% |
| Belgian | 33 | 0.1% |
| Bhutanese | 440 | 1.1% |
| Bolivian | 16 | 0.0% |
| Brazilian | 122 | 0.3% |
| British | 524 | 1.4% |
| Burmese | 806 | 2.1% |
| Cajun | 12 | 0.0% |
| Canadian | 13 | 0.0% |
| Cape Verdean | 11 | 0.0% |
| Central American | 533 | 1.4% |
| Central American Indian | 9 | 0.0% |
| Cherokee | 232 | 0.6% |
| Choctaw | 20 | 0.1% |
| Colombian | 143 | 0.4% |
| Costa Rican | 38 | 0.1% |
| Creek | 17 | 0.0% |
| Cuban | 399 | 1.0% |
| Czech | 158 | 0.4% |
| Czechoslovakian | 5 | 0.0% |
| Danish | 72 | 0.2% |
| Dominican | 22 | 0.1% |
| Dutch | 617 | 1.6% |
| Eastern European | 182 | 0.5% |
| Ecuadorian | 55 | 0.1% |
| Egyptian | 82 | 0.2% |
| English | 5,471 | 14.2% |
| European | 1,361 | 3.5% |
| Finnish | 25 | 0.1% |
| French | 603 | 1.6% |
| French Canadian | 230 | 0.6% |
| German | 4,308 | 11.2% |
| Greek | 238 | 0.6% |
| Guamanian / Chamorro | 279 | 0.7% |
| Guatemalan | 187 | 0.5% |
| Honduran | 274 | 0.7% |
| Hungarian | 333 | 0.9% |
| Indian (Asian) | 361 | 0.9% |
| Indonesian | 26 | 0.1% |
| Iranian | 18 | 0.1% |
| Irish | 4,670 | 12.2% |
| Italian | 1,612 | 4.2% |
| Jamaican | 91 | 0.2% |
| Korean | 277 | 0.7% |
| Laotian | 57 | 0.2% |
| Latvian | 10 | 0.0% |
| Lebanese | 16 | 0.0% |
| Lithuanian | 45 | 0.1% |
| Mexican | 744 | 1.9% |
| Nicaraguan | 4 | 0.0% |
| Nigerian | 265 | 0.7% |
| Northern European | 168 | 0.4% |
| Norwegian | 492 | 1.3% |
| Pakistani | 36 | 0.1% |
| Panamanian | 18 | 0.1% |
| Pennsylvania German | 28 | 0.1% |
| Peruvian | 85 | 0.2% |
| Polish | 847 | 2.2% |
| Portuguese | 116 | 0.3% |
| Potawatomi | 8 | 0.0% |
| Puerto Rican | 507 | 1.3% |
| Romanian | 68 | 0.2% |
| Russian | 195 | 0.5% |
| Salvadoran | 12 | 0.0% |
| Scandinavian | 178 | 0.5% |
| Scotch-Irish | 335 | 0.9% |
| Scottish | 909 | 2.4% |
| Slavic | 28 | 0.1% |
| Slovak | 150 | 0.4% |
| South African | 56 | 0.2% |
| South American | 683 | 1.8% |
| South American Indian | 17 | 0.0% |
| Spanish | 29 | 0.1% |
| Spanish American | 25 | 0.1% |
| Sri Lankan | 89 | 0.2% |
| Subsaharan African | 569 | 1.5% |
| Swedish | 275 | 0.7% |
| Swiss | 38 | 0.1% |
| Thai | 1,322 | 3.4% |
| Trinidadian and Tobagonian | 19 | 0.1% |
| Turkish | 37 | 0.1% |
| Ukrainian | 98 | 0.3% |
| Venezuelan | 76 | 0.2% |
| Welsh | 306 | 0.8% |
| Zimbabwean | 58 | 0.2% | View All 91 Rows |
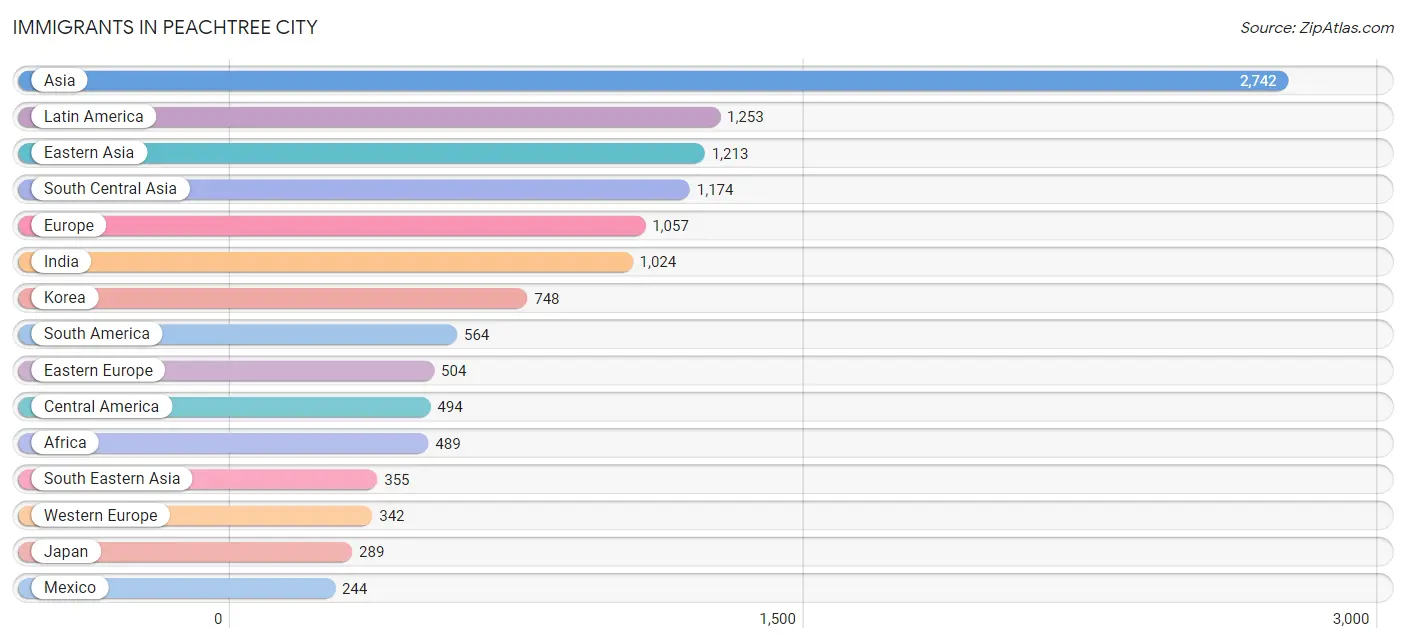
Immigrants in Peachtree City
The most numerous immigrant groups reported in Peachtree City came from Asia (2,742 | 7.1%), Latin America (1,253 | 3.3%), Eastern Asia (1,213 | 3.2%), South Central Asia (1,174 | 3.1%), and Europe (1,057 | 2.8%), together accounting for 19.4% of all Peachtree City residents.
| Immigration Origin | # Population | % Population |
| Africa | 489 | 1.3% |
| Argentina | 110 | 0.3% |
| Asia | 2,742 | 7.1% |
| Australia | 9 | 0.0% |
| Bangladesh | 132 | 0.3% |
| Bolivia | 24 | 0.1% |
| Brazil | 131 | 0.3% |
| Cameroon | 61 | 0.2% |
| Canada | 211 | 0.5% |
| Caribbean | 195 | 0.5% |
| Central America | 494 | 1.3% |
| China | 176 | 0.5% |
| Colombia | 83 | 0.2% |
| Cuba | 77 | 0.2% |
| Czechoslovakia | 53 | 0.1% |
| Dominican Republic | 9 | 0.0% |
| Eastern Africa | 59 | 0.2% |
| Eastern Asia | 1,213 | 3.2% |
| Eastern Europe | 504 | 1.3% |
| Ecuador | 55 | 0.1% |
| England | 55 | 0.1% |
| Europe | 1,057 | 2.8% |
| France | 27 | 0.1% |
| Germany | 196 | 0.5% |
| Guatemala | 11 | 0.0% |
| Honduras | 222 | 0.6% |
| Hong Kong | 42 | 0.1% |
| Hungary | 30 | 0.1% |
| India | 1,024 | 2.7% |
| Indonesia | 50 | 0.1% |
| Iran | 18 | 0.1% |
| Ireland | 15 | 0.0% |
| Jamaica | 90 | 0.2% |
| Japan | 289 | 0.7% |
| Korea | 748 | 1.9% |
| Latin America | 1,253 | 3.3% |
| Latvia | 10 | 0.0% |
| Malaysia | 17 | 0.0% |
| Mexico | 244 | 0.6% |
| Middle Africa | 61 | 0.2% |
| Netherlands | 119 | 0.3% |
| Nigeria | 200 | 0.5% |
| Northern Africa | 30 | 0.1% |
| Northern Europe | 201 | 0.5% |
| Oceania | 36 | 0.1% |
| Panama | 17 | 0.0% |
| Peru | 85 | 0.2% |
| Philippines | 211 | 0.5% |
| Poland | 110 | 0.3% |
| Portugal | 10 | 0.0% |
| Romania | 11 | 0.0% |
| Russia | 12 | 0.0% |
| Scotland | 23 | 0.1% |
| South Africa | 123 | 0.3% |
| South America | 564 | 1.5% |
| South Central Asia | 1,174 | 3.1% |
| South Eastern Asia | 355 | 0.9% |
| Southern Europe | 10 | 0.0% |
| Thailand | 36 | 0.1% |
| Trinidad and Tobago | 19 | 0.1% |
| Ukraine | 30 | 0.1% |
| Venezuela | 76 | 0.2% |
| Vietnam | 29 | 0.1% |
| Western Africa | 200 | 0.5% |
| Western Europe | 342 | 0.9% |
| Zimbabwe | 58 | 0.2% | View All 66 Rows |
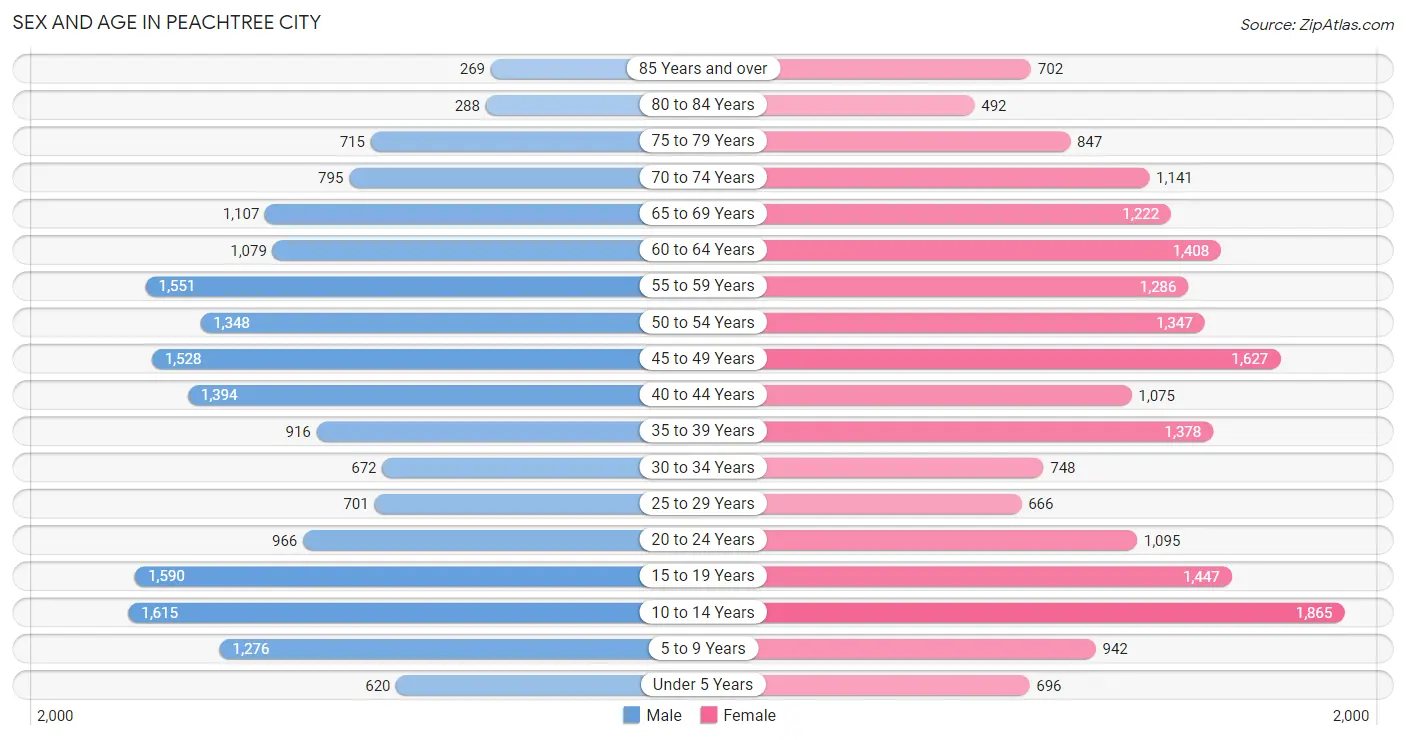
Sex and Age in Peachtree City
Sex and Age in Peachtree City
The most populous age groups in Peachtree City are 10 to 14 Years (1,615 | 8.8%) for men and 10 to 14 Years (1,865 | 9.3%) for women.
| Age Bracket | Male | Female |
| Under 5 Years | 620 (3.4%) | 696 (3.5%) |
| 5 to 9 Years | 1,276 (6.9%) | 942 (4.7%) |
| 10 to 14 Years | 1,615 (8.8%) | 1,865 (9.3%) |
| 15 to 19 Years | 1,590 (8.6%) | 1,447 (7.2%) |
| 20 to 24 Years | 966 (5.2%) | 1,095 (5.5%) |
| 25 to 29 Years | 701 (3.8%) | 666 (3.3%) |
| 30 to 34 Years | 672 (3.6%) | 748 (3.7%) |
| 35 to 39 Years | 916 (5.0%) | 1,378 (6.9%) |
| 40 to 44 Years | 1,394 (7.6%) | 1,075 (5.4%) |
| 45 to 49 Years | 1,528 (8.3%) | 1,627 (8.1%) |
| 50 to 54 Years | 1,348 (7.3%) | 1,347 (6.7%) |
| 55 to 59 Years | 1,551 (8.4%) | 1,286 (6.4%) |
| 60 to 64 Years | 1,079 (5.9%) | 1,408 (7.0%) |
| 65 to 69 Years | 1,107 (6.0%) | 1,222 (6.1%) |
| 70 to 74 Years | 795 (4.3%) | 1,141 (5.7%) |
| 75 to 79 Years | 715 (3.9%) | 847 (4.2%) |
| 80 to 84 Years | 288 (1.6%) | 492 (2.5%) |
| 85 Years and over | 269 (1.5%) | 702 (3.5%) |
| Total | 18,430 (100.0%) | 19,984 (100.0%) |
Families and Households in Peachtree City
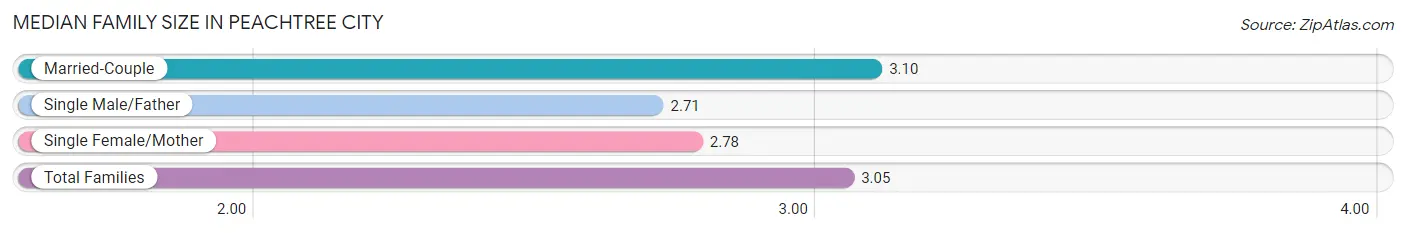
Median Family Size in Peachtree City
The median family size in Peachtree City is 3.05 persons per family, with married-couple families (9,391 | 85.2%) accounting for the largest median family size of 3.1 persons per family. On the other hand, single male/father families (312 | 2.8%) represent the smallest median family size with 2.71 persons per family.
| Family Type | # Families | Family Size |
| Married-Couple | 9,391 (85.2%) | 3.10 |
| Single Male/Father | 312 (2.8%) | 2.71 |
| Single Female/Mother | 1,324 (12.0%) | 2.78 |
| Total Families | 11,027 (100.0%) | 3.05 |
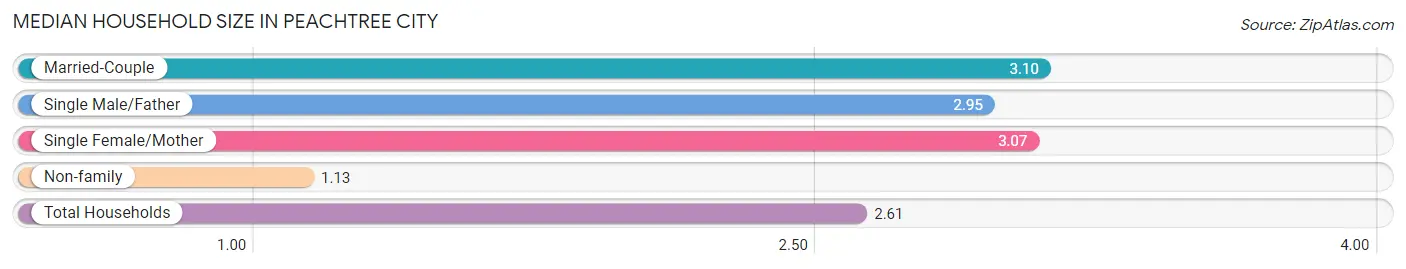
Median Household Size in Peachtree City
The median household size in Peachtree City is 2.61 persons per household, with married-couple households (9,391 | 64.3%) accounting for the largest median household size of 3.1 persons per household. non-family households (3,571 | 24.5%) represent the smallest median household size with 1.13 persons per household.
| Household Type | # Households | Household Size |
| Married-Couple | 9,391 (64.3%) | 3.10 |
| Single Male/Father | 312 (2.1%) | 2.95 |
| Single Female/Mother | 1,324 (9.1%) | 3.07 |
| Non-family | 3,571 (24.5%) | 1.13 |
| Total Households | 14,598 (100.0%) | 2.61 |
Household Size by Marriage Status in Peachtree City
Out of a total of 14,598 households in Peachtree City, 11,027 (75.5%) are family households, while 3,571 (24.5%) are nonfamily households. The most numerous type of family households are 2-person households, comprising 4,835, and the most common type of nonfamily households are 1-person households, comprising 3,147.
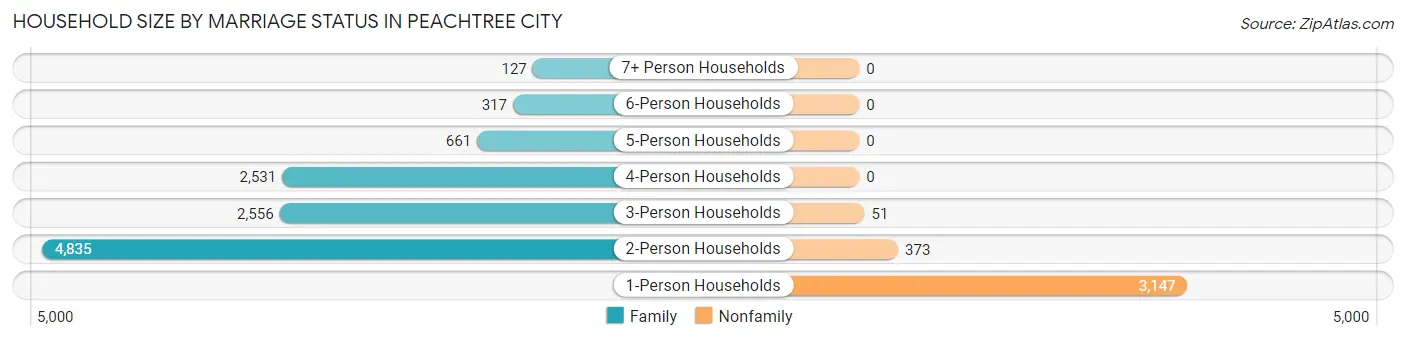
| Household Size | Family Households | Nonfamily Households |
| 1-Person Households | - | 3,147 (21.6%) |
| 2-Person Households | 4,835 (33.1%) | 373 (2.6%) |
| 3-Person Households | 2,556 (17.5%) | 51 (0.4%) |
| 4-Person Households | 2,531 (17.3%) | 0 (0.0%) |
| 5-Person Households | 661 (4.5%) | 0 (0.0%) |
| 6-Person Households | 317 (2.2%) | 0 (0.0%) |
| 7+ Person Households | 127 (0.9%) | 0 (0.0%) |
| Total | 11,027 (75.5%) | 3,571 (24.5%) |
Female Fertility in Peachtree City
Fertility by Age in Peachtree City
Average fertility rate in Peachtree City is 45.0 births per 1,000 women. Women in the age bracket of 20 to 34 years have the highest fertility rate with 91.0 births per 1,000 women. Women in the age bracket of 20 to 34 years acount for 61.6% of all women with births.
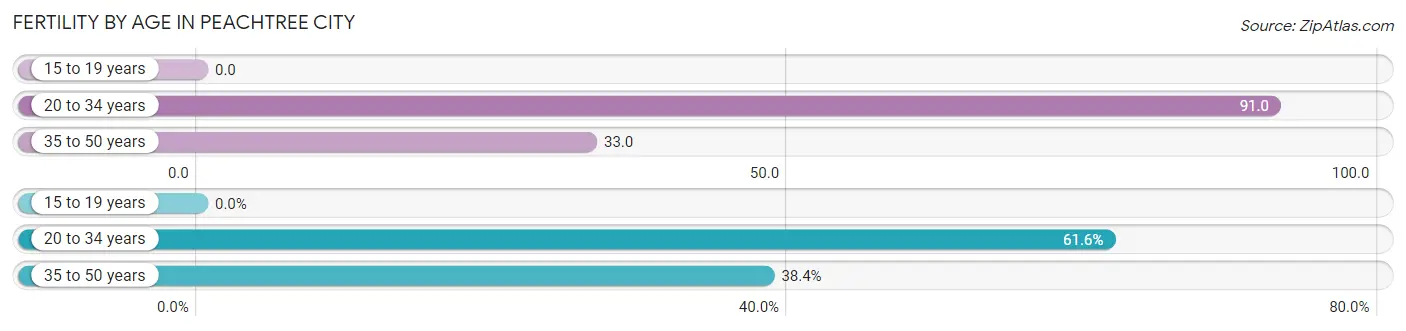
| Age Bracket | Women with Births | Births / 1,000 Women |
| 15 to 19 years | 0 (0.0%) | 0.0 |
| 20 to 34 years | 229 (61.6%) | 91.0 |
| 35 to 50 years | 143 (38.4%) | 33.0 |
| Total | 372 (100.0%) | 45.0 |
Fertility by Age by Marriage Status in Peachtree City
66.9% of women with births (372) in Peachtree City are married. The highest percentage of unmarried women with births falls into 20 to 34 years age bracket with 33.6% of them unmarried at the time of birth, while the lowest percentage of unmarried women with births belong to 35 to 50 years age bracket with 32.2% of them unmarried.
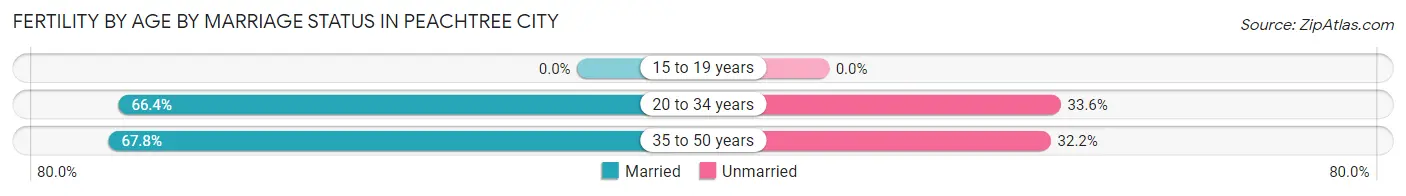
| Age Bracket | Married | Unmarried |
| 15 to 19 years | 0 (0.0%) | 0 (0.0%) |
| 20 to 34 years | 152 (66.4%) | 77 (33.6%) |
| 35 to 50 years | 97 (67.8%) | 46 (32.2%) |
| Total | 249 (66.9%) | 123 (33.1%) |
Fertility by Education in Peachtree City
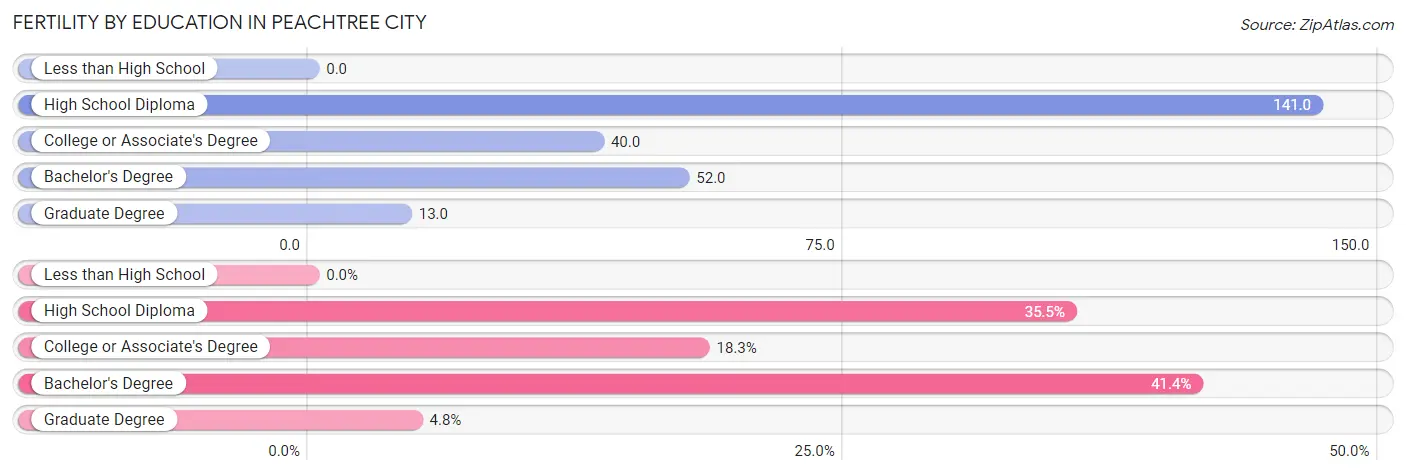
| Educational Attainment | Women with Births | Births / 1,000 Women |
| Less than High School | 0 (0.0%) | 0.0 |
| High School Diploma | 132 (35.5%) | 141.0 |
| College or Associate's Degree | 68 (18.3%) | 40.0 |
| Bachelor's Degree | 154 (41.4%) | 52.0 |
| Graduate Degree | 18 (4.8%) | 13.0 |
| Total | 372 (100.0%) | 45.0 |
Fertility by Education by Marriage Status in Peachtree City
33.1% of women with births in Peachtree City are unmarried. Women with the educational attainment of bachelor's degree are most likely to be married with 100.0% of them married at childbirth, while women with the educational attainment of graduate degree are least likely to be married with 83.3% of them unmarried at childbirth.
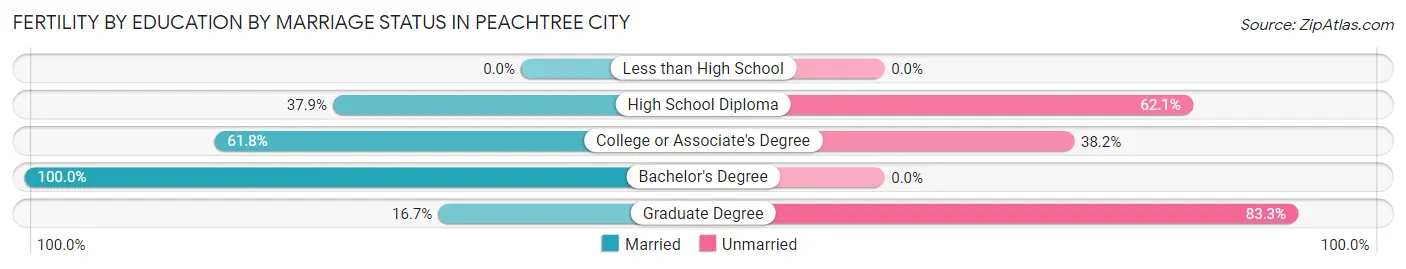
| Educational Attainment | Married | Unmarried |
| Less than High School | 0 (0.0%) | 0 (0.0%) |
| High School Diploma | 50 (37.9%) | 82 (62.1%) |
| College or Associate's Degree | 42 (61.8%) | 26 (38.2%) |
| Bachelor's Degree | 154 (100.0%) | 0 (0.0%) |
| Graduate Degree | 3 (16.7%) | 15 (83.3%) |
| Total | 249 (66.9%) | 123 (33.1%) |
Employment Characteristics in Peachtree City
Employment by Class of Employer in Peachtree City
Among the 17,081 employed individuals in Peachtree City, private company employees (11,787 | 69.0%), not-for-profit organizations (1,563 | 9.1%), and self-employed (incorporated) (1,203 | 7.0%) make up the most common classes of employment.
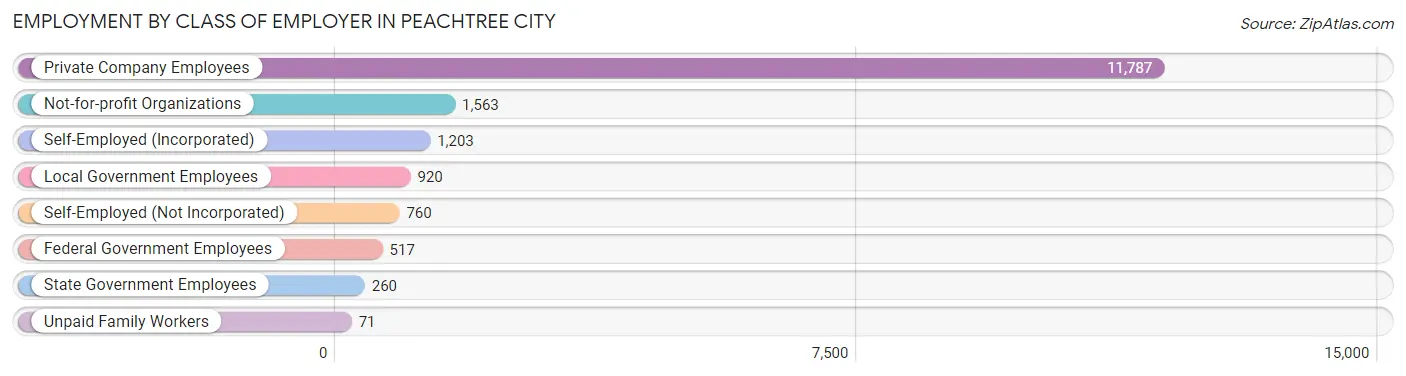
| Employer Class | # Employees | % Employees |
| Private Company Employees | 11,787 | 69.0% |
| Self-Employed (Incorporated) | 1,203 | 7.0% |
| Self-Employed (Not Incorporated) | 760 | 4.4% |
| Not-for-profit Organizations | 1,563 | 9.1% |
| Local Government Employees | 920 | 5.4% |
| State Government Employees | 260 | 1.5% |
| Federal Government Employees | 517 | 3.0% |
| Unpaid Family Workers | 71 | 0.4% |
| Total | 17,081 | 100.0% |
Employment Status by Age in Peachtree City
According to the labor force statistics for Peachtree City, out of the total population over 16 years of age (30,496), 59.1% or 18,023 individuals are in the labor force, with 3.7% or 667 of them unemployed. The age group with the highest labor force participation rate is 45 to 54 years, with 84.5% or 4,943 individuals in the labor force. Within the labor force, the 16 to 19 years age range has the highest percentage of unemployed individuals, with 19.9% or 134 of them being unemployed.
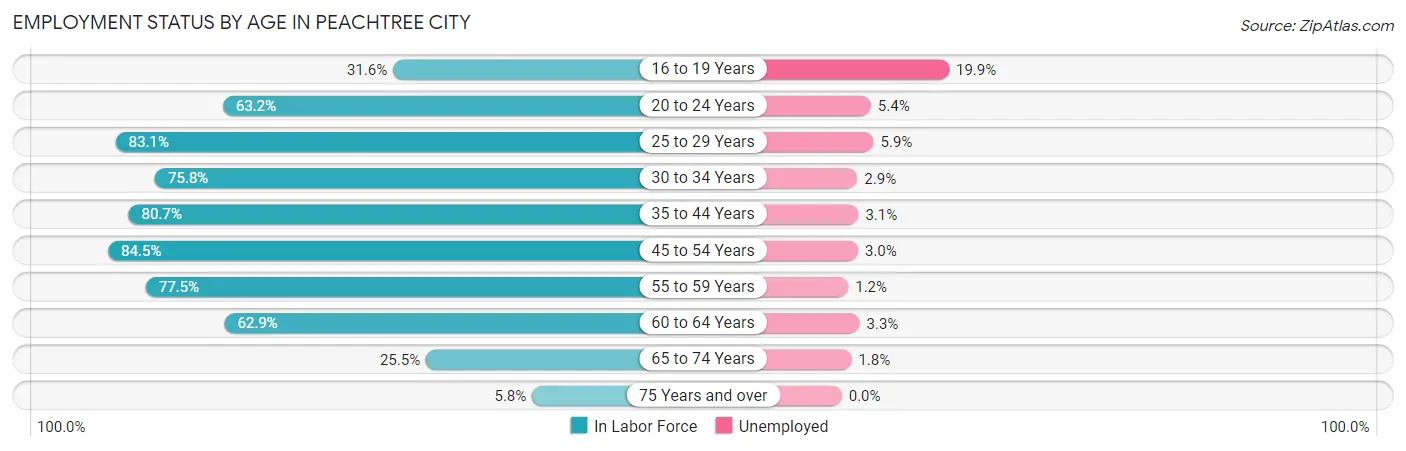
| Age Bracket | In Labor Force | Unemployed |
| 16 to 19 Years | 674 (31.6%) | 134 (19.9%) |
| 20 to 24 Years | 1,303 (63.2%) | 70 (5.4%) |
| 25 to 29 Years | 1,136 (83.1%) | 67 (5.9%) |
| 30 to 34 Years | 1,076 (75.8%) | 31 (2.9%) |
| 35 to 44 Years | 3,844 (80.7%) | 119 (3.1%) |
| 45 to 54 Years | 4,943 (84.5%) | 148 (3.0%) |
| 55 to 59 Years | 2,199 (77.5%) | 26 (1.2%) |
| 60 to 64 Years | 1,564 (62.9%) | 52 (3.3%) |
| 65 to 74 Years | 1,088 (25.5%) | 20 (1.8%) |
| 75 Years and over | 192 (5.8%) | 0 (0.0%) |
| Total | 18,023 (59.1%) | 667 (3.7%) |
Employment Status by Educational Attainment in Peachtree City
According to labor force statistics for Peachtree City, 78.8% of individuals (14,755) out of the total population between 25 and 64 years of age (18,724) are in the labor force, with 3.0% or 443 of them being unemployed. The group with the highest labor force participation rate are those with the educational attainment of bachelor's degree or higher, with 83.5% or 10,565 individuals in the labor force. Within the labor force, individuals with college / associate degree education have the highest percentage of unemployment, with 5.2% or 145 of them being unemployed.
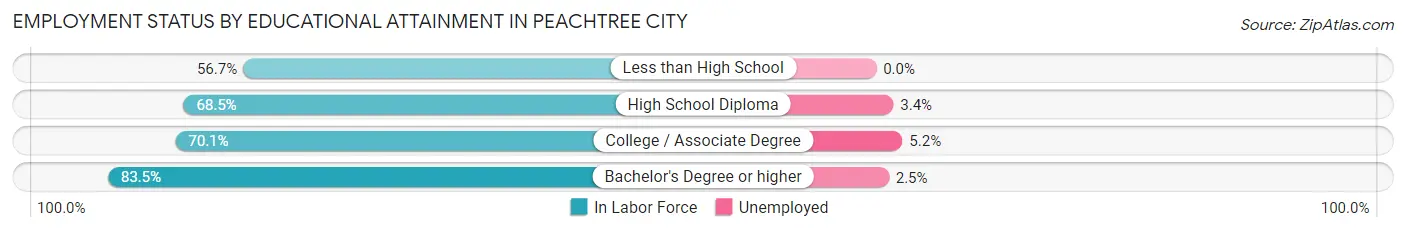
| Educational Attainment | In Labor Force | Unemployed |
| Less than High School | 152 (56.7%) | 0 (0.0%) |
| High School Diploma | 1,241 (68.5%) | 62 (3.4%) |
| College / Associate Degree | 2,798 (70.1%) | 208 (5.2%) |
| Bachelor's Degree or higher | 10,565 (83.5%) | 316 (2.5%) |
| Total | 14,755 (78.8%) | 562 (3.0%) |
Employment Occupations by Sex in Peachtree City
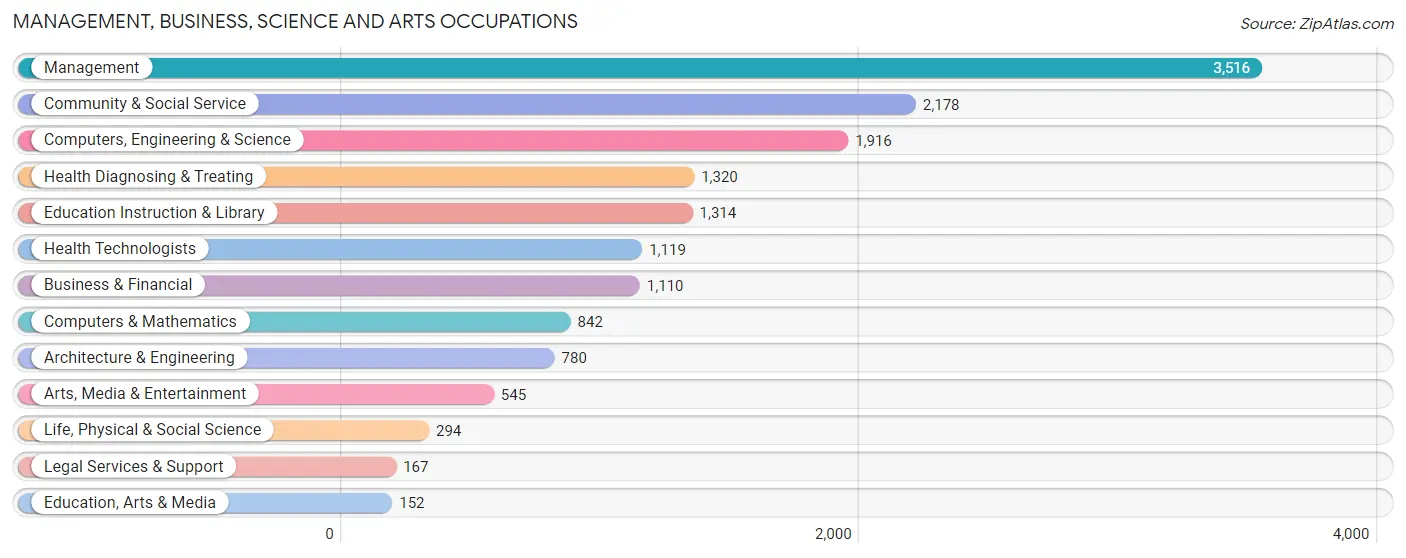
Management, Business, Science and Arts Occupations
The most common Management, Business, Science and Arts occupations in Peachtree City are Management (3,516 | 20.3%), Community & Social Service (2,178 | 12.6%), Computers, Engineering & Science (1,916 | 11.1%), Health Diagnosing & Treating (1,320 | 7.6%), and Education Instruction & Library (1,314 | 7.6%).
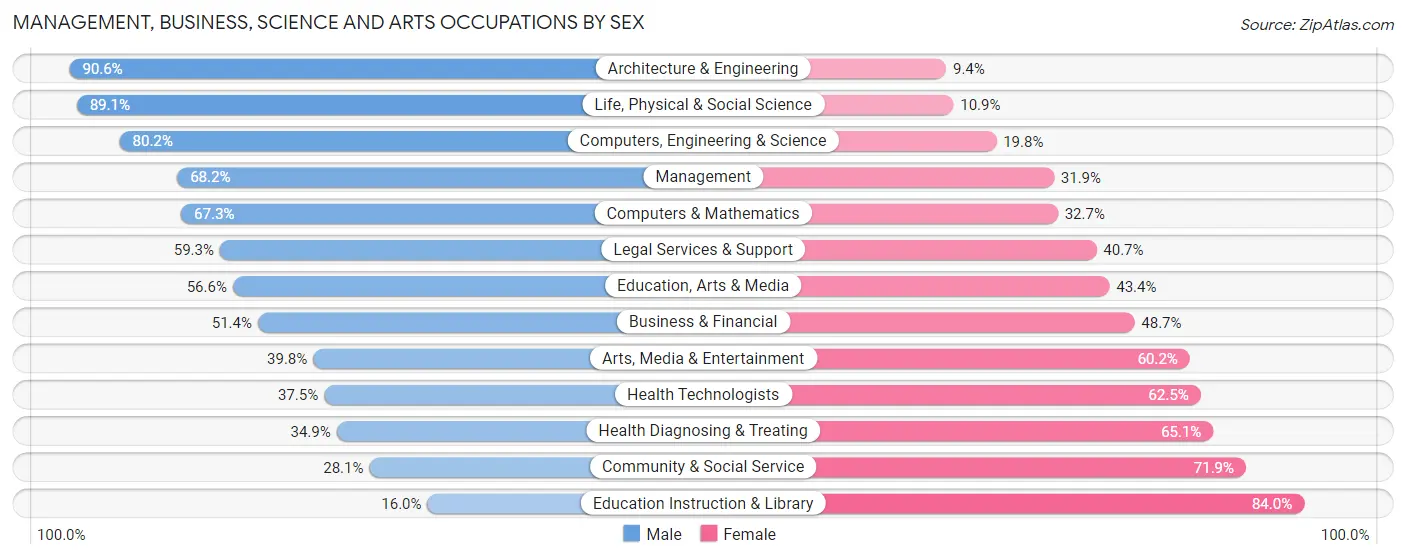
Management, Business, Science and Arts Occupations by Sex
Within the Management, Business, Science and Arts occupations in Peachtree City, the most male-oriented occupations are Architecture & Engineering (90.6%), Life, Physical & Social Science (89.1%), and Computers, Engineering & Science (80.2%), while the most female-oriented occupations are Education Instruction & Library (84.0%), Community & Social Service (71.9%), and Health Diagnosing & Treating (65.1%).
| Occupation | Male | Female |
| Management | 2,396 (68.1%) | 1,120 (31.9%) |
| Business & Financial | 570 (51.3%) | 540 (48.6%) |
| Computers, Engineering & Science | 1,536 (80.2%) | 380 (19.8%) |
| Computers & Mathematics | 567 (67.3%) | 275 (32.7%) |
| Architecture & Engineering | 707 (90.6%) | 73 (9.4%) |
| Life, Physical & Social Science | 262 (89.1%) | 32 (10.9%) |
| Community & Social Service | 612 (28.1%) | 1,566 (71.9%) |
| Education, Arts & Media | 86 (56.6%) | 66 (43.4%) |
| Legal Services & Support | 99 (59.3%) | 68 (40.7%) |
| Education Instruction & Library | 210 (16.0%) | 1,104 (84.0%) |
| Arts, Media & Entertainment | 217 (39.8%) | 328 (60.2%) |
| Health Diagnosing & Treating | 461 (34.9%) | 859 (65.1%) |
| Health Technologists | 420 (37.5%) | 699 (62.5%) |
| Total (Category) | 5,575 (55.5%) | 4,465 (44.5%) |
| Total (Overall) | 9,866 (56.9%) | 7,471 (43.1%) |
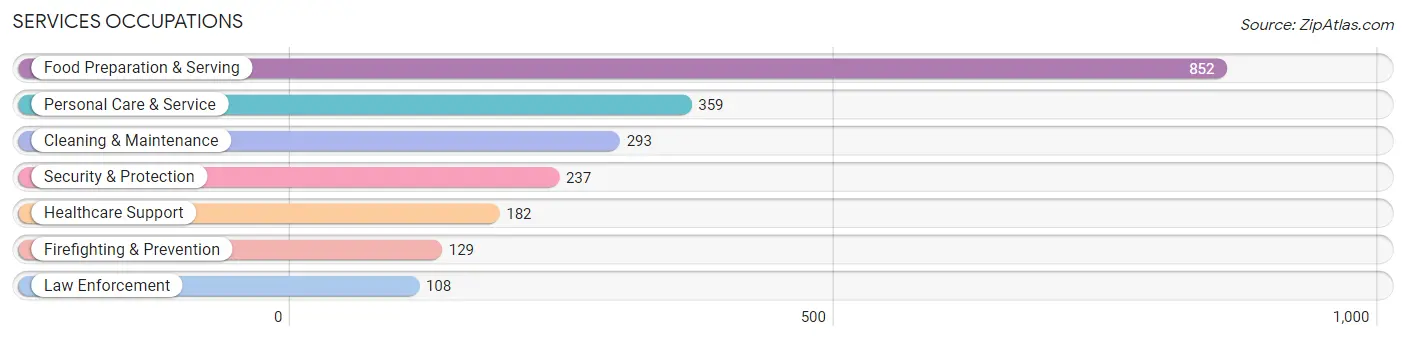
Services Occupations
The most common Services occupations in Peachtree City are Food Preparation & Serving (852 | 4.9%), Personal Care & Service (359 | 2.1%), Cleaning & Maintenance (293 | 1.7%), Security & Protection (237 | 1.4%), and Healthcare Support (182 | 1.1%).
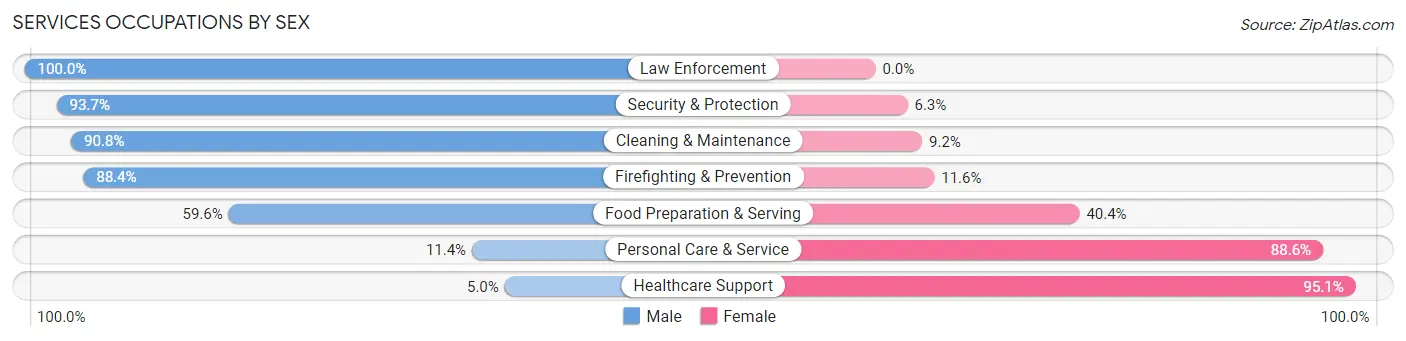
Services Occupations by Sex
Within the Services occupations in Peachtree City, the most male-oriented occupations are Law Enforcement (100.0%), Security & Protection (93.7%), and Cleaning & Maintenance (90.8%), while the most female-oriented occupations are Healthcare Support (95.1%), Personal Care & Service (88.6%), and Food Preparation & Serving (40.4%).
| Occupation | Male | Female |
| Healthcare Support | 9 (5.0%) | 173 (95.1%) |
| Security & Protection | 222 (93.7%) | 15 (6.3%) |
| Firefighting & Prevention | 114 (88.4%) | 15 (11.6%) |
| Law Enforcement | 108 (100.0%) | 0 (0.0%) |
| Food Preparation & Serving | 508 (59.6%) | 344 (40.4%) |
| Cleaning & Maintenance | 266 (90.8%) | 27 (9.2%) |
| Personal Care & Service | 41 (11.4%) | 318 (88.6%) |
| Total (Category) | 1,046 (54.4%) | 877 (45.6%) |
| Total (Overall) | 9,866 (56.9%) | 7,471 (43.1%) |
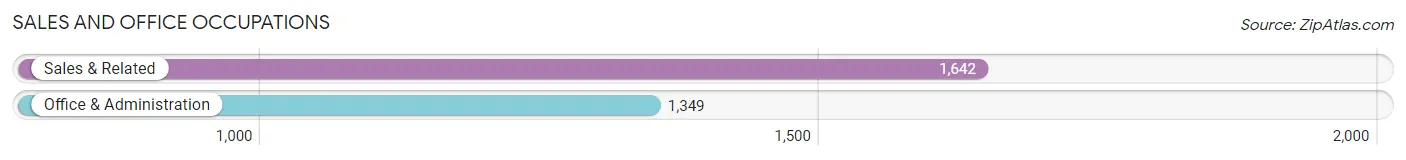
Sales and Office Occupations
The most common Sales and Office occupations in Peachtree City are Sales & Related (1,642 | 9.5%), and Office & Administration (1,349 | 7.8%).
Sales and Office Occupations by Sex
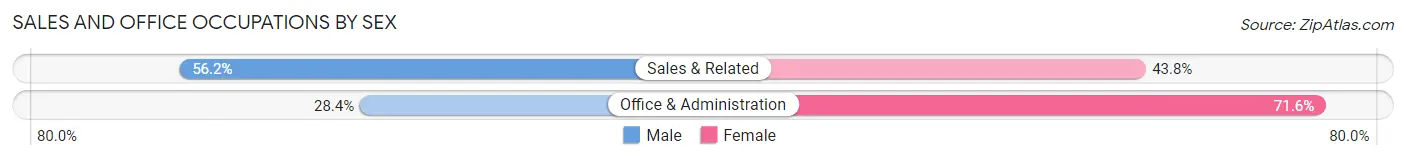
| Occupation | Male | Female |
| Sales & Related | 923 (56.2%) | 719 (43.8%) |
| Office & Administration | 383 (28.4%) | 966 (71.6%) |
| Total (Category) | 1,306 (43.7%) | 1,685 (56.3%) |
| Total (Overall) | 9,866 (56.9%) | 7,471 (43.1%) |
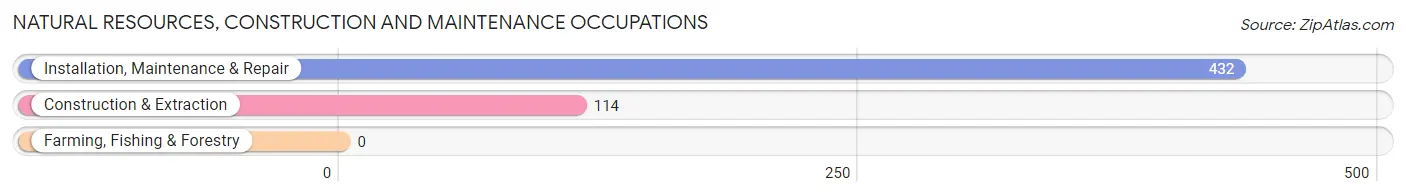
Natural Resources, Construction and Maintenance Occupations
The most common Natural Resources, Construction and Maintenance occupations in Peachtree City are Installation, Maintenance & Repair (432 | 2.5%), and Construction & Extraction (114 | 0.7%).
Natural Resources, Construction and Maintenance Occupations by Sex
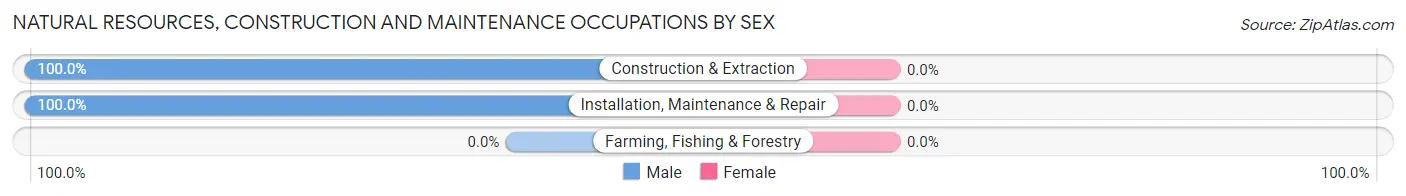
| Occupation | Male | Female |
| Farming, Fishing & Forestry | 0 (0.0%) | 0 (0.0%) |
| Construction & Extraction | 114 (100.0%) | 0 (0.0%) |
| Installation, Maintenance & Repair | 432 (100.0%) | 0 (0.0%) |
| Total (Category) | 546 (100.0%) | 0 (0.0%) |
| Total (Overall) | 9,866 (56.9%) | 7,471 (43.1%) |
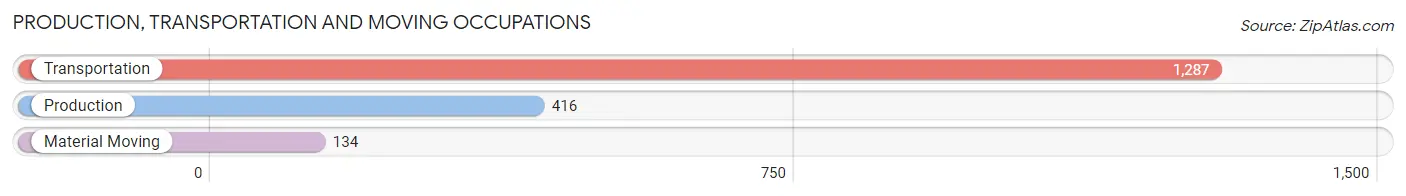
Production, Transportation and Moving Occupations
The most common Production, Transportation and Moving occupations in Peachtree City are Transportation (1,287 | 7.4%), Production (416 | 2.4%), and Material Moving (134 | 0.8%).
Production, Transportation and Moving Occupations by Sex
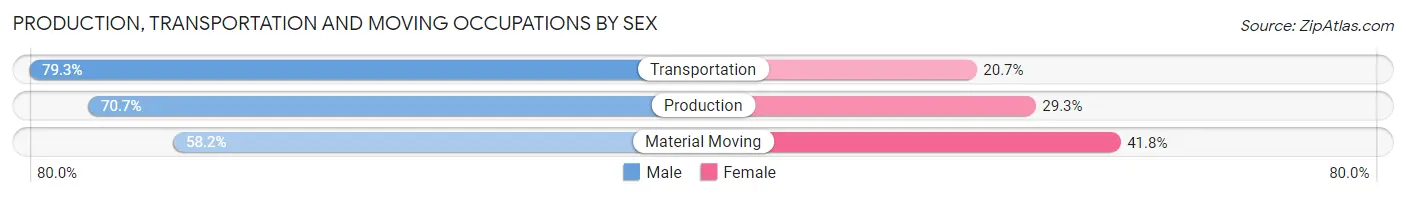
| Occupation | Male | Female |
| Production | 294 (70.7%) | 122 (29.3%) |
| Transportation | 1,021 (79.3%) | 266 (20.7%) |
| Material Moving | 78 (58.2%) | 56 (41.8%) |
| Total (Category) | 1,393 (75.8%) | 444 (24.2%) |
| Total (Overall) | 9,866 (56.9%) | 7,471 (43.1%) |
Employment Industries by Sex in Peachtree City
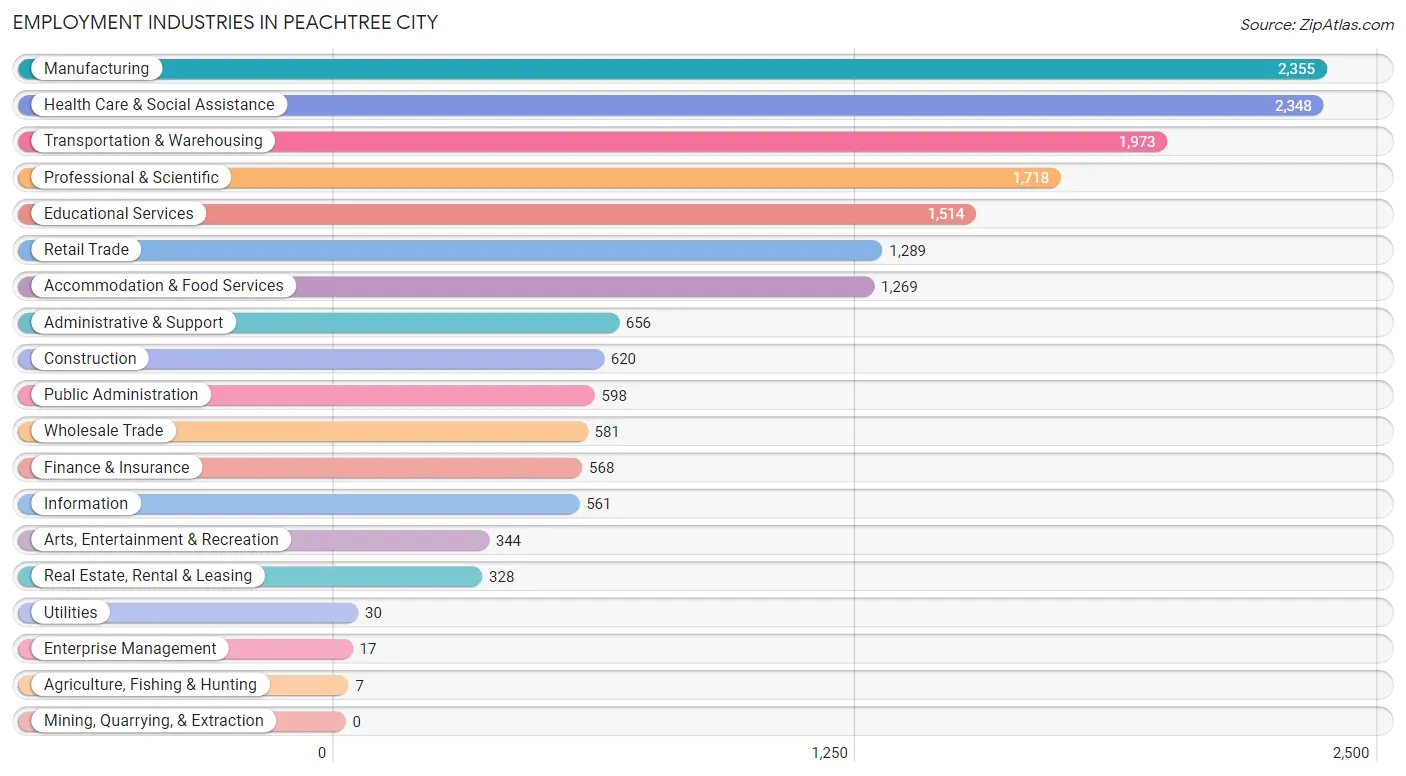
Employment Industries in Peachtree City
The major employment industries in Peachtree City include Manufacturing (2,355 | 13.6%), Health Care & Social Assistance (2,348 | 13.5%), Transportation & Warehousing (1,973 | 11.4%), Professional & Scientific (1,718 | 9.9%), and Educational Services (1,514 | 8.7%).
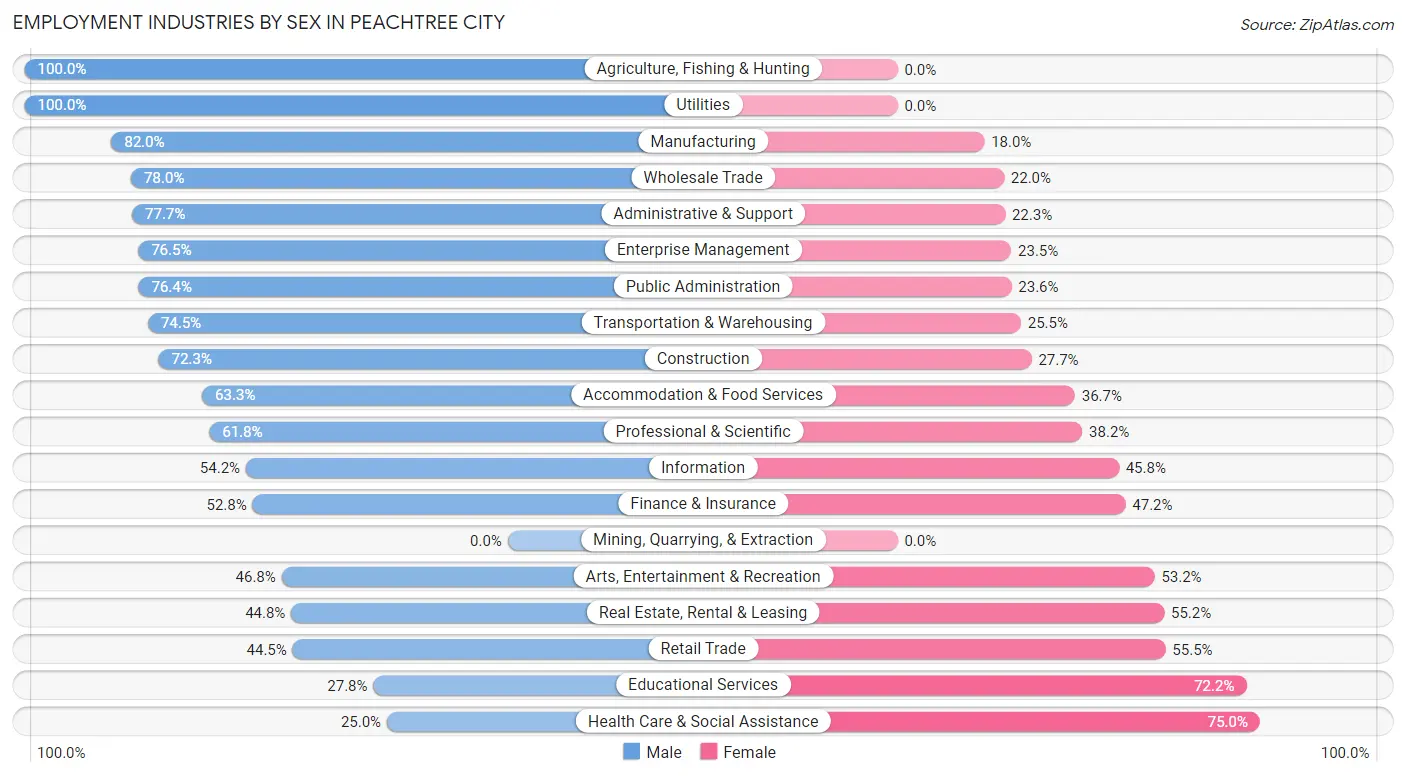
Employment Industries by Sex in Peachtree City
The Peachtree City industries that see more men than women are Agriculture, Fishing & Hunting (100.0%), Utilities (100.0%), and Manufacturing (82.0%), whereas the industries that tend to have a higher number of women are Health Care & Social Assistance (75.0%), Educational Services (72.2%), and Retail Trade (55.5%).
| Industry | Male | Female |
| Agriculture, Fishing & Hunting | 7 (100.0%) | 0 (0.0%) |
| Mining, Quarrying, & Extraction | 0 (0.0%) | 0 (0.0%) |
| Construction | 448 (72.3%) | 172 (27.7%) |
| Manufacturing | 1,932 (82.0%) | 423 (18.0%) |
| Wholesale Trade | 453 (78.0%) | 128 (22.0%) |
| Retail Trade | 574 (44.5%) | 715 (55.5%) |
| Transportation & Warehousing | 1,469 (74.5%) | 504 (25.5%) |
| Utilities | 30 (100.0%) | 0 (0.0%) |
| Information | 304 (54.2%) | 257 (45.8%) |
| Finance & Insurance | 300 (52.8%) | 268 (47.2%) |
| Real Estate, Rental & Leasing | 147 (44.8%) | 181 (55.2%) |
| Professional & Scientific | 1,061 (61.8%) | 657 (38.2%) |
| Enterprise Management | 13 (76.5%) | 4 (23.5%) |
| Administrative & Support | 510 (77.7%) | 146 (22.3%) |
| Educational Services | 421 (27.8%) | 1,093 (72.2%) |
| Health Care & Social Assistance | 587 (25.0%) | 1,761 (75.0%) |
| Arts, Entertainment & Recreation | 161 (46.8%) | 183 (53.2%) |
| Accommodation & Food Services | 803 (63.3%) | 466 (36.7%) |
| Public Administration | 457 (76.4%) | 141 (23.6%) |
| Total | 9,866 (56.9%) | 7,471 (43.1%) |
Education in Peachtree City
School Enrollment in Peachtree City
The most common levels of schooling among the 10,719 students in Peachtree City are middle school (2,923 | 27.3%), high school (2,889 | 27.0%), and elementary school (1,837 | 17.1%).
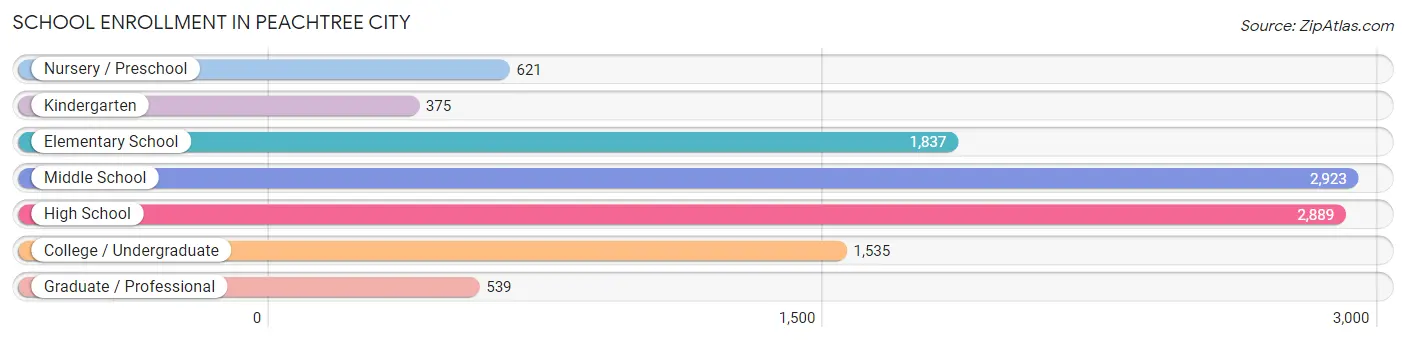
| School Level | # Students | % Students |
| Nursery / Preschool | 621 | 5.8% |
| Kindergarten | 375 | 3.5% |
| Elementary School | 1,837 | 17.1% |
| Middle School | 2,923 | 27.3% |
| High School | 2,889 | 27.0% |
| College / Undergraduate | 1,535 | 14.3% |
| Graduate / Professional | 539 | 5.0% |
| Total | 10,719 | 100.0% |
School Enrollment by Age by Funding Source in Peachtree City
Out of a total of 10,719 students who are enrolled in schools in Peachtree City, 1,812 (16.9%) attend a private institution, while the remaining 8,907 (83.1%) are enrolled in public schools. The age group of 3 to 4 year olds has the highest likelihood of being enrolled in private schools, with 402 (74.6% in the age bracket) enrolled. Conversely, the age group of 15 to 17 year olds has the lowest likelihood of being enrolled in a private school, with 1,991 (92.2% in the age bracket) attending a public institution.
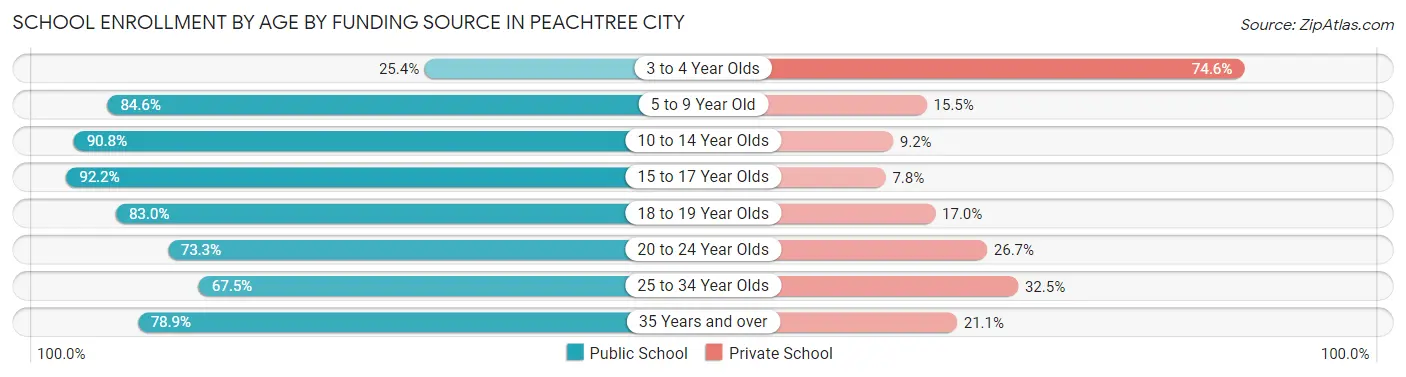
| Age Bracket | Public School | Private School |
| 3 to 4 Year Olds | 137 (25.4%) | 402 (74.6%) |
| 5 to 9 Year Old | 1,800 (84.6%) | 329 (15.4%) |
| 10 to 14 Year Olds | 3,095 (90.8%) | 312 (9.2%) |
| 15 to 17 Year Olds | 1,991 (92.2%) | 168 (7.8%) |
| 18 to 19 Year Olds | 570 (83.0%) | 117 (17.0%) |
| 20 to 24 Year Olds | 803 (73.3%) | 292 (26.7%) |
| 25 to 34 Year Olds | 260 (67.5%) | 125 (32.5%) |
| 35 Years and over | 251 (78.9%) | 67 (21.1%) |
| Total | 8,907 (83.1%) | 1,812 (16.9%) |
Educational Attainment by Field of Study in Peachtree City
Business (3,663 | 22.1%), engineering (2,012 | 12.1%), science & technology (1,743 | 10.5%), education (1,719 | 10.4%), and social sciences (1,105 | 6.7%) are the most common fields of study among 16,577 individuals in Peachtree City who have obtained a bachelor's degree or higher.
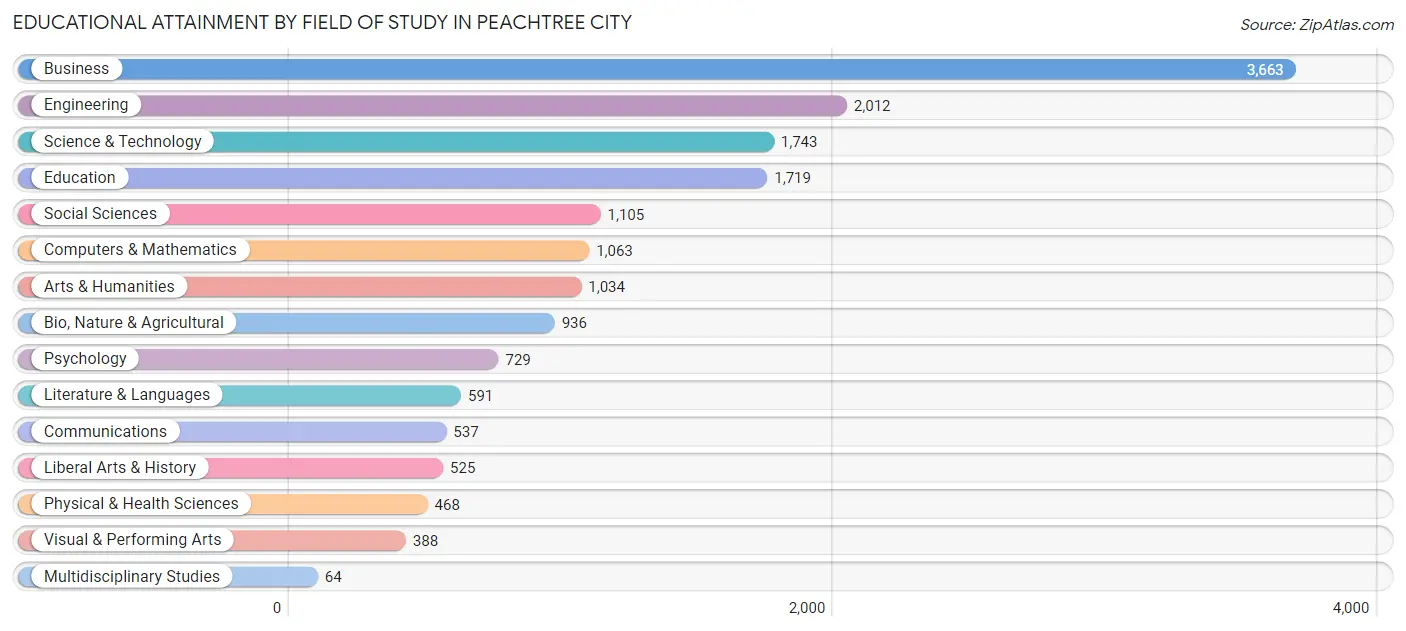
| Field of Study | # Graduates | % Graduates |
| Computers & Mathematics | 1,063 | 6.4% |
| Bio, Nature & Agricultural | 936 | 5.7% |
| Physical & Health Sciences | 468 | 2.8% |
| Psychology | 729 | 4.4% |
| Social Sciences | 1,105 | 6.7% |
| Engineering | 2,012 | 12.1% |
| Multidisciplinary Studies | 64 | 0.4% |
| Science & Technology | 1,743 | 10.5% |
| Business | 3,663 | 22.1% |
| Education | 1,719 | 10.4% |
| Literature & Languages | 591 | 3.6% |
| Liberal Arts & History | 525 | 3.2% |
| Visual & Performing Arts | 388 | 2.3% |
| Communications | 537 | 3.2% |
| Arts & Humanities | 1,034 | 6.2% |
| Total | 16,577 | 100.0% |
Transportation & Commute in Peachtree City
Vehicle Availability by Sex in Peachtree City
The most prevalent vehicle ownership categories in Peachtree City are males with 2 vehicles (4,121, accounting for 42.4%) and females with 2 vehicles (3,411, making up 56.0%).
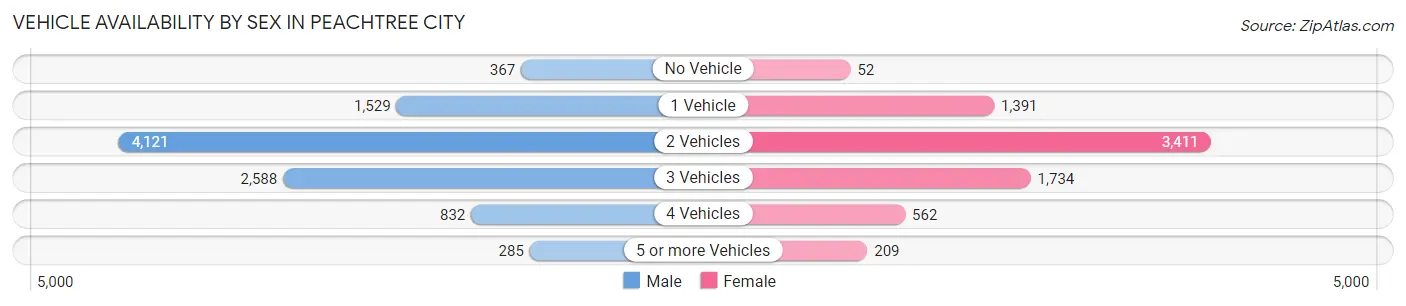
| Vehicles Available | Male | Female |
| No Vehicle | 367 (3.8%) | 52 (0.7%) |
| 1 Vehicle | 1,529 (15.7%) | 1,391 (18.9%) |
| 2 Vehicles | 4,121 (42.4%) | 3,411 (46.4%) |
| 3 Vehicles | 2,588 (26.6%) | 1,734 (23.6%) |
| 4 Vehicles | 832 (8.6%) | 562 (7.6%) |
| 5 or more Vehicles | 285 (2.9%) | 209 (2.8%) |
| Total | 9,722 (100.0%) | 7,359 (100.0%) |
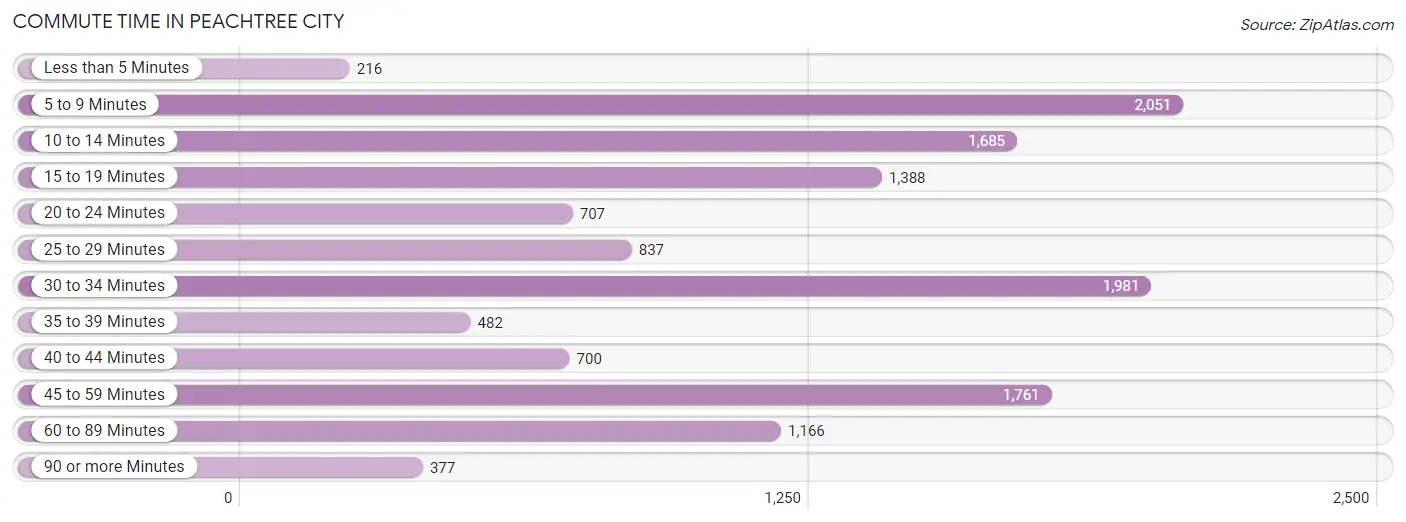
Commute Time in Peachtree City
The most frequently occuring commute durations in Peachtree City are 5 to 9 minutes (2,051 commuters, 15.4%), 30 to 34 minutes (1,981 commuters, 14.8%), and 45 to 59 minutes (1,761 commuters, 13.2%).
| Commute Time | # Commuters | % Commuters |
| Less than 5 Minutes | 216 | 1.6% |
| 5 to 9 Minutes | 2,051 | 15.4% |
| 10 to 14 Minutes | 1,685 | 12.6% |
| 15 to 19 Minutes | 1,388 | 10.4% |
| 20 to 24 Minutes | 707 | 5.3% |
| 25 to 29 Minutes | 837 | 6.3% |
| 30 to 34 Minutes | 1,981 | 14.8% |
| 35 to 39 Minutes | 482 | 3.6% |
| 40 to 44 Minutes | 700 | 5.2% |
| 45 to 59 Minutes | 1,761 | 13.2% |
| 60 to 89 Minutes | 1,166 | 8.7% |
| 90 or more Minutes | 377 | 2.8% |
Commute Time by Sex in Peachtree City
The most common commute times in Peachtree City are 30 to 34 minutes (1,501 commuters, 19.8%) for males and 5 to 9 minutes (1,139 commuters, 19.8%) for females.
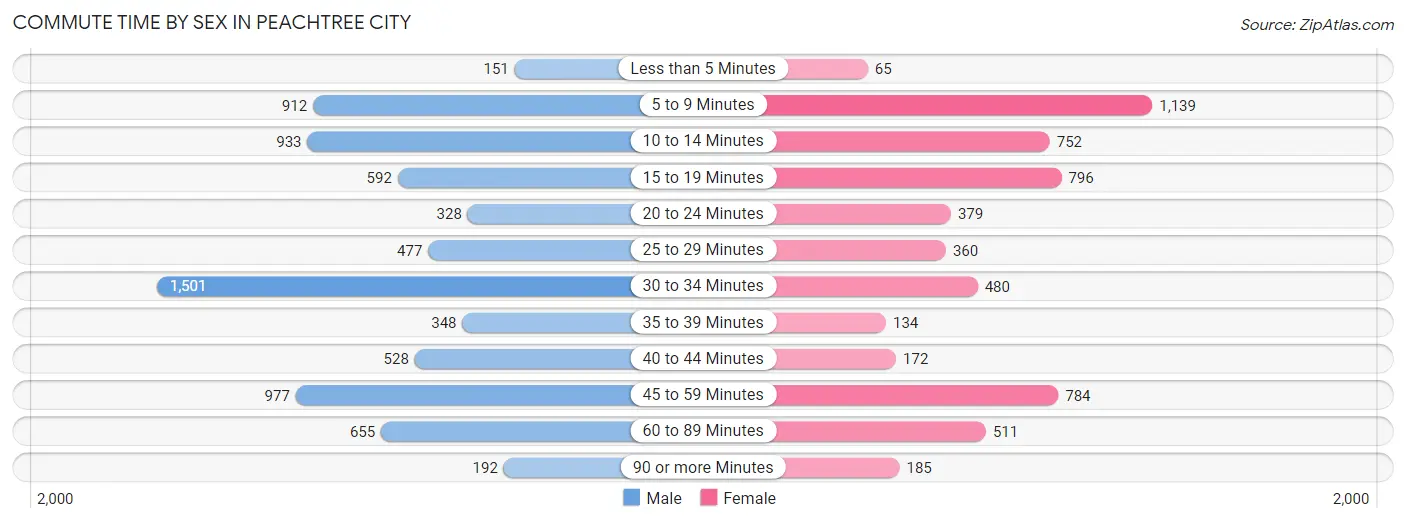
| Commute Time | Male | Female |
| Less than 5 Minutes | 151 (2.0%) | 65 (1.1%) |
| 5 to 9 Minutes | 912 (12.0%) | 1,139 (19.8%) |
| 10 to 14 Minutes | 933 (12.3%) | 752 (13.1%) |
| 15 to 19 Minutes | 592 (7.8%) | 796 (13.8%) |
| 20 to 24 Minutes | 328 (4.3%) | 379 (6.6%) |
| 25 to 29 Minutes | 477 (6.3%) | 360 (6.2%) |
| 30 to 34 Minutes | 1,501 (19.8%) | 480 (8.3%) |
| 35 to 39 Minutes | 348 (4.6%) | 134 (2.3%) |
| 40 to 44 Minutes | 528 (7.0%) | 172 (3.0%) |
| 45 to 59 Minutes | 977 (12.9%) | 784 (13.6%) |
| 60 to 89 Minutes | 655 (8.6%) | 511 (8.9%) |
| 90 or more Minutes | 192 (2.5%) | 185 (3.2%) |
Time of Departure to Work by Sex in Peachtree City
The most frequent times of departure to work in Peachtree City are 7:00 AM to 7:29 AM (1,033, 13.6%) for males and 8:00 AM to 8:29 AM (1,047, 18.2%) for females.
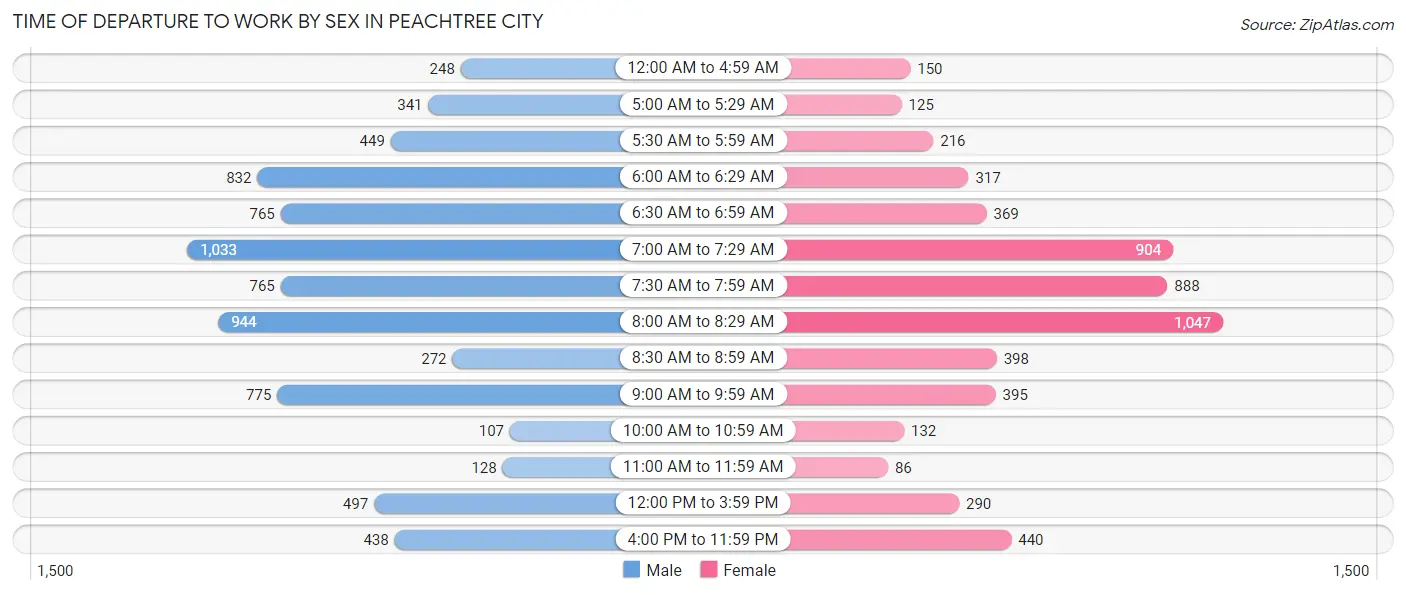
| Time of Departure | Male | Female |
| 12:00 AM to 4:59 AM | 248 (3.3%) | 150 (2.6%) |
| 5:00 AM to 5:29 AM | 341 (4.5%) | 125 (2.2%) |
| 5:30 AM to 5:59 AM | 449 (5.9%) | 216 (3.7%) |
| 6:00 AM to 6:29 AM | 832 (11.0%) | 317 (5.5%) |
| 6:30 AM to 6:59 AM | 765 (10.1%) | 369 (6.4%) |
| 7:00 AM to 7:29 AM | 1,033 (13.6%) | 904 (15.7%) |
| 7:30 AM to 7:59 AM | 765 (10.1%) | 888 (15.4%) |
| 8:00 AM to 8:29 AM | 944 (12.4%) | 1,047 (18.2%) |
| 8:30 AM to 8:59 AM | 272 (3.6%) | 398 (6.9%) |
| 9:00 AM to 9:59 AM | 775 (10.2%) | 395 (6.9%) |
| 10:00 AM to 10:59 AM | 107 (1.4%) | 132 (2.3%) |
| 11:00 AM to 11:59 AM | 128 (1.7%) | 86 (1.5%) |
| 12:00 PM to 3:59 PM | 497 (6.5%) | 290 (5.0%) |
| 4:00 PM to 11:59 PM | 438 (5.8%) | 440 (7.6%) |
| Total | 7,594 (100.0%) | 5,757 (100.0%) |
Housing Occupancy in Peachtree City
Occupancy by Ownership in Peachtree City
Of the total 14,598 dwellings in Peachtree City, owner-occupied units account for 10,872 (74.5%), while renter-occupied units make up 3,726 (25.5%).
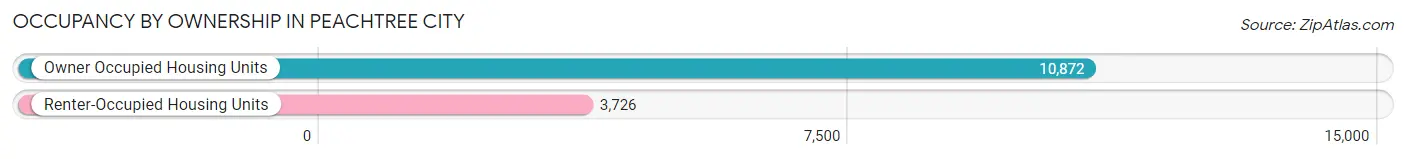
| Occupancy | # Housing Units | % Housing Units |
| Owner Occupied Housing Units | 10,872 | 74.5% |
| Renter-Occupied Housing Units | 3,726 | 25.5% |
| Total Occupied Housing Units | 14,598 | 100.0% |
Occupancy by Household Size in Peachtree City
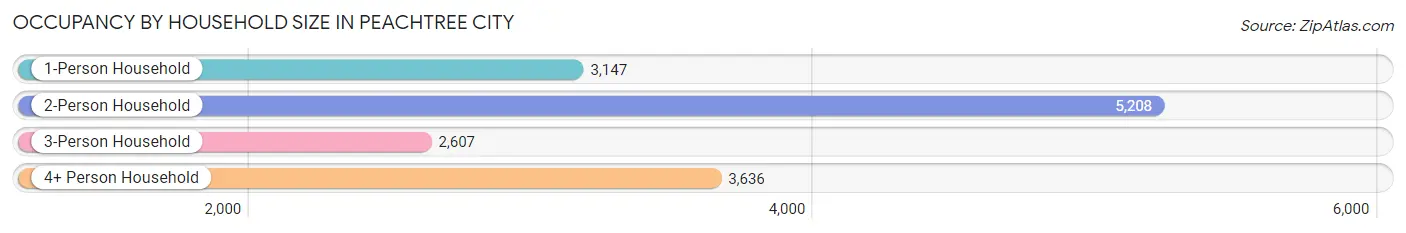
| Household Size | # Housing Units | % Housing Units |
| 1-Person Household | 3,147 | 21.6% |
| 2-Person Household | 5,208 | 35.7% |
| 3-Person Household | 2,607 | 17.9% |
| 4+ Person Household | 3,636 | 24.9% |
| Total Housing Units | 14,598 | 100.0% |
Occupancy by Ownership by Household Size in Peachtree City
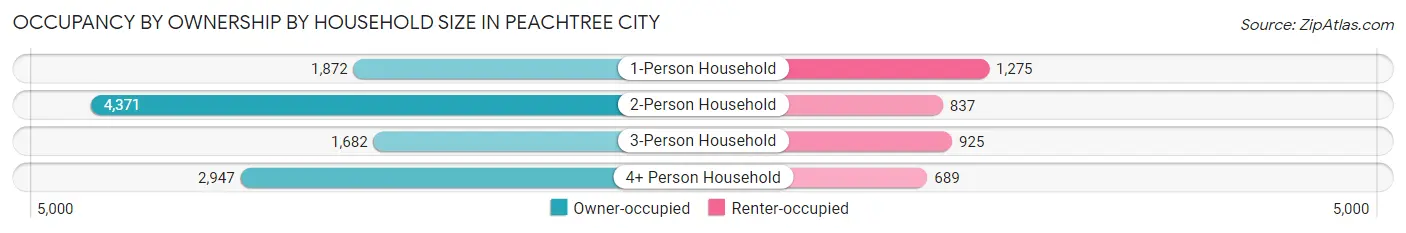
| Household Size | Owner-occupied | Renter-occupied |
| 1-Person Household | 1,872 (59.5%) | 1,275 (40.5%) |
| 2-Person Household | 4,371 (83.9%) | 837 (16.1%) |
| 3-Person Household | 1,682 (64.5%) | 925 (35.5%) |
| 4+ Person Household | 2,947 (81.0%) | 689 (19.0%) |
| Total Housing Units | 10,872 (74.5%) | 3,726 (25.5%) |
Occupancy by Educational Attainment in Peachtree City
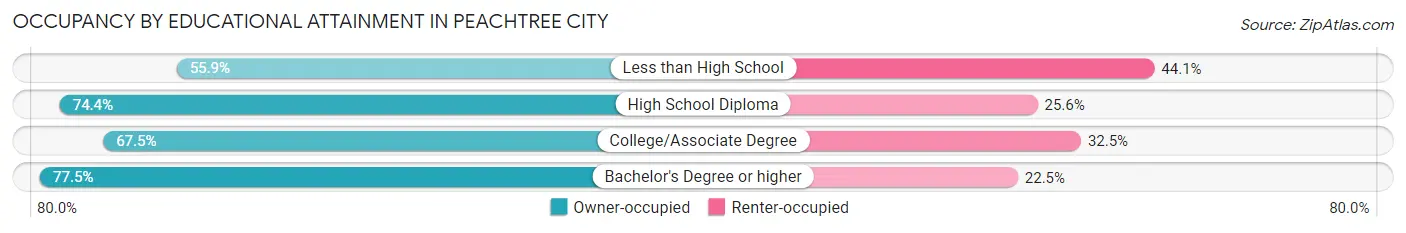
| Household Size | Owner-occupied | Renter-occupied |
| Less than High School | 119 (55.9%) | 94 (44.1%) |
| High School Diploma | 1,457 (74.4%) | 501 (25.6%) |
| College/Associate Degree | 2,287 (67.5%) | 1,100 (32.5%) |
| Bachelor's Degree or higher | 7,009 (77.5%) | 2,031 (22.5%) |
Occupancy by Age of Householder in Peachtree City
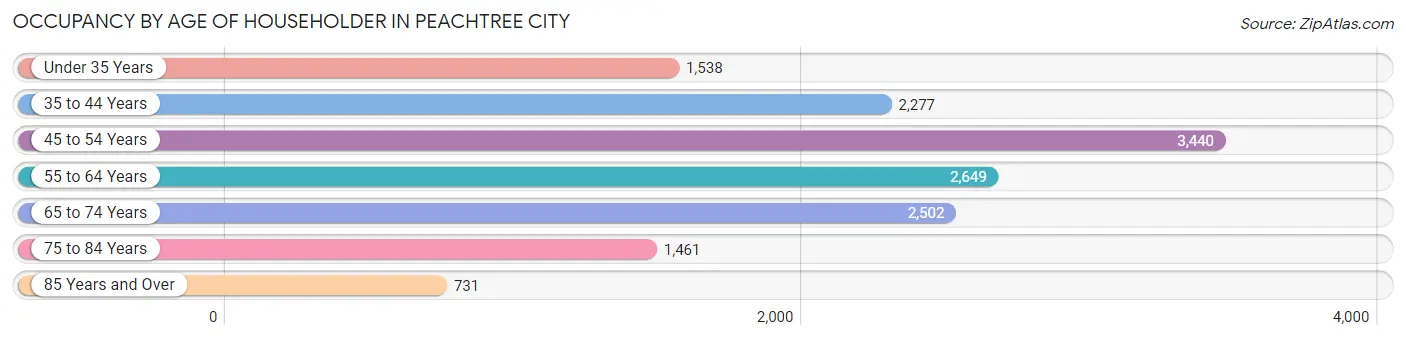
| Age Bracket | # Households | % Households |
| Under 35 Years | 1,538 | 10.5% |
| 35 to 44 Years | 2,277 | 15.6% |
| 45 to 54 Years | 3,440 | 23.6% |
| 55 to 64 Years | 2,649 | 18.1% |
| 65 to 74 Years | 2,502 | 17.1% |
| 75 to 84 Years | 1,461 | 10.0% |
| 85 Years and Over | 731 | 5.0% |
| Total | 14,598 | 100.0% |
Housing Finances in Peachtree City
Median Income by Occupancy in Peachtree City
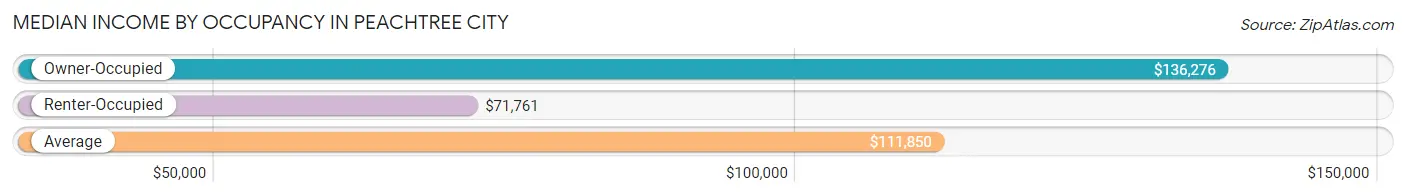
| Occupancy Type | # Households | Median Income |
| Owner-Occupied | 10,872 (74.5%) | $136,276 |
| Renter-Occupied | 3,726 (25.5%) | $71,761 |
| Average | 14,598 (100.0%) | $111,850 |
Occupancy by Householder Income Bracket in Peachtree City
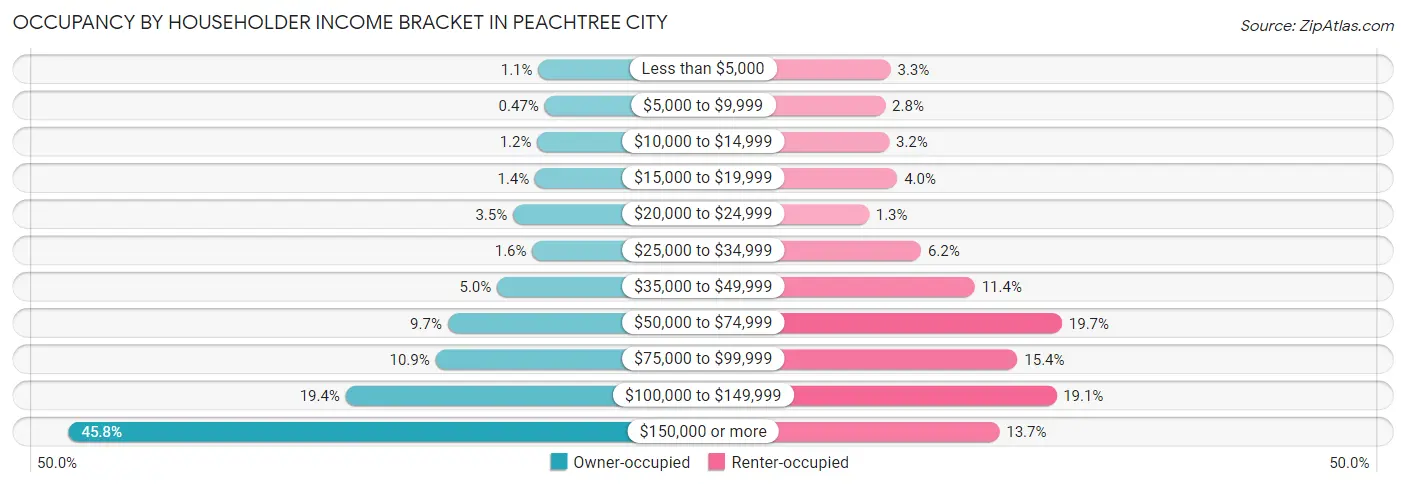
| Income Bracket | Owner-occupied | Renter-occupied |
| Less than $5,000 | 116 (1.1%) | 124 (3.3%) |
| $5,000 to $9,999 | 51 (0.5%) | 105 (2.8%) |
| $10,000 to $14,999 | 127 (1.2%) | 119 (3.2%) |
| $15,000 to $19,999 | 150 (1.4%) | 148 (4.0%) |
| $20,000 to $24,999 | 378 (3.5%) | 47 (1.3%) |
| $25,000 to $34,999 | 178 (1.6%) | 232 (6.2%) |
| $35,000 to $49,999 | 544 (5.0%) | 423 (11.4%) |
| $50,000 to $74,999 | 1,055 (9.7%) | 732 (19.7%) |
| $75,000 to $99,999 | 1,181 (10.9%) | 574 (15.4%) |
| $100,000 to $149,999 | 2,111 (19.4%) | 712 (19.1%) |
| $150,000 or more | 4,981 (45.8%) | 510 (13.7%) |
| Total | 10,872 (100.0%) | 3,726 (100.0%) |
Monthly Housing Cost Tiers in Peachtree City
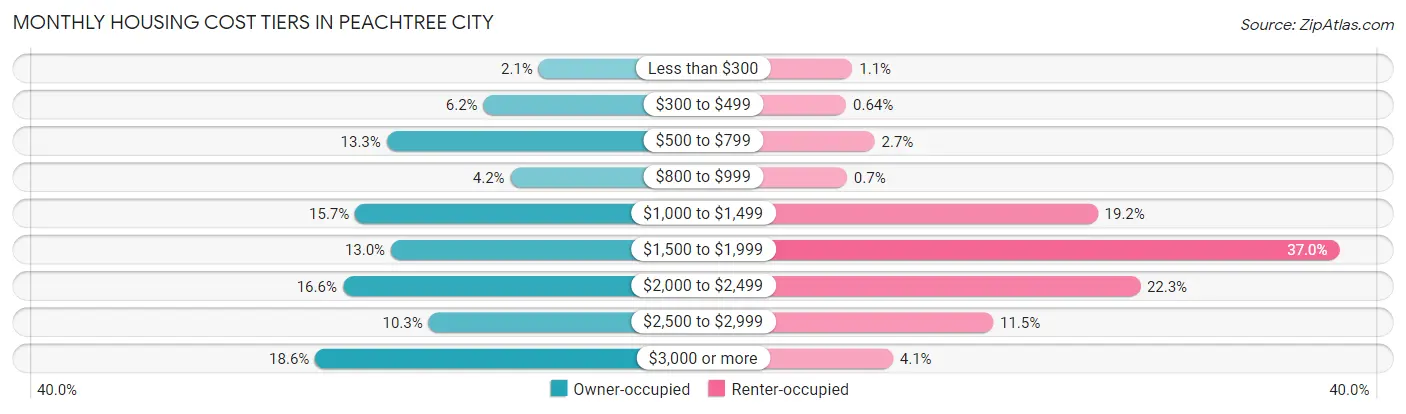
| Monthly Cost | Owner-occupied | Renter-occupied |
| Less than $300 | 233 (2.1%) | 41 (1.1%) |
| $300 to $499 | 675 (6.2%) | 24 (0.6%) |
| $500 to $799 | 1,450 (13.3%) | 102 (2.7%) |
| $800 to $999 | 459 (4.2%) | 26 (0.7%) |
| $1,000 to $1,499 | 1,703 (15.7%) | 714 (19.2%) |
| $1,500 to $1,999 | 1,415 (13.0%) | 1,377 (37.0%) |
| $2,000 to $2,499 | 1,801 (16.6%) | 830 (22.3%) |
| $2,500 to $2,999 | 1,114 (10.2%) | 427 (11.5%) |
| $3,000 or more | 2,022 (18.6%) | 152 (4.1%) |
| Total | 10,872 (100.0%) | 3,726 (100.0%) |
Physical Housing Characteristics in Peachtree City
Housing Structures in Peachtree City
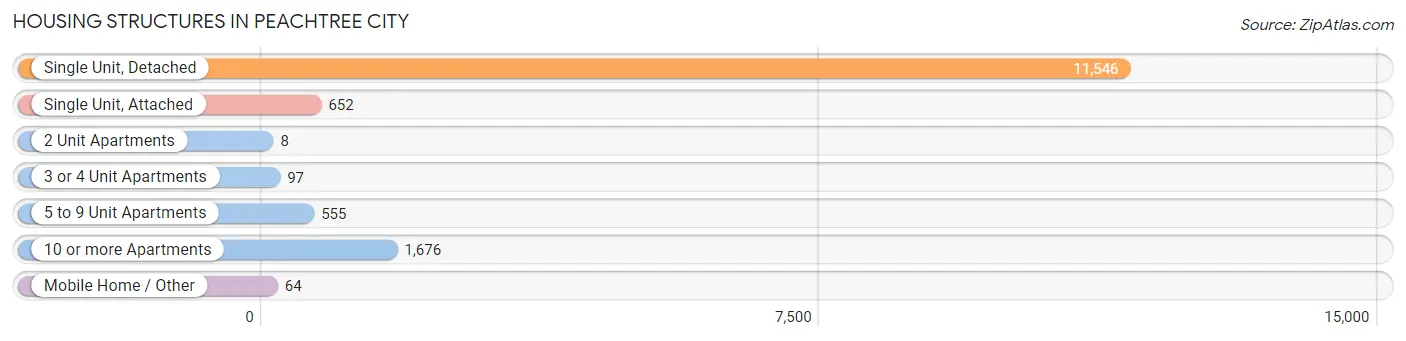
| Structure Type | # Housing Units | % Housing Units |
| Single Unit, Detached | 11,546 | 79.1% |
| Single Unit, Attached | 652 | 4.5% |
| 2 Unit Apartments | 8 | 0.1% |
| 3 or 4 Unit Apartments | 97 | 0.7% |
| 5 to 9 Unit Apartments | 555 | 3.8% |
| 10 or more Apartments | 1,676 | 11.5% |
| Mobile Home / Other | 64 | 0.4% |
| Total | 14,598 | 100.0% |
Housing Structures by Occupancy in Peachtree City
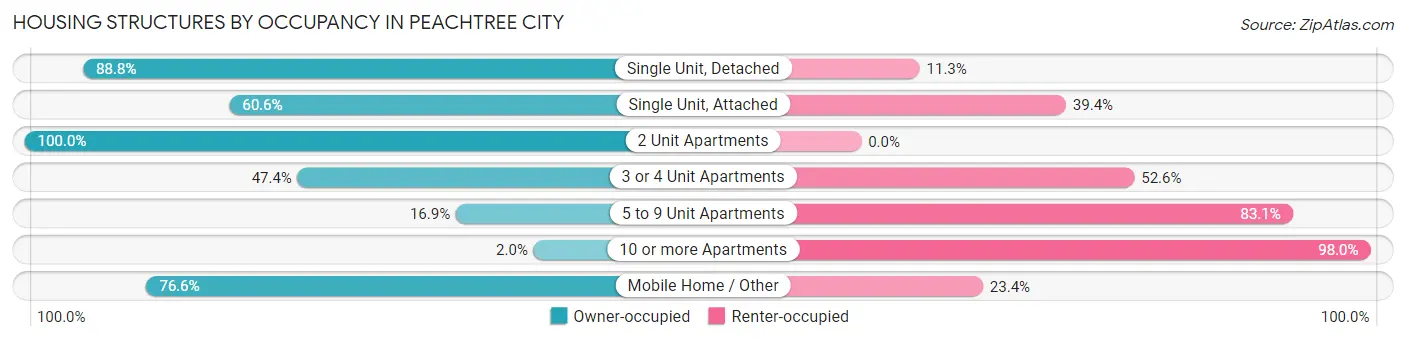
| Structure Type | Owner-occupied | Renter-occupied |
| Single Unit, Detached | 10,247 (88.7%) | 1,299 (11.3%) |
| Single Unit, Attached | 395 (60.6%) | 257 (39.4%) |
| 2 Unit Apartments | 8 (100.0%) | 0 (0.0%) |
| 3 or 4 Unit Apartments | 46 (47.4%) | 51 (52.6%) |
| 5 to 9 Unit Apartments | 94 (16.9%) | 461 (83.1%) |
| 10 or more Apartments | 33 (2.0%) | 1,643 (98.0%) |
| Mobile Home / Other | 49 (76.6%) | 15 (23.4%) |
| Total | 10,872 (74.5%) | 3,726 (25.5%) |
Housing Structures by Number of Rooms in Peachtree City
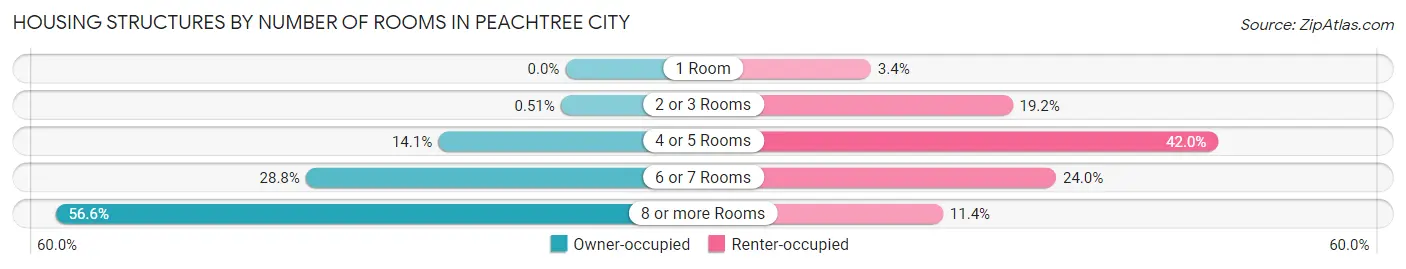
| Number of Rooms | Owner-occupied | Renter-occupied |
| 1 Room | 0 (0.0%) | 128 (3.4%) |
| 2 or 3 Rooms | 55 (0.5%) | 714 (19.2%) |
| 4 or 5 Rooms | 1,535 (14.1%) | 1,564 (42.0%) |
| 6 or 7 Rooms | 3,132 (28.8%) | 894 (24.0%) |
| 8 or more Rooms | 6,150 (56.6%) | 426 (11.4%) |
| Total | 10,872 (100.0%) | 3,726 (100.0%) |
Housing Structure by Heating Type in Peachtree City
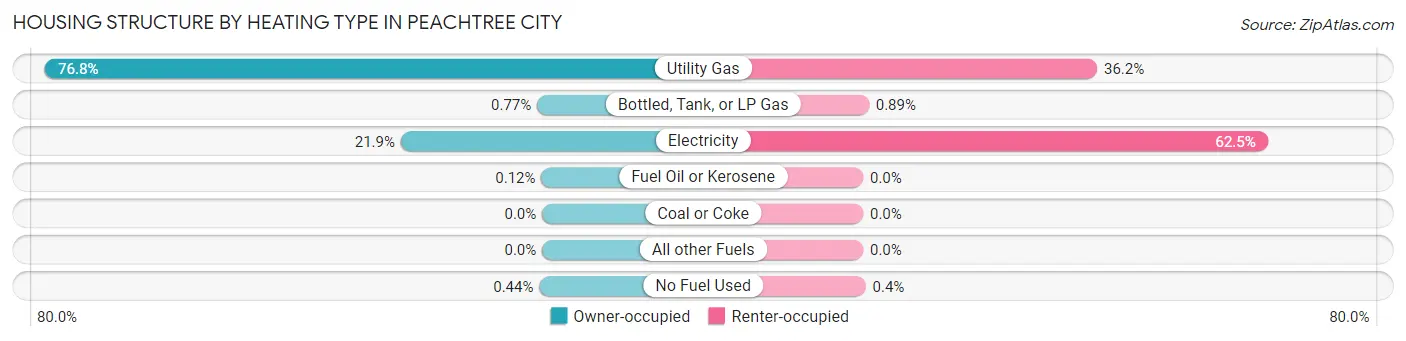
| Heating Type | Owner-occupied | Renter-occupied |
| Utility Gas | 8,352 (76.8%) | 1,348 (36.2%) |
| Bottled, Tank, or LP Gas | 84 (0.8%) | 33 (0.9%) |
| Electricity | 2,375 (21.8%) | 2,330 (62.5%) |
| Fuel Oil or Kerosene | 13 (0.1%) | 0 (0.0%) |
| Coal or Coke | 0 (0.0%) | 0 (0.0%) |
| All other Fuels | 0 (0.0%) | 0 (0.0%) |
| No Fuel Used | 48 (0.4%) | 15 (0.4%) |
| Total | 10,872 (100.0%) | 3,726 (100.0%) |
Household Vehicle Usage in Peachtree City
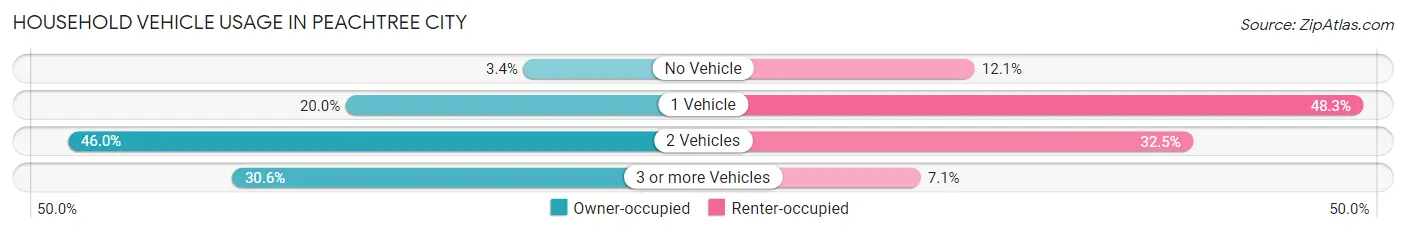
| Vehicles per Household | Owner-occupied | Renter-occupied |
| No Vehicle | 371 (3.4%) | 452 (12.1%) |
| 1 Vehicle | 2,174 (20.0%) | 1,801 (48.3%) |
| 2 Vehicles | 4,996 (46.0%) | 1,209 (32.5%) |
| 3 or more Vehicles | 3,331 (30.6%) | 264 (7.1%) |
| Total | 10,872 (100.0%) | 3,726 (100.0%) |
Real Estate & Mortgages in Peachtree City
Real Estate and Mortgage Overview in Peachtree City
| Characteristic | Without Mortgage | With Mortgage |
| Housing Units | 3,457 | 7,415 |
| Median Property Value | $419,200 | $445,500 |
| Median Household Income | $105,469 | $3,787 |
| Monthly Housing Costs | $654 | $2,022 |
| Real Estate Taxes | $2,799 | $126 |
Property Value by Mortgage Status in Peachtree City
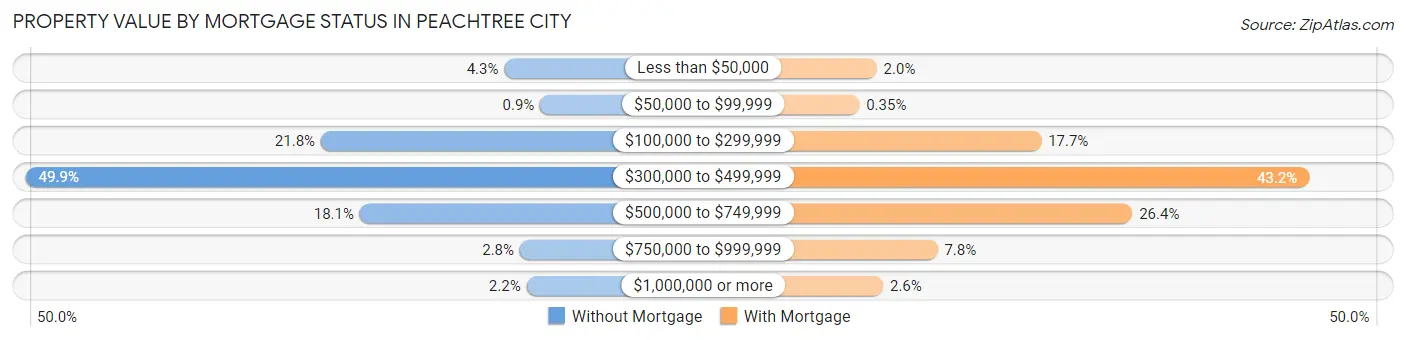
| Property Value | Without Mortgage | With Mortgage |
| Less than $50,000 | 149 (4.3%) | 149 (2.0%) |
| $50,000 to $99,999 | 31 (0.9%) | 26 (0.4%) |
| $100,000 to $299,999 | 753 (21.8%) | 1,311 (17.7%) |
| $300,000 to $499,999 | 1,725 (49.9%) | 3,203 (43.2%) |
| $500,000 to $749,999 | 625 (18.1%) | 1,954 (26.4%) |
| $750,000 to $999,999 | 98 (2.8%) | 578 (7.8%) |
| $1,000,000 or more | 76 (2.2%) | 194 (2.6%) |
| Total | 3,457 (100.0%) | 7,415 (100.0%) |
Household Income by Mortgage Status in Peachtree City
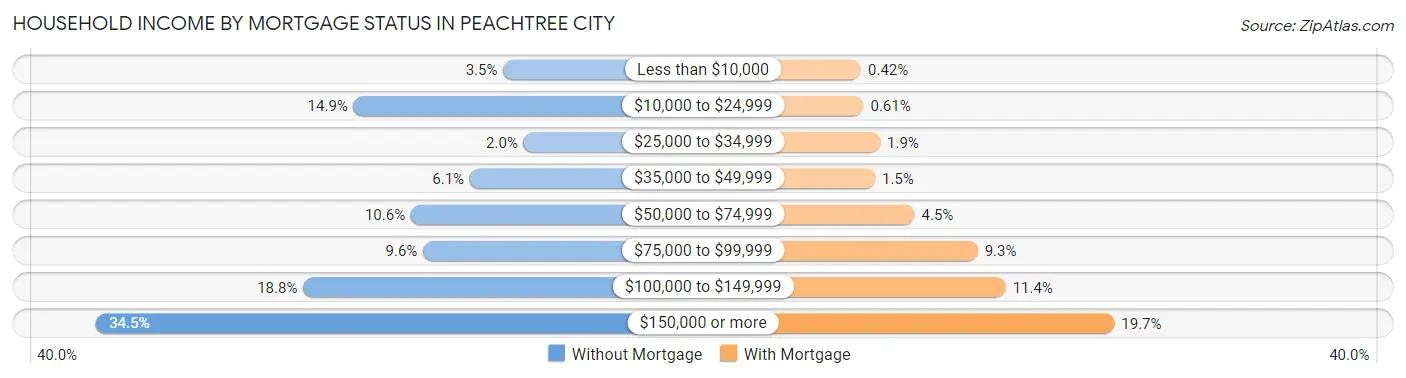
| Household Income | Without Mortgage | With Mortgage |
| Less than $10,000 | 122 (3.5%) | 31 (0.4%) |
| $10,000 to $24,999 | 516 (14.9%) | 45 (0.6%) |
| $25,000 to $34,999 | 68 (2.0%) | 139 (1.9%) |
| $35,000 to $49,999 | 210 (6.1%) | 110 (1.5%) |
| $50,000 to $74,999 | 365 (10.6%) | 334 (4.5%) |
| $75,000 to $99,999 | 333 (9.6%) | 690 (9.3%) |
| $100,000 to $149,999 | 649 (18.8%) | 848 (11.4%) |
| $150,000 or more | 1,194 (34.5%) | 1,462 (19.7%) |
| Total | 3,457 (100.0%) | 7,415 (100.0%) |
Property Value to Household Income Ratio in Peachtree City
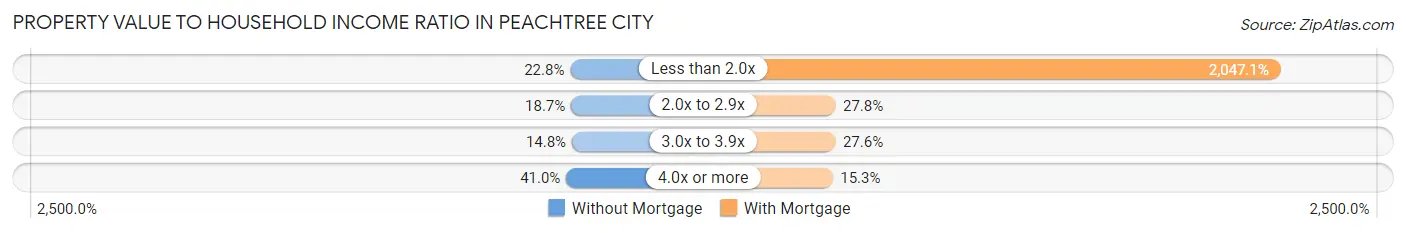
| Value-to-Income Ratio | Without Mortgage | With Mortgage |
| Less than 2.0x | 787 (22.8%) | 151,791 (2,047.1%) |
| 2.0x to 2.9x | 648 (18.7%) | 2,060 (27.8%) |
| 3.0x to 3.9x | 512 (14.8%) | 2,047 (27.6%) |
| 4.0x or more | 1,416 (41.0%) | 1,134 (15.3%) |
| Total | 3,457 (100.0%) | 7,415 (100.0%) |
Real Estate Taxes by Mortgage Status in Peachtree City
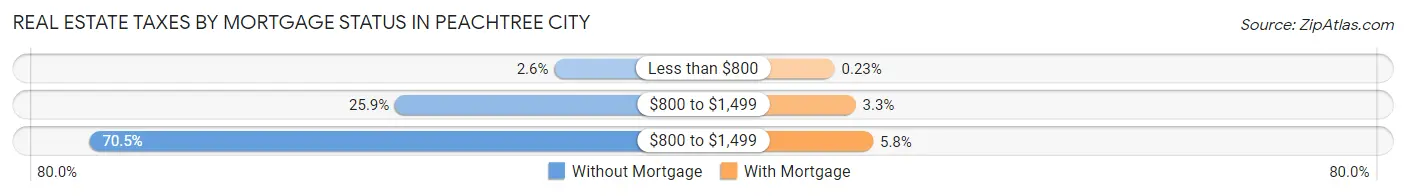
| Property Taxes | Without Mortgage | With Mortgage |
| Less than $800 | 90 (2.6%) | 17 (0.2%) |
| $800 to $1,499 | 894 (25.9%) | 245 (3.3%) |
| $800 to $1,499 | 2,438 (70.5%) | 433 (5.8%) |
| Total | 3,457 (100.0%) | 7,415 (100.0%) |
Health & Disability in Peachtree City
Health Insurance Coverage by Age in Peachtree City
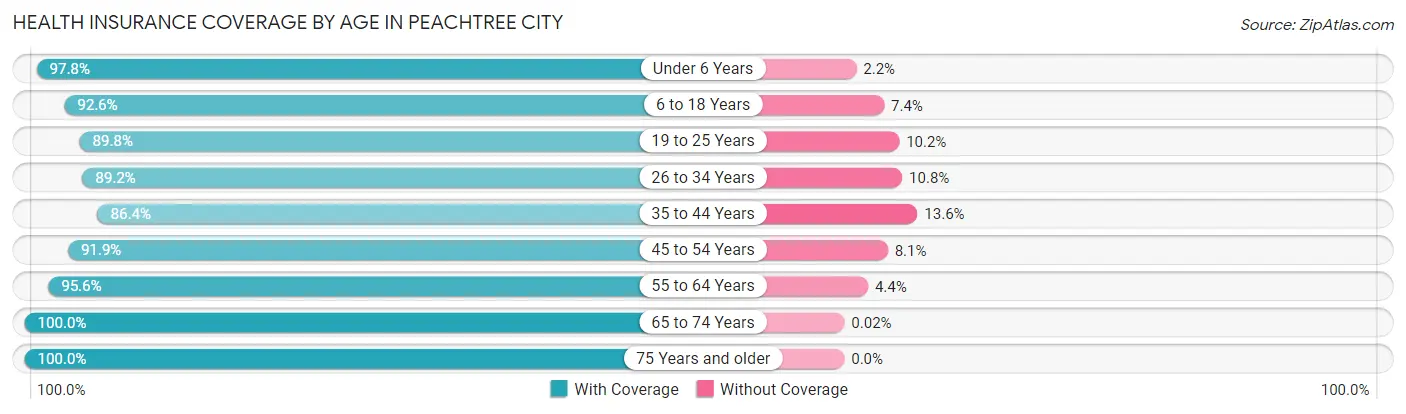
| Age Bracket | With Coverage | Without Coverage |
| Under 6 Years | 1,704 (97.8%) | 39 (2.2%) |
| 6 to 18 Years | 7,211 (92.6%) | 578 (7.4%) |
| 19 to 25 Years | 2,569 (89.8%) | 293 (10.2%) |
| 26 to 34 Years | 2,225 (89.2%) | 269 (10.8%) |
| 35 to 44 Years | 4,114 (86.4%) | 649 (13.6%) |
| 45 to 54 Years | 5,365 (91.9%) | 472 (8.1%) |
| 55 to 64 Years | 5,041 (95.6%) | 233 (4.4%) |
| 65 to 74 Years | 4,240 (100.0%) | 1 (0.0%) |
| 75 Years and older | 3,146 (100.0%) | 0 (0.0%) |
| Total | 35,615 (93.4%) | 2,534 (6.6%) |
Health Insurance Coverage by Citizenship Status in Peachtree City
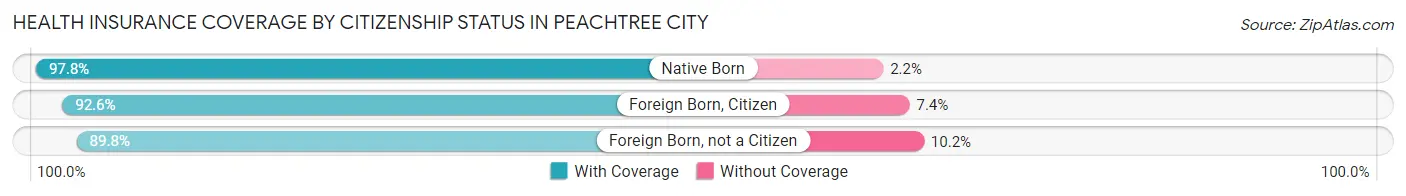
| Citizenship Status | With Coverage | Without Coverage |
| Native Born | 1,704 (97.8%) | 39 (2.2%) |
| Foreign Born, Citizen | 7,211 (92.6%) | 578 (7.4%) |
| Foreign Born, not a Citizen | 2,569 (89.8%) | 293 (10.2%) |
Health Insurance Coverage by Household Income in Peachtree City
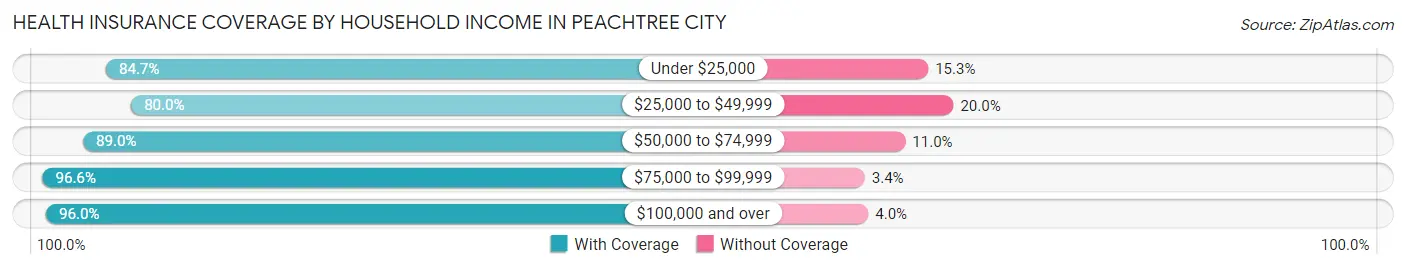
| Household Income | With Coverage | Without Coverage |
| Under $25,000 | 1,577 (84.7%) | 284 (15.3%) |
| $25,000 to $49,999 | 2,557 (80.0%) | 639 (20.0%) |
| $50,000 to $74,999 | 3,812 (89.0%) | 470 (11.0%) |
| $75,000 to $99,999 | 3,571 (96.6%) | 125 (3.4%) |
| $100,000 and over | 24,098 (96.0%) | 1,015 (4.0%) |
Public vs Private Health Insurance Coverage by Age in Peachtree City
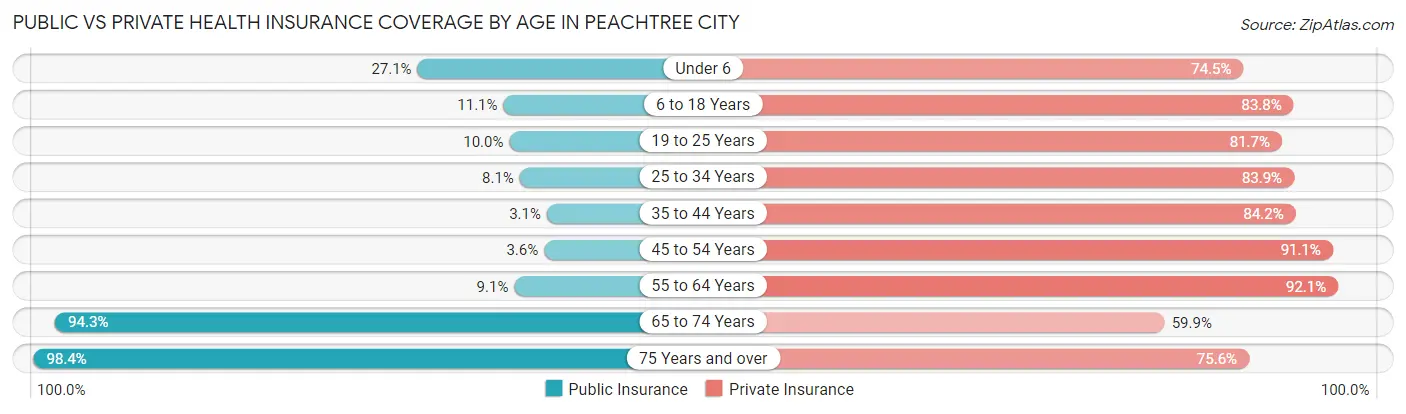
| Age Bracket | Public Insurance | Private Insurance |
| Under 6 | 472 (27.1%) | 1,299 (74.5%) |
| 6 to 18 Years | 867 (11.1%) | 6,530 (83.8%) |
| 19 to 25 Years | 287 (10.0%) | 2,337 (81.7%) |
| 25 to 34 Years | 202 (8.1%) | 2,093 (83.9%) |
| 35 to 44 Years | 146 (3.1%) | 4,011 (84.2%) |
| 45 to 54 Years | 209 (3.6%) | 5,318 (91.1%) |
| 55 to 64 Years | 481 (9.1%) | 4,858 (92.1%) |
| 65 to 74 Years | 4,000 (94.3%) | 2,542 (59.9%) |
| 75 Years and over | 3,094 (98.4%) | 2,377 (75.6%) |
| Total | 9,758 (25.6%) | 31,365 (82.2%) |
Disability Status by Sex by Age in Peachtree City
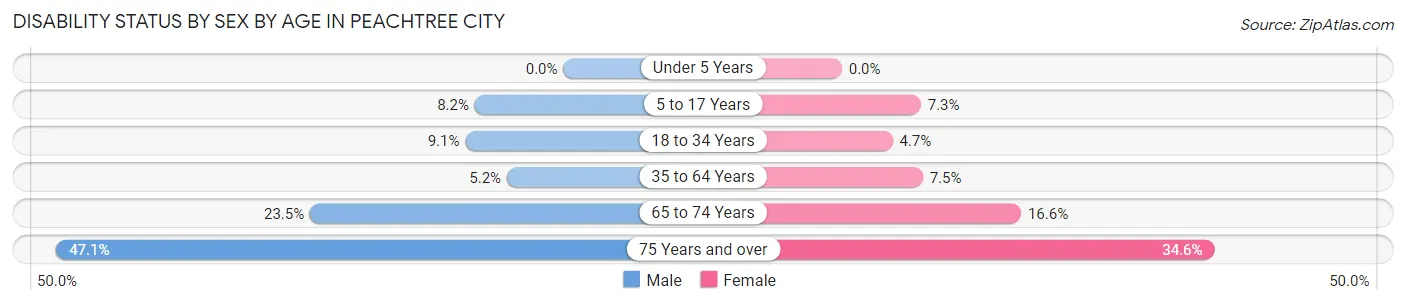
| Age Bracket | Male | Female |
| Under 5 Years | 0 (0.0%) | 0 (0.0%) |
| 5 to 17 Years | 322 (8.2%) | 290 (7.3%) |
| 18 to 34 Years | 263 (9.1%) | 132 (4.7%) |
| 35 to 64 Years | 408 (5.2%) | 608 (7.5%) |
| 65 to 74 Years | 443 (23.5%) | 392 (16.6%) |
| 75 Years and over | 593 (47.1%) | 652 (34.6%) |
Disability Class by Sex by Age in Peachtree City
Disability Class: Hearing Difficulty
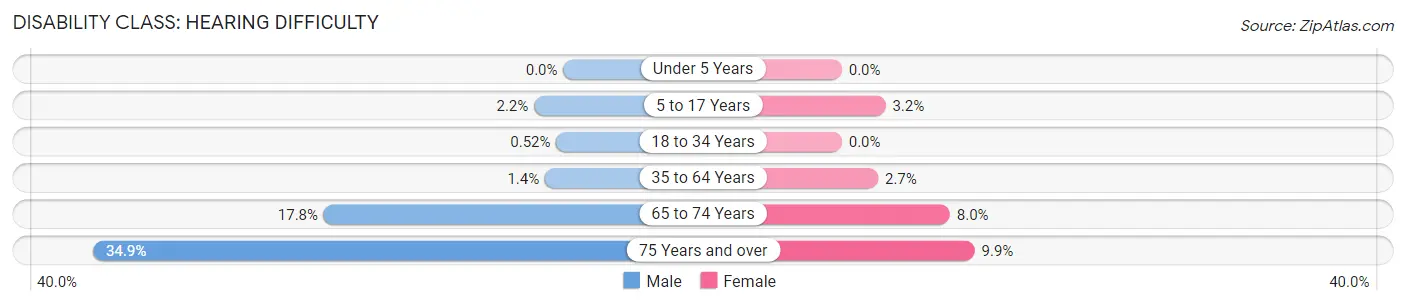
| Age Bracket | Male | Female |
| Under 5 Years | 0 (0.0%) | 0 (0.0%) |
| 5 to 17 Years | 85 (2.2%) | 128 (3.2%) |
| 18 to 34 Years | 15 (0.5%) | 0 (0.0%) |
| 35 to 64 Years | 106 (1.4%) | 218 (2.7%) |
| 65 to 74 Years | 335 (17.8%) | 189 (8.0%) |
| 75 Years and over | 440 (34.9%) | 186 (9.9%) |
Disability Class: Vision Difficulty
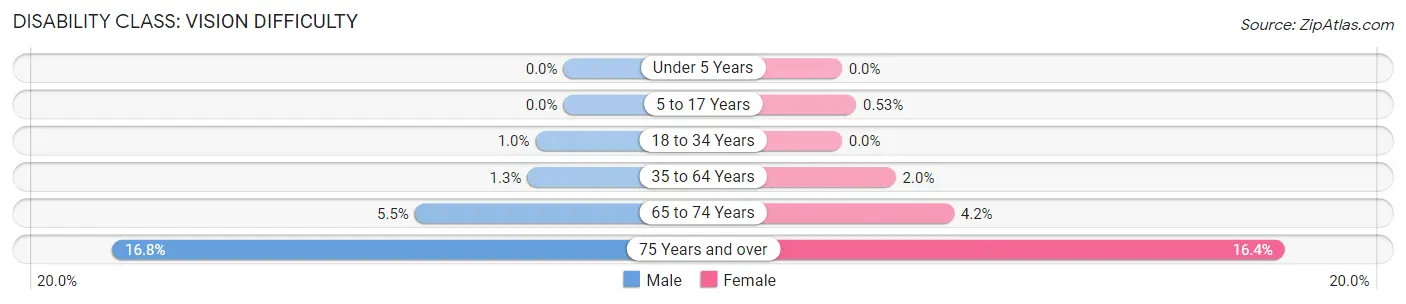
| Age Bracket | Male | Female |
| Under 5 Years | 0 (0.0%) | 0 (0.0%) |
| 5 to 17 Years | 0 (0.0%) | 21 (0.5%) |
| 18 to 34 Years | 30 (1.0%) | 0 (0.0%) |
| 35 to 64 Years | 104 (1.3%) | 162 (2.0%) |
| 65 to 74 Years | 104 (5.5%) | 98 (4.2%) |
| 75 Years and over | 211 (16.8%) | 310 (16.4%) |
Disability Class: Cognitive Difficulty
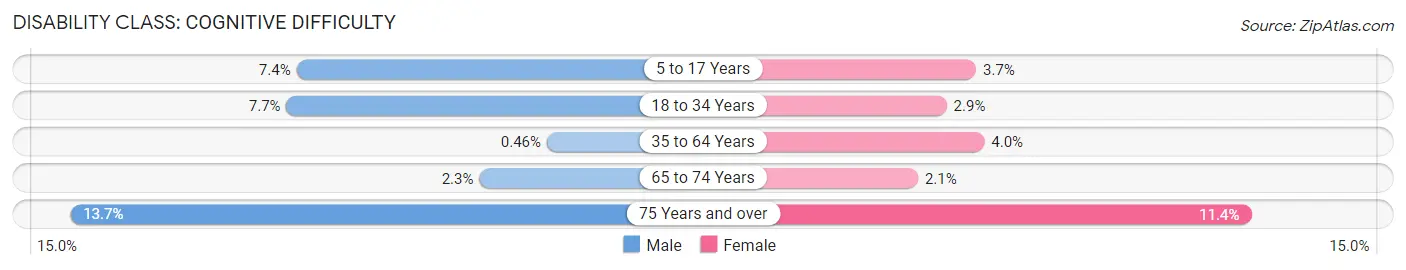
| Age Bracket | Male | Female |
| 5 to 17 Years | 291 (7.4%) | 148 (3.7%) |
| 18 to 34 Years | 223 (7.7%) | 82 (2.9%) |
| 35 to 64 Years | 36 (0.5%) | 321 (4.0%) |
| 65 to 74 Years | 44 (2.3%) | 50 (2.1%) |
| 75 Years and over | 173 (13.7%) | 215 (11.4%) |
Disability Class: Ambulatory Difficulty
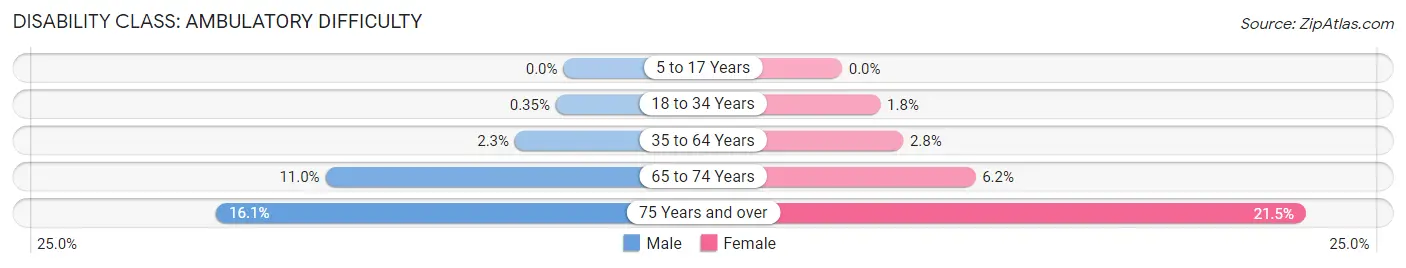
| Age Bracket | Male | Female |
| 5 to 17 Years | 0 (0.0%) | 0 (0.0%) |
| 18 to 34 Years | 10 (0.4%) | 50 (1.8%) |
| 35 to 64 Years | 175 (2.2%) | 230 (2.8%) |
| 65 to 74 Years | 208 (11.0%) | 146 (6.2%) |
| 75 Years and over | 203 (16.1%) | 406 (21.5%) |
Disability Class: Self-Care Difficulty
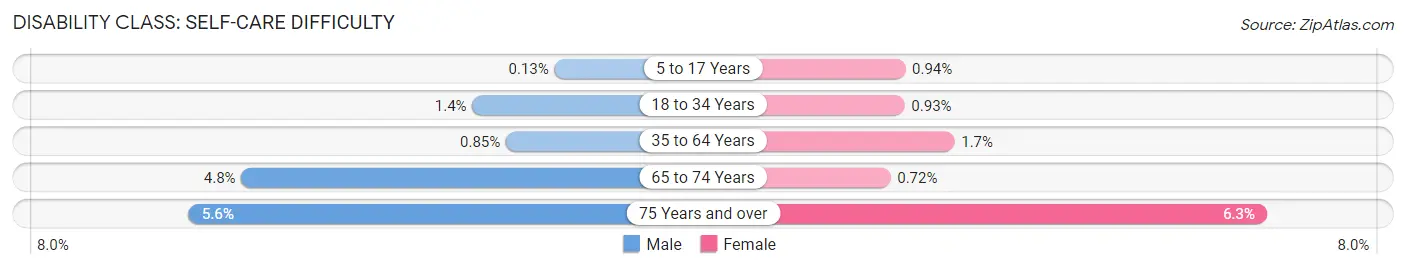
| Age Bracket | Male | Female |
| 5 to 17 Years | 5 (0.1%) | 37 (0.9%) |
| 18 to 34 Years | 39 (1.3%) | 26 (0.9%) |
| 35 to 64 Years | 66 (0.9%) | 135 (1.7%) |
| 65 to 74 Years | 90 (4.8%) | 17 (0.7%) |
| 75 Years and over | 70 (5.6%) | 119 (6.3%) |
Technology Access in Peachtree City
Computing Device Access in Peachtree City
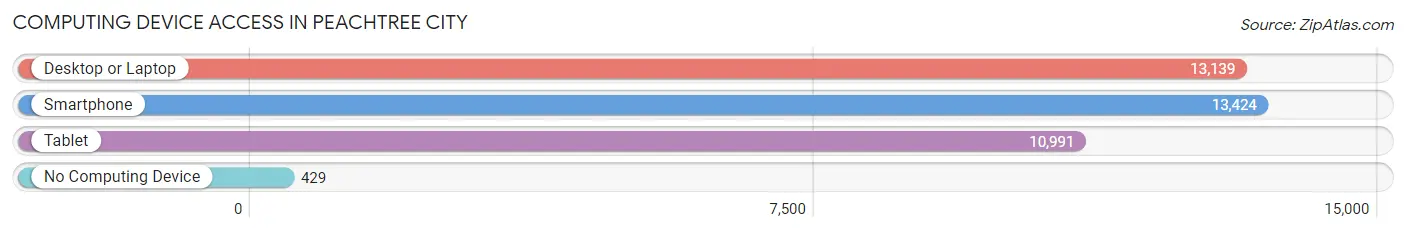
| Device Type | # Households | % Households |
| Desktop or Laptop | 13,139 | 90.0% |
| Smartphone | 13,424 | 92.0% |
| Tablet | 10,991 | 75.3% |
| No Computing Device | 429 | 2.9% |
| Total | 14,598 | 100.0% |
Internet Access in Peachtree City
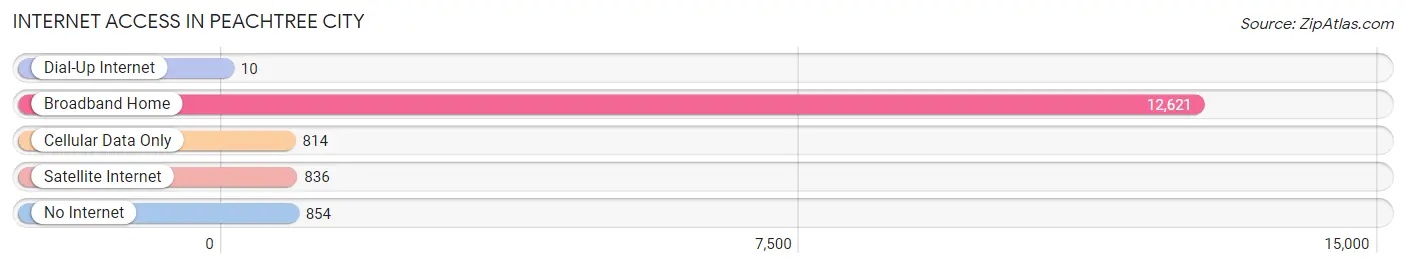
| Internet Type | # Households | % Households |
| Dial-Up Internet | 10 | 0.1% |
| Broadband Home | 12,621 | 86.5% |
| Cellular Data Only | 814 | 5.6% |
| Satellite Internet | 836 | 5.7% |
| No Internet | 854 | 5.9% |
| Total | 14,598 | 100.0% |
Peachtree City Summary
Peachtree City is a city located in Fayette County, Georgia, United States. It is a suburb of Atlanta and is part of the Atlanta metropolitan area. As of the 2010 census, the city had a population of 34,364.
History
Peachtree City was founded in 1959 by real estate developer Ray L. Bennett. Bennett envisioned a planned community that would be a self-contained city with residential, commercial, and industrial areas. The city was incorporated in 1959 and was named after the peach trees that were abundant in the area.
The city was designed around a network of golf cart paths that connect the city's residential, commercial, and recreational areas. The paths are used by residents to travel around the city and are a popular tourist attraction.
Geography
Peachtree City is located in Fayette County, Georgia, about 25 miles south of Atlanta. It is situated in the foothills of the Appalachian Mountains and is bordered by the cities of Fayetteville, Tyrone, and Senoia.
The city covers an area of approximately 24 square miles and is divided into four distinct districts: The North, South, East, and West. The city is also home to several lakes, including Lake Peachtree, Lake Kedron, and Lake McIntosh.
Economy
Peachtree City is home to a variety of businesses, including manufacturing, retail, and service industries. The city is also home to several corporate headquarters, including Kia Motors, Mitsubishi Motors, and the United Parcel Service (UPS).
The city is also home to several shopping centers, including The Avenue Peachtree City, The Avenue East, and The Avenue West. The city is also home to several golf courses, including Planterra Ridge Golf Club, Flat Creek Country Club, and Braelinn Golf Club.
Demographics
As of the 2010 census, the city had a population of 34,364. The racial makeup of the city was 79.2% White, 11.3% African American, 0.3% Native American, 4.2% Asian, 0.1% Pacific Islander, 2.2% from other races, and 2.8% from two or more races. Hispanic or Latino of any race were 6.2% of the population.
The median income for a household in the city was $76,845, and the median income for a family was $90,945. The per capita income for the city was $37,945. About 4.2% of families and 5.3% of the population were below the poverty line, including 6.2% of those under age 18 and 4.2% of those age 65 or over.
Peachtree City is a diverse and vibrant community that offers a variety of activities and attractions for residents and visitors alike. The city is home to a variety of businesses, shopping centers, and recreational activities, making it an ideal place to live, work, and play.
Common Questions
What is Per Capita Income in Peachtree City?
Per Capita income in Peachtree City is $57,849.
What is the Median Family Income in Peachtree City?
Median Family Income in Peachtree City is $139,152.
What is the Median Household income in Peachtree City?
Median Household Income in Peachtree City is $111,850.
What is Income or Wage Gap in Peachtree City?
Income or Wage Gap in Peachtree City is 54.1%.
Women in Peachtree City earn 45.9 cents for every dollar earned by a man.
What is Family Income Deficit in Peachtree City?
Family Income Deficit in Peachtree City is $13,908.
Families that are below poverty line in Peachtree City earn $13,908 less on average than the poverty threshold level.
What is Inequality or Gini Index in Peachtree City?
Inequality or Gini Index in Peachtree City is 0.43.
What is the Total Population of Peachtree City?
Total Population of Peachtree City is 38,414.
What is the Total Male Population of Peachtree City?
Total Male Population of Peachtree City is 18,430.
What is the Total Female Population of Peachtree City?
Total Female Population of Peachtree City is 19,984.
What is the Ratio of Males per 100 Females in Peachtree City?
There are 92.22 Males per 100 Females in Peachtree City.
What is the Ratio of Females per 100 Males in Peachtree City?
There are 108.43 Females per 100 Males in Peachtree City.
What is the Median Population Age in Peachtree City?
Median Population Age in Peachtree City is 44.2 Years.
What is the Average Family Size in Peachtree City
Average Family Size in Peachtree City is 3.0 People.
What is the Average Household Size in Peachtree City
Average Household Size in Peachtree City is 2.6 People.
How Large is the Labor Force in Peachtree City?
There are 18,023 People in the Labor Forcein in Peachtree City.
What is the Percentage of People in the Labor Force in Peachtree City?
59.1% of People are in the Labor Force in Peachtree City.
What is the Unemployment Rate in Peachtree City?
Unemployment Rate in Peachtree City is 3.7%.