Cities with the Highest Percentage of Immigrants from Guyana in Georgia
RELATED REPORTS & OPTIONS
Guyana
Georgia
Compare Cities
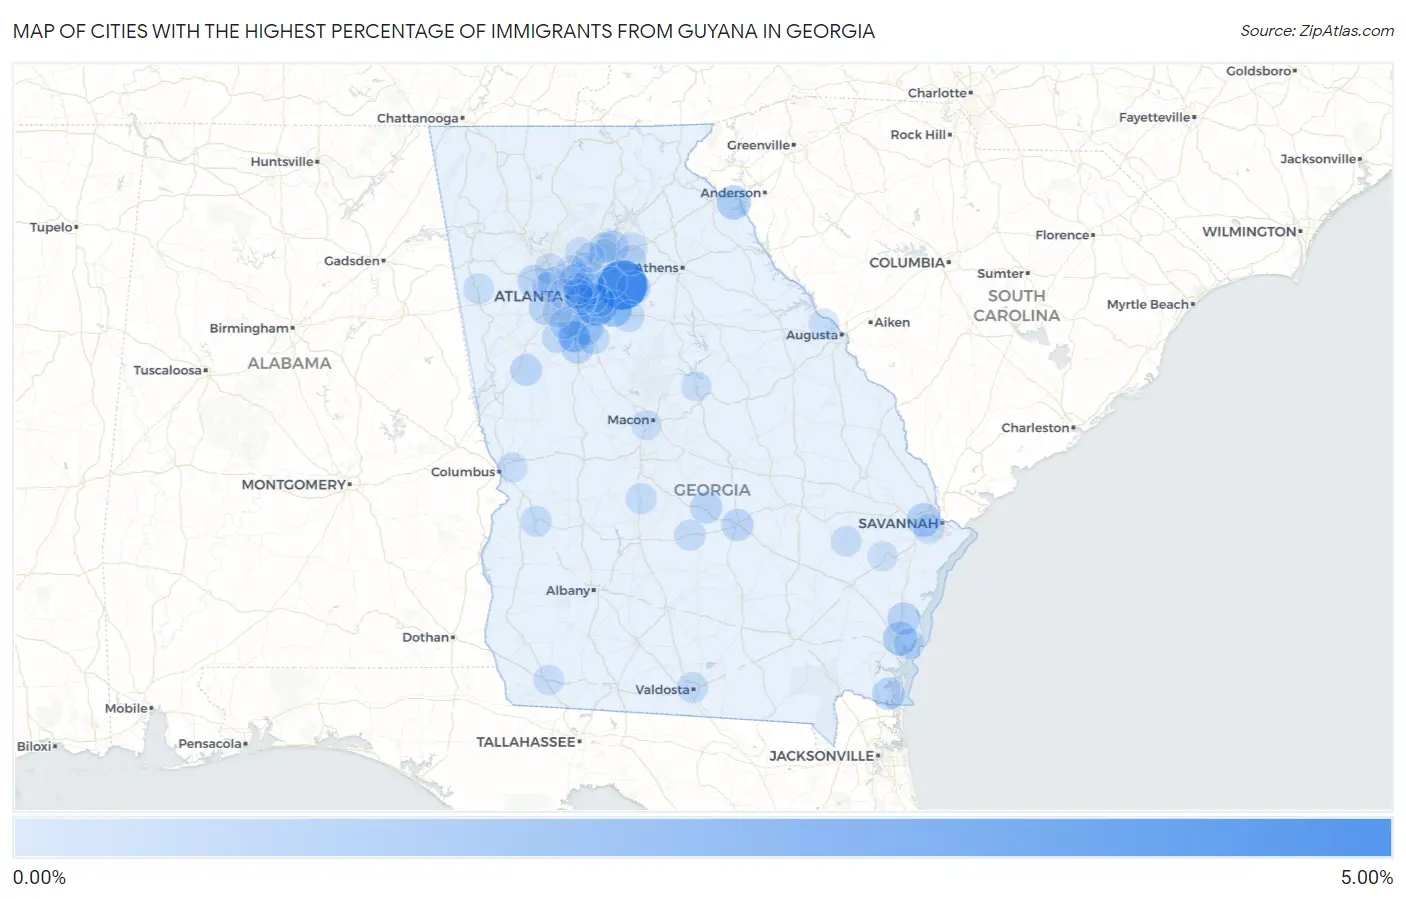
Map of Cities with the Highest Percentage of Immigrants from Guyana in Georgia
0.00%
5.00%
Cities with the Highest Percentage of Immigrants from Guyana in Georgia
| City | Guyana | vs State | vs National | |
| 1. | Loganville | 4.12% | 0.097%(+4.02)#-1 | 0.087%(+4.03)#0 |
| 2. | Stonecrest | 2.31% | 0.097%(+2.21)#0 | 0.087%(+2.22)#1 |
| 3. | Milstead | 1.48% | 0.097%(+1.38)#1 | 0.087%(+1.39)#2 |
| 4. | Conyers | 1.25% | 0.097%(+1.15)#2 | 0.087%(+1.17)#3 |
| 5. | Reed Creek | 0.89% | 0.097%(+0.795)#3 | 0.087%(+0.805)#4 |
| 6. | Country Club Estates | 0.81% | 0.097%(+0.709)#4 | 0.087%(+0.719)#5 |
| 7. | Stockbridge | 0.78% | 0.097%(+0.686)#5 | 0.087%(+0.696)#6 |
| 8. | Pooler | 0.78% | 0.097%(+0.680)#17 | 0.087%(+0.690)#691 |
| 9. | Avondale Estates | 0.71% | 0.097%(+0.616)#18 | 0.087%(+0.626)#692 |
| 10. | Between | 0.61% | 0.097%(+0.514)#19 | 0.087%(+0.524)#693 |
| 11. | Darien | 0.56% | 0.097%(+0.462)#20 | 0.087%(+0.472)#694 |
| 12. | Hampton | 0.52% | 0.097%(+0.425)#21 | 0.087%(+0.435)#695 |
| 13. | Kings Bay Base | 0.49% | 0.097%(+0.393)#22 | 0.087%(+0.403)#696 |
| 14. | Powder Springs | 0.46% | 0.097%(+0.364)#23 | 0.087%(+0.374)#697 |
| 15. | Chamblee | 0.45% | 0.097%(+0.350)#33 | 0.087%(+0.360)#1,253 |
| 16. | Eastman | 0.44% | 0.097%(+0.347)#34 | 0.087%(+0.357)#1,254 |
| 17. | Mcrae Helena | 0.44% | 0.097%(+0.345)#35 | 0.087%(+0.355)#1,255 |
| 18. | Buford | 0.41% | 0.097%(+0.309)#36 | 0.087%(+0.320)#1,256 |
| 19. | Lovejoy | 0.38% | 0.097%(+0.287)#37 | 0.087%(+0.297)#1,257 |
| 20. | South Fulton | 0.38% | 0.097%(+0.282)#38 | 0.087%(+0.292)#1,258 |
| 21. | Luthersville | 0.38% | 0.097%(+0.282)#39 | 0.087%(+0.292)#1,259 |
| 22. | Belvedere Park | 0.37% | 0.097%(+0.274)#40 | 0.087%(+0.284)#1,260 |
| 23. | Morrow | 0.34% | 0.097%(+0.238)#41 | 0.087%(+0.248)#1,261 |
| 24. | Lithonia | 0.31% | 0.097%(+0.209)#42 | 0.087%(+0.219)#1,262 |
| 25. | Bonanza | 0.30% | 0.097%(+0.205)#43 | 0.087%(+0.216)#1,263 |
| 26. | Covington | 0.29% | 0.097%(+0.192)#44 | 0.087%(+0.202)#1,264 |
| 27. | Suwanee | 0.28% | 0.097%(+0.186)#45 | 0.087%(+0.196)#1,265 |
| 28. | Mcdonough | 0.24% | 0.097%(+0.143)#46 | 0.087%(+0.154)#1,266 |
| 29. | Snellville | 0.24% | 0.097%(+0.142)#47 | 0.087%(+0.153)#1,267 |
| 30. | Fayetteville | 0.24% | 0.097%(+0.140)#48 | 0.087%(+0.150)#1,268 |
| 31. | Richland | 0.23% | 0.097%(+0.136)#49 | 0.087%(+0.146)#1,269 |
| 32. | Unadilla | 0.23% | 0.097%(+0.131)#50 | 0.087%(+0.141)#1,270 |
| 33. | Abbeville | 0.22% | 0.097%(+0.121)#51 | 0.087%(+0.131)#1,271 |
| 34. | Valdosta | 0.21% | 0.097%(+0.111)#52 | 0.087%(+0.121)#1,634 |
| 35. | Redan | 0.20% | 0.097%(+0.107)#53 | 0.087%(+0.118)#1,635 |
| 36. | St Simons | 0.18% | 0.097%(+0.078)#54 | 0.087%(+0.088)#1,636 |
| 37. | Riverdale | 0.17% | 0.097%(+0.077)#55 | 0.087%(+0.087)#1,637 |
| 38. | Buchanan | 0.16% | 0.097%(+0.065)#56 | 0.087%(+0.075)#1,638 |
| 39. | Marietta | 0.15% | 0.097%(+0.058)#57 | 0.087%(+0.068)#1,639 |
| 40. | Stone Mountain | 0.14% | 0.097%(+0.039)#58 | 0.087%(+0.049)#1,640 |
| 41. | Glennville | 0.13% | 0.097%(+0.038)#59 | 0.087%(+0.048)#1,641 |
| 42. | Candler Mcafee | 0.12% | 0.097%(+0.022)#60 | 0.087%(+0.032)#1,642 |
| 43. | Mableton | 0.11% | 0.097%(+0.013)#61 | 0.087%(+0.024)#1,643 |
| 44. | Peachtree Corners | 0.11% | 0.097%(+0.010)#62 | 0.087%(+0.020)#1,644 |
| 45. | Sugar Hill | 0.10% | 0.097%(+0.007)#63 | 0.087%(+0.017)#1,645 |
| 46. | Smyrna | 0.10% | 0.097%(+0.003)#64 | 0.087%(+0.014)#1,646 |
| 47. | North Decatur | 0.099% | 0.097%(+0.002)#65 | 0.087%(+0.012)#1,647 |
| 48. | Brookhaven | 0.093% | 0.097%(-0.004)#66 | 0.087%(+0.006)#1,648 |
| 49. | Braselton | 0.087% | 0.097%(-0.010)#67 | 0.087%(+0.000)#1,649 |
| 50. | Evans | 0.080% | 0.097%(-0.017)#68 | 0.087%(-0.007)#1,650 |
| 51. | Tucker | 0.073% | 0.097%(-0.024)#69 | 0.087%(-0.014)#1,651 |
| 52. | Atlanta | 0.072% | 0.097%(-0.025)#70 | 0.087%(-0.015)#1,727 |
| 53. | Columbus | 0.066% | 0.097%(-0.030)#71 | 0.087%(-0.020)#1,728 |
| 54. | Bainbridge | 0.063% | 0.097%(-0.034)#72 | 0.087%(-0.024)#1,729 |
| 55. | College Park | 0.057% | 0.097%(-0.040)#73 | 0.087%(-0.030)#1,730 |
| 56. | Macon Bibb County | 0.054% | 0.097%(-0.043)#74 | 0.087%(-0.033)#1,740 |
| 57. | Auburn | 0.051% | 0.097%(-0.046)#75 | 0.087%(-0.035)#1,741 |
| 58. | Decatur | 0.049% | 0.097%(-0.048)#76 | 0.087%(-0.038)#1,742 |
| 59. | Savannah | 0.047% | 0.097%(-0.050)#77 | 0.087%(-0.039)#1,743 |
| 60. | Augusta-Richmond County Consolidated Government (Balance) | 0.039% | 0.097%(-0.058)#78 | 0.087%(-0.048)#1,751 |
| 61. | Milledgeville | 0.035% | 0.097%(-0.062)#79 | 0.087%(-0.051)#1,752 |
| 62. | Alpharetta | 0.030% | 0.097%(-0.067)#80 | 0.087%(-0.056)#1,753 |
| 63. | Johns Creek | 0.024% | 0.097%(-0.073)#81 | 0.087%(-0.062)#1,754 |
| 64. | Cusseta Chattahoochee County Unified Government | 0.021% | 0.097%(-0.076)#82 | 0.087%(-0.065)#1,755 |
| 65. | Hinesville | 0.020% | 0.097%(-0.077)#83 | 0.087%(-0.067)#1,756 |
| 66. | Sandy Springs | 0.0065% | 0.097%(-0.090)#84 | 0.087%(-0.080)#1,757 |
Common Questions
What are the Top 10 Cities with the Highest Percentage of Immigrants from Guyana in Georgia?
Top 10 Cities with the Highest Percentage of Immigrants from Guyana in Georgia are:
#1
4.12%
#2
2.31%
#3
1.25%
#4
0.89%
#5
0.81%
#6
0.78%
#7
0.78%
#8
0.71%
#9
0.61%
#10
0.56%
What city has the Highest Percentage of Immigrants from Guyana in Georgia?
Loganville has the Highest Percentage of Immigrants from Guyana in Georgia with 4.12%.
What is the Percentage of Immigrants from Guyana in the State of Georgia?
Percentage of Immigrants from Guyana in Georgia is 0.097%.
What is the Percentage of Immigrants from Guyana in the United States?
Percentage of Immigrants from Guyana in the United States is 0.087%.