Zip Codes with the Highest Percentage of Population Employed in Architecture & Engineering in Georgia
RELATED REPORTS & OPTIONS
Architecture & Engineering
Georgia
Compare Zip Codes
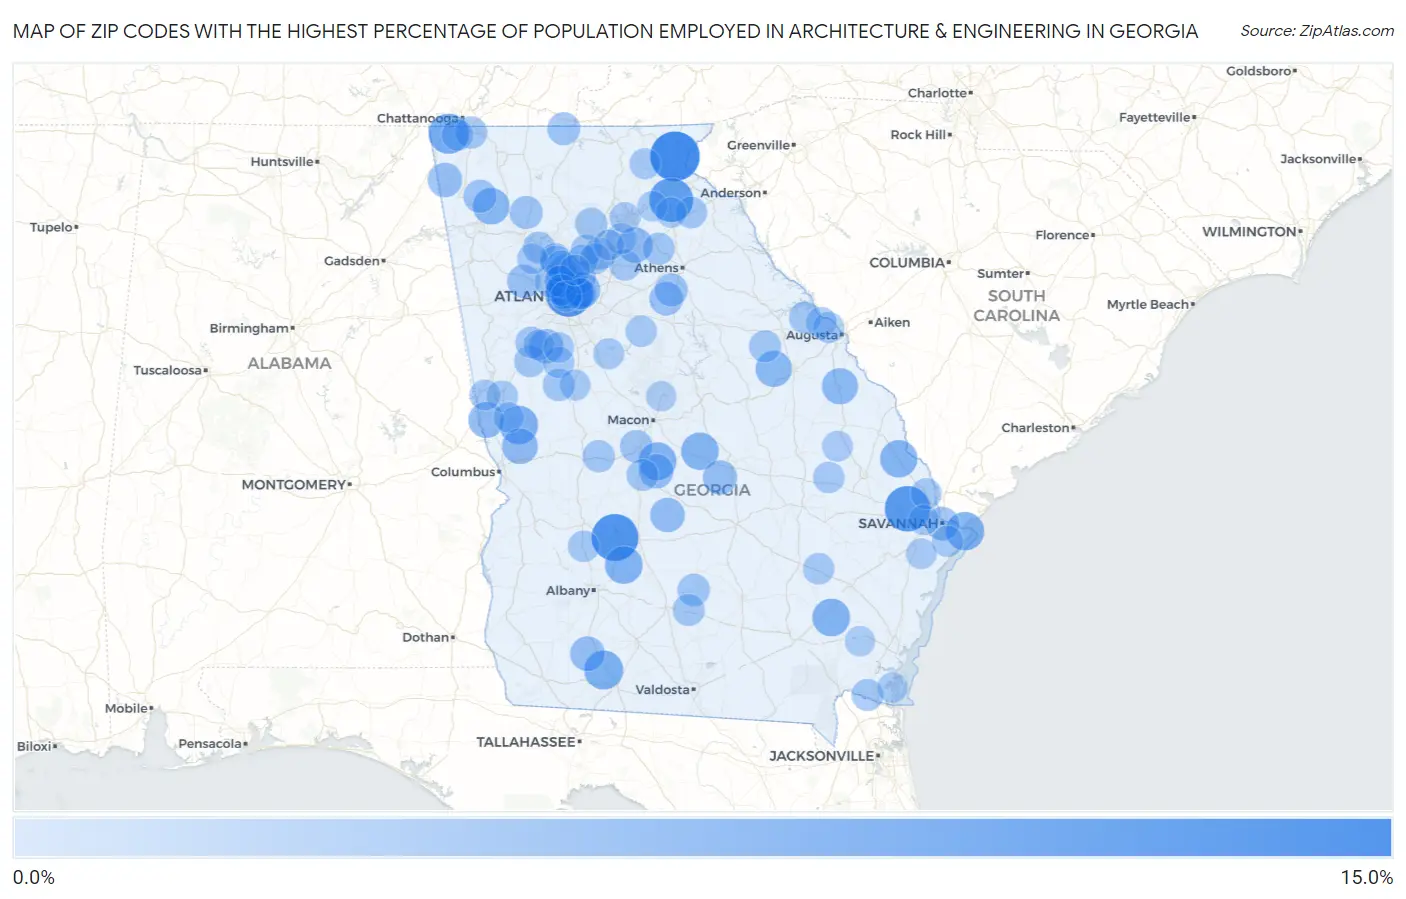
Map of Zip Codes with the Highest Percentage of Population Employed in Architecture & Engineering in Georgia
0.0%
15.0%
Zip Codes with the Highest Percentage of Population Employed in Architecture & Engineering in Georgia
| Zip Code | % Employed | vs State | vs National | |
| 1. | 30552 | 10.6% | 1.8%(+8.81)#1 | 2.1%(+8.45)#305 |
| 2. | 31735 | 9.5% | 1.8%(+7.73)#2 | 2.1%(+7.37)#374 |
| 3. | 30308 | 9.2% | 1.8%(+7.45)#3 | 2.1%(+7.10)#392 |
| 4. | 31307 | 8.9% | 1.8%(+7.07)#4 | 2.1%(+6.72)#440 |
| 5. | 30511 | 8.3% | 1.8%(+6.49)#5 | 2.1%(+6.14)#520 |
| 6. | 30757 | 6.7% | 1.8%(+4.94)#6 | 2.1%(+4.59)#813 |
| 7. | 31773 | 6.3% | 1.8%(+4.47)#7 | 2.1%(+4.12)#970 |
| 8. | 31823 | 6.1% | 1.8%(+4.27)#8 | 2.1%(+3.92)#1,052 |
| 9. | 31328 | 6.0% | 1.8%(+4.23)#9 | 2.1%(+3.88)#1,070 |
| 10. | 31005 | 5.7% | 1.8%(+3.95)#10 | 2.1%(+3.59)#1,200 |
| 11. | 31557 | 5.7% | 1.8%(+3.89)#11 | 2.1%(+3.54)#1,222 |
| 12. | 31796 | 5.7% | 1.8%(+3.89)#12 | 2.1%(+3.54)#1,226 |
| 13. | 31017 | 5.6% | 1.8%(+3.85)#13 | 2.1%(+3.50)#1,245 |
| 14. | 30446 | 5.6% | 1.8%(+3.78)#14 | 2.1%(+3.42)#1,295 |
| 15. | 30363 | 5.4% | 1.8%(+3.59)#15 | 2.1%(+3.23)#1,400 |
| 16. | 30309 | 5.4% | 1.8%(+3.58)#16 | 2.1%(+3.23)#1,405 |
| 17. | 30733 | 5.3% | 1.8%(+3.46)#17 | 2.1%(+3.10)#1,486 |
| 18. | 30810 | 5.2% | 1.8%(+3.37)#18 | 2.1%(+3.01)#1,553 |
| 19. | 30830 | 5.1% | 1.8%(+3.28)#19 | 2.1%(+2.93)#1,612 |
| 20. | 31833 | 4.9% | 1.8%(+3.12)#20 | 2.1%(+2.77)#1,715 |
| 21. | 31807 | 4.9% | 1.8%(+3.11)#21 | 2.1%(+2.76)#1,728 |
| 22. | 30517 | 4.8% | 1.8%(+2.99)#22 | 2.1%(+2.63)#1,851 |
| 23. | 30079 | 4.8% | 1.8%(+2.98)#23 | 2.1%(+2.63)#1,853 |
| 24. | 30327 | 4.5% | 1.8%(+2.73)#24 | 2.1%(+2.37)#2,097 |
| 25. | 31779 | 4.5% | 1.8%(+2.71)#25 | 2.1%(+2.35)#2,119 |
| 26. | 31071 | 4.4% | 1.8%(+2.64)#26 | 2.1%(+2.29)#2,213 |
| 27. | 30731 | 4.4% | 1.8%(+2.61)#27 | 2.1%(+2.25)#2,256 |
| 28. | 31047 | 4.4% | 1.8%(+2.59)#28 | 2.1%(+2.24)#2,270 |
| 29. | 30269 | 4.4% | 1.8%(+2.58)#29 | 2.1%(+2.23)#2,288 |
| 30. | 31019 | 4.3% | 1.8%(+2.51)#30 | 2.1%(+2.15)#2,364 |
| 31. | 30623 | 4.1% | 1.8%(+2.29)#31 | 2.1%(+1.93)#2,643 |
| 32. | 30328 | 4.1% | 1.8%(+2.27)#32 | 2.1%(+1.91)#2,681 |
| 33. | 31401 | 4.1% | 1.8%(+2.26)#33 | 2.1%(+1.91)#2,690 |
| 34. | 30141 | 3.9% | 1.8%(+2.15)#34 | 2.1%(+1.80)#2,852 |
| 35. | 30105 | 3.9% | 1.8%(+2.13)#35 | 2.1%(+1.77)#2,891 |
| 36. | 30621 | 3.9% | 1.8%(+2.08)#36 | 2.1%(+1.72)#2,982 |
| 37. | 30171 | 3.8% | 1.8%(+2.05)#37 | 2.1%(+1.70)#3,011 |
| 38. | 30555 | 3.8% | 1.8%(+2.01)#38 | 2.1%(+1.65)#3,088 |
| 39. | 30082 | 3.8% | 1.8%(+1.98)#39 | 2.1%(+1.63)#3,141 |
| 40. | 31008 | 3.7% | 1.8%(+1.91)#40 | 2.1%(+1.55)#3,279 |
| 41. | 31774 | 3.6% | 1.8%(+1.80)#41 | 2.1%(+1.45)#3,515 |
| 42. | 31076 | 3.5% | 1.8%(+1.74)#42 | 2.1%(+1.38)#3,657 |
| 43. | 30549 | 3.5% | 1.8%(+1.72)#43 | 2.1%(+1.37)#3,694 |
| 44. | 30028 | 3.5% | 1.8%(+1.71)#44 | 2.1%(+1.36)#3,729 |
| 45. | 30742 | 3.5% | 1.8%(+1.70)#45 | 2.1%(+1.34)#3,756 |
| 46. | 30828 | 3.5% | 1.8%(+1.66)#46 | 2.1%(+1.30)#3,851 |
| 47. | 30206 | 3.4% | 1.8%(+1.63)#47 | 2.1%(+1.28)#3,913 |
| 48. | 31749 | 3.4% | 1.8%(+1.60)#48 | 2.1%(+1.25)#3,972 |
| 49. | 31548 | 3.4% | 1.8%(+1.59)#49 | 2.1%(+1.24)#3,980 |
| 50. | 30341 | 3.4% | 1.8%(+1.58)#50 | 2.1%(+1.22)#4,014 |
| 51. | 30802 | 3.4% | 1.8%(+1.57)#51 | 2.1%(+1.21)#4,040 |
| 52. | 30030 | 3.4% | 1.8%(+1.57)#52 | 2.1%(+1.21)#4,043 |
| 53. | 30259 | 3.3% | 1.8%(+1.55)#53 | 2.1%(+1.20)#4,072 |
| 54. | 31069 | 3.3% | 1.8%(+1.55)#54 | 2.1%(+1.19)#4,090 |
| 55. | 30024 | 3.3% | 1.8%(+1.54)#55 | 2.1%(+1.19)#4,093 |
| 56. | 30102 | 3.3% | 1.8%(+1.54)#56 | 2.1%(+1.18)#4,099 |
| 57. | 30265 | 3.3% | 1.8%(+1.53)#57 | 2.1%(+1.17)#4,146 |
| 58. | 30521 | 3.3% | 1.8%(+1.52)#58 | 2.1%(+1.17)#4,153 |
| 59. | 30725 | 3.3% | 1.8%(+1.46)#59 | 2.1%(+1.11)#4,307 |
| 60. | 30066 | 3.2% | 1.8%(+1.44)#60 | 2.1%(+1.09)#4,355 |
| 61. | 31787 | 3.2% | 1.8%(+1.44)#61 | 2.1%(+1.09)#4,358 |
| 62. | 30062 | 3.2% | 1.8%(+1.44)#62 | 2.1%(+1.08)#4,382 |
| 63. | 31563 | 3.2% | 1.8%(+1.41)#63 | 2.1%(+1.06)#4,440 |
| 64. | 30068 | 3.2% | 1.8%(+1.41)#64 | 2.1%(+1.06)#4,452 |
| 65. | 30019 | 3.2% | 1.8%(+1.39)#65 | 2.1%(+1.04)#4,499 |
| 66. | 30439 | 3.2% | 1.8%(+1.39)#66 | 2.1%(+1.03)#4,507 |
| 67. | 30205 | 3.2% | 1.8%(+1.39)#67 | 2.1%(+1.03)#4,510 |
| 68. | 30339 | 3.2% | 1.8%(+1.37)#68 | 2.1%(+1.02)#4,547 |
| 69. | 30318 | 3.2% | 1.8%(+1.36)#69 | 2.1%(+1.00)#4,598 |
| 70. | 30055 | 3.1% | 1.8%(+1.35)#70 | 2.1%(+0.993)#4,619 |
| 71. | 31411 | 3.1% | 1.8%(+1.33)#71 | 2.1%(+0.978)#4,661 |
| 72. | 30005 | 3.1% | 1.8%(+1.33)#72 | 2.1%(+0.973)#4,688 |
| 73. | 30241 | 3.1% | 1.8%(+1.31)#73 | 2.1%(+0.954)#4,735 |
| 74. | 30295 | 3.1% | 1.8%(+1.27)#74 | 2.1%(+0.913)#4,844 |
| 75. | 30002 | 3.1% | 1.8%(+1.26)#75 | 2.1%(+0.904)#4,879 |
| 76. | 30571 | 3.0% | 1.8%(+1.25)#76 | 2.1%(+0.892)#4,921 |
| 77. | 31326 | 3.0% | 1.8%(+1.25)#77 | 2.1%(+0.891)#4,923 |
| 78. | 30907 | 3.0% | 1.8%(+1.24)#78 | 2.1%(+0.891)#4,929 |
| 79. | 30234 | 3.0% | 1.8%(+1.24)#79 | 2.1%(+0.889)#4,936 |
| 80. | 30022 | 3.0% | 1.8%(+1.23)#80 | 2.1%(+0.876)#4,972 |
| 81. | 30809 | 3.0% | 1.8%(+1.23)#81 | 2.1%(+0.874)#4,975 |
| 82. | 30303 | 3.0% | 1.8%(+1.22)#82 | 2.1%(+0.861)#5,024 |
| 83. | 30097 | 3.0% | 1.8%(+1.17)#83 | 2.1%(+0.818)#5,169 |
| 84. | 30542 | 3.0% | 1.8%(+1.17)#84 | 2.1%(+0.812)#5,195 |
| 85. | 30277 | 3.0% | 1.8%(+1.16)#85 | 2.1%(+0.808)#5,204 |
| 86. | 30101 | 3.0% | 1.8%(+1.16)#86 | 2.1%(+0.806)#5,220 |
| 87. | 30240 | 2.9% | 1.8%(+1.15)#87 | 2.1%(+0.797)#5,250 |
| 88. | 30425 | 2.9% | 1.8%(+1.13)#88 | 2.1%(+0.780)#5,322 |
| 89. | 30215 | 2.9% | 1.8%(+1.13)#89 | 2.1%(+0.771)#5,352 |
| 90. | 30518 | 2.9% | 1.8%(+1.11)#90 | 2.1%(+0.754)#5,412 |
| 91. | 31324 | 2.9% | 1.8%(+1.11)#91 | 2.1%(+0.753)#5,415 |
| 92. | 30338 | 2.9% | 1.8%(+1.10)#92 | 2.1%(+0.748)#5,427 |
| 93. | 30506 | 2.9% | 1.8%(+1.06)#93 | 2.1%(+0.707)#5,563 |
| 94. | 30554 | 2.8% | 1.8%(+1.04)#94 | 2.1%(+0.690)#5,627 |
| 95. | 30547 | 2.8% | 1.8%(+1.03)#95 | 2.1%(+0.674)#5,692 |
| 96. | 31558 | 2.8% | 1.8%(+1.02)#96 | 2.1%(+0.668)#5,719 |
| 97. | 31822 | 2.8% | 1.8%(+1.02)#97 | 2.1%(+0.663)#5,752 |
| 98. | 31322 | 2.8% | 1.8%(+1.00)#98 | 2.1%(+0.647)#5,802 |
| 99. | 31566 | 2.8% | 1.8%(+0.977)#99 | 2.1%(+0.623)#5,898 |
| 100. | 31032 | 2.8% | 1.8%(+0.974)#100 | 2.1%(+0.620)#5,903 |
Common Questions
What are the Top 10 Zip Codes with the Highest Percentage of Population Employed in Architecture & Engineering in Georgia?
Top 10 Zip Codes with the Highest Percentage of Population Employed in Architecture & Engineering in Georgia are:
What zip code has the Highest Percentage of Population Employed in Architecture & Engineering in Georgia?
30552 has the Highest Percentage of Population Employed in Architecture & Engineering in Georgia with 10.6%.
What is the Percentage of Population Employed in Architecture & Engineering in the State of Georgia?
Percentage of Population Employed in Architecture & Engineering in Georgia is 1.8%.
What is the Percentage of Population Employed in Architecture & Engineering in the United States?
Percentage of Population Employed in Architecture & Engineering in the United States is 2.1%.