Homer, GA Map & Demographics
Homer Map
Homer Overview
$30,296
PER CAPITA INCOME
$86,667
AVG FAMILY INCOME
$73,542
AVG HOUSEHOLD INCOME
45.9%
WAGE / INCOME GAP [ % ]
54.1¢/ $1
WAGE / INCOME GAP [ $ ]
$9,941
FAMILY INCOME DEFICIT
0.44
INEQUALITY / GINI INDEX
1,659
TOTAL POPULATION
786
MALE POPULATION
873
FEMALE POPULATION
90.03
MALES / 100 FEMALES
111.07
FEMALES / 100 MALES
31.8
MEDIAN AGE
3.4
AVG FAMILY SIZE
2.9
AVG HOUSEHOLD SIZE
741
LABOR FORCE [ PEOPLE ]
59.3%
PERCENT IN LABOR FORCE
4.7%
UNEMPLOYMENT RATE
Homer Zip Codes
Homer Area Codes
Income in Homer
Income Overview in Homer
Per Capita Income in Homer is $30,296, while median incomes of families and households are $86,667 and $73,542 respectively.
| Characteristic | Number | Measure |
| Per Capita Income | 1,659 | $30,296 |
| Median Family Income | 426 | $86,667 |
| Mean Family Income | 426 | $97,189 |
| Median Household Income | 574 | $73,542 |
| Mean Household Income | 574 | $83,289 |
| Income Deficit | 426 | $9,941 |
| Wage / Income Gap (%) | 1,659 | 45.87% |
| Wage / Income Gap ($) | 1,659 | 54.13¢ per $1 |
| Gini / Inequality Index | 1,659 | 0.44 |
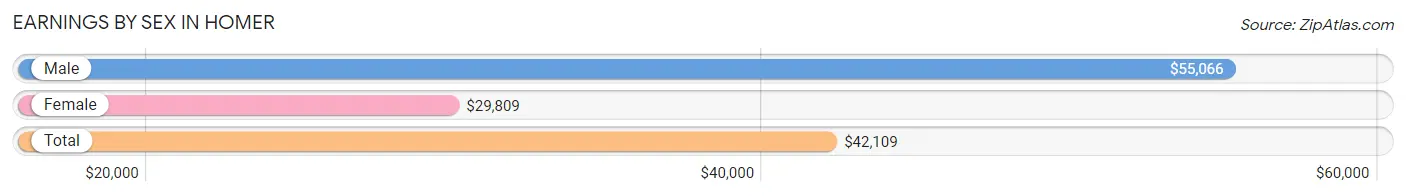
Earnings by Sex in Homer
Average Earnings in Homer are $42,109, $55,066 for men and $29,809 for women, a difference of 45.9%.
| Sex | Number | Average Earnings |
| Male | 388 (48.8%) | $55,066 |
| Female | 407 (51.2%) | $29,809 |
| Total | 795 (100.0%) | $42,109 |
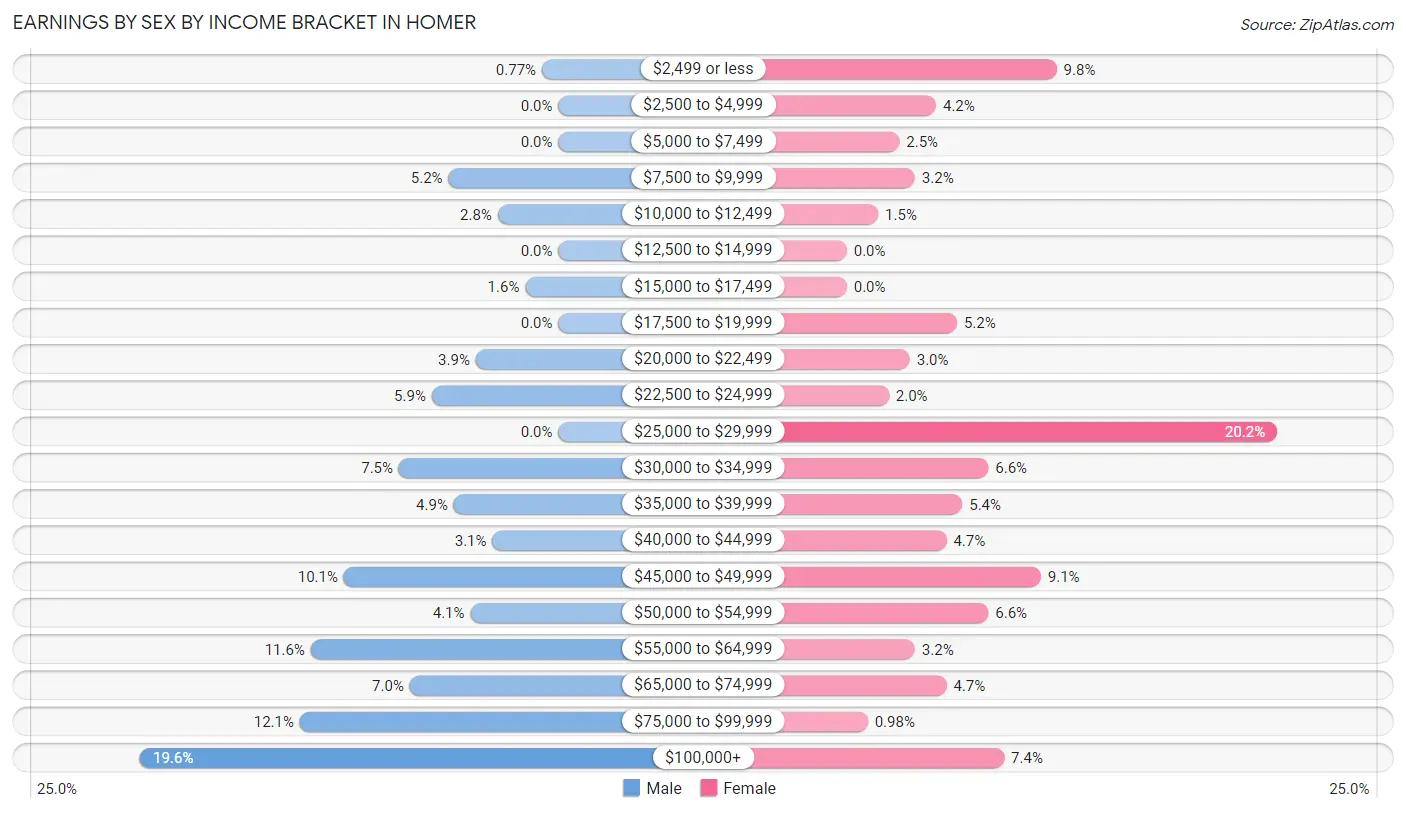
Earnings by Sex by Income Bracket in Homer
The most common earnings brackets in Homer are $100,000+ for men (76 | 19.6%) and $25,000 to $29,999 for women (82 | 20.2%).
| Income | Male | Female |
| $2,499 or less | 3 (0.8%) | 40 (9.8%) |
| $2,500 to $4,999 | 0 (0.0%) | 17 (4.2%) |
| $5,000 to $7,499 | 0 (0.0%) | 10 (2.5%) |
| $7,500 to $9,999 | 20 (5.1%) | 13 (3.2%) |
| $10,000 to $12,499 | 11 (2.8%) | 6 (1.5%) |
| $12,500 to $14,999 | 0 (0.0%) | 0 (0.0%) |
| $15,000 to $17,499 | 6 (1.5%) | 0 (0.0%) |
| $17,500 to $19,999 | 0 (0.0%) | 21 (5.2%) |
| $20,000 to $22,499 | 15 (3.9%) | 12 (2.9%) |
| $22,500 to $24,999 | 23 (5.9%) | 8 (2.0%) |
| $25,000 to $29,999 | 0 (0.0%) | 82 (20.2%) |
| $30,000 to $34,999 | 29 (7.5%) | 27 (6.6%) |
| $35,000 to $39,999 | 19 (4.9%) | 22 (5.4%) |
| $40,000 to $44,999 | 12 (3.1%) | 19 (4.7%) |
| $45,000 to $49,999 | 39 (10.1%) | 37 (9.1%) |
| $50,000 to $54,999 | 16 (4.1%) | 27 (6.6%) |
| $55,000 to $64,999 | 45 (11.6%) | 13 (3.2%) |
| $65,000 to $74,999 | 27 (7.0%) | 19 (4.7%) |
| $75,000 to $99,999 | 47 (12.1%) | 4 (1.0%) |
| $100,000+ | 76 (19.6%) | 30 (7.4%) |
| Total | 388 (100.0%) | 407 (100.0%) |
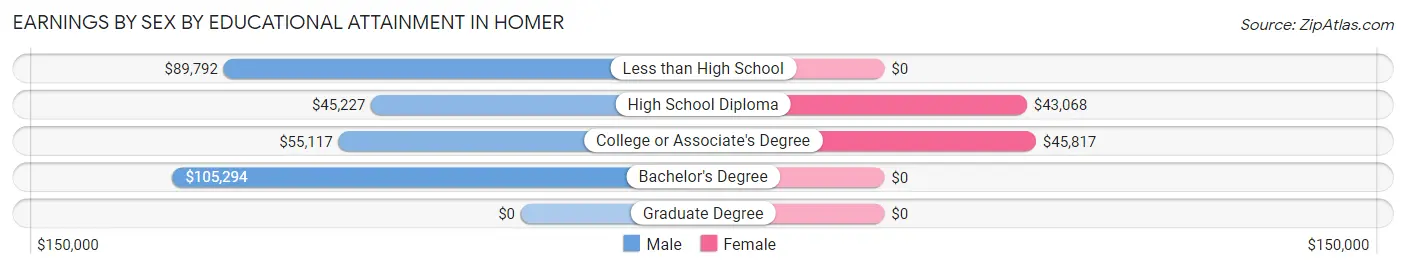
Earnings by Sex by Educational Attainment in Homer
Average earnings in Homer are $56,250 for men and $45,143 for women, a difference of 19.8%. Men with an educational attainment of bachelor's degree enjoy the highest average annual earnings of $105,294, while those with high school diploma education earn the least with $45,227. Women with an educational attainment of college or associate's degree earn the most with the average annual earnings of $45,817, while those with high school diploma education have the smallest earnings of $43,068.
| Educational Attainment | Male Income | Female Income |
| Less than High School | $89,792 | $0 |
| High School Diploma | $45,227 | $43,068 |
| College or Associate's Degree | $55,117 | $45,817 |
| Bachelor's Degree | $105,294 | $0 |
| Graduate Degree | - | - |
| Total | $56,250 | $45,143 |
Family Income in Homer
Family Income Brackets in Homer
According to the Homer family income data, there are 107 families falling into the $75,000 to $99,999 income range, which is the most common income bracket and makes up 25.1% of all families.
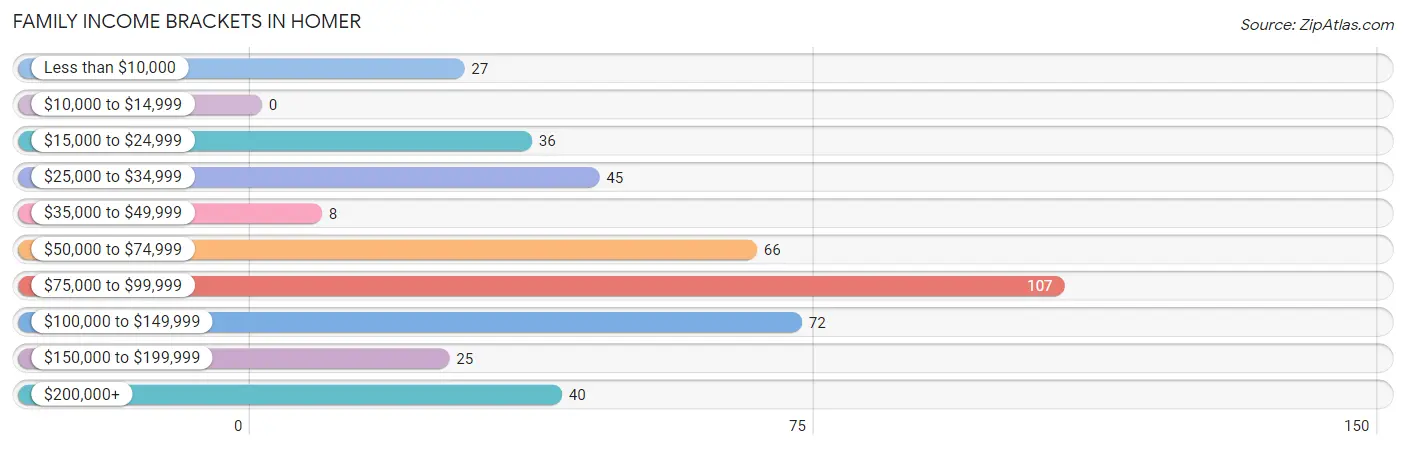
| Income Bracket | # Families | % Families |
| Less than $10,000 | 27 | 6.3% |
| $10,000 to $14,999 | 0 | 0.0% |
| $15,000 to $24,999 | 36 | 8.5% |
| $25,000 to $34,999 | 45 | 10.6% |
| $35,000 to $49,999 | 8 | 1.9% |
| $50,000 to $74,999 | 66 | 15.5% |
| $75,000 to $99,999 | 107 | 25.1% |
| $100,000 to $149,999 | 72 | 16.9% |
| $150,000 to $199,999 | 25 | 5.9% |
| $200,000+ | 40 | 9.4% |
Family Income by Famaliy Size in Homer
5-person families (45 | 10.6%) account for the highest median family income in Homer with $110,156 per family, while 2-person families (213 | 50.0%) have the highest median income of $40,738 per family member.
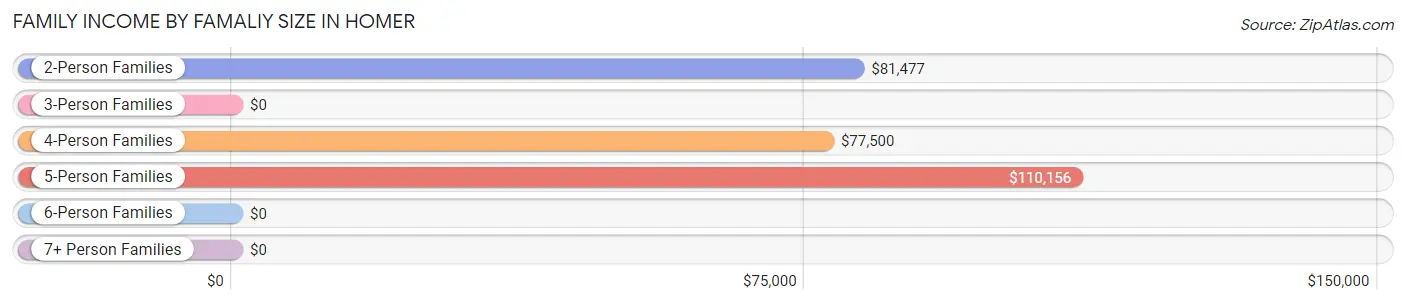
| Income Bracket | # Families | Median Income |
| 2-Person Families | 213 (50.0%) | $81,477 |
| 3-Person Families | 76 (17.8%) | $0 |
| 4-Person Families | 74 (17.4%) | $77,500 |
| 5-Person Families | 45 (10.6%) | $110,156 |
| 6-Person Families | 18 (4.2%) | $0 |
| 7+ Person Families | 0 (0.0%) | $0 |
| Total | 426 (100.0%) | $86,667 |
Family Income by Number of Earners in Homer
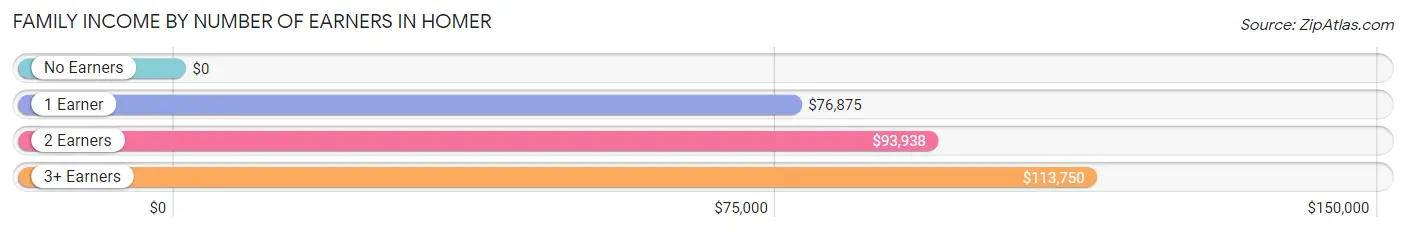
| Number of Earners | # Families | Median Income |
| No Earners | 99 (23.2%) | $0 |
| 1 Earner | 142 (33.3%) | $76,875 |
| 2 Earners | 123 (28.9%) | $93,938 |
| 3+ Earners | 62 (14.5%) | $113,750 |
| Total | 426 (100.0%) | $86,667 |
Household Income in Homer
Household Income Brackets in Homer
With 126 households falling in the category, the $75,000 to $99,999 income range is the most frequent in Homer, accounting for 22.0% of all households. In contrast, only 16 households (2.8%) fall into the $35,000 to $49,999 income bracket, making it the least populous group.
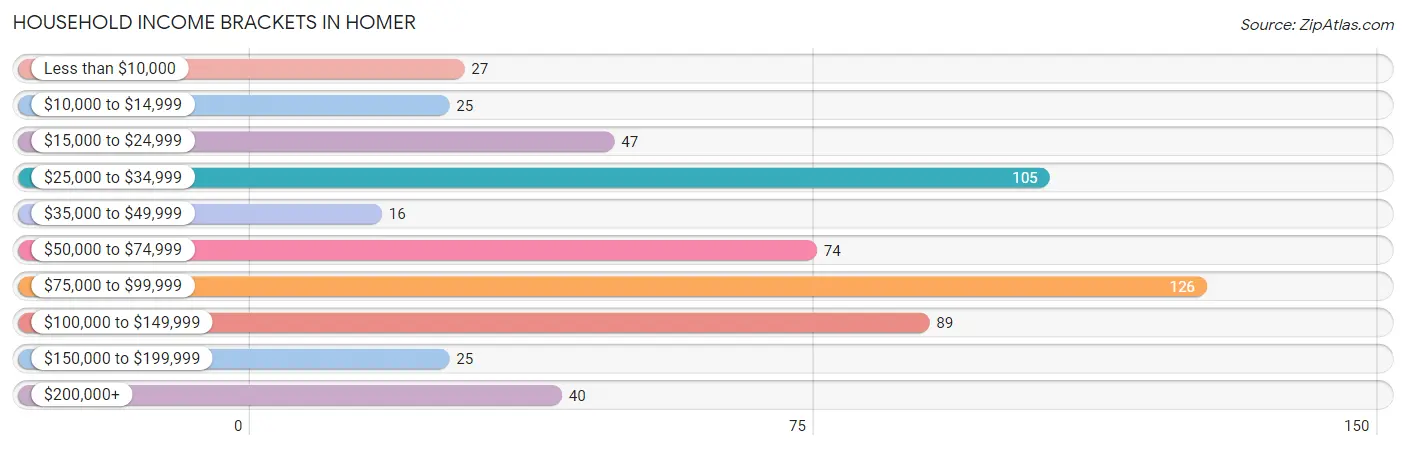
| Income Bracket | # Households | % Households |
| Less than $10,000 | 27 | 4.7% |
| $10,000 to $14,999 | 25 | 4.4% |
| $15,000 to $24,999 | 47 | 8.2% |
| $25,000 to $34,999 | 105 | 18.3% |
| $35,000 to $49,999 | 16 | 2.8% |
| $50,000 to $74,999 | 74 | 12.9% |
| $75,000 to $99,999 | 126 | 22.0% |
| $100,000 to $149,999 | 89 | 15.5% |
| $150,000 to $199,999 | 25 | 4.4% |
| $200,000+ | 40 | 7.0% |
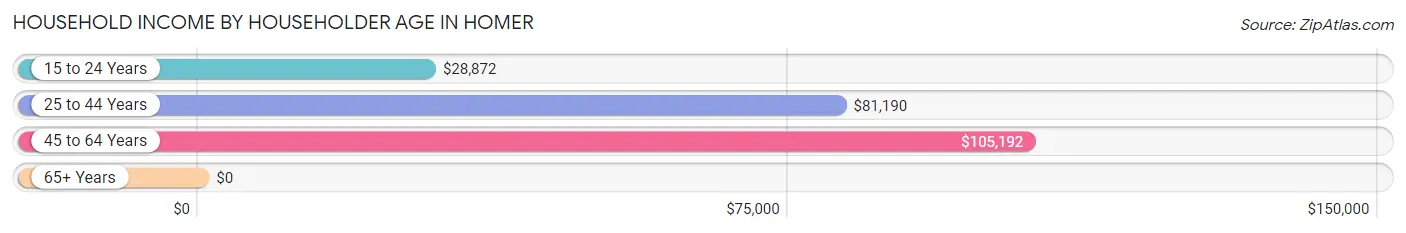
Household Income by Householder Age in Homer
The median household income in Homer is $73,542, with the highest median household income of $105,192 found in the 45 to 64 years age bracket for the primary householder. A total of 176 households (30.7%) fall into this category. Meanwhile, the 65+ years age bracket for the primary householder has the lowest median household income of $0, with 111 households (19.3%) in this group.
| Income Bracket | # Households | Median Income |
| 15 to 24 Years | 83 (14.5%) | $28,872 |
| 25 to 44 Years | 204 (35.5%) | $81,190 |
| 45 to 64 Years | 176 (30.7%) | $105,192 |
| 65+ Years | 111 (19.3%) | $0 |
| Total | 574 (100.0%) | $73,542 |
Poverty in Homer
Income Below Poverty by Sex and Age in Homer
With 17.4% poverty level for males and 16.8% for females among the residents of Homer, 12 to 14 year old males and 12 to 14 year old females are the most vulnerable to poverty, with 67 males (71.3%) and 6 females (100.0%) in their respective age groups living below the poverty level.
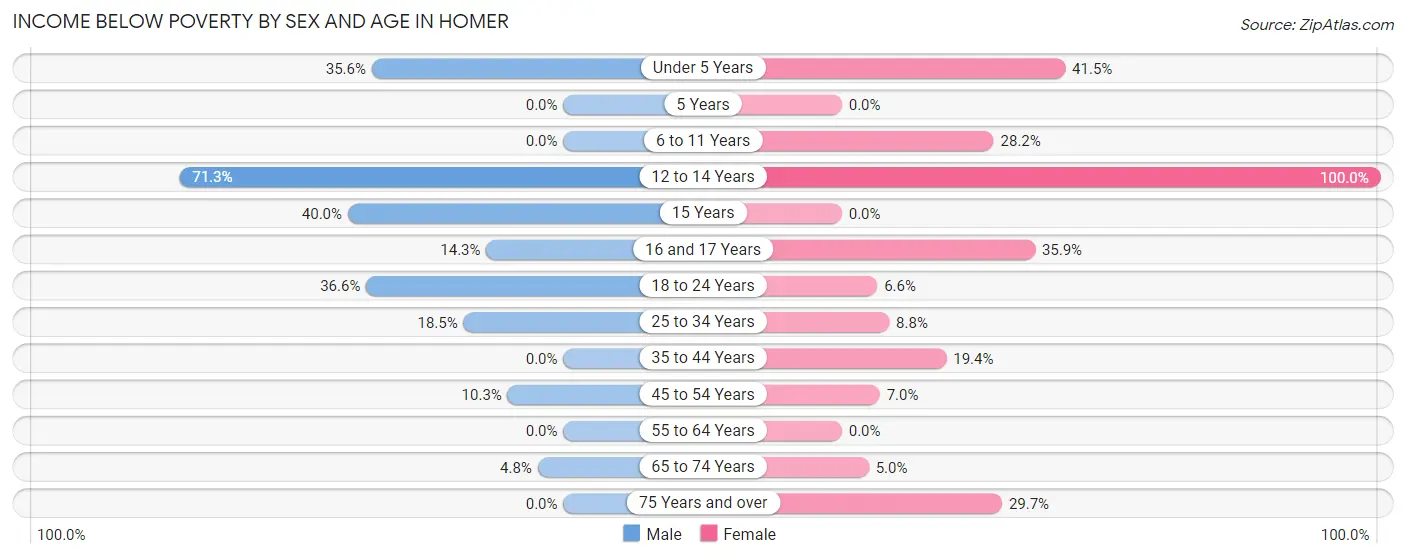
| Age Bracket | Male | Female |
| Under 5 Years | 16 (35.6%) | 17 (41.5%) |
| 5 Years | 0 (0.0%) | 0 (0.0%) |
| 6 to 11 Years | 0 (0.0%) | 31 (28.2%) |
| 12 to 14 Years | 67 (71.3%) | 6 (100.0%) |
| 15 Years | 4 (40.0%) | 0 (0.0%) |
| 16 and 17 Years | 6 (14.3%) | 19 (35.8%) |
| 18 to 24 Years | 15 (36.6%) | 10 (6.6%) |
| 25 to 34 Years | 15 (18.5%) | 8 (8.8%) |
| 35 to 44 Years | 0 (0.0%) | 26 (19.4%) |
| 45 to 54 Years | 12 (10.3%) | 5 (7.0%) |
| 55 to 64 Years | 0 (0.0%) | 0 (0.0%) |
| 65 to 74 Years | 2 (4.8%) | 2 (5.0%) |
| 75 Years and over | 0 (0.0%) | 22 (29.7%) |
| Total | 137 (17.4%) | 146 (16.8%) |
Income Above Poverty by Sex and Age in Homer
According to the poverty statistics in Homer, males aged 5 years and females aged 15 years are the age groups that are most secure financially, with 100.0% of males and 100.0% of females in these age groups living above the poverty line.
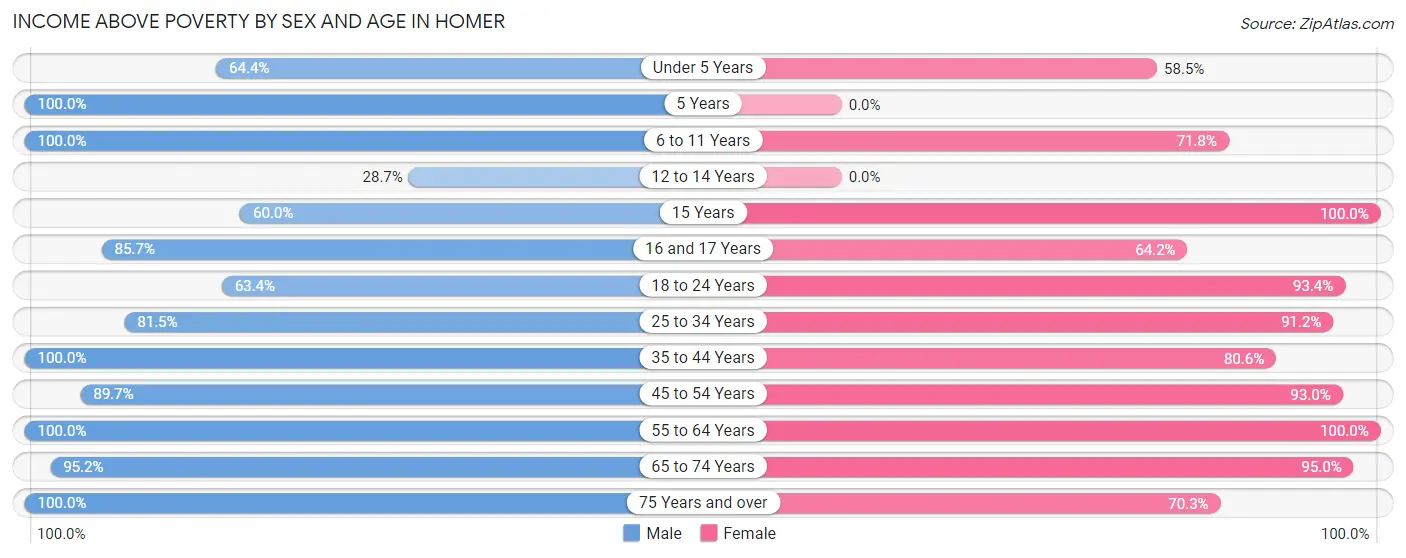
| Age Bracket | Male | Female |
| Under 5 Years | 29 (64.4%) | 24 (58.5%) |
| 5 Years | 25 (100.0%) | 0 (0.0%) |
| 6 to 11 Years | 50 (100.0%) | 79 (71.8%) |
| 12 to 14 Years | 27 (28.7%) | 0 (0.0%) |
| 15 Years | 6 (60.0%) | 23 (100.0%) |
| 16 and 17 Years | 36 (85.7%) | 34 (64.1%) |
| 18 to 24 Years | 26 (63.4%) | 142 (93.4%) |
| 25 to 34 Years | 66 (81.5%) | 83 (91.2%) |
| 35 to 44 Years | 93 (100.0%) | 108 (80.6%) |
| 45 to 54 Years | 104 (89.7%) | 66 (93.0%) |
| 55 to 64 Years | 121 (100.0%) | 73 (100.0%) |
| 65 to 74 Years | 40 (95.2%) | 38 (95.0%) |
| 75 Years and over | 25 (100.0%) | 52 (70.3%) |
| Total | 648 (82.6%) | 722 (83.2%) |
Income Below Poverty Among Married-Couple Families in Homer
The poverty statistics for married-couple families in Homer show that 6.3% or 21 of the total 331 families live below the poverty line. Families with 3 or 4 children have the highest poverty rate of 56.7%, comprising of 17 families. On the other hand, families with no children have the lowest poverty rate of 1.2%, which includes 2 families.
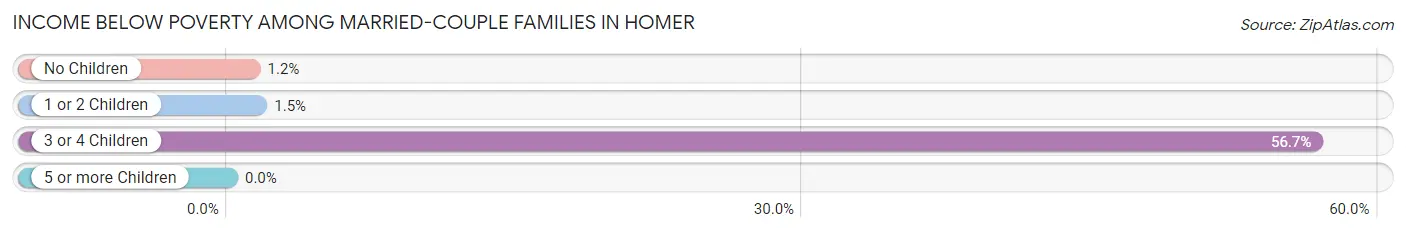
| Children | Above Poverty | Below Poverty |
| No Children | 168 (98.8%) | 2 (1.2%) |
| 1 or 2 Children | 129 (98.5%) | 2 (1.5%) |
| 3 or 4 Children | 13 (43.3%) | 17 (56.7%) |
| 5 or more Children | 0 (0.0%) | 0 (0.0%) |
| Total | 310 (93.7%) | 21 (6.3%) |
Income Below Poverty Among Single-Parent Households in Homer
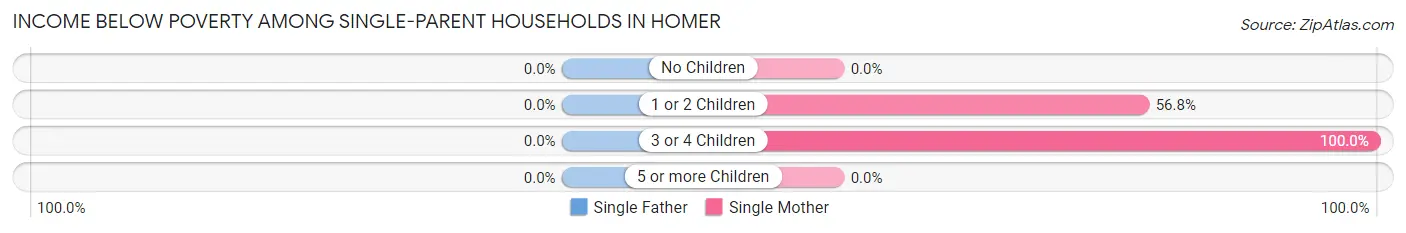
| Children | Single Father | Single Mother |
| No Children | 0 (0.0%) | 0 (0.0%) |
| 1 or 2 Children | 0 (0.0%) | 25 (56.8%) |
| 3 or 4 Children | 0 (0.0%) | 3 (100.0%) |
| 5 or more Children | 0 (0.0%) | 0 (0.0%) |
| Total | 0 (0.0%) | 28 (32.6%) |
Income Below Poverty Among Married-Couple vs Single-Parent Households in Homer
The poverty data for Homer shows that 21 of the married-couple family households (6.3%) and 28 of the single-parent households (29.5%) are living below the poverty level. Within the married-couple family households, those with 3 or 4 children have the highest poverty rate, with 17 households (56.7%) falling below the poverty line. Among the single-parent households, those with 3 or 4 children have the highest poverty rate, with 3 household (100.0%) living below poverty.
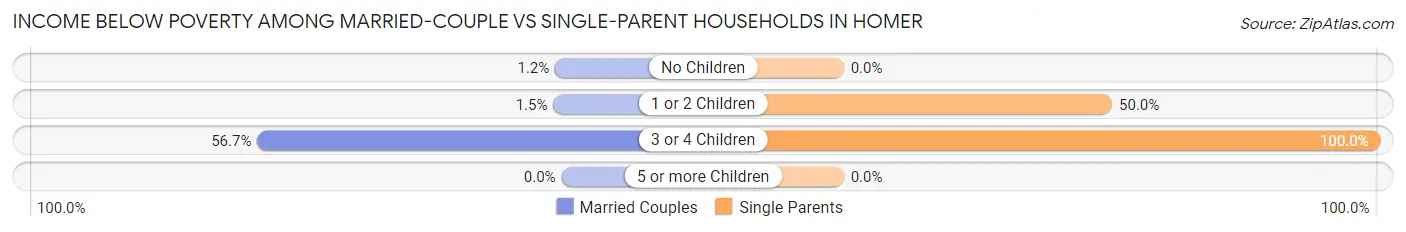
| Children | Married-Couple Families | Single-Parent Households |
| No Children | 2 (1.2%) | 0 (0.0%) |
| 1 or 2 Children | 2 (1.5%) | 25 (50.0%) |
| 3 or 4 Children | 17 (56.7%) | 3 (100.0%) |
| 5 or more Children | 0 (0.0%) | 0 (0.0%) |
| Total | 21 (6.3%) | 28 (29.5%) |
Race in Homer
The most populous races in Homer are White / Caucasian (1,326 | 79.9%), Two or more Races (130 | 7.8%), and Black / African American (127 | 7.7%).
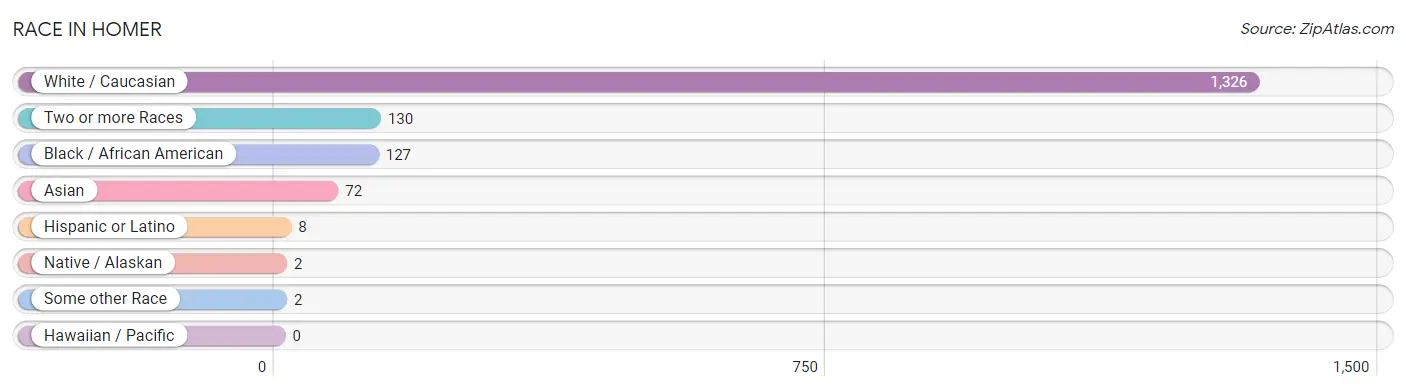
| Race | # Population | % Population |
| Asian | 72 | 4.3% |
| Black / African American | 127 | 7.7% |
| Hawaiian / Pacific | 0 | 0.0% |
| Hispanic or Latino | 8 | 0.5% |
| Native / Alaskan | 2 | 0.1% |
| White / Caucasian | 1,326 | 79.9% |
| Two or more Races | 130 | 7.8% |
| Some other Race | 2 | 0.1% |
| Total | 1,659 | 100.0% |
Ancestry in Homer
The most populous ancestries reported in Homer are English (273 | 16.5%), American (99 | 6.0%), Irish (78 | 4.7%), Scotch-Irish (78 | 4.7%), and Burmese (72 | 4.3%), together accounting for 36.2% of all Homer residents.
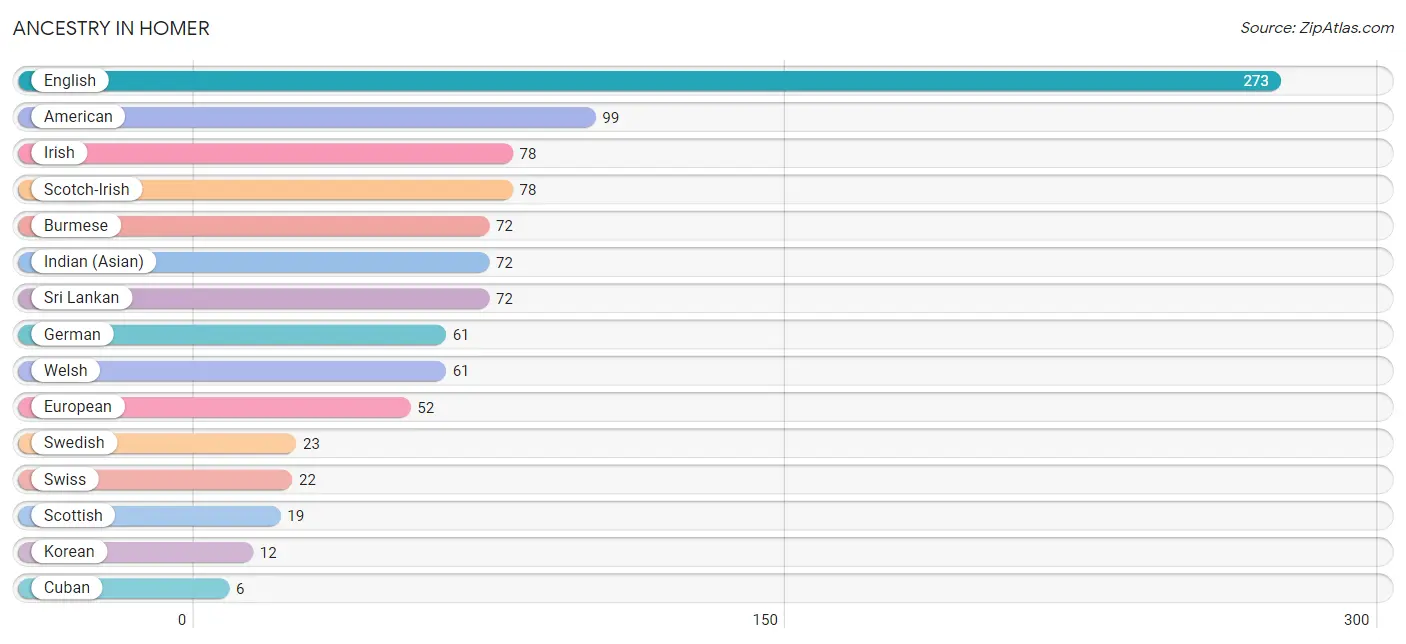
| Ancestry | # Population | % Population |
| American | 99 | 6.0% |
| Burmese | 72 | 4.3% |
| Cherokee | 2 | 0.1% |
| Cuban | 6 | 0.4% |
| Czech | 3 | 0.2% |
| English | 273 | 16.5% |
| European | 52 | 3.1% |
| French | 3 | 0.2% |
| German | 61 | 3.7% |
| Indian (Asian) | 72 | 4.3% |
| Irish | 78 | 4.7% |
| Italian | 3 | 0.2% |
| Korean | 12 | 0.7% |
| Mexican | 2 | 0.1% |
| Scotch-Irish | 78 | 4.7% |
| Scottish | 19 | 1.1% |
| Sri Lankan | 72 | 4.3% |
| Swedish | 23 | 1.4% |
| Swiss | 22 | 1.3% |
| Welsh | 61 | 3.7% | View All 20 Rows |
Immigrants in Homer

| Immigration Origin | # Population | % Population | View All 0 Rows |
Sex and Age in Homer
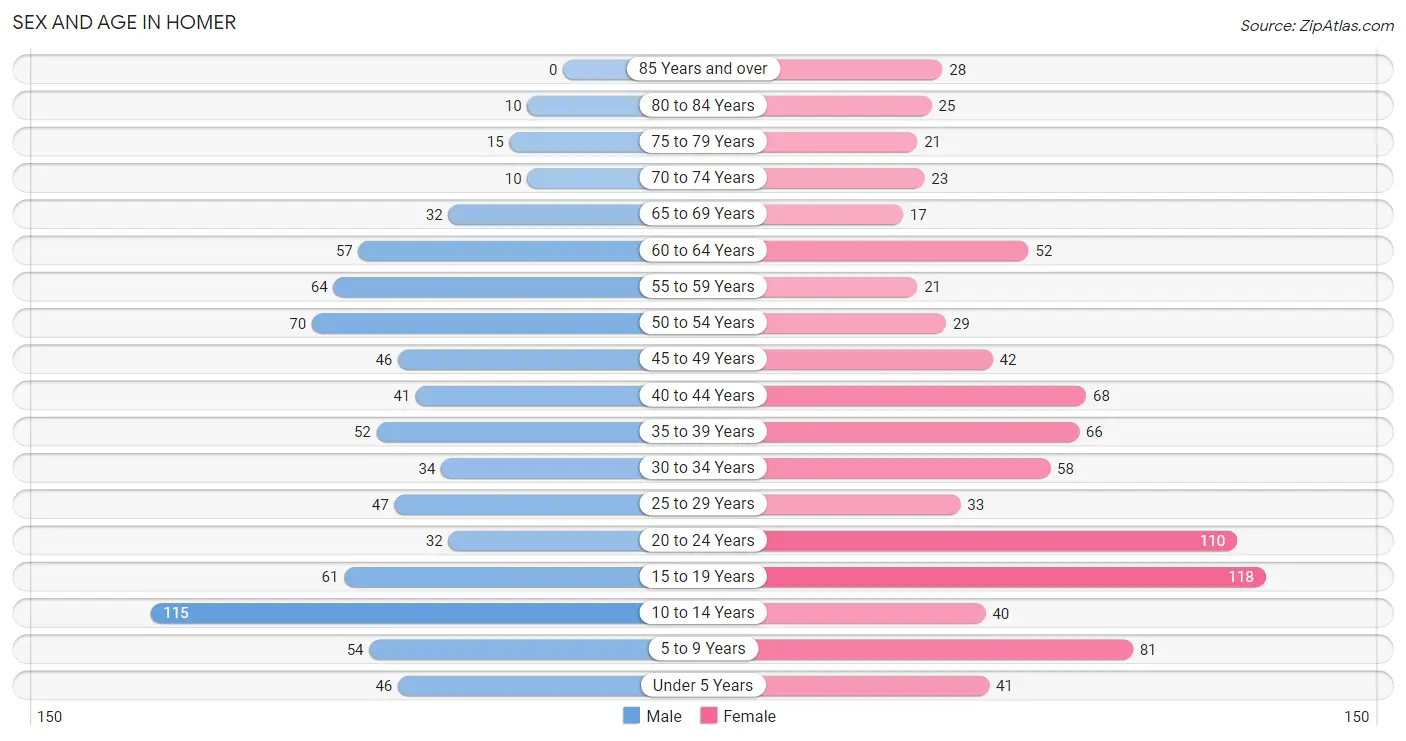
Sex and Age in Homer
The most populous age groups in Homer are 10 to 14 Years (115 | 14.6%) for men and 15 to 19 Years (118 | 13.5%) for women.
| Age Bracket | Male | Female |
| Under 5 Years | 46 (5.9%) | 41 (4.7%) |
| 5 to 9 Years | 54 (6.9%) | 81 (9.3%) |
| 10 to 14 Years | 115 (14.6%) | 40 (4.6%) |
| 15 to 19 Years | 61 (7.8%) | 118 (13.5%) |
| 20 to 24 Years | 32 (4.1%) | 110 (12.6%) |
| 25 to 29 Years | 47 (6.0%) | 33 (3.8%) |
| 30 to 34 Years | 34 (4.3%) | 58 (6.6%) |
| 35 to 39 Years | 52 (6.6%) | 66 (7.6%) |
| 40 to 44 Years | 41 (5.2%) | 68 (7.8%) |
| 45 to 49 Years | 46 (5.9%) | 42 (4.8%) |
| 50 to 54 Years | 70 (8.9%) | 29 (3.3%) |
| 55 to 59 Years | 64 (8.1%) | 21 (2.4%) |
| 60 to 64 Years | 57 (7.2%) | 52 (6.0%) |
| 65 to 69 Years | 32 (4.1%) | 17 (1.9%) |
| 70 to 74 Years | 10 (1.3%) | 23 (2.6%) |
| 75 to 79 Years | 15 (1.9%) | 21 (2.4%) |
| 80 to 84 Years | 10 (1.3%) | 25 (2.9%) |
| 85 Years and over | 0 (0.0%) | 28 (3.2%) |
| Total | 786 (100.0%) | 873 (100.0%) |
Families and Households in Homer
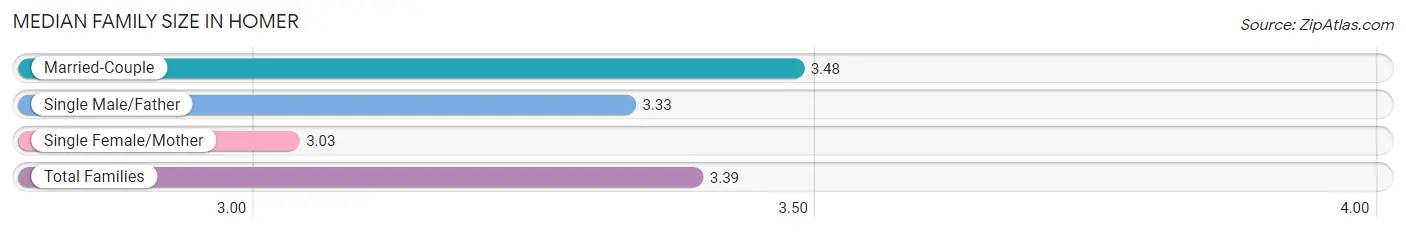
Median Family Size in Homer
The median family size in Homer is 3.39 persons per family, with married-couple families (331 | 77.7%) accounting for the largest median family size of 3.48 persons per family. On the other hand, single female/mother families (86 | 20.2%) represent the smallest median family size with 3.03 persons per family.
| Family Type | # Families | Family Size |
| Married-Couple | 331 (77.7%) | 3.48 |
| Single Male/Father | 9 (2.1%) | 3.33 |
| Single Female/Mother | 86 (20.2%) | 3.03 |
| Total Families | 426 (100.0%) | 3.39 |
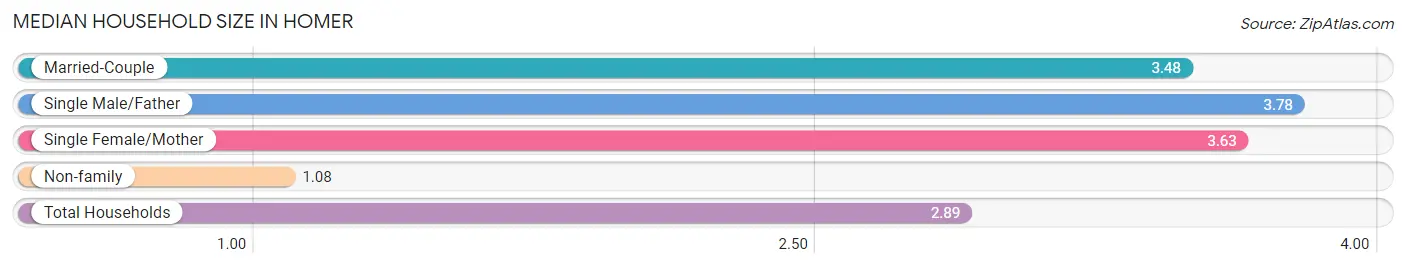
Median Household Size in Homer
The median household size in Homer is 2.89 persons per household, with single male/father households (9 | 1.6%) accounting for the largest median household size of 3.78 persons per household. non-family households (148 | 25.8%) represent the smallest median household size with 1.08 persons per household.
| Household Type | # Households | Household Size |
| Married-Couple | 331 (57.7%) | 3.48 |
| Single Male/Father | 9 (1.6%) | 3.78 |
| Single Female/Mother | 86 (15.0%) | 3.63 |
| Non-family | 148 (25.8%) | 1.08 |
| Total Households | 574 (100.0%) | 2.89 |
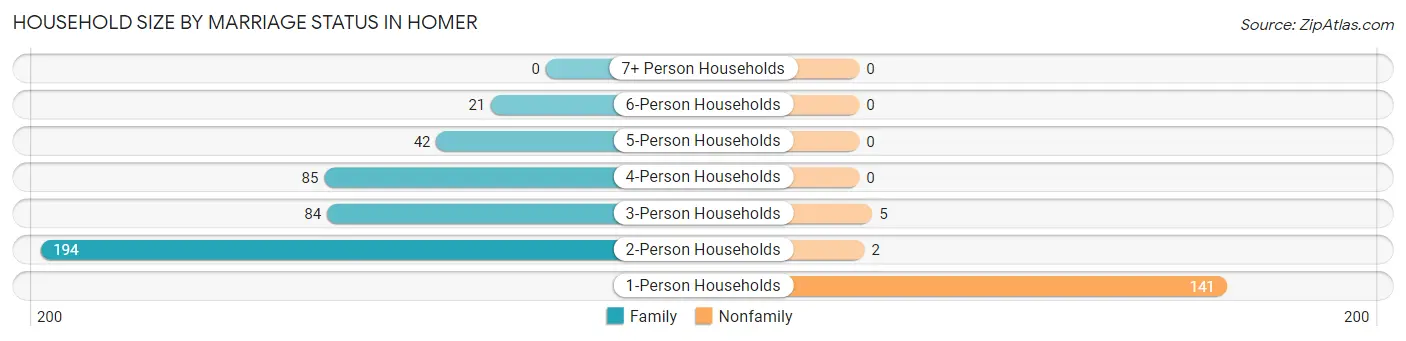
Household Size by Marriage Status in Homer
Out of a total of 574 households in Homer, 426 (74.2%) are family households, while 148 (25.8%) are nonfamily households. The most numerous type of family households are 2-person households, comprising 194, and the most common type of nonfamily households are 1-person households, comprising 141.
| Household Size | Family Households | Nonfamily Households |
| 1-Person Households | - | 141 (24.6%) |
| 2-Person Households | 194 (33.8%) | 2 (0.4%) |
| 3-Person Households | 84 (14.6%) | 5 (0.9%) |
| 4-Person Households | 85 (14.8%) | 0 (0.0%) |
| 5-Person Households | 42 (7.3%) | 0 (0.0%) |
| 6-Person Households | 21 (3.7%) | 0 (0.0%) |
| 7+ Person Households | 0 (0.0%) | 0 (0.0%) |
| Total | 426 (74.2%) | 148 (25.8%) |
Female Fertility in Homer
Fertility by Age in Homer
Average fertility rate in Homer is 56.0 births per 1,000 women. Women in the age bracket of 20 to 34 years have the highest fertility rate with 90.0 births per 1,000 women. Women in the age bracket of 20 to 34 years acount for 64.3% of all women with births.
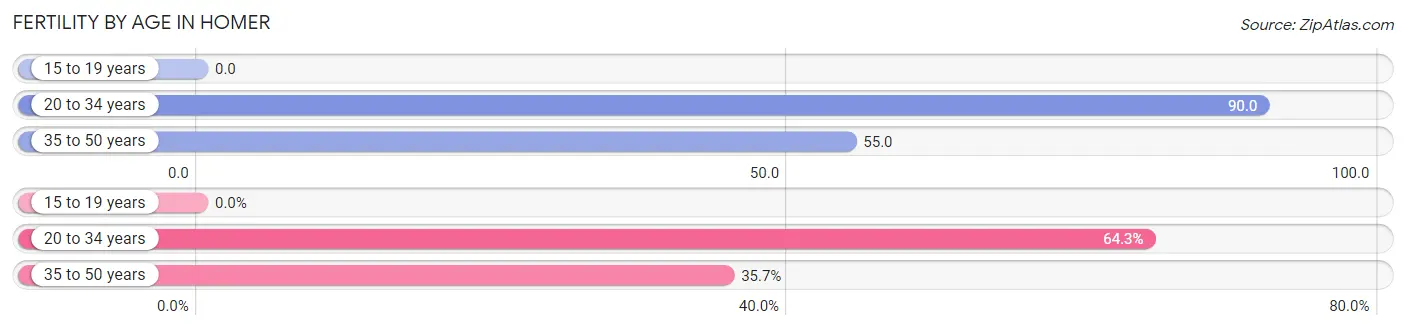
| Age Bracket | Women with Births | Births / 1,000 Women |
| 15 to 19 years | 0 (0.0%) | 0.0 |
| 20 to 34 years | 18 (64.3%) | 90.0 |
| 35 to 50 years | 10 (35.7%) | 55.0 |
| Total | 28 (100.0%) | 56.0 |
Fertility by Age by Marriage Status in Homer
71.4% of women with births (28) in Homer are married. The highest percentage of unmarried women with births falls into 35 to 50 years age bracket with 80.0% of them unmarried at the time of birth, while the lowest percentage of unmarried women with births belong to 20 to 34 years age bracket with 0.0% of them unmarried.
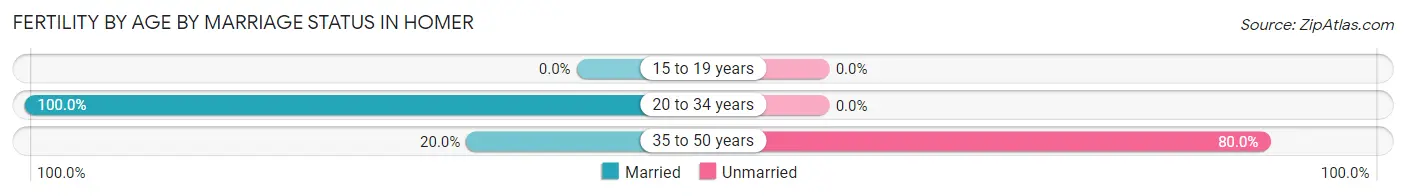
| Age Bracket | Married | Unmarried |
| 15 to 19 years | 0 (0.0%) | 0 (0.0%) |
| 20 to 34 years | 18 (100.0%) | 0 (0.0%) |
| 35 to 50 years | 2 (20.0%) | 8 (80.0%) |
| Total | 20 (71.4%) | 8 (28.6%) |
Fertility by Education in Homer
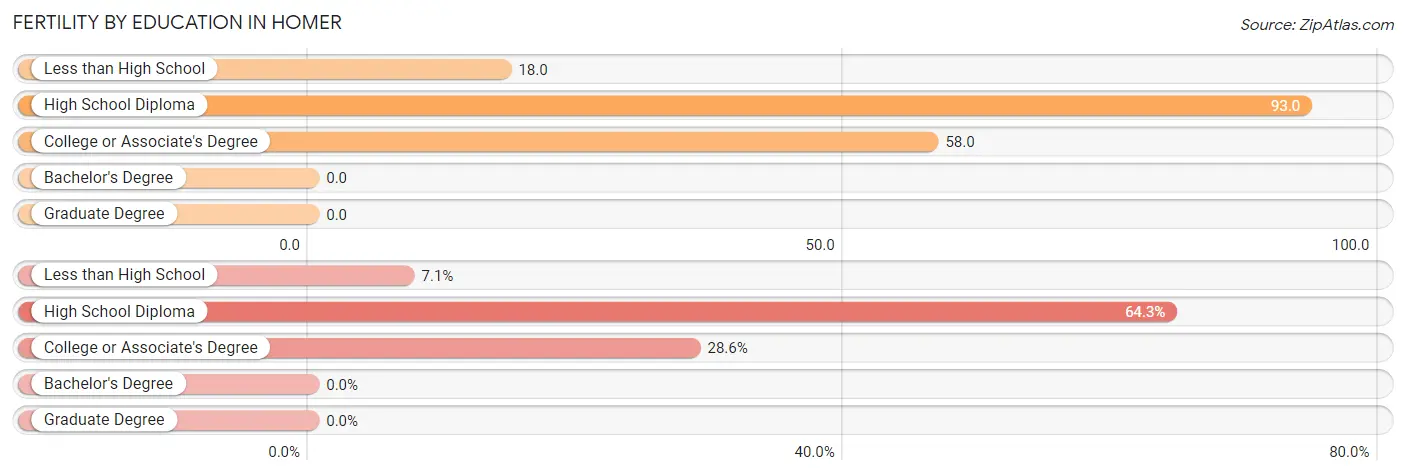
| Educational Attainment | Women with Births | Births / 1,000 Women |
| Less than High School | 2 (7.1%) | 18.0 |
| High School Diploma | 18 (64.3%) | 93.0 |
| College or Associate's Degree | 8 (28.6%) | 58.0 |
| Bachelor's Degree | 0 (0.0%) | 0.0 |
| Graduate Degree | 0 (0.0%) | 0.0 |
| Total | 28 (100.0%) | 56.0 |
Fertility by Education by Marriage Status in Homer
28.6% of women with births in Homer are unmarried. Women with the educational attainment of less than high school are most likely to be married with 100.0% of them married at childbirth, while women with the educational attainment of college or associate's degree are least likely to be married with 37.5% of them unmarried at childbirth.
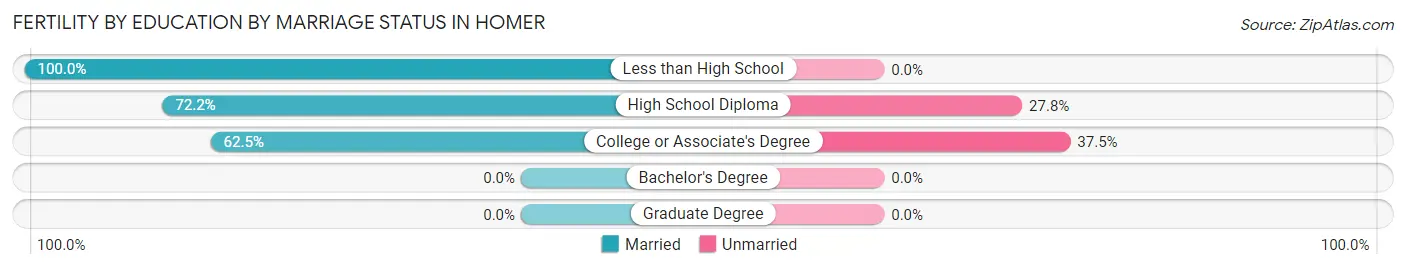
| Educational Attainment | Married | Unmarried |
| Less than High School | 2 (100.0%) | 0 (0.0%) |
| High School Diploma | 13 (72.2%) | 5 (27.8%) |
| College or Associate's Degree | 5 (62.5%) | 3 (37.5%) |
| Bachelor's Degree | 0 (0.0%) | 0 (0.0%) |
| Graduate Degree | 0 (0.0%) | 0 (0.0%) |
| Total | 20 (71.4%) | 8 (28.6%) |
Employment Characteristics in Homer
Employment by Class of Employer in Homer
Among the 693 employed individuals in Homer, private company employees (393 | 56.7%), self-employed (not incorporated) (124 | 17.9%), and local government employees (66 | 9.5%) make up the most common classes of employment.
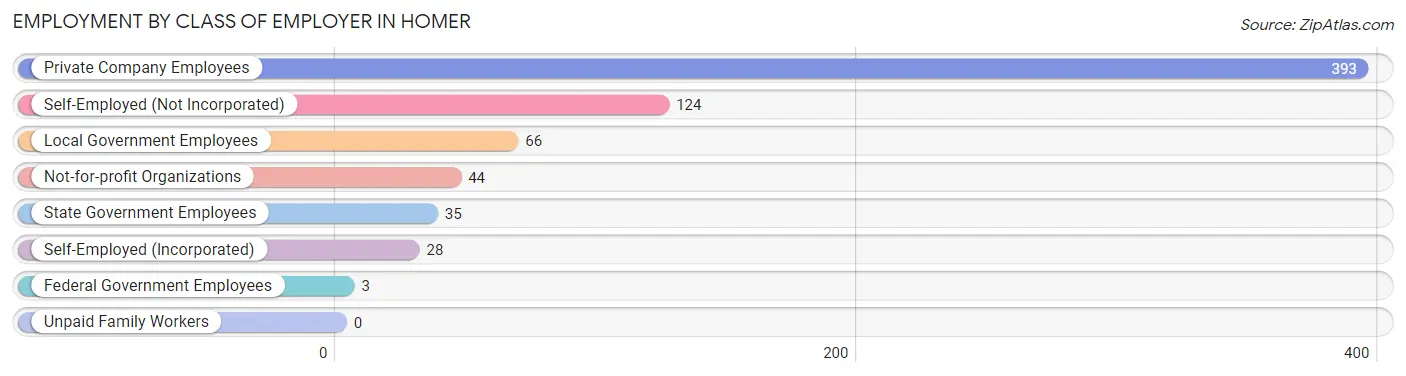
| Employer Class | # Employees | % Employees |
| Private Company Employees | 393 | 56.7% |
| Self-Employed (Incorporated) | 28 | 4.0% |
| Self-Employed (Not Incorporated) | 124 | 17.9% |
| Not-for-profit Organizations | 44 | 6.4% |
| Local Government Employees | 66 | 9.5% |
| State Government Employees | 35 | 5.1% |
| Federal Government Employees | 3 | 0.4% |
| Unpaid Family Workers | 0 | 0.0% |
| Total | 693 | 100.0% |
Employment Status by Age in Homer
According to the labor force statistics for Homer, out of the total population over 16 years of age (1,249), 59.3% or 741 individuals are in the labor force, with 4.7% or 35 of them unemployed. The age group with the highest labor force participation rate is 20 to 24 years, with 94.4% or 134 individuals in the labor force. Within the labor force, the 35 to 44 years age range has the highest percentage of unemployed individuals, with 11.3% or 23 of them being unemployed.
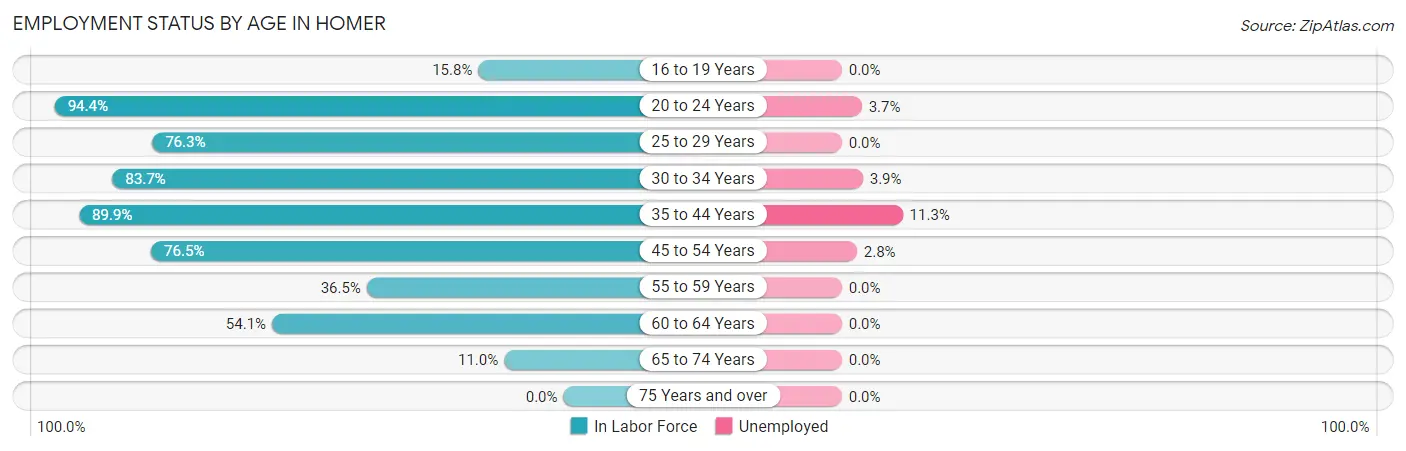
| Age Bracket | In Labor Force | Unemployed |
| 16 to 19 Years | 23 (15.8%) | 0 (0.0%) |
| 20 to 24 Years | 134 (94.4%) | 5 (3.7%) |
| 25 to 29 Years | 61 (76.3%) | 0 (0.0%) |
| 30 to 34 Years | 77 (83.7%) | 3 (3.9%) |
| 35 to 44 Years | 204 (89.9%) | 23 (11.3%) |
| 45 to 54 Years | 143 (76.5%) | 4 (2.8%) |
| 55 to 59 Years | 31 (36.5%) | 0 (0.0%) |
| 60 to 64 Years | 59 (54.1%) | 0 (0.0%) |
| 65 to 74 Years | 9 (11.0%) | 0 (0.0%) |
| 75 Years and over | 0 (0.0%) | 0 (0.0%) |
| Total | 741 (59.3%) | 35 (4.7%) |
Employment Status by Educational Attainment in Homer
According to labor force statistics for Homer, 73.7% of individuals (575) out of the total population between 25 and 64 years of age (780) are in the labor force, with 5.2% or 30 of them being unemployed. The group with the highest labor force participation rate are those with the educational attainment of bachelor's degree or higher, with 84.6% or 121 individuals in the labor force. Within the labor force, individuals with less than high school education have the highest percentage of unemployment, with 16.3% or 7 of them being unemployed.
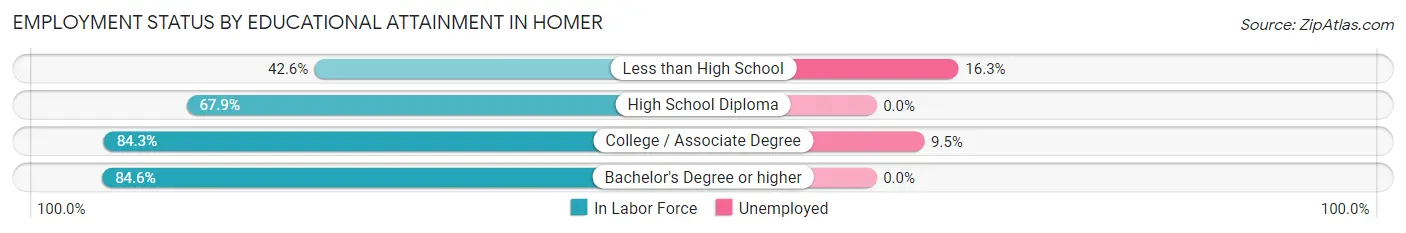
| Educational Attainment | In Labor Force | Unemployed |
| Less than High School | 43 (42.6%) | 16 (16.3%) |
| High School Diploma | 169 (67.9%) | 0 (0.0%) |
| College / Associate Degree | 242 (84.3%) | 27 (9.5%) |
| Bachelor's Degree or higher | 121 (84.6%) | 0 (0.0%) |
| Total | 575 (73.7%) | 41 (5.2%) |
Employment Occupations by Sex in Homer
Management, Business, Science and Arts Occupations
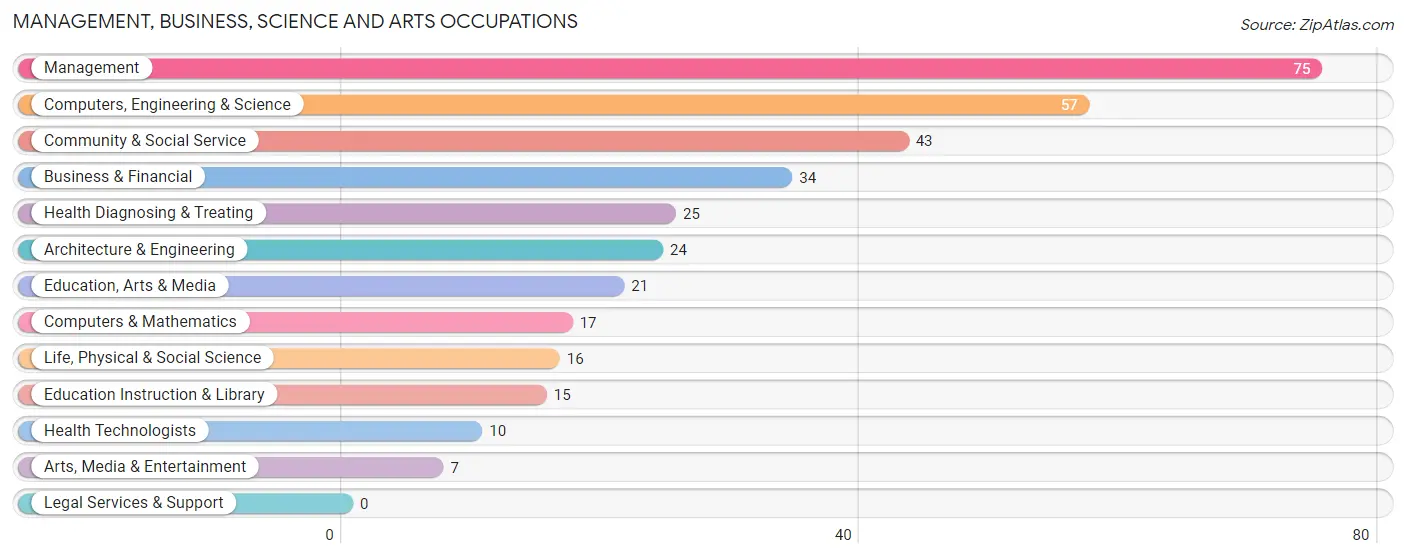
The most common Management, Business, Science and Arts occupations in Homer are Management (75 | 10.6%), Computers, Engineering & Science (57 | 8.1%), Community & Social Service (43 | 6.1%), Business & Financial (34 | 4.8%), and Health Diagnosing & Treating (25 | 3.5%).
Management, Business, Science and Arts Occupations by Sex
Within the Management, Business, Science and Arts occupations in Homer, the most male-oriented occupations are Computers & Mathematics (100.0%), Life, Physical & Social Science (100.0%), and Computers, Engineering & Science (80.7%), while the most female-oriented occupations are Education, Arts & Media (100.0%), Health Diagnosing & Treating (100.0%), and Health Technologists (100.0%).
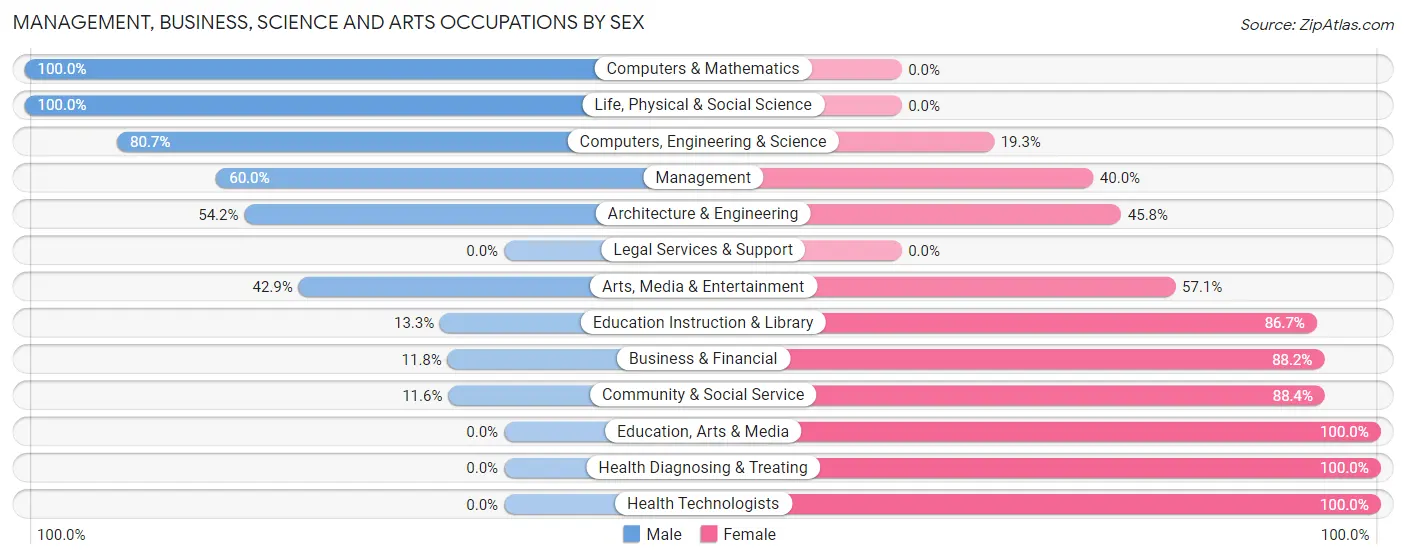
| Occupation | Male | Female |
| Management | 45 (60.0%) | 30 (40.0%) |
| Business & Financial | 4 (11.8%) | 30 (88.2%) |
| Computers, Engineering & Science | 46 (80.7%) | 11 (19.3%) |
| Computers & Mathematics | 17 (100.0%) | 0 (0.0%) |
| Architecture & Engineering | 13 (54.2%) | 11 (45.8%) |
| Life, Physical & Social Science | 16 (100.0%) | 0 (0.0%) |
| Community & Social Service | 5 (11.6%) | 38 (88.4%) |
| Education, Arts & Media | 0 (0.0%) | 21 (100.0%) |
| Legal Services & Support | 0 (0.0%) | 0 (0.0%) |
| Education Instruction & Library | 2 (13.3%) | 13 (86.7%) |
| Arts, Media & Entertainment | 3 (42.9%) | 4 (57.1%) |
| Health Diagnosing & Treating | 0 (0.0%) | 25 (100.0%) |
| Health Technologists | 0 (0.0%) | 10 (100.0%) |
| Total (Category) | 100 (42.7%) | 134 (57.3%) |
| Total (Overall) | 372 (52.7%) | 334 (47.3%) |
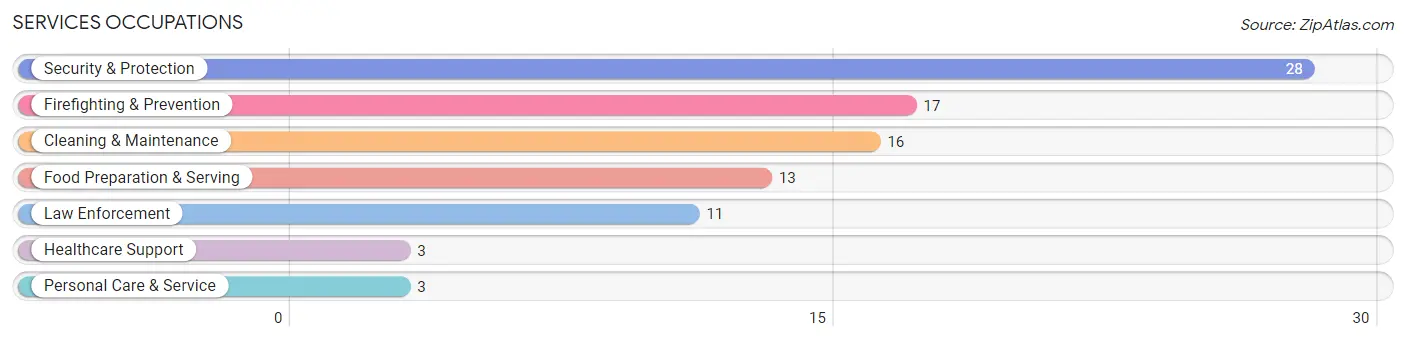
Services Occupations
The most common Services occupations in Homer are Security & Protection (28 | 4.0%), Firefighting & Prevention (17 | 2.4%), Cleaning & Maintenance (16 | 2.3%), Food Preparation & Serving (13 | 1.8%), and Law Enforcement (11 | 1.6%).
Services Occupations by Sex
Within the Services occupations in Homer, the most male-oriented occupations are Security & Protection (100.0%), Firefighting & Prevention (100.0%), and Law Enforcement (100.0%), while the most female-oriented occupations are Healthcare Support (100.0%), and Personal Care & Service (100.0%).
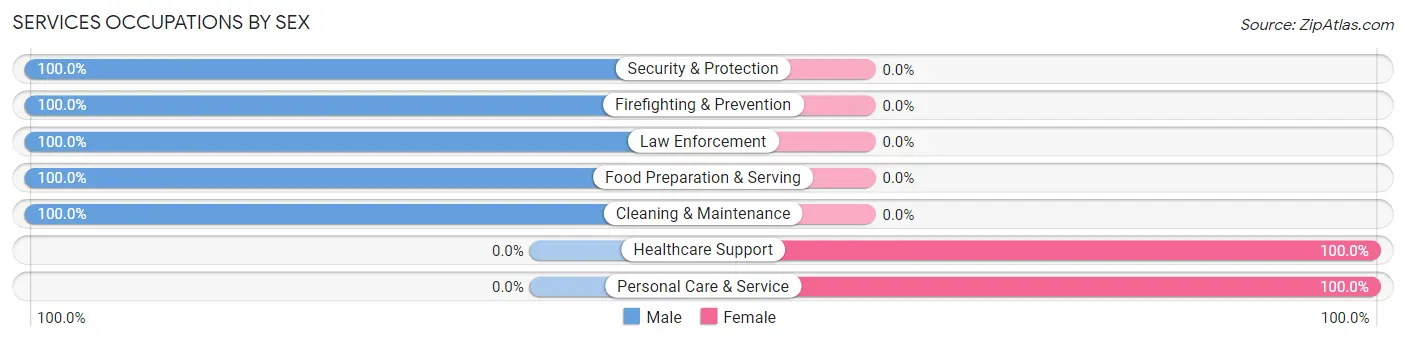
| Occupation | Male | Female |
| Healthcare Support | 0 (0.0%) | 3 (100.0%) |
| Security & Protection | 28 (100.0%) | 0 (0.0%) |
| Firefighting & Prevention | 17 (100.0%) | 0 (0.0%) |
| Law Enforcement | 11 (100.0%) | 0 (0.0%) |
| Food Preparation & Serving | 13 (100.0%) | 0 (0.0%) |
| Cleaning & Maintenance | 16 (100.0%) | 0 (0.0%) |
| Personal Care & Service | 0 (0.0%) | 3 (100.0%) |
| Total (Category) | 57 (90.5%) | 6 (9.5%) |
| Total (Overall) | 372 (52.7%) | 334 (47.3%) |
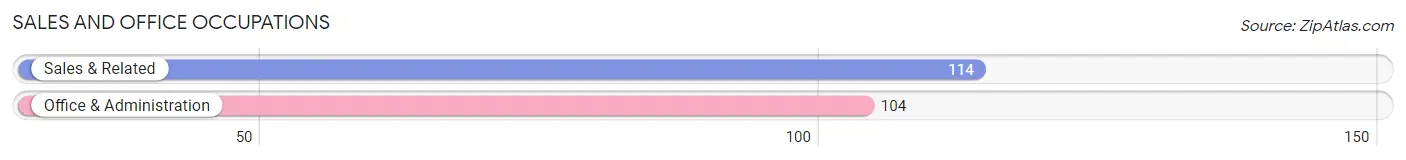
Sales and Office Occupations
The most common Sales and Office occupations in Homer are Sales & Related (114 | 16.2%), and Office & Administration (104 | 14.7%).
Sales and Office Occupations by Sex
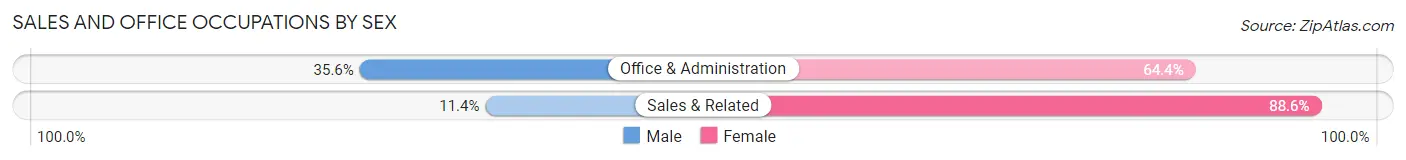
| Occupation | Male | Female |
| Sales & Related | 13 (11.4%) | 101 (88.6%) |
| Office & Administration | 37 (35.6%) | 67 (64.4%) |
| Total (Category) | 50 (22.9%) | 168 (77.1%) |
| Total (Overall) | 372 (52.7%) | 334 (47.3%) |
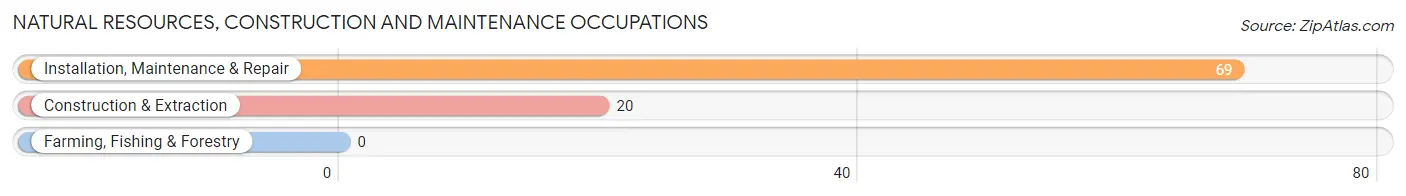
Natural Resources, Construction and Maintenance Occupations
The most common Natural Resources, Construction and Maintenance occupations in Homer are Installation, Maintenance & Repair (69 | 9.8%), and Construction & Extraction (20 | 2.8%).
Natural Resources, Construction and Maintenance Occupations by Sex
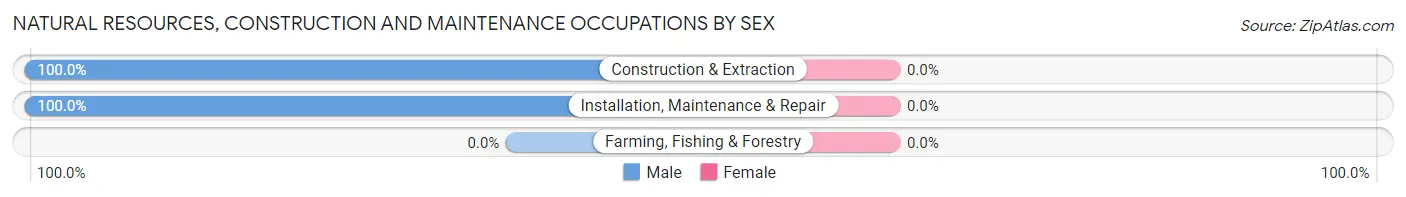
| Occupation | Male | Female |
| Farming, Fishing & Forestry | 0 (0.0%) | 0 (0.0%) |
| Construction & Extraction | 20 (100.0%) | 0 (0.0%) |
| Installation, Maintenance & Repair | 69 (100.0%) | 0 (0.0%) |
| Total (Category) | 89 (100.0%) | 0 (0.0%) |
| Total (Overall) | 372 (52.7%) | 334 (47.3%) |
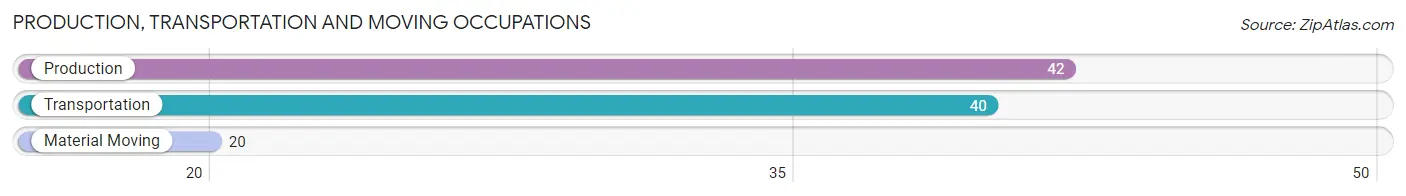
Production, Transportation and Moving Occupations
The most common Production, Transportation and Moving occupations in Homer are Production (42 | 5.9%), Transportation (40 | 5.7%), and Material Moving (20 | 2.8%).
Production, Transportation and Moving Occupations by Sex
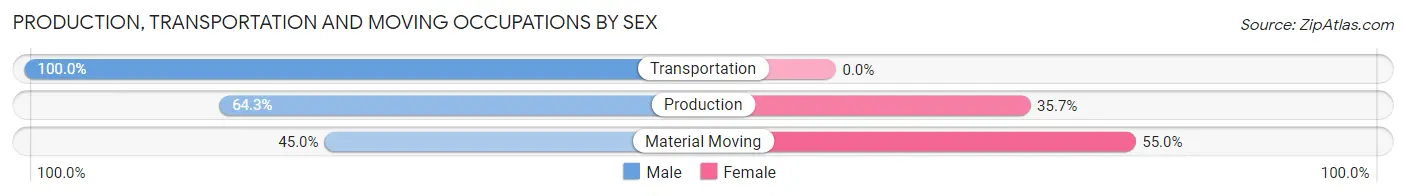
| Occupation | Male | Female |
| Production | 27 (64.3%) | 15 (35.7%) |
| Transportation | 40 (100.0%) | 0 (0.0%) |
| Material Moving | 9 (45.0%) | 11 (55.0%) |
| Total (Category) | 76 (74.5%) | 26 (25.5%) |
| Total (Overall) | 372 (52.7%) | 334 (47.3%) |
Employment Industries by Sex in Homer
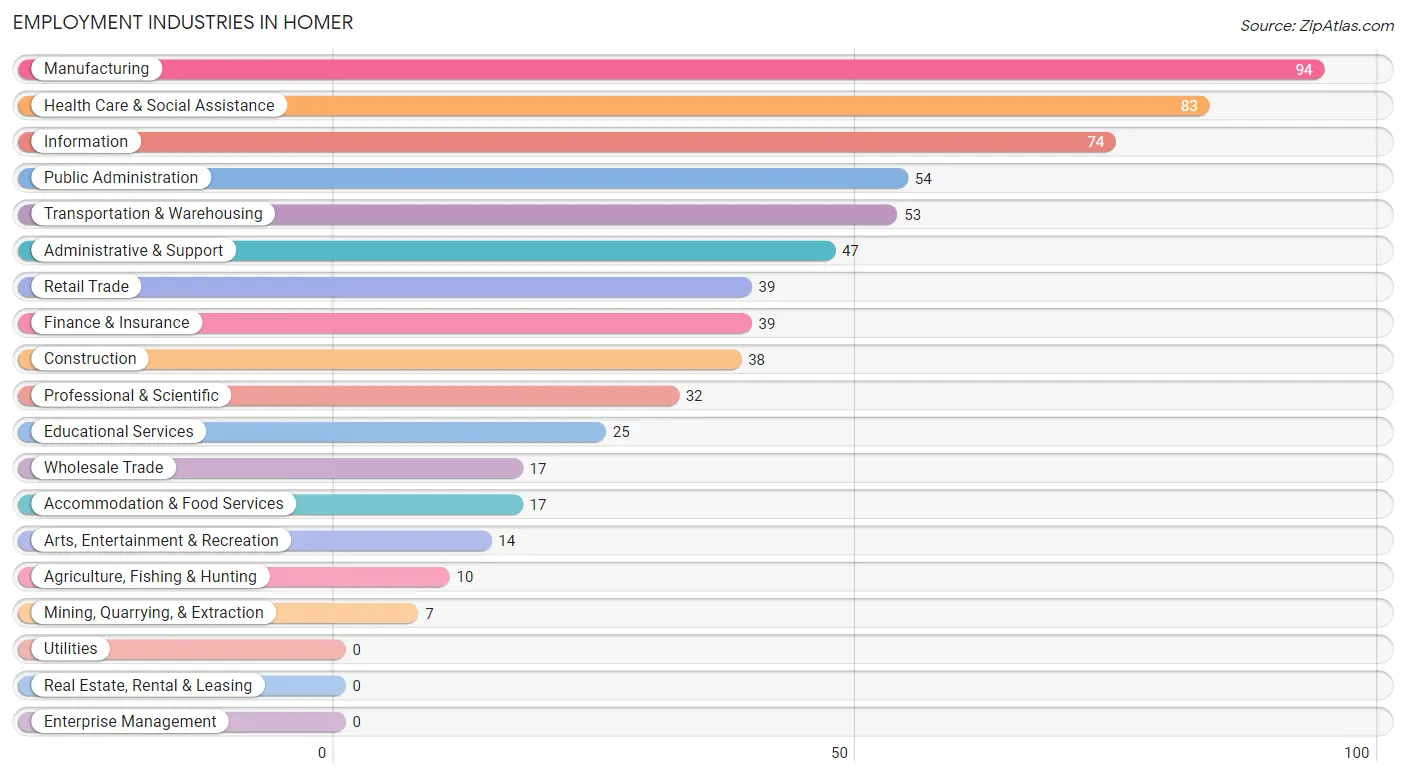
Employment Industries in Homer
The major employment industries in Homer include Manufacturing (94 | 13.3%), Health Care & Social Assistance (83 | 11.8%), Information (74 | 10.5%), Public Administration (54 | 7.6%), and Transportation & Warehousing (53 | 7.5%).
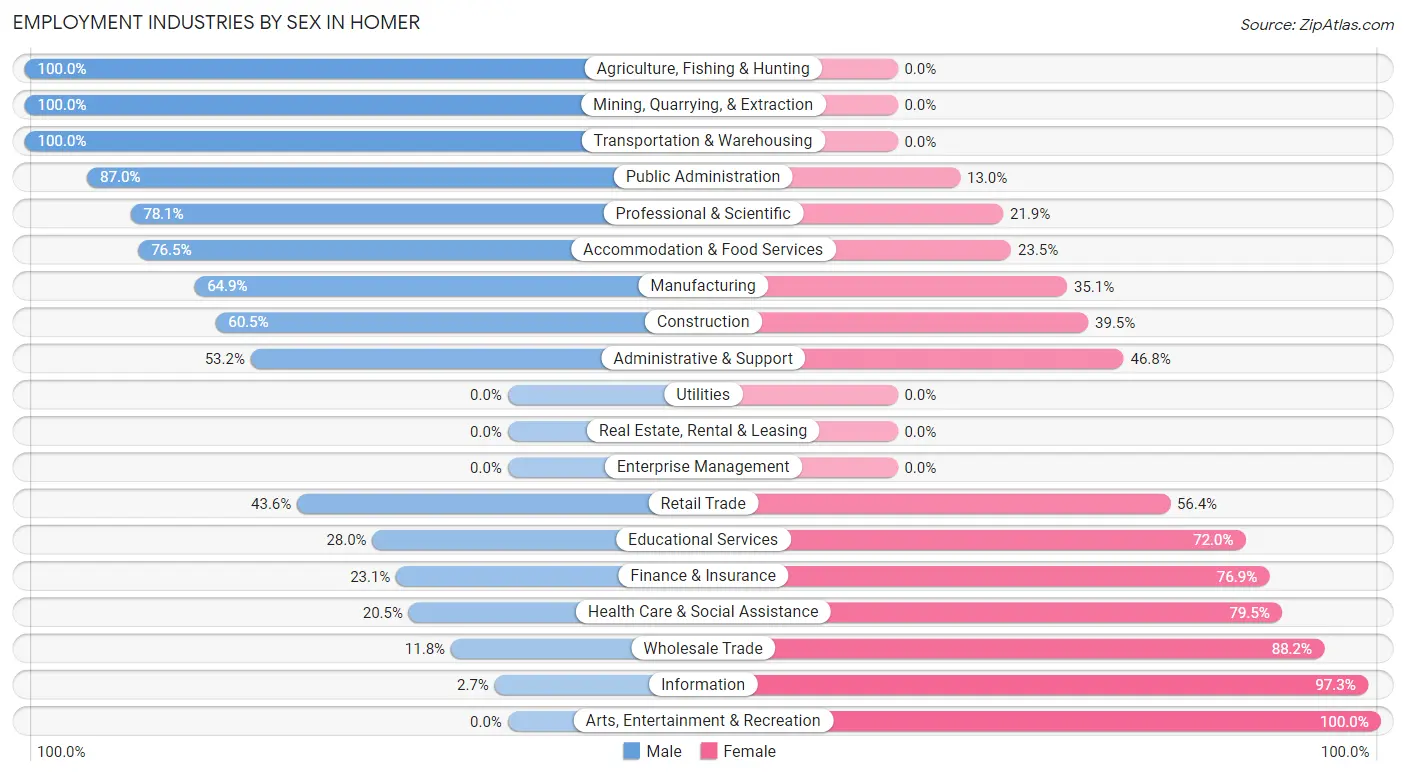
Employment Industries by Sex in Homer
The Homer industries that see more men than women are Agriculture, Fishing & Hunting (100.0%), Mining, Quarrying, & Extraction (100.0%), and Transportation & Warehousing (100.0%), whereas the industries that tend to have a higher number of women are Arts, Entertainment & Recreation (100.0%), Information (97.3%), and Wholesale Trade (88.2%).
| Industry | Male | Female |
| Agriculture, Fishing & Hunting | 10 (100.0%) | 0 (0.0%) |
| Mining, Quarrying, & Extraction | 7 (100.0%) | 0 (0.0%) |
| Construction | 23 (60.5%) | 15 (39.5%) |
| Manufacturing | 61 (64.9%) | 33 (35.1%) |
| Wholesale Trade | 2 (11.8%) | 15 (88.2%) |
| Retail Trade | 17 (43.6%) | 22 (56.4%) |
| Transportation & Warehousing | 53 (100.0%) | 0 (0.0%) |
| Utilities | 0 (0.0%) | 0 (0.0%) |
| Information | 2 (2.7%) | 72 (97.3%) |
| Finance & Insurance | 9 (23.1%) | 30 (76.9%) |
| Real Estate, Rental & Leasing | 0 (0.0%) | 0 (0.0%) |
| Professional & Scientific | 25 (78.1%) | 7 (21.9%) |
| Enterprise Management | 0 (0.0%) | 0 (0.0%) |
| Administrative & Support | 25 (53.2%) | 22 (46.8%) |
| Educational Services | 7 (28.0%) | 18 (72.0%) |
| Health Care & Social Assistance | 17 (20.5%) | 66 (79.5%) |
| Arts, Entertainment & Recreation | 0 (0.0%) | 14 (100.0%) |
| Accommodation & Food Services | 13 (76.5%) | 4 (23.5%) |
| Public Administration | 47 (87.0%) | 7 (13.0%) |
| Total | 372 (52.7%) | 334 (47.3%) |
Education in Homer
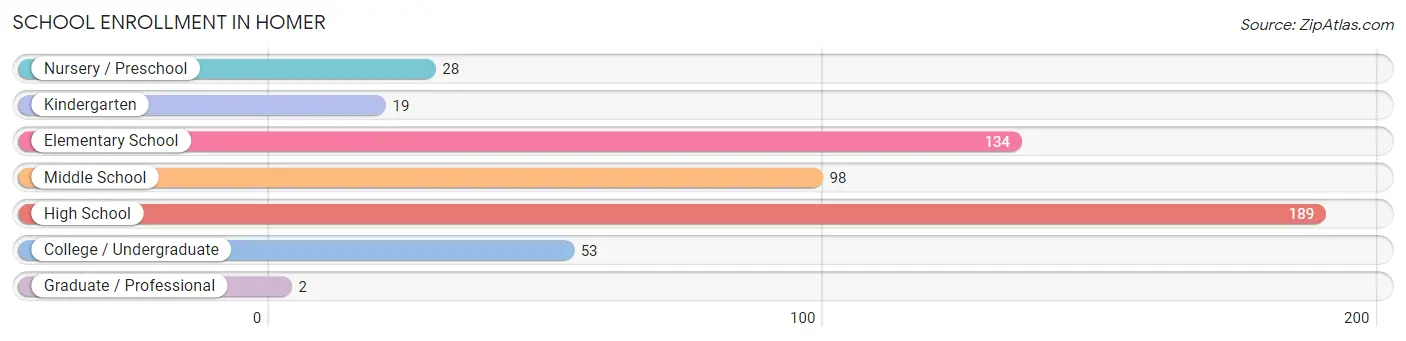
School Enrollment in Homer
The most common levels of schooling among the 523 students in Homer are high school (189 | 36.1%), elementary school (134 | 25.6%), and middle school (98 | 18.7%).
| School Level | # Students | % Students |
| Nursery / Preschool | 28 | 5.3% |
| Kindergarten | 19 | 3.6% |
| Elementary School | 134 | 25.6% |
| Middle School | 98 | 18.7% |
| High School | 189 | 36.1% |
| College / Undergraduate | 53 | 10.1% |
| Graduate / Professional | 2 | 0.4% |
| Total | 523 | 100.0% |
School Enrollment by Age by Funding Source in Homer
Out of a total of 523 students who are enrolled in schools in Homer, 80 (15.3%) attend a private institution, while the remaining 443 (84.7%) are enrolled in public schools. The age group of 3 to 4 year olds has the highest likelihood of being enrolled in private schools, with 22 (100.0% in the age bracket) enrolled. Conversely, the age group of 5 to 9 year old has the lowest likelihood of being enrolled in a private school, with 135 (100.0% in the age bracket) attending a public institution.
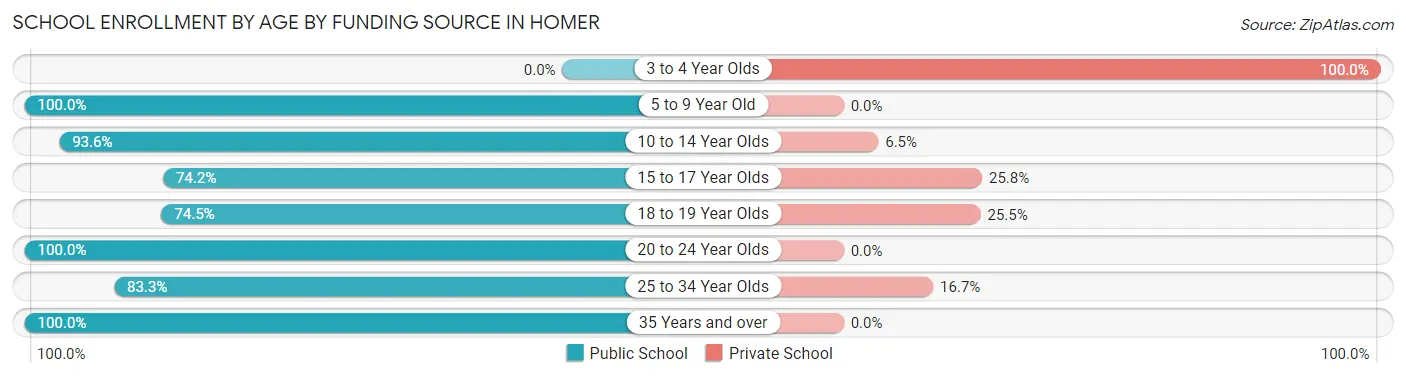
| Age Bracket | Public School | Private School |
| 3 to 4 Year Olds | 0 (0.0%) | 22 (100.0%) |
| 5 to 9 Year Old | 135 (100.0%) | 0 (0.0%) |
| 10 to 14 Year Olds | 145 (93.5%) | 10 (6.5%) |
| 15 to 17 Year Olds | 95 (74.2%) | 33 (25.8%) |
| 18 to 19 Year Olds | 38 (74.5%) | 13 (25.5%) |
| 20 to 24 Year Olds | 15 (100.0%) | 0 (0.0%) |
| 25 to 34 Year Olds | 10 (83.3%) | 2 (16.7%) |
| 35 Years and over | 5 (100.0%) | 0 (0.0%) |
| Total | 443 (84.7%) | 80 (15.3%) |
Educational Attainment by Field of Study in Homer
Business (66 | 37.1%), arts & humanities (25 | 14.0%), computers & mathematics (24 | 13.5%), social sciences (20 | 11.2%), and liberal arts & history (18 | 10.1%) are the most common fields of study among 178 individuals in Homer who have obtained a bachelor's degree or higher.
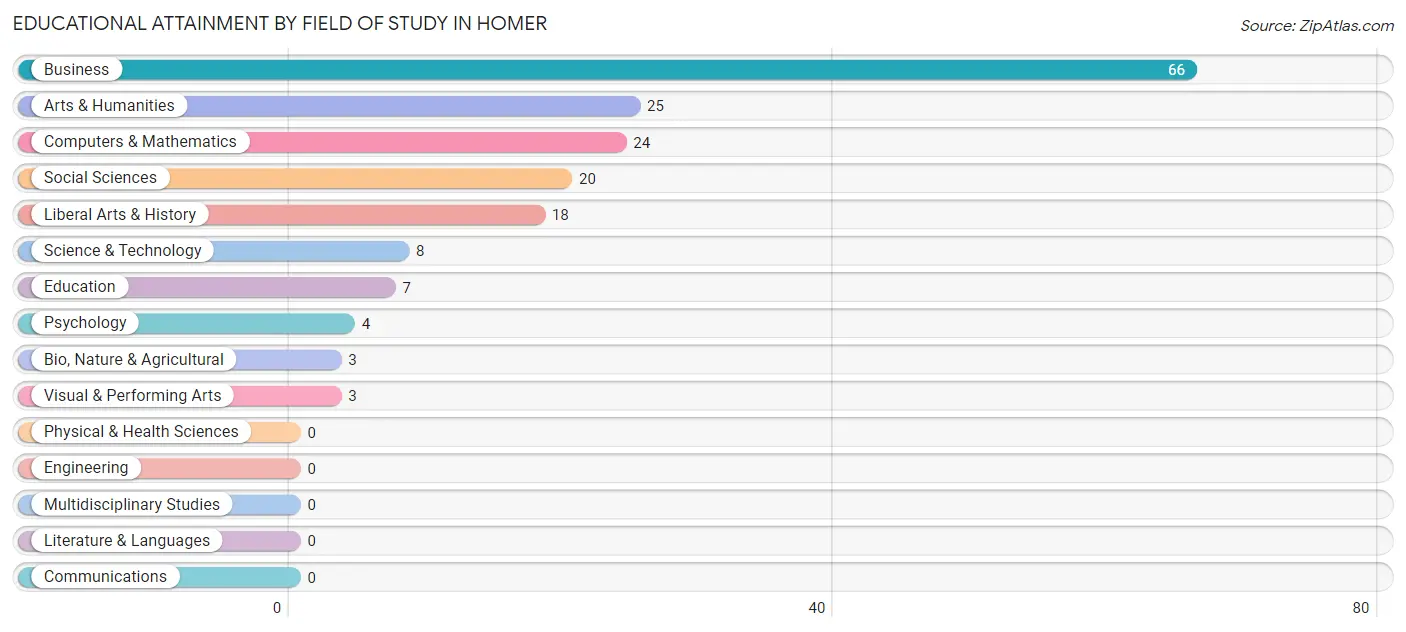
| Field of Study | # Graduates | % Graduates |
| Computers & Mathematics | 24 | 13.5% |
| Bio, Nature & Agricultural | 3 | 1.7% |
| Physical & Health Sciences | 0 | 0.0% |
| Psychology | 4 | 2.2% |
| Social Sciences | 20 | 11.2% |
| Engineering | 0 | 0.0% |
| Multidisciplinary Studies | 0 | 0.0% |
| Science & Technology | 8 | 4.5% |
| Business | 66 | 37.1% |
| Education | 7 | 3.9% |
| Literature & Languages | 0 | 0.0% |
| Liberal Arts & History | 18 | 10.1% |
| Visual & Performing Arts | 3 | 1.7% |
| Communications | 0 | 0.0% |
| Arts & Humanities | 25 | 14.0% |
| Total | 178 | 100.0% |
Transportation & Commute in Homer
Vehicle Availability by Sex in Homer
The most prevalent vehicle ownership categories in Homer are males with 2 vehicles (131, accounting for 36.3%) and females with 2 vehicles (94, making up 39.5%).
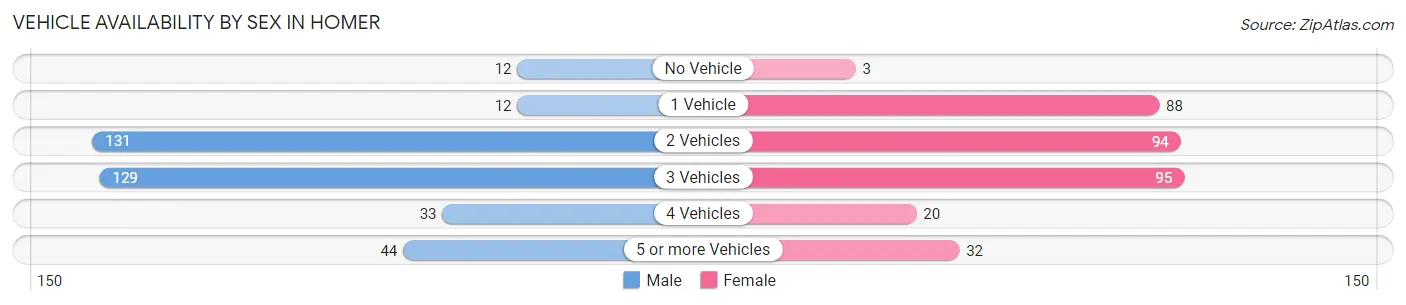
| Vehicles Available | Male | Female |
| No Vehicle | 12 (3.3%) | 3 (0.9%) |
| 1 Vehicle | 12 (3.3%) | 88 (26.5%) |
| 2 Vehicles | 131 (36.3%) | 94 (28.3%) |
| 3 Vehicles | 129 (35.7%) | 95 (28.6%) |
| 4 Vehicles | 33 (9.1%) | 20 (6.0%) |
| 5 or more Vehicles | 44 (12.2%) | 32 (9.6%) |
| Total | 361 (100.0%) | 332 (100.0%) |
Commute Time in Homer
The most frequently occuring commute durations in Homer are 35 to 39 minutes (131 commuters, 19.6%), 45 to 59 minutes (109 commuters, 16.3%), and 25 to 29 minutes (108 commuters, 16.2%).
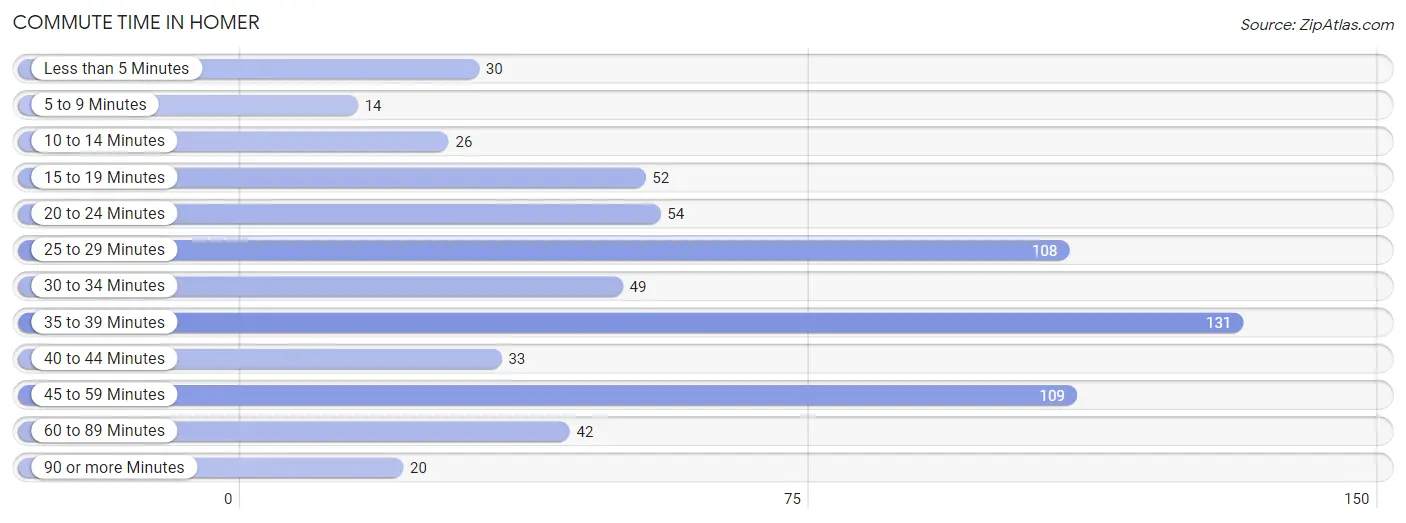
| Commute Time | # Commuters | % Commuters |
| Less than 5 Minutes | 30 | 4.5% |
| 5 to 9 Minutes | 14 | 2.1% |
| 10 to 14 Minutes | 26 | 3.9% |
| 15 to 19 Minutes | 52 | 7.8% |
| 20 to 24 Minutes | 54 | 8.1% |
| 25 to 29 Minutes | 108 | 16.2% |
| 30 to 34 Minutes | 49 | 7.3% |
| 35 to 39 Minutes | 131 | 19.6% |
| 40 to 44 Minutes | 33 | 4.9% |
| 45 to 59 Minutes | 109 | 16.3% |
| 60 to 89 Minutes | 42 | 6.3% |
| 90 or more Minutes | 20 | 3.0% |
Commute Time by Sex in Homer
The most common commute times in Homer are 35 to 39 minutes (84 commuters, 24.4%) for males and 25 to 29 minutes (89 commuters, 27.5%) for females.
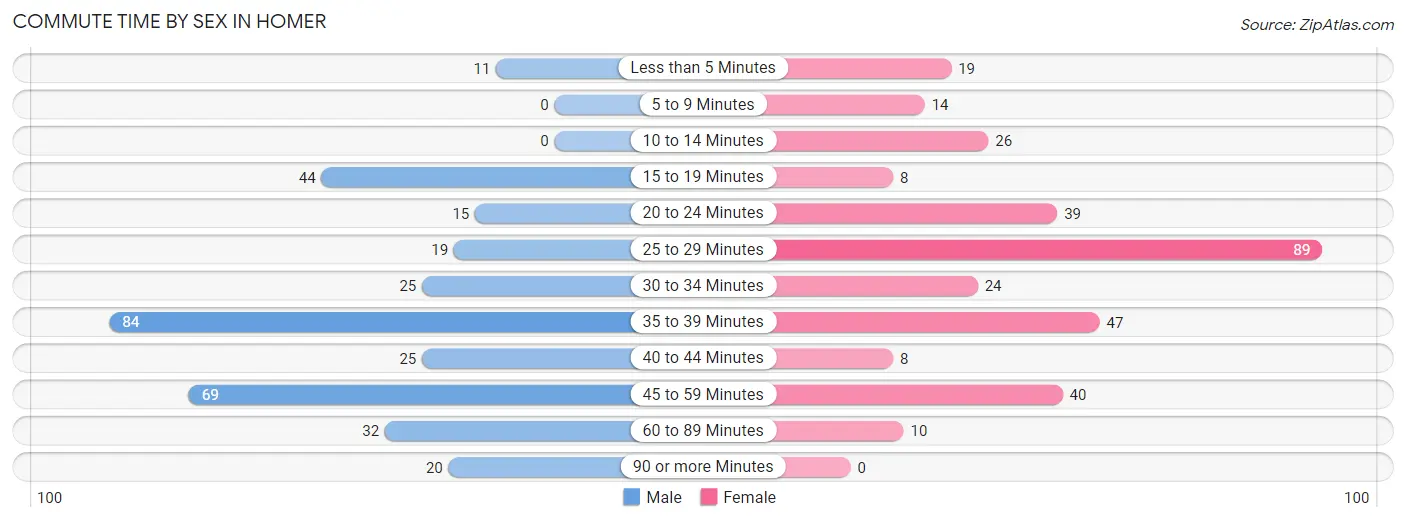
| Commute Time | Male | Female |
| Less than 5 Minutes | 11 (3.2%) | 19 (5.9%) |
| 5 to 9 Minutes | 0 (0.0%) | 14 (4.3%) |
| 10 to 14 Minutes | 0 (0.0%) | 26 (8.0%) |
| 15 to 19 Minutes | 44 (12.8%) | 8 (2.5%) |
| 20 to 24 Minutes | 15 (4.4%) | 39 (12.0%) |
| 25 to 29 Minutes | 19 (5.5%) | 89 (27.5%) |
| 30 to 34 Minutes | 25 (7.3%) | 24 (7.4%) |
| 35 to 39 Minutes | 84 (24.4%) | 47 (14.5%) |
| 40 to 44 Minutes | 25 (7.3%) | 8 (2.5%) |
| 45 to 59 Minutes | 69 (20.1%) | 40 (12.3%) |
| 60 to 89 Minutes | 32 (9.3%) | 10 (3.1%) |
| 90 or more Minutes | 20 (5.8%) | 0 (0.0%) |
Time of Departure to Work by Sex in Homer
The most frequent times of departure to work in Homer are 5:00 AM to 5:29 AM (63, 18.3%) for males and 6:30 AM to 6:59 AM (81, 25.0%) for females.
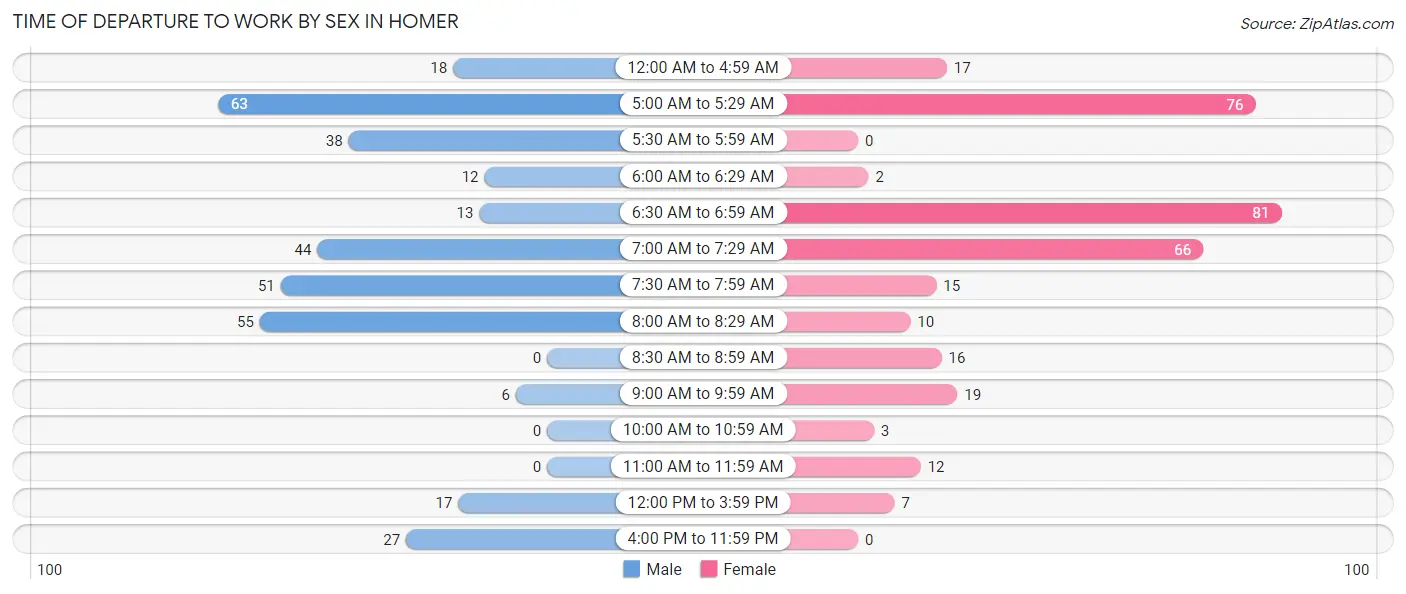
| Time of Departure | Male | Female |
| 12:00 AM to 4:59 AM | 18 (5.2%) | 17 (5.2%) |
| 5:00 AM to 5:29 AM | 63 (18.3%) | 76 (23.5%) |
| 5:30 AM to 5:59 AM | 38 (11.1%) | 0 (0.0%) |
| 6:00 AM to 6:29 AM | 12 (3.5%) | 2 (0.6%) |
| 6:30 AM to 6:59 AM | 13 (3.8%) | 81 (25.0%) |
| 7:00 AM to 7:29 AM | 44 (12.8%) | 66 (20.4%) |
| 7:30 AM to 7:59 AM | 51 (14.8%) | 15 (4.6%) |
| 8:00 AM to 8:29 AM | 55 (16.0%) | 10 (3.1%) |
| 8:30 AM to 8:59 AM | 0 (0.0%) | 16 (4.9%) |
| 9:00 AM to 9:59 AM | 6 (1.7%) | 19 (5.9%) |
| 10:00 AM to 10:59 AM | 0 (0.0%) | 3 (0.9%) |
| 11:00 AM to 11:59 AM | 0 (0.0%) | 12 (3.7%) |
| 12:00 PM to 3:59 PM | 17 (4.9%) | 7 (2.2%) |
| 4:00 PM to 11:59 PM | 27 (7.9%) | 0 (0.0%) |
| Total | 344 (100.0%) | 324 (100.0%) |
Housing Occupancy in Homer
Occupancy by Ownership in Homer
Of the total 574 dwellings in Homer, owner-occupied units account for 343 (59.8%), while renter-occupied units make up 231 (40.2%).
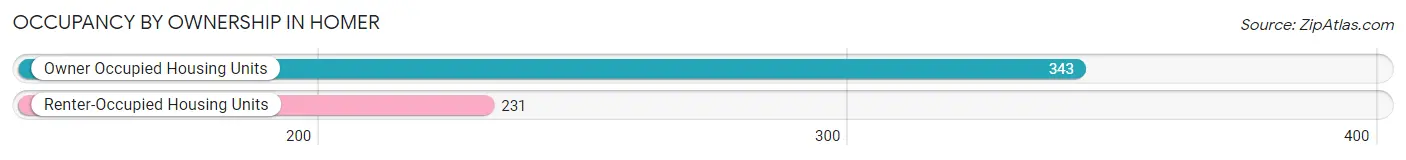
| Occupancy | # Housing Units | % Housing Units |
| Owner Occupied Housing Units | 343 | 59.8% |
| Renter-Occupied Housing Units | 231 | 40.2% |
| Total Occupied Housing Units | 574 | 100.0% |
Occupancy by Household Size in Homer
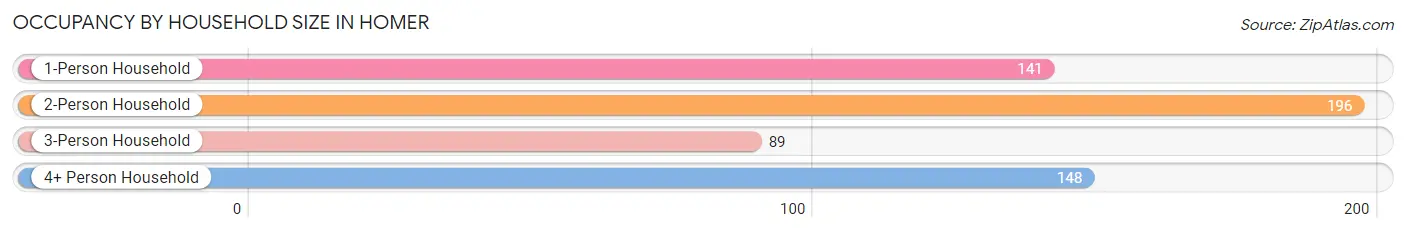
| Household Size | # Housing Units | % Housing Units |
| 1-Person Household | 141 | 24.6% |
| 2-Person Household | 196 | 34.2% |
| 3-Person Household | 89 | 15.5% |
| 4+ Person Household | 148 | 25.8% |
| Total Housing Units | 574 | 100.0% |
Occupancy by Ownership by Household Size in Homer
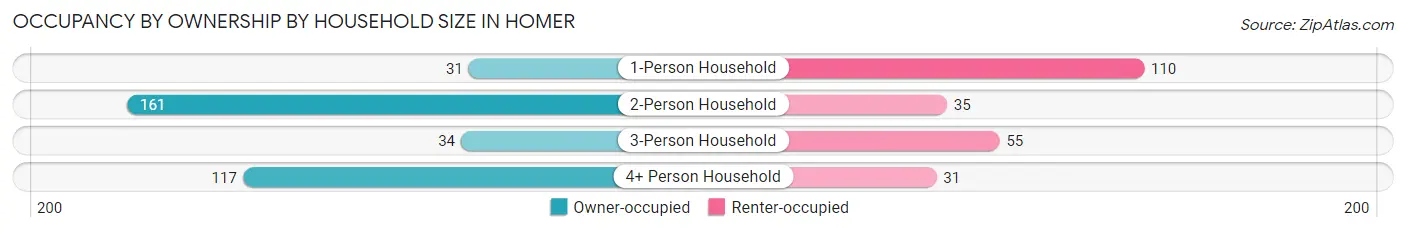
| Household Size | Owner-occupied | Renter-occupied |
| 1-Person Household | 31 (22.0%) | 110 (78.0%) |
| 2-Person Household | 161 (82.1%) | 35 (17.9%) |
| 3-Person Household | 34 (38.2%) | 55 (61.8%) |
| 4+ Person Household | 117 (79.0%) | 31 (20.9%) |
| Total Housing Units | 343 (59.8%) | 231 (40.2%) |
Occupancy by Educational Attainment in Homer
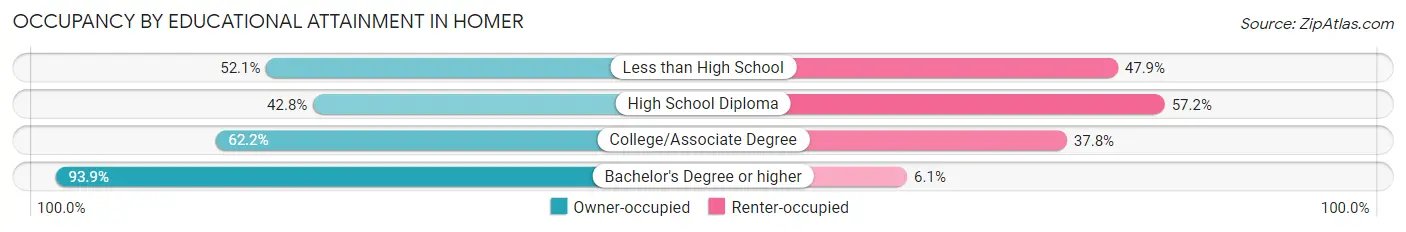
| Household Size | Owner-occupied | Renter-occupied |
| Less than High School | 50 (52.1%) | 46 (47.9%) |
| High School Diploma | 89 (42.8%) | 119 (57.2%) |
| College/Associate Degree | 97 (62.2%) | 59 (37.8%) |
| Bachelor's Degree or higher | 107 (93.9%) | 7 (6.1%) |
Occupancy by Age of Householder in Homer
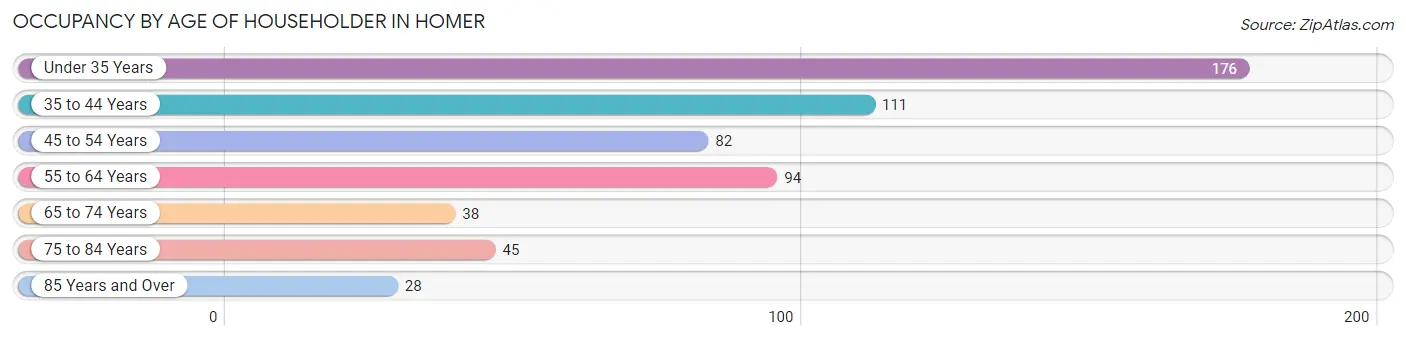
| Age Bracket | # Households | % Households |
| Under 35 Years | 176 | 30.7% |
| 35 to 44 Years | 111 | 19.3% |
| 45 to 54 Years | 82 | 14.3% |
| 55 to 64 Years | 94 | 16.4% |
| 65 to 74 Years | 38 | 6.6% |
| 75 to 84 Years | 45 | 7.8% |
| 85 Years and Over | 28 | 4.9% |
| Total | 574 | 100.0% |
Housing Finances in Homer
Median Income by Occupancy in Homer
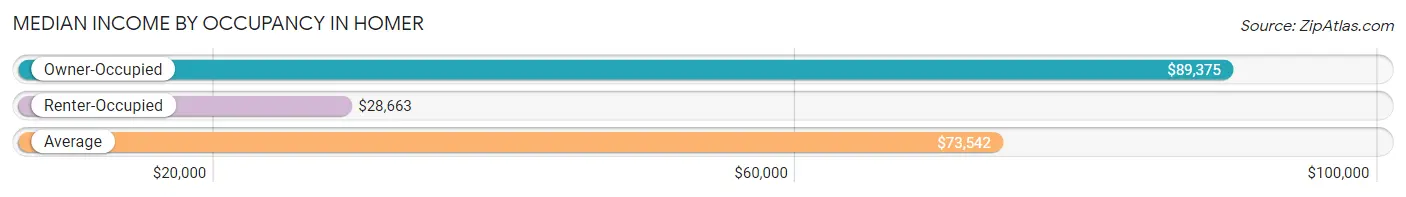
| Occupancy Type | # Households | Median Income |
| Owner-Occupied | 343 (59.8%) | $89,375 |
| Renter-Occupied | 231 (40.2%) | $28,663 |
| Average | 574 (100.0%) | $73,542 |
Occupancy by Householder Income Bracket in Homer
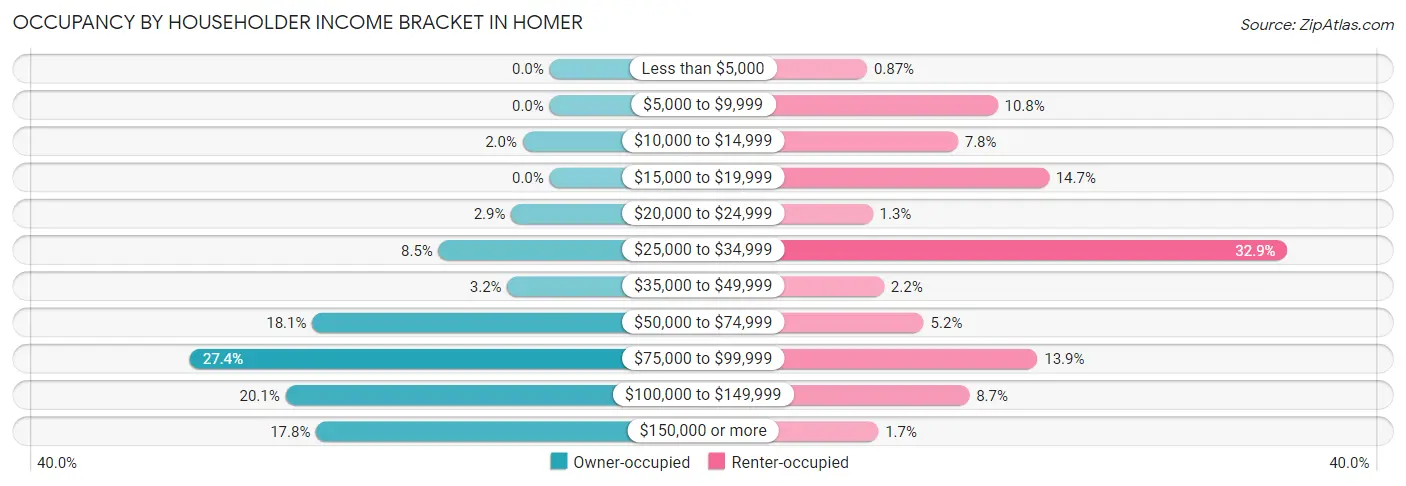
| Income Bracket | Owner-occupied | Renter-occupied |
| Less than $5,000 | 0 (0.0%) | 2 (0.9%) |
| $5,000 to $9,999 | 0 (0.0%) | 25 (10.8%) |
| $10,000 to $14,999 | 7 (2.0%) | 18 (7.8%) |
| $15,000 to $19,999 | 0 (0.0%) | 34 (14.7%) |
| $20,000 to $24,999 | 10 (2.9%) | 3 (1.3%) |
| $25,000 to $34,999 | 29 (8.5%) | 76 (32.9%) |
| $35,000 to $49,999 | 11 (3.2%) | 5 (2.2%) |
| $50,000 to $74,999 | 62 (18.1%) | 12 (5.2%) |
| $75,000 to $99,999 | 94 (27.4%) | 32 (13.9%) |
| $100,000 to $149,999 | 69 (20.1%) | 20 (8.7%) |
| $150,000 or more | 61 (17.8%) | 4 (1.7%) |
| Total | 343 (100.0%) | 231 (100.0%) |
Monthly Housing Cost Tiers in Homer
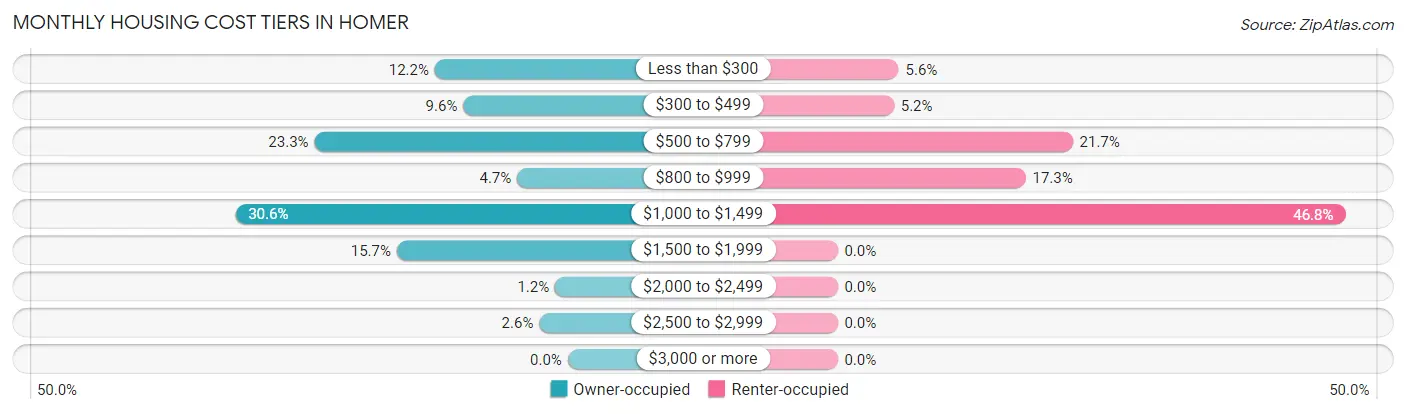
| Monthly Cost | Owner-occupied | Renter-occupied |
| Less than $300 | 42 (12.2%) | 13 (5.6%) |
| $300 to $499 | 33 (9.6%) | 12 (5.2%) |
| $500 to $799 | 80 (23.3%) | 50 (21.6%) |
| $800 to $999 | 16 (4.7%) | 40 (17.3%) |
| $1,000 to $1,499 | 105 (30.6%) | 108 (46.8%) |
| $1,500 to $1,999 | 54 (15.7%) | 0 (0.0%) |
| $2,000 to $2,499 | 4 (1.2%) | 0 (0.0%) |
| $2,500 to $2,999 | 9 (2.6%) | 0 (0.0%) |
| $3,000 or more | 0 (0.0%) | 0 (0.0%) |
| Total | 343 (100.0%) | 231 (100.0%) |
Physical Housing Characteristics in Homer
Housing Structures in Homer
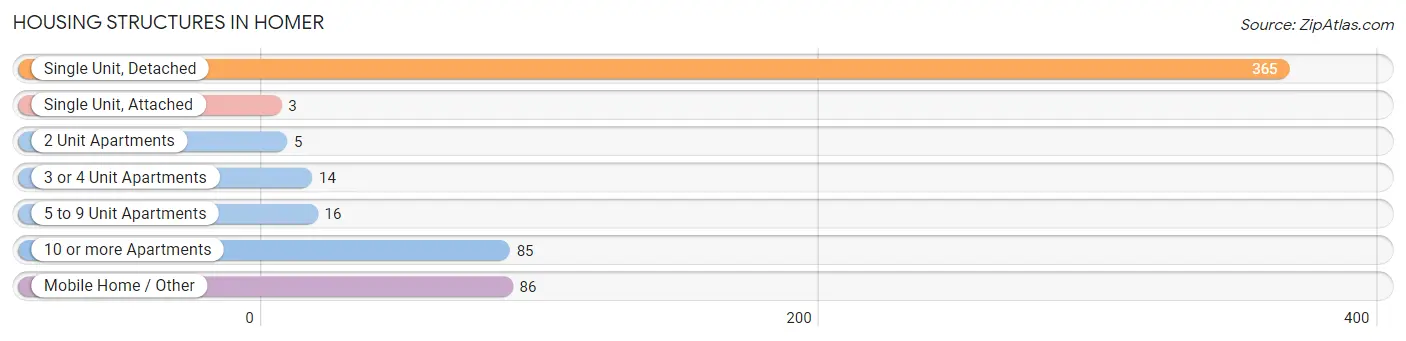
| Structure Type | # Housing Units | % Housing Units |
| Single Unit, Detached | 365 | 63.6% |
| Single Unit, Attached | 3 | 0.5% |
| 2 Unit Apartments | 5 | 0.9% |
| 3 or 4 Unit Apartments | 14 | 2.4% |
| 5 to 9 Unit Apartments | 16 | 2.8% |
| 10 or more Apartments | 85 | 14.8% |
| Mobile Home / Other | 86 | 15.0% |
| Total | 574 | 100.0% |
Housing Structures by Occupancy in Homer
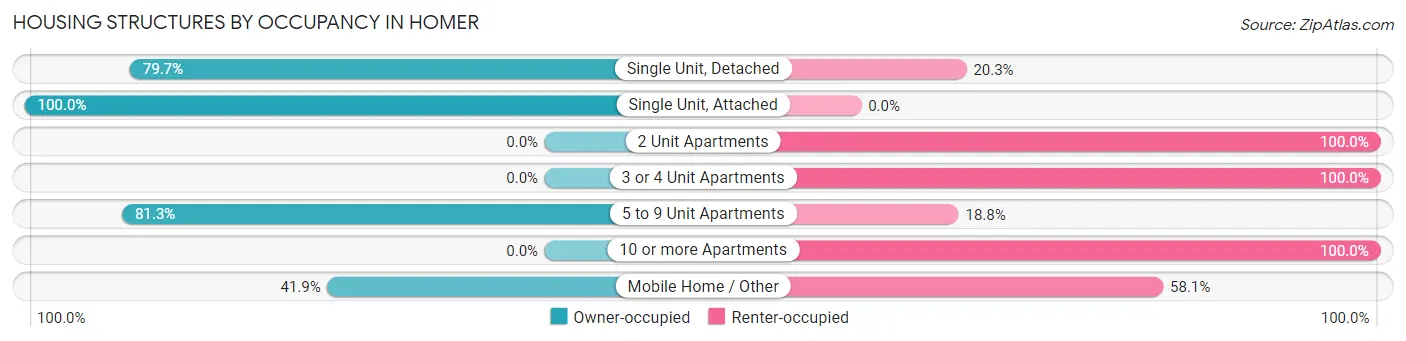
| Structure Type | Owner-occupied | Renter-occupied |
| Single Unit, Detached | 291 (79.7%) | 74 (20.3%) |
| Single Unit, Attached | 3 (100.0%) | 0 (0.0%) |
| 2 Unit Apartments | 0 (0.0%) | 5 (100.0%) |
| 3 or 4 Unit Apartments | 0 (0.0%) | 14 (100.0%) |
| 5 to 9 Unit Apartments | 13 (81.2%) | 3 (18.8%) |
| 10 or more Apartments | 0 (0.0%) | 85 (100.0%) |
| Mobile Home / Other | 36 (41.9%) | 50 (58.1%) |
| Total | 343 (59.8%) | 231 (40.2%) |
Housing Structures by Number of Rooms in Homer
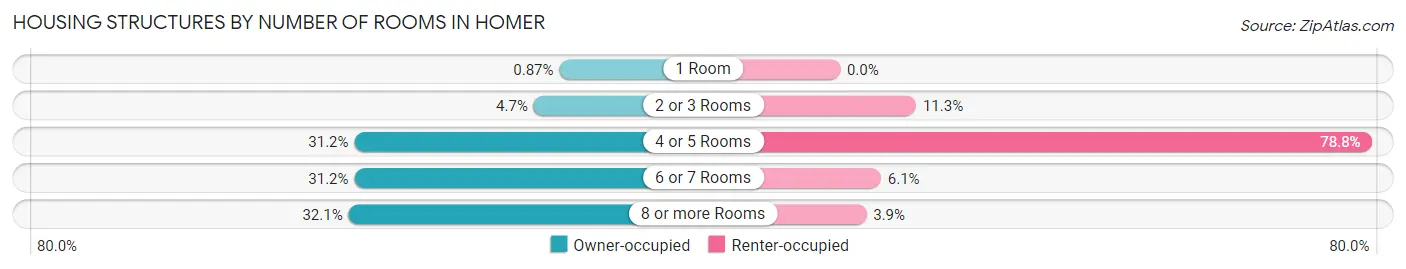
| Number of Rooms | Owner-occupied | Renter-occupied |
| 1 Room | 3 (0.9%) | 0 (0.0%) |
| 2 or 3 Rooms | 16 (4.7%) | 26 (11.3%) |
| 4 or 5 Rooms | 107 (31.2%) | 182 (78.8%) |
| 6 or 7 Rooms | 107 (31.2%) | 14 (6.1%) |
| 8 or more Rooms | 110 (32.1%) | 9 (3.9%) |
| Total | 343 (100.0%) | 231 (100.0%) |
Housing Structure by Heating Type in Homer
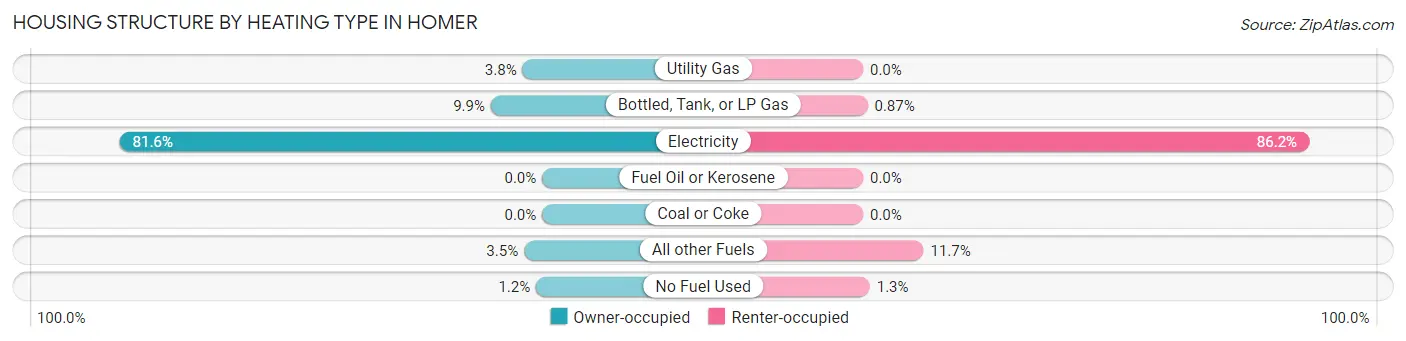
| Heating Type | Owner-occupied | Renter-occupied |
| Utility Gas | 13 (3.8%) | 0 (0.0%) |
| Bottled, Tank, or LP Gas | 34 (9.9%) | 2 (0.9%) |
| Electricity | 280 (81.6%) | 199 (86.2%) |
| Fuel Oil or Kerosene | 0 (0.0%) | 0 (0.0%) |
| Coal or Coke | 0 (0.0%) | 0 (0.0%) |
| All other Fuels | 12 (3.5%) | 27 (11.7%) |
| No Fuel Used | 4 (1.2%) | 3 (1.3%) |
| Total | 343 (100.0%) | 231 (100.0%) |
Household Vehicle Usage in Homer
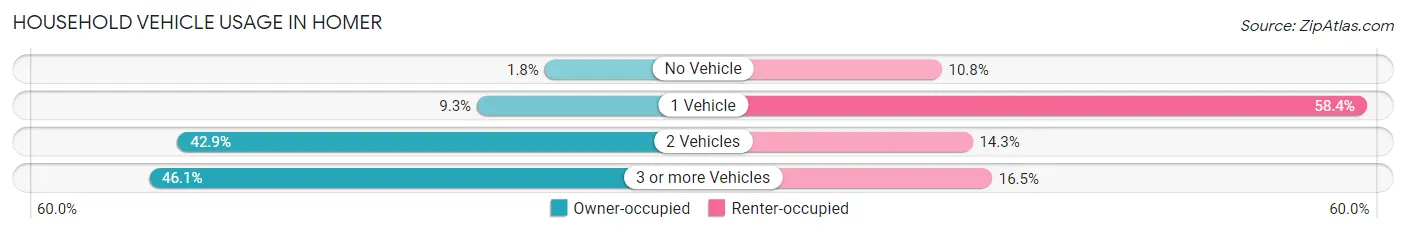
| Vehicles per Household | Owner-occupied | Renter-occupied |
| No Vehicle | 6 (1.8%) | 25 (10.8%) |
| 1 Vehicle | 32 (9.3%) | 135 (58.4%) |
| 2 Vehicles | 147 (42.9%) | 33 (14.3%) |
| 3 or more Vehicles | 158 (46.1%) | 38 (16.5%) |
| Total | 343 (100.0%) | 231 (100.0%) |
Real Estate & Mortgages in Homer
Real Estate and Mortgage Overview in Homer
| Characteristic | Without Mortgage | With Mortgage |
| Housing Units | 155 | 188 |
| Median Property Value | $247,200 | $238,500 |
| Median Household Income | $76,146 | $36 |
| Monthly Housing Costs | $521 | $0 |
| Real Estate Taxes | $1,739 | $2 |
Property Value by Mortgage Status in Homer
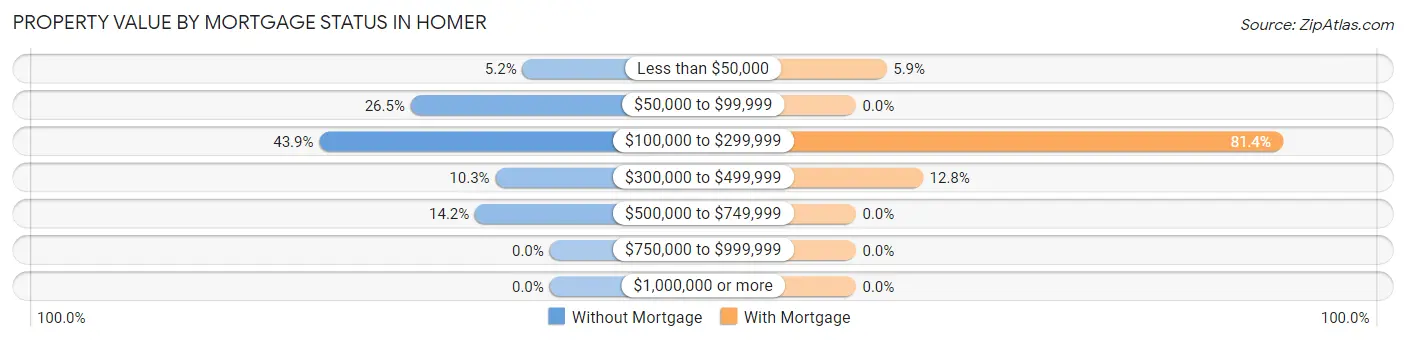
| Property Value | Without Mortgage | With Mortgage |
| Less than $50,000 | 8 (5.2%) | 11 (5.9%) |
| $50,000 to $99,999 | 41 (26.5%) | 0 (0.0%) |
| $100,000 to $299,999 | 68 (43.9%) | 153 (81.4%) |
| $300,000 to $499,999 | 16 (10.3%) | 24 (12.8%) |
| $500,000 to $749,999 | 22 (14.2%) | 0 (0.0%) |
| $750,000 to $999,999 | 0 (0.0%) | 0 (0.0%) |
| $1,000,000 or more | 0 (0.0%) | 0 (0.0%) |
| Total | 155 (100.0%) | 188 (100.0%) |
Household Income by Mortgage Status in Homer
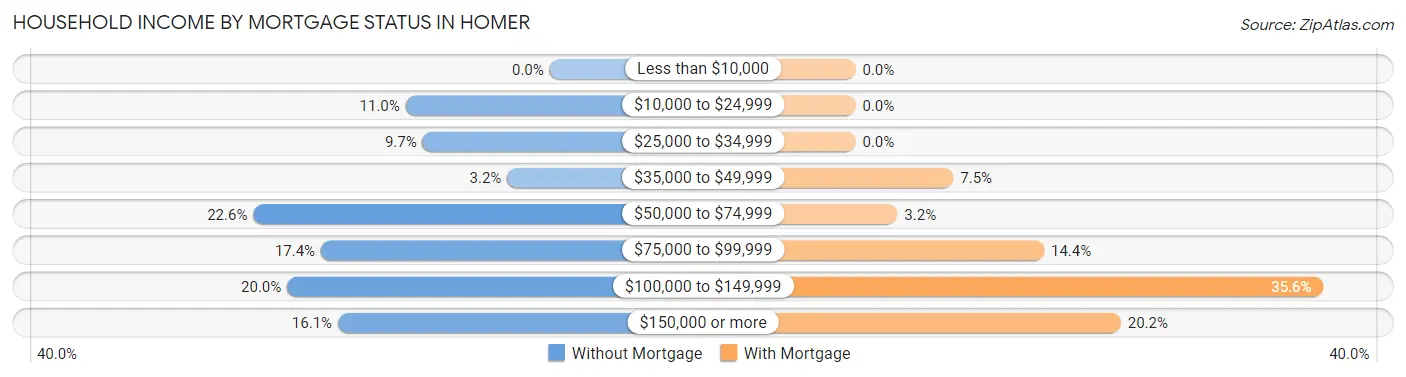
| Household Income | Without Mortgage | With Mortgage |
| Less than $10,000 | 0 (0.0%) | 0 (0.0%) |
| $10,000 to $24,999 | 17 (11.0%) | 0 (0.0%) |
| $25,000 to $34,999 | 15 (9.7%) | 0 (0.0%) |
| $35,000 to $49,999 | 5 (3.2%) | 14 (7.4%) |
| $50,000 to $74,999 | 35 (22.6%) | 6 (3.2%) |
| $75,000 to $99,999 | 27 (17.4%) | 27 (14.4%) |
| $100,000 to $149,999 | 31 (20.0%) | 67 (35.6%) |
| $150,000 or more | 25 (16.1%) | 38 (20.2%) |
| Total | 155 (100.0%) | 188 (100.0%) |
Property Value to Household Income Ratio in Homer
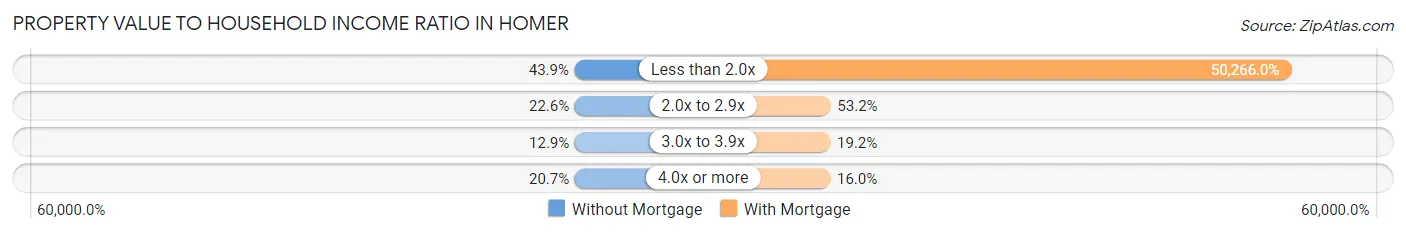
| Value-to-Income Ratio | Without Mortgage | With Mortgage |
| Less than 2.0x | 68 (43.9%) | 94,500 (50,266.0%) |
| 2.0x to 2.9x | 35 (22.6%) | 100 (53.2%) |
| 3.0x to 3.9x | 20 (12.9%) | 36 (19.2%) |
| 4.0x or more | 32 (20.6%) | 30 (16.0%) |
| Total | 155 (100.0%) | 188 (100.0%) |
Real Estate Taxes by Mortgage Status in Homer
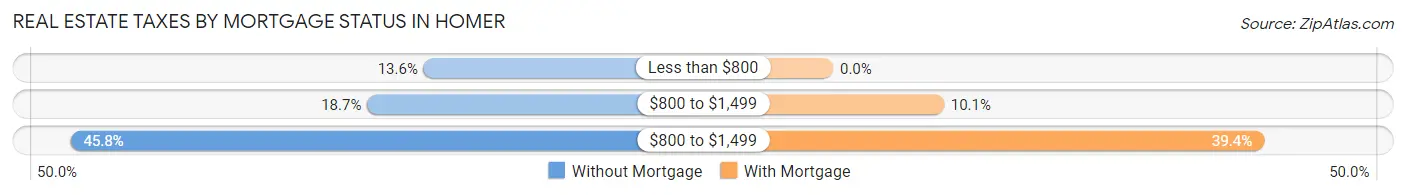
| Property Taxes | Without Mortgage | With Mortgage |
| Less than $800 | 21 (13.6%) | 0 (0.0%) |
| $800 to $1,499 | 29 (18.7%) | 19 (10.1%) |
| $800 to $1,499 | 71 (45.8%) | 74 (39.4%) |
| Total | 155 (100.0%) | 188 (100.0%) |
Health & Disability in Homer
Health Insurance Coverage by Age in Homer
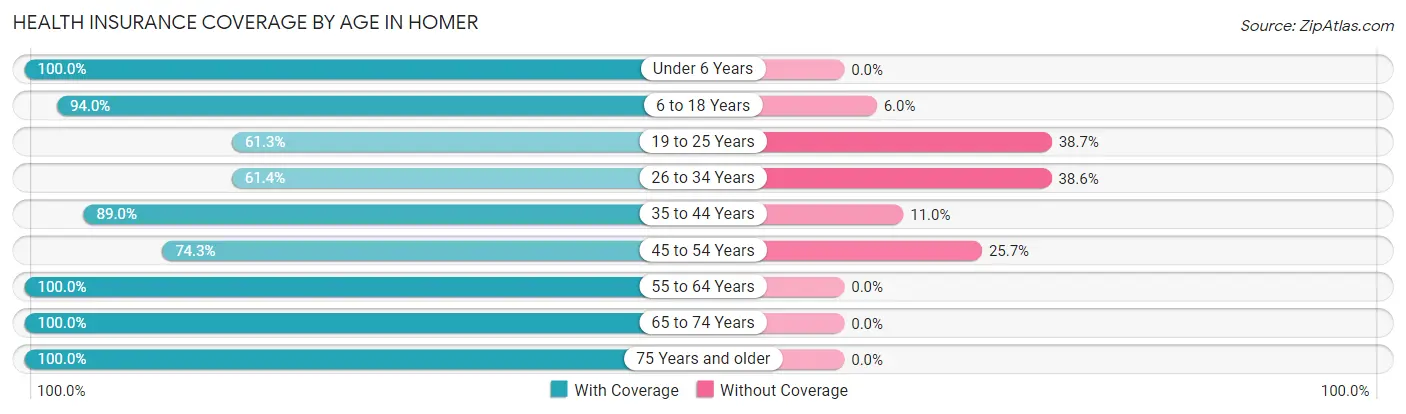
| Age Bracket | With Coverage | Without Coverage |
| Under 6 Years | 112 (100.0%) | 0 (0.0%) |
| 6 to 18 Years | 389 (94.0%) | 25 (6.0%) |
| 19 to 25 Years | 130 (61.3%) | 82 (38.7%) |
| 26 to 34 Years | 81 (61.4%) | 51 (38.6%) |
| 35 to 44 Years | 202 (89.0%) | 25 (11.0%) |
| 45 to 54 Years | 139 (74.3%) | 48 (25.7%) |
| 55 to 64 Years | 194 (100.0%) | 0 (0.0%) |
| 65 to 74 Years | 82 (100.0%) | 0 (0.0%) |
| 75 Years and older | 99 (100.0%) | 0 (0.0%) |
| Total | 1,428 (86.1%) | 231 (13.9%) |
Health Insurance Coverage by Citizenship Status in Homer
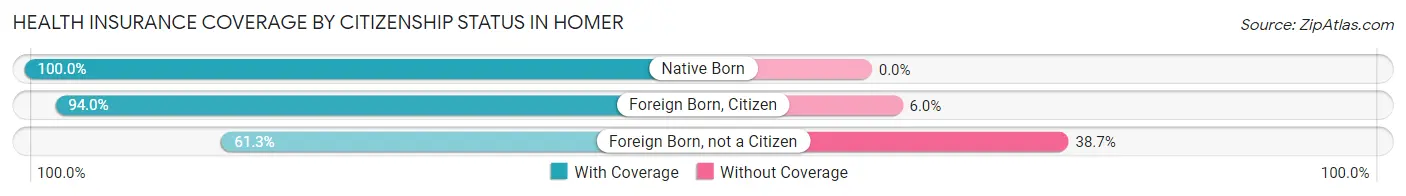
| Citizenship Status | With Coverage | Without Coverage |
| Native Born | 112 (100.0%) | 0 (0.0%) |
| Foreign Born, Citizen | 389 (94.0%) | 25 (6.0%) |
| Foreign Born, not a Citizen | 130 (61.3%) | 82 (38.7%) |
Health Insurance Coverage by Household Income in Homer
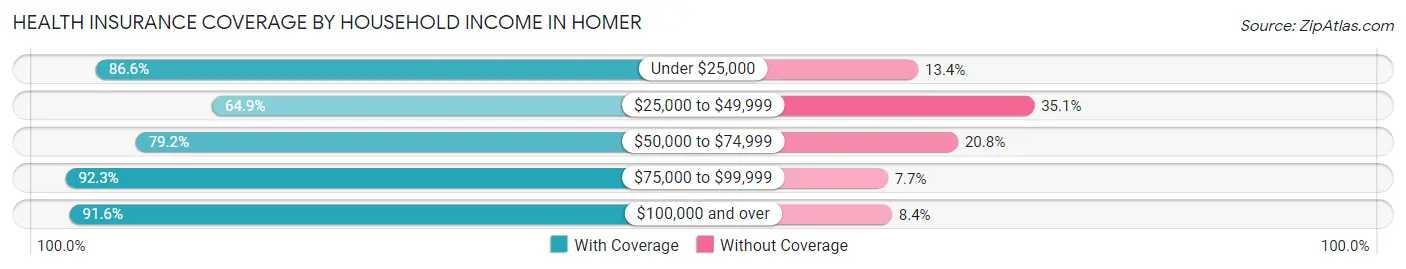
| Household Income | With Coverage | Without Coverage |
| Under $25,000 | 227 (86.6%) | 35 (13.4%) |
| $25,000 to $49,999 | 133 (64.9%) | 72 (35.1%) |
| $50,000 to $74,999 | 171 (79.2%) | 45 (20.8%) |
| $75,000 to $99,999 | 398 (92.3%) | 33 (7.7%) |
| $100,000 and over | 499 (91.6%) | 46 (8.4%) |
Public vs Private Health Insurance Coverage by Age in Homer
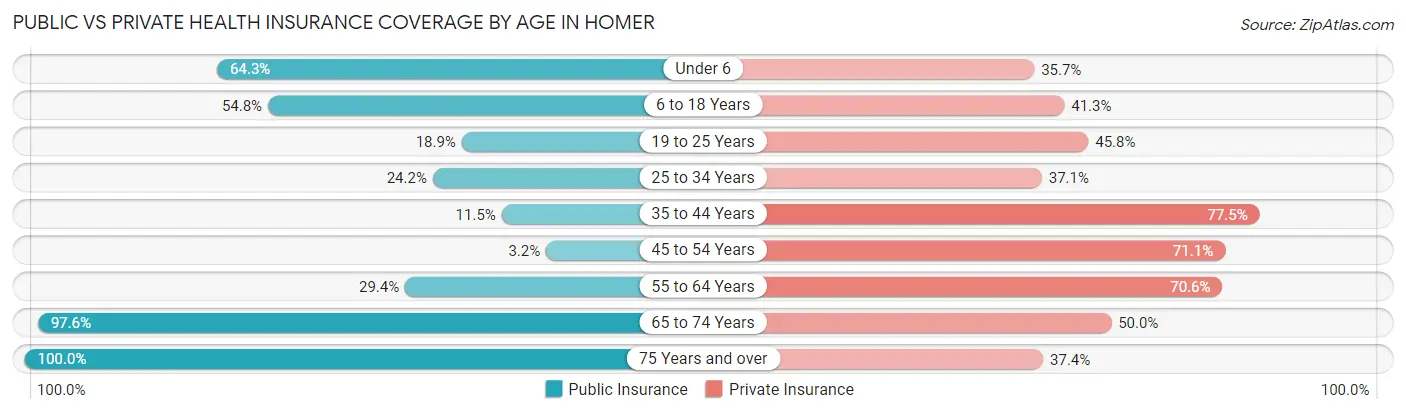
| Age Bracket | Public Insurance | Private Insurance |
| Under 6 | 72 (64.3%) | 40 (35.7%) |
| 6 to 18 Years | 227 (54.8%) | 171 (41.3%) |
| 19 to 25 Years | 40 (18.9%) | 97 (45.8%) |
| 25 to 34 Years | 32 (24.2%) | 49 (37.1%) |
| 35 to 44 Years | 26 (11.5%) | 176 (77.5%) |
| 45 to 54 Years | 6 (3.2%) | 133 (71.1%) |
| 55 to 64 Years | 57 (29.4%) | 137 (70.6%) |
| 65 to 74 Years | 80 (97.6%) | 41 (50.0%) |
| 75 Years and over | 99 (100.0%) | 37 (37.4%) |
| Total | 639 (38.5%) | 881 (53.1%) |
Disability Status by Sex by Age in Homer
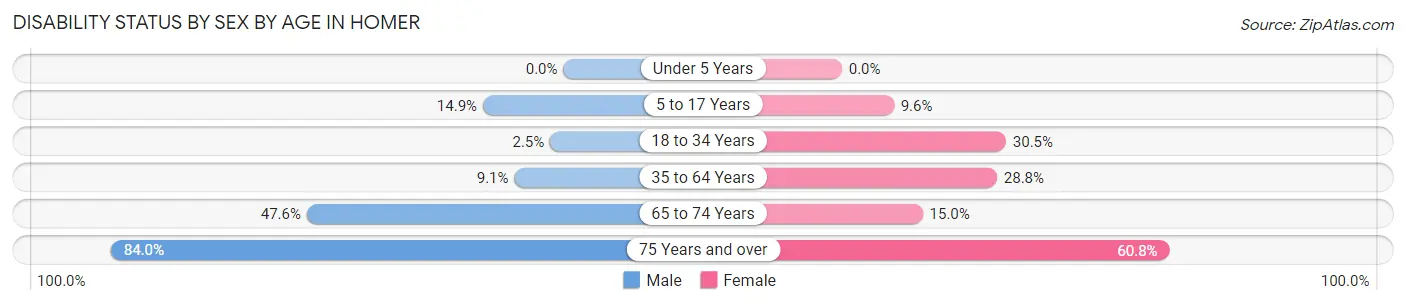
| Age Bracket | Male | Female |
| Under 5 Years | 0 (0.0%) | 0 (0.0%) |
| 5 to 17 Years | 33 (14.9%) | 19 (9.6%) |
| 18 to 34 Years | 3 (2.5%) | 74 (30.4%) |
| 35 to 64 Years | 30 (9.1%) | 80 (28.8%) |
| 65 to 74 Years | 20 (47.6%) | 6 (15.0%) |
| 75 Years and over | 21 (84.0%) | 45 (60.8%) |
Disability Class by Sex by Age in Homer
Disability Class: Hearing Difficulty
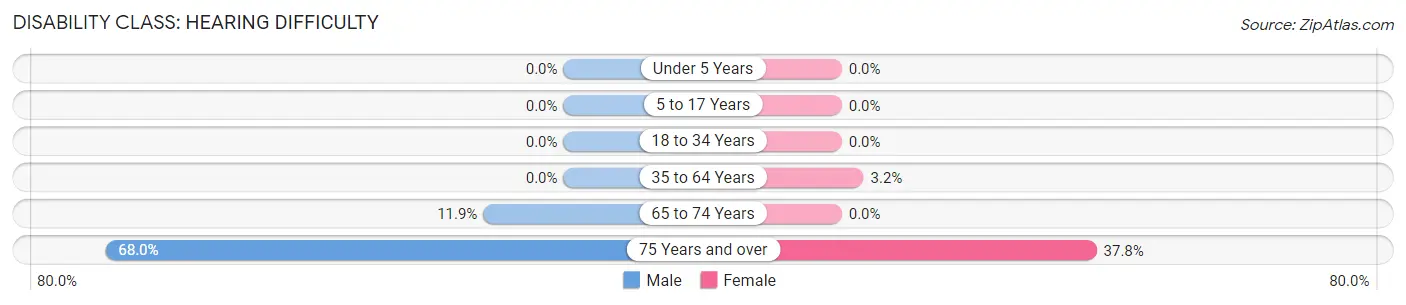
| Age Bracket | Male | Female |
| Under 5 Years | 0 (0.0%) | 0 (0.0%) |
| 5 to 17 Years | 0 (0.0%) | 0 (0.0%) |
| 18 to 34 Years | 0 (0.0%) | 0 (0.0%) |
| 35 to 64 Years | 0 (0.0%) | 9 (3.2%) |
| 65 to 74 Years | 5 (11.9%) | 0 (0.0%) |
| 75 Years and over | 17 (68.0%) | 28 (37.8%) |
Disability Class: Vision Difficulty
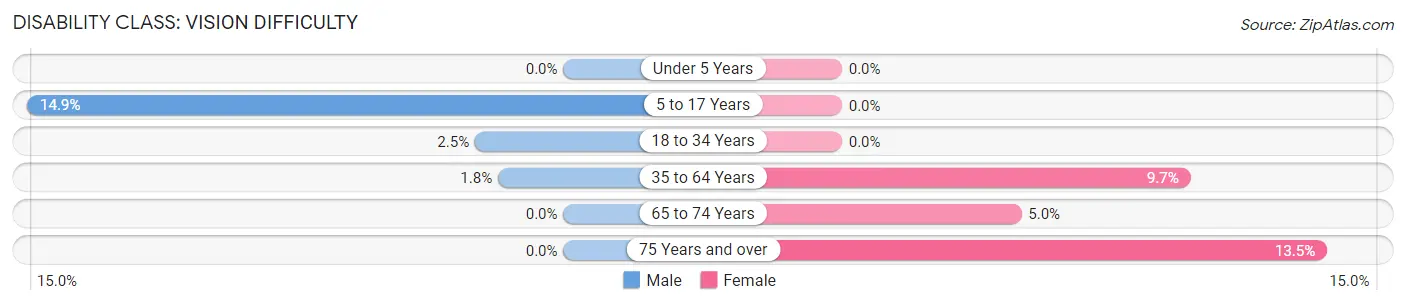
| Age Bracket | Male | Female |
| Under 5 Years | 0 (0.0%) | 0 (0.0%) |
| 5 to 17 Years | 33 (14.9%) | 0 (0.0%) |
| 18 to 34 Years | 3 (2.5%) | 0 (0.0%) |
| 35 to 64 Years | 6 (1.8%) | 27 (9.7%) |
| 65 to 74 Years | 0 (0.0%) | 2 (5.0%) |
| 75 Years and over | 0 (0.0%) | 10 (13.5%) |
Disability Class: Cognitive Difficulty
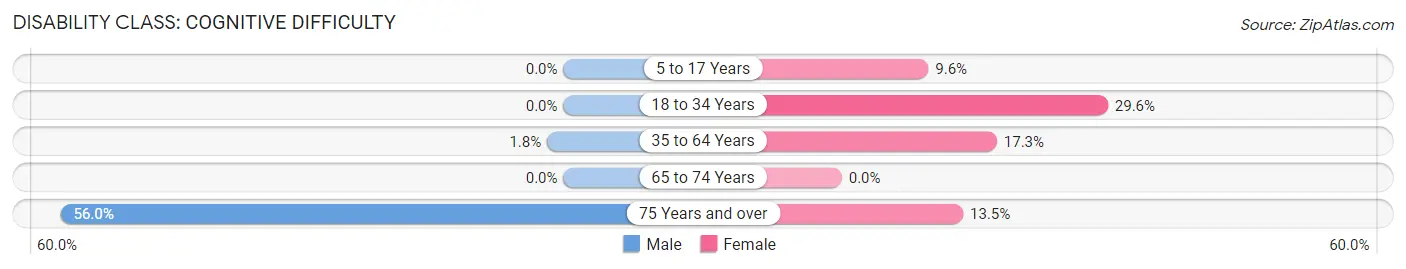
| Age Bracket | Male | Female |
| 5 to 17 Years | 0 (0.0%) | 19 (9.6%) |
| 18 to 34 Years | 0 (0.0%) | 72 (29.6%) |
| 35 to 64 Years | 6 (1.8%) | 48 (17.3%) |
| 65 to 74 Years | 0 (0.0%) | 0 (0.0%) |
| 75 Years and over | 14 (56.0%) | 10 (13.5%) |
Disability Class: Ambulatory Difficulty
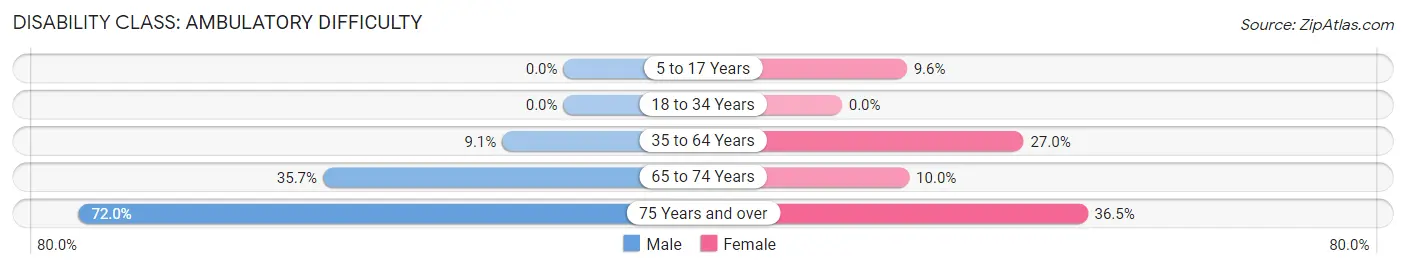
| Age Bracket | Male | Female |
| 5 to 17 Years | 0 (0.0%) | 19 (9.6%) |
| 18 to 34 Years | 0 (0.0%) | 0 (0.0%) |
| 35 to 64 Years | 30 (9.1%) | 75 (27.0%) |
| 65 to 74 Years | 15 (35.7%) | 4 (10.0%) |
| 75 Years and over | 18 (72.0%) | 27 (36.5%) |
Disability Class: Self-Care Difficulty
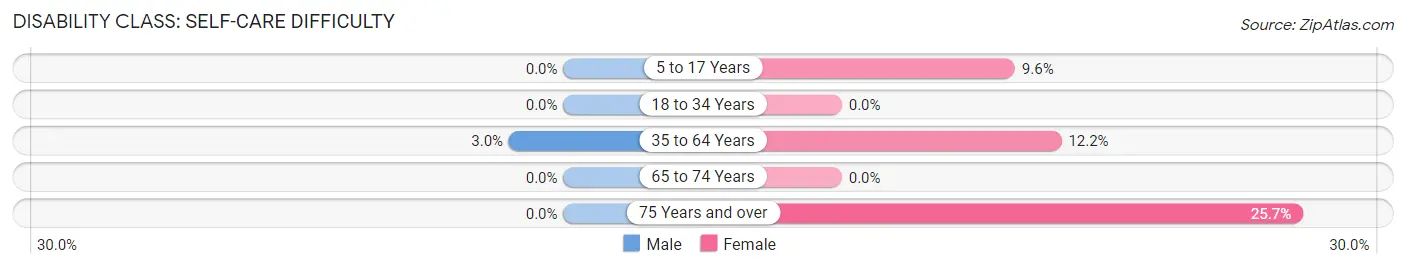
| Age Bracket | Male | Female |
| 5 to 17 Years | 0 (0.0%) | 19 (9.6%) |
| 18 to 34 Years | 0 (0.0%) | 0 (0.0%) |
| 35 to 64 Years | 10 (3.0%) | 34 (12.2%) |
| 65 to 74 Years | 0 (0.0%) | 0 (0.0%) |
| 75 Years and over | 0 (0.0%) | 19 (25.7%) |
Technology Access in Homer
Computing Device Access in Homer
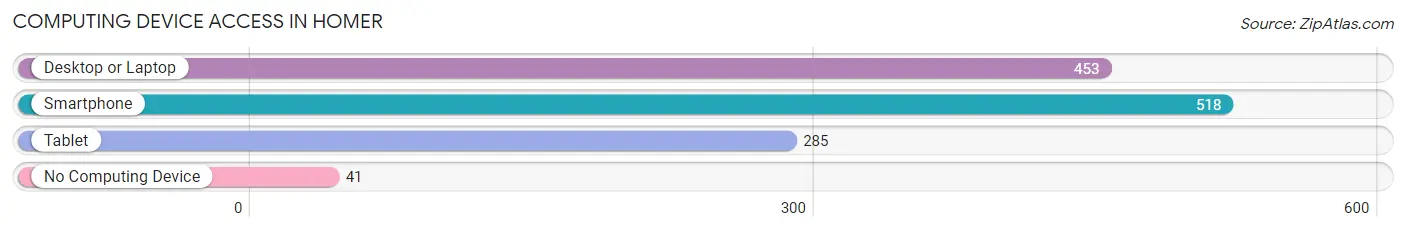
| Device Type | # Households | % Households |
| Desktop or Laptop | 453 | 78.9% |
| Smartphone | 518 | 90.2% |
| Tablet | 285 | 49.6% |
| No Computing Device | 41 | 7.1% |
| Total | 574 | 100.0% |
Internet Access in Homer
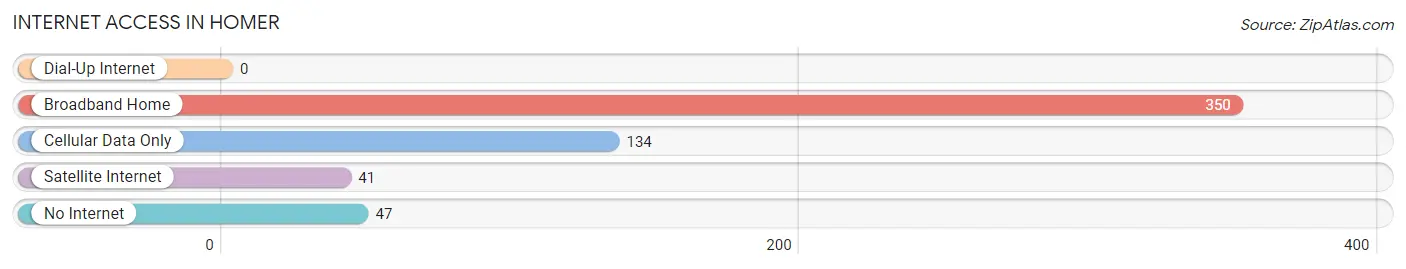
| Internet Type | # Households | % Households |
| Dial-Up Internet | 0 | 0.0% |
| Broadband Home | 350 | 61.0% |
| Cellular Data Only | 134 | 23.3% |
| Satellite Internet | 41 | 7.1% |
| No Internet | 47 | 8.2% |
| Total | 574 | 100.0% |
Homer Summary
Homer, Georgia is a small city located in Banks County, Georgia, United States. It is situated in the foothills of the Blue Ridge Mountains, approximately 60 miles northeast of Atlanta. The city has a population of approximately 1,500 people and is the county seat of Banks County.
History
Homer was founded in 1858 and was named after the Greek poet Homer. The city was originally known as Homerville, but the name was changed to Homer in 1872. The city was incorporated in 1883.
Homer was an important stop on the Gainesville Midland Railroad, which ran from Gainesville to Athens. The railroad was built in the late 19th century and was used to transport cotton and other goods. The railroad was abandoned in the early 20th century.
Homer was also an important stop on the Dixie Highway, which ran from Michigan to Florida. The highway was built in the early 20th century and was used to transport people and goods. The highway was abandoned in the mid-20th century.
Geography
Homer is located in the foothills of the Blue Ridge Mountains in Banks County, Georgia. The city is situated at an elevation of 1,000 feet above sea level. The city is located approximately 60 miles northeast of Atlanta.
The city is located in the Piedmont region of Georgia, which is characterized by rolling hills and valleys. The city is located in the Chattahoochee National Forest, which is home to a variety of wildlife, including deer, turkey, and black bear.
Economy
Homer’s economy is largely based on agriculture. The city is home to several farms, which produce a variety of crops, including corn, soybeans, and cotton. The city is also home to several manufacturing companies, which produce a variety of products, including furniture, textiles, and automotive parts.
The city is also home to several retail stores, restaurants, and other businesses. The city is home to several banks, which provide financial services to the local community.
Demographics
Homer has a population of approximately 1,500 people. The city is predominantly white, with approximately 90% of the population being white. The city is also home to a small African American population, with approximately 5% of the population being African American.
The median household income in Homer is approximately $35,000. The median home value is approximately $100,000. The city has a poverty rate of approximately 15%.
Conclusion
Homer, Georgia is a small city located in Banks County, Georgia, United States. It is situated in the foothills of the Blue Ridge Mountains, approximately 60 miles northeast of Atlanta. The city has a population of approximately 1,500 people and is the county seat of Banks County. The city’s economy is largely based on agriculture, manufacturing, and retail. The city is predominantly white, with a small African American population. The median household income in Homer is approximately $35,000 and the median home value is approximately $100,000. The city has a poverty rate of approximately 15%.
Common Questions
What is Per Capita Income in Homer?
Per Capita income in Homer is $30,296.
What is the Median Family Income in Homer?
Median Family Income in Homer is $86,667.
What is the Median Household income in Homer?
Median Household Income in Homer is $73,542.
What is Income or Wage Gap in Homer?
Income or Wage Gap in Homer is 45.9%.
Women in Homer earn 54.1 cents for every dollar earned by a man.
What is Family Income Deficit in Homer?
Family Income Deficit in Homer is $9,941.
Families that are below poverty line in Homer earn $9,941 less on average than the poverty threshold level.
What is Inequality or Gini Index in Homer?
Inequality or Gini Index in Homer is 0.44.
What is the Total Population of Homer?
Total Population of Homer is 1,659.
What is the Total Male Population of Homer?
Total Male Population of Homer is 786.
What is the Total Female Population of Homer?
Total Female Population of Homer is 873.
What is the Ratio of Males per 100 Females in Homer?
There are 90.03 Males per 100 Females in Homer.
What is the Ratio of Females per 100 Males in Homer?
There are 111.07 Females per 100 Males in Homer.
What is the Median Population Age in Homer?
Median Population Age in Homer is 31.8 Years.
What is the Average Family Size in Homer
Average Family Size in Homer is 3.4 People.
What is the Average Household Size in Homer
Average Household Size in Homer is 2.9 People.
How Large is the Labor Force in Homer?
There are 741 People in the Labor Forcein in Homer.
What is the Percentage of People in the Labor Force in Homer?
59.3% of People are in the Labor Force in Homer.
What is the Unemployment Rate in Homer?
Unemployment Rate in Homer is 4.7%.