Hahira, GA Map & Demographics
Hahira Map
Hahira Overview
$26,680
PER CAPITA INCOME
$73,162
AVG FAMILY INCOME
$67,143
AVG HOUSEHOLD INCOME
29.2%
WAGE / INCOME GAP [ % ]
70.8¢/ $1
WAGE / INCOME GAP [ $ ]
0.38
INEQUALITY / GINI INDEX
3,361
TOTAL POPULATION
1,567
MALE POPULATION
1,794
FEMALE POPULATION
87.35
MALES / 100 FEMALES
114.49
FEMALES / 100 MALES
26.0
MEDIAN AGE
3.7
AVG FAMILY SIZE
3.2
AVG HOUSEHOLD SIZE
1,615
LABOR FORCE [ PEOPLE ]
69.3%
PERCENT IN LABOR FORCE
5.0%
UNEMPLOYMENT RATE
Hahira Zip Codes
Hahira Area Codes
Income in Hahira
Income Overview in Hahira
Per Capita Income in Hahira is $26,680, while median incomes of families and households are $73,162 and $67,143 respectively.
| Characteristic | Number | Measure |
| Per Capita Income | 3,361 | $26,680 |
| Median Family Income | 837 | $73,162 |
| Mean Family Income | 837 | $81,748 |
| Median Household Income | 1,046 | $67,143 |
| Mean Household Income | 1,046 | $83,778 |
| Income Deficit | 837 | $0 |
| Wage / Income Gap (%) | 3,361 | 29.18% |
| Wage / Income Gap ($) | 3,361 | 70.82¢ per $1 |
| Gini / Inequality Index | 3,361 | 0.38 |
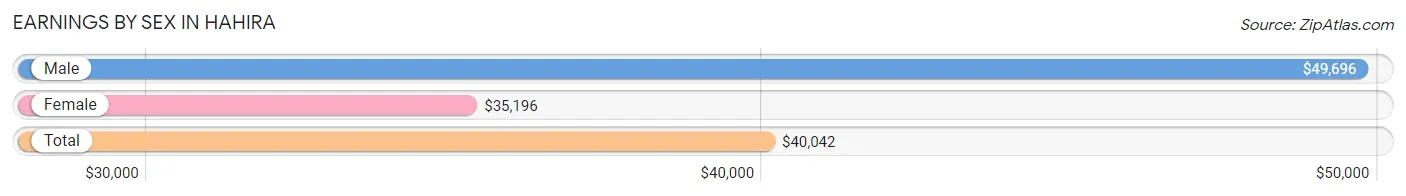
Earnings by Sex in Hahira
Average Earnings in Hahira are $40,042, $49,696 for men and $35,196 for women, a difference of 29.2%.
| Sex | Number | Average Earnings |
| Male | 871 (52.1%) | $49,696 |
| Female | 801 (47.9%) | $35,196 |
| Total | 1,672 (100.0%) | $40,042 |
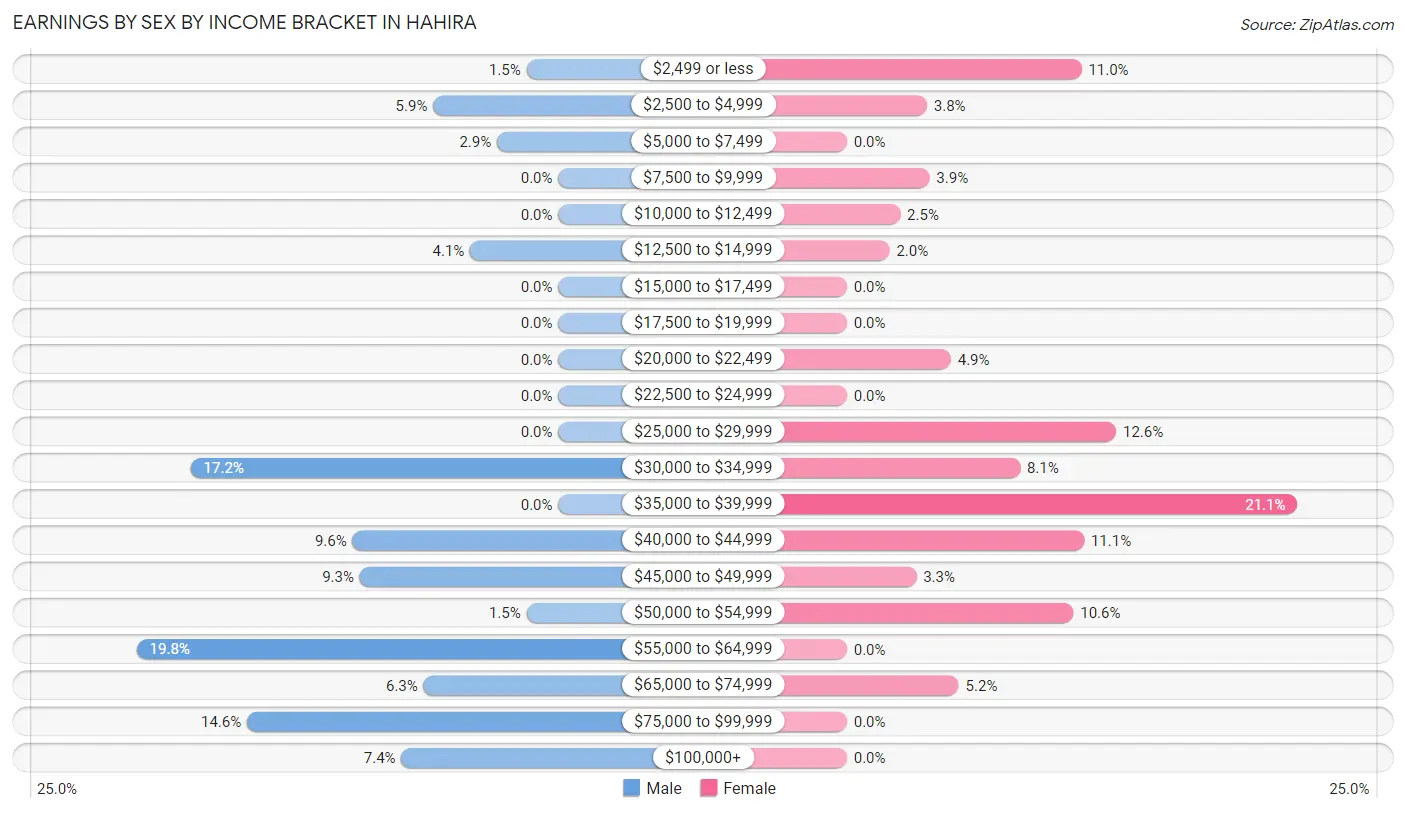
Earnings by Sex by Income Bracket in Hahira
The most common earnings brackets in Hahira are $55,000 to $64,999 for men (172 | 19.8%) and $35,000 to $39,999 for women (169 | 21.1%).
| Income | Male | Female |
| $2,499 or less | 13 (1.5%) | 88 (11.0%) |
| $2,500 to $4,999 | 51 (5.9%) | 30 (3.7%) |
| $5,000 to $7,499 | 25 (2.9%) | 0 (0.0%) |
| $7,500 to $9,999 | 0 (0.0%) | 31 (3.9%) |
| $10,000 to $12,499 | 0 (0.0%) | 20 (2.5%) |
| $12,500 to $14,999 | 36 (4.1%) | 16 (2.0%) |
| $15,000 to $17,499 | 0 (0.0%) | 0 (0.0%) |
| $17,500 to $19,999 | 0 (0.0%) | 0 (0.0%) |
| $20,000 to $22,499 | 0 (0.0%) | 39 (4.9%) |
| $22,500 to $24,999 | 0 (0.0%) | 0 (0.0%) |
| $25,000 to $29,999 | 0 (0.0%) | 101 (12.6%) |
| $30,000 to $34,999 | 150 (17.2%) | 65 (8.1%) |
| $35,000 to $39,999 | 0 (0.0%) | 169 (21.1%) |
| $40,000 to $44,999 | 84 (9.6%) | 89 (11.1%) |
| $45,000 to $49,999 | 81 (9.3%) | 26 (3.3%) |
| $50,000 to $54,999 | 13 (1.5%) | 85 (10.6%) |
| $55,000 to $64,999 | 172 (19.8%) | 0 (0.0%) |
| $65,000 to $74,999 | 55 (6.3%) | 42 (5.2%) |
| $75,000 to $99,999 | 127 (14.6%) | 0 (0.0%) |
| $100,000+ | 64 (7.3%) | 0 (0.0%) |
| Total | 871 (100.0%) | 801 (100.0%) |
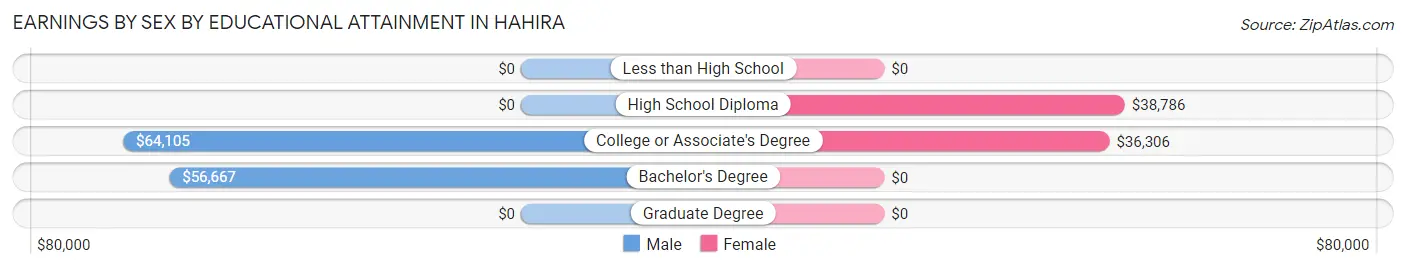
Earnings by Sex by Educational Attainment in Hahira
Average earnings in Hahira are $62,669 for men and $37,155 for women, a difference of 40.7%. Men with an educational attainment of college or associate's degree enjoy the highest average annual earnings of $64,105, while those with bachelor's degree education earn the least with $56,667. Women with an educational attainment of high school diploma earn the most with the average annual earnings of $38,786, while those with college or associate's degree education have the smallest earnings of $36,306.
| Educational Attainment | Male Income | Female Income |
| Less than High School | - | - |
| High School Diploma | - | - |
| College or Associate's Degree | $64,105 | $36,306 |
| Bachelor's Degree | $56,667 | $0 |
| Graduate Degree | - | - |
| Total | $62,669 | $37,155 |
Family Income in Hahira
Family Income Brackets in Hahira
According to the Hahira family income data, there are 312 families falling into the $50,000 to $74,999 income range, which is the most common income bracket and makes up 37.3% of all families.
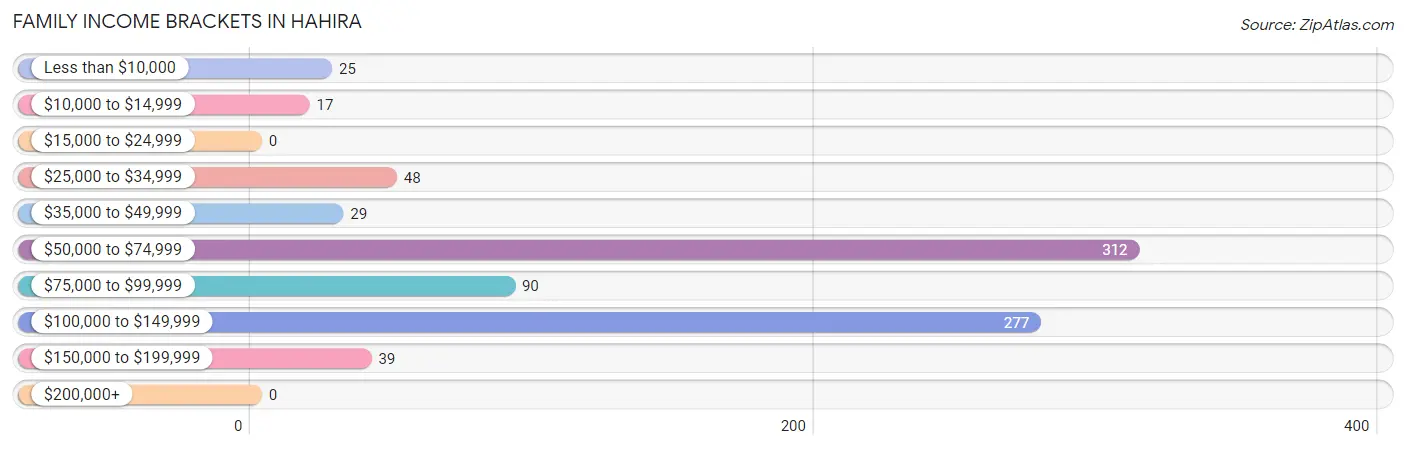
| Income Bracket | # Families | % Families |
| Less than $10,000 | 25 | 3.0% |
| $10,000 to $14,999 | 17 | 2.0% |
| $15,000 to $24,999 | 0 | 0.0% |
| $25,000 to $34,999 | 48 | 5.7% |
| $35,000 to $49,999 | 29 | 3.5% |
| $50,000 to $74,999 | 312 | 37.3% |
| $75,000 to $99,999 | 90 | 10.8% |
| $100,000 to $149,999 | 277 | 33.1% |
| $150,000 to $199,999 | 39 | 4.7% |
| $200,000+ | 0 | 0.0% |
Family Income by Famaliy Size in Hahira
4-person families (148 | 17.7%) account for the highest median family income in Hahira with $115,318 per family, while 2-person families (293 | 35.0%) have the highest median income of $33,192 per family member.
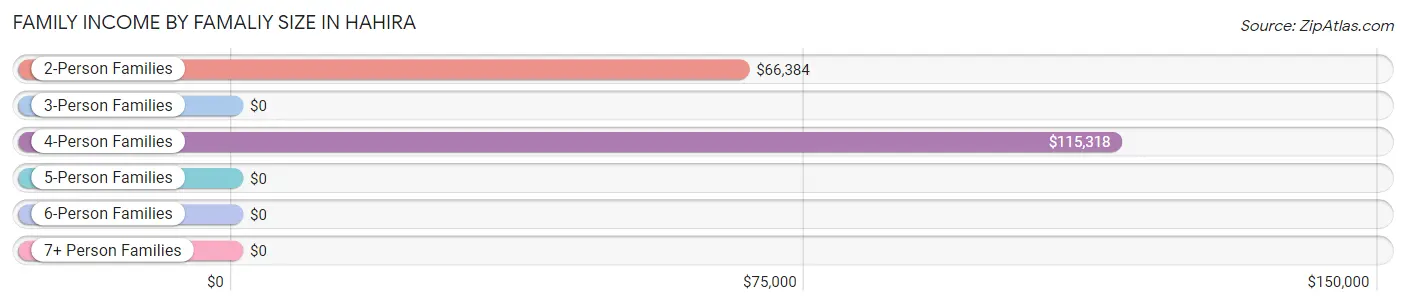
| Income Bracket | # Families | Median Income |
| 2-Person Families | 293 (35.0%) | $66,384 |
| 3-Person Families | 124 (14.8%) | $0 |
| 4-Person Families | 148 (17.7%) | $115,318 |
| 5-Person Families | 229 (27.4%) | $0 |
| 6-Person Families | 18 (2.1%) | $0 |
| 7+ Person Families | 25 (3.0%) | $0 |
| Total | 837 (100.0%) | $73,162 |
Family Income by Number of Earners in Hahira
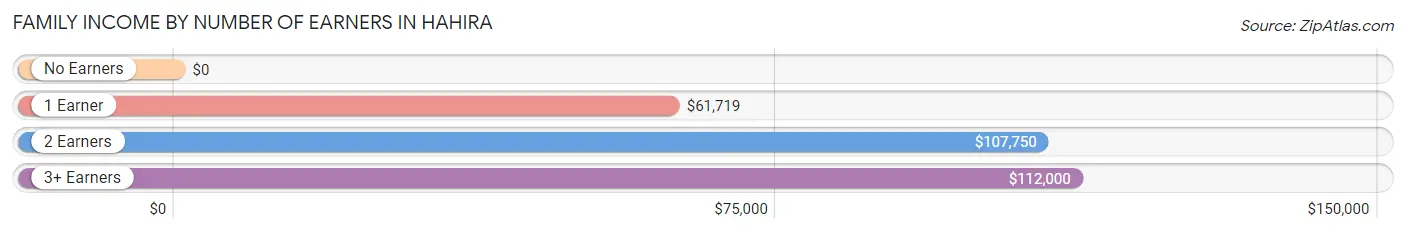
| Number of Earners | # Families | Median Income |
| No Earners | 58 (6.9%) | $0 |
| 1 Earner | 283 (33.8%) | $61,719 |
| 2 Earners | 396 (47.3%) | $107,750 |
| 3+ Earners | 100 (11.9%) | $112,000 |
| Total | 837 (100.0%) | $73,162 |
Household Income in Hahira
Household Income Brackets in Hahira
With 337 households falling in the category, the $50,000 to $74,999 income range is the most frequent in Hahira, accounting for 32.2% of all households. In contrast, only 28 households (2.7%) fall into the $200,000+ income bracket, making it the least populous group.
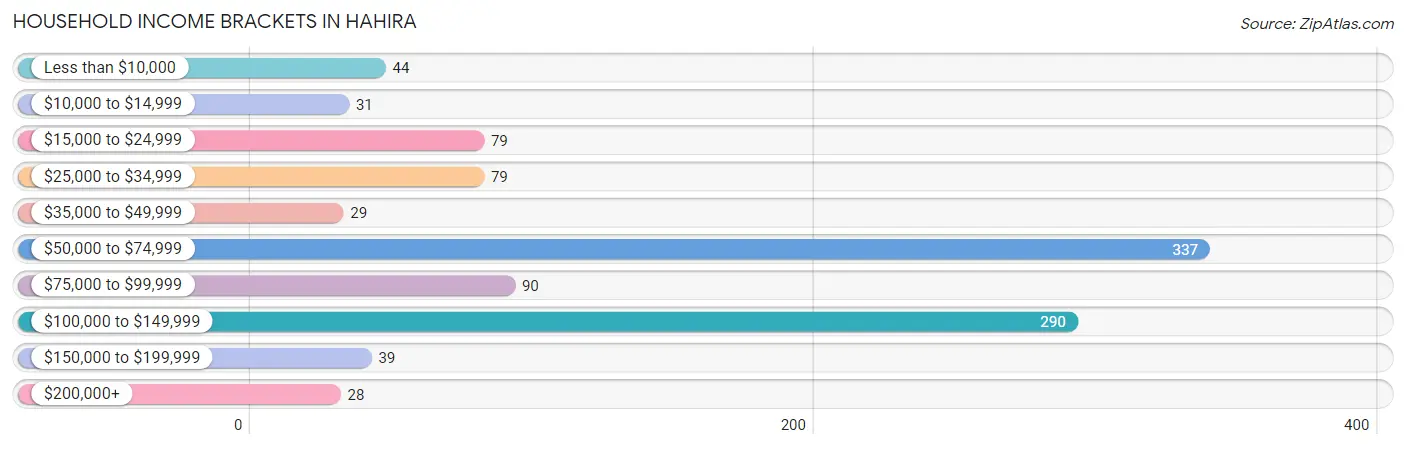
| Income Bracket | # Households | % Households |
| Less than $10,000 | 44 | 4.2% |
| $10,000 to $14,999 | 31 | 3.0% |
| $15,000 to $24,999 | 79 | 7.6% |
| $25,000 to $34,999 | 79 | 7.6% |
| $35,000 to $49,999 | 29 | 2.8% |
| $50,000 to $74,999 | 337 | 32.2% |
| $75,000 to $99,999 | 90 | 8.6% |
| $100,000 to $149,999 | 290 | 27.7% |
| $150,000 to $199,999 | 39 | 3.7% |
| $200,000+ | 28 | 2.7% |
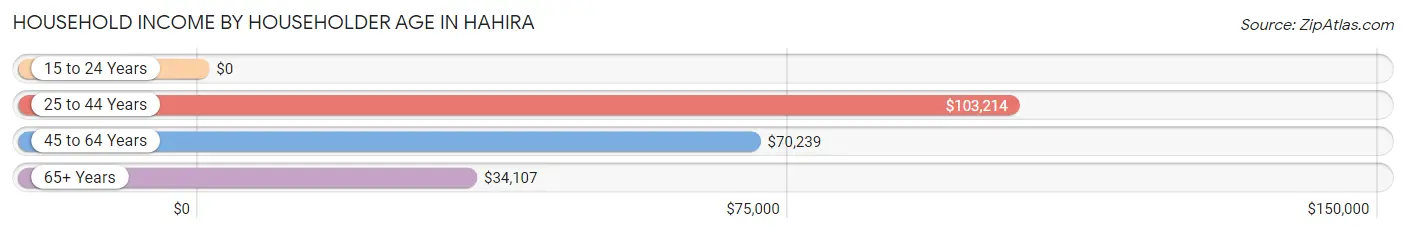
Household Income by Householder Age in Hahira
The median household income in Hahira is $67,143, with the highest median household income of $103,214 found in the 25 to 44 years age bracket for the primary householder. A total of 498 households (47.6%) fall into this category. Meanwhile, the 15 to 24 years age bracket for the primary householder has the lowest median household income of $0, with 103 households (9.9%) in this group.
| Income Bracket | # Households | Median Income |
| 15 to 24 Years | 103 (9.9%) | $0 |
| 25 to 44 Years | 498 (47.6%) | $103,214 |
| 45 to 64 Years | 257 (24.6%) | $70,239 |
| 65+ Years | 188 (18.0%) | $34,107 |
| Total | 1,046 (100.0%) | $67,143 |
Poverty in Hahira
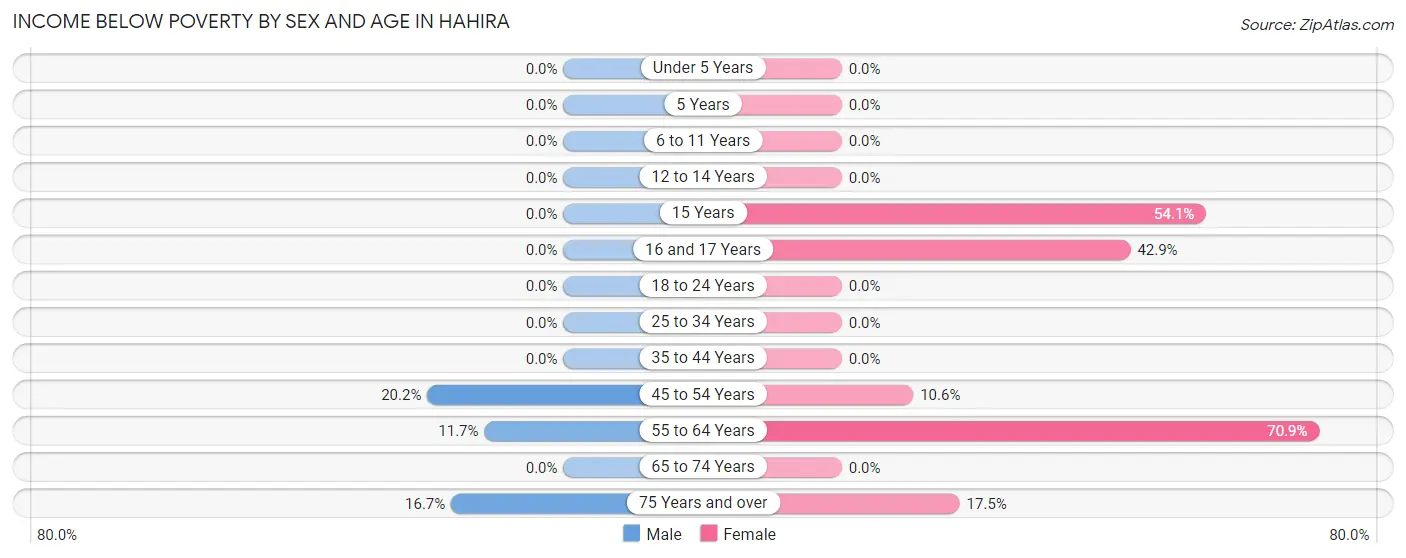
Income Below Poverty by Sex and Age in Hahira
With 3.8% poverty level for males and 8.2% for females among the residents of Hahira, 45 to 54 year old males and 55 to 64 year old females are the most vulnerable to poverty, with 19 males (20.2%) and 39 females (70.9%) in their respective age groups living below the poverty level.
| Age Bracket | Male | Female |
| Under 5 Years | 0 (0.0%) | 0 (0.0%) |
| 5 Years | 0 (0.0%) | 0 (0.0%) |
| 6 to 11 Years | 0 (0.0%) | 0 (0.0%) |
| 12 to 14 Years | 0 (0.0%) | 0 (0.0%) |
| 15 Years | 0 (0.0%) | 33 (54.1%) |
| 16 and 17 Years | 0 (0.0%) | 33 (42.9%) |
| 18 to 24 Years | 0 (0.0%) | 0 (0.0%) |
| 25 to 34 Years | 0 (0.0%) | 0 (0.0%) |
| 35 to 44 Years | 0 (0.0%) | 0 (0.0%) |
| 45 to 54 Years | 19 (20.2%) | 28 (10.6%) |
| 55 to 64 Years | 23 (11.7%) | 39 (70.9%) |
| 65 to 74 Years | 0 (0.0%) | 0 (0.0%) |
| 75 Years and over | 17 (16.7%) | 14 (17.5%) |
| Total | 59 (3.8%) | 147 (8.2%) |
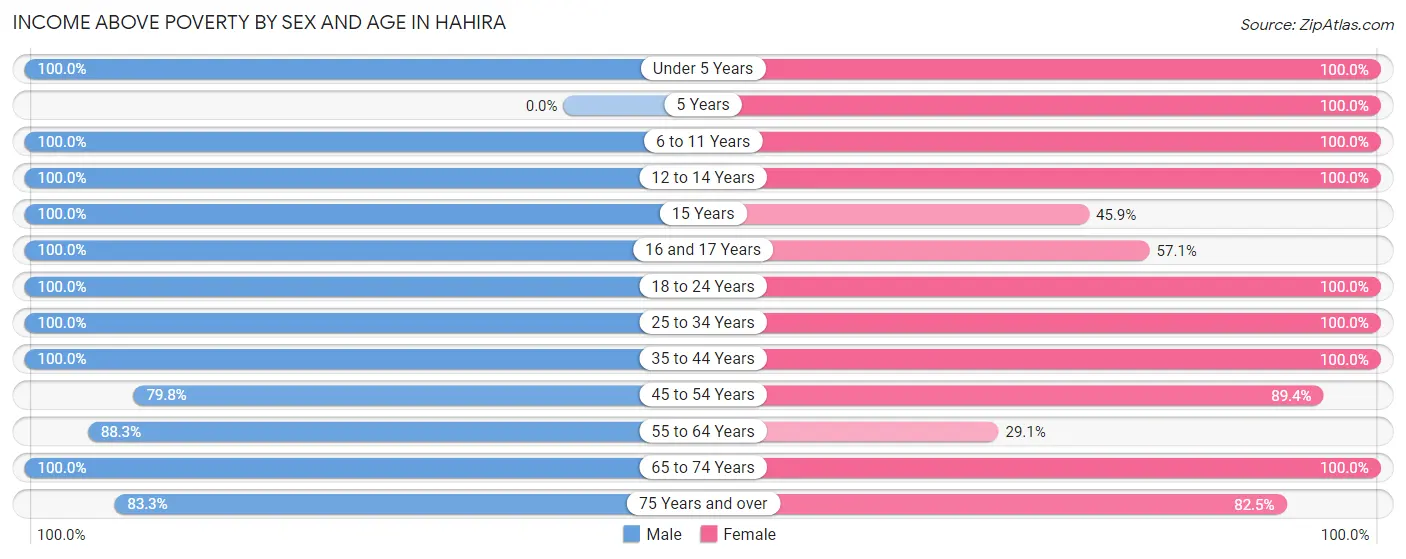
Income Above Poverty by Sex and Age in Hahira
According to the poverty statistics in Hahira, males aged under 5 years and females aged under 5 years are the age groups that are most secure financially, with 100.0% of males and 100.0% of females in these age groups living above the poverty line.
| Age Bracket | Male | Female |
| Under 5 Years | 267 (100.0%) | 273 (100.0%) |
| 5 Years | 0 (0.0%) | 16 (100.0%) |
| 6 to 11 Years | 84 (100.0%) | 116 (100.0%) |
| 12 to 14 Years | 50 (100.0%) | 93 (100.0%) |
| 15 Years | 70 (100.0%) | 28 (45.9%) |
| 16 and 17 Years | 59 (100.0%) | 44 (57.1%) |
| 18 to 24 Years | 241 (100.0%) | 238 (100.0%) |
| 25 to 34 Years | 134 (100.0%) | 239 (100.0%) |
| 35 to 44 Years | 245 (100.0%) | 211 (100.0%) |
| 45 to 54 Years | 75 (79.8%) | 236 (89.4%) |
| 55 to 64 Years | 173 (88.3%) | 16 (29.1%) |
| 65 to 74 Years | 25 (100.0%) | 71 (100.0%) |
| 75 Years and over | 85 (83.3%) | 66 (82.5%) |
| Total | 1,508 (96.2%) | 1,647 (91.8%) |
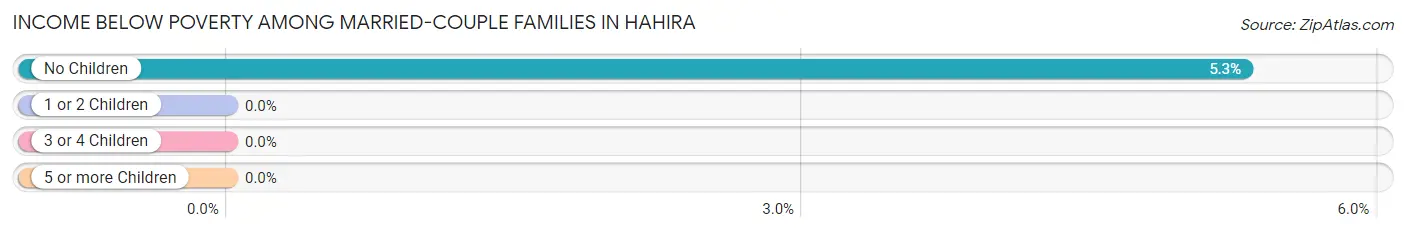
Income Below Poverty Among Married-Couple Families in Hahira
The poverty statistics for married-couple families in Hahira show that 2.5% or 17 of the total 673 families live below the poverty line. Families with no children have the highest poverty rate of 5.3%, comprising of 17 families. On the other hand, families with 1 or 2 children have the lowest poverty rate of 0.0%, which includes 0 families.
| Children | Above Poverty | Below Poverty |
| No Children | 304 (94.7%) | 17 (5.3%) |
| 1 or 2 Children | 122 (100.0%) | 0 (0.0%) |
| 3 or 4 Children | 230 (100.0%) | 0 (0.0%) |
| 5 or more Children | 0 (0.0%) | 0 (0.0%) |
| Total | 656 (97.5%) | 17 (2.5%) |
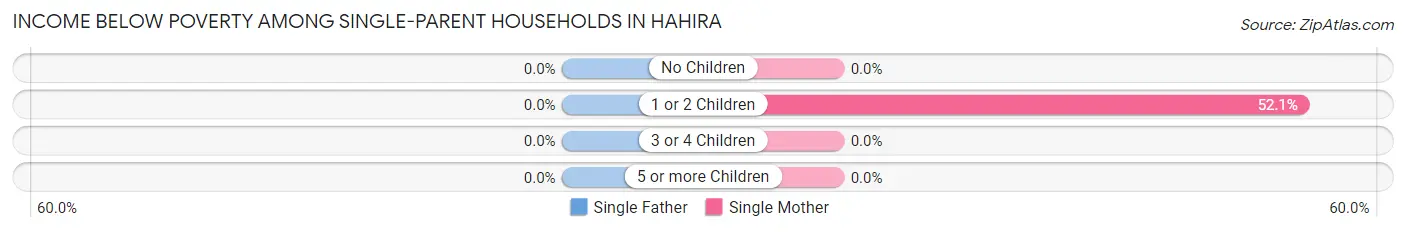
Income Below Poverty Among Single-Parent Households in Hahira
| Children | Single Father | Single Mother |
| No Children | 0 (0.0%) | 0 (0.0%) |
| 1 or 2 Children | 0 (0.0%) | 25 (52.1%) |
| 3 or 4 Children | 0 (0.0%) | 0 (0.0%) |
| 5 or more Children | 0 (0.0%) | 0 (0.0%) |
| Total | 0 (0.0%) | 25 (18.7%) |
Income Below Poverty Among Married-Couple vs Single-Parent Households in Hahira
The poverty data for Hahira shows that 17 of the married-couple family households (2.5%) and 25 of the single-parent households (15.2%) are living below the poverty level. Within the married-couple family households, those with no children have the highest poverty rate, with 17 households (5.3%) falling below the poverty line. Among the single-parent households, those with 1 or 2 children have the highest poverty rate, with 25 household (32.1%) living below poverty.
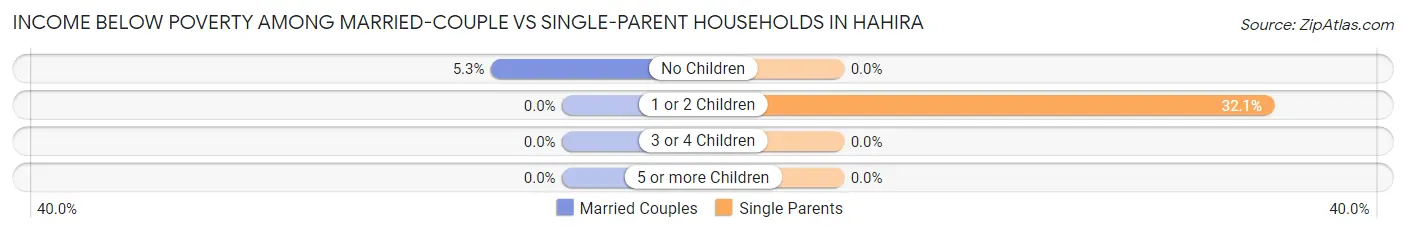
| Children | Married-Couple Families | Single-Parent Households |
| No Children | 17 (5.3%) | 0 (0.0%) |
| 1 or 2 Children | 0 (0.0%) | 25 (32.1%) |
| 3 or 4 Children | 0 (0.0%) | 0 (0.0%) |
| 5 or more Children | 0 (0.0%) | 0 (0.0%) |
| Total | 17 (2.5%) | 25 (15.2%) |
Race in Hahira
The most populous races in Hahira are White / Caucasian (2,431 | 72.3%), Black / African American (479 | 14.2%), and Hispanic or Latino (313 | 9.3%).
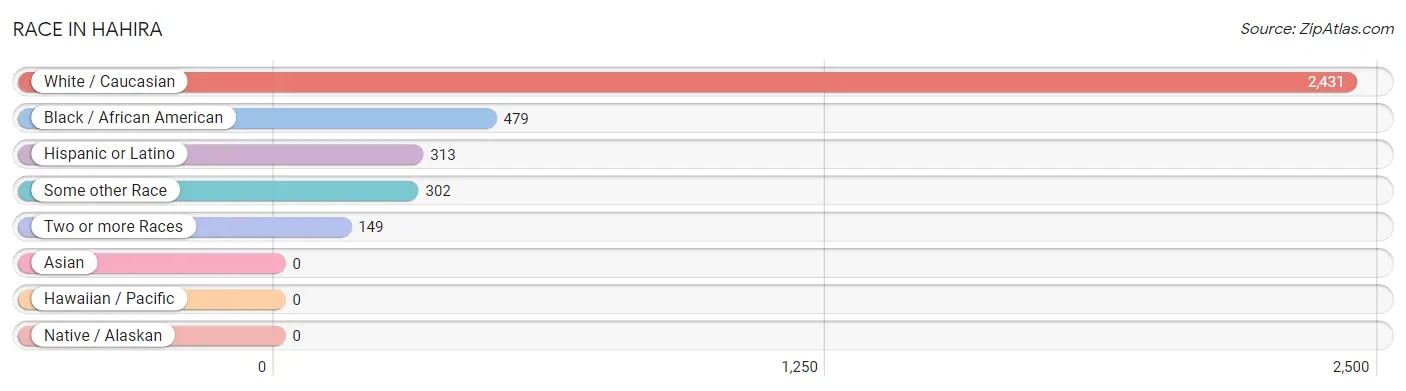
| Race | # Population | % Population |
| Asian | 0 | 0.0% |
| Black / African American | 479 | 14.2% |
| Hawaiian / Pacific | 0 | 0.0% |
| Hispanic or Latino | 313 | 9.3% |
| Native / Alaskan | 0 | 0.0% |
| White / Caucasian | 2,431 | 72.3% |
| Two or more Races | 149 | 4.4% |
| Some other Race | 302 | 9.0% |
| Total | 3,361 | 100.0% |
Ancestry in Hahira
The most populous ancestries reported in Hahira are German (389 | 11.6%), Puerto Rican (274 | 8.2%), Scottish (202 | 6.0%), Irish (186 | 5.5%), and American (155 | 4.6%), together accounting for 35.9% of all Hahira residents.
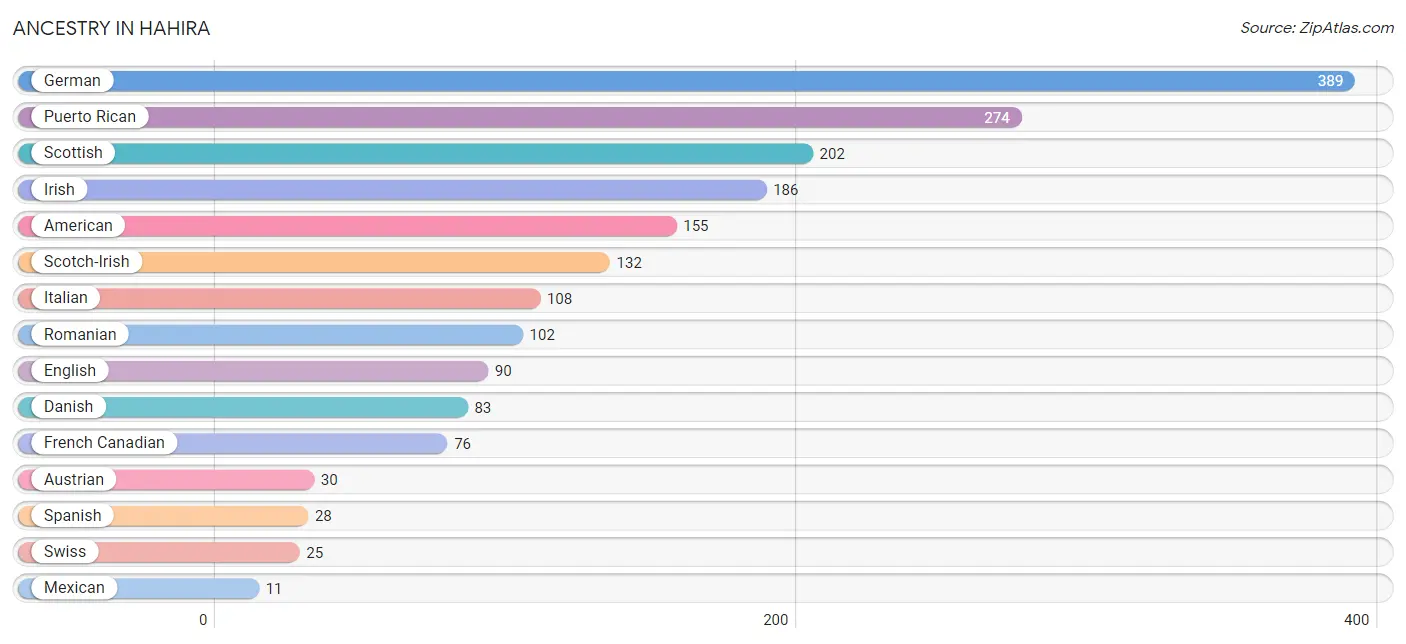
| Ancestry | # Population | % Population |
| American | 155 | 4.6% |
| Austrian | 30 | 0.9% |
| Danish | 83 | 2.5% |
| English | 90 | 2.7% |
| French Canadian | 76 | 2.3% |
| German | 389 | 11.6% |
| Irish | 186 | 5.5% |
| Italian | 108 | 3.2% |
| Mexican | 11 | 0.3% |
| Puerto Rican | 274 | 8.2% |
| Romanian | 102 | 3.0% |
| Scotch-Irish | 132 | 3.9% |
| Scottish | 202 | 6.0% |
| Spanish | 28 | 0.8% |
| Swiss | 25 | 0.7% | View All 15 Rows |
Immigrants in Hahira
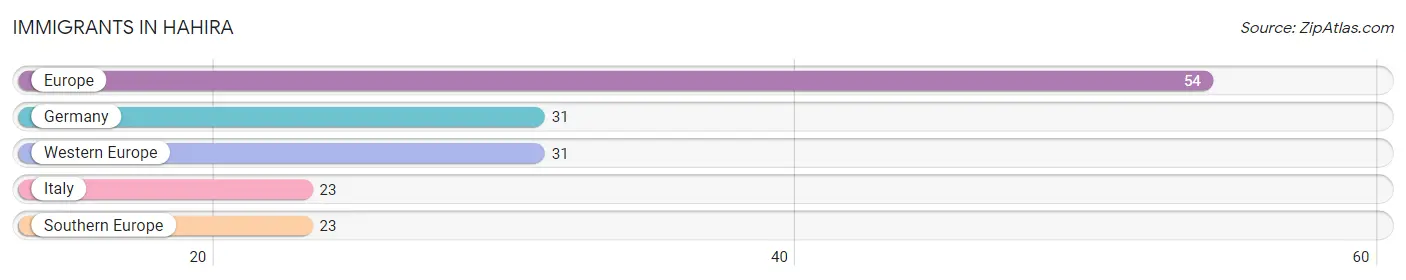
The most numerous immigrant groups reported in Hahira came from Europe (54 | 1.6%), Germany (31 | 0.9%), Western Europe (31 | 0.9%), Italy (23 | 0.7%), and Southern Europe (23 | 0.7%), together accounting for 4.8% of all Hahira residents.
| Immigration Origin | # Population | % Population |
| Europe | 54 | 1.6% |
| Germany | 31 | 0.9% |
| Italy | 23 | 0.7% |
| Southern Europe | 23 | 0.7% |
| Western Europe | 31 | 0.9% | View All 5 Rows |
Sex and Age in Hahira
Sex and Age in Hahira
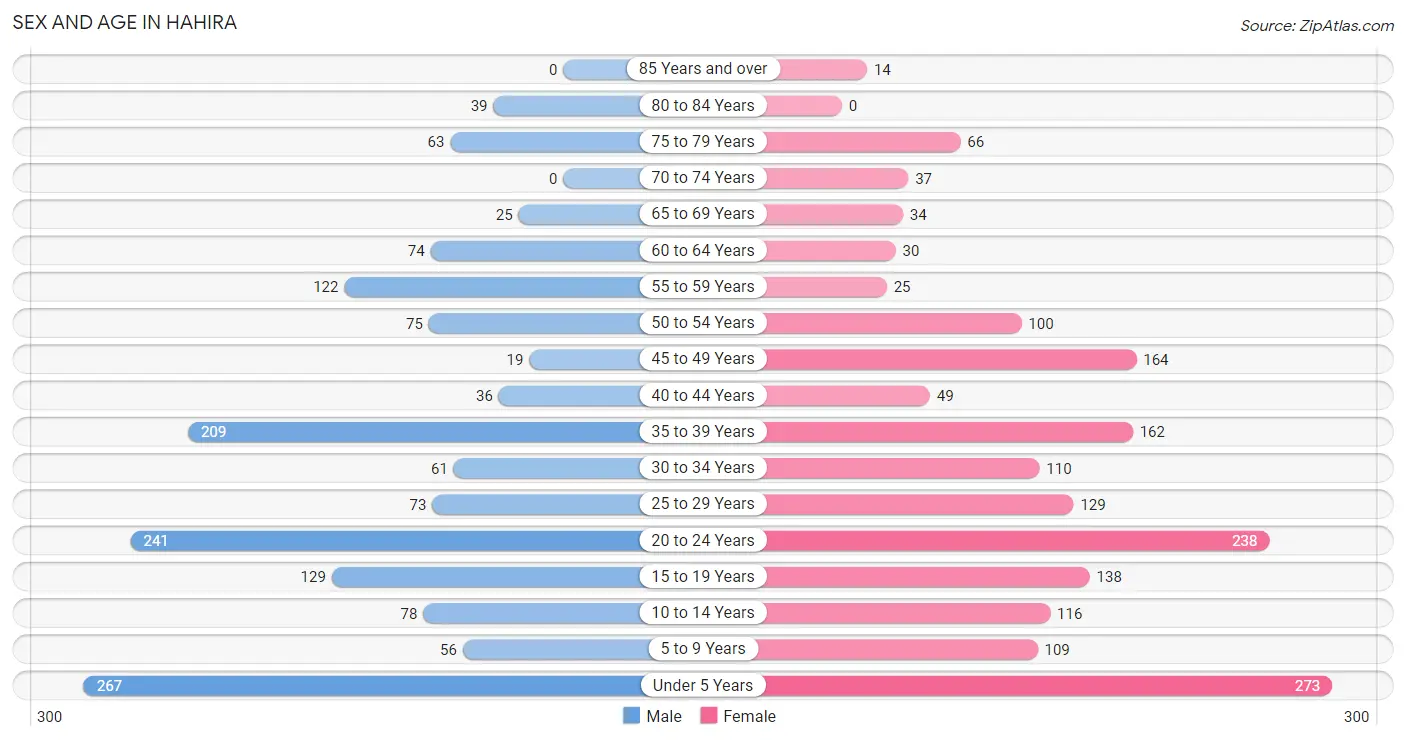
The most populous age groups in Hahira are Under 5 Years (267 | 17.0%) for men and Under 5 Years (273 | 15.2%) for women.
| Age Bracket | Male | Female |
| Under 5 Years | 267 (17.0%) | 273 (15.2%) |
| 5 to 9 Years | 56 (3.6%) | 109 (6.1%) |
| 10 to 14 Years | 78 (5.0%) | 116 (6.5%) |
| 15 to 19 Years | 129 (8.2%) | 138 (7.7%) |
| 20 to 24 Years | 241 (15.4%) | 238 (13.3%) |
| 25 to 29 Years | 73 (4.7%) | 129 (7.2%) |
| 30 to 34 Years | 61 (3.9%) | 110 (6.1%) |
| 35 to 39 Years | 209 (13.3%) | 162 (9.0%) |
| 40 to 44 Years | 36 (2.3%) | 49 (2.7%) |
| 45 to 49 Years | 19 (1.2%) | 164 (9.1%) |
| 50 to 54 Years | 75 (4.8%) | 100 (5.6%) |
| 55 to 59 Years | 122 (7.8%) | 25 (1.4%) |
| 60 to 64 Years | 74 (4.7%) | 30 (1.7%) |
| 65 to 69 Years | 25 (1.6%) | 34 (1.9%) |
| 70 to 74 Years | 0 (0.0%) | 37 (2.1%) |
| 75 to 79 Years | 63 (4.0%) | 66 (3.7%) |
| 80 to 84 Years | 39 (2.5%) | 0 (0.0%) |
| 85 Years and over | 0 (0.0%) | 14 (0.8%) |
| Total | 1,567 (100.0%) | 1,794 (100.0%) |
Families and Households in Hahira
Median Family Size in Hahira
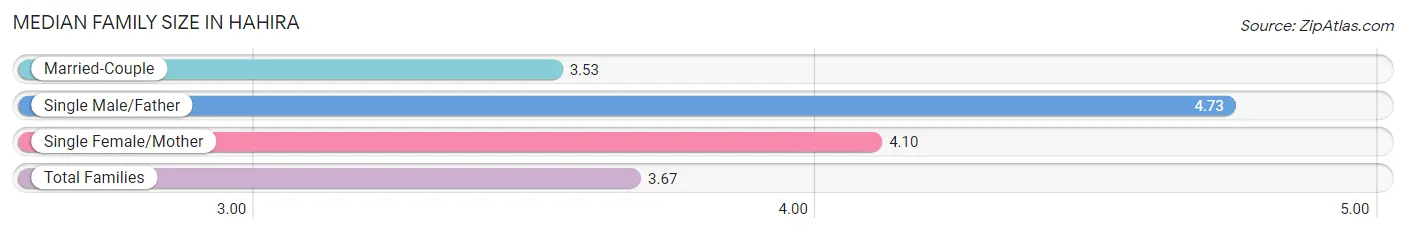
The median family size in Hahira is 3.67 persons per family, with single male/father families (30 | 3.6%) accounting for the largest median family size of 4.73 persons per family. On the other hand, married-couple families (673 | 80.4%) represent the smallest median family size with 3.53 persons per family.
| Family Type | # Families | Family Size |
| Married-Couple | 673 (80.4%) | 3.53 |
| Single Male/Father | 30 (3.6%) | 4.73 |
| Single Female/Mother | 134 (16.0%) | 4.10 |
| Total Families | 837 (100.0%) | 3.67 |
Median Household Size in Hahira
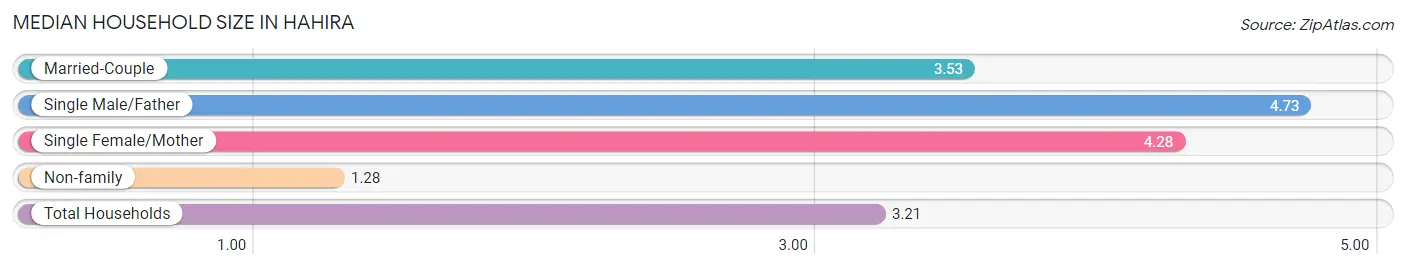
The median household size in Hahira is 3.21 persons per household, with single male/father households (30 | 2.9%) accounting for the largest median household size of 4.73 persons per household. non-family households (209 | 20.0%) represent the smallest median household size with 1.28 persons per household.
| Household Type | # Households | Household Size |
| Married-Couple | 673 (64.3%) | 3.53 |
| Single Male/Father | 30 (2.9%) | 4.73 |
| Single Female/Mother | 134 (12.8%) | 4.28 |
| Non-family | 209 (20.0%) | 1.28 |
| Total Households | 1,046 (100.0%) | 3.21 |
Household Size by Marriage Status in Hahira
Out of a total of 1,046 households in Hahira, 837 (80.0%) are family households, while 209 (20.0%) are nonfamily households. The most numerous type of family households are 2-person households, comprising 293, and the most common type of nonfamily households are 1-person households, comprising 164.
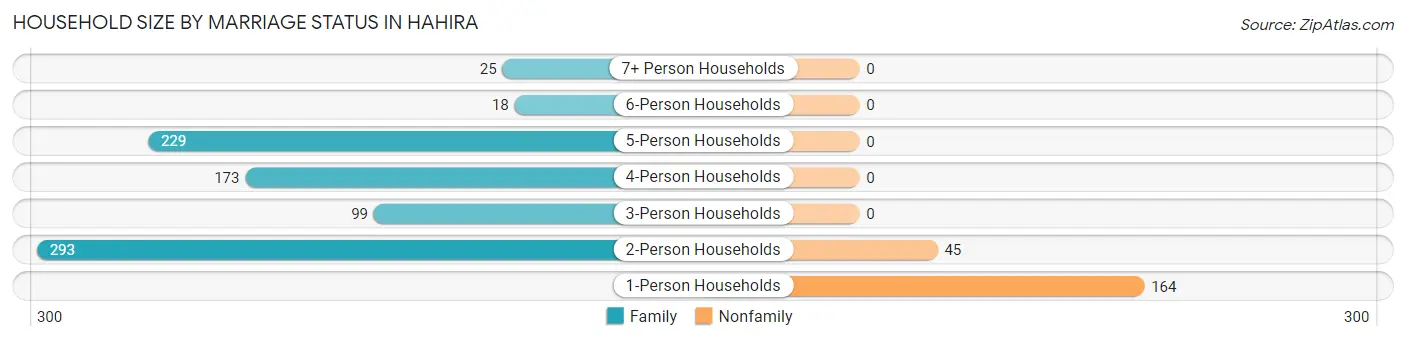
| Household Size | Family Households | Nonfamily Households |
| 1-Person Households | - | 164 (15.7%) |
| 2-Person Households | 293 (28.0%) | 45 (4.3%) |
| 3-Person Households | 99 (9.5%) | 0 (0.0%) |
| 4-Person Households | 173 (16.5%) | 0 (0.0%) |
| 5-Person Households | 229 (21.9%) | 0 (0.0%) |
| 6-Person Households | 18 (1.7%) | 0 (0.0%) |
| 7+ Person Households | 25 (2.4%) | 0 (0.0%) |
| Total | 837 (80.0%) | 209 (20.0%) |
Female Fertility in Hahira
Fertility by Age in Hahira
Average fertility rate in Hahira is 132.0 births per 1,000 women. Women in the age bracket of 20 to 34 years have the highest fertility rate with 279.0 births per 1,000 women. Women in the age bracket of 20 to 34 years acount for 100.0% of all women with births.
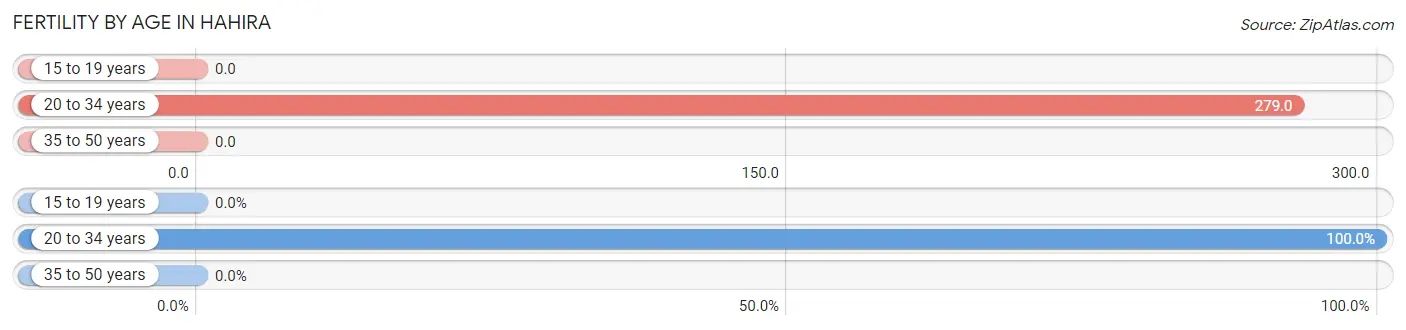
| Age Bracket | Women with Births | Births / 1,000 Women |
| 15 to 19 years | 0 (0.0%) | 0.0 |
| 20 to 34 years | 133 (100.0%) | 279.0 |
| 35 to 50 years | 0 (0.0%) | 0.0 |
| Total | 133 (100.0%) | 132.0 |
Fertility by Age by Marriage Status in Hahira
73.7% of women with births (133) in Hahira are married. The highest percentage of unmarried women with births falls into 20 to 34 years age bracket with 26.3% of them unmarried at the time of birth, while the lowest percentage of unmarried women with births belong to 20 to 34 years age bracket with 26.3% of them unmarried.
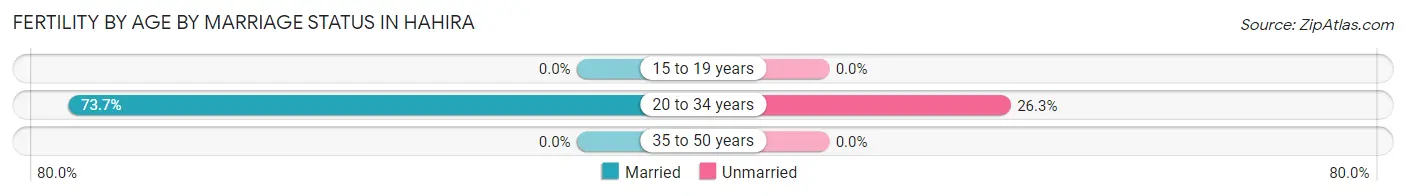
| Age Bracket | Married | Unmarried |
| 15 to 19 years | 0 (0.0%) | 0 (0.0%) |
| 20 to 34 years | 98 (73.7%) | 35 (26.3%) |
| 35 to 50 years | 0 (0.0%) | 0 (0.0%) |
| Total | 98 (73.7%) | 35 (26.3%) |
Fertility by Education in Hahira
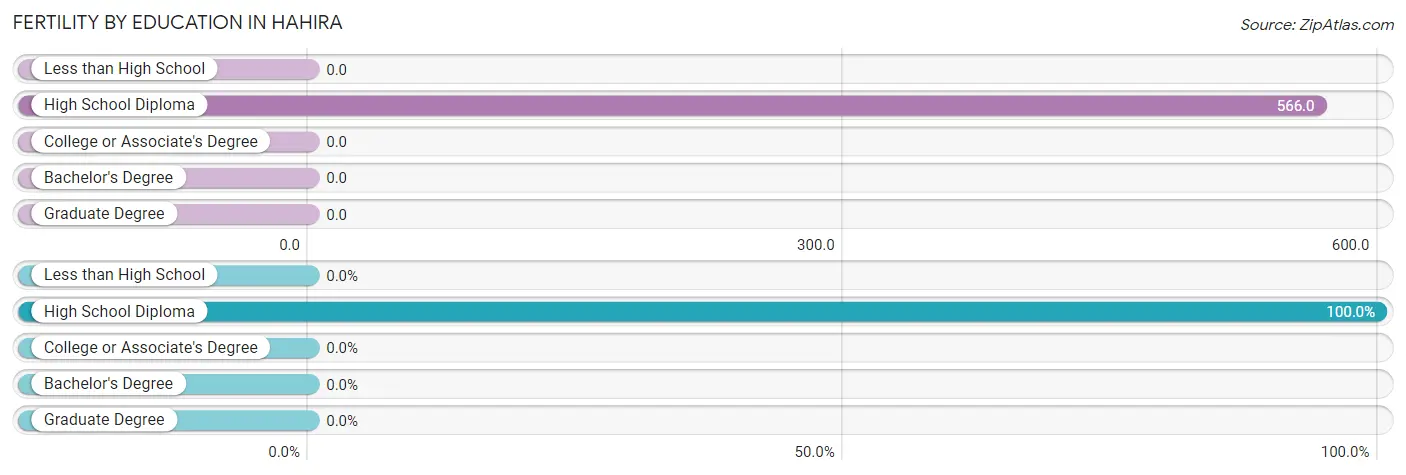
| Educational Attainment | Women with Births | Births / 1,000 Women |
| Less than High School | 0 (0.0%) | 0.0 |
| High School Diploma | 133 (100.0%) | 566.0 |
| College or Associate's Degree | 0 (0.0%) | 0.0 |
| Bachelor's Degree | 0 (0.0%) | 0.0 |
| Graduate Degree | 0 (0.0%) | 0.0 |
| Total | 133 (100.0%) | 132.0 |
Fertility by Education by Marriage Status in Hahira
26.3% of women with births in Hahira are unmarried. Women with the educational attainment of high school diploma are most likely to be married with 73.7% of them married at childbirth, while women with the educational attainment of high school diploma are least likely to be married with 26.3% of them unmarried at childbirth.
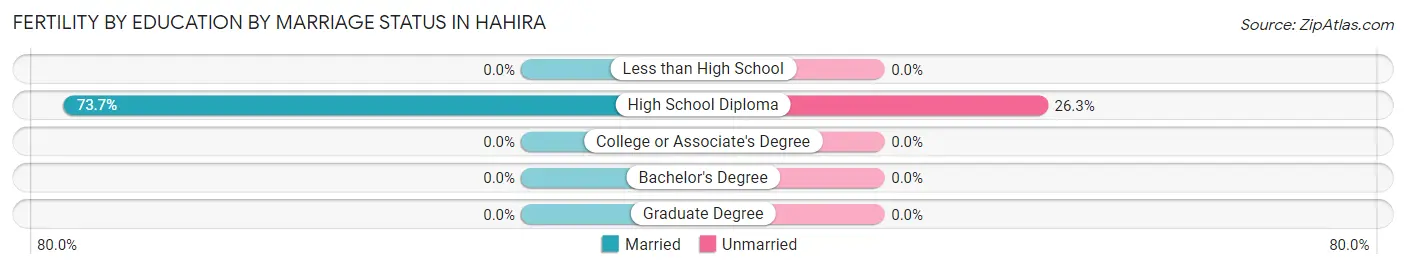
| Educational Attainment | Married | Unmarried |
| Less than High School | 0 (0.0%) | 0 (0.0%) |
| High School Diploma | 98 (73.7%) | 35 (26.3%) |
| College or Associate's Degree | 0 (0.0%) | 0 (0.0%) |
| Bachelor's Degree | 0 (0.0%) | 0 (0.0%) |
| Graduate Degree | 0 (0.0%) | 0 (0.0%) |
| Total | 98 (73.7%) | 35 (26.3%) |
Employment Characteristics in Hahira
Employment by Class of Employer in Hahira
Among the 1,539 employed individuals in Hahira, private company employees (879 | 57.1%), state government employees (246 | 16.0%), and local government employees (173 | 11.2%) make up the most common classes of employment.
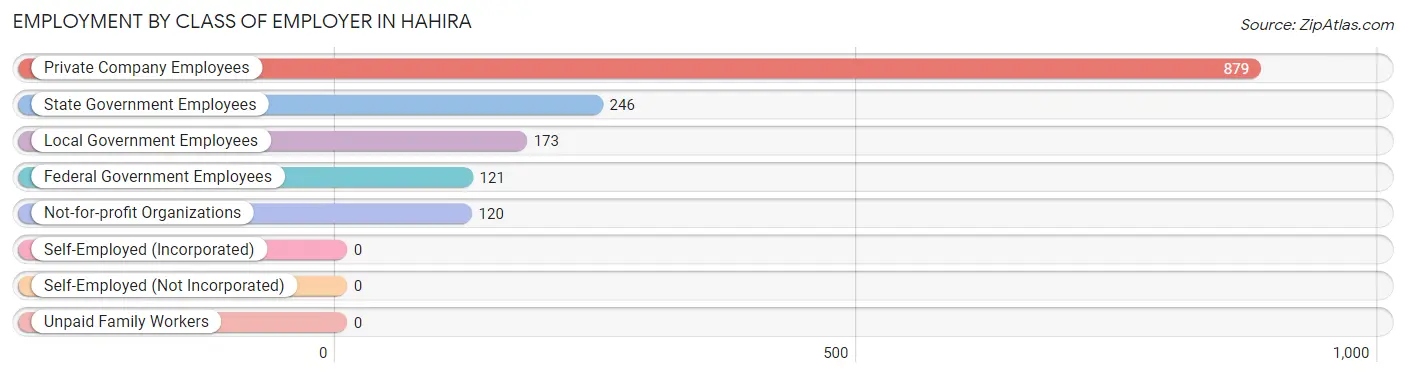
| Employer Class | # Employees | % Employees |
| Private Company Employees | 879 | 57.1% |
| Self-Employed (Incorporated) | 0 | 0.0% |
| Self-Employed (Not Incorporated) | 0 | 0.0% |
| Not-for-profit Organizations | 120 | 7.8% |
| Local Government Employees | 173 | 11.2% |
| State Government Employees | 246 | 16.0% |
| Federal Government Employees | 121 | 7.9% |
| Unpaid Family Workers | 0 | 0.0% |
| Total | 1,539 | 100.0% |
Employment Status by Age in Hahira
According to the labor force statistics for Hahira, out of the total population over 16 years of age (2,331), 69.3% or 1,615 individuals are in the labor force, with 5.0% or 81 of them unemployed. The age group with the highest labor force participation rate is 35 to 44 years, with 94.3% or 430 individuals in the labor force. Within the labor force, the 16 to 19 years age range has the highest percentage of unemployed individuals, with 69.2% or 36 of them being unemployed.
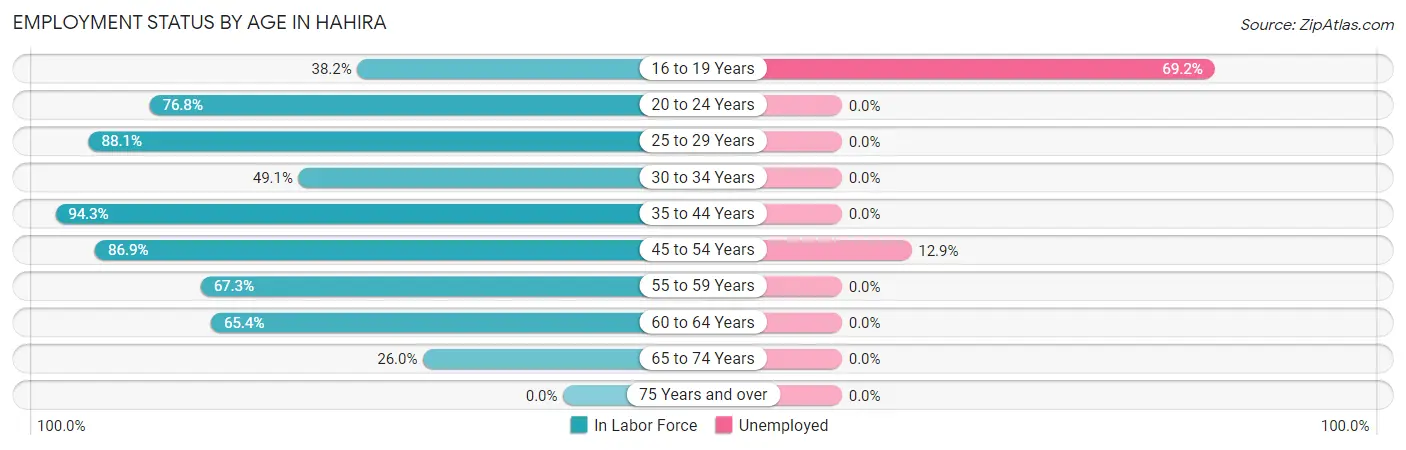
| Age Bracket | In Labor Force | Unemployed |
| 16 to 19 Years | 52 (38.2%) | 36 (69.2%) |
| 20 to 24 Years | 368 (76.8%) | 0 (0.0%) |
| 25 to 29 Years | 178 (88.1%) | 0 (0.0%) |
| 30 to 34 Years | 84 (49.1%) | 0 (0.0%) |
| 35 to 44 Years | 430 (94.3%) | 0 (0.0%) |
| 45 to 54 Years | 311 (86.9%) | 40 (12.9%) |
| 55 to 59 Years | 99 (67.3%) | 0 (0.0%) |
| 60 to 64 Years | 68 (65.4%) | 0 (0.0%) |
| 65 to 74 Years | 25 (26.0%) | 0 (0.0%) |
| 75 Years and over | 0 (0.0%) | 0 (0.0%) |
| Total | 1,615 (69.3%) | 81 (5.0%) |
Employment Status by Educational Attainment in Hahira
According to labor force statistics for Hahira, 81.4% of individuals (1,171) out of the total population between 25 and 64 years of age (1,438) are in the labor force, with 3.7% or 43 of them being unemployed. The group with the highest labor force participation rate are those with the educational attainment of bachelor's degree or higher, with 95.1% or 428 individuals in the labor force. Within the labor force, individuals with college / associate degree education have the highest percentage of unemployment, with 9.8% or 49 of them being unemployed.
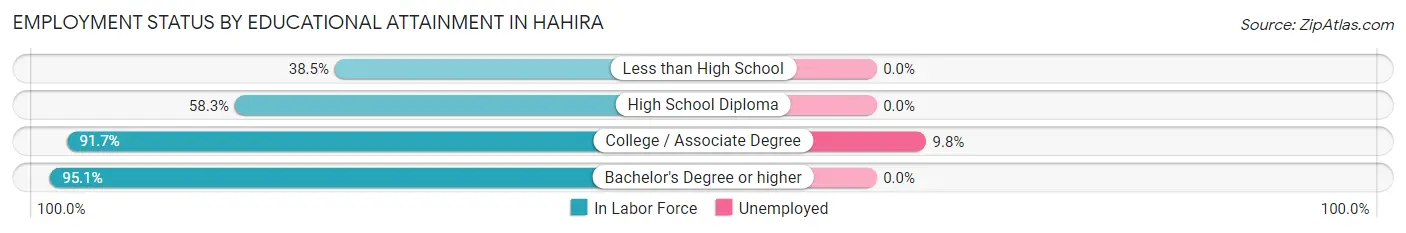
| Educational Attainment | In Labor Force | Unemployed |
| Less than High School | 30 (38.5%) | 0 (0.0%) |
| High School Diploma | 214 (58.3%) | 0 (0.0%) |
| College / Associate Degree | 498 (91.7%) | 53 (9.8%) |
| Bachelor's Degree or higher | 428 (95.1%) | 0 (0.0%) |
| Total | 1,171 (81.4%) | 53 (3.7%) |
Employment Occupations by Sex in Hahira
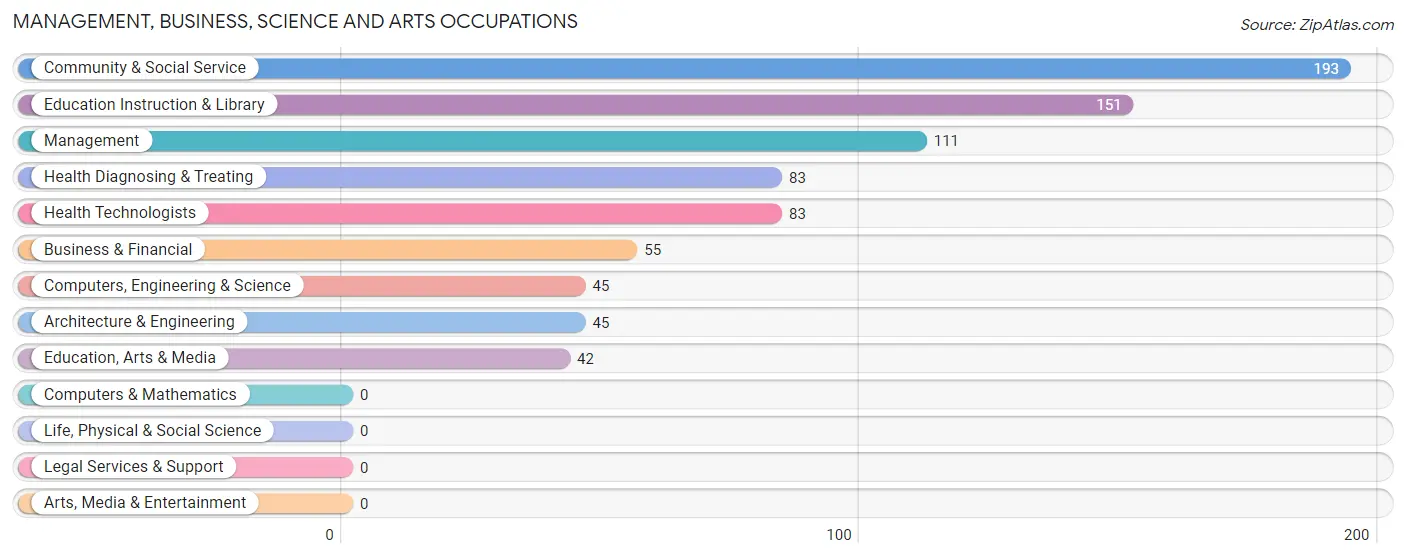
Management, Business, Science and Arts Occupations
The most common Management, Business, Science and Arts occupations in Hahira are Community & Social Service (193 | 13.3%), Education Instruction & Library (151 | 10.4%), Management (111 | 7.7%), Health Diagnosing & Treating (83 | 5.7%), and Health Technologists (83 | 5.7%).
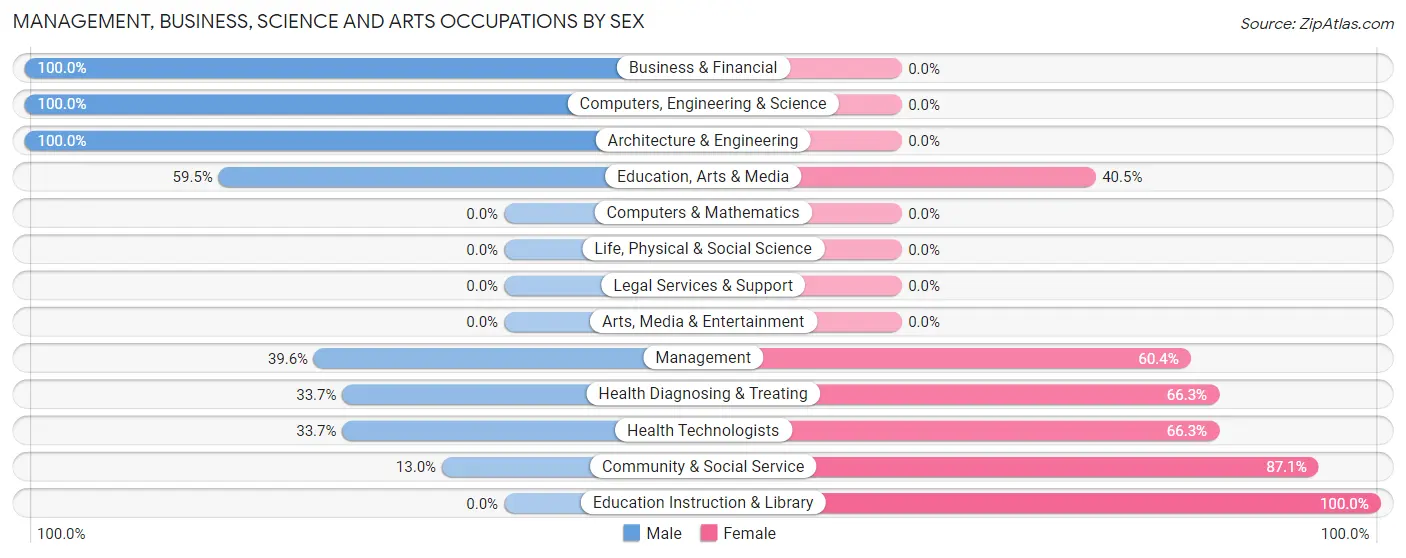
Management, Business, Science and Arts Occupations by Sex
Within the Management, Business, Science and Arts occupations in Hahira, the most male-oriented occupations are Business & Financial (100.0%), Computers, Engineering & Science (100.0%), and Architecture & Engineering (100.0%), while the most female-oriented occupations are Education Instruction & Library (100.0%), Community & Social Service (87.1%), and Health Diagnosing & Treating (66.3%).
| Occupation | Male | Female |
| Management | 44 (39.6%) | 67 (60.4%) |
| Business & Financial | 55 (100.0%) | 0 (0.0%) |
| Computers, Engineering & Science | 45 (100.0%) | 0 (0.0%) |
| Computers & Mathematics | 0 (0.0%) | 0 (0.0%) |
| Architecture & Engineering | 45 (100.0%) | 0 (0.0%) |
| Life, Physical & Social Science | 0 (0.0%) | 0 (0.0%) |
| Community & Social Service | 25 (13.0%) | 168 (87.1%) |
| Education, Arts & Media | 25 (59.5%) | 17 (40.5%) |
| Legal Services & Support | 0 (0.0%) | 0 (0.0%) |
| Education Instruction & Library | 0 (0.0%) | 151 (100.0%) |
| Arts, Media & Entertainment | 0 (0.0%) | 0 (0.0%) |
| Health Diagnosing & Treating | 28 (33.7%) | 55 (66.3%) |
| Health Technologists | 28 (33.7%) | 55 (66.3%) |
| Total (Category) | 197 (40.5%) | 290 (59.6%) |
| Total (Overall) | 731 (50.4%) | 719 (49.6%) |
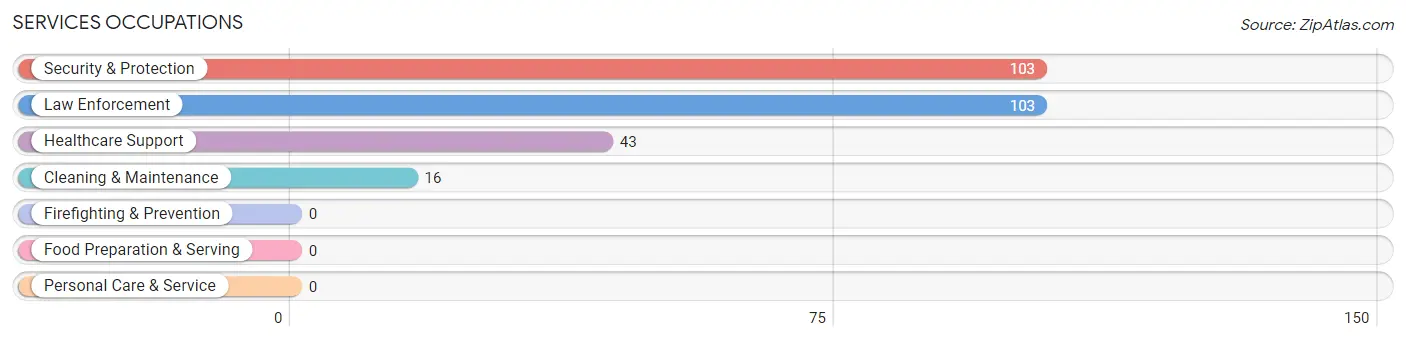
Services Occupations
The most common Services occupations in Hahira are Security & Protection (103 | 7.1%), Law Enforcement (103 | 7.1%), Healthcare Support (43 | 3.0%), and Cleaning & Maintenance (16 | 1.1%).
Services Occupations by Sex
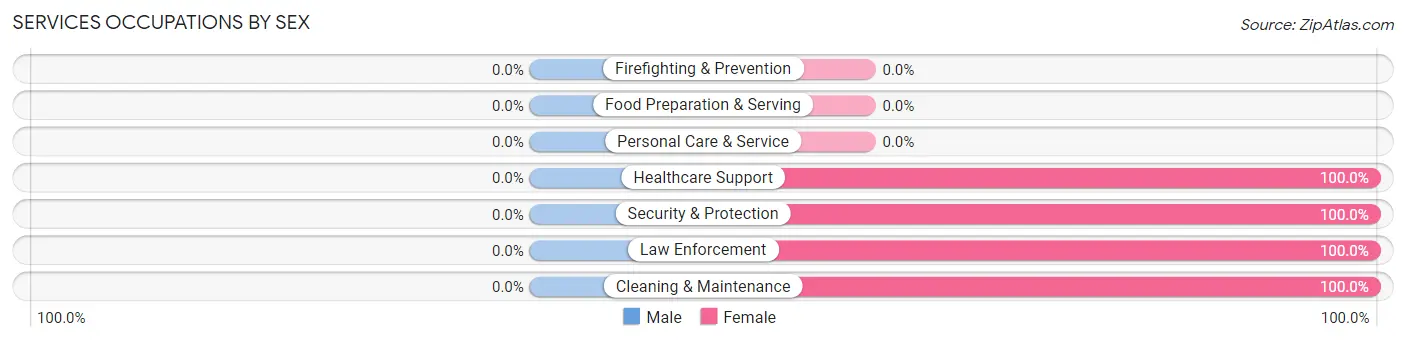
| Occupation | Male | Female |
| Healthcare Support | 0 (0.0%) | 43 (100.0%) |
| Security & Protection | 0 (0.0%) | 103 (100.0%) |
| Firefighting & Prevention | 0 (0.0%) | 0 (0.0%) |
| Law Enforcement | 0 (0.0%) | 103 (100.0%) |
| Food Preparation & Serving | 0 (0.0%) | 0 (0.0%) |
| Cleaning & Maintenance | 0 (0.0%) | 16 (100.0%) |
| Personal Care & Service | 0 (0.0%) | 0 (0.0%) |
| Total (Category) | 0 (0.0%) | 162 (100.0%) |
| Total (Overall) | 731 (50.4%) | 719 (49.6%) |
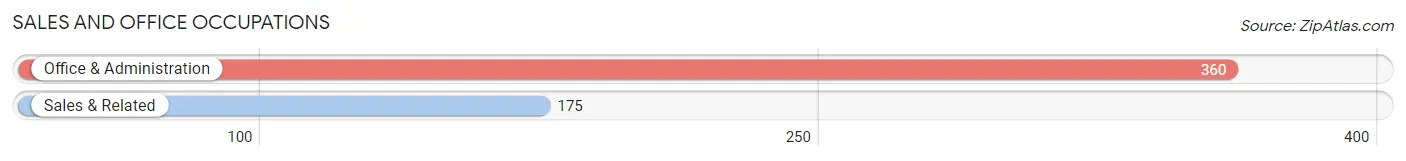
Sales and Office Occupations
The most common Sales and Office occupations in Hahira are Office & Administration (360 | 24.8%), and Sales & Related (175 | 12.1%).
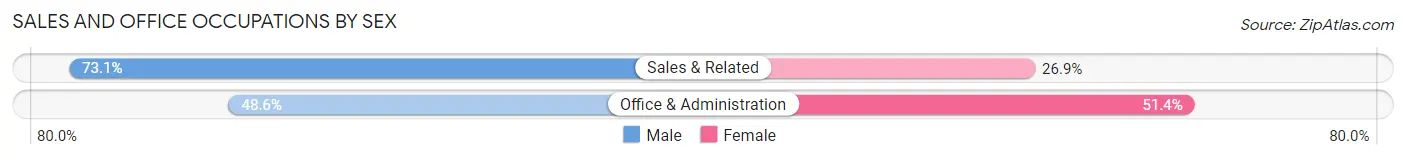
Sales and Office Occupations by Sex
| Occupation | Male | Female |
| Sales & Related | 128 (73.1%) | 47 (26.9%) |
| Office & Administration | 175 (48.6%) | 185 (51.4%) |
| Total (Category) | 303 (56.6%) | 232 (43.4%) |
| Total (Overall) | 731 (50.4%) | 719 (49.6%) |
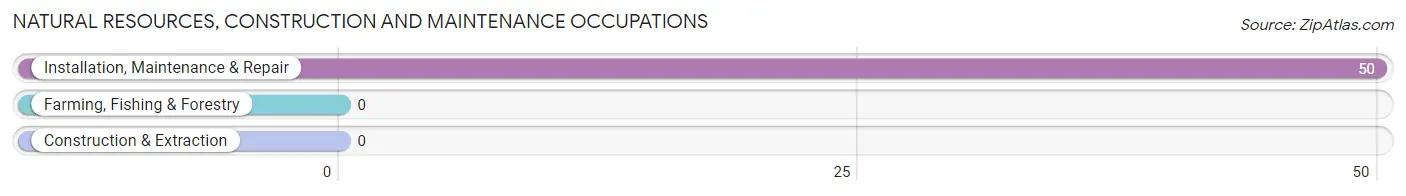
Natural Resources, Construction and Maintenance Occupations
The most common Natural Resources, Construction and Maintenance occupations in Hahira are , and Installation, Maintenance & Repair (50 | 3.5%).
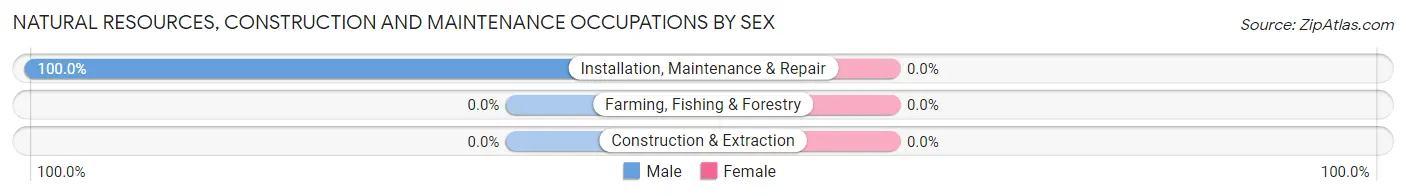
Natural Resources, Construction and Maintenance Occupations by Sex
| Occupation | Male | Female |
| Farming, Fishing & Forestry | 0 (0.0%) | 0 (0.0%) |
| Construction & Extraction | 0 (0.0%) | 0 (0.0%) |
| Installation, Maintenance & Repair | 50 (100.0%) | 0 (0.0%) |
| Total (Category) | 50 (100.0%) | 0 (0.0%) |
| Total (Overall) | 731 (50.4%) | 719 (49.6%) |
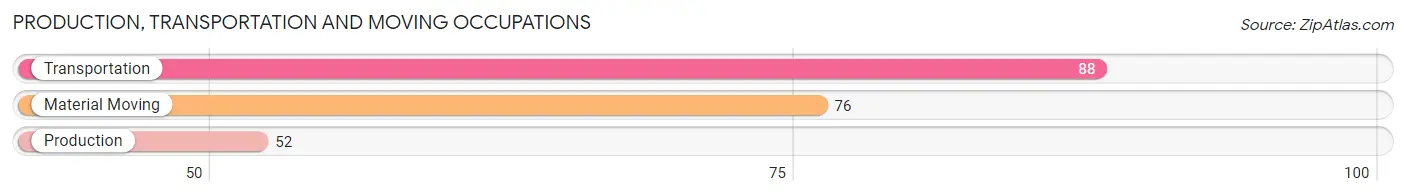
Production, Transportation and Moving Occupations
The most common Production, Transportation and Moving occupations in Hahira are Transportation (88 | 6.1%), Material Moving (76 | 5.2%), and Production (52 | 3.6%).
Production, Transportation and Moving Occupations by Sex
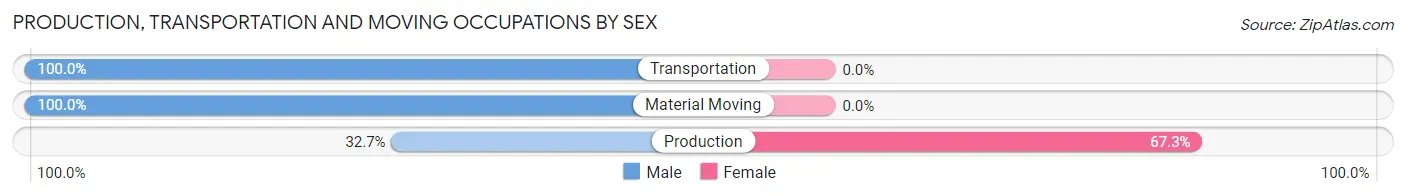
| Occupation | Male | Female |
| Production | 17 (32.7%) | 35 (67.3%) |
| Transportation | 88 (100.0%) | 0 (0.0%) |
| Material Moving | 76 (100.0%) | 0 (0.0%) |
| Total (Category) | 181 (83.8%) | 35 (16.2%) |
| Total (Overall) | 731 (50.4%) | 719 (49.6%) |
Employment Industries by Sex in Hahira
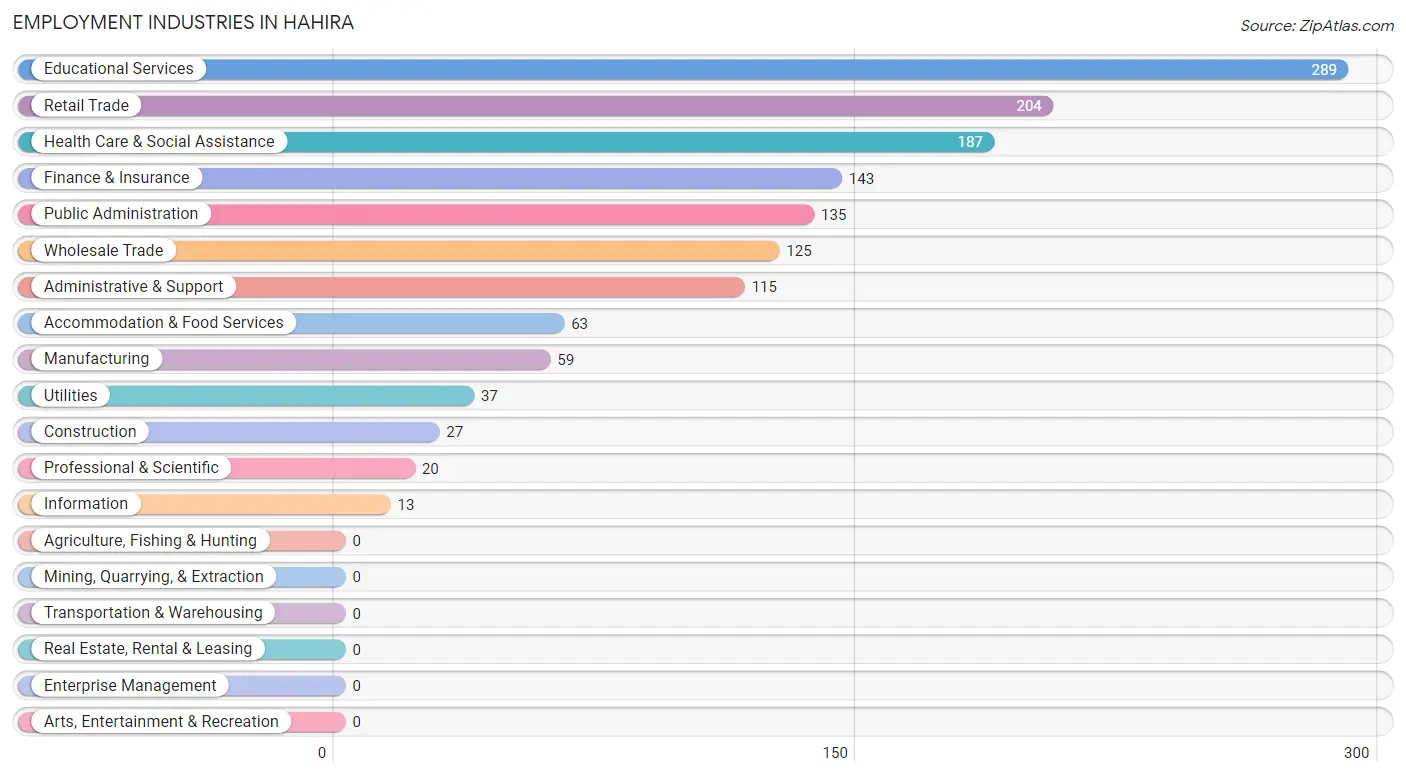
Employment Industries in Hahira
The major employment industries in Hahira include Educational Services (289 | 19.9%), Retail Trade (204 | 14.1%), Health Care & Social Assistance (187 | 12.9%), Finance & Insurance (143 | 9.9%), and Public Administration (135 | 9.3%).
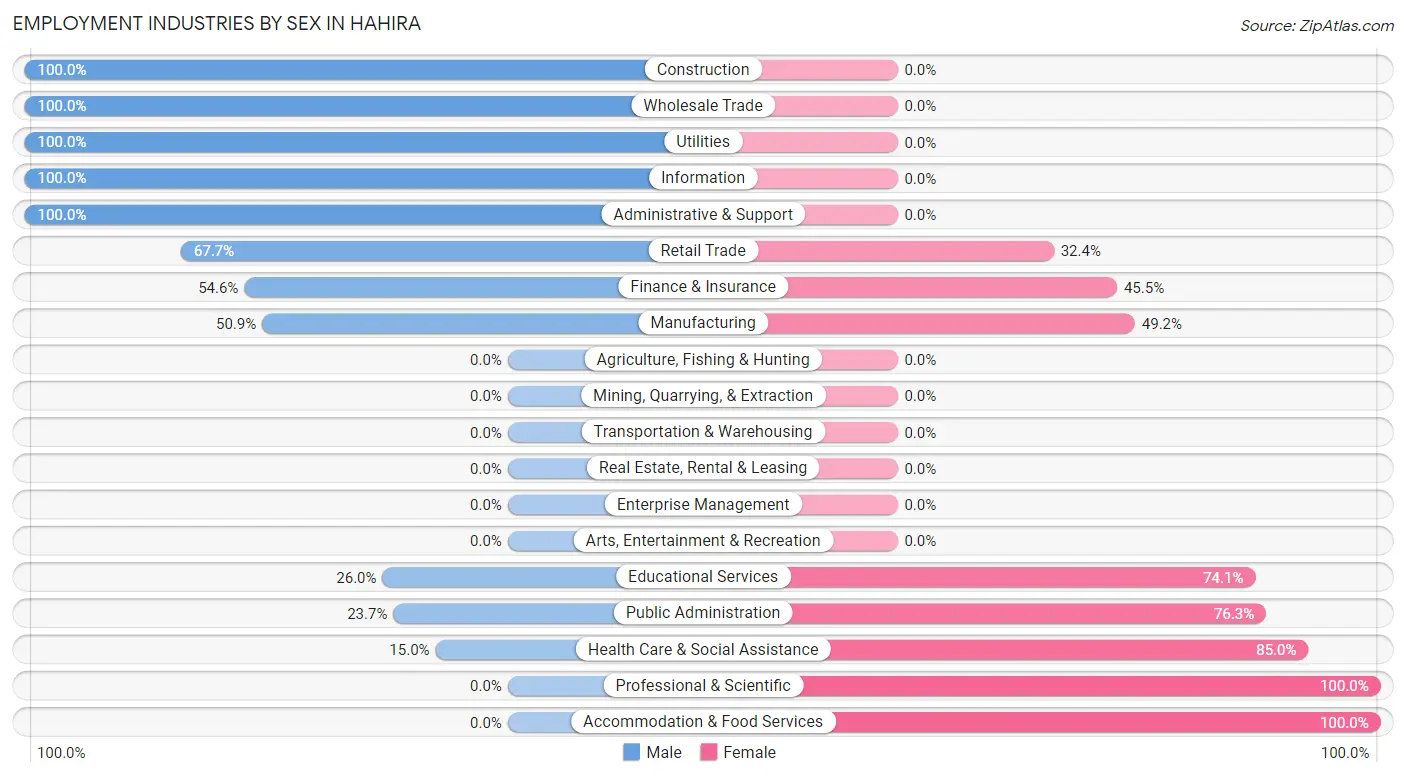
Employment Industries by Sex in Hahira
The Hahira industries that see more men than women are Construction (100.0%), Wholesale Trade (100.0%), and Utilities (100.0%), whereas the industries that tend to have a higher number of women are Professional & Scientific (100.0%), Accommodation & Food Services (100.0%), and Health Care & Social Assistance (85.0%).
| Industry | Male | Female |
| Agriculture, Fishing & Hunting | 0 (0.0%) | 0 (0.0%) |
| Mining, Quarrying, & Extraction | 0 (0.0%) | 0 (0.0%) |
| Construction | 27 (100.0%) | 0 (0.0%) |
| Manufacturing | 30 (50.8%) | 29 (49.1%) |
| Wholesale Trade | 125 (100.0%) | 0 (0.0%) |
| Retail Trade | 138 (67.6%) | 66 (32.4%) |
| Transportation & Warehousing | 0 (0.0%) | 0 (0.0%) |
| Utilities | 37 (100.0%) | 0 (0.0%) |
| Information | 13 (100.0%) | 0 (0.0%) |
| Finance & Insurance | 78 (54.5%) | 65 (45.5%) |
| Real Estate, Rental & Leasing | 0 (0.0%) | 0 (0.0%) |
| Professional & Scientific | 0 (0.0%) | 20 (100.0%) |
| Enterprise Management | 0 (0.0%) | 0 (0.0%) |
| Administrative & Support | 115 (100.0%) | 0 (0.0%) |
| Educational Services | 75 (26.0%) | 214 (74.1%) |
| Health Care & Social Assistance | 28 (15.0%) | 159 (85.0%) |
| Arts, Entertainment & Recreation | 0 (0.0%) | 0 (0.0%) |
| Accommodation & Food Services | 0 (0.0%) | 63 (100.0%) |
| Public Administration | 32 (23.7%) | 103 (76.3%) |
| Total | 731 (50.4%) | 719 (49.6%) |
Education in Hahira
School Enrollment in Hahira
The most common levels of schooling among the 1,048 students in Hahira are high school (307 | 29.3%), college / undergraduate (269 | 25.7%), and middle school (154 | 14.7%).
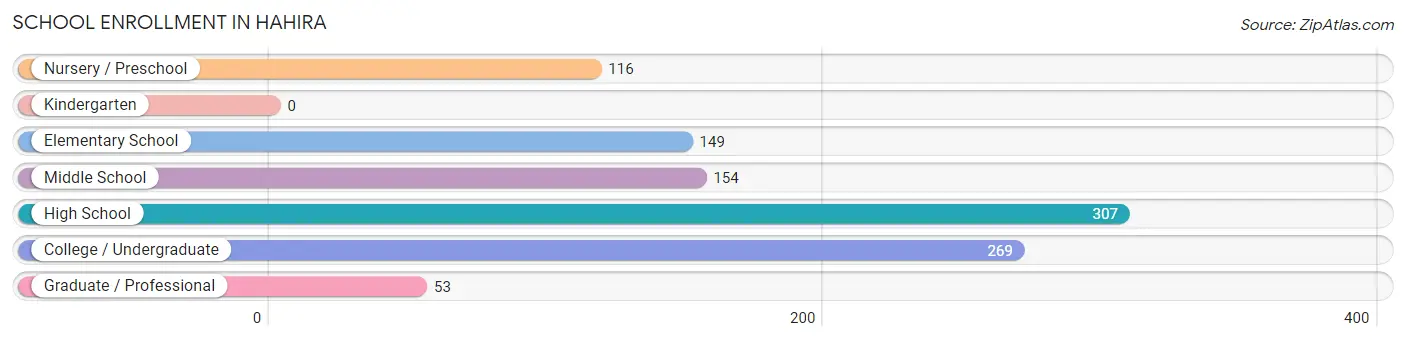
| School Level | # Students | % Students |
| Nursery / Preschool | 116 | 11.1% |
| Kindergarten | 0 | 0.0% |
| Elementary School | 149 | 14.2% |
| Middle School | 154 | 14.7% |
| High School | 307 | 29.3% |
| College / Undergraduate | 269 | 25.7% |
| Graduate / Professional | 53 | 5.1% |
| Total | 1,048 | 100.0% |
School Enrollment by Age by Funding Source in Hahira
Out of a total of 1,048 students who are enrolled in schools in Hahira, 121 (11.5%) attend a private institution, while the remaining 927 (88.5%) are enrolled in public schools. The age group of 3 to 4 year olds has the highest likelihood of being enrolled in private schools, with 46 (39.7% in the age bracket) enrolled. Conversely, the age group of 5 to 9 year old has the lowest likelihood of being enrolled in a private school, with 149 (100.0% in the age bracket) attending a public institution.
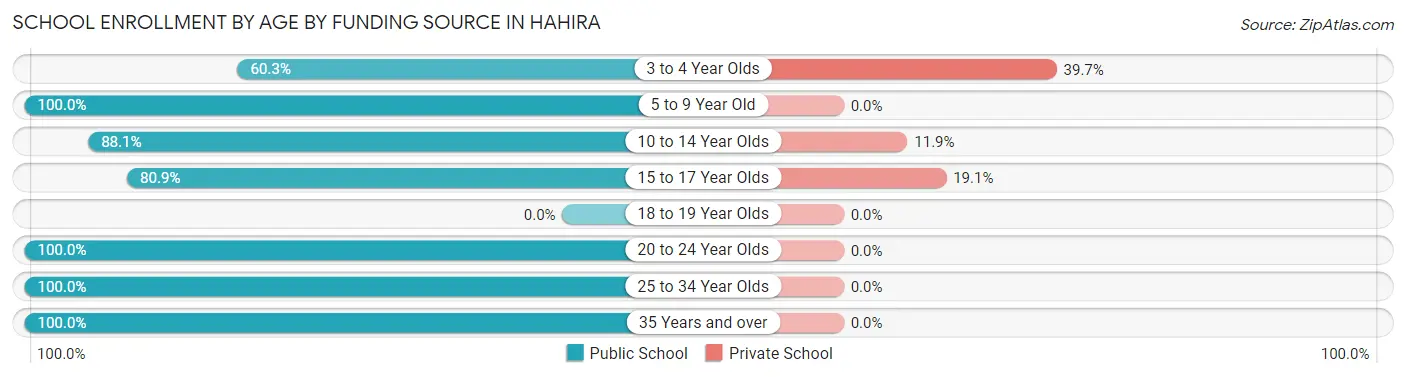
| Age Bracket | Public School | Private School |
| 3 to 4 Year Olds | 70 (60.3%) | 46 (39.7%) |
| 5 to 9 Year Old | 149 (100.0%) | 0 (0.0%) |
| 10 to 14 Year Olds | 171 (88.1%) | 23 (11.9%) |
| 15 to 17 Year Olds | 216 (80.9%) | 51 (19.1%) |
| 18 to 19 Year Olds | 0 (0.0%) | 0 (0.0%) |
| 20 to 24 Year Olds | 250 (100.0%) | 0 (0.0%) |
| 25 to 34 Year Olds | 53 (100.0%) | 0 (0.0%) |
| 35 Years and over | 19 (100.0%) | 0 (0.0%) |
| Total | 927 (88.5%) | 121 (11.5%) |
Educational Attainment by Field of Study in Hahira
Science & technology (132 | 25.2%), education (80 | 15.3%), business (55 | 10.5%), liberal arts & history (53 | 10.1%), and visual & performing arts (40 | 7.6%) are the most common fields of study among 524 individuals in Hahira who have obtained a bachelor's degree or higher.
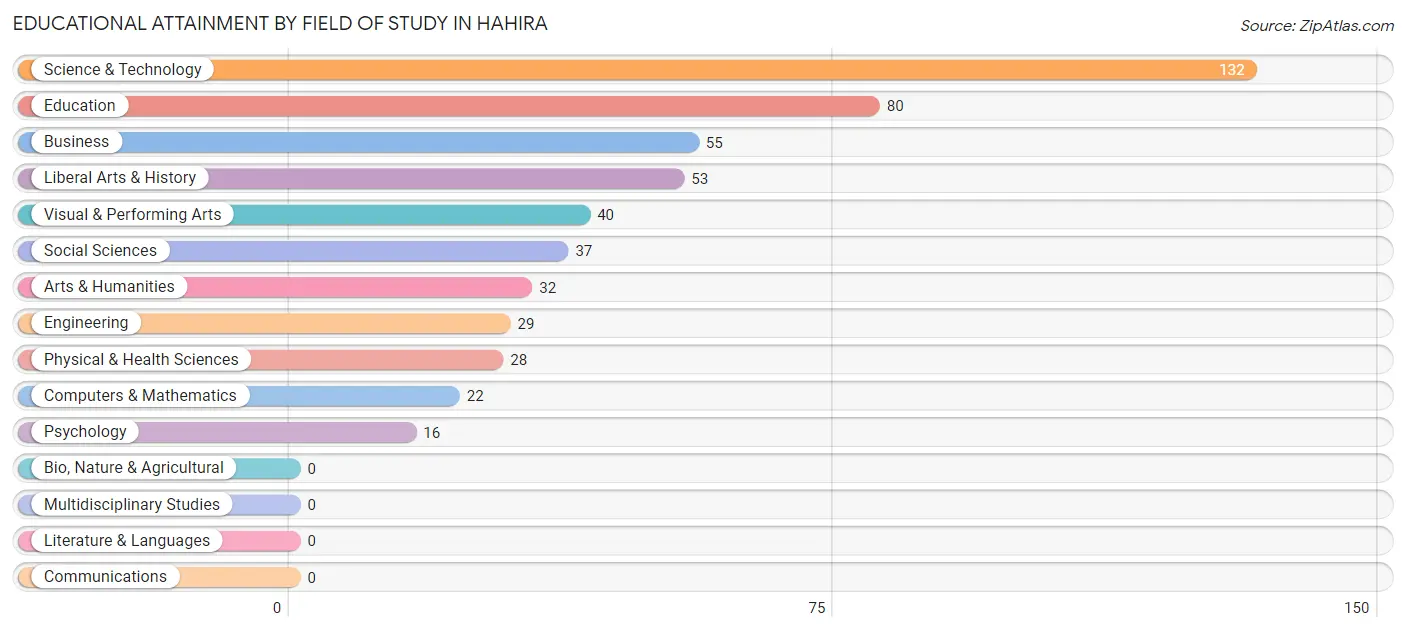
| Field of Study | # Graduates | % Graduates |
| Computers & Mathematics | 22 | 4.2% |
| Bio, Nature & Agricultural | 0 | 0.0% |
| Physical & Health Sciences | 28 | 5.3% |
| Psychology | 16 | 3.0% |
| Social Sciences | 37 | 7.1% |
| Engineering | 29 | 5.5% |
| Multidisciplinary Studies | 0 | 0.0% |
| Science & Technology | 132 | 25.2% |
| Business | 55 | 10.5% |
| Education | 80 | 15.3% |
| Literature & Languages | 0 | 0.0% |
| Liberal Arts & History | 53 | 10.1% |
| Visual & Performing Arts | 40 | 7.6% |
| Communications | 0 | 0.0% |
| Arts & Humanities | 32 | 6.1% |
| Total | 524 | 100.0% |
Transportation & Commute in Hahira
Vehicle Availability by Sex in Hahira
The most prevalent vehicle ownership categories in Hahira are males with 2 vehicles (458, accounting for 55.8%) and females with 2 vehicles (344, making up 63.7%).
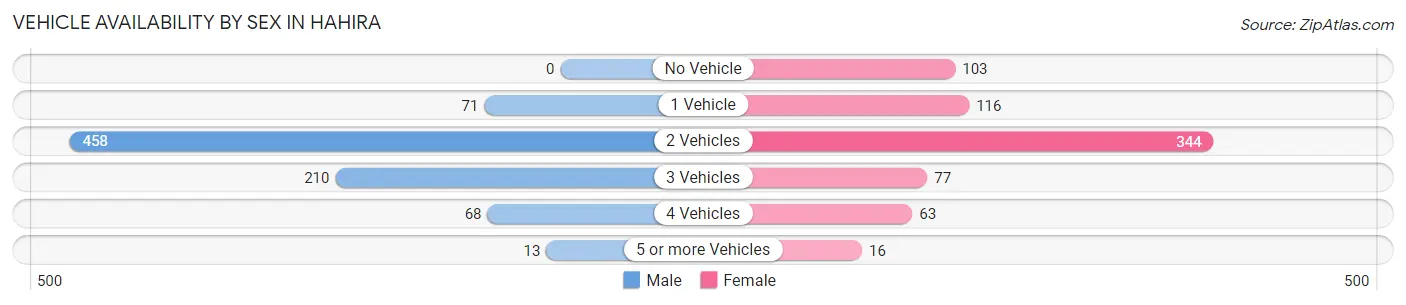
| Vehicles Available | Male | Female |
| No Vehicle | 0 (0.0%) | 103 (14.3%) |
| 1 Vehicle | 71 (8.7%) | 116 (16.1%) |
| 2 Vehicles | 458 (55.8%) | 344 (47.8%) |
| 3 Vehicles | 210 (25.6%) | 77 (10.7%) |
| 4 Vehicles | 68 (8.3%) | 63 (8.8%) |
| 5 or more Vehicles | 13 (1.6%) | 16 (2.2%) |
| Total | 820 (100.0%) | 719 (100.0%) |
Commute Time in Hahira
The most frequently occuring commute durations in Hahira are 20 to 24 minutes (400 commuters, 27.6%), 15 to 19 minutes (310 commuters, 21.3%), and 45 to 59 minutes (179 commuters, 12.3%).
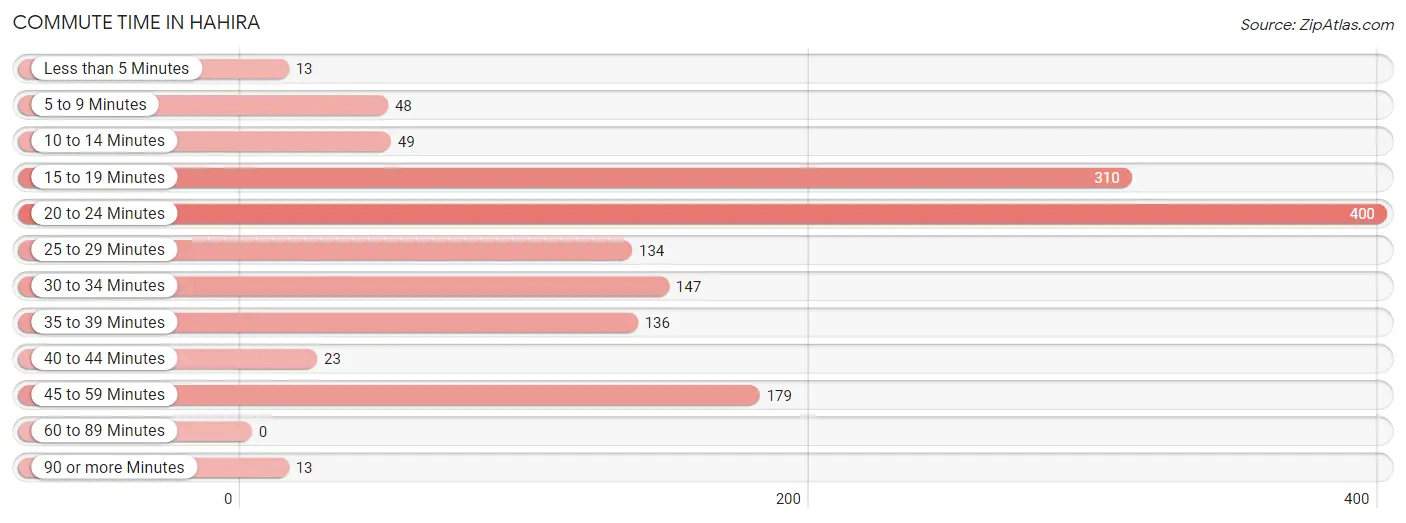
| Commute Time | # Commuters | % Commuters |
| Less than 5 Minutes | 13 | 0.9% |
| 5 to 9 Minutes | 48 | 3.3% |
| 10 to 14 Minutes | 49 | 3.4% |
| 15 to 19 Minutes | 310 | 21.3% |
| 20 to 24 Minutes | 400 | 27.6% |
| 25 to 29 Minutes | 134 | 9.2% |
| 30 to 34 Minutes | 147 | 10.1% |
| 35 to 39 Minutes | 136 | 9.4% |
| 40 to 44 Minutes | 23 | 1.6% |
| 45 to 59 Minutes | 179 | 12.3% |
| 60 to 89 Minutes | 0 | 0.0% |
| 90 or more Minutes | 13 | 0.9% |
Commute Time by Sex in Hahira
The most common commute times in Hahira are 20 to 24 minutes (243 commuters, 29.6%) for males and 20 to 24 minutes (157 commuters, 24.8%) for females.
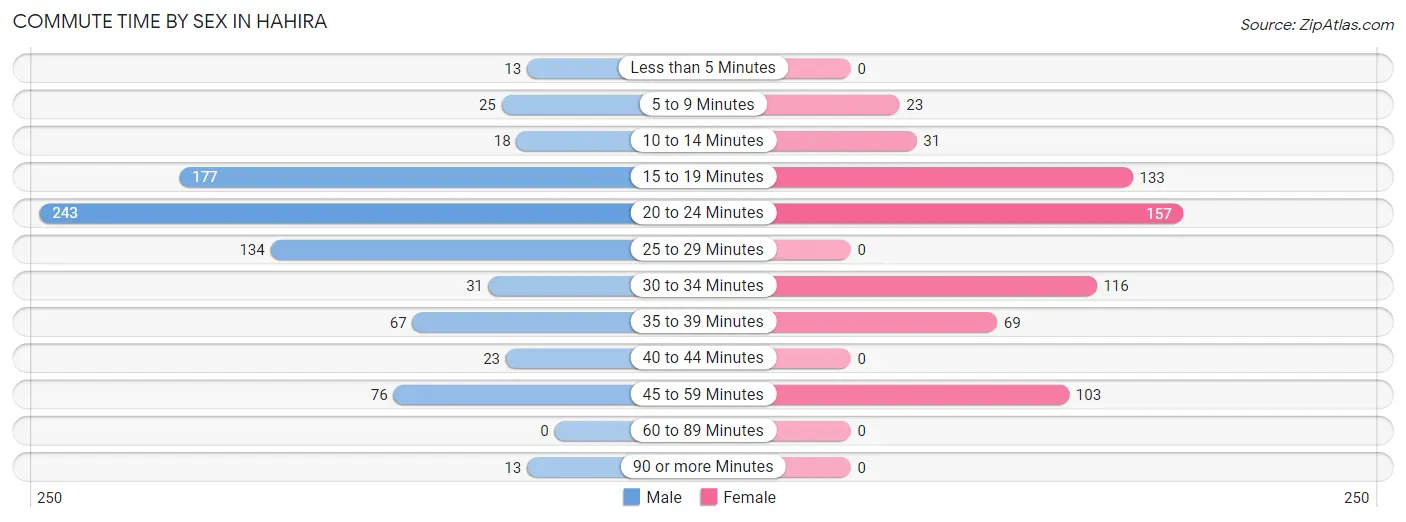
| Commute Time | Male | Female |
| Less than 5 Minutes | 13 (1.6%) | 0 (0.0%) |
| 5 to 9 Minutes | 25 (3.0%) | 23 (3.6%) |
| 10 to 14 Minutes | 18 (2.2%) | 31 (4.9%) |
| 15 to 19 Minutes | 177 (21.6%) | 133 (21.0%) |
| 20 to 24 Minutes | 243 (29.6%) | 157 (24.8%) |
| 25 to 29 Minutes | 134 (16.3%) | 0 (0.0%) |
| 30 to 34 Minutes | 31 (3.8%) | 116 (18.3%) |
| 35 to 39 Minutes | 67 (8.2%) | 69 (10.9%) |
| 40 to 44 Minutes | 23 (2.8%) | 0 (0.0%) |
| 45 to 59 Minutes | 76 (9.3%) | 103 (16.3%) |
| 60 to 89 Minutes | 0 (0.0%) | 0 (0.0%) |
| 90 or more Minutes | 13 (1.6%) | 0 (0.0%) |
Time of Departure to Work by Sex in Hahira
The most frequent times of departure to work in Hahira are 7:00 AM to 7:29 AM (338, 41.2%) for males and 7:00 AM to 7:29 AM (188, 29.7%) for females.
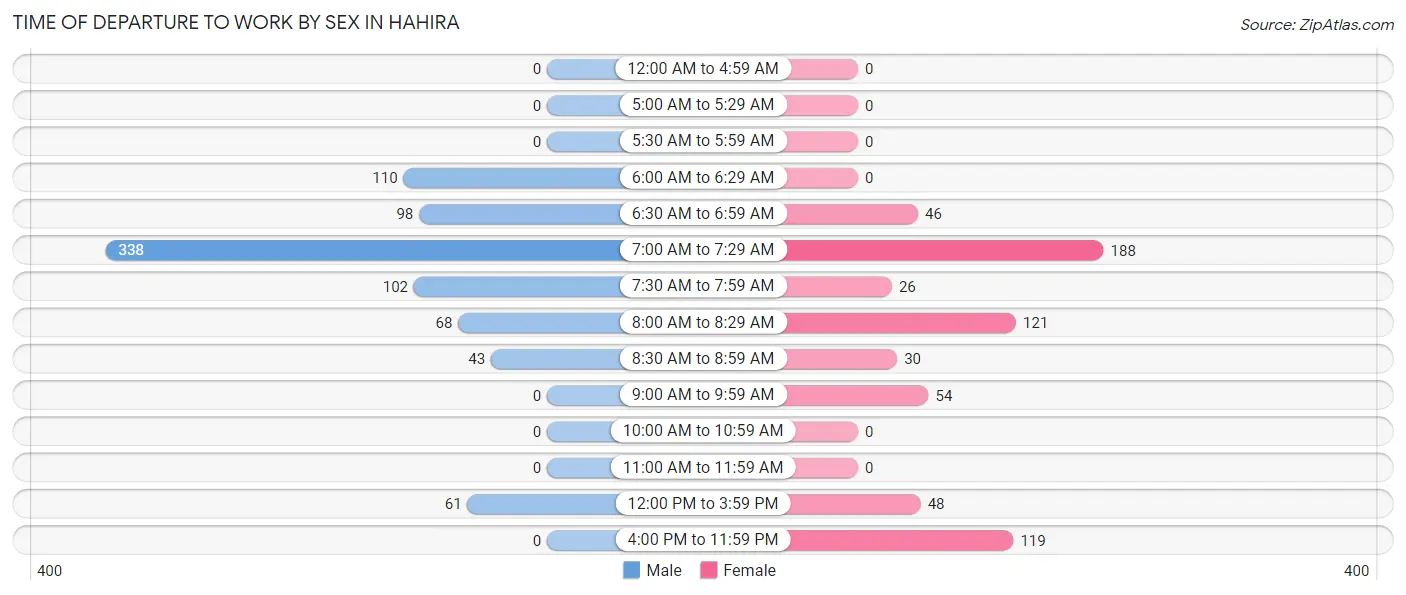
| Time of Departure | Male | Female |
| 12:00 AM to 4:59 AM | 0 (0.0%) | 0 (0.0%) |
| 5:00 AM to 5:29 AM | 0 (0.0%) | 0 (0.0%) |
| 5:30 AM to 5:59 AM | 0 (0.0%) | 0 (0.0%) |
| 6:00 AM to 6:29 AM | 110 (13.4%) | 0 (0.0%) |
| 6:30 AM to 6:59 AM | 98 (11.9%) | 46 (7.3%) |
| 7:00 AM to 7:29 AM | 338 (41.2%) | 188 (29.7%) |
| 7:30 AM to 7:59 AM | 102 (12.4%) | 26 (4.1%) |
| 8:00 AM to 8:29 AM | 68 (8.3%) | 121 (19.2%) |
| 8:30 AM to 8:59 AM | 43 (5.2%) | 30 (4.8%) |
| 9:00 AM to 9:59 AM | 0 (0.0%) | 54 (8.5%) |
| 10:00 AM to 10:59 AM | 0 (0.0%) | 0 (0.0%) |
| 11:00 AM to 11:59 AM | 0 (0.0%) | 0 (0.0%) |
| 12:00 PM to 3:59 PM | 61 (7.4%) | 48 (7.6%) |
| 4:00 PM to 11:59 PM | 0 (0.0%) | 119 (18.8%) |
| Total | 820 (100.0%) | 632 (100.0%) |
Housing Occupancy in Hahira
Occupancy by Ownership in Hahira
Of the total 1,046 dwellings in Hahira, owner-occupied units account for 741 (70.8%), while renter-occupied units make up 305 (29.2%).
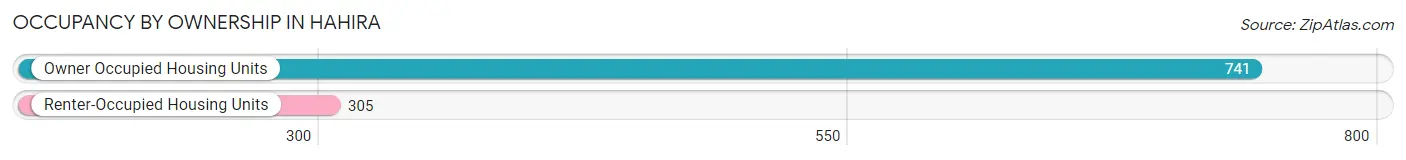
| Occupancy | # Housing Units | % Housing Units |
| Owner Occupied Housing Units | 741 | 70.8% |
| Renter-Occupied Housing Units | 305 | 29.2% |
| Total Occupied Housing Units | 1,046 | 100.0% |
Occupancy by Household Size in Hahira
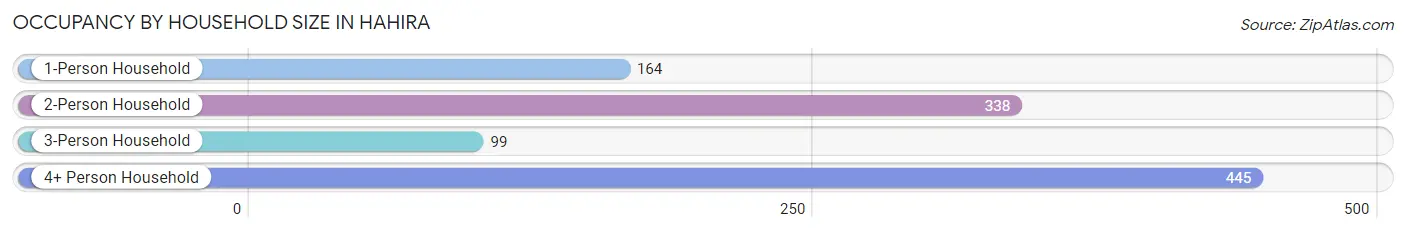
| Household Size | # Housing Units | % Housing Units |
| 1-Person Household | 164 | 15.7% |
| 2-Person Household | 338 | 32.3% |
| 3-Person Household | 99 | 9.5% |
| 4+ Person Household | 445 | 42.5% |
| Total Housing Units | 1,046 | 100.0% |
Occupancy by Ownership by Household Size in Hahira
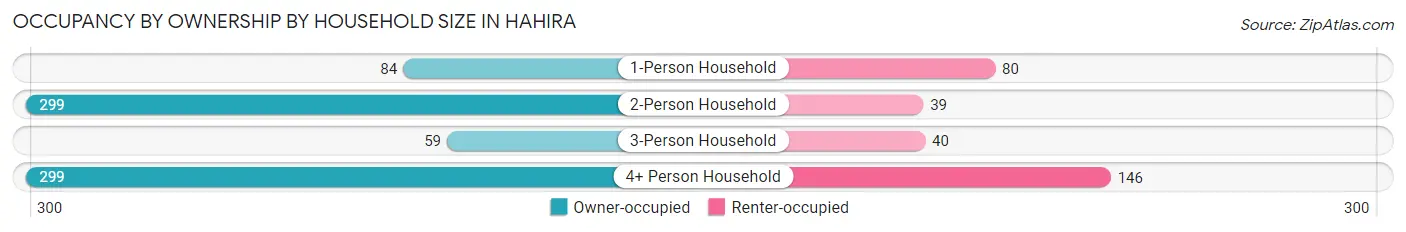
| Household Size | Owner-occupied | Renter-occupied |
| 1-Person Household | 84 (51.2%) | 80 (48.8%) |
| 2-Person Household | 299 (88.5%) | 39 (11.5%) |
| 3-Person Household | 59 (59.6%) | 40 (40.4%) |
| 4+ Person Household | 299 (67.2%) | 146 (32.8%) |
| Total Housing Units | 741 (70.8%) | 305 (29.2%) |
Occupancy by Educational Attainment in Hahira
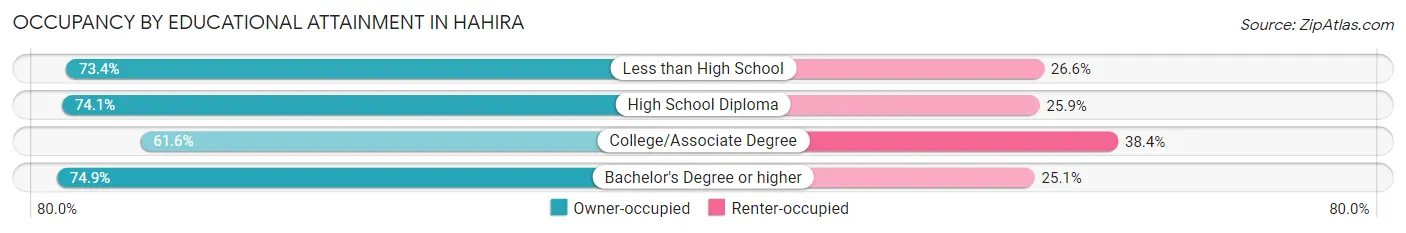
| Household Size | Owner-occupied | Renter-occupied |
| Less than High School | 69 (73.4%) | 25 (26.6%) |
| High School Diploma | 200 (74.1%) | 70 (25.9%) |
| College/Associate Degree | 180 (61.6%) | 112 (38.4%) |
| Bachelor's Degree or higher | 292 (74.9%) | 98 (25.1%) |
Occupancy by Age of Householder in Hahira
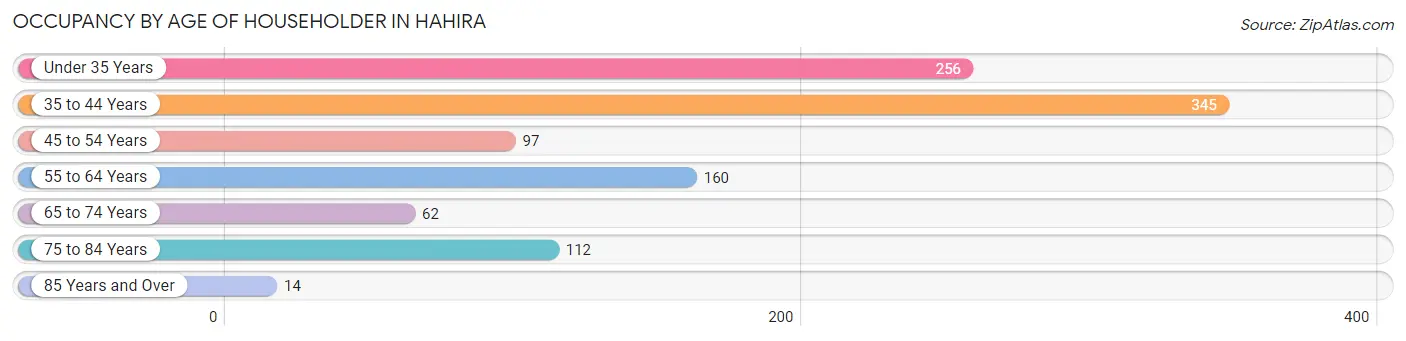
| Age Bracket | # Households | % Households |
| Under 35 Years | 256 | 24.5% |
| 35 to 44 Years | 345 | 33.0% |
| 45 to 54 Years | 97 | 9.3% |
| 55 to 64 Years | 160 | 15.3% |
| 65 to 74 Years | 62 | 5.9% |
| 75 to 84 Years | 112 | 10.7% |
| 85 Years and Over | 14 | 1.3% |
| Total | 1,046 | 100.0% |
Housing Finances in Hahira
Median Income by Occupancy in Hahira
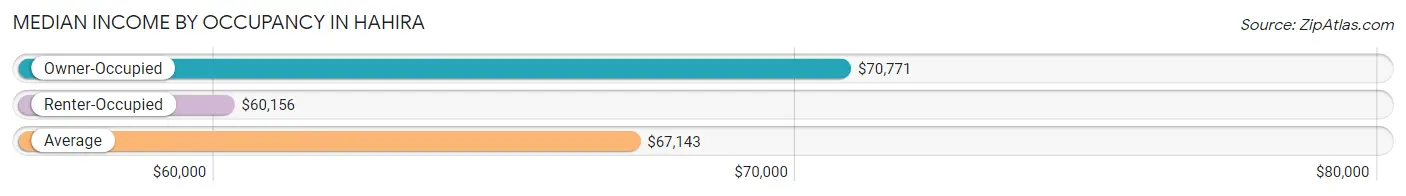
| Occupancy Type | # Households | Median Income |
| Owner-Occupied | 741 (70.8%) | $70,771 |
| Renter-Occupied | 305 (29.2%) | $60,156 |
| Average | 1,046 (100.0%) | $67,143 |
Occupancy by Householder Income Bracket in Hahira
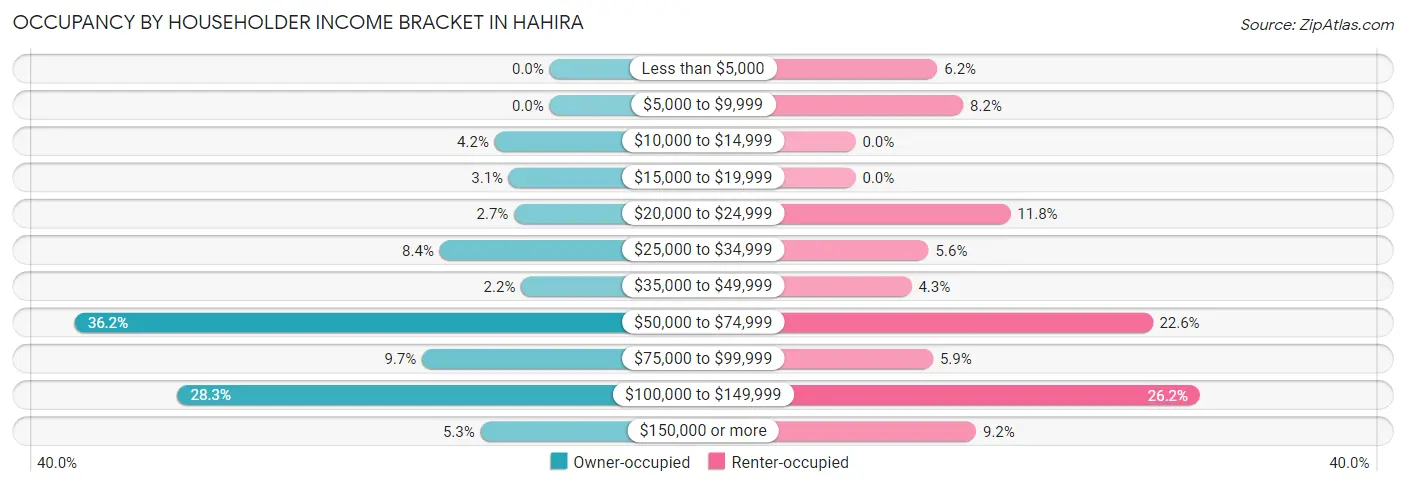
| Income Bracket | Owner-occupied | Renter-occupied |
| Less than $5,000 | 0 (0.0%) | 19 (6.2%) |
| $5,000 to $9,999 | 0 (0.0%) | 25 (8.2%) |
| $10,000 to $14,999 | 31 (4.2%) | 0 (0.0%) |
| $15,000 to $19,999 | 23 (3.1%) | 0 (0.0%) |
| $20,000 to $24,999 | 20 (2.7%) | 36 (11.8%) |
| $25,000 to $34,999 | 62 (8.4%) | 17 (5.6%) |
| $35,000 to $49,999 | 16 (2.2%) | 13 (4.3%) |
| $50,000 to $74,999 | 268 (36.2%) | 69 (22.6%) |
| $75,000 to $99,999 | 72 (9.7%) | 18 (5.9%) |
| $100,000 to $149,999 | 210 (28.3%) | 80 (26.2%) |
| $150,000 or more | 39 (5.3%) | 28 (9.2%) |
| Total | 741 (100.0%) | 305 (100.0%) |
Monthly Housing Cost Tiers in Hahira
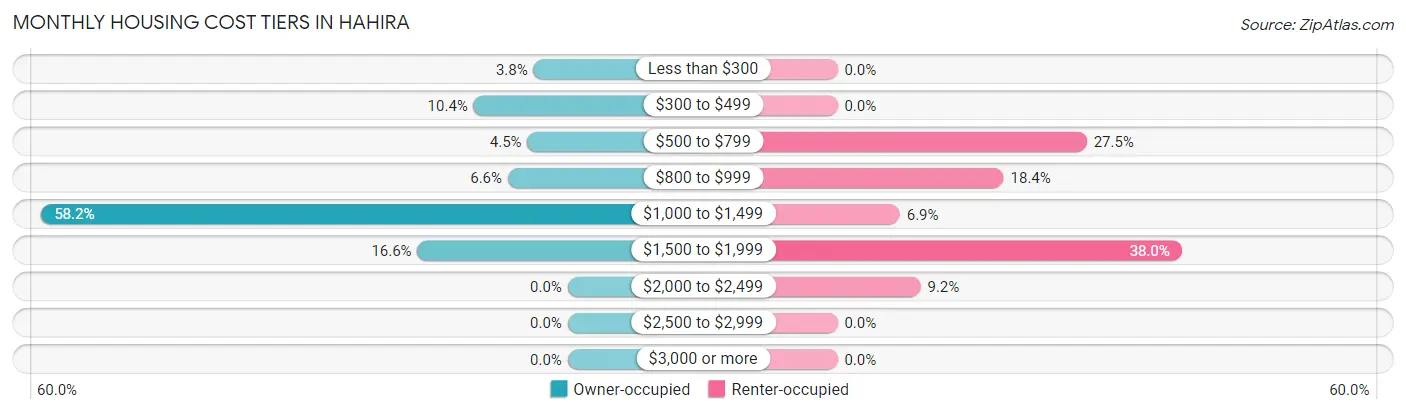
| Monthly Cost | Owner-occupied | Renter-occupied |
| Less than $300 | 28 (3.8%) | 0 (0.0%) |
| $300 to $499 | 77 (10.4%) | 0 (0.0%) |
| $500 to $799 | 33 (4.4%) | 84 (27.5%) |
| $800 to $999 | 49 (6.6%) | 56 (18.4%) |
| $1,000 to $1,499 | 431 (58.2%) | 21 (6.9%) |
| $1,500 to $1,999 | 123 (16.6%) | 116 (38.0%) |
| $2,000 to $2,499 | 0 (0.0%) | 28 (9.2%) |
| $2,500 to $2,999 | 0 (0.0%) | 0 (0.0%) |
| $3,000 or more | 0 (0.0%) | 0 (0.0%) |
| Total | 741 (100.0%) | 305 (100.0%) |
Physical Housing Characteristics in Hahira
Housing Structures in Hahira
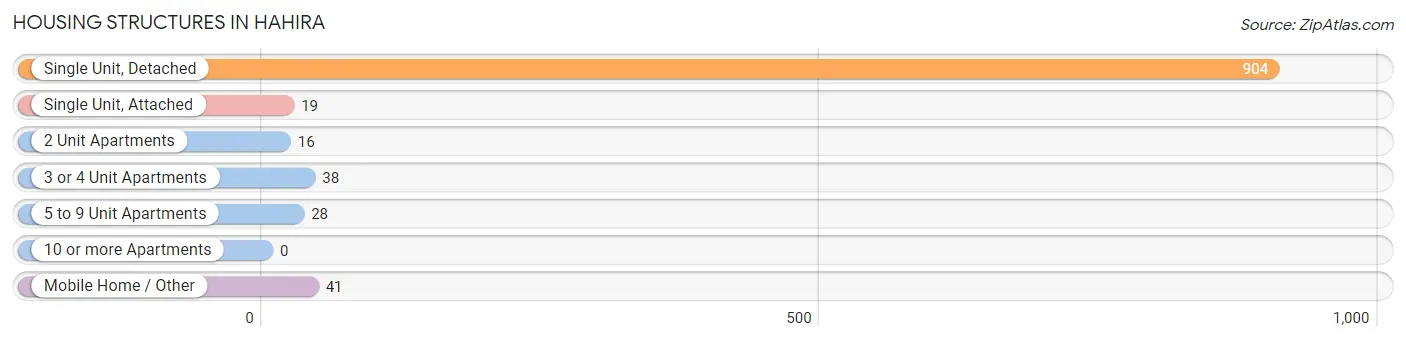
| Structure Type | # Housing Units | % Housing Units |
| Single Unit, Detached | 904 | 86.4% |
| Single Unit, Attached | 19 | 1.8% |
| 2 Unit Apartments | 16 | 1.5% |
| 3 or 4 Unit Apartments | 38 | 3.6% |
| 5 to 9 Unit Apartments | 28 | 2.7% |
| 10 or more Apartments | 0 | 0.0% |
| Mobile Home / Other | 41 | 3.9% |
| Total | 1,046 | 100.0% |
Housing Structures by Occupancy in Hahira
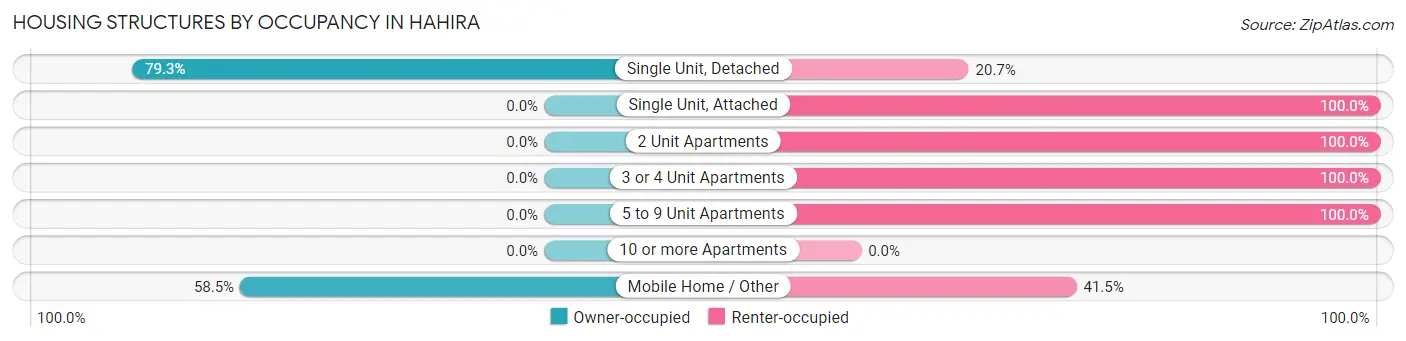
| Structure Type | Owner-occupied | Renter-occupied |
| Single Unit, Detached | 717 (79.3%) | 187 (20.7%) |
| Single Unit, Attached | 0 (0.0%) | 19 (100.0%) |
| 2 Unit Apartments | 0 (0.0%) | 16 (100.0%) |
| 3 or 4 Unit Apartments | 0 (0.0%) | 38 (100.0%) |
| 5 to 9 Unit Apartments | 0 (0.0%) | 28 (100.0%) |
| 10 or more Apartments | 0 (0.0%) | 0 (0.0%) |
| Mobile Home / Other | 24 (58.5%) | 17 (41.5%) |
| Total | 741 (70.8%) | 305 (29.2%) |
Housing Structures by Number of Rooms in Hahira
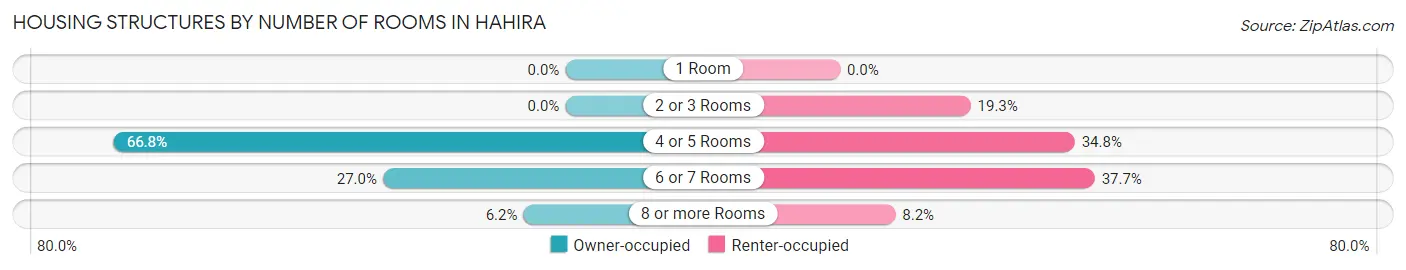
| Number of Rooms | Owner-occupied | Renter-occupied |
| 1 Room | 0 (0.0%) | 0 (0.0%) |
| 2 or 3 Rooms | 0 (0.0%) | 59 (19.3%) |
| 4 or 5 Rooms | 495 (66.8%) | 106 (34.7%) |
| 6 or 7 Rooms | 200 (27.0%) | 115 (37.7%) |
| 8 or more Rooms | 46 (6.2%) | 25 (8.2%) |
| Total | 741 (100.0%) | 305 (100.0%) |
Housing Structure by Heating Type in Hahira
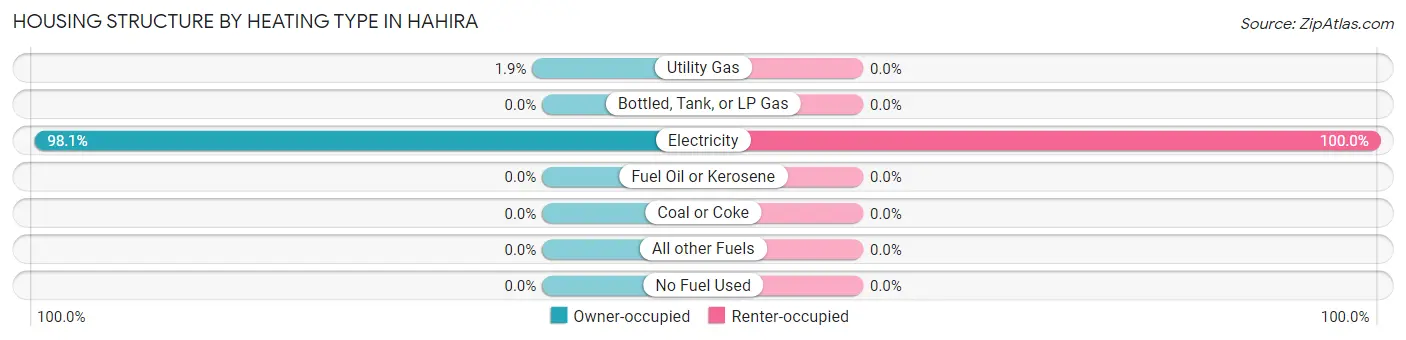
| Heating Type | Owner-occupied | Renter-occupied |
| Utility Gas | 14 (1.9%) | 0 (0.0%) |
| Bottled, Tank, or LP Gas | 0 (0.0%) | 0 (0.0%) |
| Electricity | 727 (98.1%) | 305 (100.0%) |
| Fuel Oil or Kerosene | 0 (0.0%) | 0 (0.0%) |
| Coal or Coke | 0 (0.0%) | 0 (0.0%) |
| All other Fuels | 0 (0.0%) | 0 (0.0%) |
| No Fuel Used | 0 (0.0%) | 0 (0.0%) |
| Total | 741 (100.0%) | 305 (100.0%) |
Household Vehicle Usage in Hahira
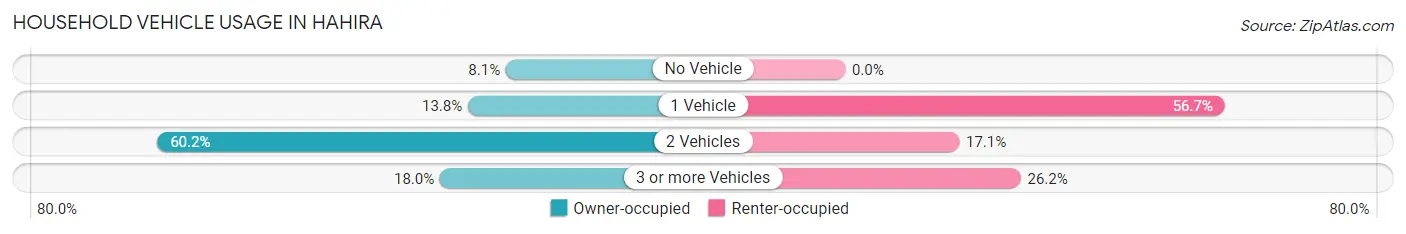
| Vehicles per Household | Owner-occupied | Renter-occupied |
| No Vehicle | 60 (8.1%) | 0 (0.0%) |
| 1 Vehicle | 102 (13.8%) | 173 (56.7%) |
| 2 Vehicles | 446 (60.2%) | 52 (17.1%) |
| 3 or more Vehicles | 133 (17.9%) | 80 (26.2%) |
| Total | 741 (100.0%) | 305 (100.0%) |
Real Estate & Mortgages in Hahira
Real Estate and Mortgage Overview in Hahira
| Characteristic | Without Mortgage | With Mortgage |
| Housing Units | 138 | 603 |
| Median Property Value | $156,000 | $143,600 |
| Median Household Income | - | - |
| Monthly Housing Costs | $391 | $0 |
| Real Estate Taxes | $1,552 | $0 |
Property Value by Mortgage Status in Hahira
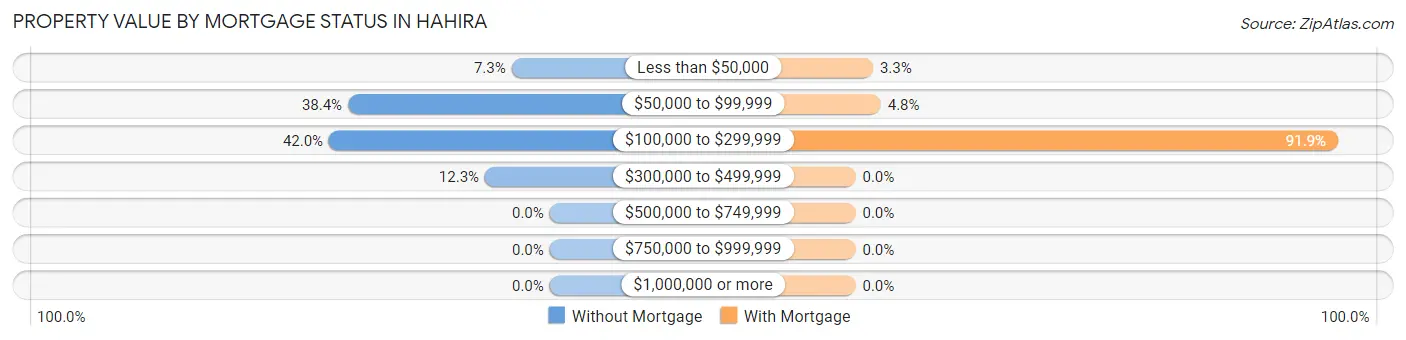
| Property Value | Without Mortgage | With Mortgage |
| Less than $50,000 | 10 (7.2%) | 20 (3.3%) |
| $50,000 to $99,999 | 53 (38.4%) | 29 (4.8%) |
| $100,000 to $299,999 | 58 (42.0%) | 554 (91.9%) |
| $300,000 to $499,999 | 17 (12.3%) | 0 (0.0%) |
| $500,000 to $749,999 | 0 (0.0%) | 0 (0.0%) |
| $750,000 to $999,999 | 0 (0.0%) | 0 (0.0%) |
| $1,000,000 or more | 0 (0.0%) | 0 (0.0%) |
| Total | 138 (100.0%) | 603 (100.0%) |
Household Income by Mortgage Status in Hahira
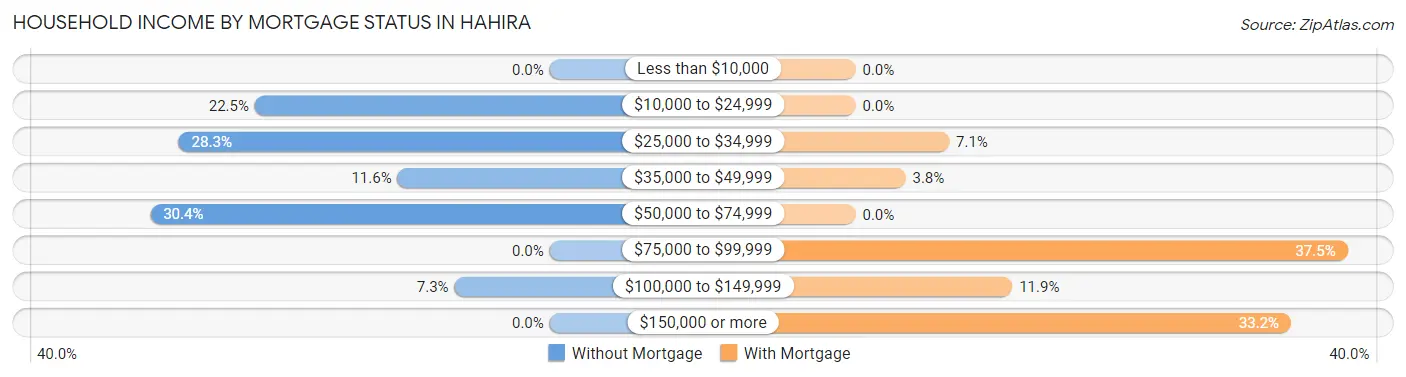
| Household Income | Without Mortgage | With Mortgage |
| Less than $10,000 | 0 (0.0%) | 0 (0.0%) |
| $10,000 to $24,999 | 31 (22.5%) | 0 (0.0%) |
| $25,000 to $34,999 | 39 (28.3%) | 43 (7.1%) |
| $35,000 to $49,999 | 16 (11.6%) | 23 (3.8%) |
| $50,000 to $74,999 | 42 (30.4%) | 0 (0.0%) |
| $75,000 to $99,999 | 0 (0.0%) | 226 (37.5%) |
| $100,000 to $149,999 | 10 (7.2%) | 72 (11.9%) |
| $150,000 or more | 0 (0.0%) | 200 (33.2%) |
| Total | 138 (100.0%) | 603 (100.0%) |
Property Value to Household Income Ratio in Hahira
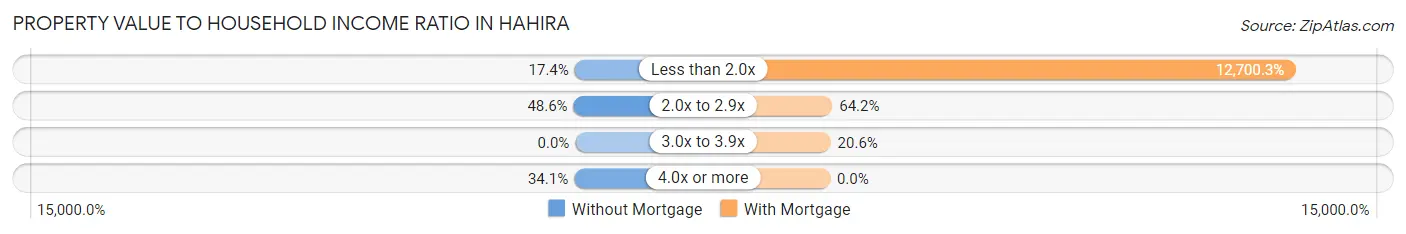
| Value-to-Income Ratio | Without Mortgage | With Mortgage |
| Less than 2.0x | 24 (17.4%) | 76,583 (12,700.3%) |
| 2.0x to 2.9x | 67 (48.5%) | 387 (64.2%) |
| 3.0x to 3.9x | 0 (0.0%) | 124 (20.6%) |
| 4.0x or more | 47 (34.1%) | 0 (0.0%) |
| Total | 138 (100.0%) | 603 (100.0%) |
Real Estate Taxes by Mortgage Status in Hahira
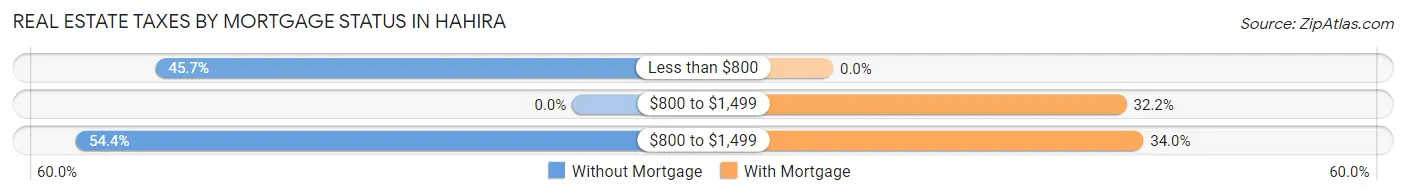
| Property Taxes | Without Mortgage | With Mortgage |
| Less than $800 | 63 (45.7%) | 0 (0.0%) |
| $800 to $1,499 | 0 (0.0%) | 194 (32.2%) |
| $800 to $1,499 | 75 (54.3%) | 205 (34.0%) |
| Total | 138 (100.0%) | 603 (100.0%) |
Health & Disability in Hahira
Health Insurance Coverage by Age in Hahira
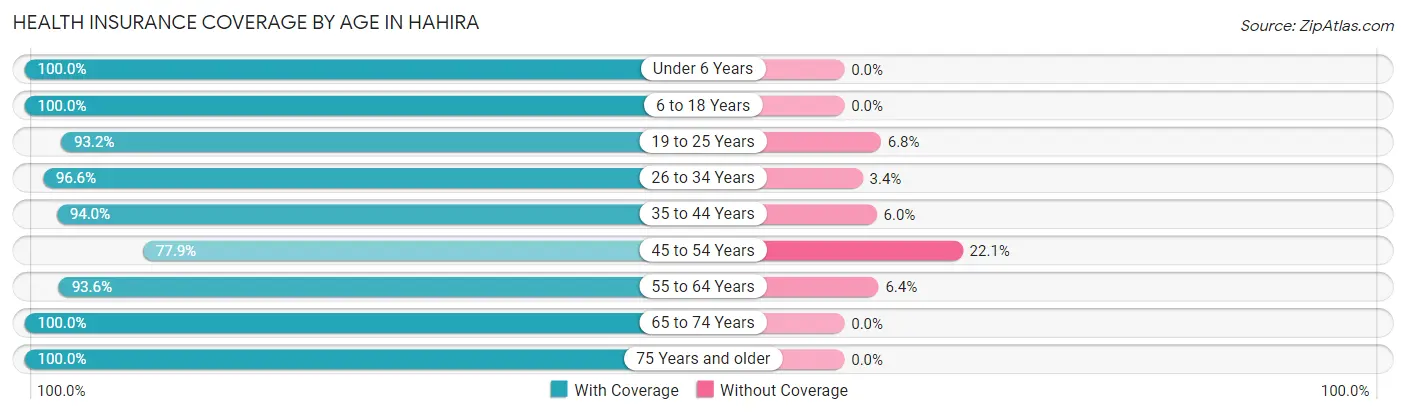
| Age Bracket | With Coverage | Without Coverage |
| Under 6 Years | 556 (100.0%) | 0 (0.0%) |
| 6 to 18 Years | 610 (100.0%) | 0 (0.0%) |
| 19 to 25 Years | 479 (93.2%) | 35 (6.8%) |
| 26 to 34 Years | 312 (96.6%) | 11 (3.4%) |
| 35 to 44 Years | 359 (94.0%) | 23 (6.0%) |
| 45 to 54 Years | 279 (77.9%) | 79 (22.1%) |
| 55 to 64 Years | 235 (93.6%) | 16 (6.4%) |
| 65 to 74 Years | 96 (100.0%) | 0 (0.0%) |
| 75 Years and older | 182 (100.0%) | 0 (0.0%) |
| Total | 3,108 (95.0%) | 164 (5.0%) |
Health Insurance Coverage by Citizenship Status in Hahira
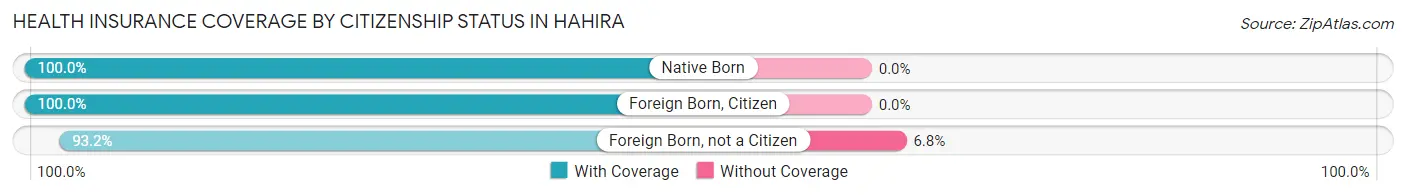
| Citizenship Status | With Coverage | Without Coverage |
| Native Born | 556 (100.0%) | 0 (0.0%) |
| Foreign Born, Citizen | 610 (100.0%) | 0 (0.0%) |
| Foreign Born, not a Citizen | 479 (93.2%) | 35 (6.8%) |
Health Insurance Coverage by Household Income in Hahira
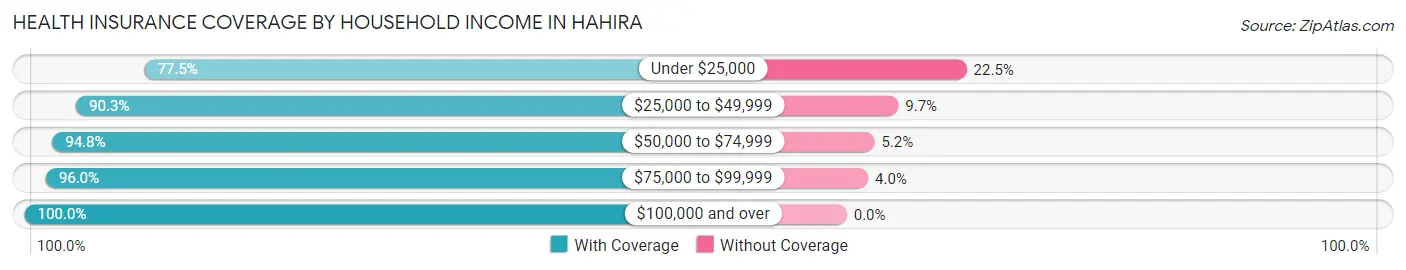
| Household Income | With Coverage | Without Coverage |
| Under $25,000 | 221 (77.5%) | 64 (22.5%) |
| $25,000 to $49,999 | 215 (90.3%) | 23 (9.7%) |
| $50,000 to $74,999 | 1,205 (94.8%) | 66 (5.2%) |
| $75,000 to $99,999 | 265 (96.0%) | 11 (4.0%) |
| $100,000 and over | 1,202 (100.0%) | 0 (0.0%) |
Public vs Private Health Insurance Coverage by Age in Hahira
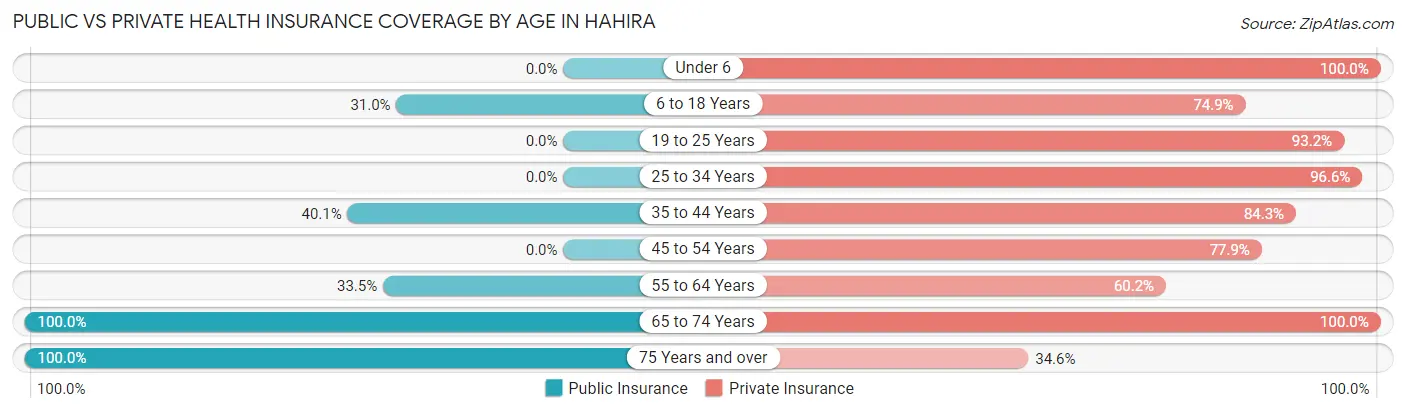
| Age Bracket | Public Insurance | Private Insurance |
| Under 6 | 0 (0.0%) | 556 (100.0%) |
| 6 to 18 Years | 189 (31.0%) | 457 (74.9%) |
| 19 to 25 Years | 0 (0.0%) | 479 (93.2%) |
| 25 to 34 Years | 0 (0.0%) | 312 (96.6%) |
| 35 to 44 Years | 153 (40.1%) | 322 (84.3%) |
| 45 to 54 Years | 0 (0.0%) | 279 (77.9%) |
| 55 to 64 Years | 84 (33.5%) | 151 (60.2%) |
| 65 to 74 Years | 96 (100.0%) | 96 (100.0%) |
| 75 Years and over | 182 (100.0%) | 63 (34.6%) |
| Total | 704 (21.5%) | 2,715 (83.0%) |
Disability Status by Sex by Age in Hahira
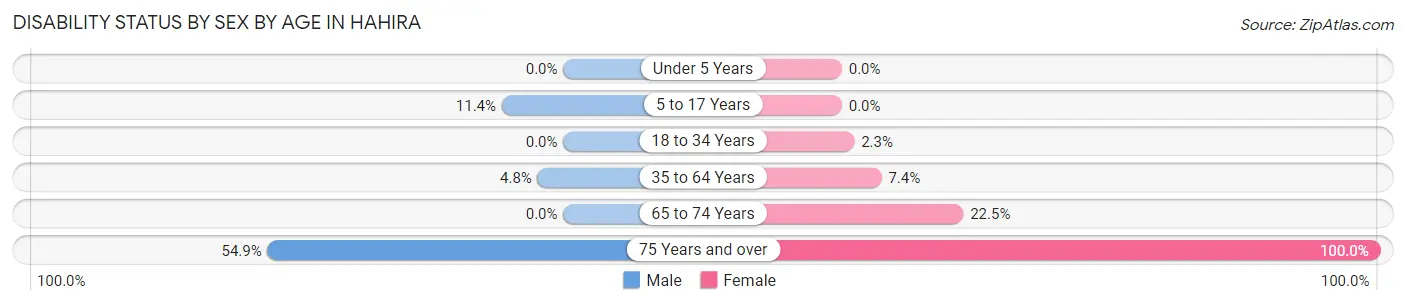
| Age Bracket | Male | Female |
| Under 5 Years | 0 (0.0%) | 0 (0.0%) |
| 5 to 17 Years | 30 (11.4%) | 0 (0.0%) |
| 18 to 34 Years | 0 (0.0%) | 11 (2.3%) |
| 35 to 64 Years | 22 (4.8%) | 39 (7.4%) |
| 65 to 74 Years | 0 (0.0%) | 16 (22.5%) |
| 75 Years and over | 56 (54.9%) | 80 (100.0%) |
Disability Class by Sex by Age in Hahira
Disability Class: Hearing Difficulty
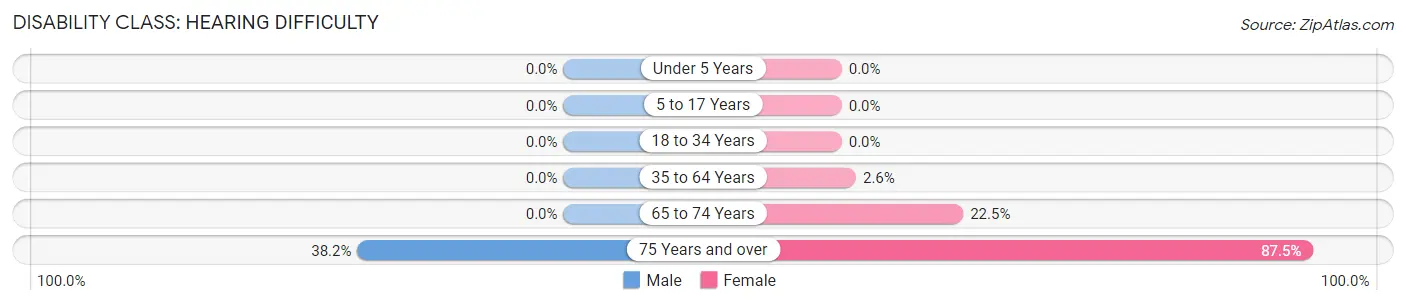
| Age Bracket | Male | Female |
| Under 5 Years | 0 (0.0%) | 0 (0.0%) |
| 5 to 17 Years | 0 (0.0%) | 0 (0.0%) |
| 18 to 34 Years | 0 (0.0%) | 0 (0.0%) |
| 35 to 64 Years | 0 (0.0%) | 14 (2.6%) |
| 65 to 74 Years | 0 (0.0%) | 16 (22.5%) |
| 75 Years and over | 39 (38.2%) | 70 (87.5%) |
Disability Class: Vision Difficulty
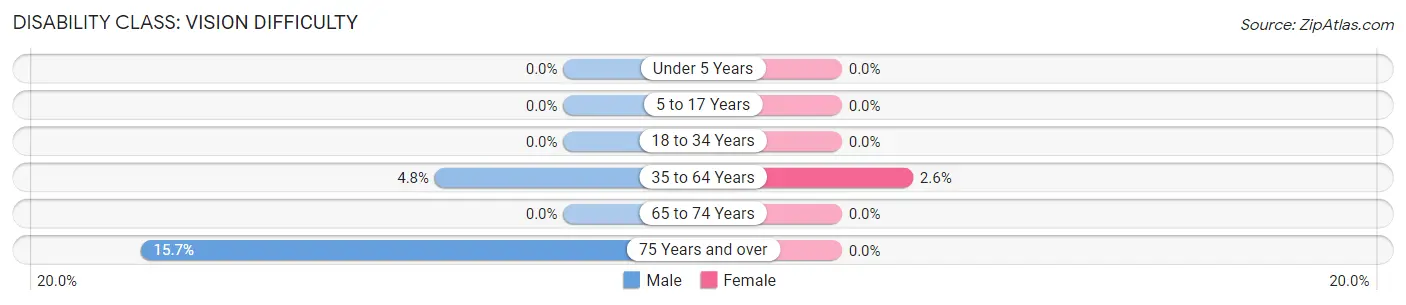
| Age Bracket | Male | Female |
| Under 5 Years | 0 (0.0%) | 0 (0.0%) |
| 5 to 17 Years | 0 (0.0%) | 0 (0.0%) |
| 18 to 34 Years | 0 (0.0%) | 0 (0.0%) |
| 35 to 64 Years | 22 (4.8%) | 14 (2.6%) |
| 65 to 74 Years | 0 (0.0%) | 0 (0.0%) |
| 75 Years and over | 16 (15.7%) | 0 (0.0%) |
Disability Class: Cognitive Difficulty
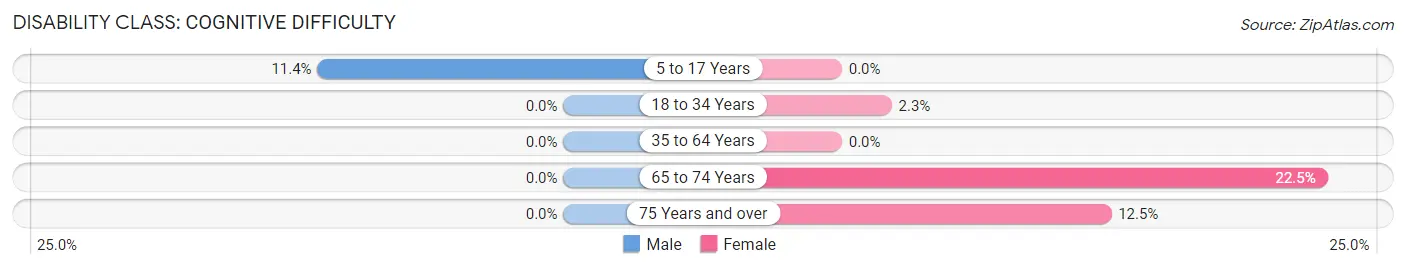
| Age Bracket | Male | Female |
| 5 to 17 Years | 30 (11.4%) | 0 (0.0%) |
| 18 to 34 Years | 0 (0.0%) | 11 (2.3%) |
| 35 to 64 Years | 0 (0.0%) | 0 (0.0%) |
| 65 to 74 Years | 0 (0.0%) | 16 (22.5%) |
| 75 Years and over | 0 (0.0%) | 10 (12.5%) |
Disability Class: Ambulatory Difficulty
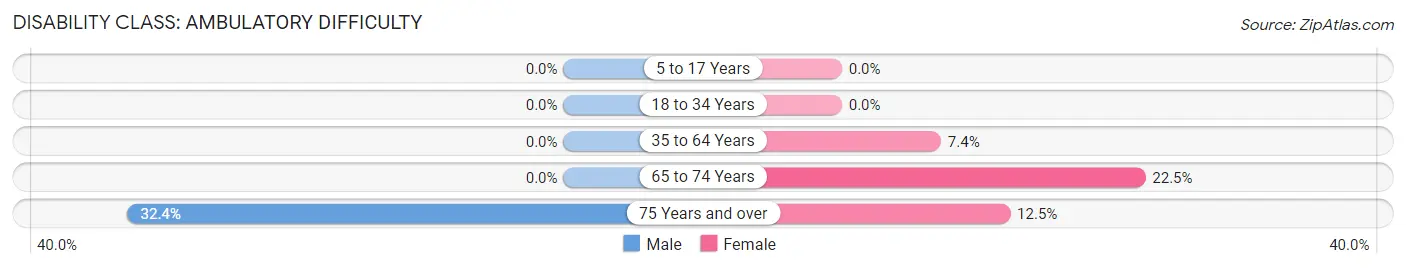
| Age Bracket | Male | Female |
| 5 to 17 Years | 0 (0.0%) | 0 (0.0%) |
| 18 to 34 Years | 0 (0.0%) | 0 (0.0%) |
| 35 to 64 Years | 0 (0.0%) | 39 (7.4%) |
| 65 to 74 Years | 0 (0.0%) | 16 (22.5%) |
| 75 Years and over | 33 (32.4%) | 10 (12.5%) |
Disability Class: Self-Care Difficulty
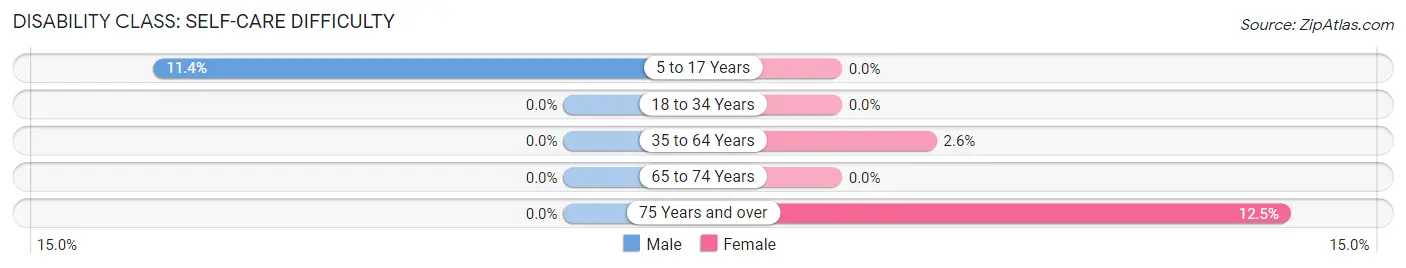
| Age Bracket | Male | Female |
| 5 to 17 Years | 30 (11.4%) | 0 (0.0%) |
| 18 to 34 Years | 0 (0.0%) | 0 (0.0%) |
| 35 to 64 Years | 0 (0.0%) | 14 (2.6%) |
| 65 to 74 Years | 0 (0.0%) | 0 (0.0%) |
| 75 Years and over | 0 (0.0%) | 10 (12.5%) |
Technology Access in Hahira
Computing Device Access in Hahira
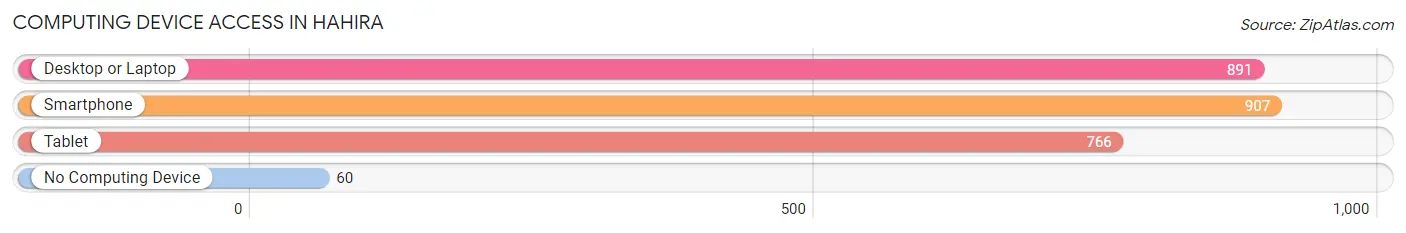
| Device Type | # Households | % Households |
| Desktop or Laptop | 891 | 85.2% |
| Smartphone | 907 | 86.7% |
| Tablet | 766 | 73.2% |
| No Computing Device | 60 | 5.7% |
| Total | 1,046 | 100.0% |
Internet Access in Hahira
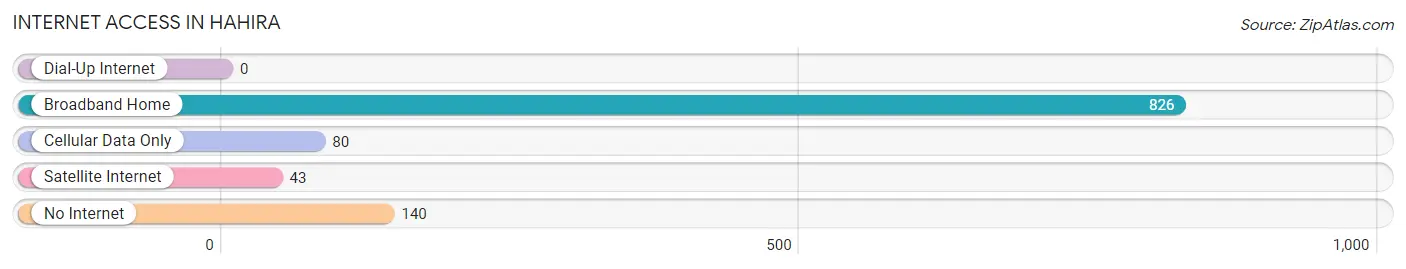
| Internet Type | # Households | % Households |
| Dial-Up Internet | 0 | 0.0% |
| Broadband Home | 826 | 79.0% |
| Cellular Data Only | 80 | 7.6% |
| Satellite Internet | 43 | 4.1% |
| No Internet | 140 | 13.4% |
| Total | 1,046 | 100.0% |
Hahira Summary
Hahira is a small town located in Lowndes County, Georgia, United States. It is situated about 20 miles north of Valdosta and is part of the Valdosta Metropolitan Statistical Area. The population of Hahira was 2,717 at the 2010 census.
History
Hahira was founded in 1891 by the Georgia and Florida Railroad. The town was named after the daughter of a railroad official, Hahira Smith. The town was incorporated in 1895 and was the first town in Lowndes County to be incorporated.
In the early 1900s, Hahira was a thriving agricultural community. The town was known for its cotton, corn, and peanuts. The town also had a thriving lumber industry.
In the 1920s, Hahira began to experience a population boom. The town was home to several businesses, including a bank, a hotel, a movie theater, and a variety of stores.
In the 1950s, Hahira experienced a decline in population as many of its residents moved to larger cities in search of better job opportunities. The town also experienced a decline in its agricultural industry as the cotton and peanut crops were replaced by soybeans and corn.
Geography
Hahira is located in Lowndes County, Georgia, at the intersection of US Highway 41 and Georgia State Route 122. The town is situated about 20 miles north of Valdosta and is part of the Valdosta Metropolitan Statistical Area.
The town is located in the flatwoods region of Georgia and is surrounded by pine forests. The town is located on the Withlacoochee River, which is a tributary of the Suwannee River.
Economy
Hahira’s economy is largely based on agriculture. The town is home to several farms that produce cotton, corn, peanuts, and soybeans. The town is also home to several lumber mills.
The town is also home to several small businesses, including restaurants, retail stores, and service providers. The town is also home to several manufacturing companies, including a paper mill and a furniture factory.
Demographics
As of the 2010 census, the population of Hahira was 2,717. The racial makeup of the town was 79.3% White, 17.2% African American, 0.7% Native American, 0.3% Asian, 0.1% Pacific Islander, 1.2% from other races, and 1.4% from two or more races. Hispanic or Latino of any race were 3.2% of the population.
The median income for a household in Hahira was $35,938, and the median income for a family was $41,250. The per capita income for the town was $17,845. About 17.2% of families and 20.2% of the population were below the poverty line, including 28.2% of those under age 18 and 11.2% of those age 65 or over.
Common Questions
What is Per Capita Income in Hahira?
Per Capita income in Hahira is $26,680.
What is the Median Family Income in Hahira?
Median Family Income in Hahira is $73,162.
What is the Median Household income in Hahira?
Median Household Income in Hahira is $67,143.
What is Income or Wage Gap in Hahira?
Income or Wage Gap in Hahira is 29.2%.
Women in Hahira earn 70.8 cents for every dollar earned by a man.
What is Inequality or Gini Index in Hahira?
Inequality or Gini Index in Hahira is 0.38.
What is the Total Population of Hahira?
Total Population of Hahira is 3,361.
What is the Total Male Population of Hahira?
Total Male Population of Hahira is 1,567.
What is the Total Female Population of Hahira?
Total Female Population of Hahira is 1,794.
What is the Ratio of Males per 100 Females in Hahira?
There are 87.35 Males per 100 Females in Hahira.
What is the Ratio of Females per 100 Males in Hahira?
There are 114.49 Females per 100 Males in Hahira.
What is the Median Population Age in Hahira?
Median Population Age in Hahira is 26.0 Years.
What is the Average Family Size in Hahira
Average Family Size in Hahira is 3.7 People.
What is the Average Household Size in Hahira
Average Household Size in Hahira is 3.2 People.
How Large is the Labor Force in Hahira?
There are 1,615 People in the Labor Forcein in Hahira.
What is the Percentage of People in the Labor Force in Hahira?
69.3% of People are in the Labor Force in Hahira.
What is the Unemployment Rate in Hahira?
Unemployment Rate in Hahira is 5.0%.