Zip Codes with the Highest Percentage of Population Employed in Architecture & Engineering in Woodstock, GA
RELATED REPORTS & OPTIONS
Architecture & Engineering
Woodstock
Compare Zip Codes
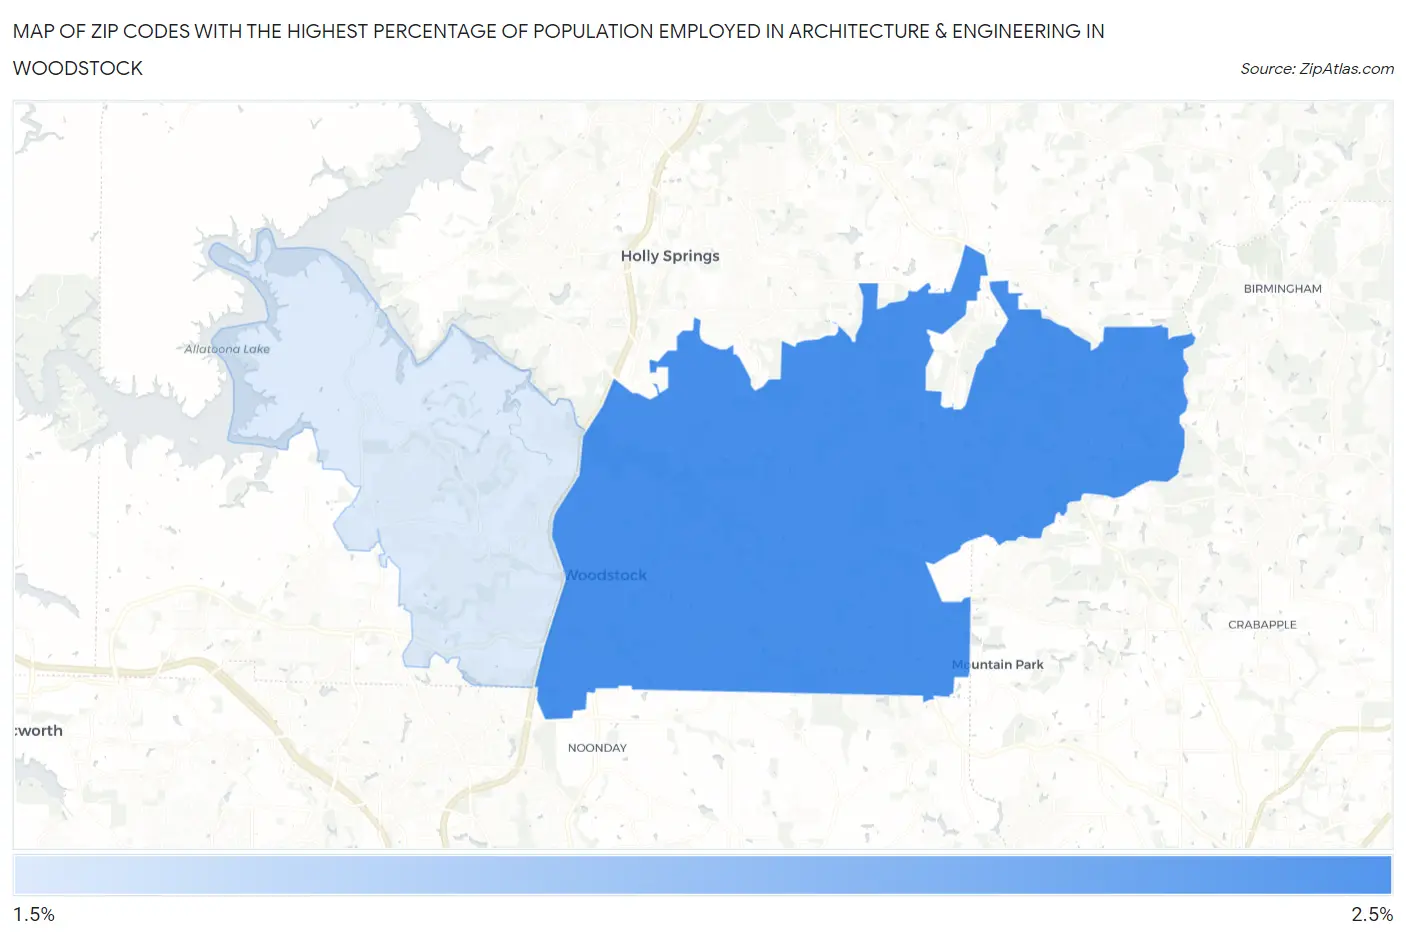
Map of Zip Codes with the Highest Percentage of Population Employed in Architecture & Engineering in Woodstock
2.1%
2.4%
Zip Codes with the Highest Percentage of Population Employed in Architecture & Engineering in Woodstock, GA
| Zip Code | % Employed | vs State | vs National | |
| 1. | 30188 | 2.4% | 1.8%(+0.602)#131 | 2.1%(+0.247)#7,488 |
| 2. | 30189 | 2.1% | 1.8%(+0.311)#171 | 2.1%(-0.043)#9,013 |
1
Common Questions
What are the Top Zip Codes with the Highest Percentage of Population Employed in Architecture & Engineering in Woodstock, GA?
Top Zip Codes with the Highest Percentage of Population Employed in Architecture & Engineering in Woodstock, GA are:
What zip code has the Highest Percentage of Population Employed in Architecture & Engineering in Woodstock, GA?
30188 has the Highest Percentage of Population Employed in Architecture & Engineering in Woodstock, GA with 2.4%.
What is the Percentage of Population Employed in Architecture & Engineering in Woodstock, GA?
Percentage of Population Employed in Architecture & Engineering in Woodstock is 2.0%.
What is the Percentage of Population Employed in Architecture & Engineering in Georgia?
Percentage of Population Employed in Architecture & Engineering in Georgia is 1.8%.
What is the Percentage of Population Employed in Architecture & Engineering in the United States?
Percentage of Population Employed in Architecture & Engineering in the United States is 2.1%.