Enigma, GA Map & Demographics
Enigma Map
Enigma Overview
$14,111
PER CAPITA INCOME
57.5%
WAGE / INCOME GAP [ % ]
42.5¢/ $1
WAGE / INCOME GAP [ $ ]
$14,166
FAMILY INCOME DEFICIT
0.53
INEQUALITY / GINI INDEX
1,251
TOTAL POPULATION
658
MALE POPULATION
593
FEMALE POPULATION
110.96
MALES / 100 FEMALES
90.12
FEMALES / 100 MALES
41.7
MEDIAN AGE
3.0
AVG FAMILY SIZE
2.7
AVG HOUSEHOLD SIZE
353
LABOR FORCE [ PEOPLE ]
36.5%
PERCENT IN LABOR FORCE
Enigma Zip Codes
Enigma Area Codes
Income in Enigma
Income Overview in Enigma
| Characteristic | Number | Measure |
| Per Capita Income | 1,251 | $14,111 |
| Median Family Income | 368 | $0 |
| Mean Family Income | 368 | $36,850 |
| Median Household Income | 462 | $0 |
| Mean Household Income | 462 | $36,415 |
| Income Deficit | 368 | $14,166 |
| Wage / Income Gap (%) | 1,251 | 57.47% |
| Wage / Income Gap ($) | 1,251 | 42.53¢ per $1 |
| Gini / Inequality Index | 1,251 | 0.53 |
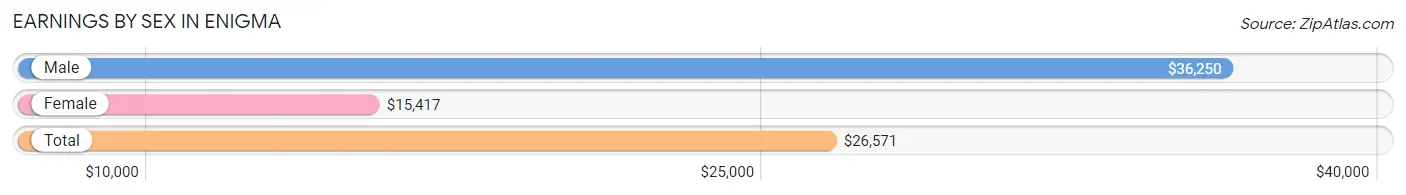
Earnings by Sex in Enigma
Average Earnings in Enigma are $26,571, $36,250 for men and $15,417 for women, a difference of 57.5%.
| Sex | Number | Average Earnings |
| Male | 233 (63.1%) | $36,250 |
| Female | 136 (36.9%) | $15,417 |
| Total | 369 (100.0%) | $26,571 |
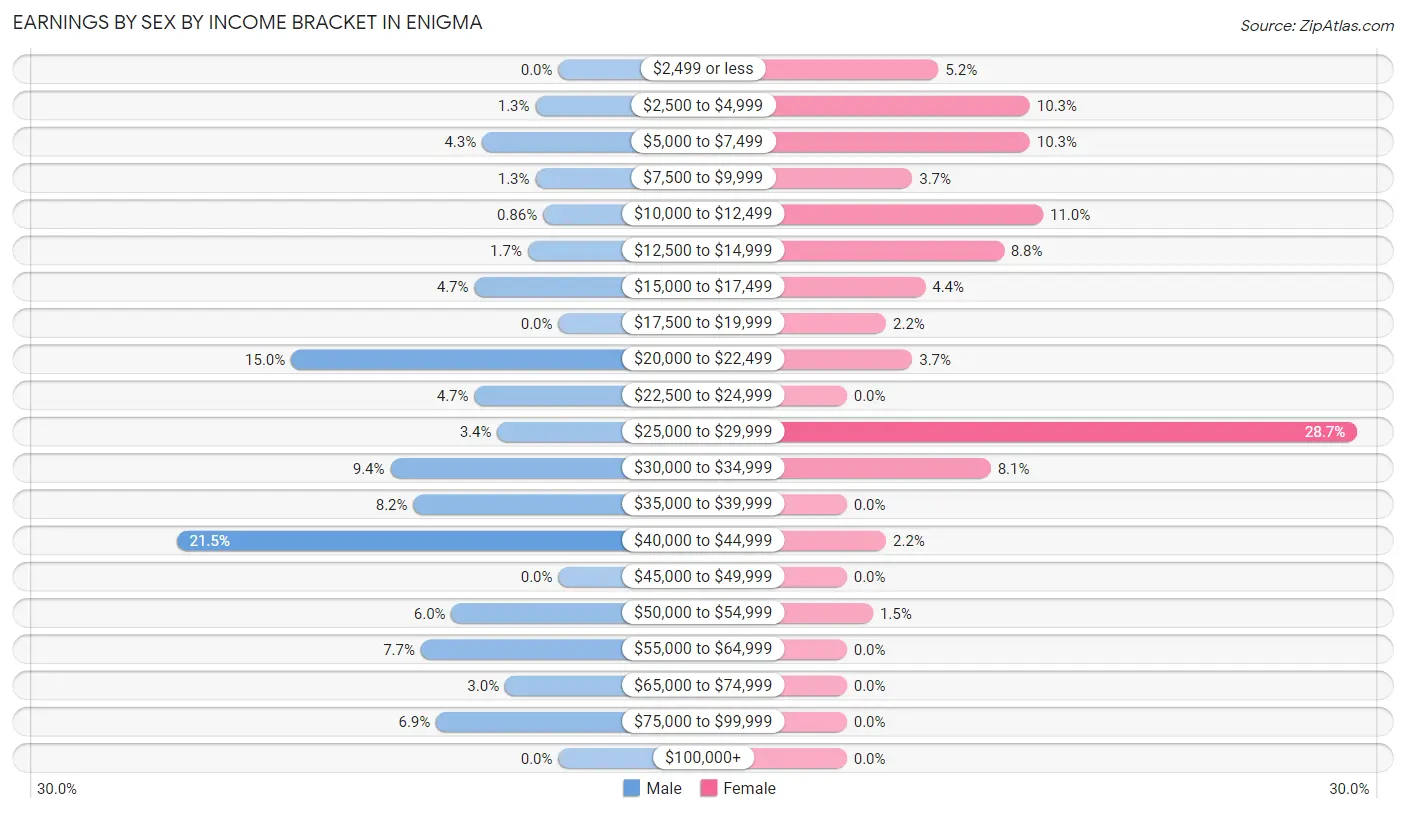
Earnings by Sex by Income Bracket in Enigma
The most common earnings brackets in Enigma are $40,000 to $44,999 for men (50 | 21.5%) and $25,000 to $29,999 for women (39 | 28.7%).
| Income | Male | Female |
| $2,499 or less | 0 (0.0%) | 7 (5.1%) |
| $2,500 to $4,999 | 3 (1.3%) | 14 (10.3%) |
| $5,000 to $7,499 | 10 (4.3%) | 14 (10.3%) |
| $7,500 to $9,999 | 3 (1.3%) | 5 (3.7%) |
| $10,000 to $12,499 | 2 (0.9%) | 15 (11.0%) |
| $12,500 to $14,999 | 4 (1.7%) | 12 (8.8%) |
| $15,000 to $17,499 | 11 (4.7%) | 6 (4.4%) |
| $17,500 to $19,999 | 0 (0.0%) | 3 (2.2%) |
| $20,000 to $22,499 | 35 (15.0%) | 5 (3.7%) |
| $22,500 to $24,999 | 11 (4.7%) | 0 (0.0%) |
| $25,000 to $29,999 | 8 (3.4%) | 39 (28.7%) |
| $30,000 to $34,999 | 22 (9.4%) | 11 (8.1%) |
| $35,000 to $39,999 | 19 (8.2%) | 0 (0.0%) |
| $40,000 to $44,999 | 50 (21.5%) | 3 (2.2%) |
| $45,000 to $49,999 | 0 (0.0%) | 0 (0.0%) |
| $50,000 to $54,999 | 14 (6.0%) | 2 (1.5%) |
| $55,000 to $64,999 | 18 (7.7%) | 0 (0.0%) |
| $65,000 to $74,999 | 7 (3.0%) | 0 (0.0%) |
| $75,000 to $99,999 | 16 (6.9%) | 0 (0.0%) |
| $100,000+ | 0 (0.0%) | 0 (0.0%) |
| Total | 233 (100.0%) | 136 (100.0%) |
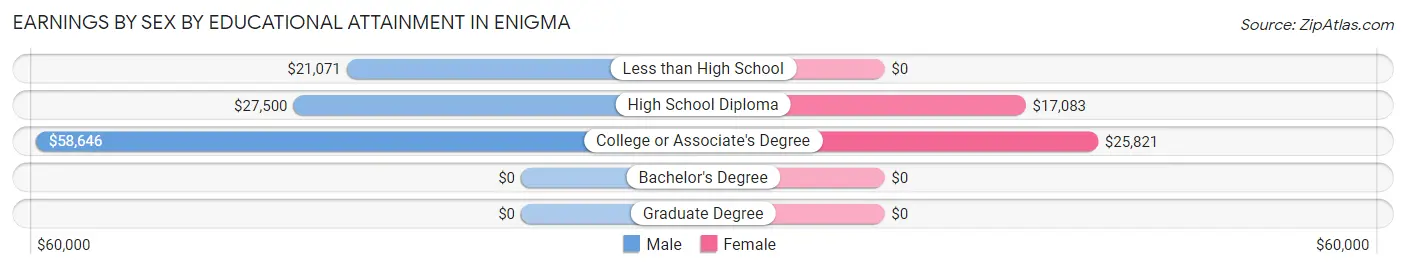
Earnings by Sex by Educational Attainment in Enigma
Average earnings in Enigma are $37,083 for men and $25,036 for women, a difference of 32.5%. Men with an educational attainment of college or associate's degree enjoy the highest average annual earnings of $58,646, while those with less than high school education earn the least with $21,071. Women with an educational attainment of college or associate's degree earn the most with the average annual earnings of $25,821, while those with high school diploma education have the smallest earnings of $17,083.
| Educational Attainment | Male Income | Female Income |
| Less than High School | $21,071 | $0 |
| High School Diploma | $27,500 | $17,083 |
| College or Associate's Degree | $58,646 | $25,821 |
| Bachelor's Degree | - | - |
| Graduate Degree | - | - |
| Total | $37,083 | $25,036 |
Family Income in Enigma
Family Income Brackets in Enigma
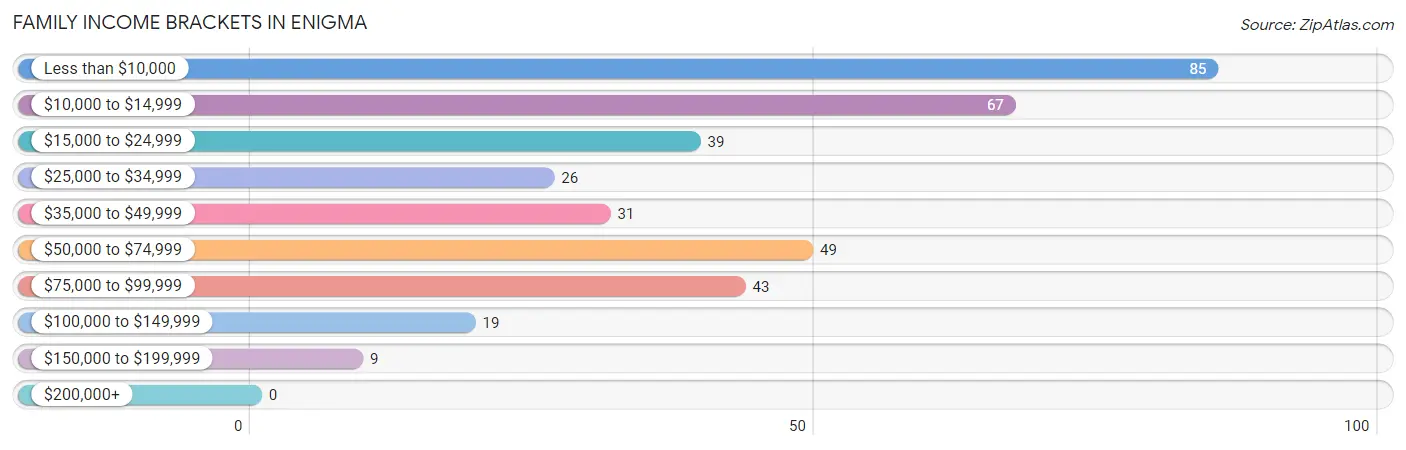
According to the Enigma family income data, there are 85 families falling into the less than $10,000 income range, which is the most common income bracket and makes up 23.1% of all families.
| Income Bracket | # Families | % Families |
| Less than $10,000 | 85 | 23.1% |
| $10,000 to $14,999 | 67 | 18.2% |
| $15,000 to $24,999 | 39 | 10.6% |
| $25,000 to $34,999 | 26 | 7.1% |
| $35,000 to $49,999 | 31 | 8.4% |
| $50,000 to $74,999 | 49 | 13.3% |
| $75,000 to $99,999 | 43 | 11.7% |
| $100,000 to $149,999 | 19 | 5.2% |
| $150,000 to $199,999 | 9 | 2.4% |
| $200,000+ | 0 | 0.0% |
Family Income by Famaliy Size in Enigma
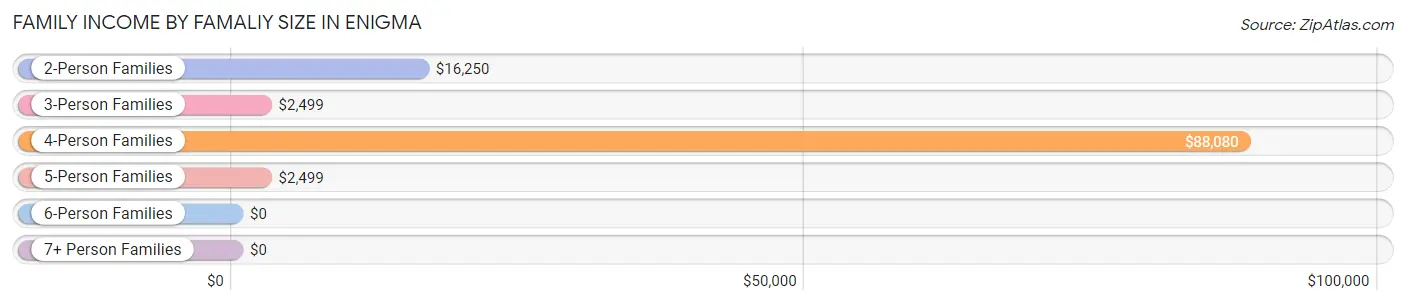
4-person families (85 | 23.1%) account for the highest median family income in Enigma with $88,080 per family, while 4-person families (85 | 23.1%) have the highest median income of $22,020 per family member.
| Income Bracket | # Families | Median Income |
| 2-Person Families | 187 (50.8%) | $16,250 |
| 3-Person Families | 59 (16.0%) | $2,499 |
| 4-Person Families | 85 (23.1%) | $88,080 |
| 5-Person Families | 28 (7.6%) | $2,499 |
| 6-Person Families | 9 (2.5%) | $0 |
| 7+ Person Families | 0 (0.0%) | $0 |
| Total | 368 (100.0%) | $0 |
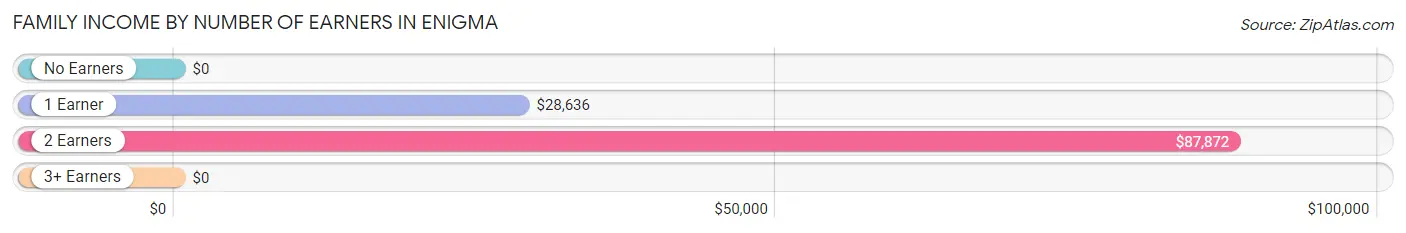
Family Income by Number of Earners in Enigma
| Number of Earners | # Families | Median Income |
| No Earners | 208 (56.5%) | $0 |
| 1 Earner | 44 (12.0%) | $28,636 |
| 2 Earners | 105 (28.5%) | $87,872 |
| 3+ Earners | 11 (3.0%) | $0 |
| Total | 368 (100.0%) | $0 |
Household Income in Enigma
Household Income Brackets in Enigma
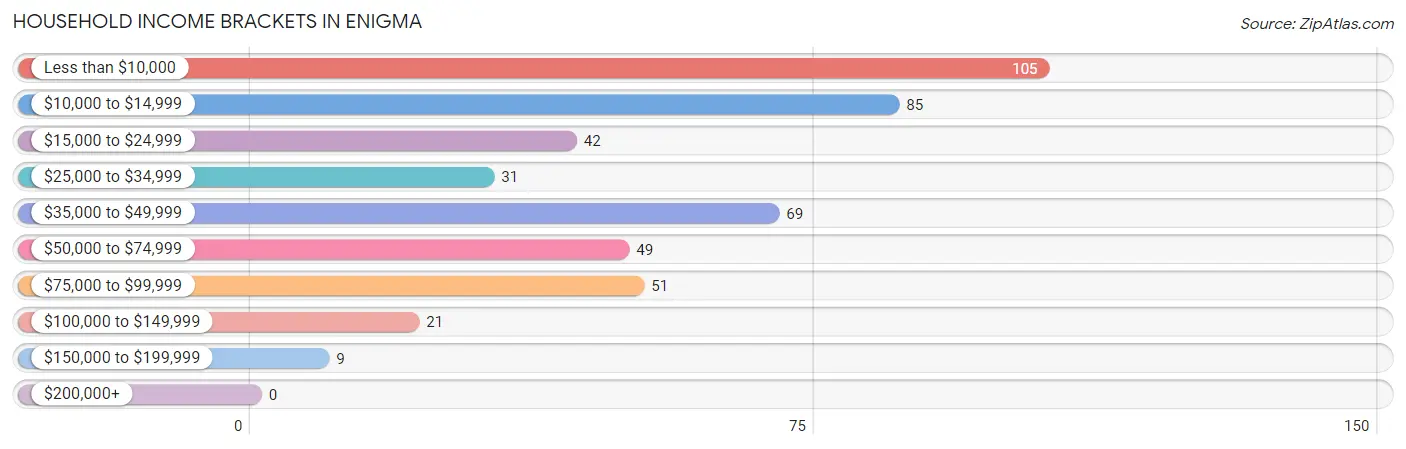
With 105 households falling in the category, the less than $10,000 income range is the most frequent in Enigma, accounting for 22.7% of all households.
| Income Bracket | # Households | % Households |
| Less than $10,000 | 105 | 22.7% |
| $10,000 to $14,999 | 85 | 18.4% |
| $15,000 to $24,999 | 42 | 9.1% |
| $25,000 to $34,999 | 31 | 6.7% |
| $35,000 to $49,999 | 69 | 14.9% |
| $50,000 to $74,999 | 49 | 10.6% |
| $75,000 to $99,999 | 51 | 11.0% |
| $100,000 to $149,999 | 21 | 4.5% |
| $150,000 to $199,999 | 9 | 1.9% |
| $200,000+ | 0 | 0.0% |
Household Income by Householder Age in Enigma
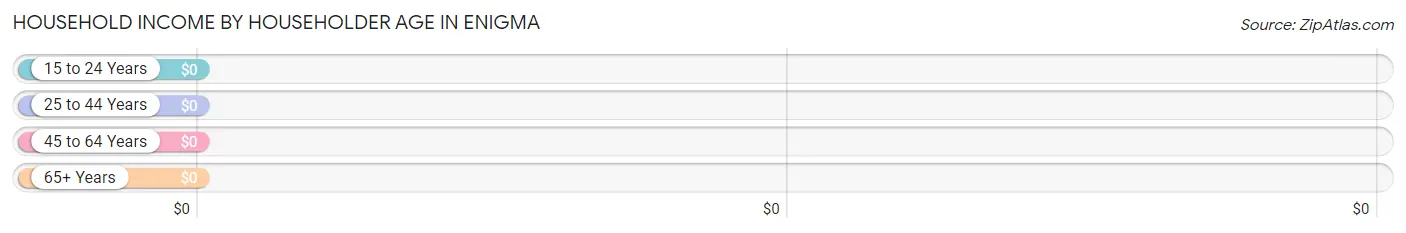
| Income Bracket | # Households | Median Income |
| 15 to 24 Years | 27 (5.8%) | $0 |
| 25 to 44 Years | 85 (18.4%) | $0 |
| 45 to 64 Years | 226 (48.9%) | $0 |
| 65+ Years | 124 (26.8%) | $0 |
| Total | 462 (100.0%) | $0 |
Poverty in Enigma
Income Below Poverty by Sex and Age in Enigma
With 44.4% poverty level for males and 53.5% for females among the residents of Enigma, 5 year old males and 6 to 11 year old females are the most vulnerable to poverty, with 14 males (100.0%) and 49 females (92.4%) in their respective age groups living below the poverty level.
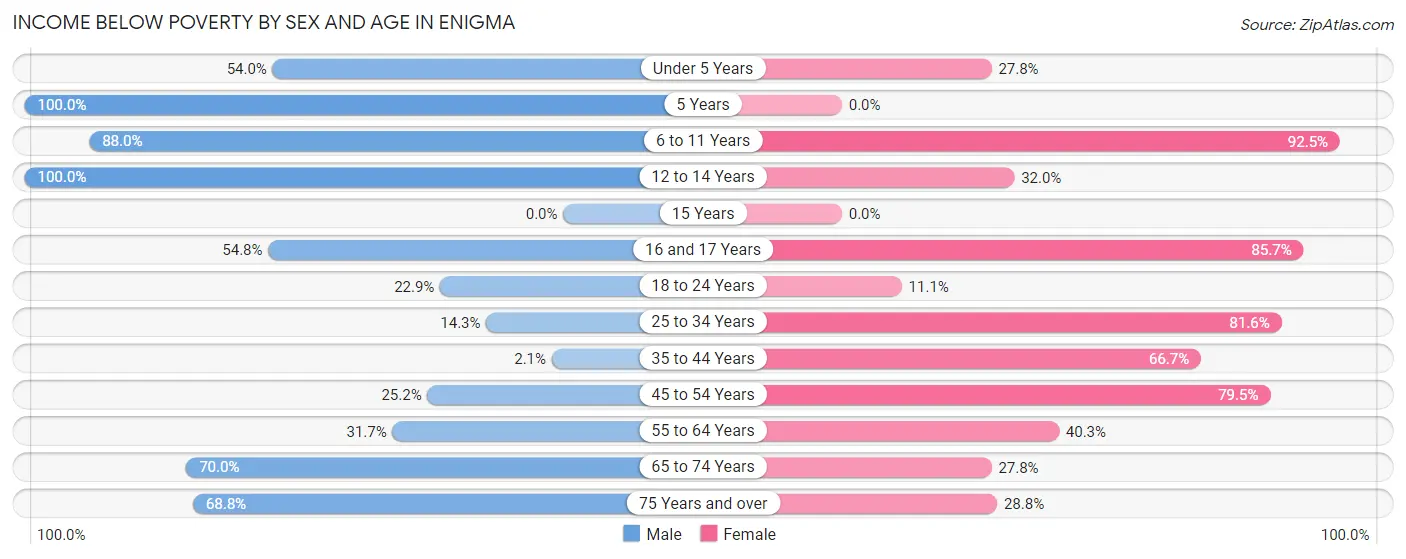
| Age Bracket | Male | Female |
| Under 5 Years | 41 (53.9%) | 5 (27.8%) |
| 5 Years | 14 (100.0%) | 0 (0.0%) |
| 6 to 11 Years | 44 (88.0%) | 49 (92.4%) |
| 12 to 14 Years | 41 (100.0%) | 8 (32.0%) |
| 15 Years | 0 (0.0%) | 0 (0.0%) |
| 16 and 17 Years | 23 (54.8%) | 24 (85.7%) |
| 18 to 24 Years | 16 (22.9%) | 3 (11.1%) |
| 25 to 34 Years | 7 (14.3%) | 40 (81.6%) |
| 35 to 44 Years | 1 (2.1%) | 34 (66.7%) |
| 45 to 54 Years | 29 (25.2%) | 66 (79.5%) |
| 55 to 64 Years | 26 (31.7%) | 56 (40.3%) |
| 65 to 74 Years | 28 (70.0%) | 15 (27.8%) |
| 75 Years and over | 22 (68.8%) | 17 (28.8%) |
| Total | 292 (44.4%) | 317 (53.5%) |
Income Above Poverty by Sex and Age in Enigma
According to the poverty statistics in Enigma, males aged 35 to 44 years and females aged 15 years are the age groups that are most secure financially, with 97.9% of males and 100.0% of females in these age groups living above the poverty line.
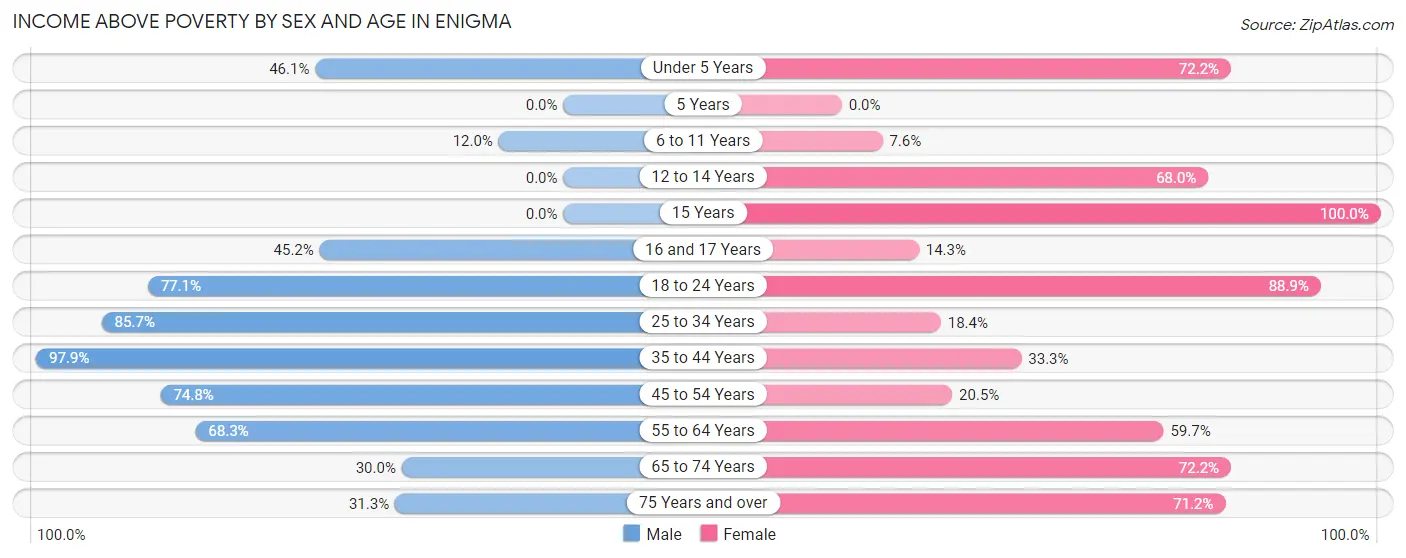
| Age Bracket | Male | Female |
| Under 5 Years | 35 (46.1%) | 13 (72.2%) |
| 5 Years | 0 (0.0%) | 0 (0.0%) |
| 6 to 11 Years | 6 (12.0%) | 4 (7.5%) |
| 12 to 14 Years | 0 (0.0%) | 17 (68.0%) |
| 15 Years | 0 (0.0%) | 7 (100.0%) |
| 16 and 17 Years | 19 (45.2%) | 4 (14.3%) |
| 18 to 24 Years | 54 (77.1%) | 24 (88.9%) |
| 25 to 34 Years | 42 (85.7%) | 9 (18.4%) |
| 35 to 44 Years | 46 (97.9%) | 17 (33.3%) |
| 45 to 54 Years | 86 (74.8%) | 17 (20.5%) |
| 55 to 64 Years | 56 (68.3%) | 83 (59.7%) |
| 65 to 74 Years | 12 (30.0%) | 39 (72.2%) |
| 75 Years and over | 10 (31.2%) | 42 (71.2%) |
| Total | 366 (55.6%) | 276 (46.5%) |
Income Below Poverty Among Married-Couple Families in Enigma
The poverty statistics for married-couple families in Enigma show that 40.8% or 87 of the total 213 families live below the poverty line. Families with no children have the highest poverty rate of 41.5%, comprising of 49 families. On the other hand, families with 3 or 4 children have the lowest poverty rate of 37.5%, which includes 3 families.
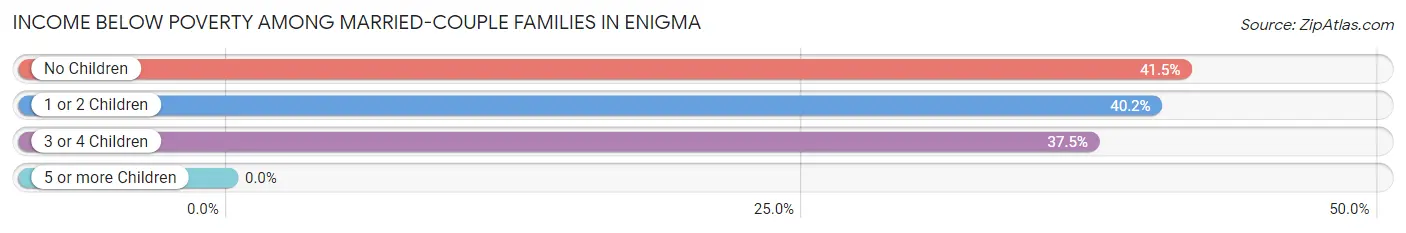
| Children | Above Poverty | Below Poverty |
| No Children | 69 (58.5%) | 49 (41.5%) |
| 1 or 2 Children | 52 (59.8%) | 35 (40.2%) |
| 3 or 4 Children | 5 (62.5%) | 3 (37.5%) |
| 5 or more Children | 0 (0.0%) | 0 (0.0%) |
| Total | 126 (59.2%) | 87 (40.8%) |
Income Below Poverty Among Single-Parent Households in Enigma
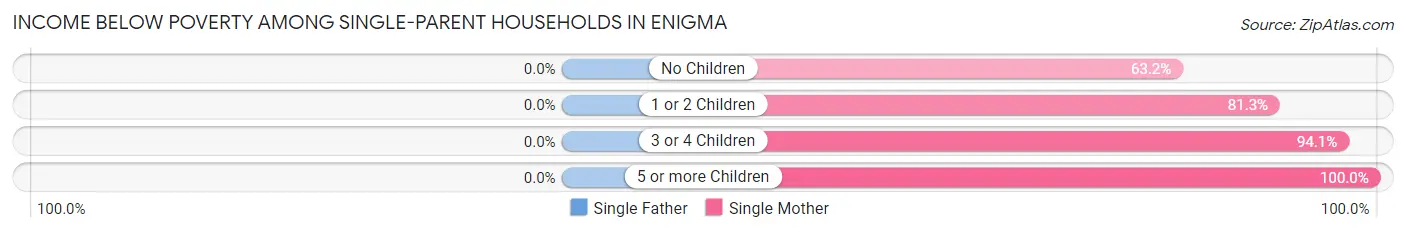
| Children | Single Father | Single Mother |
| No Children | 0 (0.0%) | 55 (63.2%) |
| 1 or 2 Children | 0 (0.0%) | 13 (81.2%) |
| 3 or 4 Children | 0 (0.0%) | 32 (94.1%) |
| 5 or more Children | 0 (0.0%) | 9 (100.0%) |
| Total | 0 (0.0%) | 109 (74.7%) |
Income Below Poverty Among Married-Couple vs Single-Parent Households in Enigma
The poverty data for Enigma shows that 87 of the married-couple family households (40.8%) and 109 of the single-parent households (70.3%) are living below the poverty level. Within the married-couple family households, those with no children have the highest poverty rate, with 49 households (41.5%) falling below the poverty line. Among the single-parent households, those with 5 or more children have the highest poverty rate, with 9 household (100.0%) living below poverty.
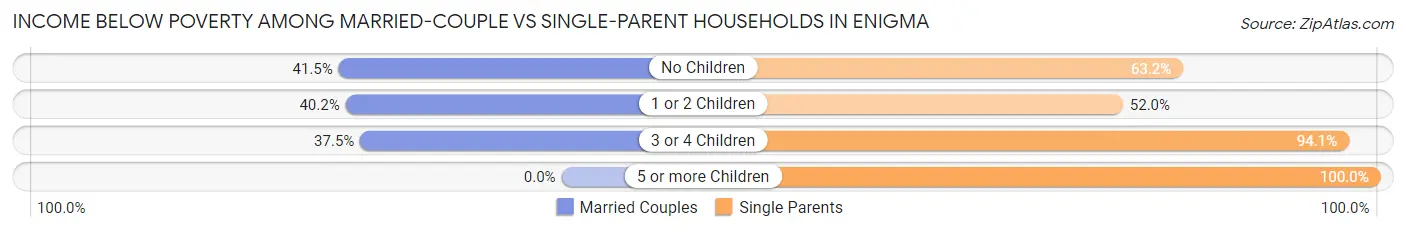
| Children | Married-Couple Families | Single-Parent Households |
| No Children | 49 (41.5%) | 55 (63.2%) |
| 1 or 2 Children | 35 (40.2%) | 13 (52.0%) |
| 3 or 4 Children | 3 (37.5%) | 32 (94.1%) |
| 5 or more Children | 0 (0.0%) | 9 (100.0%) |
| Total | 87 (40.8%) | 109 (70.3%) |
Race in Enigma
The most populous races in Enigma are White / Caucasian (1,010 | 80.7%), Hispanic or Latino (195 | 15.6%), and Two or more Races (96 | 7.7%).
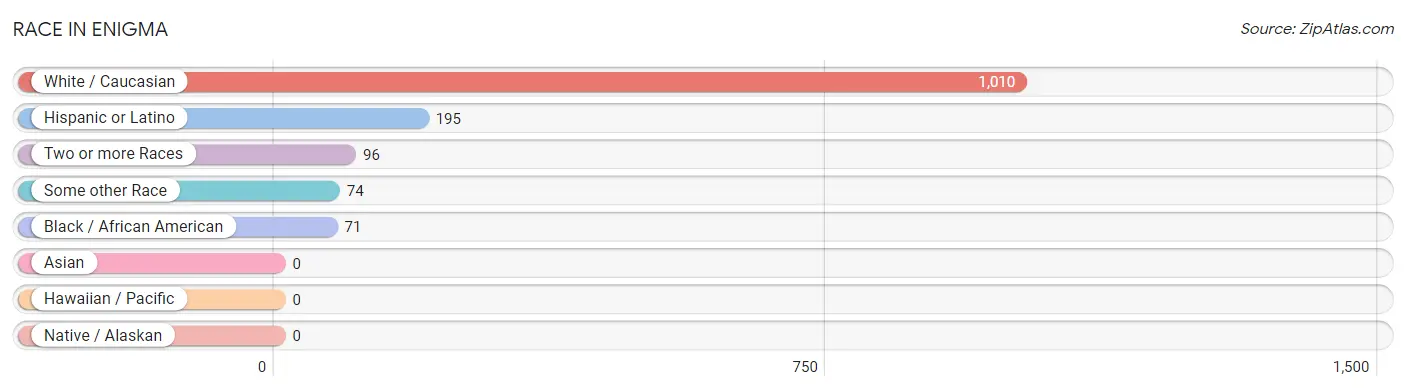
| Race | # Population | % Population |
| Asian | 0 | 0.0% |
| Black / African American | 71 | 5.7% |
| Hawaiian / Pacific | 0 | 0.0% |
| Hispanic or Latino | 195 | 15.6% |
| Native / Alaskan | 0 | 0.0% |
| White / Caucasian | 1,010 | 80.7% |
| Two or more Races | 96 | 7.7% |
| Some other Race | 74 | 5.9% |
| Total | 1,251 | 100.0% |
Ancestry in Enigma
The most populous ancestries reported in Enigma are Mexican (194 | 15.5%), American (77 | 6.2%), Irish (56 | 4.5%), French (51 | 4.1%), and German (42 | 3.4%), together accounting for 33.6% of all Enigma residents.
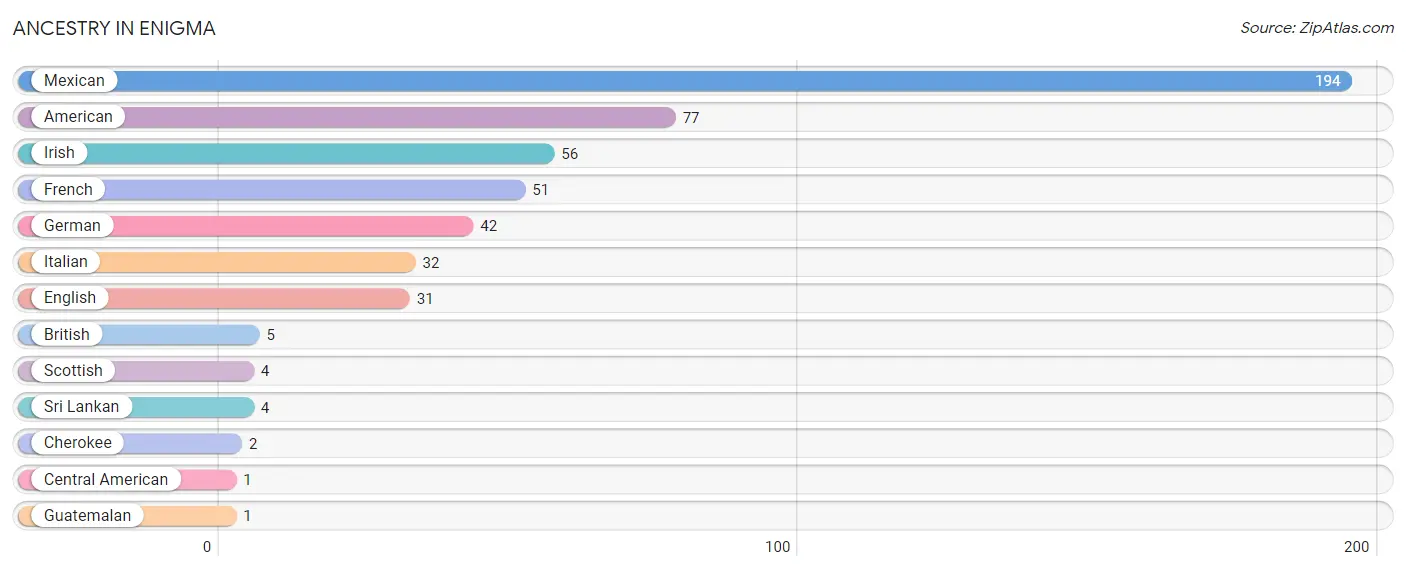
| Ancestry | # Population | % Population |
| American | 77 | 6.2% |
| British | 5 | 0.4% |
| Central American | 1 | 0.1% |
| Cherokee | 2 | 0.2% |
| English | 31 | 2.5% |
| French | 51 | 4.1% |
| German | 42 | 3.4% |
| Guatemalan | 1 | 0.1% |
| Irish | 56 | 4.5% |
| Italian | 32 | 2.6% |
| Mexican | 194 | 15.5% |
| Scottish | 4 | 0.3% |
| Sri Lankan | 4 | 0.3% | View All 13 Rows |
Immigrants in Enigma
The most numerous immigrant groups reported in Enigma came from Central America (36 | 2.9%), Latin America (36 | 2.9%), Mexico (35 | 2.8%), and Guatemala (1 | 0.1%), together accounting for 8.6% of all Enigma residents.
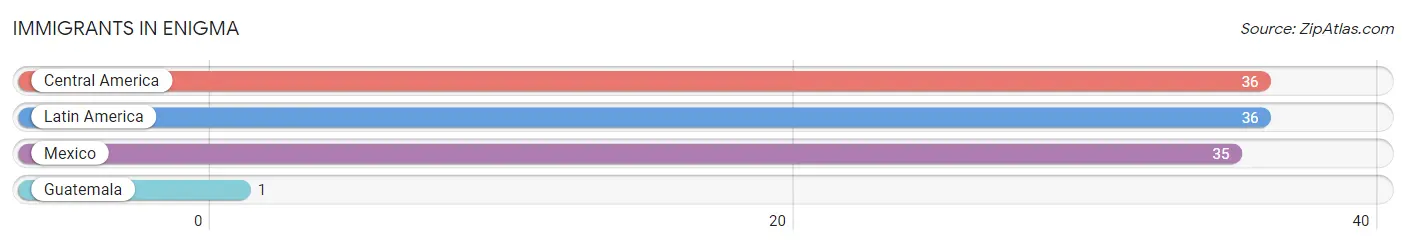
| Immigration Origin | # Population | % Population |
| Central America | 36 | 2.9% |
| Guatemala | 1 | 0.1% |
| Latin America | 36 | 2.9% |
| Mexico | 35 | 2.8% | View All 4 Rows |
Sex and Age in Enigma
Sex and Age in Enigma
The most populous age groups in Enigma are 50 to 54 Years (78 | 11.8%) for men and 60 to 64 Years (109 | 18.4%) for women.
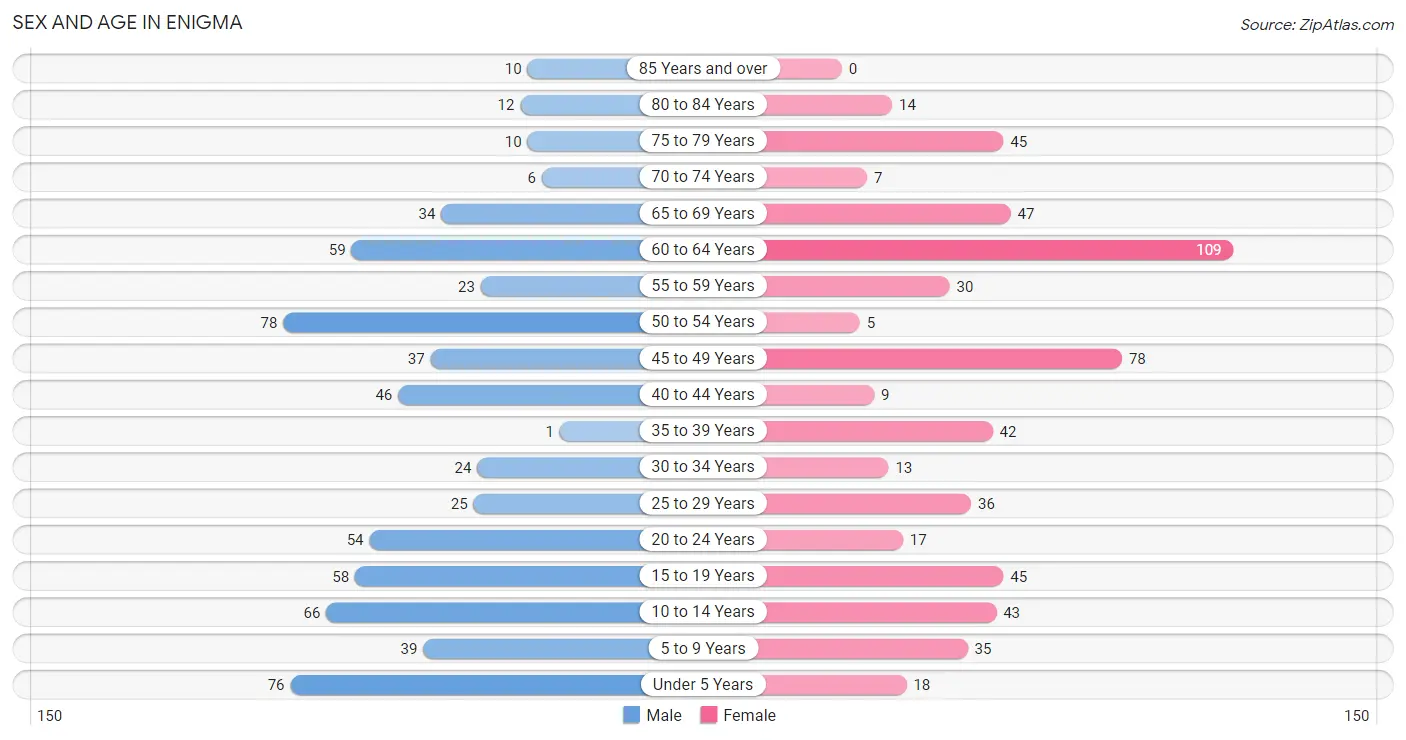
| Age Bracket | Male | Female |
| Under 5 Years | 76 (11.6%) | 18 (3.0%) |
| 5 to 9 Years | 39 (5.9%) | 35 (5.9%) |
| 10 to 14 Years | 66 (10.0%) | 43 (7.2%) |
| 15 to 19 Years | 58 (8.8%) | 45 (7.6%) |
| 20 to 24 Years | 54 (8.2%) | 17 (2.9%) |
| 25 to 29 Years | 25 (3.8%) | 36 (6.1%) |
| 30 to 34 Years | 24 (3.6%) | 13 (2.2%) |
| 35 to 39 Years | 1 (0.2%) | 42 (7.1%) |
| 40 to 44 Years | 46 (7.0%) | 9 (1.5%) |
| 45 to 49 Years | 37 (5.6%) | 78 (13.2%) |
| 50 to 54 Years | 78 (11.8%) | 5 (0.8%) |
| 55 to 59 Years | 23 (3.5%) | 30 (5.1%) |
| 60 to 64 Years | 59 (9.0%) | 109 (18.4%) |
| 65 to 69 Years | 34 (5.2%) | 47 (7.9%) |
| 70 to 74 Years | 6 (0.9%) | 7 (1.2%) |
| 75 to 79 Years | 10 (1.5%) | 45 (7.6%) |
| 80 to 84 Years | 12 (1.8%) | 14 (2.4%) |
| 85 Years and over | 10 (1.5%) | 0 (0.0%) |
| Total | 658 (100.0%) | 593 (100.0%) |
Families and Households in Enigma
Median Family Size in Enigma
The median family size in Enigma is 3.05 persons per family, with married-couple families (213 | 57.9%) accounting for the largest median family size of 3.18 persons per family. On the other hand, single female/mother families (146 | 39.7%) represent the smallest median family size with 2.86 persons per family.
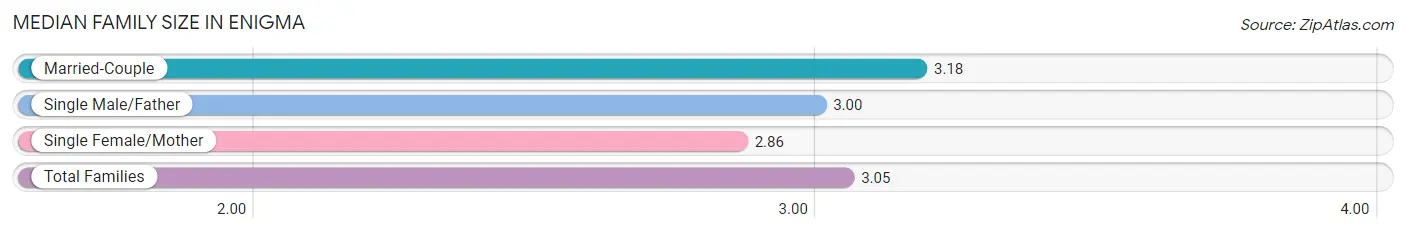
| Family Type | # Families | Family Size |
| Married-Couple | 213 (57.9%) | 3.18 |
| Single Male/Father | 9 (2.5%) | 3.00 |
| Single Female/Mother | 146 (39.7%) | 2.86 |
| Total Families | 368 (100.0%) | 3.05 |
Median Household Size in Enigma
The median household size in Enigma is 2.71 persons per household, with married-couple households (213 | 46.1%) accounting for the largest median household size of 3.18 persons per household. non-family households (94 | 20.3%) represent the smallest median household size with 1.21 persons per household.
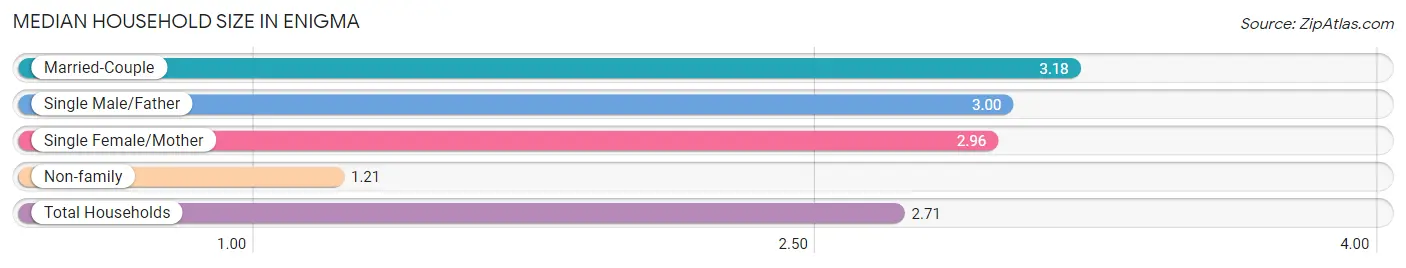
| Household Type | # Households | Household Size |
| Married-Couple | 213 (46.1%) | 3.18 |
| Single Male/Father | 9 (1.9%) | 3.00 |
| Single Female/Mother | 146 (31.6%) | 2.96 |
| Non-family | 94 (20.3%) | 1.21 |
| Total Households | 462 (100.0%) | 2.71 |
Household Size by Marriage Status in Enigma
Out of a total of 462 households in Enigma, 368 (79.6%) are family households, while 94 (20.3%) are nonfamily households. The most numerous type of family households are 2-person households, comprising 187, and the most common type of nonfamily households are 1-person households, comprising 83.
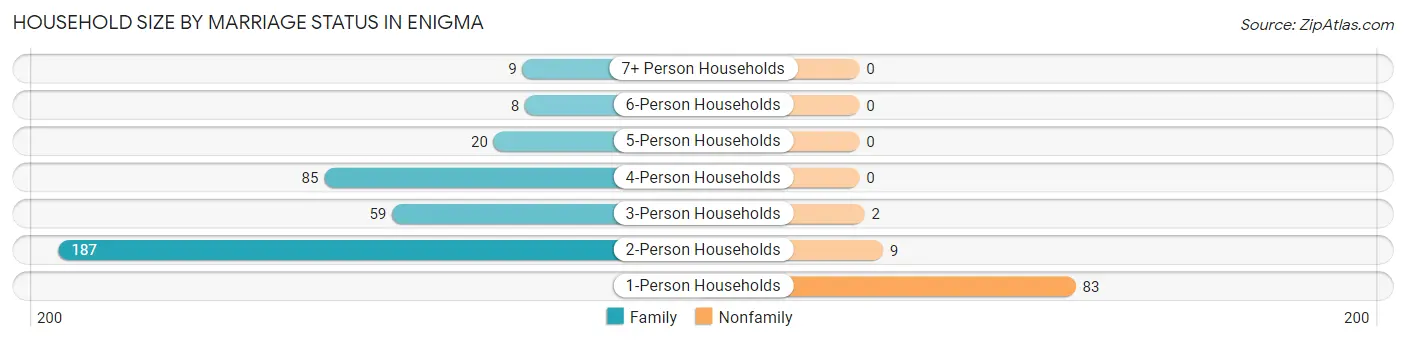
| Household Size | Family Households | Nonfamily Households |
| 1-Person Households | - | 83 (18.0%) |
| 2-Person Households | 187 (40.5%) | 9 (1.9%) |
| 3-Person Households | 59 (12.8%) | 2 (0.4%) |
| 4-Person Households | 85 (18.4%) | 0 (0.0%) |
| 5-Person Households | 20 (4.3%) | 0 (0.0%) |
| 6-Person Households | 8 (1.7%) | 0 (0.0%) |
| 7+ Person Households | 9 (1.9%) | 0 (0.0%) |
| Total | 368 (79.6%) | 94 (20.3%) |
Female Fertility in Enigma
Fertility by Age in Enigma
Average fertility rate in Enigma is 128.0 births per 1,000 women. Women in the age bracket of 20 to 34 years have the highest fertility rate with 470.0 births per 1,000 women. Women in the age bracket of 20 to 34 years acount for 100.0% of all women with births.
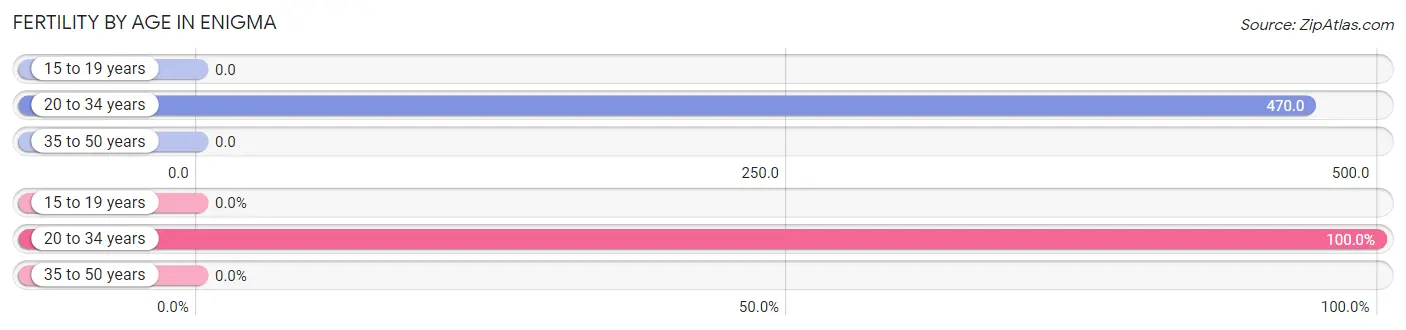
| Age Bracket | Women with Births | Births / 1,000 Women |
| 15 to 19 years | 0 (0.0%) | 0.0 |
| 20 to 34 years | 31 (100.0%) | 470.0 |
| 35 to 50 years | 0 (0.0%) | 0.0 |
| Total | 31 (100.0%) | 128.0 |
Fertility by Age by Marriage Status in Enigma
64.5% of women with births (31) in Enigma are married. The highest percentage of unmarried women with births falls into 20 to 34 years age bracket with 35.5% of them unmarried at the time of birth, while the lowest percentage of unmarried women with births belong to 20 to 34 years age bracket with 35.5% of them unmarried.

| Age Bracket | Married | Unmarried |
| 15 to 19 years | 0 (0.0%) | 0 (0.0%) |
| 20 to 34 years | 20 (64.5%) | 11 (35.5%) |
| 35 to 50 years | 0 (0.0%) | 0 (0.0%) |
| Total | 20 (64.5%) | 11 (35.5%) |
Fertility by Education in Enigma
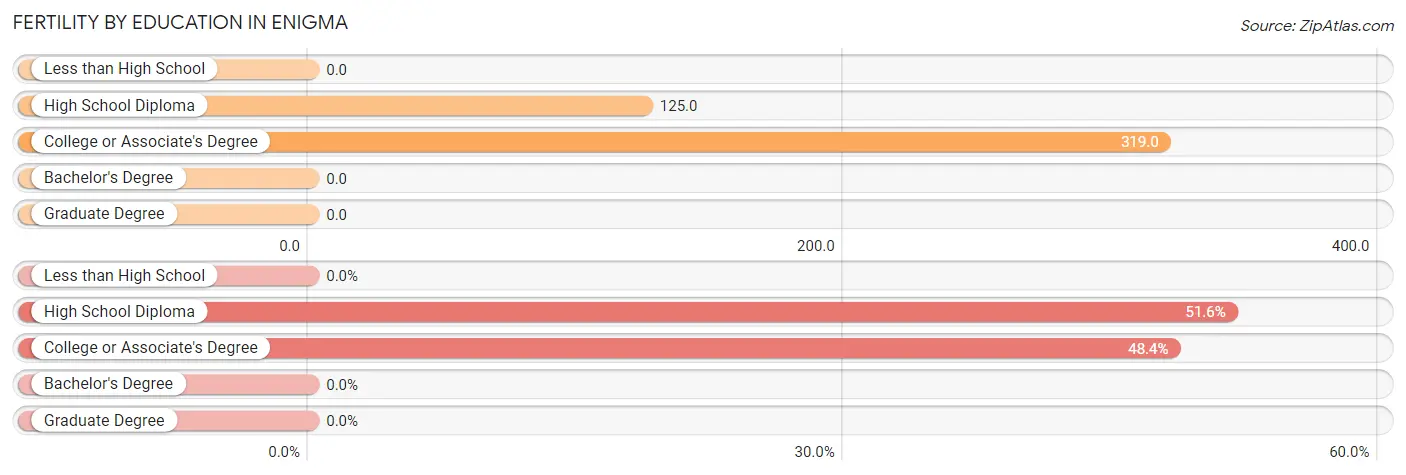
| Educational Attainment | Women with Births | Births / 1,000 Women |
| Less than High School | 0 (0.0%) | 0.0 |
| High School Diploma | 16 (51.6%) | 125.0 |
| College or Associate's Degree | 15 (48.4%) | 319.0 |
| Bachelor's Degree | 0 (0.0%) | 0.0 |
| Graduate Degree | 0 (0.0%) | 0.0 |
| Total | 31 (100.0%) | 128.0 |
Fertility by Education by Marriage Status in Enigma
35.5% of women with births in Enigma are unmarried. Women with the educational attainment of college or associate's degree are most likely to be married with 100.0% of them married at childbirth, while women with the educational attainment of high school diploma are least likely to be married with 68.8% of them unmarried at childbirth.
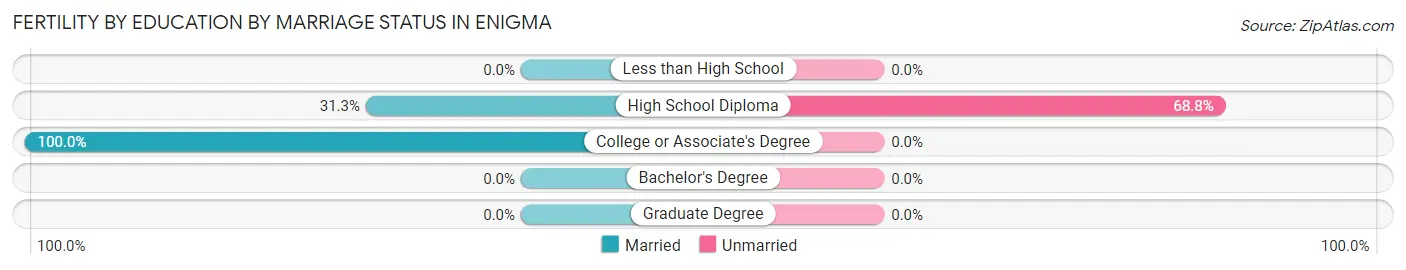
| Educational Attainment | Married | Unmarried |
| Less than High School | 0 (0.0%) | 0 (0.0%) |
| High School Diploma | 5 (31.2%) | 11 (68.8%) |
| College or Associate's Degree | 15 (100.0%) | 0 (0.0%) |
| Bachelor's Degree | 0 (0.0%) | 0 (0.0%) |
| Graduate Degree | 0 (0.0%) | 0 (0.0%) |
| Total | 20 (64.5%) | 11 (35.5%) |
Employment Characteristics in Enigma
Employment by Class of Employer in Enigma
Among the 350 employed individuals in Enigma, private company employees (271 | 77.4%), self-employed (not incorporated) (35 | 10.0%), and state government employees (24 | 6.9%) make up the most common classes of employment.
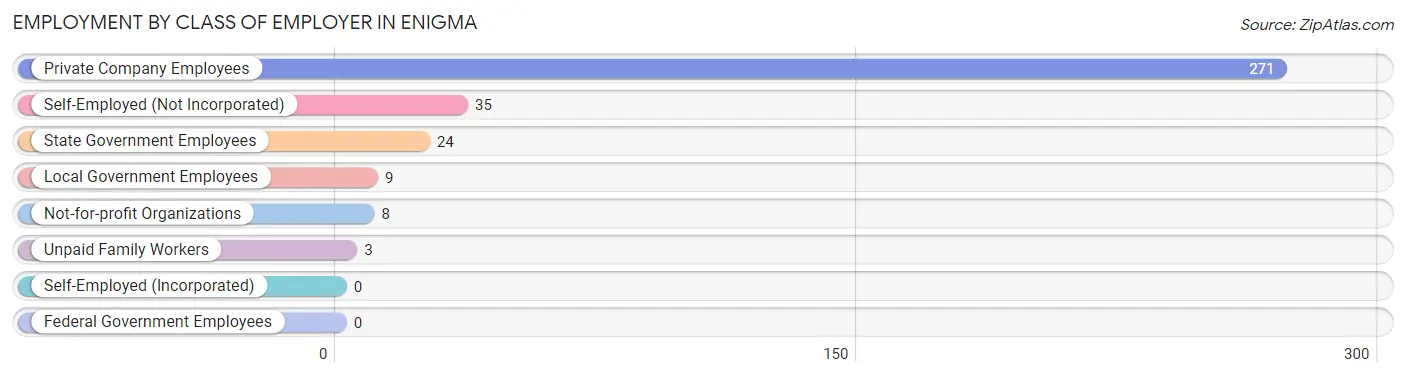
| Employer Class | # Employees | % Employees |
| Private Company Employees | 271 | 77.4% |
| Self-Employed (Incorporated) | 0 | 0.0% |
| Self-Employed (Not Incorporated) | 35 | 10.0% |
| Not-for-profit Organizations | 8 | 2.3% |
| Local Government Employees | 9 | 2.6% |
| State Government Employees | 24 | 6.9% |
| Federal Government Employees | 0 | 0.0% |
| Unpaid Family Workers | 3 | 0.9% |
| Total | 350 | 100.0% |
Employment Status by Age in Enigma
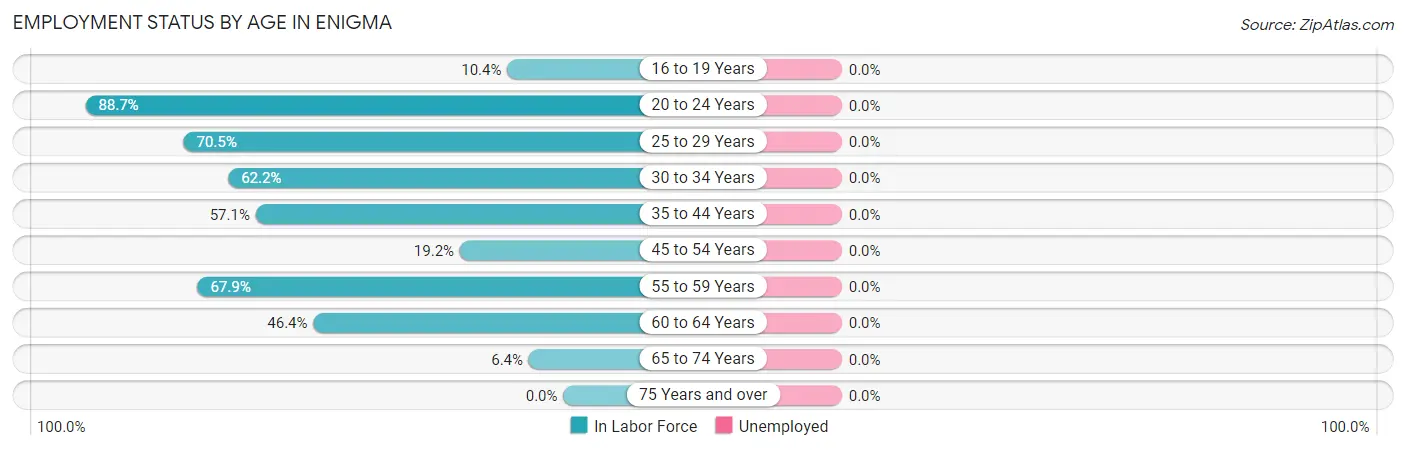
| Age Bracket | In Labor Force | Unemployed |
| 16 to 19 Years | 10 (10.4%) | 0 (0.0%) |
| 20 to 24 Years | 63 (88.7%) | 0 (0.0%) |
| 25 to 29 Years | 43 (70.5%) | 0 (0.0%) |
| 30 to 34 Years | 23 (62.2%) | 0 (0.0%) |
| 35 to 44 Years | 56 (57.1%) | 0 (0.0%) |
| 45 to 54 Years | 38 (19.2%) | 0 (0.0%) |
| 55 to 59 Years | 36 (67.9%) | 0 (0.0%) |
| 60 to 64 Years | 78 (46.4%) | 0 (0.0%) |
| 65 to 74 Years | 6 (6.4%) | 0 (0.0%) |
| 75 Years and over | 0 (0.0%) | 0 (0.0%) |
| Total | 353 (36.5%) | 0 (0.0%) |
Employment Status by Educational Attainment in Enigma
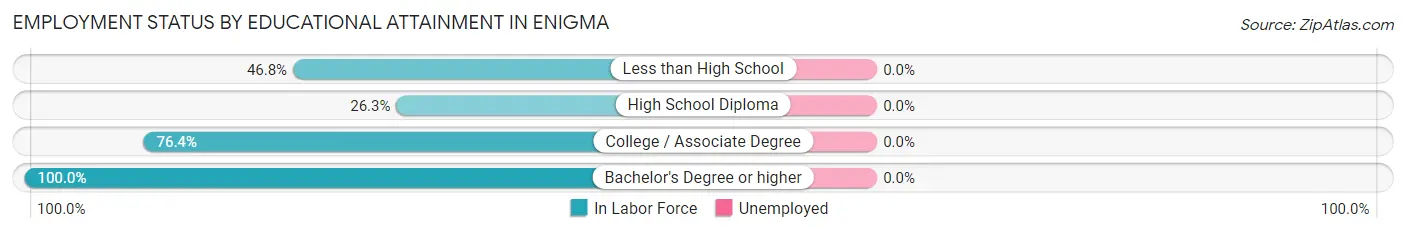
| Educational Attainment | In Labor Force | Unemployed |
| Less than High School | 72 (46.8%) | 0 (0.0%) |
| High School Diploma | 83 (26.3%) | 0 (0.0%) |
| College / Associate Degree | 84 (76.4%) | 0 (0.0%) |
| Bachelor's Degree or higher | 35 (100.0%) | 0 (0.0%) |
| Total | 274 (44.6%) | 0 (0.0%) |
Employment Occupations by Sex in Enigma
Management, Business, Science and Arts Occupations
The most common Management, Business, Science and Arts occupations in Enigma are Computers, Engineering & Science (29 | 8.2%), Architecture & Engineering (29 | 8.2%), Community & Social Service (19 | 5.4%), Education Instruction & Library (19 | 5.4%), and Health Diagnosing & Treating (6 | 1.7%).
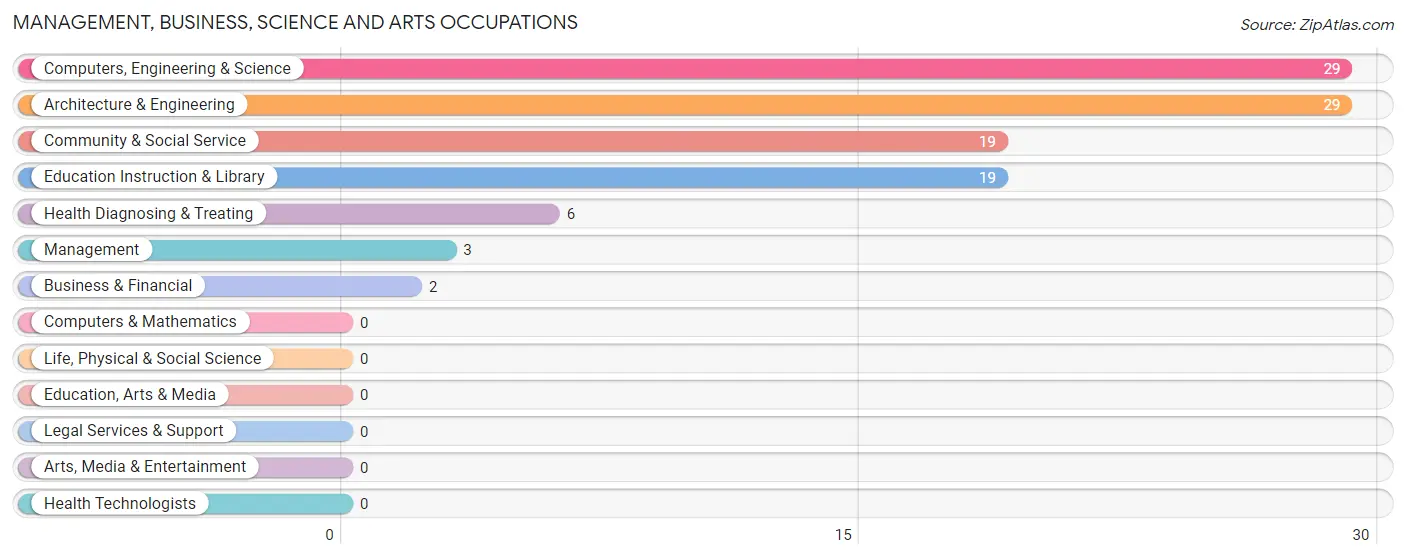
Management, Business, Science and Arts Occupations by Sex
Within the Management, Business, Science and Arts occupations in Enigma, the most male-oriented occupations are Computers, Engineering & Science (100.0%), and Architecture & Engineering (100.0%), while the most female-oriented occupations are Management (100.0%), Business & Financial (100.0%), and Community & Social Service (100.0%).
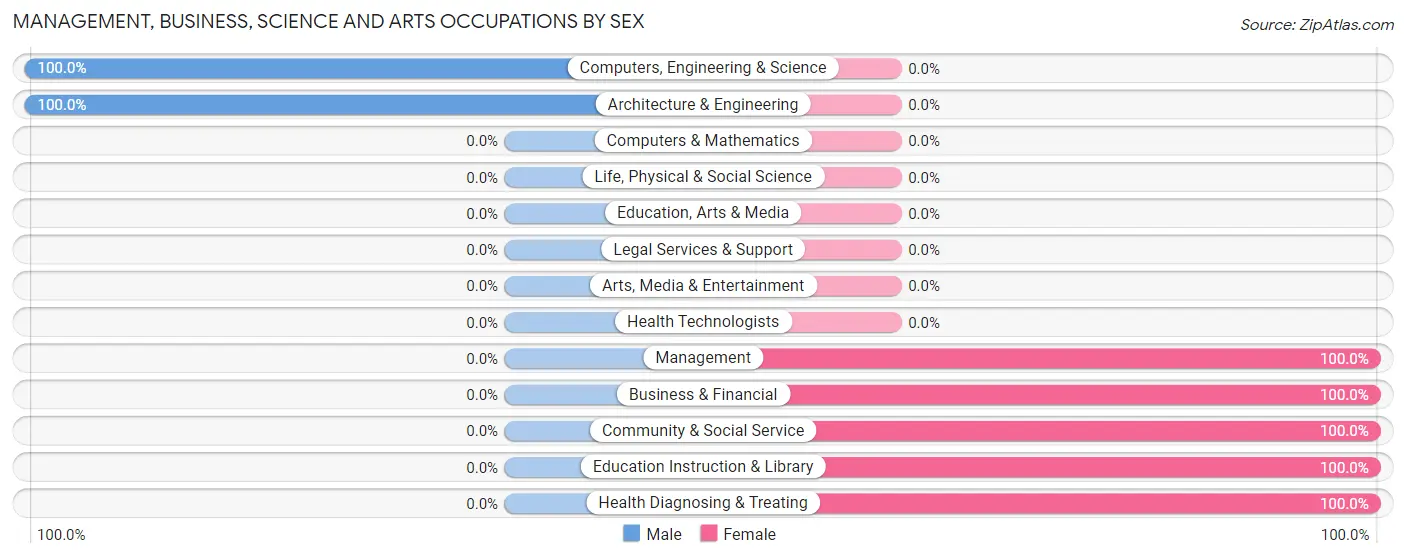
| Occupation | Male | Female |
| Management | 0 (0.0%) | 3 (100.0%) |
| Business & Financial | 0 (0.0%) | 2 (100.0%) |
| Computers, Engineering & Science | 29 (100.0%) | 0 (0.0%) |
| Computers & Mathematics | 0 (0.0%) | 0 (0.0%) |
| Architecture & Engineering | 29 (100.0%) | 0 (0.0%) |
| Life, Physical & Social Science | 0 (0.0%) | 0 (0.0%) |
| Community & Social Service | 0 (0.0%) | 19 (100.0%) |
| Education, Arts & Media | 0 (0.0%) | 0 (0.0%) |
| Legal Services & Support | 0 (0.0%) | 0 (0.0%) |
| Education Instruction & Library | 0 (0.0%) | 19 (100.0%) |
| Arts, Media & Entertainment | 0 (0.0%) | 0 (0.0%) |
| Health Diagnosing & Treating | 0 (0.0%) | 6 (100.0%) |
| Health Technologists | 0 (0.0%) | 0 (0.0%) |
| Total (Category) | 29 (49.1%) | 30 (50.8%) |
| Total (Overall) | 228 (64.6%) | 125 (35.4%) |
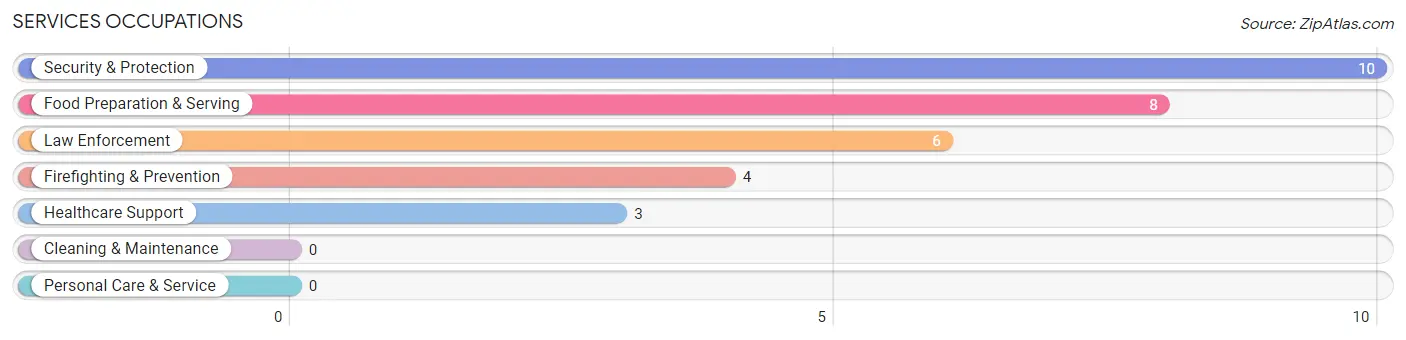
Services Occupations
The most common Services occupations in Enigma are Security & Protection (10 | 2.8%), Food Preparation & Serving (8 | 2.3%), Law Enforcement (6 | 1.7%), Firefighting & Prevention (4 | 1.1%), and Healthcare Support (3 | 0.9%).
Services Occupations by Sex
Within the Services occupations in Enigma, the most male-oriented occupations are Security & Protection (100.0%), Firefighting & Prevention (100.0%), and Law Enforcement (100.0%), while the most female-oriented occupations are Healthcare Support (100.0%), and Food Preparation & Serving (75.0%).
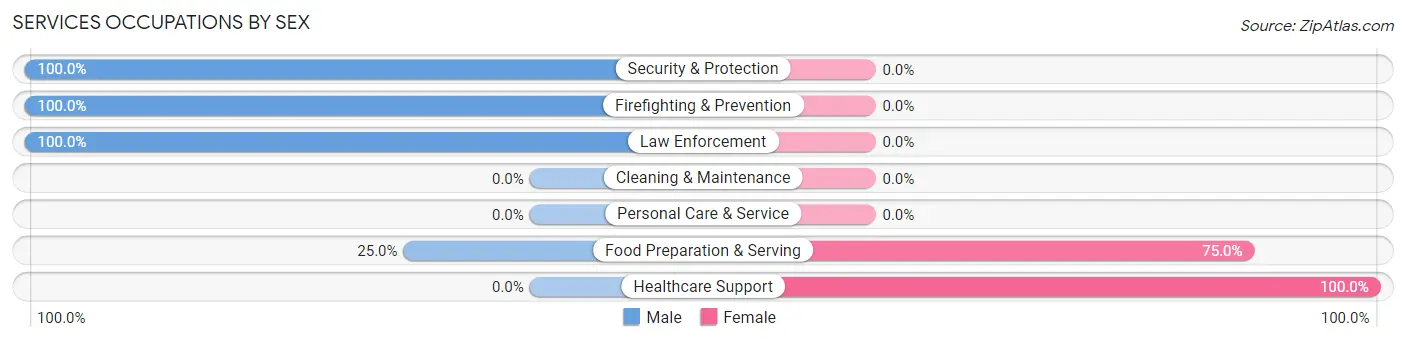
| Occupation | Male | Female |
| Healthcare Support | 0 (0.0%) | 3 (100.0%) |
| Security & Protection | 10 (100.0%) | 0 (0.0%) |
| Firefighting & Prevention | 4 (100.0%) | 0 (0.0%) |
| Law Enforcement | 6 (100.0%) | 0 (0.0%) |
| Food Preparation & Serving | 2 (25.0%) | 6 (75.0%) |
| Cleaning & Maintenance | 0 (0.0%) | 0 (0.0%) |
| Personal Care & Service | 0 (0.0%) | 0 (0.0%) |
| Total (Category) | 12 (57.1%) | 9 (42.9%) |
| Total (Overall) | 228 (64.6%) | 125 (35.4%) |
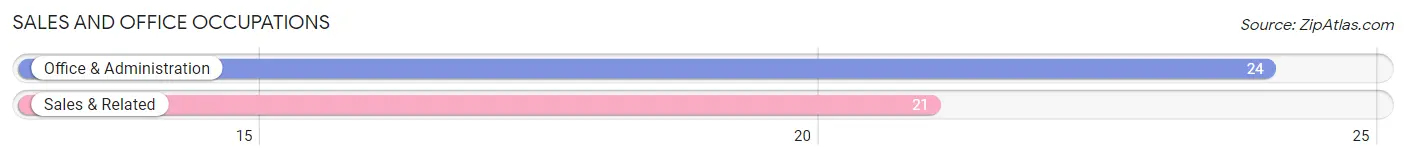
Sales and Office Occupations
The most common Sales and Office occupations in Enigma are Office & Administration (24 | 6.8%), and Sales & Related (21 | 5.9%).
Sales and Office Occupations by Sex
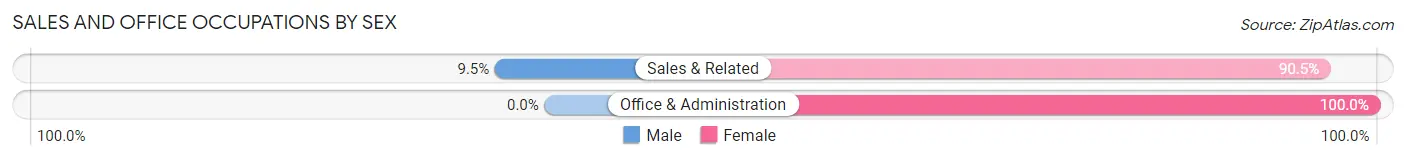
| Occupation | Male | Female |
| Sales & Related | 2 (9.5%) | 19 (90.5%) |
| Office & Administration | 0 (0.0%) | 24 (100.0%) |
| Total (Category) | 2 (4.4%) | 43 (95.6%) |
| Total (Overall) | 228 (64.6%) | 125 (35.4%) |
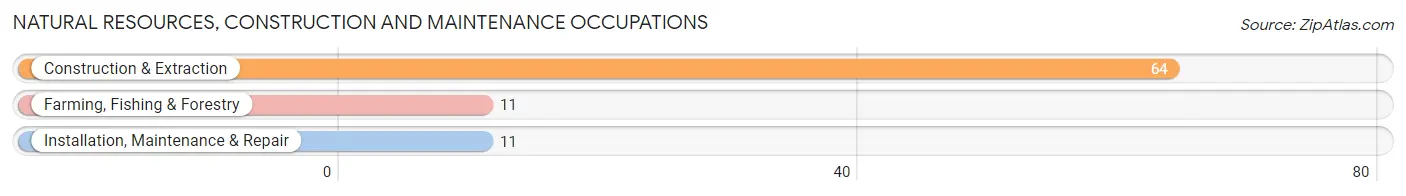
Natural Resources, Construction and Maintenance Occupations
The most common Natural Resources, Construction and Maintenance occupations in Enigma are Construction & Extraction (64 | 18.1%), Farming, Fishing & Forestry (11 | 3.1%), and Installation, Maintenance & Repair (11 | 3.1%).
Natural Resources, Construction and Maintenance Occupations by Sex
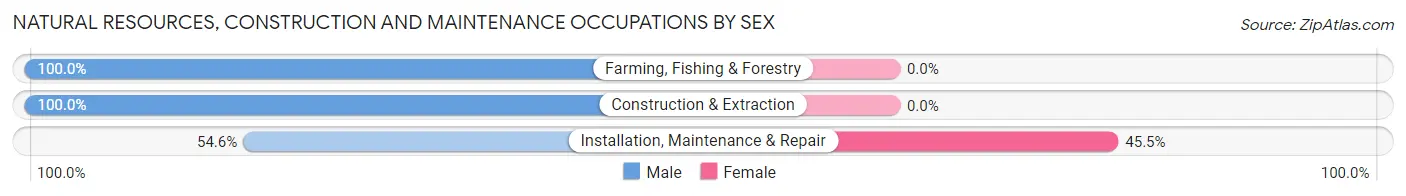
| Occupation | Male | Female |
| Farming, Fishing & Forestry | 11 (100.0%) | 0 (0.0%) |
| Construction & Extraction | 64 (100.0%) | 0 (0.0%) |
| Installation, Maintenance & Repair | 6 (54.5%) | 5 (45.5%) |
| Total (Category) | 81 (94.2%) | 5 (5.8%) |
| Total (Overall) | 228 (64.6%) | 125 (35.4%) |
Production, Transportation and Moving Occupations
The most common Production, Transportation and Moving occupations in Enigma are Production (72 | 20.4%), Transportation (49 | 13.9%), and Material Moving (21 | 5.9%).
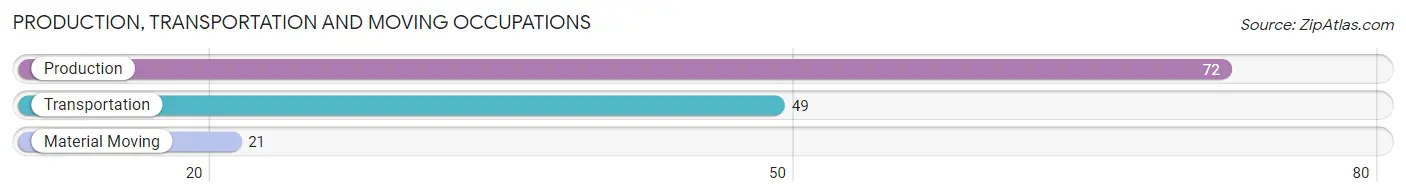
Production, Transportation and Moving Occupations by Sex
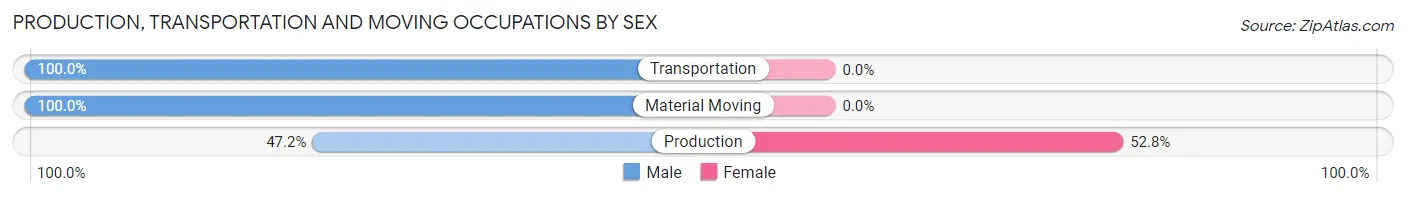
| Occupation | Male | Female |
| Production | 34 (47.2%) | 38 (52.8%) |
| Transportation | 49 (100.0%) | 0 (0.0%) |
| Material Moving | 21 (100.0%) | 0 (0.0%) |
| Total (Category) | 104 (73.2%) | 38 (26.8%) |
| Total (Overall) | 228 (64.6%) | 125 (35.4%) |
Employment Industries by Sex in Enigma
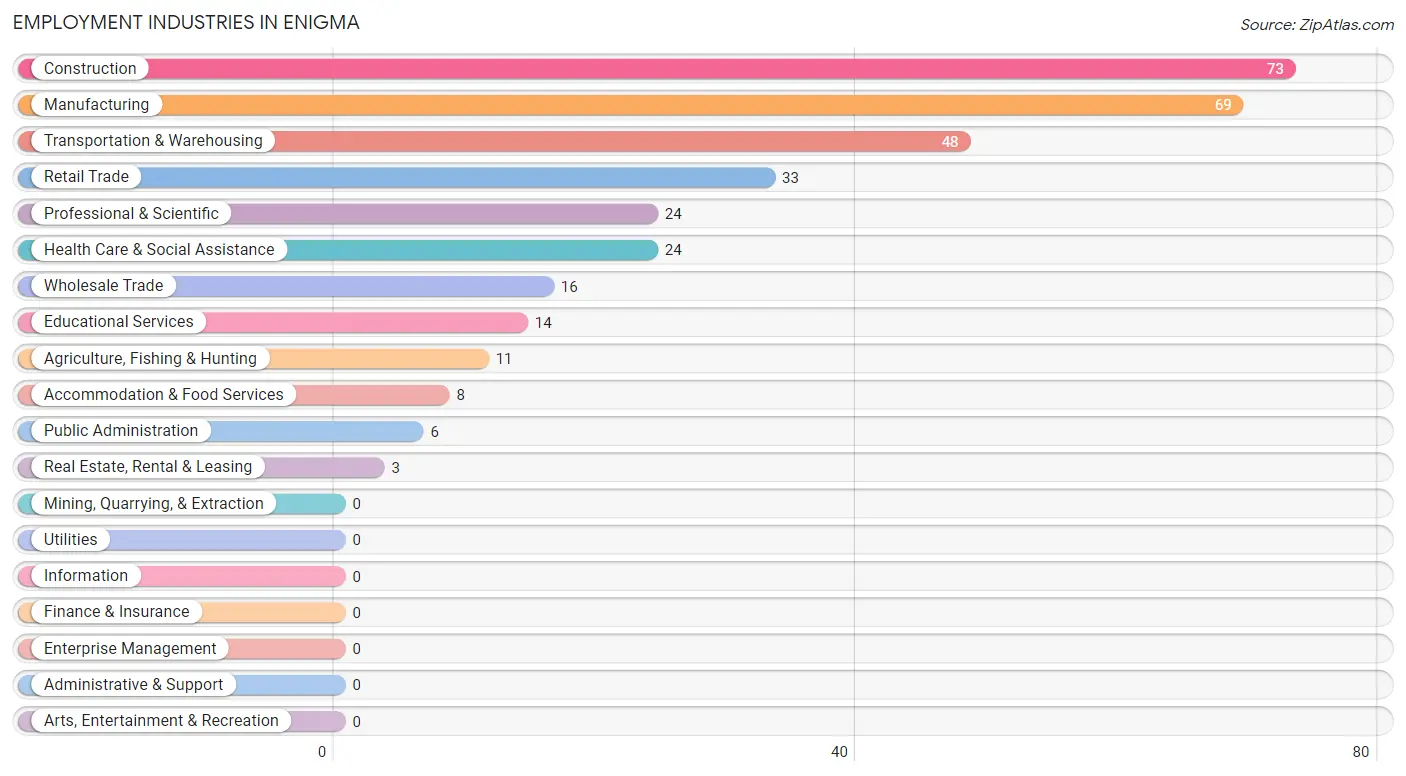
Employment Industries in Enigma
The major employment industries in Enigma include Construction (73 | 20.7%), Manufacturing (69 | 19.6%), Transportation & Warehousing (48 | 13.6%), Retail Trade (33 | 9.3%), and Professional & Scientific (24 | 6.8%).
Employment Industries by Sex in Enigma
The Enigma industries that see more men than women are Agriculture, Fishing & Hunting (100.0%), Construction (100.0%), and Wholesale Trade (100.0%), whereas the industries that tend to have a higher number of women are Real Estate, Rental & Leasing (100.0%), Educational Services (100.0%), and Health Care & Social Assistance (100.0%).
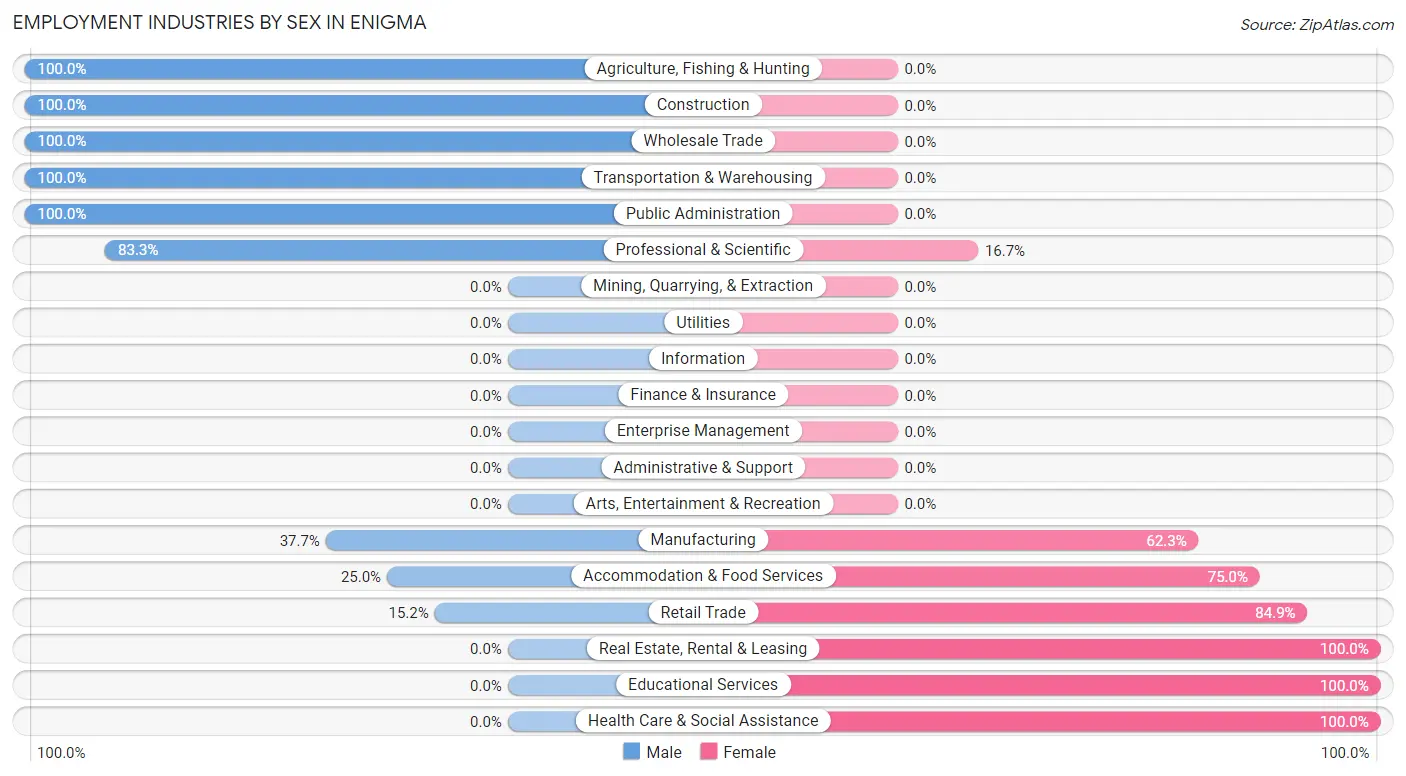
| Industry | Male | Female |
| Agriculture, Fishing & Hunting | 11 (100.0%) | 0 (0.0%) |
| Mining, Quarrying, & Extraction | 0 (0.0%) | 0 (0.0%) |
| Construction | 73 (100.0%) | 0 (0.0%) |
| Manufacturing | 26 (37.7%) | 43 (62.3%) |
| Wholesale Trade | 16 (100.0%) | 0 (0.0%) |
| Retail Trade | 5 (15.1%) | 28 (84.9%) |
| Transportation & Warehousing | 48 (100.0%) | 0 (0.0%) |
| Utilities | 0 (0.0%) | 0 (0.0%) |
| Information | 0 (0.0%) | 0 (0.0%) |
| Finance & Insurance | 0 (0.0%) | 0 (0.0%) |
| Real Estate, Rental & Leasing | 0 (0.0%) | 3 (100.0%) |
| Professional & Scientific | 20 (83.3%) | 4 (16.7%) |
| Enterprise Management | 0 (0.0%) | 0 (0.0%) |
| Administrative & Support | 0 (0.0%) | 0 (0.0%) |
| Educational Services | 0 (0.0%) | 14 (100.0%) |
| Health Care & Social Assistance | 0 (0.0%) | 24 (100.0%) |
| Arts, Entertainment & Recreation | 0 (0.0%) | 0 (0.0%) |
| Accommodation & Food Services | 2 (25.0%) | 6 (75.0%) |
| Public Administration | 6 (100.0%) | 0 (0.0%) |
| Total | 228 (64.6%) | 125 (35.4%) |
Education in Enigma
School Enrollment in Enigma
The most common levels of schooling among the 327 students in Enigma are middle school (94 | 28.7%), high school (89 | 27.2%), and elementary school (54 | 16.5%).
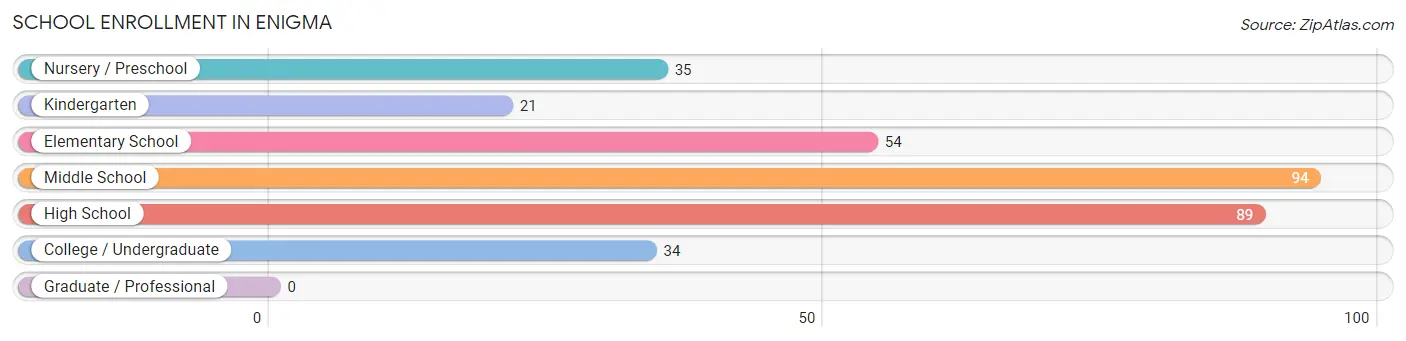
| School Level | # Students | % Students |
| Nursery / Preschool | 35 | 10.7% |
| Kindergarten | 21 | 6.4% |
| Elementary School | 54 | 16.5% |
| Middle School | 94 | 28.7% |
| High School | 89 | 27.2% |
| College / Undergraduate | 34 | 10.4% |
| Graduate / Professional | 0 | 0.0% |
| Total | 327 | 100.0% |
School Enrollment by Age by Funding Source in Enigma
Out of a total of 327 students who are enrolled in schools in Enigma, 8 (2.4%) attend a private institution, while the remaining 319 (97.6%) are enrolled in public schools. The age group of 3 to 4 year olds has the highest likelihood of being enrolled in private schools, with 8 (25.8% in the age bracket) enrolled. Conversely, the age group of 5 to 9 year old has the lowest likelihood of being enrolled in a private school, with 64 (100.0% in the age bracket) attending a public institution.
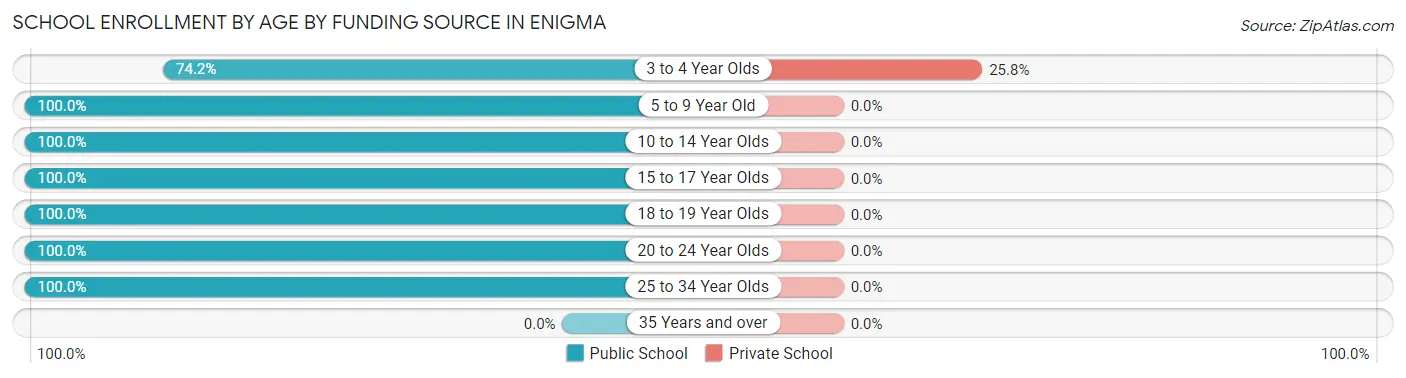
| Age Bracket | Public School | Private School |
| 3 to 4 Year Olds | 23 (74.2%) | 8 (25.8%) |
| 5 to 9 Year Old | 64 (100.0%) | 0 (0.0%) |
| 10 to 14 Year Olds | 109 (100.0%) | 0 (0.0%) |
| 15 to 17 Year Olds | 77 (100.0%) | 0 (0.0%) |
| 18 to 19 Year Olds | 20 (100.0%) | 0 (0.0%) |
| 20 to 24 Year Olds | 20 (100.0%) | 0 (0.0%) |
| 25 to 34 Year Olds | 6 (100.0%) | 0 (0.0%) |
| 35 Years and over | 0 (0.0%) | 0 (0.0%) |
| Total | 319 (97.6%) | 8 (2.4%) |
Educational Attainment by Field of Study in Enigma
Education (30 | 71.4%), science & technology (7 | 16.7%), and business (5 | 11.9%) are the most common fields of study among 42 individuals in Enigma who have obtained a bachelor's degree or higher.
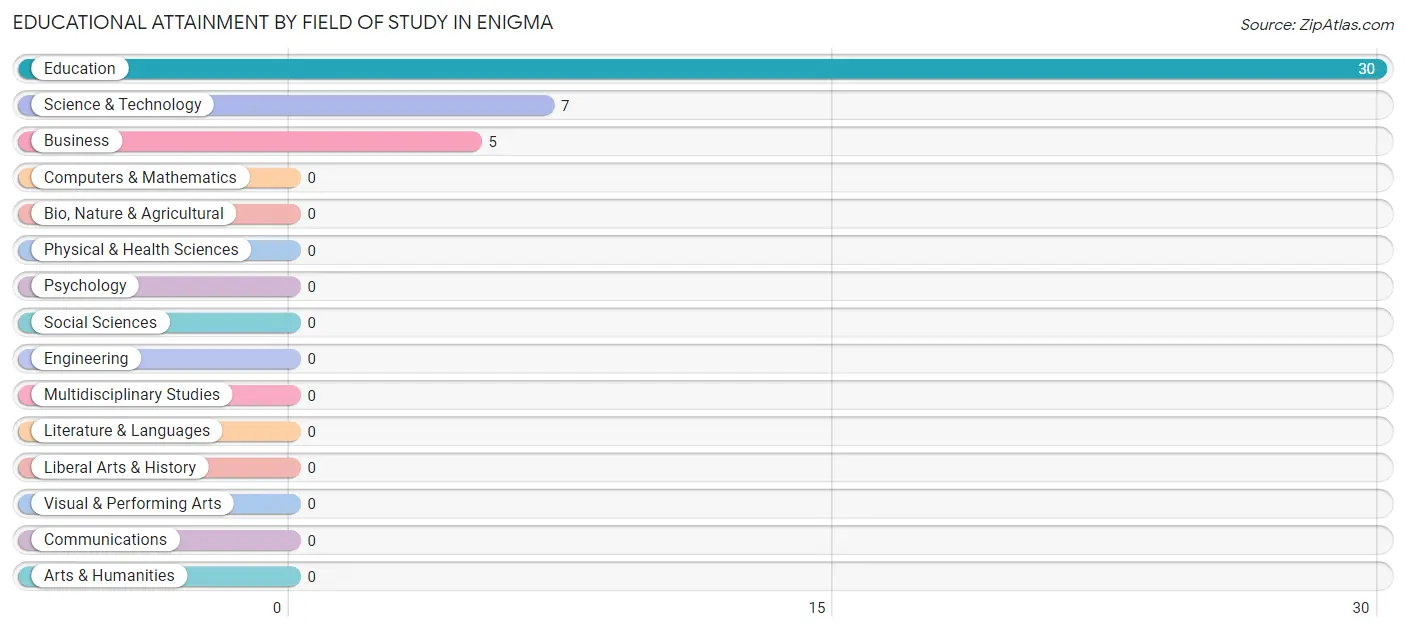
| Field of Study | # Graduates | % Graduates |
| Computers & Mathematics | 0 | 0.0% |
| Bio, Nature & Agricultural | 0 | 0.0% |
| Physical & Health Sciences | 0 | 0.0% |
| Psychology | 0 | 0.0% |
| Social Sciences | 0 | 0.0% |
| Engineering | 0 | 0.0% |
| Multidisciplinary Studies | 0 | 0.0% |
| Science & Technology | 7 | 16.7% |
| Business | 5 | 11.9% |
| Education | 30 | 71.4% |
| Literature & Languages | 0 | 0.0% |
| Liberal Arts & History | 0 | 0.0% |
| Visual & Performing Arts | 0 | 0.0% |
| Communications | 0 | 0.0% |
| Arts & Humanities | 0 | 0.0% |
| Total | 42 | 100.0% |
Transportation & Commute in Enigma
Vehicle Availability by Sex in Enigma
The most prevalent vehicle ownership categories in Enigma are males with 3 vehicles (103, accounting for 45.8%) and females with 3 vehicles (15, making up 82.4%).
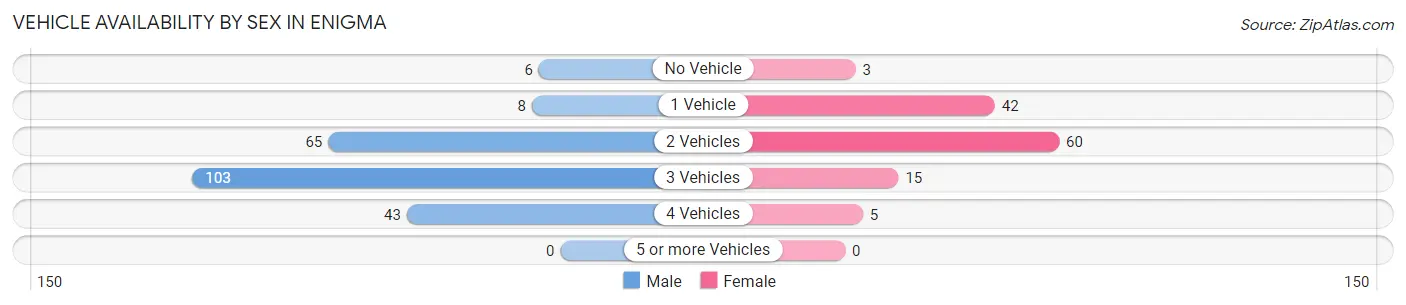
| Vehicles Available | Male | Female |
| No Vehicle | 6 (2.7%) | 3 (2.4%) |
| 1 Vehicle | 8 (3.6%) | 42 (33.6%) |
| 2 Vehicles | 65 (28.9%) | 60 (48.0%) |
| 3 Vehicles | 103 (45.8%) | 15 (12.0%) |
| 4 Vehicles | 43 (19.1%) | 5 (4.0%) |
| 5 or more Vehicles | 0 (0.0%) | 0 (0.0%) |
| Total | 225 (100.0%) | 125 (100.0%) |
Commute Time in Enigma
The most frequently occuring commute durations in Enigma are 20 to 24 minutes (87 commuters, 25.3%), 15 to 19 minutes (72 commuters, 20.9%), and 30 to 34 minutes (65 commuters, 18.9%).
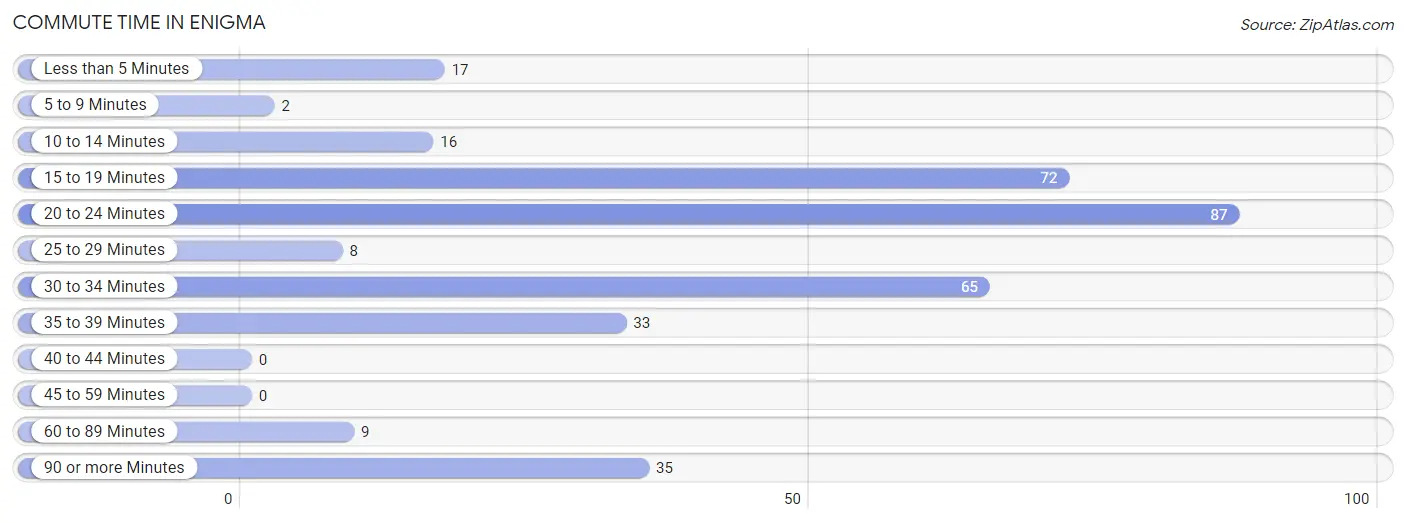
| Commute Time | # Commuters | % Commuters |
| Less than 5 Minutes | 17 | 4.9% |
| 5 to 9 Minutes | 2 | 0.6% |
| 10 to 14 Minutes | 16 | 4.6% |
| 15 to 19 Minutes | 72 | 20.9% |
| 20 to 24 Minutes | 87 | 25.3% |
| 25 to 29 Minutes | 8 | 2.3% |
| 30 to 34 Minutes | 65 | 18.9% |
| 35 to 39 Minutes | 33 | 9.6% |
| 40 to 44 Minutes | 0 | 0.0% |
| 45 to 59 Minutes | 0 | 0.0% |
| 60 to 89 Minutes | 9 | 2.6% |
| 90 or more Minutes | 35 | 10.2% |
Commute Time by Sex in Enigma
The most common commute times in Enigma are 30 to 34 minutes (56 commuters, 24.9%) for males and 20 to 24 minutes (39 commuters, 32.8%) for females.
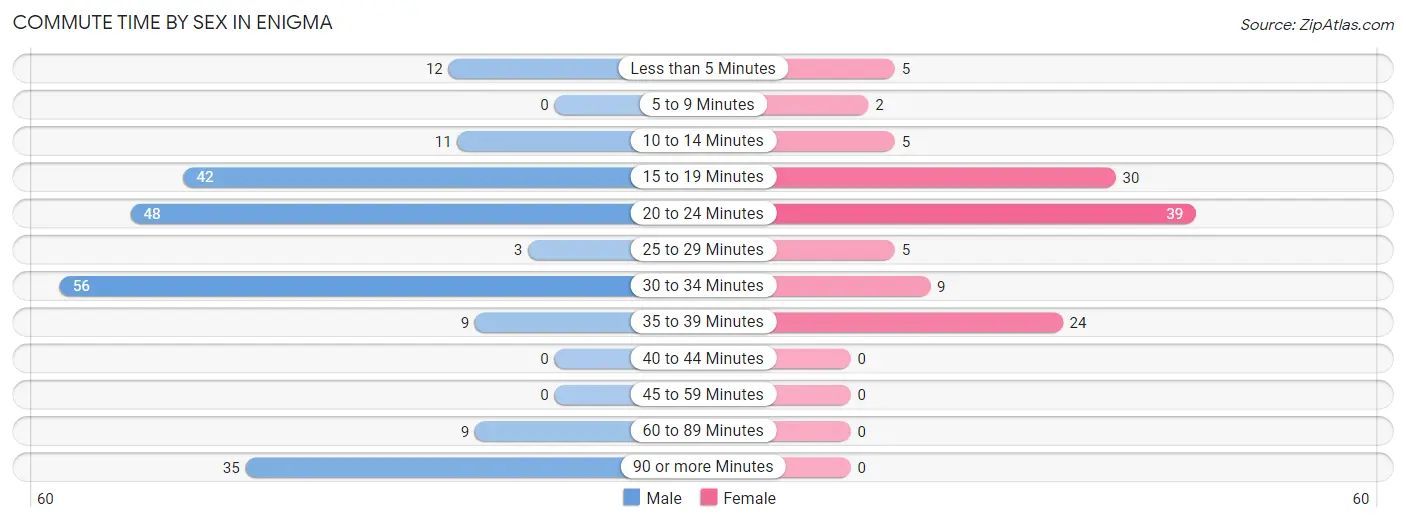
| Commute Time | Male | Female |
| Less than 5 Minutes | 12 (5.3%) | 5 (4.2%) |
| 5 to 9 Minutes | 0 (0.0%) | 2 (1.7%) |
| 10 to 14 Minutes | 11 (4.9%) | 5 (4.2%) |
| 15 to 19 Minutes | 42 (18.7%) | 30 (25.2%) |
| 20 to 24 Minutes | 48 (21.3%) | 39 (32.8%) |
| 25 to 29 Minutes | 3 (1.3%) | 5 (4.2%) |
| 30 to 34 Minutes | 56 (24.9%) | 9 (7.6%) |
| 35 to 39 Minutes | 9 (4.0%) | 24 (20.2%) |
| 40 to 44 Minutes | 0 (0.0%) | 0 (0.0%) |
| 45 to 59 Minutes | 0 (0.0%) | 0 (0.0%) |
| 60 to 89 Minutes | 9 (4.0%) | 0 (0.0%) |
| 90 or more Minutes | 35 (15.6%) | 0 (0.0%) |
Time of Departure to Work by Sex in Enigma
The most frequent times of departure to work in Enigma are 7:30 AM to 7:59 AM (73, 32.4%) for males and 6:30 AM to 6:59 AM (28, 23.5%) for females.
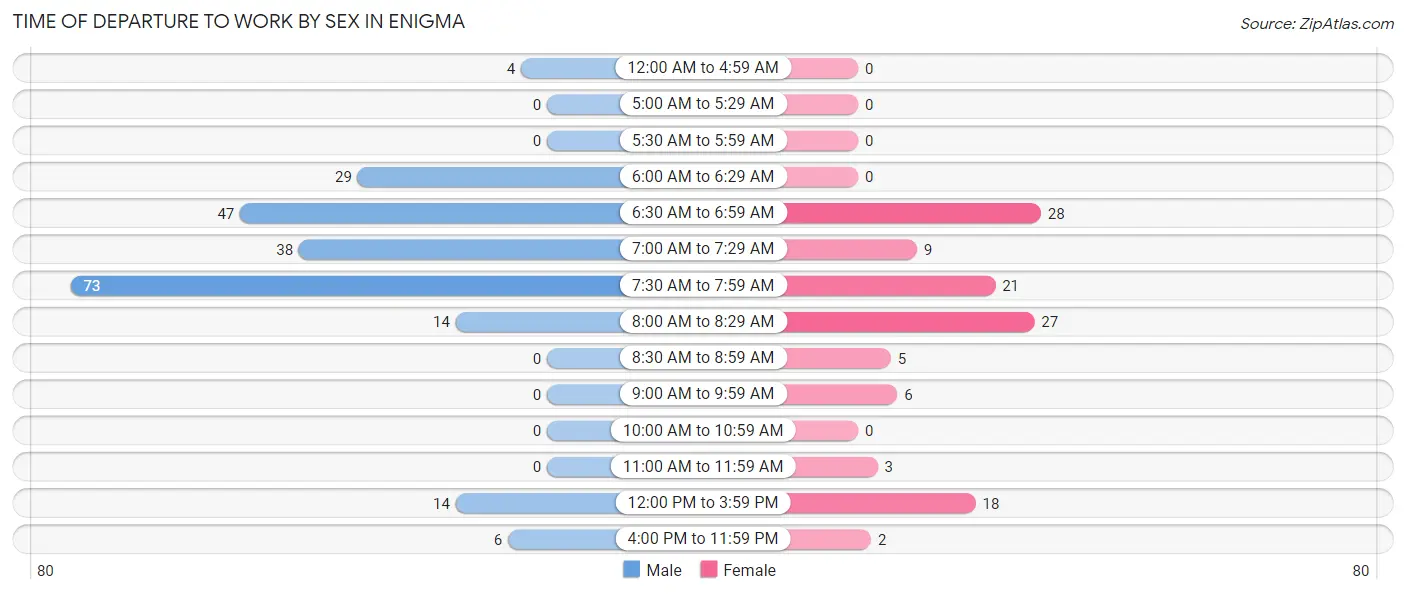
| Time of Departure | Male | Female |
| 12:00 AM to 4:59 AM | 4 (1.8%) | 0 (0.0%) |
| 5:00 AM to 5:29 AM | 0 (0.0%) | 0 (0.0%) |
| 5:30 AM to 5:59 AM | 0 (0.0%) | 0 (0.0%) |
| 6:00 AM to 6:29 AM | 29 (12.9%) | 0 (0.0%) |
| 6:30 AM to 6:59 AM | 47 (20.9%) | 28 (23.5%) |
| 7:00 AM to 7:29 AM | 38 (16.9%) | 9 (7.6%) |
| 7:30 AM to 7:59 AM | 73 (32.4%) | 21 (17.6%) |
| 8:00 AM to 8:29 AM | 14 (6.2%) | 27 (22.7%) |
| 8:30 AM to 8:59 AM | 0 (0.0%) | 5 (4.2%) |
| 9:00 AM to 9:59 AM | 0 (0.0%) | 6 (5.0%) |
| 10:00 AM to 10:59 AM | 0 (0.0%) | 0 (0.0%) |
| 11:00 AM to 11:59 AM | 0 (0.0%) | 3 (2.5%) |
| 12:00 PM to 3:59 PM | 14 (6.2%) | 18 (15.1%) |
| 4:00 PM to 11:59 PM | 6 (2.7%) | 2 (1.7%) |
| Total | 225 (100.0%) | 119 (100.0%) |
Housing Occupancy in Enigma
Occupancy by Ownership in Enigma
Of the total 462 dwellings in Enigma, owner-occupied units account for 233 (50.4%), while renter-occupied units make up 229 (49.6%).
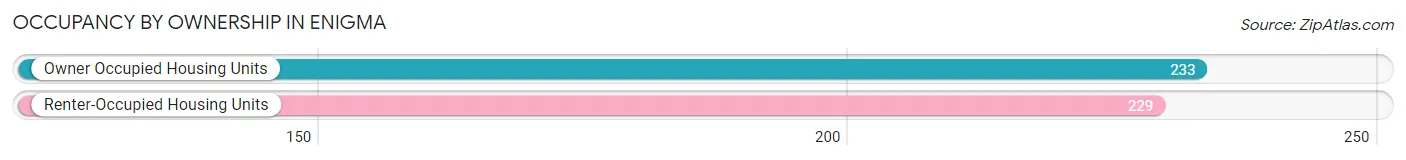
| Occupancy | # Housing Units | % Housing Units |
| Owner Occupied Housing Units | 233 | 50.4% |
| Renter-Occupied Housing Units | 229 | 49.6% |
| Total Occupied Housing Units | 462 | 100.0% |
Occupancy by Household Size in Enigma
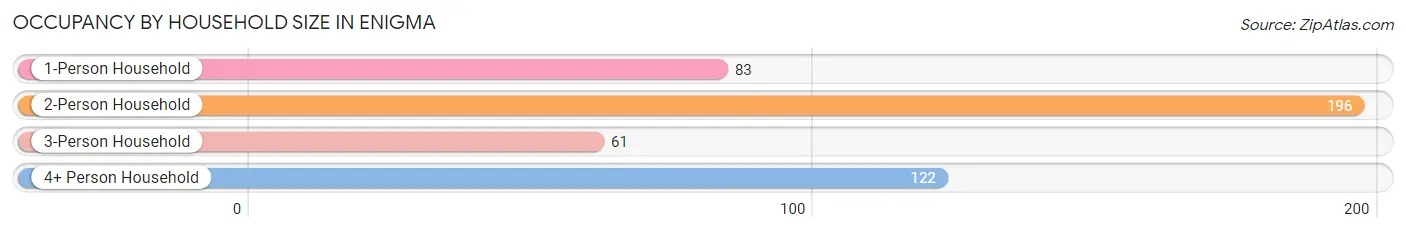
| Household Size | # Housing Units | % Housing Units |
| 1-Person Household | 83 | 18.0% |
| 2-Person Household | 196 | 42.4% |
| 3-Person Household | 61 | 13.2% |
| 4+ Person Household | 122 | 26.4% |
| Total Housing Units | 462 | 100.0% |
Occupancy by Ownership by Household Size in Enigma
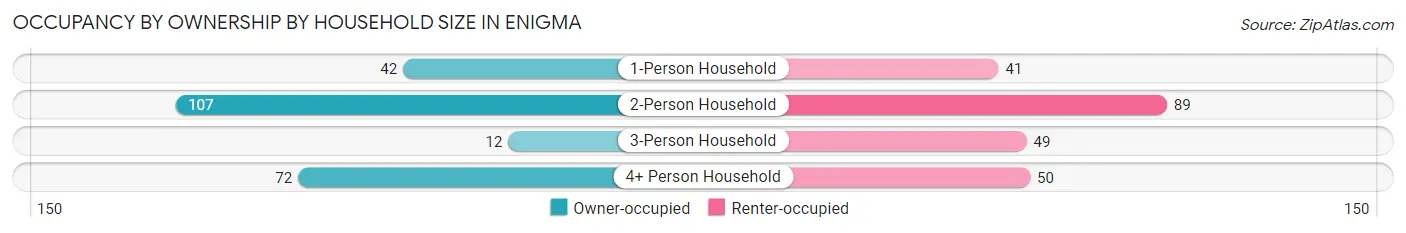
| Household Size | Owner-occupied | Renter-occupied |
| 1-Person Household | 42 (50.6%) | 41 (49.4%) |
| 2-Person Household | 107 (54.6%) | 89 (45.4%) |
| 3-Person Household | 12 (19.7%) | 49 (80.3%) |
| 4+ Person Household | 72 (59.0%) | 50 (41.0%) |
| Total Housing Units | 233 (50.4%) | 229 (49.6%) |
Occupancy by Educational Attainment in Enigma
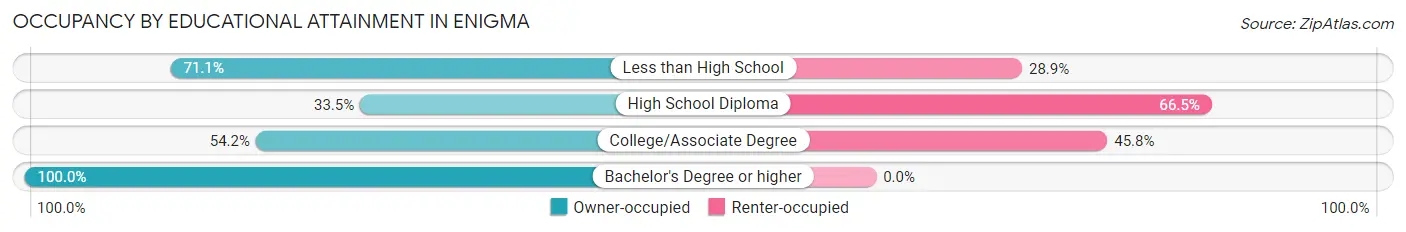
| Household Size | Owner-occupied | Renter-occupied |
| Less than High School | 86 (71.1%) | 35 (28.9%) |
| High School Diploma | 70 (33.5%) | 139 (66.5%) |
| College/Associate Degree | 65 (54.2%) | 55 (45.8%) |
| Bachelor's Degree or higher | 12 (100.0%) | 0 (0.0%) |
Occupancy by Age of Householder in Enigma
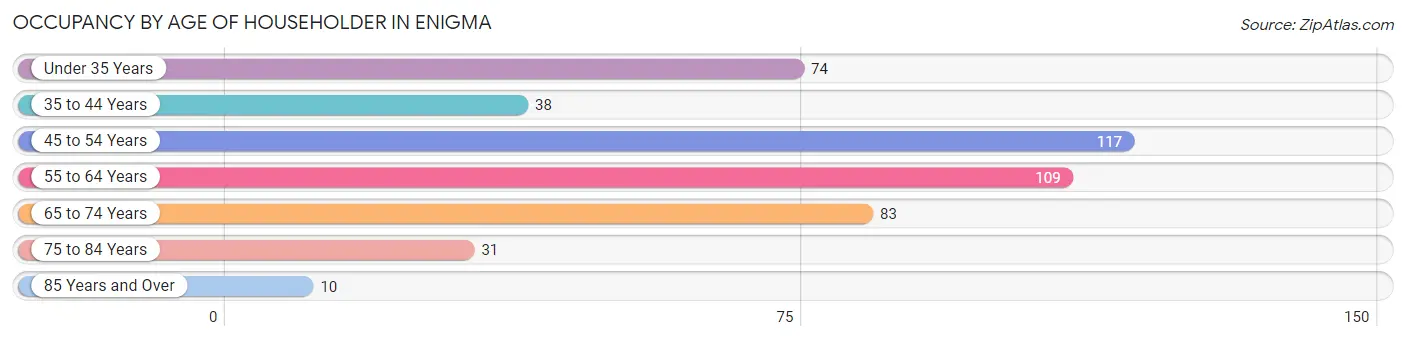
| Age Bracket | # Households | % Households |
| Under 35 Years | 74 | 16.0% |
| 35 to 44 Years | 38 | 8.2% |
| 45 to 54 Years | 117 | 25.3% |
| 55 to 64 Years | 109 | 23.6% |
| 65 to 74 Years | 83 | 18.0% |
| 75 to 84 Years | 31 | 6.7% |
| 85 Years and Over | 10 | 2.2% |
| Total | 462 | 100.0% |
Housing Finances in Enigma
Median Income by Occupancy in Enigma
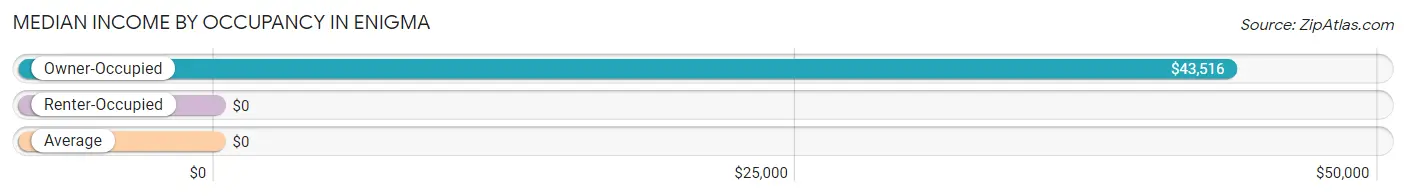
| Occupancy Type | # Households | Median Income |
| Owner-Occupied | 233 (50.4%) | $43,516 |
| Renter-Occupied | 229 (49.6%) | $0 |
| Average | 462 (100.0%) | $0 |
Occupancy by Householder Income Bracket in Enigma
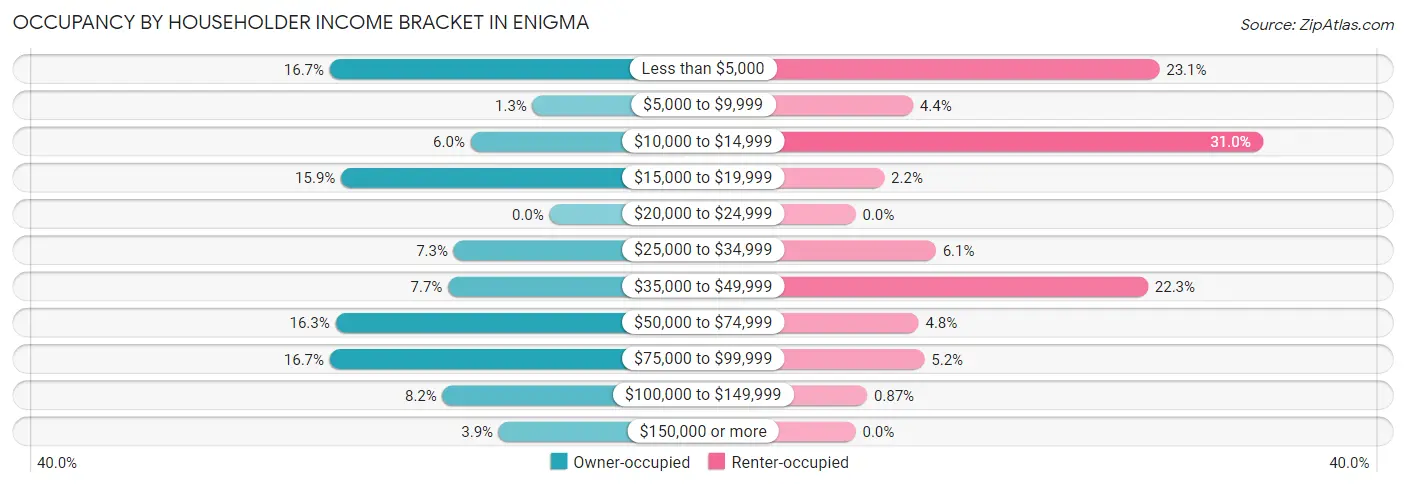
| Income Bracket | Owner-occupied | Renter-occupied |
| Less than $5,000 | 39 (16.7%) | 53 (23.1%) |
| $5,000 to $9,999 | 3 (1.3%) | 10 (4.4%) |
| $10,000 to $14,999 | 14 (6.0%) | 71 (31.0%) |
| $15,000 to $19,999 | 37 (15.9%) | 5 (2.2%) |
| $20,000 to $24,999 | 0 (0.0%) | 0 (0.0%) |
| $25,000 to $34,999 | 17 (7.3%) | 14 (6.1%) |
| $35,000 to $49,999 | 18 (7.7%) | 51 (22.3%) |
| $50,000 to $74,999 | 38 (16.3%) | 11 (4.8%) |
| $75,000 to $99,999 | 39 (16.7%) | 12 (5.2%) |
| $100,000 to $149,999 | 19 (8.2%) | 2 (0.9%) |
| $150,000 or more | 9 (3.9%) | 0 (0.0%) |
| Total | 233 (100.0%) | 229 (100.0%) |
Monthly Housing Cost Tiers in Enigma
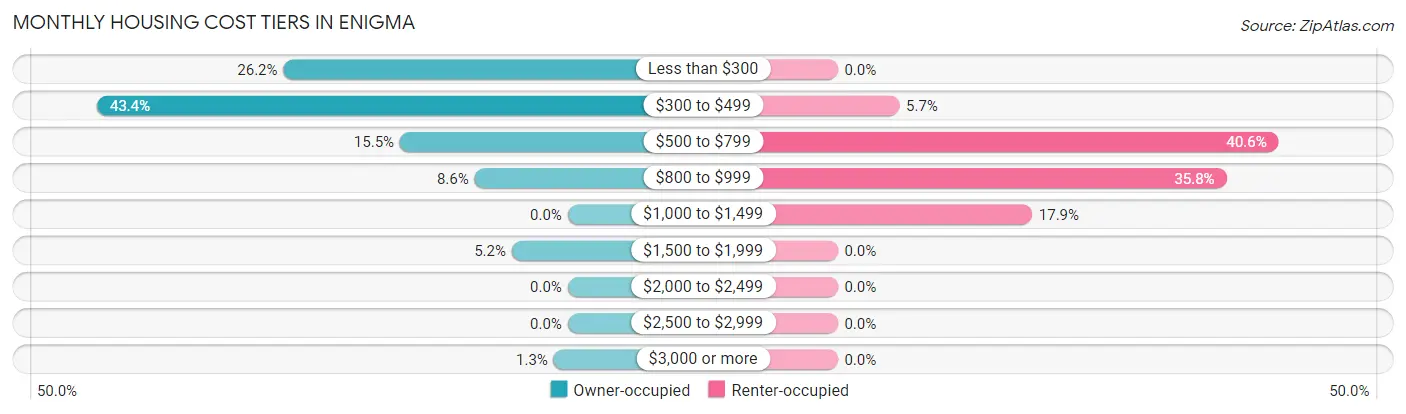
| Monthly Cost | Owner-occupied | Renter-occupied |
| Less than $300 | 61 (26.2%) | 0 (0.0%) |
| $300 to $499 | 101 (43.3%) | 13 (5.7%) |
| $500 to $799 | 36 (15.4%) | 93 (40.6%) |
| $800 to $999 | 20 (8.6%) | 82 (35.8%) |
| $1,000 to $1,499 | 0 (0.0%) | 41 (17.9%) |
| $1,500 to $1,999 | 12 (5.1%) | 0 (0.0%) |
| $2,000 to $2,499 | 0 (0.0%) | 0 (0.0%) |
| $2,500 to $2,999 | 0 (0.0%) | 0 (0.0%) |
| $3,000 or more | 3 (1.3%) | 0 (0.0%) |
| Total | 233 (100.0%) | 229 (100.0%) |
Physical Housing Characteristics in Enigma
Housing Structures in Enigma
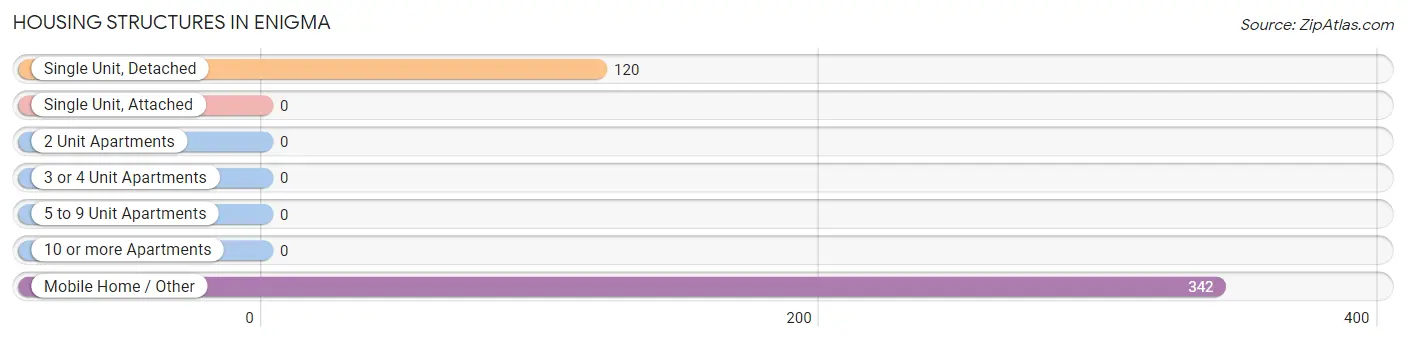
| Structure Type | # Housing Units | % Housing Units |
| Single Unit, Detached | 120 | 26.0% |
| Single Unit, Attached | 0 | 0.0% |
| 2 Unit Apartments | 0 | 0.0% |
| 3 or 4 Unit Apartments | 0 | 0.0% |
| 5 to 9 Unit Apartments | 0 | 0.0% |
| 10 or more Apartments | 0 | 0.0% |
| Mobile Home / Other | 342 | 74.0% |
| Total | 462 | 100.0% |
Housing Structures by Occupancy in Enigma
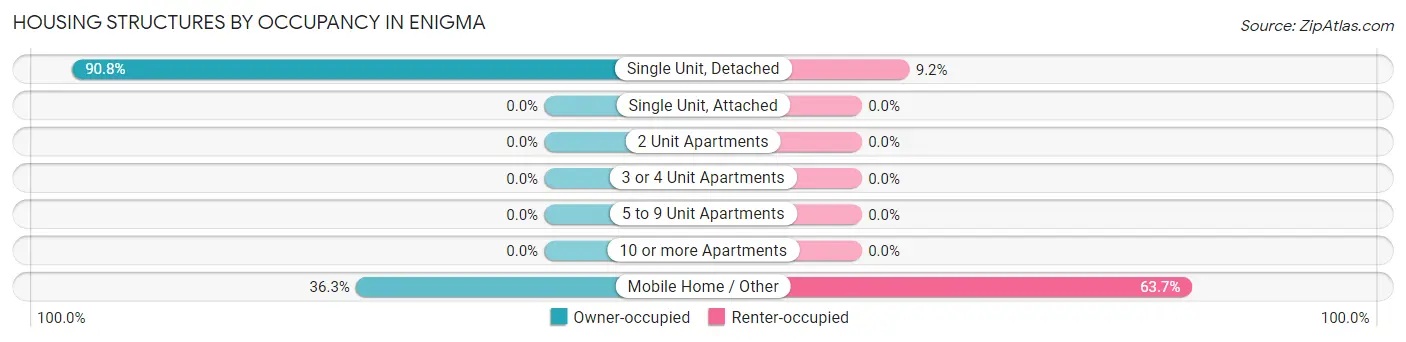
| Structure Type | Owner-occupied | Renter-occupied |
| Single Unit, Detached | 109 (90.8%) | 11 (9.2%) |
| Single Unit, Attached | 0 (0.0%) | 0 (0.0%) |
| 2 Unit Apartments | 0 (0.0%) | 0 (0.0%) |
| 3 or 4 Unit Apartments | 0 (0.0%) | 0 (0.0%) |
| 5 to 9 Unit Apartments | 0 (0.0%) | 0 (0.0%) |
| 10 or more Apartments | 0 (0.0%) | 0 (0.0%) |
| Mobile Home / Other | 124 (36.3%) | 218 (63.7%) |
| Total | 233 (50.4%) | 229 (49.6%) |
Housing Structures by Number of Rooms in Enigma
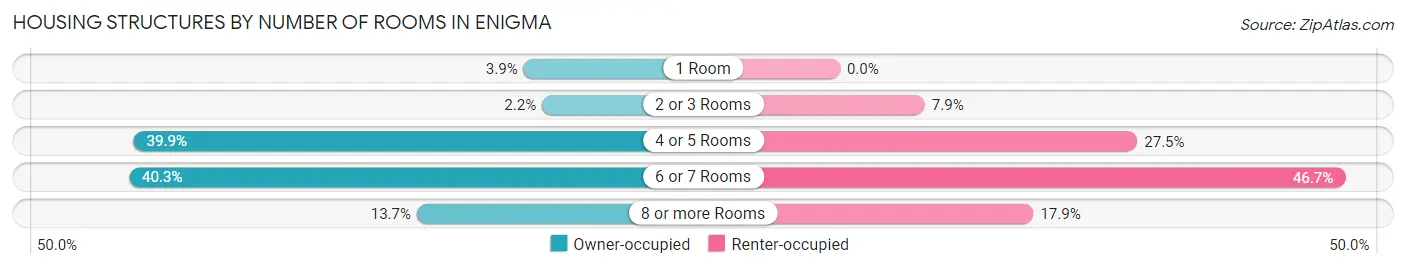
| Number of Rooms | Owner-occupied | Renter-occupied |
| 1 Room | 9 (3.9%) | 0 (0.0%) |
| 2 or 3 Rooms | 5 (2.1%) | 18 (7.9%) |
| 4 or 5 Rooms | 93 (39.9%) | 63 (27.5%) |
| 6 or 7 Rooms | 94 (40.3%) | 107 (46.7%) |
| 8 or more Rooms | 32 (13.7%) | 41 (17.9%) |
| Total | 233 (100.0%) | 229 (100.0%) |
Housing Structure by Heating Type in Enigma
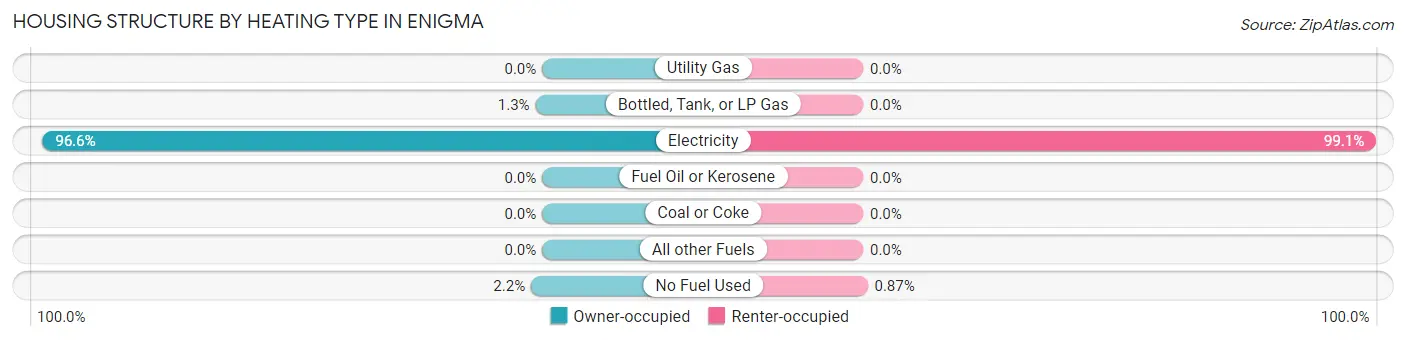
| Heating Type | Owner-occupied | Renter-occupied |
| Utility Gas | 0 (0.0%) | 0 (0.0%) |
| Bottled, Tank, or LP Gas | 3 (1.3%) | 0 (0.0%) |
| Electricity | 225 (96.6%) | 227 (99.1%) |
| Fuel Oil or Kerosene | 0 (0.0%) | 0 (0.0%) |
| Coal or Coke | 0 (0.0%) | 0 (0.0%) |
| All other Fuels | 0 (0.0%) | 0 (0.0%) |
| No Fuel Used | 5 (2.1%) | 2 (0.9%) |
| Total | 233 (100.0%) | 229 (100.0%) |
Household Vehicle Usage in Enigma
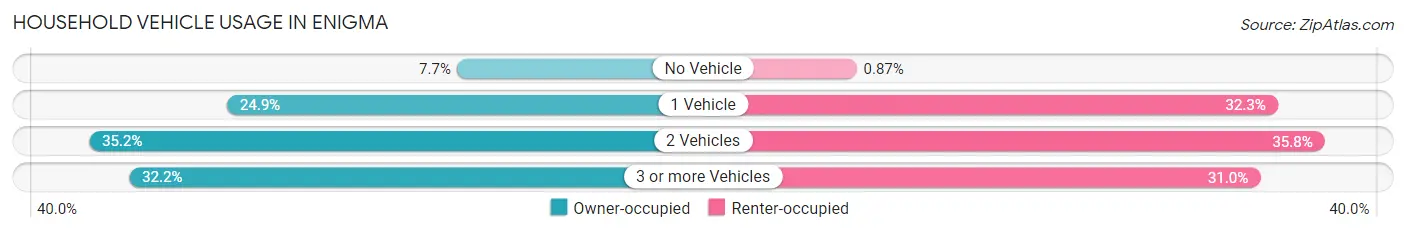
| Vehicles per Household | Owner-occupied | Renter-occupied |
| No Vehicle | 18 (7.7%) | 2 (0.9%) |
| 1 Vehicle | 58 (24.9%) | 74 (32.3%) |
| 2 Vehicles | 82 (35.2%) | 82 (35.8%) |
| 3 or more Vehicles | 75 (32.2%) | 71 (31.0%) |
| Total | 233 (100.0%) | 229 (100.0%) |
Real Estate & Mortgages in Enigma
Real Estate and Mortgage Overview in Enigma
| Characteristic | Without Mortgage | With Mortgage |
| Housing Units | 188 | 45 |
| Median Property Value | $93,100 | $0 |
| Median Household Income | $43,654 | $0 |
| Monthly Housing Costs | $383 | $0 |
| Real Estate Taxes | $858 | $0 |
Property Value by Mortgage Status in Enigma
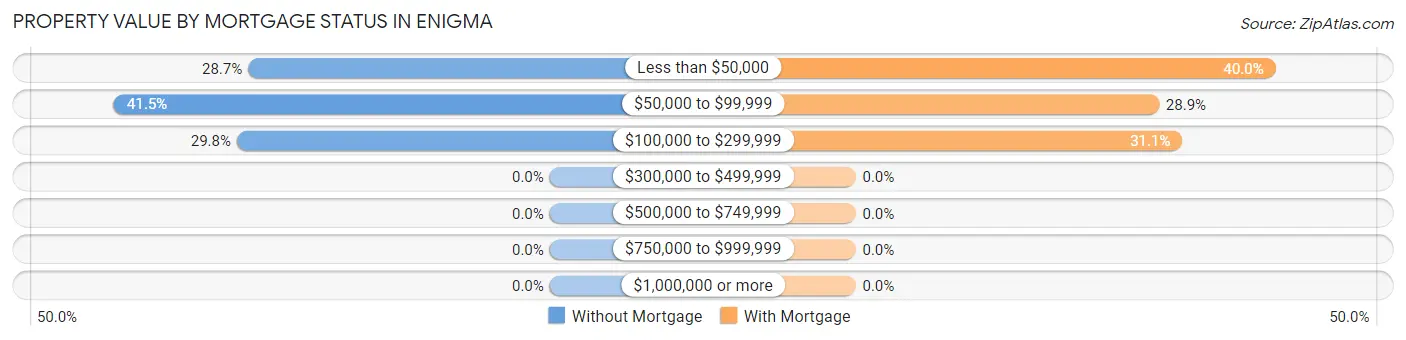
| Property Value | Without Mortgage | With Mortgage |
| Less than $50,000 | 54 (28.7%) | 18 (40.0%) |
| $50,000 to $99,999 | 78 (41.5%) | 13 (28.9%) |
| $100,000 to $299,999 | 56 (29.8%) | 14 (31.1%) |
| $300,000 to $499,999 | 0 (0.0%) | 0 (0.0%) |
| $500,000 to $749,999 | 0 (0.0%) | 0 (0.0%) |
| $750,000 to $999,999 | 0 (0.0%) | 0 (0.0%) |
| $1,000,000 or more | 0 (0.0%) | 0 (0.0%) |
| Total | 188 (100.0%) | 45 (100.0%) |
Household Income by Mortgage Status in Enigma
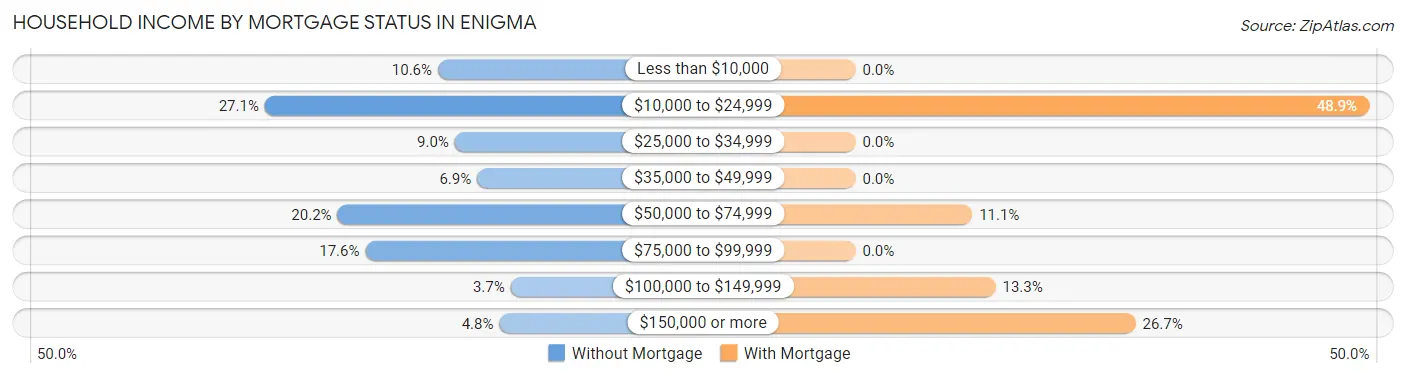
| Household Income | Without Mortgage | With Mortgage |
| Less than $10,000 | 20 (10.6%) | 0 (0.0%) |
| $10,000 to $24,999 | 51 (27.1%) | 22 (48.9%) |
| $25,000 to $34,999 | 17 (9.0%) | 0 (0.0%) |
| $35,000 to $49,999 | 13 (6.9%) | 0 (0.0%) |
| $50,000 to $74,999 | 38 (20.2%) | 5 (11.1%) |
| $75,000 to $99,999 | 33 (17.5%) | 0 (0.0%) |
| $100,000 to $149,999 | 7 (3.7%) | 6 (13.3%) |
| $150,000 or more | 9 (4.8%) | 12 (26.7%) |
| Total | 188 (100.0%) | 45 (100.0%) |
Property Value to Household Income Ratio in Enigma
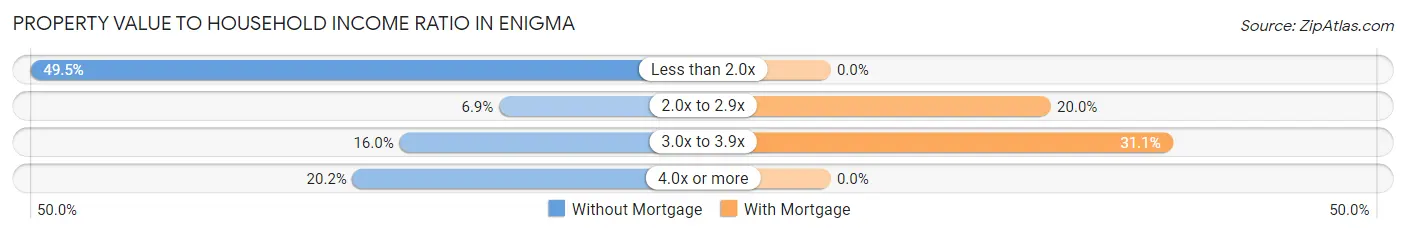
| Value-to-Income Ratio | Without Mortgage | With Mortgage |
| Less than 2.0x | 93 (49.5%) | 0 (0.0%) |
| 2.0x to 2.9x | 13 (6.9%) | 9 (20.0%) |
| 3.0x to 3.9x | 30 (16.0%) | 14 (31.1%) |
| 4.0x or more | 38 (20.2%) | 0 (0.0%) |
| Total | 188 (100.0%) | 45 (100.0%) |
Real Estate Taxes by Mortgage Status in Enigma
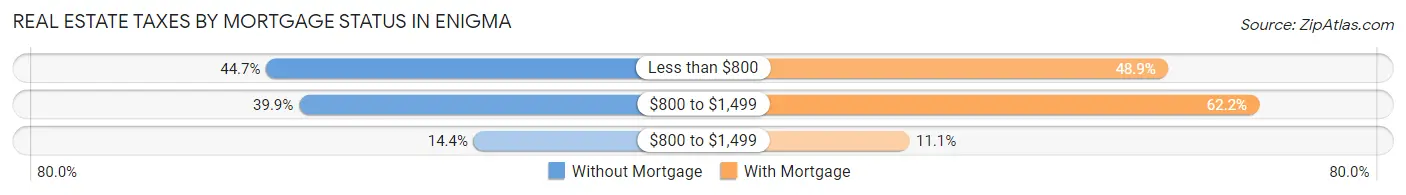
| Property Taxes | Without Mortgage | With Mortgage |
| Less than $800 | 84 (44.7%) | 22 (48.9%) |
| $800 to $1,499 | 75 (39.9%) | 28 (62.2%) |
| $800 to $1,499 | 27 (14.4%) | 5 (11.1%) |
| Total | 188 (100.0%) | 45 (100.0%) |
Health & Disability in Enigma
Health Insurance Coverage by Age in Enigma
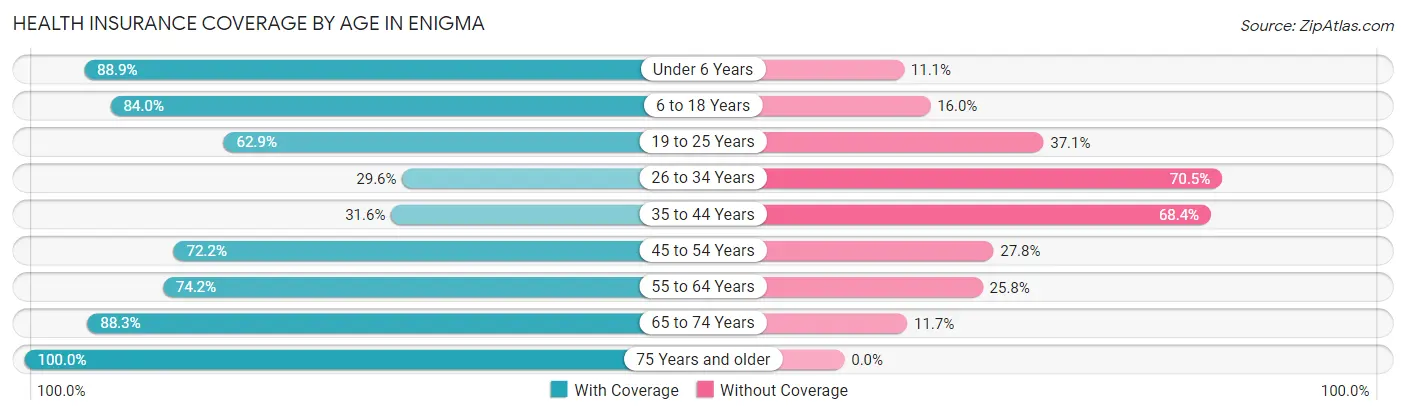
| Age Bracket | With Coverage | Without Coverage |
| Under 6 Years | 96 (88.9%) | 12 (11.1%) |
| 6 to 18 Years | 215 (84.0%) | 41 (16.0%) |
| 19 to 25 Years | 61 (62.9%) | 36 (37.1%) |
| 26 to 34 Years | 26 (29.5%) | 62 (70.5%) |
| 35 to 44 Years | 31 (31.6%) | 67 (68.4%) |
| 45 to 54 Years | 143 (72.2%) | 55 (27.8%) |
| 55 to 64 Years | 164 (74.2%) | 57 (25.8%) |
| 65 to 74 Years | 83 (88.3%) | 11 (11.7%) |
| 75 Years and older | 91 (100.0%) | 0 (0.0%) |
| Total | 910 (72.7%) | 341 (27.3%) |
Health Insurance Coverage by Citizenship Status in Enigma
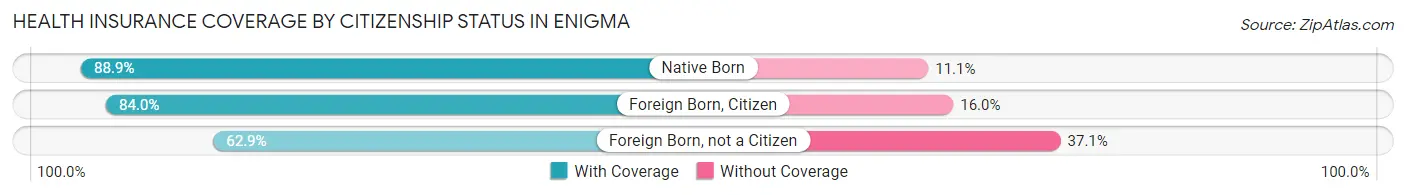
| Citizenship Status | With Coverage | Without Coverage |
| Native Born | 96 (88.9%) | 12 (11.1%) |
| Foreign Born, Citizen | 215 (84.0%) | 41 (16.0%) |
| Foreign Born, not a Citizen | 61 (62.9%) | 36 (37.1%) |
Health Insurance Coverage by Household Income in Enigma
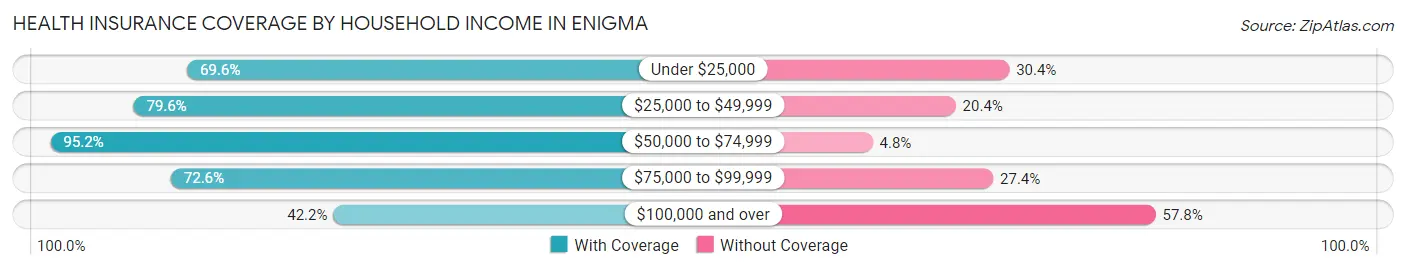
| Household Income | With Coverage | Without Coverage |
| Under $25,000 | 368 (69.6%) | 161 (30.4%) |
| $25,000 to $49,999 | 238 (79.6%) | 61 (20.4%) |
| $50,000 to $74,999 | 118 (95.2%) | 6 (4.8%) |
| $75,000 to $99,999 | 143 (72.6%) | 54 (27.4%) |
| $100,000 and over | 43 (42.2%) | 59 (57.8%) |
Public vs Private Health Insurance Coverage by Age in Enigma
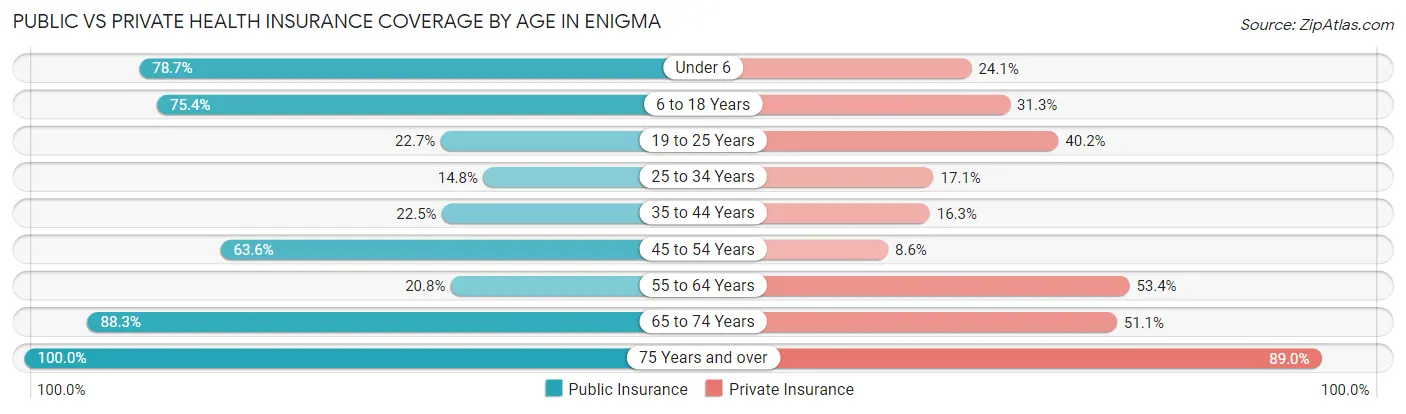
| Age Bracket | Public Insurance | Private Insurance |
| Under 6 | 85 (78.7%) | 26 (24.1%) |
| 6 to 18 Years | 193 (75.4%) | 80 (31.2%) |
| 19 to 25 Years | 22 (22.7%) | 39 (40.2%) |
| 25 to 34 Years | 13 (14.8%) | 15 (17.1%) |
| 35 to 44 Years | 22 (22.5%) | 16 (16.3%) |
| 45 to 54 Years | 126 (63.6%) | 17 (8.6%) |
| 55 to 64 Years | 46 (20.8%) | 118 (53.4%) |
| 65 to 74 Years | 83 (88.3%) | 48 (51.1%) |
| 75 Years and over | 91 (100.0%) | 81 (89.0%) |
| Total | 681 (54.4%) | 440 (35.2%) |
Disability Status by Sex by Age in Enigma
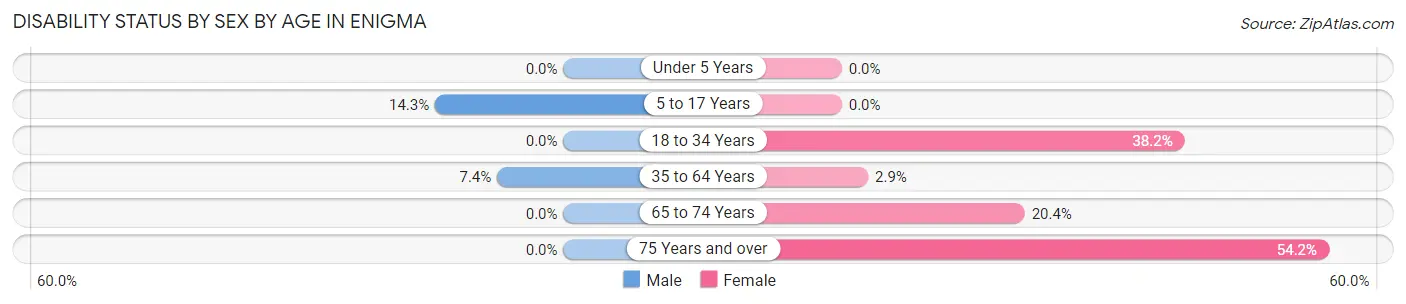
| Age Bracket | Male | Female |
| Under 5 Years | 0 (0.0%) | 0 (0.0%) |
| 5 to 17 Years | 21 (14.3%) | 0 (0.0%) |
| 18 to 34 Years | 0 (0.0%) | 29 (38.2%) |
| 35 to 64 Years | 18 (7.4%) | 8 (2.9%) |
| 65 to 74 Years | 0 (0.0%) | 11 (20.4%) |
| 75 Years and over | 0 (0.0%) | 32 (54.2%) |
Disability Class by Sex by Age in Enigma
Disability Class: Hearing Difficulty
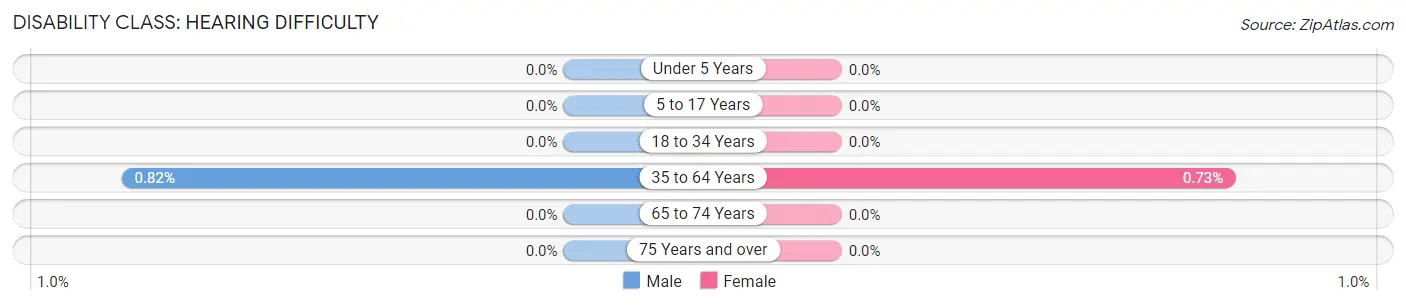
| Age Bracket | Male | Female |
| Under 5 Years | 0 (0.0%) | 0 (0.0%) |
| 5 to 17 Years | 0 (0.0%) | 0 (0.0%) |
| 18 to 34 Years | 0 (0.0%) | 0 (0.0%) |
| 35 to 64 Years | 2 (0.8%) | 2 (0.7%) |
| 65 to 74 Years | 0 (0.0%) | 0 (0.0%) |
| 75 Years and over | 0 (0.0%) | 0 (0.0%) |
Disability Class: Vision Difficulty
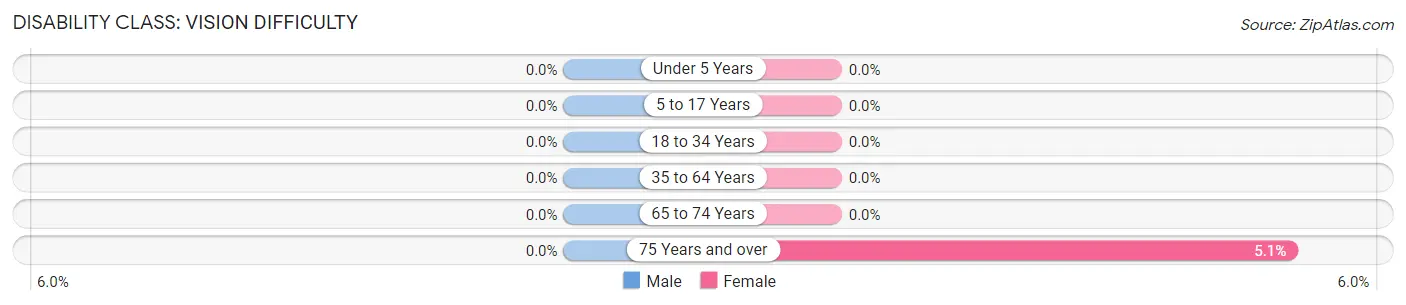
| Age Bracket | Male | Female |
| Under 5 Years | 0 (0.0%) | 0 (0.0%) |
| 5 to 17 Years | 0 (0.0%) | 0 (0.0%) |
| 18 to 34 Years | 0 (0.0%) | 0 (0.0%) |
| 35 to 64 Years | 0 (0.0%) | 0 (0.0%) |
| 65 to 74 Years | 0 (0.0%) | 0 (0.0%) |
| 75 Years and over | 0 (0.0%) | 3 (5.1%) |
Disability Class: Cognitive Difficulty
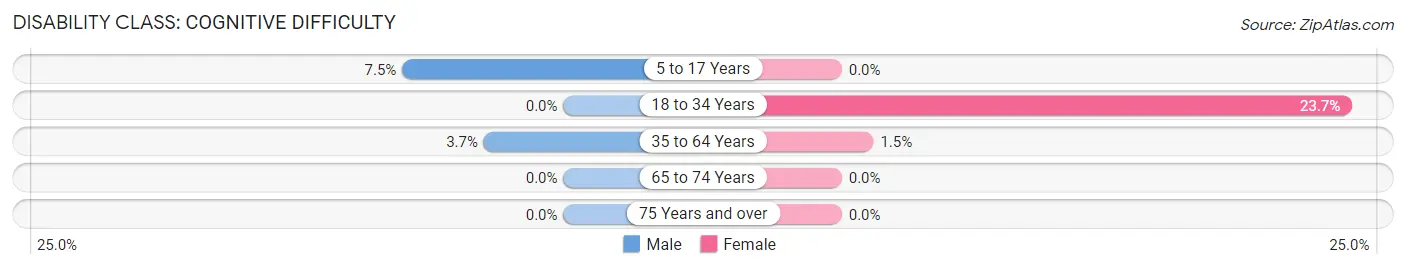
| Age Bracket | Male | Female |
| 5 to 17 Years | 11 (7.5%) | 0 (0.0%) |
| 18 to 34 Years | 0 (0.0%) | 18 (23.7%) |
| 35 to 64 Years | 9 (3.7%) | 4 (1.5%) |
| 65 to 74 Years | 0 (0.0%) | 0 (0.0%) |
| 75 Years and over | 0 (0.0%) | 0 (0.0%) |
Disability Class: Ambulatory Difficulty
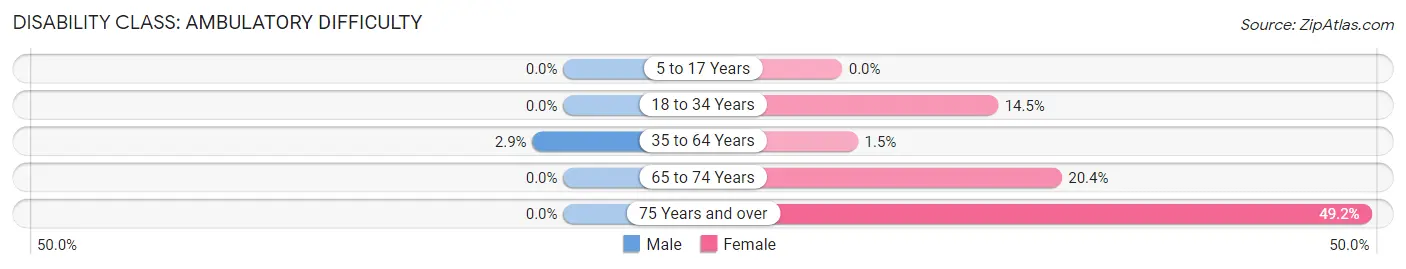
| Age Bracket | Male | Female |
| 5 to 17 Years | 0 (0.0%) | 0 (0.0%) |
| 18 to 34 Years | 0 (0.0%) | 11 (14.5%) |
| 35 to 64 Years | 7 (2.9%) | 4 (1.5%) |
| 65 to 74 Years | 0 (0.0%) | 11 (20.4%) |
| 75 Years and over | 0 (0.0%) | 29 (49.1%) |
Disability Class: Self-Care Difficulty
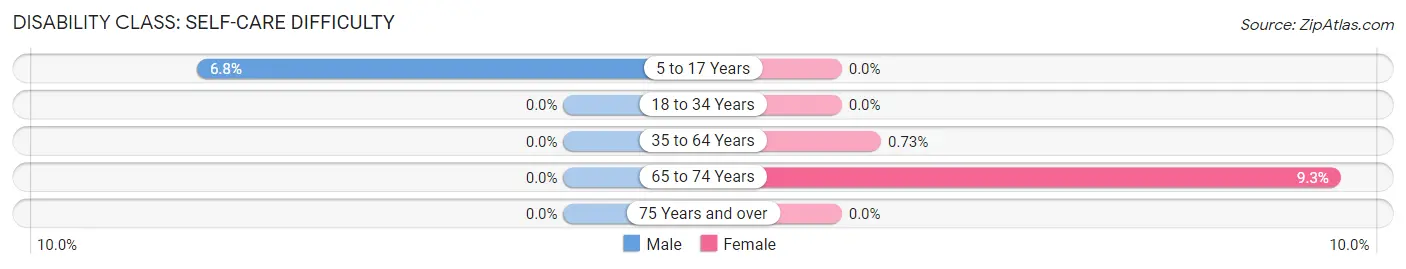
| Age Bracket | Male | Female |
| 5 to 17 Years | 10 (6.8%) | 0 (0.0%) |
| 18 to 34 Years | 0 (0.0%) | 0 (0.0%) |
| 35 to 64 Years | 0 (0.0%) | 2 (0.7%) |
| 65 to 74 Years | 0 (0.0%) | 5 (9.3%) |
| 75 Years and over | 0 (0.0%) | 0 (0.0%) |
Technology Access in Enigma
Computing Device Access in Enigma
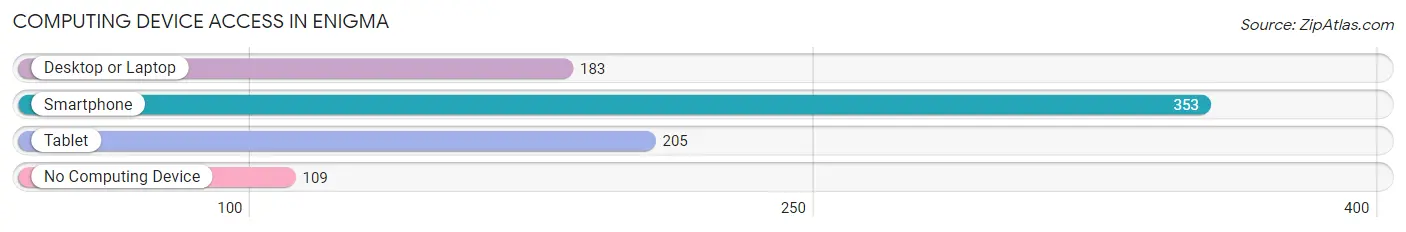
| Device Type | # Households | % Households |
| Desktop or Laptop | 183 | 39.6% |
| Smartphone | 353 | 76.4% |
| Tablet | 205 | 44.4% |
| No Computing Device | 109 | 23.6% |
| Total | 462 | 100.0% |
Internet Access in Enigma
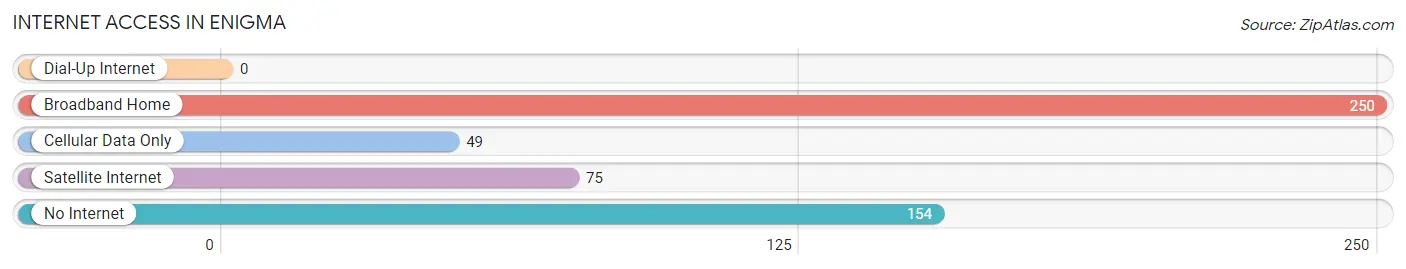
| Internet Type | # Households | % Households |
| Dial-Up Internet | 0 | 0.0% |
| Broadband Home | 250 | 54.1% |
| Cellular Data Only | 49 | 10.6% |
| Satellite Internet | 75 | 16.2% |
| No Internet | 154 | 33.3% |
| Total | 462 | 100.0% |
Enigma Summary
Enigma is a small town located in the southeastern corner of Georgia, United States. It is situated in the county of Echols, and is part of the Valdosta Metropolitan Statistical Area. The town has a population of approximately 1,000 people, and is known for its rural charm and friendly atmosphere.
History
Enigma was founded in 1891 by a group of settlers from the nearby town of Quitman. The town was named after the nearby Enigma Creek, which was named by the settlers for its mysterious nature. The town was originally a farming community, and the main crops grown were cotton, corn, and peanuts. In the early 1900s, the town began to grow and develop, and a post office was established in 1906.
In the 1920s, the town began to experience a period of growth and prosperity. The town was home to several businesses, including a general store, a sawmill, and a cotton gin. The town also had a school, a bank, and a hotel.
In the 1940s, the town experienced a decline in population due to the Great Depression and World War II. After the war, the town began to experience a period of growth and development. The town was home to several businesses, including a grocery store, a hardware store, and a gas station.
Geography
Enigma is located in the southeastern corner of Georgia, in the county of Echols. The town is situated in a rural area, and is surrounded by forests and farmland. The town is located near the Okefenokee Swamp, which is a popular tourist destination. The town is also located near the Georgia-Florida border, and is approximately 30 miles from the city of Valdosta.
Economy
Enigma’s economy is largely based on agriculture. The town is home to several farms, which produce a variety of crops, including cotton, corn, and peanuts. The town is also home to several small businesses, including a grocery store, a hardware store, and a gas station.
Demographics
As of the 2010 census, Enigma had a population of 1,000 people. The town is predominantly white, with a small African American population. The median household income is $30,000, and the median age is 40 years old. The town has a high rate of poverty, with approximately 25% of the population living below the poverty line.
Enigma is a small town with a rich history and a friendly atmosphere. The town is home to several businesses, and is surrounded by forests and farmland. The town is also located near the Okefenokee Swamp, which is a popular tourist destination. The town has a population of approximately 1,000 people, and is predominantly white. The town has a median household income of $30,000, and a median age of 40 years old. The town has a high rate of poverty, with approximately 25% of the population living below the poverty line.
Common Questions
What is Per Capita Income in Enigma?
Per Capita income in Enigma is $14,111.
What is Income or Wage Gap in Enigma?
Income or Wage Gap in Enigma is 57.5%.
Women in Enigma earn 42.5 cents for every dollar earned by a man.
What is Family Income Deficit in Enigma?
Family Income Deficit in Enigma is $14,166.
Families that are below poverty line in Enigma earn $14,166 less on average than the poverty threshold level.
What is Inequality or Gini Index in Enigma?
Inequality or Gini Index in Enigma is 0.53.
What is the Total Population of Enigma?
Total Population of Enigma is 1,251.
What is the Total Male Population of Enigma?
Total Male Population of Enigma is 658.
What is the Total Female Population of Enigma?
Total Female Population of Enigma is 593.
What is the Ratio of Males per 100 Females in Enigma?
There are 110.96 Males per 100 Females in Enigma.
What is the Ratio of Females per 100 Males in Enigma?
There are 90.12 Females per 100 Males in Enigma.
What is the Median Population Age in Enigma?
Median Population Age in Enigma is 41.7 Years.
What is the Average Family Size in Enigma
Average Family Size in Enigma is 3.0 People.
What is the Average Household Size in Enigma
Average Household Size in Enigma is 2.7 People.
How Large is the Labor Force in Enigma?
There are 353 People in the Labor Forcein in Enigma.
What is the Percentage of People in the Labor Force in Enigma?
36.5% of People are in the Labor Force in Enigma.