Milner, GA Map & Demographics
Milner Map
Milner Overview
$28,897
PER CAPITA INCOME
$69,107
AVG FAMILY INCOME
$66,125
AVG HOUSEHOLD INCOME
28.1%
WAGE / INCOME GAP [ % ]
71.9¢/ $1
WAGE / INCOME GAP [ $ ]
0.34
INEQUALITY / GINI INDEX
616
TOTAL POPULATION
313
MALE POPULATION
303
FEMALE POPULATION
103.30
MALES / 100 FEMALES
96.81
FEMALES / 100 MALES
39.9
MEDIAN AGE
3.0
AVG FAMILY SIZE
2.4
AVG HOUSEHOLD SIZE
285
LABOR FORCE [ PEOPLE ]
60.6%
PERCENT IN LABOR FORCE
3.5%
UNEMPLOYMENT RATE
Milner Zip Codes
Milner Area Codes
Income in Milner
Income Overview in Milner
Per Capita Income in Milner is $28,897, while median incomes of families and households are $69,107 and $66,125 respectively.
| Characteristic | Number | Measure |
| Per Capita Income | 616 | $28,897 |
| Median Family Income | 164 | $69,107 |
| Mean Family Income | 164 | $79,574 |
| Median Household Income | 262 | $66,125 |
| Mean Household Income | 262 | $69,190 |
| Income Deficit | 164 | $0 |
| Wage / Income Gap (%) | 616 | 28.14% |
| Wage / Income Gap ($) | 616 | 71.86¢ per $1 |
| Gini / Inequality Index | 616 | 0.34 |
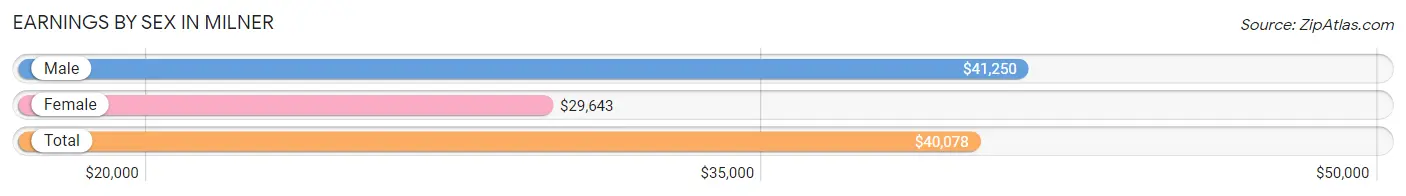
Earnings by Sex in Milner
Average Earnings in Milner are $40,078, $41,250 for men and $29,643 for women, a difference of 28.1%.
| Sex | Number | Average Earnings |
| Male | 145 (51.6%) | $41,250 |
| Female | 136 (48.4%) | $29,643 |
| Total | 281 (100.0%) | $40,078 |
Earnings by Sex by Income Bracket in Milner
The most common earnings brackets in Milner are $10,000 to $12,499 for men (26 | 17.9%) and $40,000 to $44,999 for women (21 | 15.4%).

| Income | Male | Female |
| $2,499 or less | 0 (0.0%) | 6 (4.4%) |
| $2,500 to $4,999 | 2 (1.4%) | 11 (8.1%) |
| $5,000 to $7,499 | 0 (0.0%) | 2 (1.5%) |
| $7,500 to $9,999 | 0 (0.0%) | 0 (0.0%) |
| $10,000 to $12,499 | 26 (17.9%) | 15 (11.0%) |
| $12,500 to $14,999 | 2 (1.4%) | 0 (0.0%) |
| $15,000 to $17,499 | 2 (1.4%) | 0 (0.0%) |
| $17,500 to $19,999 | 0 (0.0%) | 7 (5.1%) |
| $20,000 to $22,499 | 0 (0.0%) | 13 (9.6%) |
| $22,500 to $24,999 | 11 (7.6%) | 1 (0.7%) |
| $25,000 to $29,999 | 4 (2.8%) | 14 (10.3%) |
| $30,000 to $34,999 | 11 (7.6%) | 3 (2.2%) |
| $35,000 to $39,999 | 10 (6.9%) | 0 (0.0%) |
| $40,000 to $44,999 | 13 (9.0%) | 21 (15.4%) |
| $45,000 to $49,999 | 20 (13.8%) | 8 (5.9%) |
| $50,000 to $54,999 | 2 (1.4%) | 7 (5.1%) |
| $55,000 to $64,999 | 5 (3.5%) | 9 (6.6%) |
| $65,000 to $74,999 | 6 (4.1%) | 3 (2.2%) |
| $75,000 to $99,999 | 13 (9.0%) | 3 (2.2%) |
| $100,000+ | 18 (12.4%) | 13 (9.6%) |
| Total | 145 (100.0%) | 136 (100.0%) |
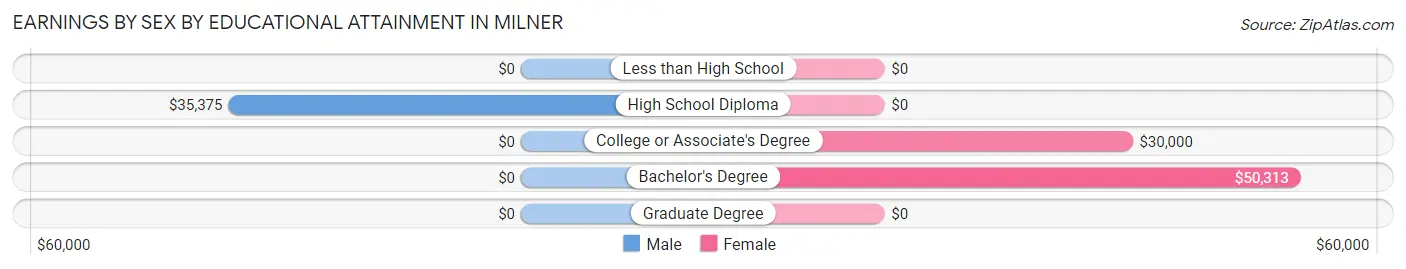
Earnings by Sex by Educational Attainment in Milner
Average earnings in Milner are $41,528 for men and $41,786 for women, a difference of 0.6%. Men with an educational attainment of high school diploma enjoy the highest average annual earnings of $35,375, while those with high school diploma education earn the least with $35,375. Women with an educational attainment of bachelor's degree earn the most with the average annual earnings of $50,313, while those with college or associate's degree education have the smallest earnings of $30,000.
| Educational Attainment | Male Income | Female Income |
| Less than High School | - | - |
| High School Diploma | $35,375 | $0 |
| College or Associate's Degree | - | - |
| Bachelor's Degree | - | - |
| Graduate Degree | - | - |
| Total | $41,528 | $41,786 |
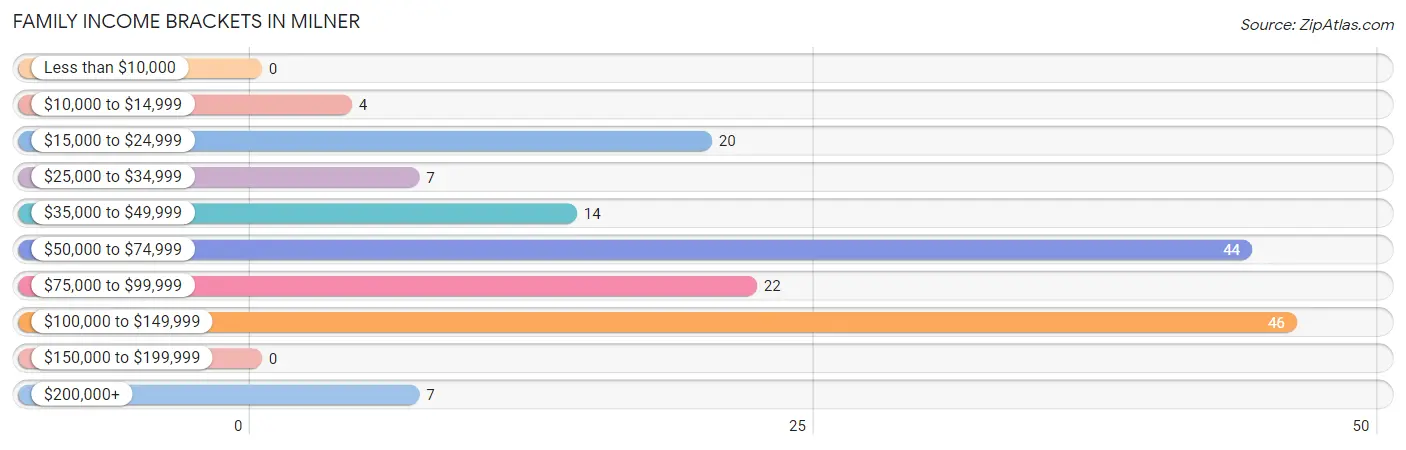
Family Income in Milner
Family Income Brackets in Milner
According to the Milner family income data, there are 46 families falling into the $100,000 to $149,999 income range, which is the most common income bracket and makes up 28.1% of all families.
| Income Bracket | # Families | % Families |
| Less than $10,000 | 0 | 0.0% |
| $10,000 to $14,999 | 4 | 2.4% |
| $15,000 to $24,999 | 20 | 12.2% |
| $25,000 to $34,999 | 7 | 4.3% |
| $35,000 to $49,999 | 14 | 8.5% |
| $50,000 to $74,999 | 44 | 26.8% |
| $75,000 to $99,999 | 22 | 13.4% |
| $100,000 to $149,999 | 46 | 28.0% |
| $150,000 to $199,999 | 0 | 0.0% |
| $200,000+ | 7 | 4.3% |
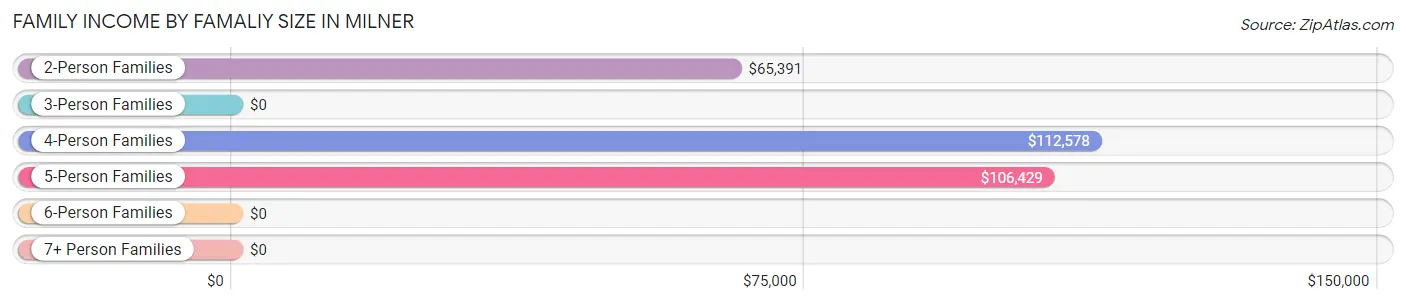
Family Income by Famaliy Size in Milner
4-person families (31 | 18.9%) account for the highest median family income in Milner with $112,578 per family, while 2-person families (89 | 54.3%) have the highest median income of $32,696 per family member.
| Income Bracket | # Families | Median Income |
| 2-Person Families | 89 (54.3%) | $65,391 |
| 3-Person Families | 24 (14.6%) | $0 |
| 4-Person Families | 31 (18.9%) | $112,578 |
| 5-Person Families | 20 (12.2%) | $106,429 |
| 6-Person Families | 0 (0.0%) | $0 |
| 7+ Person Families | 0 (0.0%) | $0 |
| Total | 164 (100.0%) | $69,107 |
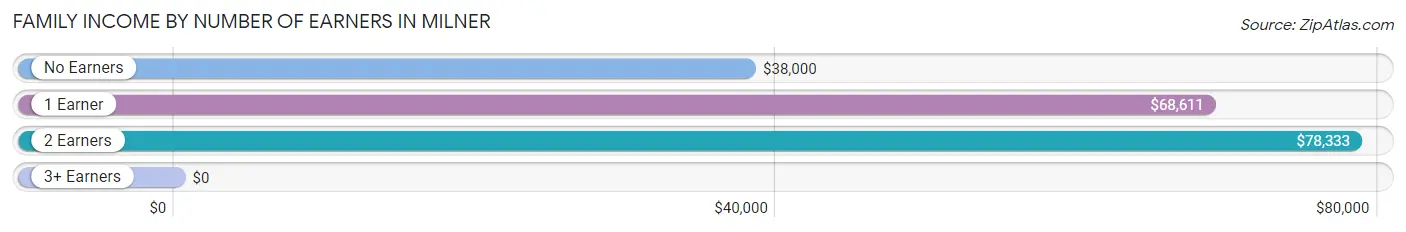
Family Income by Number of Earners in Milner
| Number of Earners | # Families | Median Income |
| No Earners | 38 (23.2%) | $38,000 |
| 1 Earner | 48 (29.3%) | $68,611 |
| 2 Earners | 66 (40.2%) | $78,333 |
| 3+ Earners | 12 (7.3%) | $0 |
| Total | 164 (100.0%) | $69,107 |
Household Income in Milner
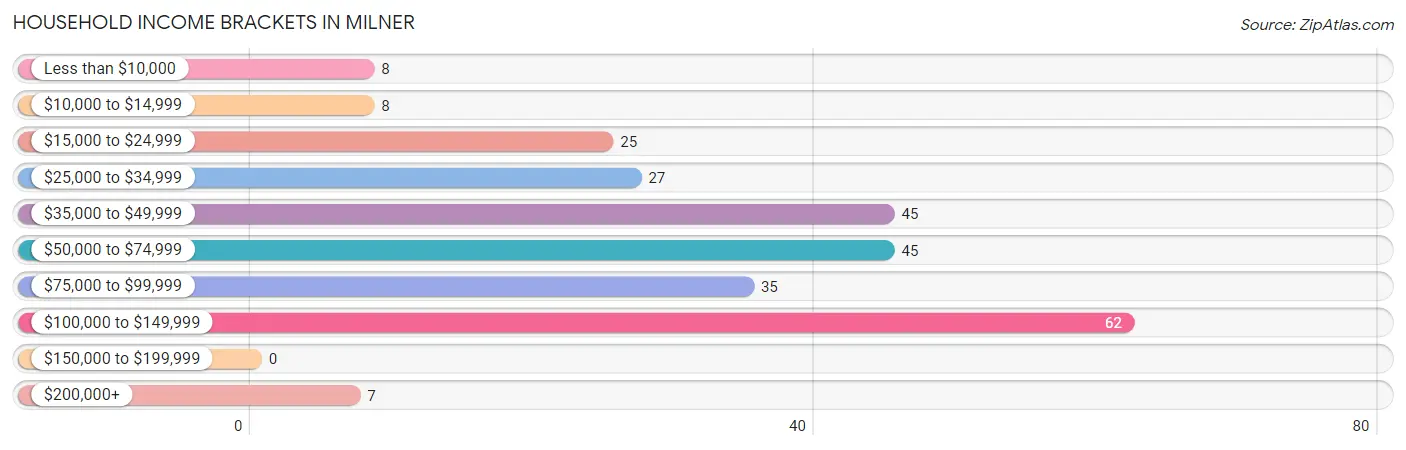
Household Income Brackets in Milner
With 62 households falling in the category, the $100,000 to $149,999 income range is the most frequent in Milner, accounting for 23.7% of all households.
| Income Bracket | # Households | % Households |
| Less than $10,000 | 8 | 3.1% |
| $10,000 to $14,999 | 8 | 3.1% |
| $15,000 to $24,999 | 25 | 9.5% |
| $25,000 to $34,999 | 27 | 10.3% |
| $35,000 to $49,999 | 45 | 17.2% |
| $50,000 to $74,999 | 45 | 17.2% |
| $75,000 to $99,999 | 35 | 13.4% |
| $100,000 to $149,999 | 62 | 23.7% |
| $150,000 to $199,999 | 0 | 0.0% |
| $200,000+ | 7 | 2.7% |
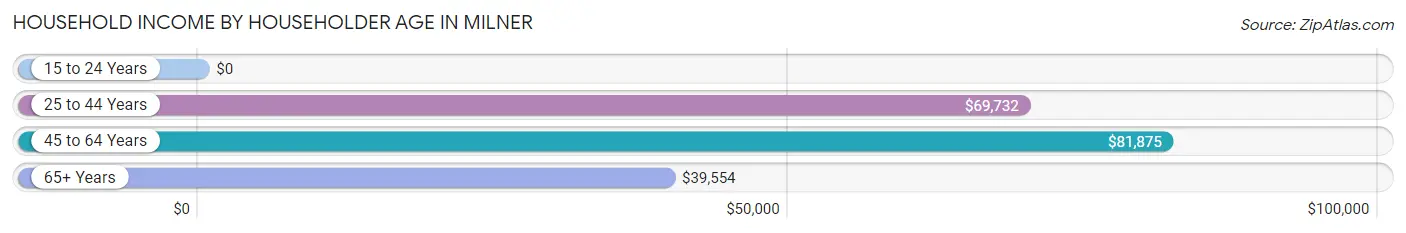
Household Income by Householder Age in Milner
The median household income in Milner is $66,125, with the highest median household income of $81,875 found in the 45 to 64 years age bracket for the primary householder. A total of 81 households (30.9%) fall into this category. Meanwhile, the 15 to 24 years age bracket for the primary householder has the lowest median household income of $0, with 15 households (5.7%) in this group.
| Income Bracket | # Households | Median Income |
| 15 to 24 Years | 15 (5.7%) | $0 |
| 25 to 44 Years | 79 (30.1%) | $69,732 |
| 45 to 64 Years | 81 (30.9%) | $81,875 |
| 65+ Years | 87 (33.2%) | $39,554 |
| Total | 262 (100.0%) | $66,125 |
Poverty in Milner
Income Below Poverty by Sex and Age in Milner
With 6.7% poverty level for males and 9.6% for females among the residents of Milner, 5 year old males and 12 to 14 year old females are the most vulnerable to poverty, with 3 males (75.0%) and 3 females (100.0%) in their respective age groups living below the poverty level.
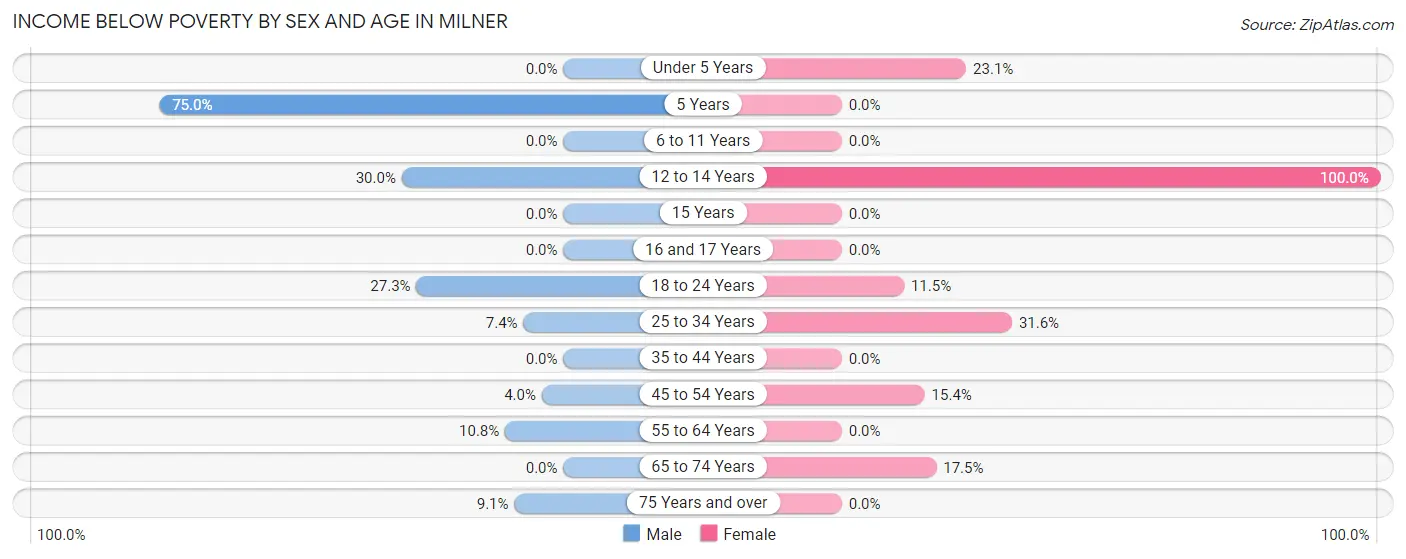
| Age Bracket | Male | Female |
| Under 5 Years | 0 (0.0%) | 3 (23.1%) |
| 5 Years | 3 (75.0%) | 0 (0.0%) |
| 6 to 11 Years | 0 (0.0%) | 0 (0.0%) |
| 12 to 14 Years | 3 (30.0%) | 3 (100.0%) |
| 15 Years | 0 (0.0%) | 0 (0.0%) |
| 16 and 17 Years | 0 (0.0%) | 0 (0.0%) |
| 18 to 24 Years | 3 (27.3%) | 3 (11.5%) |
| 25 to 34 Years | 2 (7.4%) | 6 (31.6%) |
| 35 to 44 Years | 0 (0.0%) | 0 (0.0%) |
| 45 to 54 Years | 2 (4.0%) | 4 (15.4%) |
| 55 to 64 Years | 4 (10.8%) | 0 (0.0%) |
| 65 to 74 Years | 0 (0.0%) | 10 (17.5%) |
| 75 Years and over | 4 (9.1%) | 0 (0.0%) |
| Total | 21 (6.7%) | 29 (9.6%) |
Income Above Poverty by Sex and Age in Milner
According to the poverty statistics in Milner, males aged under 5 years and females aged 5 years are the age groups that are most secure financially, with 100.0% of males and 100.0% of females in these age groups living above the poverty line.
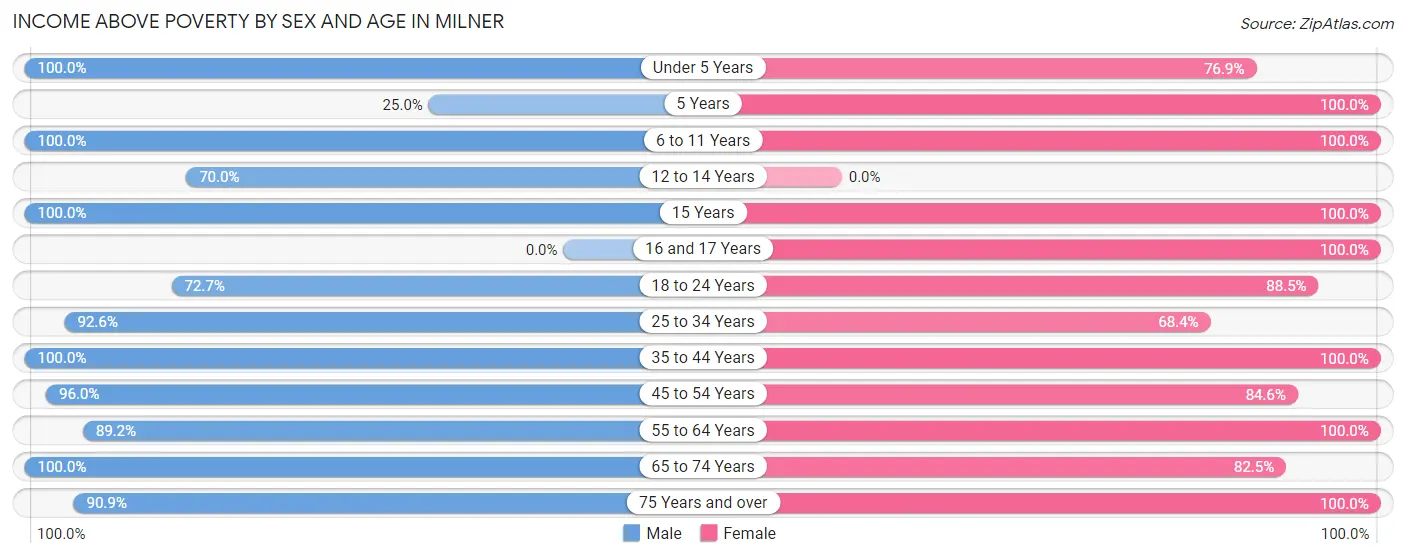
| Age Bracket | Male | Female |
| Under 5 Years | 30 (100.0%) | 10 (76.9%) |
| 5 Years | 1 (25.0%) | 18 (100.0%) |
| 6 to 11 Years | 32 (100.0%) | 26 (100.0%) |
| 12 to 14 Years | 7 (70.0%) | 0 (0.0%) |
| 15 Years | 7 (100.0%) | 3 (100.0%) |
| 16 and 17 Years | 0 (0.0%) | 11 (100.0%) |
| 18 to 24 Years | 8 (72.7%) | 23 (88.5%) |
| 25 to 34 Years | 25 (92.6%) | 13 (68.4%) |
| 35 to 44 Years | 38 (100.0%) | 51 (100.0%) |
| 45 to 54 Years | 48 (96.0%) | 22 (84.6%) |
| 55 to 64 Years | 33 (89.2%) | 28 (100.0%) |
| 65 to 74 Years | 23 (100.0%) | 47 (82.5%) |
| 75 Years and over | 40 (90.9%) | 22 (100.0%) |
| Total | 292 (93.3%) | 274 (90.4%) |
Income Below Poverty Among Married-Couple Families in Milner
The poverty statistics for married-couple families in Milner show that 3.6% or 4 of the total 111 families live below the poverty line. Families with 1 or 2 children have the highest poverty rate of 5.3%, comprising of 2 families. On the other hand, families with 3 or 4 children have the lowest poverty rate of 0.0%, which includes 0 families.
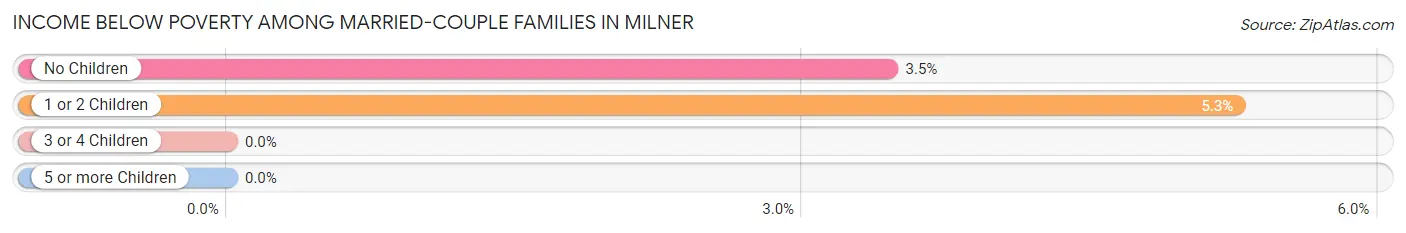
| Children | Above Poverty | Below Poverty |
| No Children | 56 (96.6%) | 2 (3.5%) |
| 1 or 2 Children | 36 (94.7%) | 2 (5.3%) |
| 3 or 4 Children | 15 (100.0%) | 0 (0.0%) |
| 5 or more Children | 0 (0.0%) | 0 (0.0%) |
| Total | 107 (96.4%) | 4 (3.6%) |
Income Below Poverty Among Single-Parent Households in Milner
According to the poverty data in Milner, 14.3% or 2 single-father households and 10.3% or 4 single-mother households are living below the poverty line. Among single-father households, those with no children have the highest poverty rate, with 2 households (14.3%) experiencing poverty. Likewise, among single-mother households, those with 1 or 2 children have the highest poverty rate, with 4 households (44.4%) falling below the poverty line.
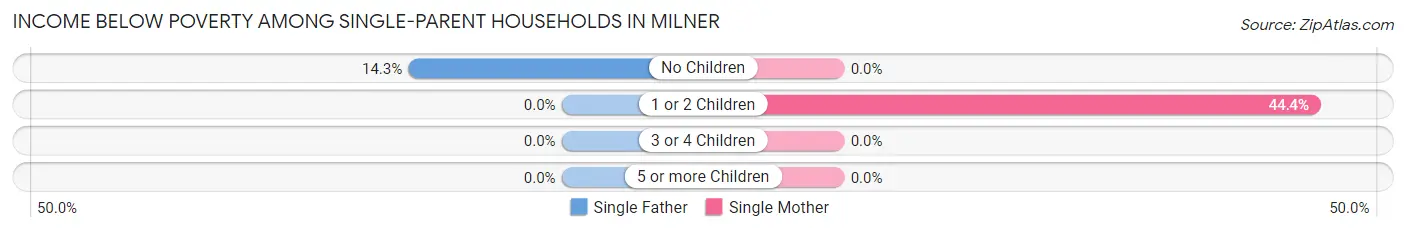
| Children | Single Father | Single Mother |
| No Children | 2 (14.3%) | 0 (0.0%) |
| 1 or 2 Children | 0 (0.0%) | 4 (44.4%) |
| 3 or 4 Children | 0 (0.0%) | 0 (0.0%) |
| 5 or more Children | 0 (0.0%) | 0 (0.0%) |
| Total | 2 (14.3%) | 4 (10.3%) |
Income Below Poverty Among Married-Couple vs Single-Parent Households in Milner
The poverty data for Milner shows that 4 of the married-couple family households (3.6%) and 6 of the single-parent households (11.3%) are living below the poverty level. Within the married-couple family households, those with 1 or 2 children have the highest poverty rate, with 2 households (5.3%) falling below the poverty line. Among the single-parent households, those with 1 or 2 children have the highest poverty rate, with 4 household (44.4%) living below poverty.
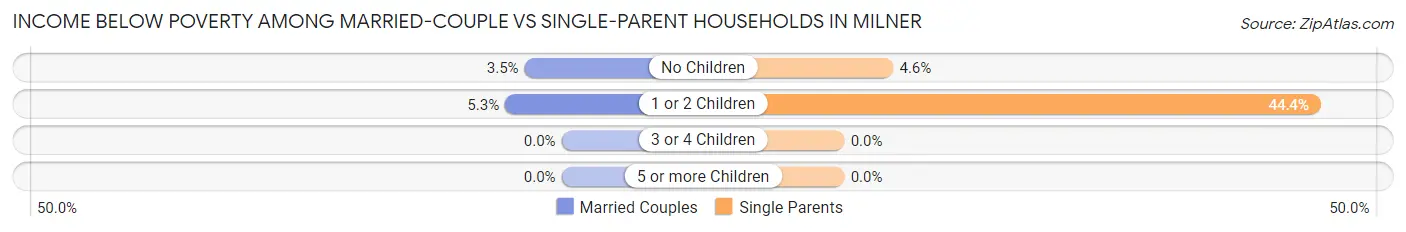
| Children | Married-Couple Families | Single-Parent Households |
| No Children | 2 (3.5%) | 2 (4.5%) |
| 1 or 2 Children | 2 (5.3%) | 4 (44.4%) |
| 3 or 4 Children | 0 (0.0%) | 0 (0.0%) |
| 5 or more Children | 0 (0.0%) | 0 (0.0%) |
| Total | 4 (3.6%) | 6 (11.3%) |
Race in Milner
The most populous races in Milner are White / Caucasian (528 | 85.7%), Black / African American (77 | 12.5%), and Hispanic or Latino (11 | 1.8%).
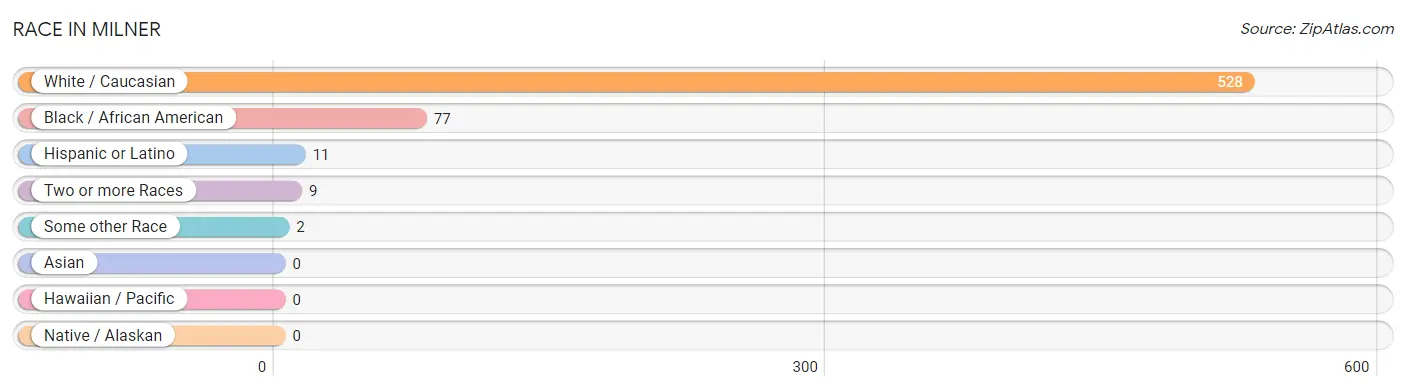
| Race | # Population | % Population |
| Asian | 0 | 0.0% |
| Black / African American | 77 | 12.5% |
| Hawaiian / Pacific | 0 | 0.0% |
| Hispanic or Latino | 11 | 1.8% |
| Native / Alaskan | 0 | 0.0% |
| White / Caucasian | 528 | 85.7% |
| Two or more Races | 9 | 1.5% |
| Some other Race | 2 | 0.3% |
| Total | 616 | 100.0% |
Ancestry in Milner
The most populous ancestries reported in Milner are American (117 | 19.0%), Irish (76 | 12.3%), German (59 | 9.6%), English (52 | 8.4%), and European (13 | 2.1%), together accounting for 51.5% of all Milner residents.
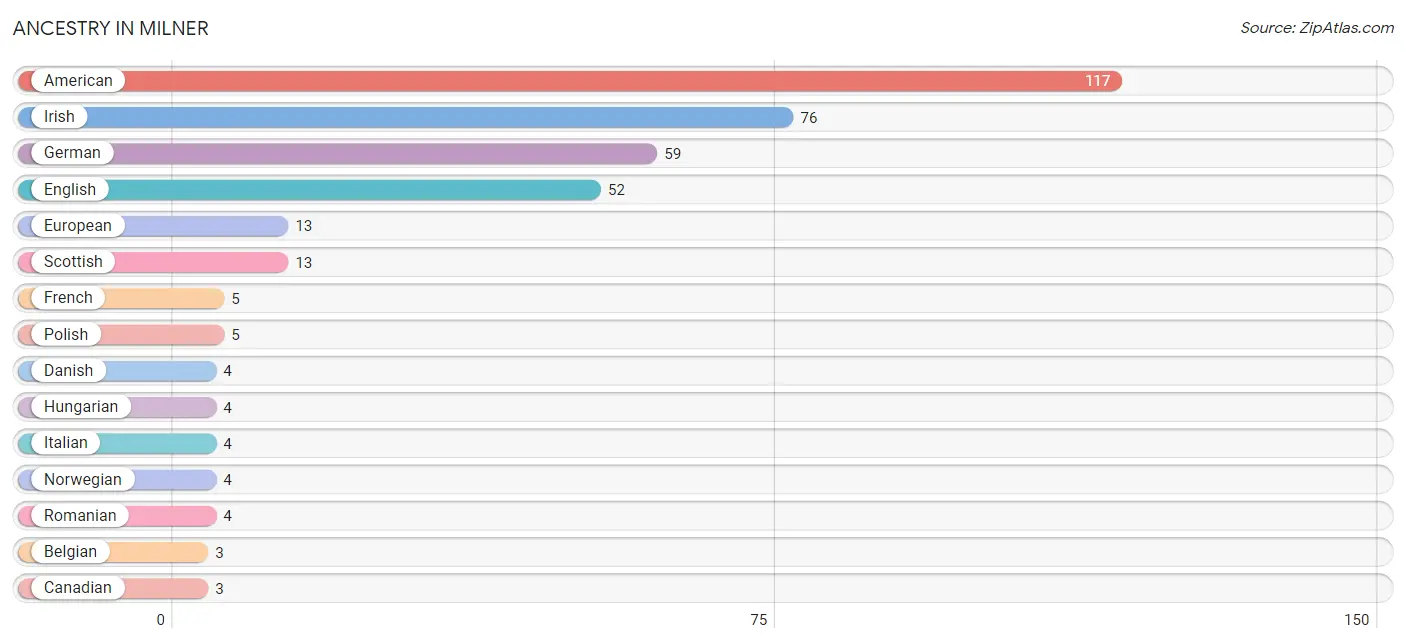
| Ancestry | # Population | % Population |
| American | 117 | 19.0% |
| Belgian | 3 | 0.5% |
| British | 2 | 0.3% |
| Canadian | 3 | 0.5% |
| Danish | 4 | 0.6% |
| English | 52 | 8.4% |
| European | 13 | 2.1% |
| French | 5 | 0.8% |
| German | 59 | 9.6% |
| Greek | 2 | 0.3% |
| Hungarian | 4 | 0.6% |
| Inupiat | 1 | 0.2% |
| Irish | 76 | 12.3% |
| Italian | 4 | 0.6% |
| Norwegian | 4 | 0.6% |
| Polish | 5 | 0.8% |
| Romanian | 4 | 0.6% |
| Scandinavian | 3 | 0.5% |
| Scotch-Irish | 2 | 0.3% |
| Scottish | 13 | 2.1% |
| Sioux | 2 | 0.3% |
| Welsh | 2 | 0.3% | View All 22 Rows |
Immigrants in Milner
The most numerous immigrant groups reported in Milner came from , and Canada (3 | 0.5%), together accounting for 0.5% of all Milner residents.

| Immigration Origin | # Population | % Population |
| Canada | 3 | 0.5% | View All 1 Rows |
Sex and Age in Milner
Sex and Age in Milner
The most populous age groups in Milner are 75 to 79 Years (36 | 11.5%) for men and 5 to 9 Years (36 | 11.9%) for women.
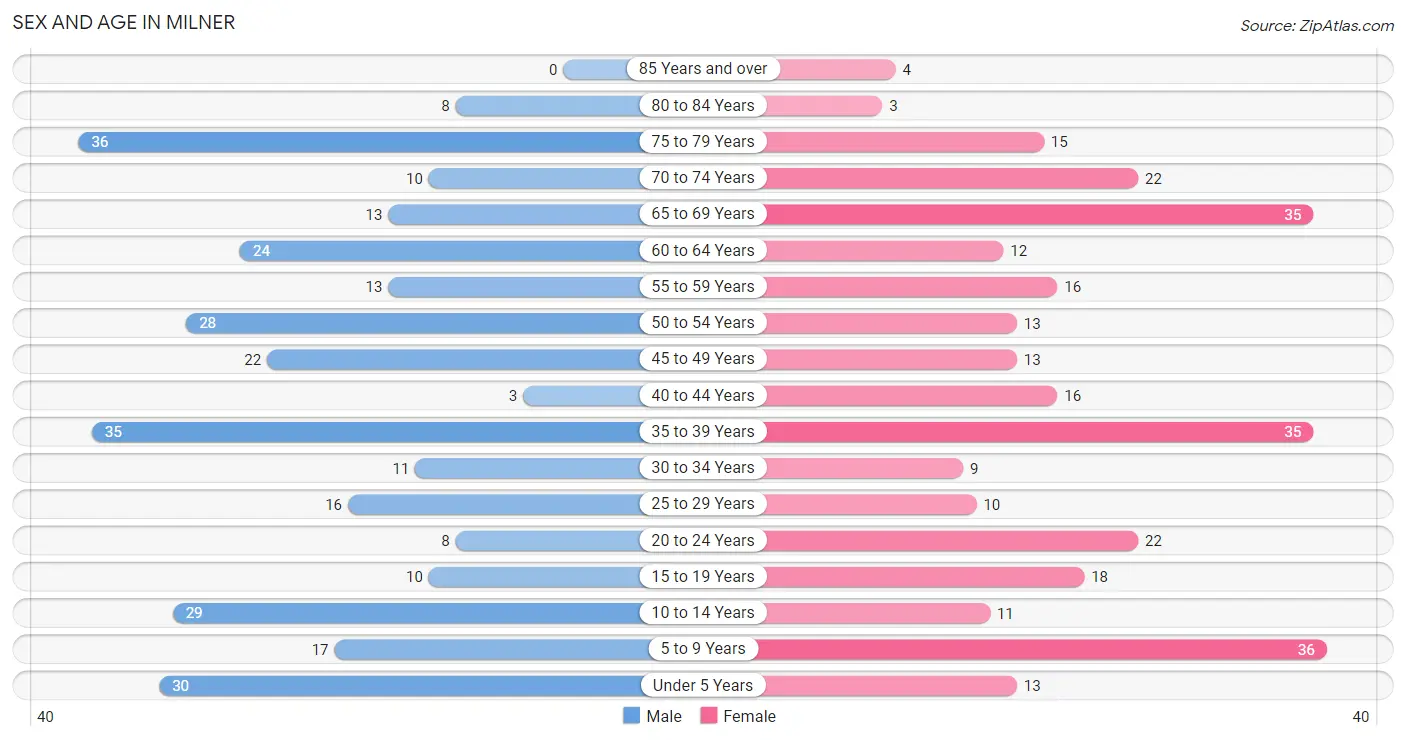
| Age Bracket | Male | Female |
| Under 5 Years | 30 (9.6%) | 13 (4.3%) |
| 5 to 9 Years | 17 (5.4%) | 36 (11.9%) |
| 10 to 14 Years | 29 (9.3%) | 11 (3.6%) |
| 15 to 19 Years | 10 (3.2%) | 18 (5.9%) |
| 20 to 24 Years | 8 (2.6%) | 22 (7.3%) |
| 25 to 29 Years | 16 (5.1%) | 10 (3.3%) |
| 30 to 34 Years | 11 (3.5%) | 9 (3.0%) |
| 35 to 39 Years | 35 (11.2%) | 35 (11.6%) |
| 40 to 44 Years | 3 (1.0%) | 16 (5.3%) |
| 45 to 49 Years | 22 (7.0%) | 13 (4.3%) |
| 50 to 54 Years | 28 (8.9%) | 13 (4.3%) |
| 55 to 59 Years | 13 (4.2%) | 16 (5.3%) |
| 60 to 64 Years | 24 (7.7%) | 12 (4.0%) |
| 65 to 69 Years | 13 (4.2%) | 35 (11.6%) |
| 70 to 74 Years | 10 (3.2%) | 22 (7.3%) |
| 75 to 79 Years | 36 (11.5%) | 15 (5.0%) |
| 80 to 84 Years | 8 (2.6%) | 3 (1.0%) |
| 85 Years and over | 0 (0.0%) | 4 (1.3%) |
| Total | 313 (100.0%) | 303 (100.0%) |
Families and Households in Milner
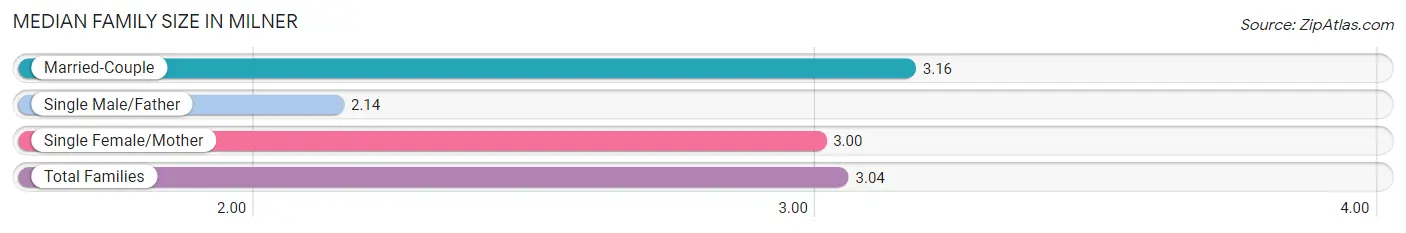
Median Family Size in Milner
The median family size in Milner is 3.04 persons per family, with married-couple families (111 | 67.7%) accounting for the largest median family size of 3.16 persons per family. On the other hand, single male/father families (14 | 8.5%) represent the smallest median family size with 2.14 persons per family.
| Family Type | # Families | Family Size |
| Married-Couple | 111 (67.7%) | 3.16 |
| Single Male/Father | 14 (8.5%) | 2.14 |
| Single Female/Mother | 39 (23.8%) | 3.00 |
| Total Families | 164 (100.0%) | 3.04 |
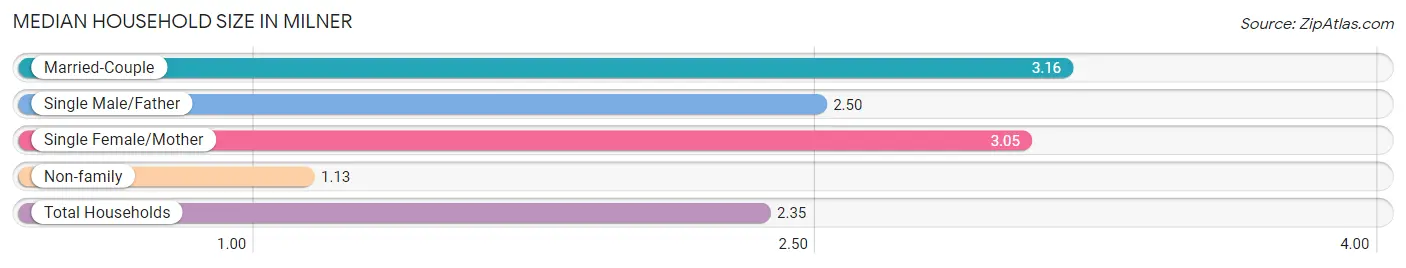
Median Household Size in Milner
The median household size in Milner is 2.35 persons per household, with married-couple households (111 | 42.4%) accounting for the largest median household size of 3.16 persons per household. non-family households (98 | 37.4%) represent the smallest median household size with 1.13 persons per household.
| Household Type | # Households | Household Size |
| Married-Couple | 111 (42.4%) | 3.16 |
| Single Male/Father | 14 (5.3%) | 2.50 |
| Single Female/Mother | 39 (14.9%) | 3.05 |
| Non-family | 98 (37.4%) | 1.13 |
| Total Households | 262 (100.0%) | 2.35 |
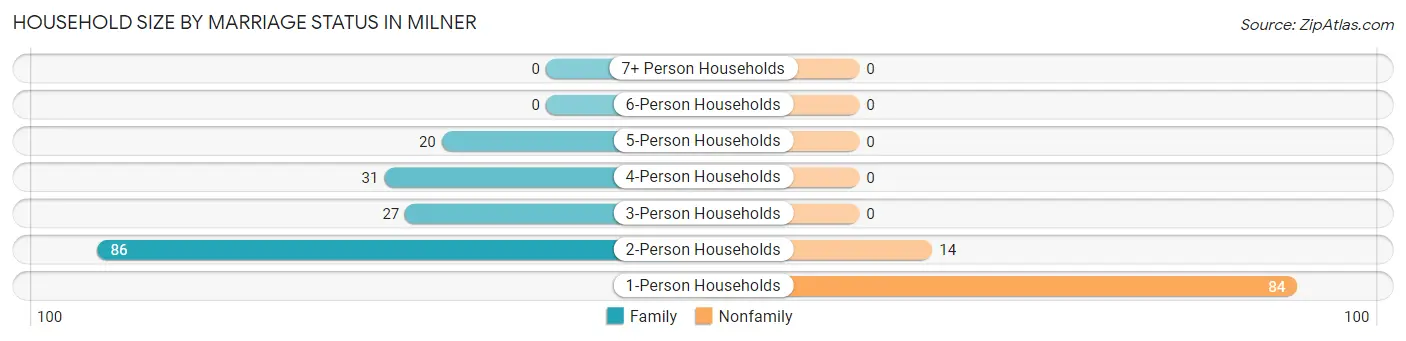
Household Size by Marriage Status in Milner
Out of a total of 262 households in Milner, 164 (62.6%) are family households, while 98 (37.4%) are nonfamily households. The most numerous type of family households are 2-person households, comprising 86, and the most common type of nonfamily households are 1-person households, comprising 84.
| Household Size | Family Households | Nonfamily Households |
| 1-Person Households | - | 84 (32.1%) |
| 2-Person Households | 86 (32.8%) | 14 (5.3%) |
| 3-Person Households | 27 (10.3%) | 0 (0.0%) |
| 4-Person Households | 31 (11.8%) | 0 (0.0%) |
| 5-Person Households | 20 (7.6%) | 0 (0.0%) |
| 6-Person Households | 0 (0.0%) | 0 (0.0%) |
| 7+ Person Households | 0 (0.0%) | 0 (0.0%) |
| Total | 164 (62.6%) | 98 (37.4%) |
Female Fertility in Milner
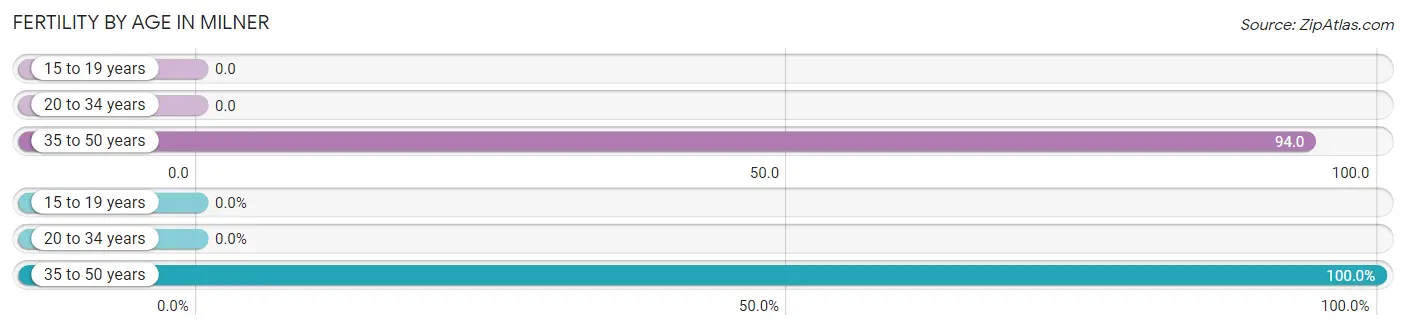
Fertility by Age in Milner
Average fertility rate in Milner is 49.0 births per 1,000 women. Women in the age bracket of 35 to 50 years have the highest fertility rate with 94.0 births per 1,000 women. Women in the age bracket of 35 to 50 years acount for 100.0% of all women with births.
| Age Bracket | Women with Births | Births / 1,000 Women |
| 15 to 19 years | 0 (0.0%) | 0.0 |
| 20 to 34 years | 0 (0.0%) | 0.0 |
| 35 to 50 years | 6 (100.0%) | 94.0 |
| Total | 6 (100.0%) | 49.0 |
Fertility by Age by Marriage Status in Milner
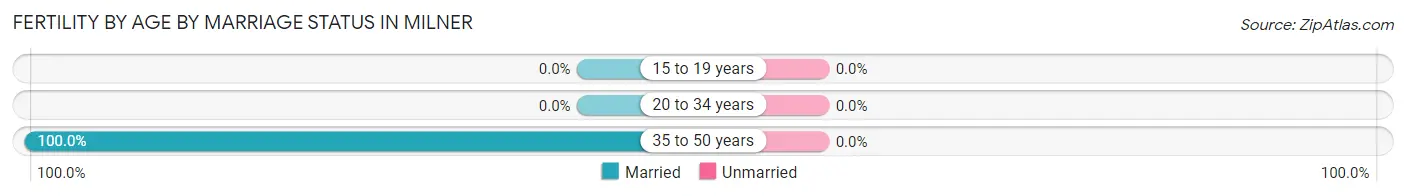
| Age Bracket | Married | Unmarried |
| 15 to 19 years | 0 (0.0%) | 0 (0.0%) |
| 20 to 34 years | 0 (0.0%) | 0 (0.0%) |
| 35 to 50 years | 6 (100.0%) | 0 (0.0%) |
| Total | 6 (100.0%) | 0 (0.0%) |
Fertility by Education in Milner
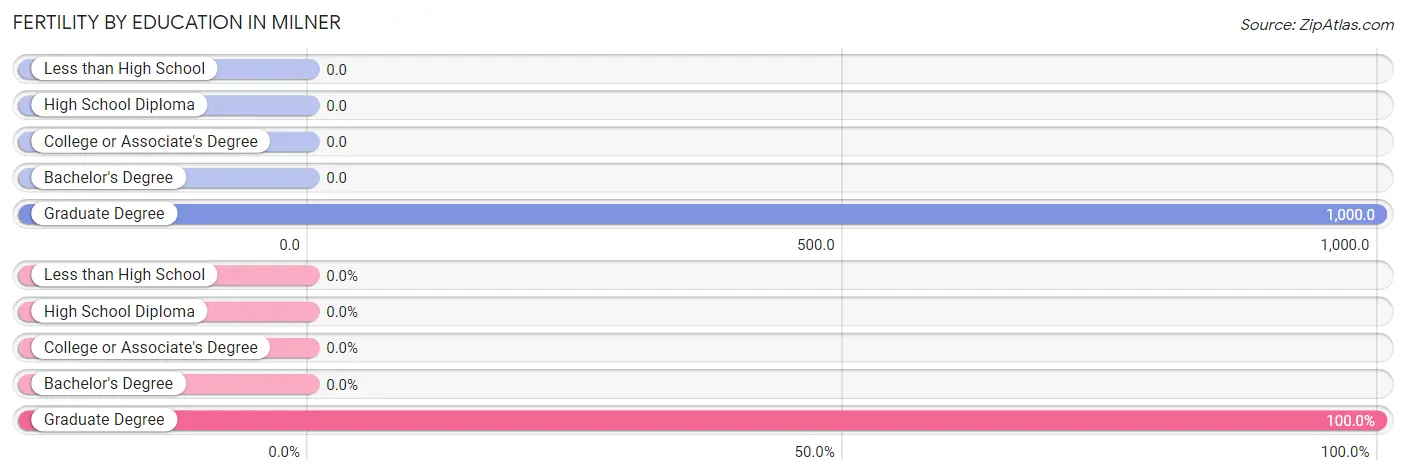
| Educational Attainment | Women with Births | Births / 1,000 Women |
| Less than High School | 0 (0.0%) | 0.0 |
| High School Diploma | 0 (0.0%) | 0.0 |
| College or Associate's Degree | 0 (0.0%) | 0.0 |
| Bachelor's Degree | 0 (0.0%) | 0.0 |
| Graduate Degree | 6 (100.0%) | 1,000.0 |
| Total | 6 (100.0%) | 49.0 |
Fertility by Education by Marriage Status in Milner
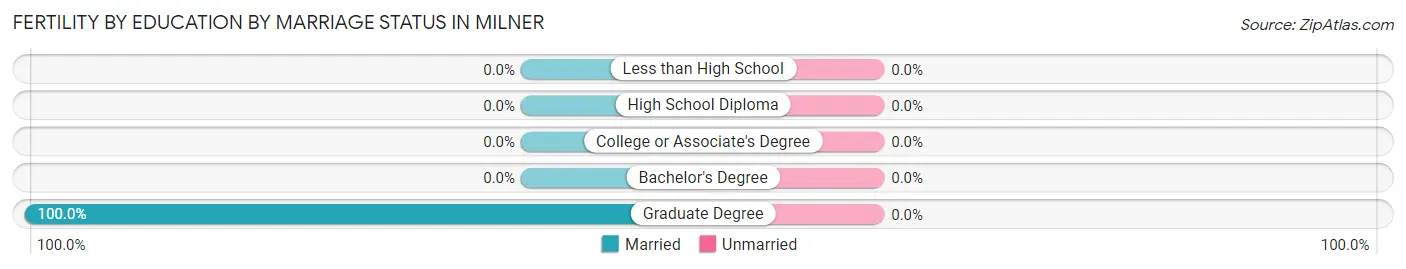
| Educational Attainment | Married | Unmarried |
| Less than High School | 0 (0.0%) | 0 (0.0%) |
| High School Diploma | 0 (0.0%) | 0 (0.0%) |
| College or Associate's Degree | 0 (0.0%) | 0 (0.0%) |
| Bachelor's Degree | 0 (0.0%) | 0 (0.0%) |
| Graduate Degree | 6 (100.0%) | 0 (0.0%) |
| Total | 6 (100.0%) | 0 (0.0%) |
Employment Characteristics in Milner
Employment by Class of Employer in Milner
Among the 273 employed individuals in Milner, private company employees (143 | 52.4%), self-employed (not incorporated) (32 | 11.7%), and local government employees (29 | 10.6%) make up the most common classes of employment.
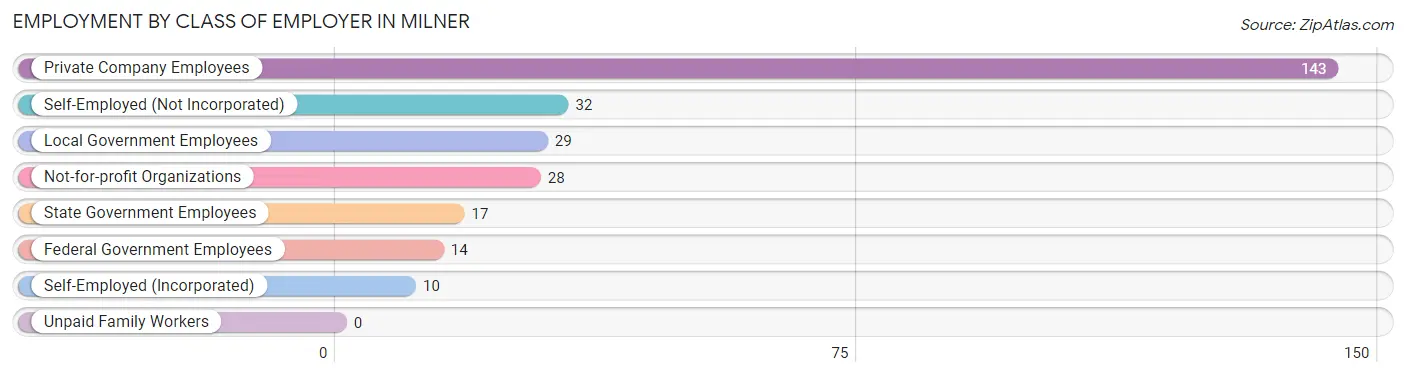
| Employer Class | # Employees | % Employees |
| Private Company Employees | 143 | 52.4% |
| Self-Employed (Incorporated) | 10 | 3.7% |
| Self-Employed (Not Incorporated) | 32 | 11.7% |
| Not-for-profit Organizations | 28 | 10.3% |
| Local Government Employees | 29 | 10.6% |
| State Government Employees | 17 | 6.2% |
| Federal Government Employees | 14 | 5.1% |
| Unpaid Family Workers | 0 | 0.0% |
| Total | 273 | 100.0% |
Employment Status by Age in Milner
According to the labor force statistics for Milner, out of the total population over 16 years of age (470), 60.6% or 285 individuals are in the labor force, with 3.5% or 10 of them unemployed. The age group with the highest labor force participation rate is 30 to 34 years, with 100.0% or 20 individuals in the labor force. Within the labor force, the 35 to 44 years age range has the highest percentage of unemployed individuals, with 9.3% or 8 of them being unemployed.
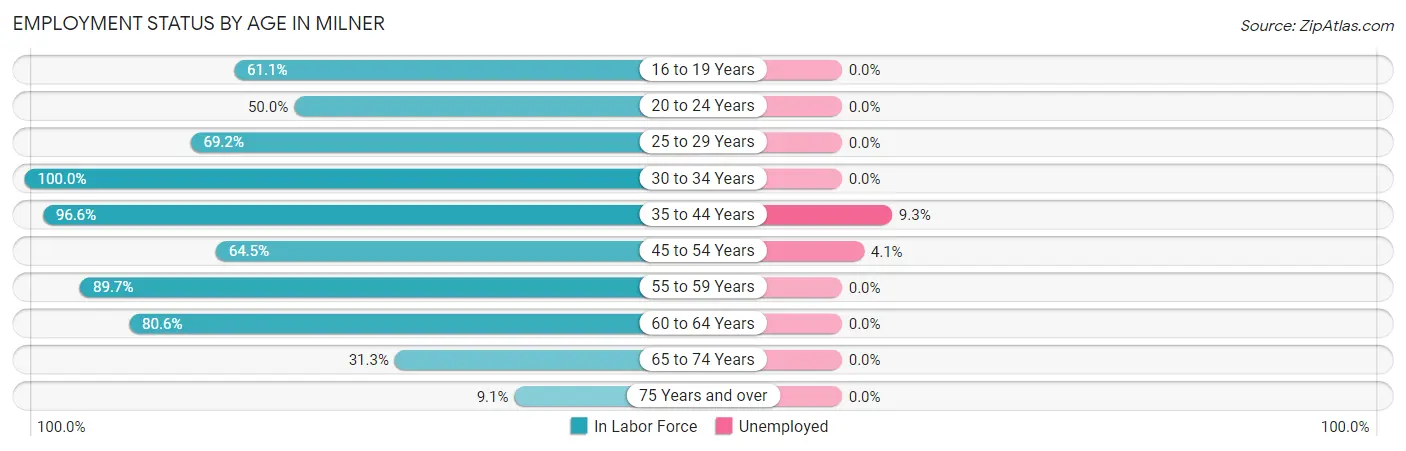
| Age Bracket | In Labor Force | Unemployed |
| 16 to 19 Years | 11 (61.1%) | 0 (0.0%) |
| 20 to 24 Years | 15 (50.0%) | 0 (0.0%) |
| 25 to 29 Years | 18 (69.2%) | 0 (0.0%) |
| 30 to 34 Years | 20 (100.0%) | 0 (0.0%) |
| 35 to 44 Years | 86 (96.6%) | 8 (9.3%) |
| 45 to 54 Years | 49 (64.5%) | 2 (4.1%) |
| 55 to 59 Years | 26 (89.7%) | 0 (0.0%) |
| 60 to 64 Years | 29 (80.6%) | 0 (0.0%) |
| 65 to 74 Years | 25 (31.3%) | 0 (0.0%) |
| 75 Years and over | 6 (9.1%) | 0 (0.0%) |
| Total | 285 (60.6%) | 10 (3.5%) |
Employment Status by Educational Attainment in Milner
According to labor force statistics for Milner, 82.6% of individuals (228) out of the total population between 25 and 64 years of age (276) are in the labor force, with 4.4% or 10 of them being unemployed. The group with the highest labor force participation rate are those with the educational attainment of less than high school, with 100.0% or 16 individuals in the labor force. Within the labor force, individuals with bachelor's degree or higher education have the highest percentage of unemployment, with 20.5% or 8 of them being unemployed.
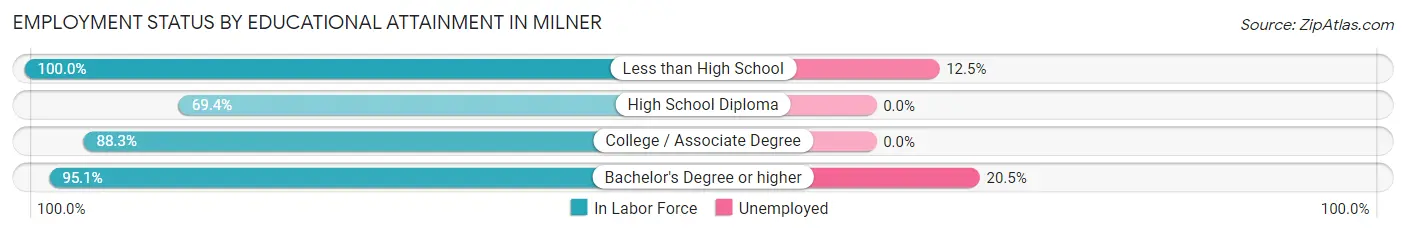
| Educational Attainment | In Labor Force | Unemployed |
| Less than High School | 16 (100.0%) | 2 (12.5%) |
| High School Diploma | 75 (69.4%) | 0 (0.0%) |
| College / Associate Degree | 98 (88.3%) | 0 (0.0%) |
| Bachelor's Degree or higher | 39 (95.1%) | 8 (20.5%) |
| Total | 228 (82.6%) | 12 (4.4%) |
Employment Occupations by Sex in Milner
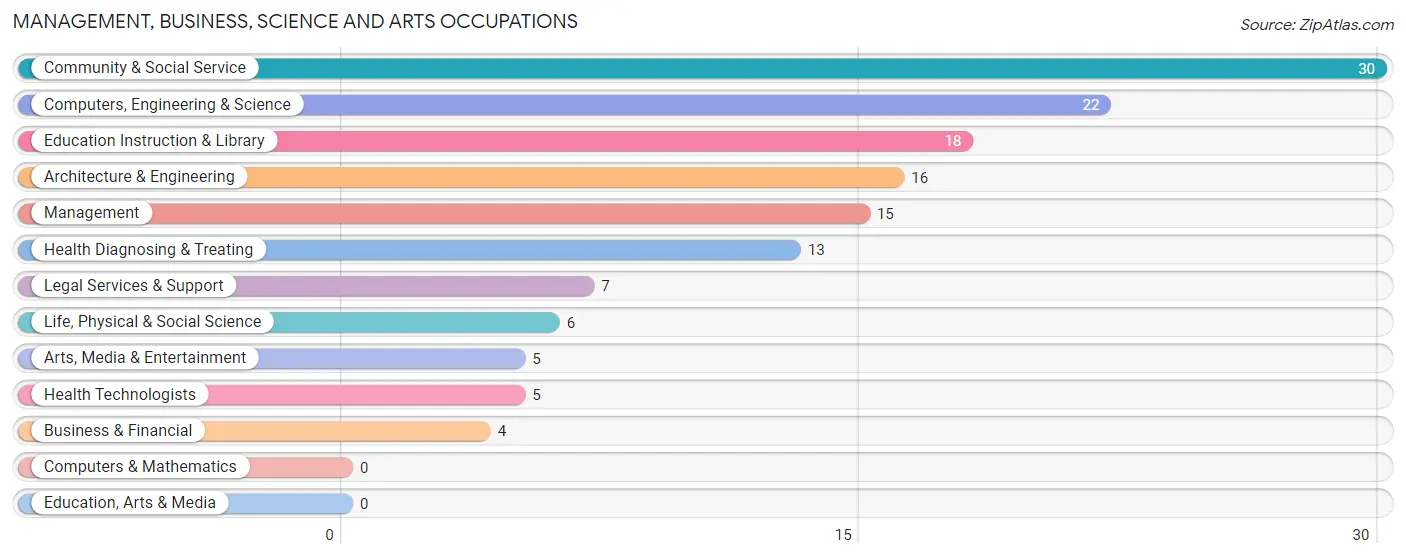
Management, Business, Science and Arts Occupations
The most common Management, Business, Science and Arts occupations in Milner are Community & Social Service (30 | 10.9%), Computers, Engineering & Science (22 | 8.0%), Education Instruction & Library (18 | 6.6%), Architecture & Engineering (16 | 5.8%), and Management (15 | 5.4%).
Management, Business, Science and Arts Occupations by Sex
Within the Management, Business, Science and Arts occupations in Milner, the most male-oriented occupations are Architecture & Engineering (100.0%), Computers, Engineering & Science (72.7%), and Education Instruction & Library (50.0%), while the most female-oriented occupations are Business & Financial (100.0%), Life, Physical & Social Science (100.0%), and Legal Services & Support (100.0%).
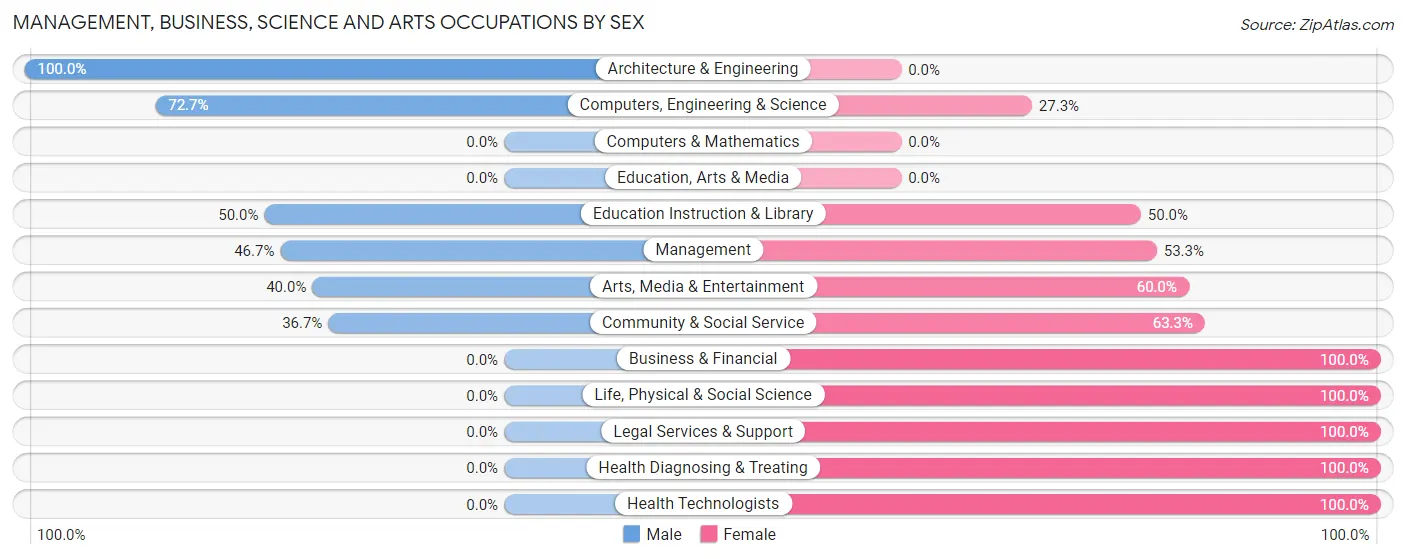
| Occupation | Male | Female |
| Management | 7 (46.7%) | 8 (53.3%) |
| Business & Financial | 0 (0.0%) | 4 (100.0%) |
| Computers, Engineering & Science | 16 (72.7%) | 6 (27.3%) |
| Computers & Mathematics | 0 (0.0%) | 0 (0.0%) |
| Architecture & Engineering | 16 (100.0%) | 0 (0.0%) |
| Life, Physical & Social Science | 0 (0.0%) | 6 (100.0%) |
| Community & Social Service | 11 (36.7%) | 19 (63.3%) |
| Education, Arts & Media | 0 (0.0%) | 0 (0.0%) |
| Legal Services & Support | 0 (0.0%) | 7 (100.0%) |
| Education Instruction & Library | 9 (50.0%) | 9 (50.0%) |
| Arts, Media & Entertainment | 2 (40.0%) | 3 (60.0%) |
| Health Diagnosing & Treating | 0 (0.0%) | 13 (100.0%) |
| Health Technologists | 0 (0.0%) | 5 (100.0%) |
| Total (Category) | 34 (40.5%) | 50 (59.5%) |
| Total (Overall) | 145 (52.7%) | 130 (47.3%) |
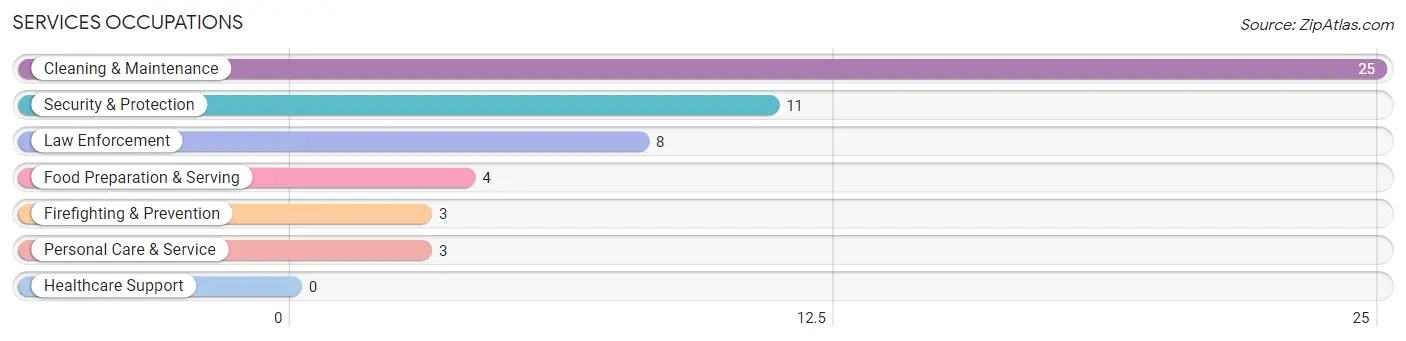
Services Occupations
The most common Services occupations in Milner are Cleaning & Maintenance (25 | 9.1%), Security & Protection (11 | 4.0%), Law Enforcement (8 | 2.9%), Food Preparation & Serving (4 | 1.5%), and Firefighting & Prevention (3 | 1.1%).
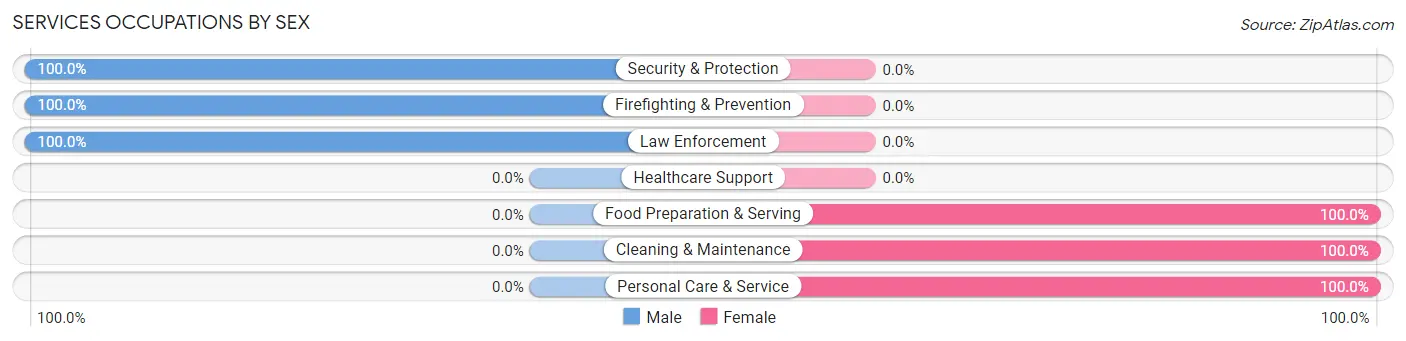
Services Occupations by Sex
Within the Services occupations in Milner, the most male-oriented occupations are Security & Protection (100.0%), Firefighting & Prevention (100.0%), and Law Enforcement (100.0%), while the most female-oriented occupations are Food Preparation & Serving (100.0%), Cleaning & Maintenance (100.0%), and Personal Care & Service (100.0%).
| Occupation | Male | Female |
| Healthcare Support | 0 (0.0%) | 0 (0.0%) |
| Security & Protection | 11 (100.0%) | 0 (0.0%) |
| Firefighting & Prevention | 3 (100.0%) | 0 (0.0%) |
| Law Enforcement | 8 (100.0%) | 0 (0.0%) |
| Food Preparation & Serving | 0 (0.0%) | 4 (100.0%) |
| Cleaning & Maintenance | 0 (0.0%) | 25 (100.0%) |
| Personal Care & Service | 0 (0.0%) | 3 (100.0%) |
| Total (Category) | 11 (25.6%) | 32 (74.4%) |
| Total (Overall) | 145 (52.7%) | 130 (47.3%) |
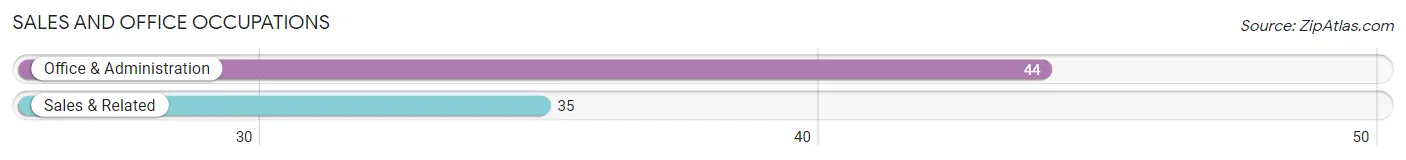
Sales and Office Occupations
The most common Sales and Office occupations in Milner are Office & Administration (44 | 16.0%), and Sales & Related (35 | 12.7%).
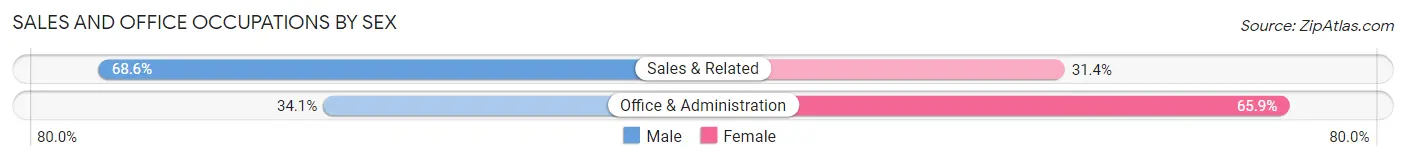
Sales and Office Occupations by Sex
| Occupation | Male | Female |
| Sales & Related | 24 (68.6%) | 11 (31.4%) |
| Office & Administration | 15 (34.1%) | 29 (65.9%) |
| Total (Category) | 39 (49.4%) | 40 (50.6%) |
| Total (Overall) | 145 (52.7%) | 130 (47.3%) |
Natural Resources, Construction and Maintenance Occupations
The most common Natural Resources, Construction and Maintenance occupations in Milner are Installation, Maintenance & Repair (24 | 8.7%), Construction & Extraction (20 | 7.3%), and Farming, Fishing & Forestry (1 | 0.4%).
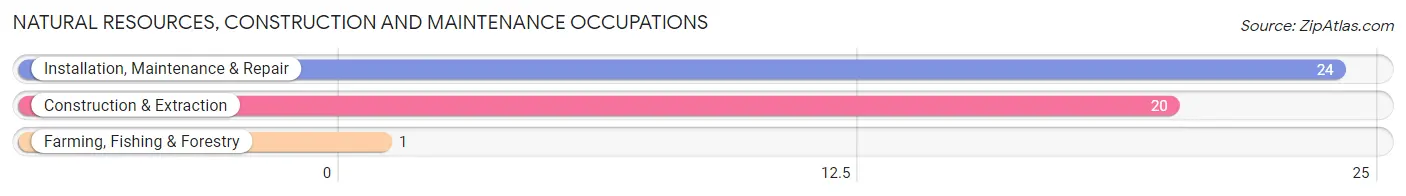
Natural Resources, Construction and Maintenance Occupations by Sex
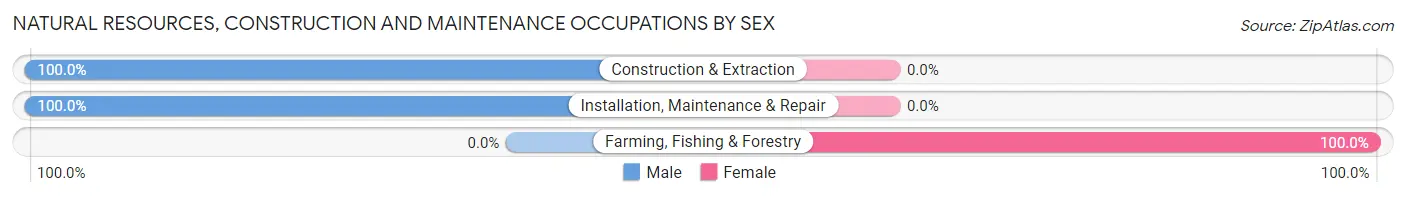
| Occupation | Male | Female |
| Farming, Fishing & Forestry | 0 (0.0%) | 1 (100.0%) |
| Construction & Extraction | 20 (100.0%) | 0 (0.0%) |
| Installation, Maintenance & Repair | 24 (100.0%) | 0 (0.0%) |
| Total (Category) | 44 (97.8%) | 1 (2.2%) |
| Total (Overall) | 145 (52.7%) | 130 (47.3%) |
Production, Transportation and Moving Occupations
The most common Production, Transportation and Moving occupations in Milner are Material Moving (19 | 6.9%), Transportation (3 | 1.1%), and Production (2 | 0.7%).
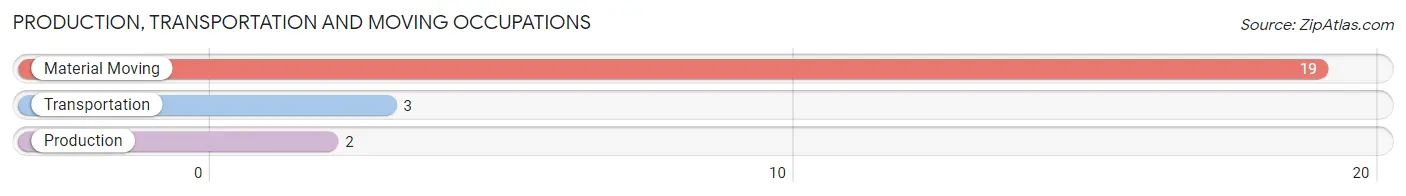
Production, Transportation and Moving Occupations by Sex
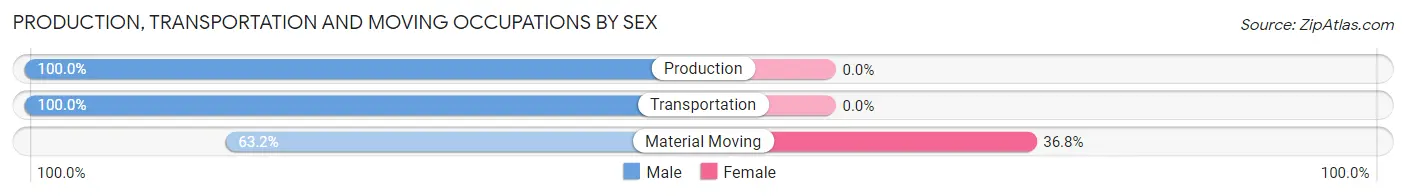
| Occupation | Male | Female |
| Production | 2 (100.0%) | 0 (0.0%) |
| Transportation | 3 (100.0%) | 0 (0.0%) |
| Material Moving | 12 (63.2%) | 7 (36.8%) |
| Total (Category) | 17 (70.8%) | 7 (29.2%) |
| Total (Overall) | 145 (52.7%) | 130 (47.3%) |
Employment Industries by Sex in Milner
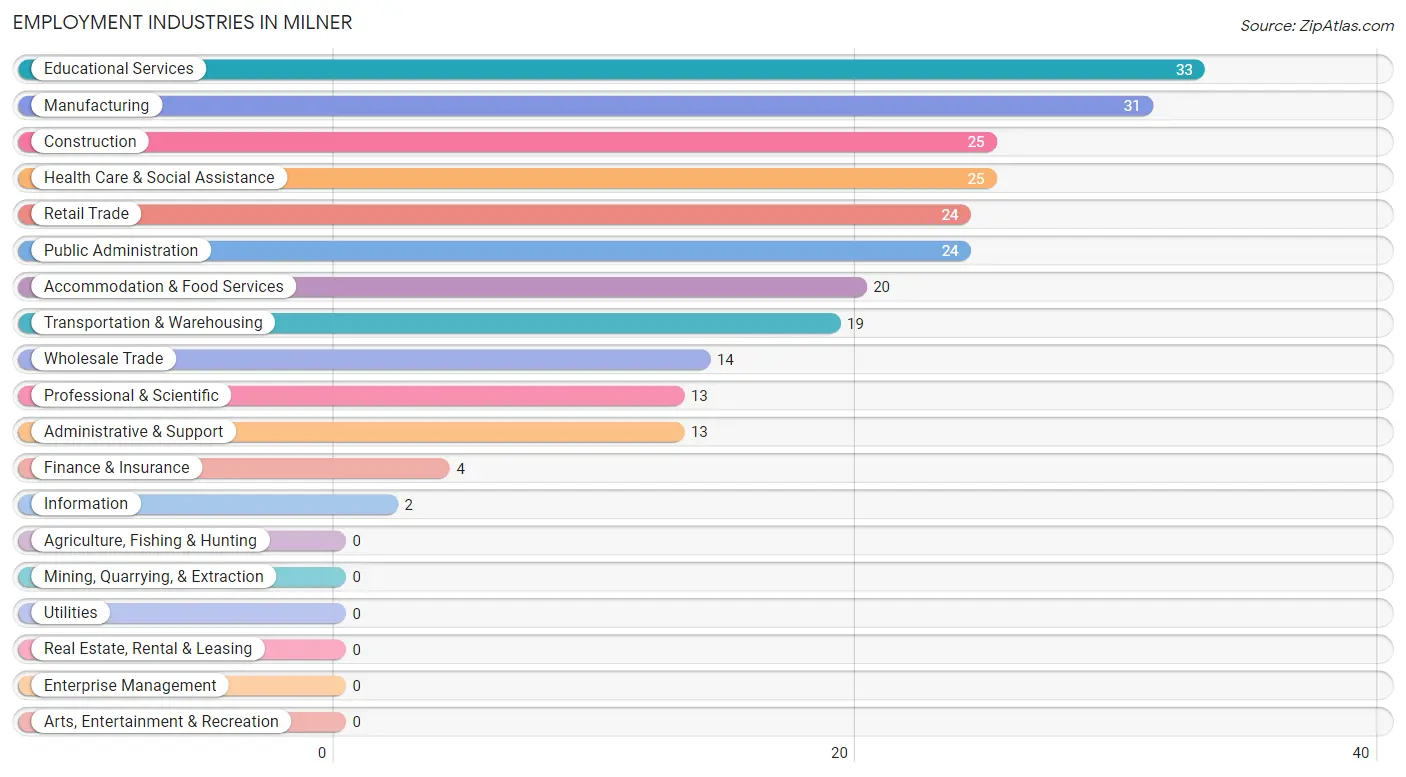
Employment Industries in Milner
The major employment industries in Milner include Educational Services (33 | 12.0%), Manufacturing (31 | 11.3%), Construction (25 | 9.1%), Health Care & Social Assistance (25 | 9.1%), and Retail Trade (24 | 8.7%).
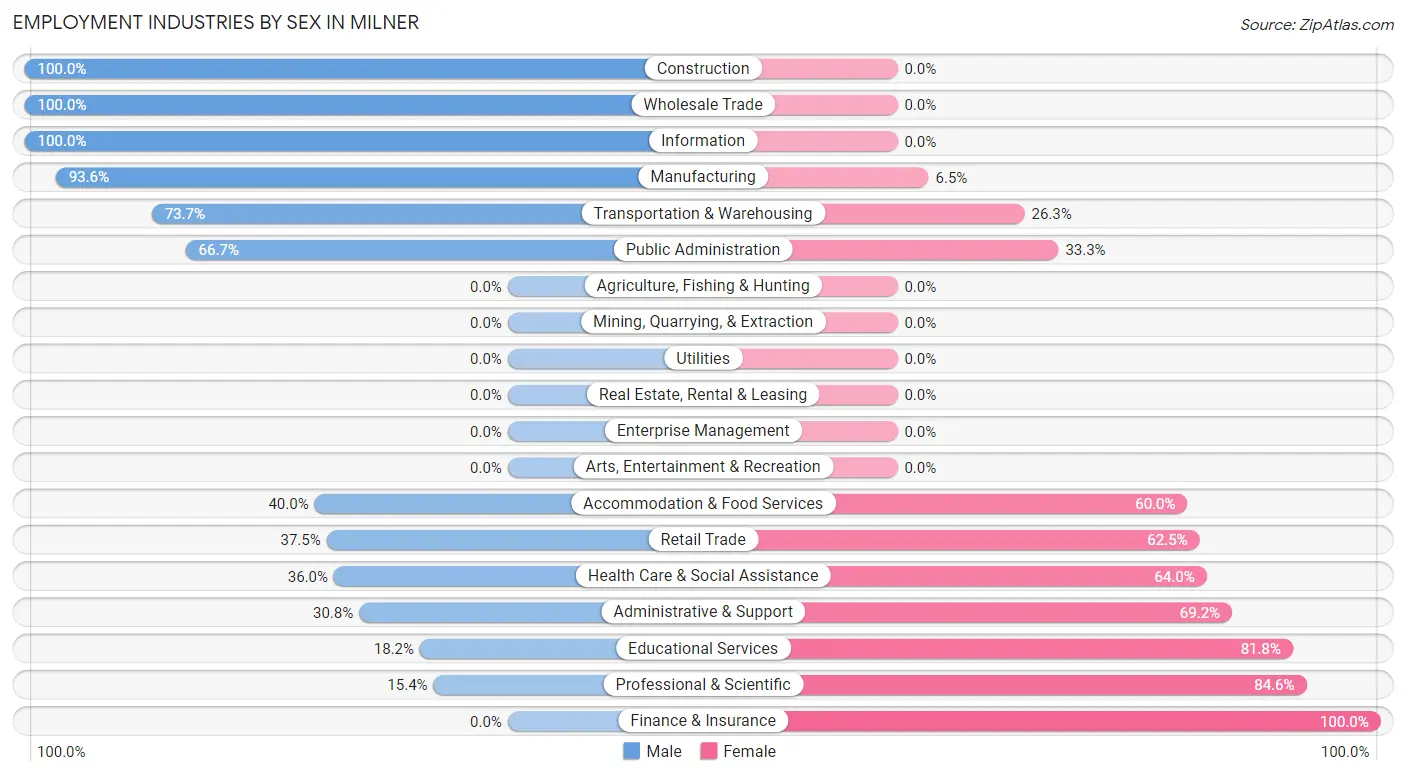
Employment Industries by Sex in Milner
The Milner industries that see more men than women are Construction (100.0%), Wholesale Trade (100.0%), and Information (100.0%), whereas the industries that tend to have a higher number of women are Finance & Insurance (100.0%), Professional & Scientific (84.6%), and Educational Services (81.8%).
| Industry | Male | Female |
| Agriculture, Fishing & Hunting | 0 (0.0%) | 0 (0.0%) |
| Mining, Quarrying, & Extraction | 0 (0.0%) | 0 (0.0%) |
| Construction | 25 (100.0%) | 0 (0.0%) |
| Manufacturing | 29 (93.5%) | 2 (6.5%) |
| Wholesale Trade | 14 (100.0%) | 0 (0.0%) |
| Retail Trade | 9 (37.5%) | 15 (62.5%) |
| Transportation & Warehousing | 14 (73.7%) | 5 (26.3%) |
| Utilities | 0 (0.0%) | 0 (0.0%) |
| Information | 2 (100.0%) | 0 (0.0%) |
| Finance & Insurance | 0 (0.0%) | 4 (100.0%) |
| Real Estate, Rental & Leasing | 0 (0.0%) | 0 (0.0%) |
| Professional & Scientific | 2 (15.4%) | 11 (84.6%) |
| Enterprise Management | 0 (0.0%) | 0 (0.0%) |
| Administrative & Support | 4 (30.8%) | 9 (69.2%) |
| Educational Services | 6 (18.2%) | 27 (81.8%) |
| Health Care & Social Assistance | 9 (36.0%) | 16 (64.0%) |
| Arts, Entertainment & Recreation | 0 (0.0%) | 0 (0.0%) |
| Accommodation & Food Services | 8 (40.0%) | 12 (60.0%) |
| Public Administration | 16 (66.7%) | 8 (33.3%) |
| Total | 145 (52.7%) | 130 (47.3%) |
Education in Milner
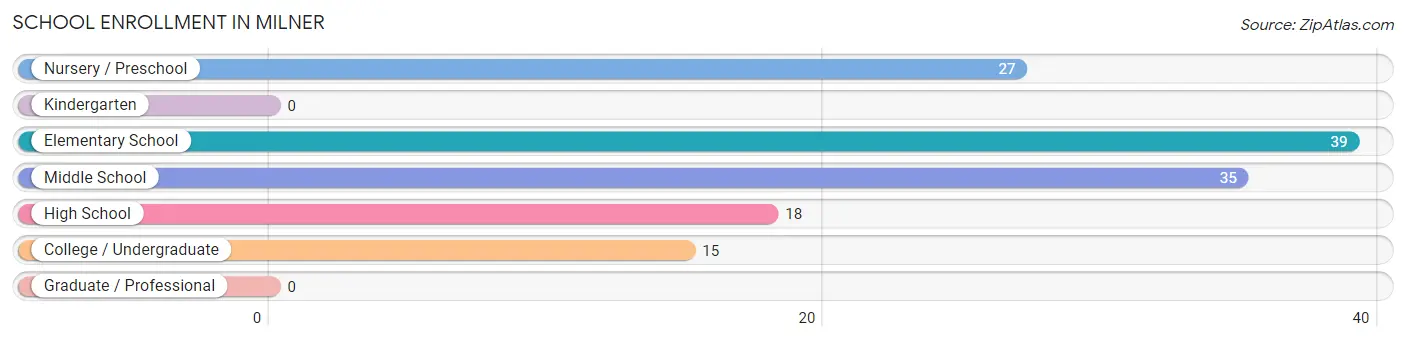
School Enrollment in Milner
The most common levels of schooling among the 134 students in Milner are elementary school (39 | 29.1%), middle school (35 | 26.1%), and nursery / preschool (27 | 20.2%).
| School Level | # Students | % Students |
| Nursery / Preschool | 27 | 20.2% |
| Kindergarten | 0 | 0.0% |
| Elementary School | 39 | 29.1% |
| Middle School | 35 | 26.1% |
| High School | 18 | 13.4% |
| College / Undergraduate | 15 | 11.2% |
| Graduate / Professional | 0 | 0.0% |
| Total | 134 | 100.0% |
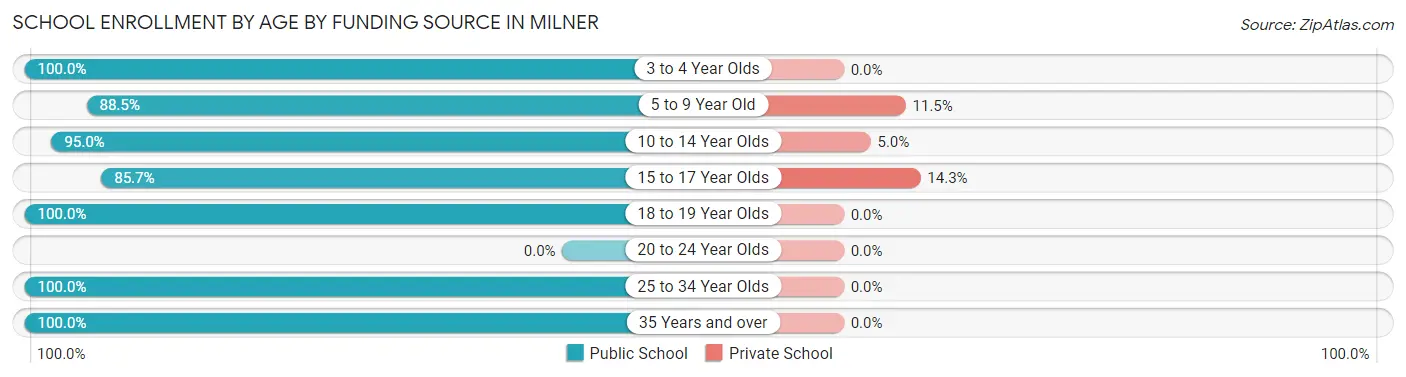
School Enrollment by Age by Funding Source in Milner
Out of a total of 134 students who are enrolled in schools in Milner, 11 (8.2%) attend a private institution, while the remaining 123 (91.8%) are enrolled in public schools. The age group of 15 to 17 year olds has the highest likelihood of being enrolled in private schools, with 3 (14.3% in the age bracket) enrolled. Conversely, the age group of 3 to 4 year olds has the lowest likelihood of being enrolled in a private school, with 6 (100.0% in the age bracket) attending a public institution.
| Age Bracket | Public School | Private School |
| 3 to 4 Year Olds | 6 (100.0%) | 0 (0.0%) |
| 5 to 9 Year Old | 46 (88.5%) | 6 (11.5%) |
| 10 to 14 Year Olds | 38 (95.0%) | 2 (5.0%) |
| 15 to 17 Year Olds | 18 (85.7%) | 3 (14.3%) |
| 18 to 19 Year Olds | 4 (100.0%) | 0 (0.0%) |
| 20 to 24 Year Olds | 0 (0.0%) | 0 (0.0%) |
| 25 to 34 Year Olds | 2 (100.0%) | 0 (0.0%) |
| 35 Years and over | 9 (100.0%) | 0 (0.0%) |
| Total | 123 (91.8%) | 11 (8.2%) |
Educational Attainment by Field of Study in Milner
Education (25 | 41.0%), business (15 | 24.6%), liberal arts & history (8 | 13.1%), science & technology (4 | 6.6%), and visual & performing arts (4 | 6.6%) are the most common fields of study among 61 individuals in Milner who have obtained a bachelor's degree or higher.
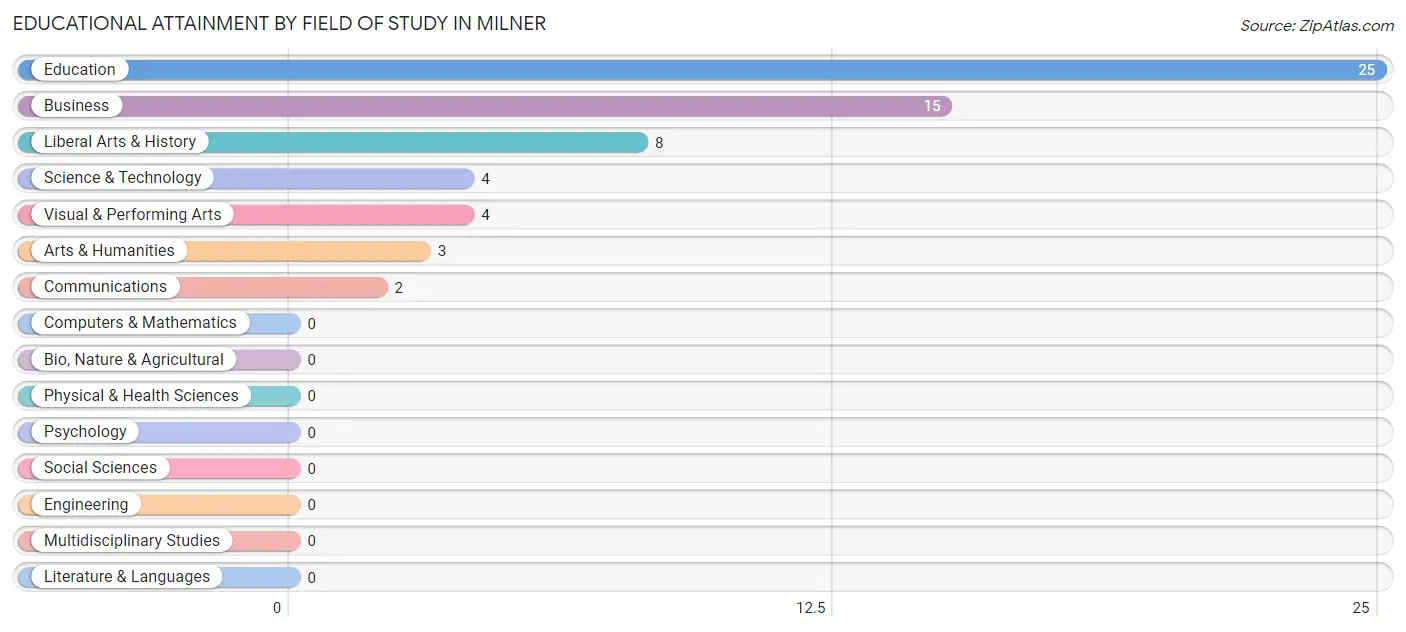
| Field of Study | # Graduates | % Graduates |
| Computers & Mathematics | 0 | 0.0% |
| Bio, Nature & Agricultural | 0 | 0.0% |
| Physical & Health Sciences | 0 | 0.0% |
| Psychology | 0 | 0.0% |
| Social Sciences | 0 | 0.0% |
| Engineering | 0 | 0.0% |
| Multidisciplinary Studies | 0 | 0.0% |
| Science & Technology | 4 | 6.6% |
| Business | 15 | 24.6% |
| Education | 25 | 41.0% |
| Literature & Languages | 0 | 0.0% |
| Liberal Arts & History | 8 | 13.1% |
| Visual & Performing Arts | 4 | 6.6% |
| Communications | 2 | 3.3% |
| Arts & Humanities | 3 | 4.9% |
| Total | 61 | 100.0% |
Transportation & Commute in Milner
Vehicle Availability by Sex in Milner
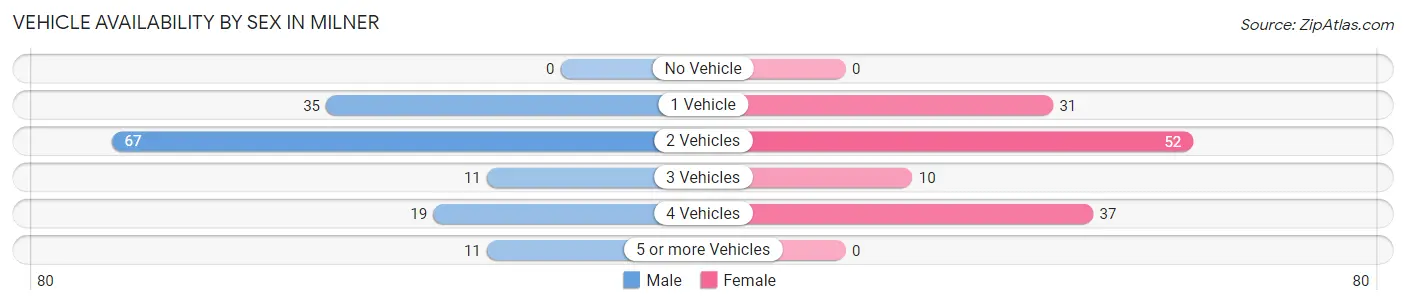
The most prevalent vehicle ownership categories in Milner are males with 2 vehicles (67, accounting for 46.9%) and females with 2 vehicles (52, making up 51.5%).
| Vehicles Available | Male | Female |
| No Vehicle | 0 (0.0%) | 0 (0.0%) |
| 1 Vehicle | 35 (24.5%) | 31 (23.8%) |
| 2 Vehicles | 67 (46.9%) | 52 (40.0%) |
| 3 Vehicles | 11 (7.7%) | 10 (7.7%) |
| 4 Vehicles | 19 (13.3%) | 37 (28.5%) |
| 5 or more Vehicles | 11 (7.7%) | 0 (0.0%) |
| Total | 143 (100.0%) | 130 (100.0%) |
Commute Time in Milner
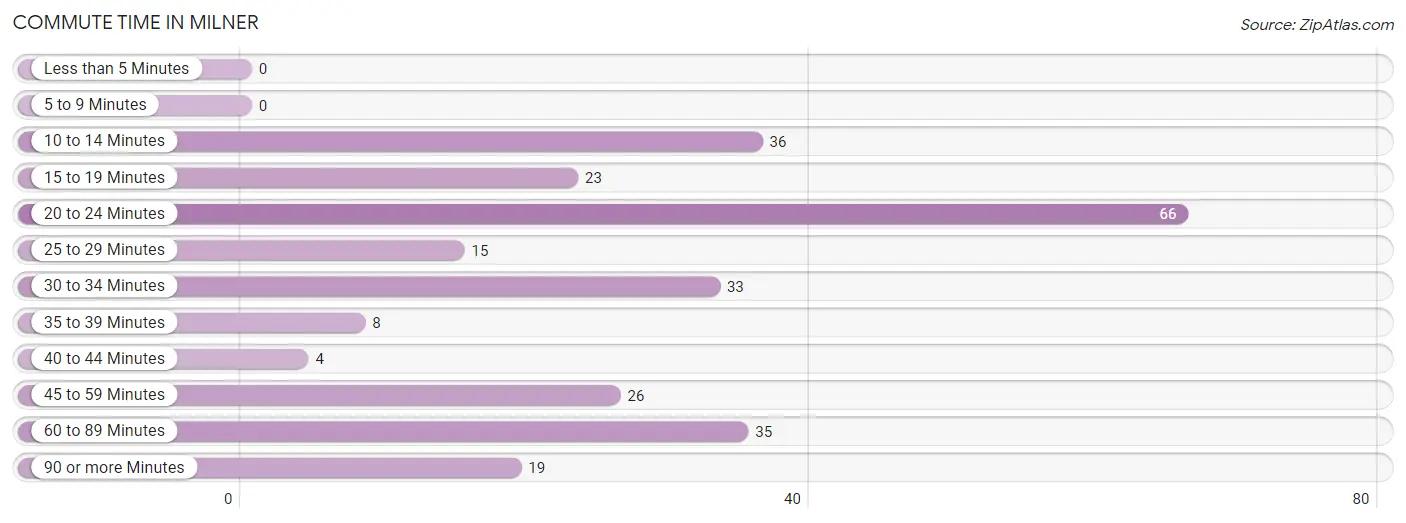
The most frequently occuring commute durations in Milner are 20 to 24 minutes (66 commuters, 24.9%), 10 to 14 minutes (36 commuters, 13.6%), and 60 to 89 minutes (35 commuters, 13.2%).
| Commute Time | # Commuters | % Commuters |
| Less than 5 Minutes | 0 | 0.0% |
| 5 to 9 Minutes | 0 | 0.0% |
| 10 to 14 Minutes | 36 | 13.6% |
| 15 to 19 Minutes | 23 | 8.7% |
| 20 to 24 Minutes | 66 | 24.9% |
| 25 to 29 Minutes | 15 | 5.7% |
| 30 to 34 Minutes | 33 | 12.4% |
| 35 to 39 Minutes | 8 | 3.0% |
| 40 to 44 Minutes | 4 | 1.5% |
| 45 to 59 Minutes | 26 | 9.8% |
| 60 to 89 Minutes | 35 | 13.2% |
| 90 or more Minutes | 19 | 7.2% |
Commute Time by Sex in Milner
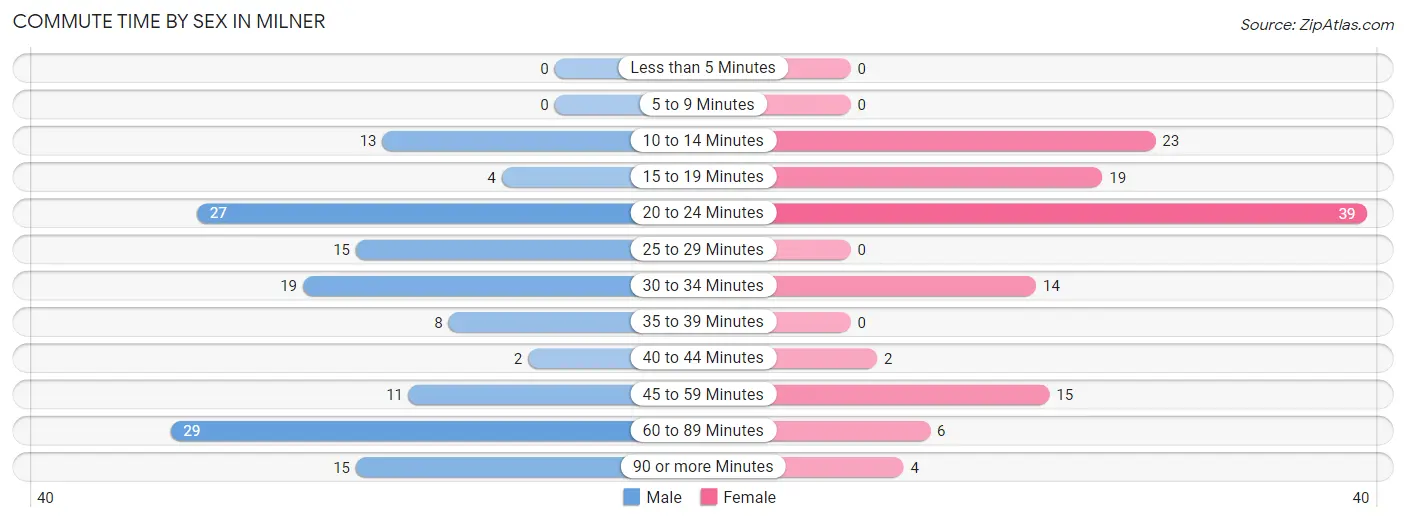
The most common commute times in Milner are 60 to 89 minutes (29 commuters, 20.3%) for males and 20 to 24 minutes (39 commuters, 32.0%) for females.
| Commute Time | Male | Female |
| Less than 5 Minutes | 0 (0.0%) | 0 (0.0%) |
| 5 to 9 Minutes | 0 (0.0%) | 0 (0.0%) |
| 10 to 14 Minutes | 13 (9.1%) | 23 (18.9%) |
| 15 to 19 Minutes | 4 (2.8%) | 19 (15.6%) |
| 20 to 24 Minutes | 27 (18.9%) | 39 (32.0%) |
| 25 to 29 Minutes | 15 (10.5%) | 0 (0.0%) |
| 30 to 34 Minutes | 19 (13.3%) | 14 (11.5%) |
| 35 to 39 Minutes | 8 (5.6%) | 0 (0.0%) |
| 40 to 44 Minutes | 2 (1.4%) | 2 (1.6%) |
| 45 to 59 Minutes | 11 (7.7%) | 15 (12.3%) |
| 60 to 89 Minutes | 29 (20.3%) | 6 (4.9%) |
| 90 or more Minutes | 15 (10.5%) | 4 (3.3%) |
Time of Departure to Work by Sex in Milner
The most frequent times of departure to work in Milner are 5:00 AM to 5:29 AM (29, 20.3%) for males and 6:30 AM to 6:59 AM (38, 31.1%) for females.
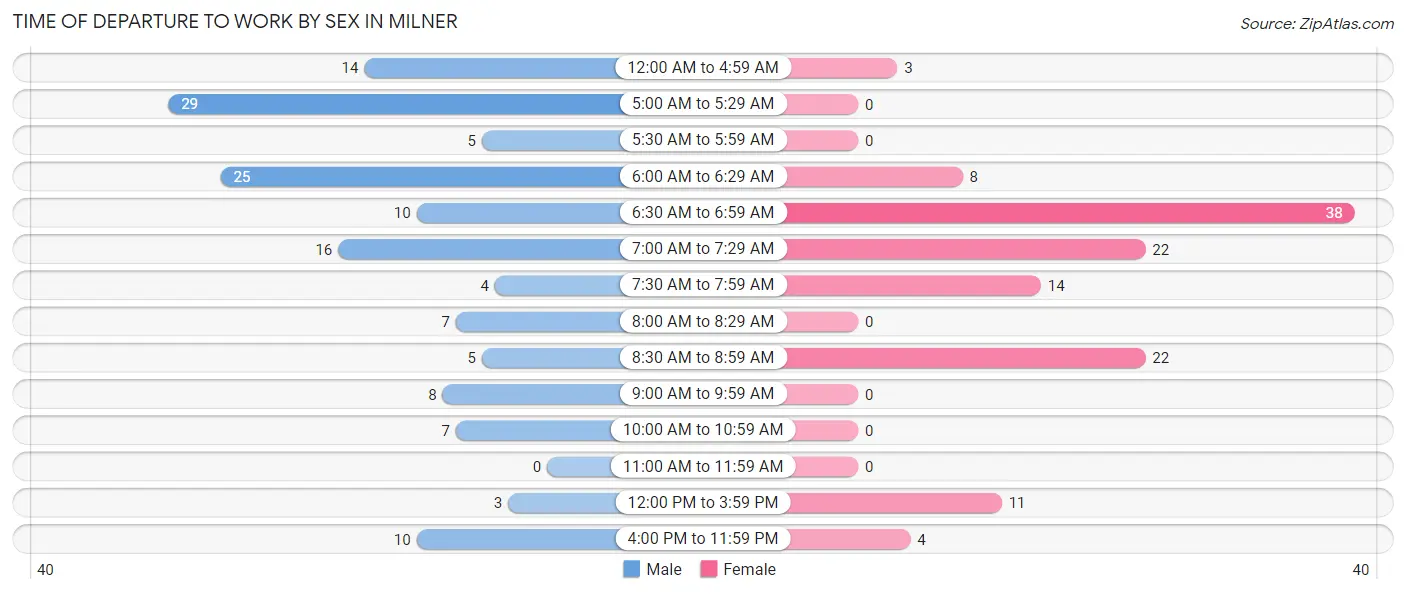
| Time of Departure | Male | Female |
| 12:00 AM to 4:59 AM | 14 (9.8%) | 3 (2.5%) |
| 5:00 AM to 5:29 AM | 29 (20.3%) | 0 (0.0%) |
| 5:30 AM to 5:59 AM | 5 (3.5%) | 0 (0.0%) |
| 6:00 AM to 6:29 AM | 25 (17.5%) | 8 (6.6%) |
| 6:30 AM to 6:59 AM | 10 (7.0%) | 38 (31.1%) |
| 7:00 AM to 7:29 AM | 16 (11.2%) | 22 (18.0%) |
| 7:30 AM to 7:59 AM | 4 (2.8%) | 14 (11.5%) |
| 8:00 AM to 8:29 AM | 7 (4.9%) | 0 (0.0%) |
| 8:30 AM to 8:59 AM | 5 (3.5%) | 22 (18.0%) |
| 9:00 AM to 9:59 AM | 8 (5.6%) | 0 (0.0%) |
| 10:00 AM to 10:59 AM | 7 (4.9%) | 0 (0.0%) |
| 11:00 AM to 11:59 AM | 0 (0.0%) | 0 (0.0%) |
| 12:00 PM to 3:59 PM | 3 (2.1%) | 11 (9.0%) |
| 4:00 PM to 11:59 PM | 10 (7.0%) | 4 (3.3%) |
| Total | 143 (100.0%) | 122 (100.0%) |
Housing Occupancy in Milner
Occupancy by Ownership in Milner
Of the total 262 dwellings in Milner, owner-occupied units account for 178 (67.9%), while renter-occupied units make up 84 (32.1%).
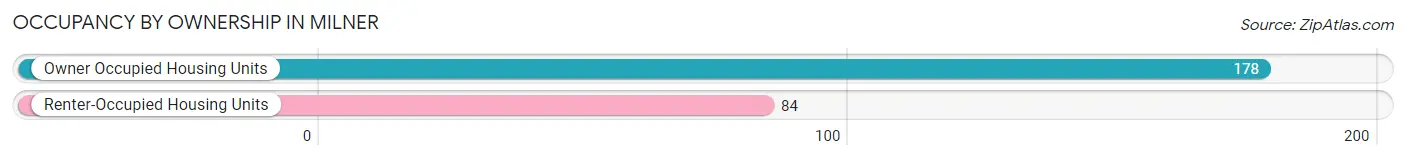
| Occupancy | # Housing Units | % Housing Units |
| Owner Occupied Housing Units | 178 | 67.9% |
| Renter-Occupied Housing Units | 84 | 32.1% |
| Total Occupied Housing Units | 262 | 100.0% |
Occupancy by Household Size in Milner
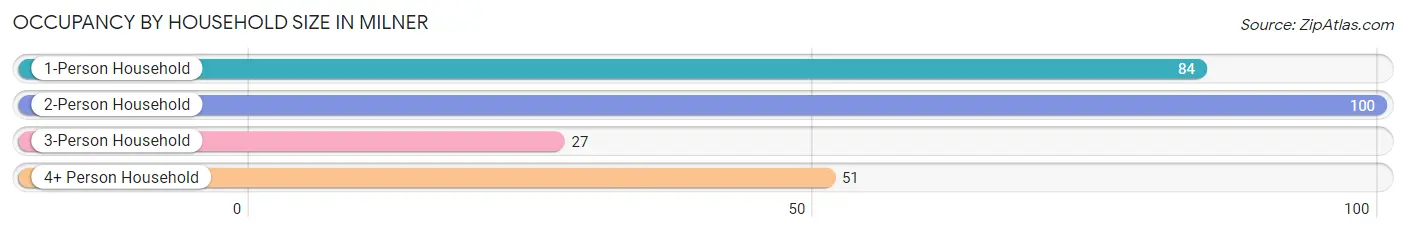
| Household Size | # Housing Units | % Housing Units |
| 1-Person Household | 84 | 32.1% |
| 2-Person Household | 100 | 38.2% |
| 3-Person Household | 27 | 10.3% |
| 4+ Person Household | 51 | 19.5% |
| Total Housing Units | 262 | 100.0% |
Occupancy by Ownership by Household Size in Milner
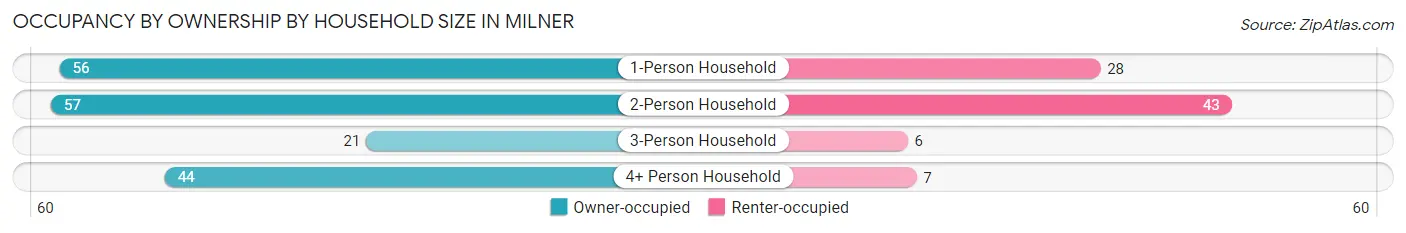
| Household Size | Owner-occupied | Renter-occupied |
| 1-Person Household | 56 (66.7%) | 28 (33.3%) |
| 2-Person Household | 57 (57.0%) | 43 (43.0%) |
| 3-Person Household | 21 (77.8%) | 6 (22.2%) |
| 4+ Person Household | 44 (86.3%) | 7 (13.7%) |
| Total Housing Units | 178 (67.9%) | 84 (32.1%) |
Occupancy by Educational Attainment in Milner
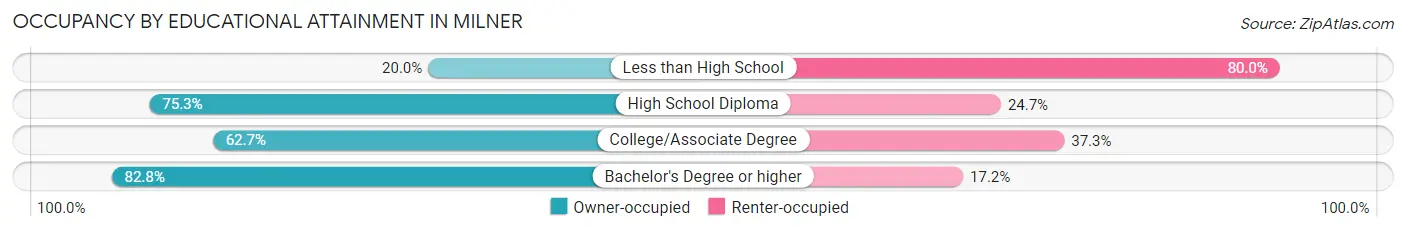
| Household Size | Owner-occupied | Renter-occupied |
| Less than High School | 2 (20.0%) | 8 (80.0%) |
| High School Diploma | 73 (75.3%) | 24 (24.7%) |
| College/Associate Degree | 79 (62.7%) | 47 (37.3%) |
| Bachelor's Degree or higher | 24 (82.8%) | 5 (17.2%) |
Occupancy by Age of Householder in Milner
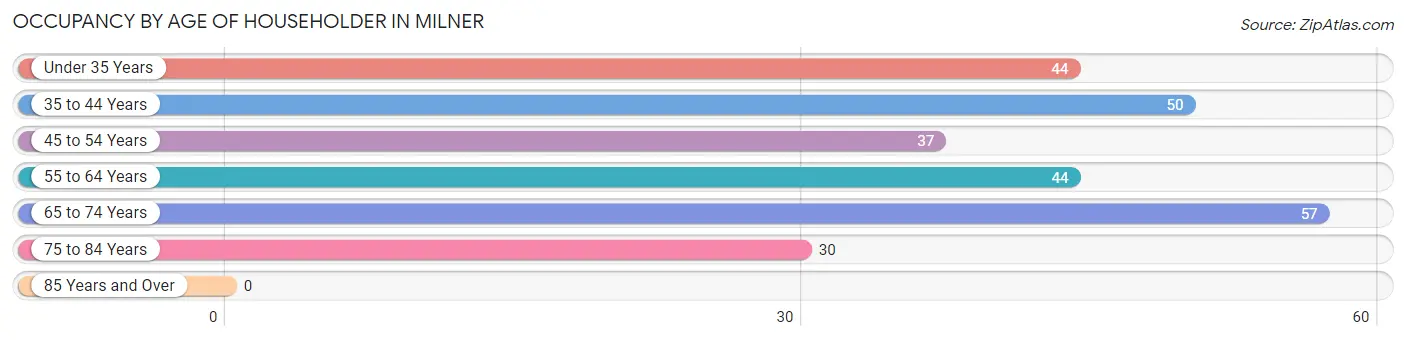
| Age Bracket | # Households | % Households |
| Under 35 Years | 44 | 16.8% |
| 35 to 44 Years | 50 | 19.1% |
| 45 to 54 Years | 37 | 14.1% |
| 55 to 64 Years | 44 | 16.8% |
| 65 to 74 Years | 57 | 21.8% |
| 75 to 84 Years | 30 | 11.5% |
| 85 Years and Over | 0 | 0.0% |
| Total | 262 | 100.0% |
Housing Finances in Milner
Median Income by Occupancy in Milner
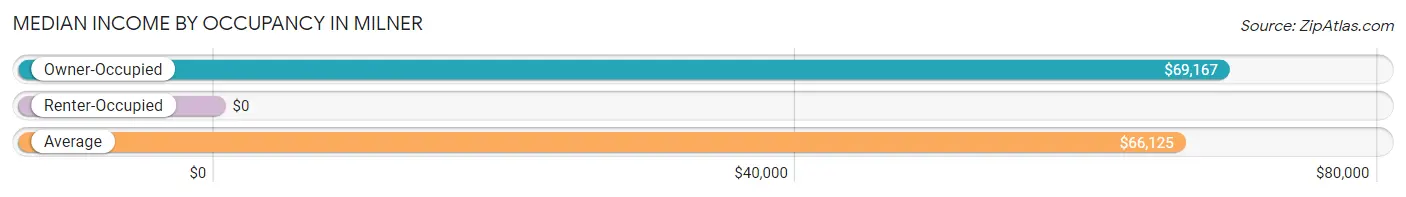
| Occupancy Type | # Households | Median Income |
| Owner-Occupied | 178 (67.9%) | $69,167 |
| Renter-Occupied | 84 (32.1%) | $0 |
| Average | 262 (100.0%) | $66,125 |
Occupancy by Householder Income Bracket in Milner
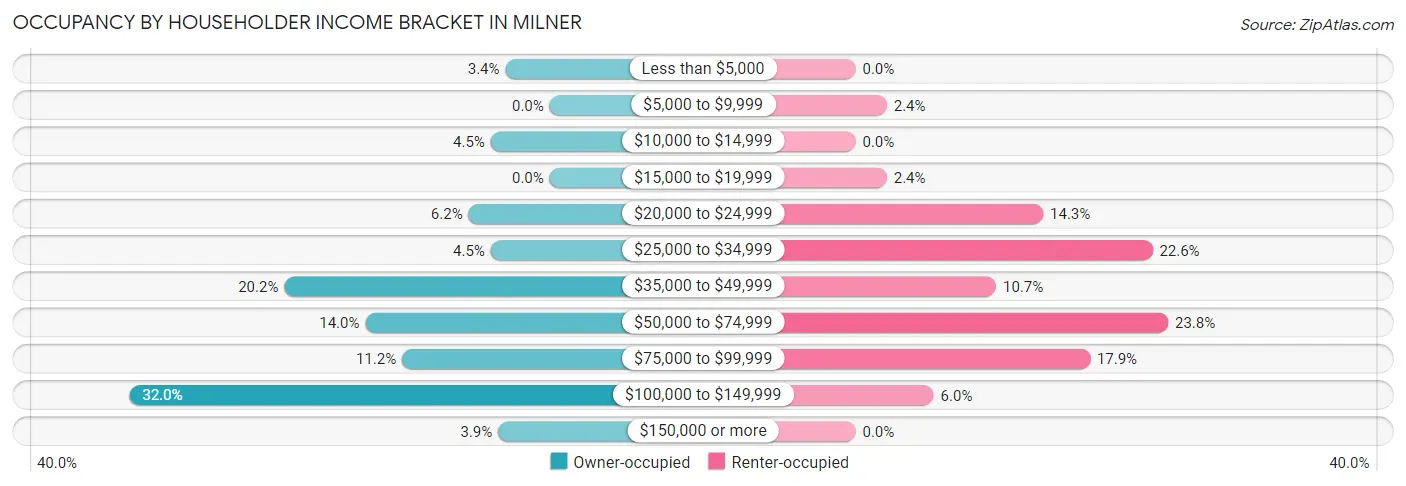
| Income Bracket | Owner-occupied | Renter-occupied |
| Less than $5,000 | 6 (3.4%) | 0 (0.0%) |
| $5,000 to $9,999 | 0 (0.0%) | 2 (2.4%) |
| $10,000 to $14,999 | 8 (4.5%) | 0 (0.0%) |
| $15,000 to $19,999 | 0 (0.0%) | 2 (2.4%) |
| $20,000 to $24,999 | 11 (6.2%) | 12 (14.3%) |
| $25,000 to $34,999 | 8 (4.5%) | 19 (22.6%) |
| $35,000 to $49,999 | 36 (20.2%) | 9 (10.7%) |
| $50,000 to $74,999 | 25 (14.0%) | 20 (23.8%) |
| $75,000 to $99,999 | 20 (11.2%) | 15 (17.9%) |
| $100,000 to $149,999 | 57 (32.0%) | 5 (5.9%) |
| $150,000 or more | 7 (3.9%) | 0 (0.0%) |
| Total | 178 (100.0%) | 84 (100.0%) |
Monthly Housing Cost Tiers in Milner
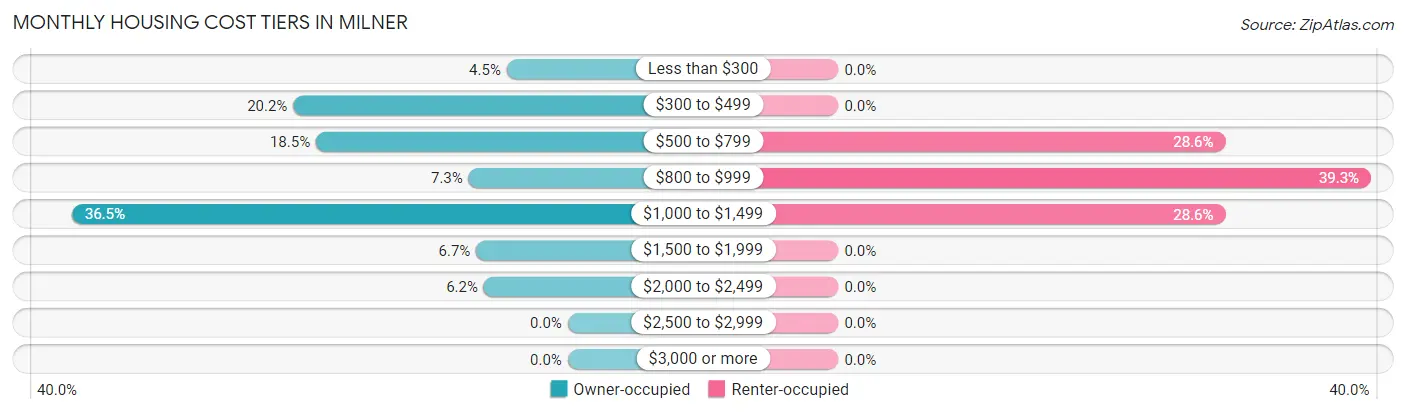
| Monthly Cost | Owner-occupied | Renter-occupied |
| Less than $300 | 8 (4.5%) | 0 (0.0%) |
| $300 to $499 | 36 (20.2%) | 0 (0.0%) |
| $500 to $799 | 33 (18.5%) | 24 (28.6%) |
| $800 to $999 | 13 (7.3%) | 33 (39.3%) |
| $1,000 to $1,499 | 65 (36.5%) | 24 (28.6%) |
| $1,500 to $1,999 | 12 (6.7%) | 0 (0.0%) |
| $2,000 to $2,499 | 11 (6.2%) | 0 (0.0%) |
| $2,500 to $2,999 | 0 (0.0%) | 0 (0.0%) |
| $3,000 or more | 0 (0.0%) | 0 (0.0%) |
| Total | 178 (100.0%) | 84 (100.0%) |
Physical Housing Characteristics in Milner
Housing Structures in Milner
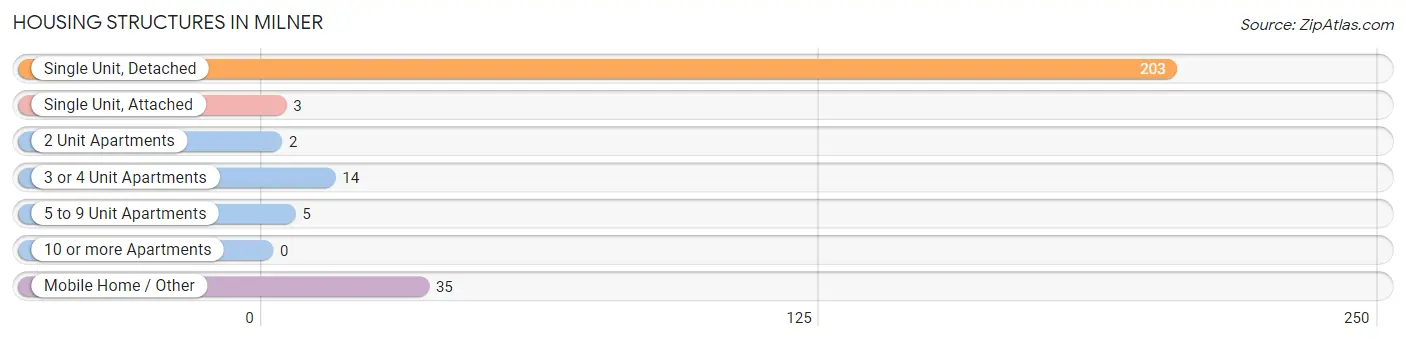
| Structure Type | # Housing Units | % Housing Units |
| Single Unit, Detached | 203 | 77.5% |
| Single Unit, Attached | 3 | 1.1% |
| 2 Unit Apartments | 2 | 0.8% |
| 3 or 4 Unit Apartments | 14 | 5.3% |
| 5 to 9 Unit Apartments | 5 | 1.9% |
| 10 or more Apartments | 0 | 0.0% |
| Mobile Home / Other | 35 | 13.4% |
| Total | 262 | 100.0% |
Housing Structures by Occupancy in Milner
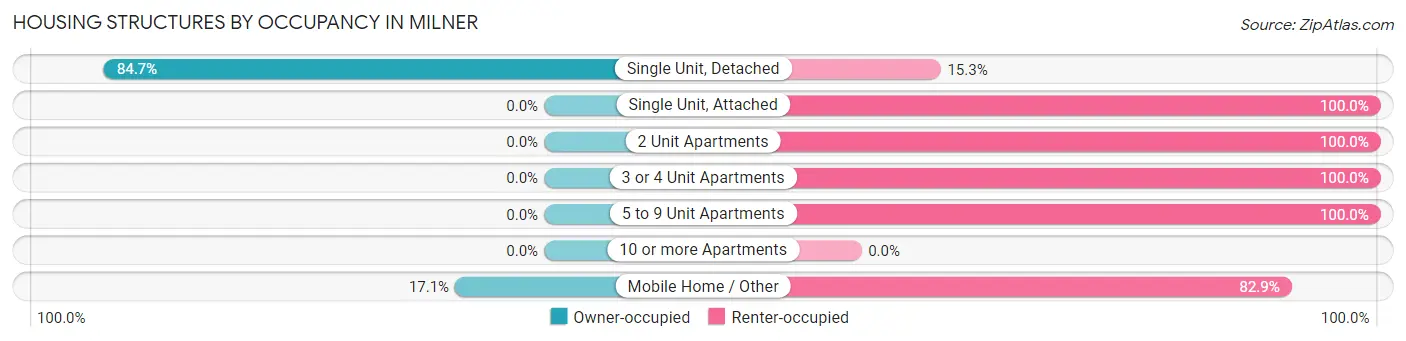
| Structure Type | Owner-occupied | Renter-occupied |
| Single Unit, Detached | 172 (84.7%) | 31 (15.3%) |
| Single Unit, Attached | 0 (0.0%) | 3 (100.0%) |
| 2 Unit Apartments | 0 (0.0%) | 2 (100.0%) |
| 3 or 4 Unit Apartments | 0 (0.0%) | 14 (100.0%) |
| 5 to 9 Unit Apartments | 0 (0.0%) | 5 (100.0%) |
| 10 or more Apartments | 0 (0.0%) | 0 (0.0%) |
| Mobile Home / Other | 6 (17.1%) | 29 (82.9%) |
| Total | 178 (67.9%) | 84 (32.1%) |
Housing Structures by Number of Rooms in Milner
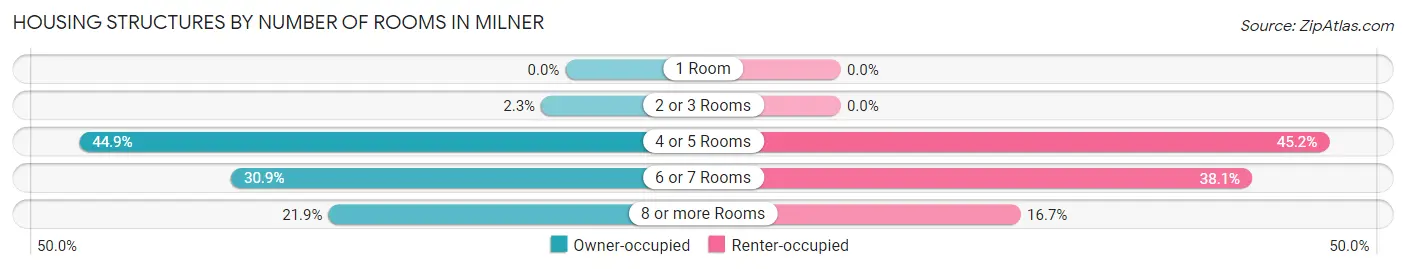
| Number of Rooms | Owner-occupied | Renter-occupied |
| 1 Room | 0 (0.0%) | 0 (0.0%) |
| 2 or 3 Rooms | 4 (2.2%) | 0 (0.0%) |
| 4 or 5 Rooms | 80 (44.9%) | 38 (45.2%) |
| 6 or 7 Rooms | 55 (30.9%) | 32 (38.1%) |
| 8 or more Rooms | 39 (21.9%) | 14 (16.7%) |
| Total | 178 (100.0%) | 84 (100.0%) |
Housing Structure by Heating Type in Milner
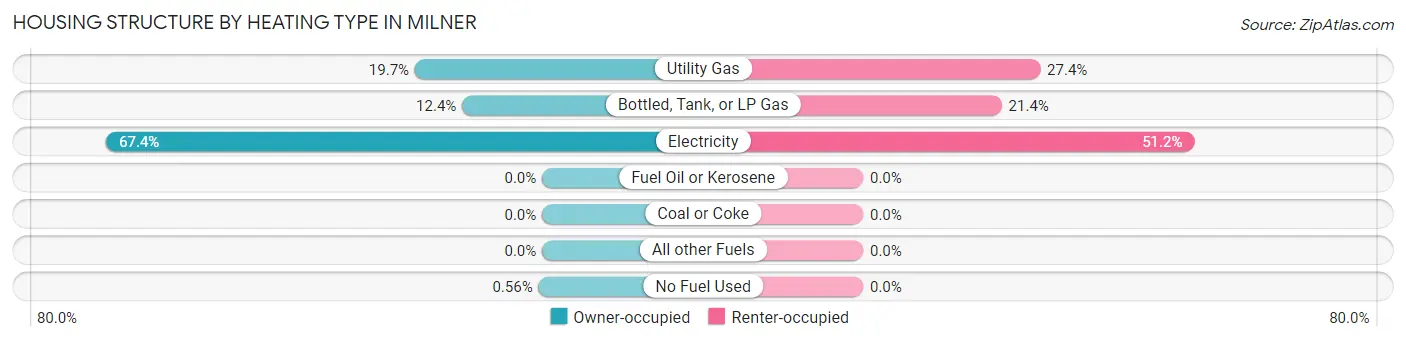
| Heating Type | Owner-occupied | Renter-occupied |
| Utility Gas | 35 (19.7%) | 23 (27.4%) |
| Bottled, Tank, or LP Gas | 22 (12.4%) | 18 (21.4%) |
| Electricity | 120 (67.4%) | 43 (51.2%) |
| Fuel Oil or Kerosene | 0 (0.0%) | 0 (0.0%) |
| Coal or Coke | 0 (0.0%) | 0 (0.0%) |
| All other Fuels | 0 (0.0%) | 0 (0.0%) |
| No Fuel Used | 1 (0.6%) | 0 (0.0%) |
| Total | 178 (100.0%) | 84 (100.0%) |
Household Vehicle Usage in Milner
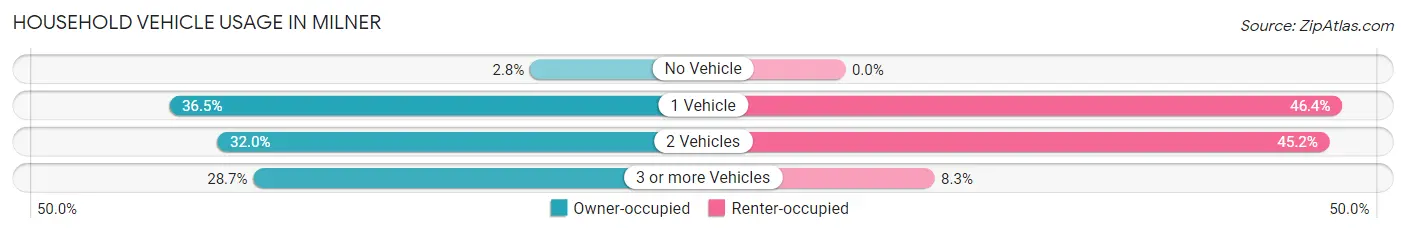
| Vehicles per Household | Owner-occupied | Renter-occupied |
| No Vehicle | 5 (2.8%) | 0 (0.0%) |
| 1 Vehicle | 65 (36.5%) | 39 (46.4%) |
| 2 Vehicles | 57 (32.0%) | 38 (45.2%) |
| 3 or more Vehicles | 51 (28.6%) | 7 (8.3%) |
| Total | 178 (100.0%) | 84 (100.0%) |
Real Estate & Mortgages in Milner
Real Estate and Mortgage Overview in Milner
| Characteristic | Without Mortgage | With Mortgage |
| Housing Units | 62 | 116 |
| Median Property Value | $100,000 | $195,000 |
| Median Household Income | $38,929 | $7 |
| Monthly Housing Costs | $410 | $0 |
| Real Estate Taxes | $1,386 | $8 |
Property Value by Mortgage Status in Milner
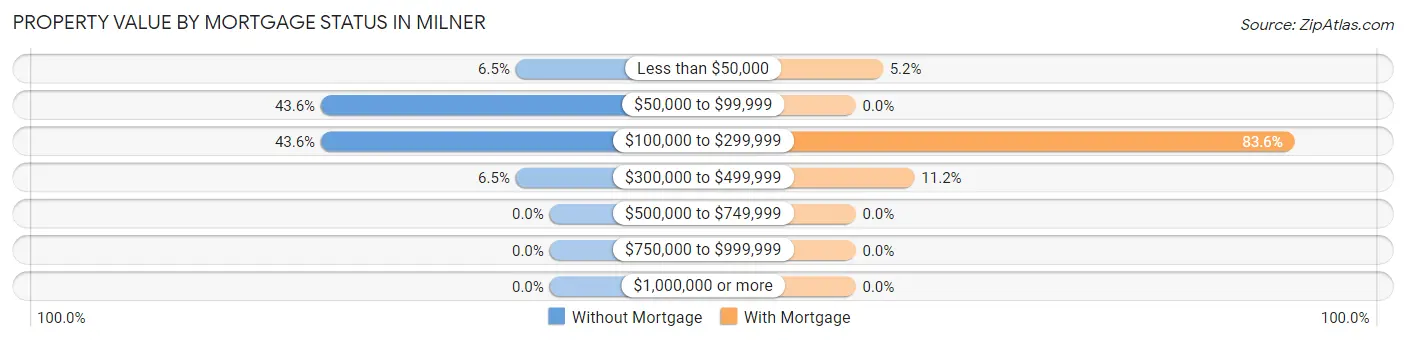
| Property Value | Without Mortgage | With Mortgage |
| Less than $50,000 | 4 (6.5%) | 6 (5.2%) |
| $50,000 to $99,999 | 27 (43.5%) | 0 (0.0%) |
| $100,000 to $299,999 | 27 (43.5%) | 97 (83.6%) |
| $300,000 to $499,999 | 4 (6.5%) | 13 (11.2%) |
| $500,000 to $749,999 | 0 (0.0%) | 0 (0.0%) |
| $750,000 to $999,999 | 0 (0.0%) | 0 (0.0%) |
| $1,000,000 or more | 0 (0.0%) | 0 (0.0%) |
| Total | 62 (100.0%) | 116 (100.0%) |
Household Income by Mortgage Status in Milner
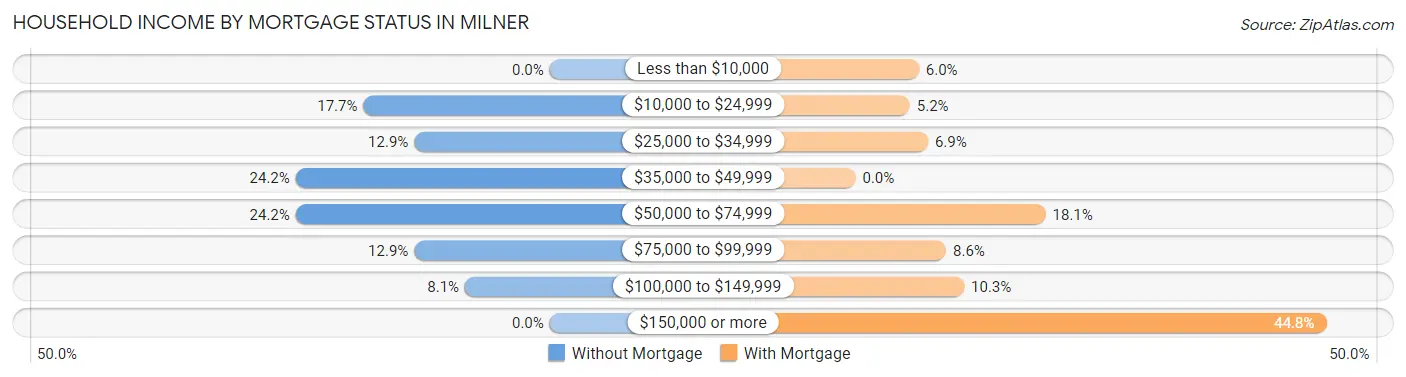
| Household Income | Without Mortgage | With Mortgage |
| Less than $10,000 | 0 (0.0%) | 7 (6.0%) |
| $10,000 to $24,999 | 11 (17.7%) | 6 (5.2%) |
| $25,000 to $34,999 | 8 (12.9%) | 8 (6.9%) |
| $35,000 to $49,999 | 15 (24.2%) | 0 (0.0%) |
| $50,000 to $74,999 | 15 (24.2%) | 21 (18.1%) |
| $75,000 to $99,999 | 8 (12.9%) | 10 (8.6%) |
| $100,000 to $149,999 | 5 (8.1%) | 12 (10.3%) |
| $150,000 or more | 0 (0.0%) | 52 (44.8%) |
| Total | 62 (100.0%) | 116 (100.0%) |
Property Value to Household Income Ratio in Milner
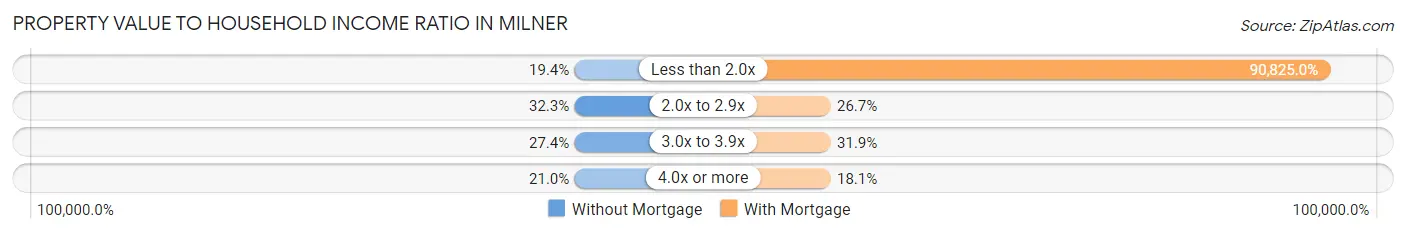
| Value-to-Income Ratio | Without Mortgage | With Mortgage |
| Less than 2.0x | 12 (19.4%) | 105,357 (90,825.0%) |
| 2.0x to 2.9x | 20 (32.3%) | 31 (26.7%) |
| 3.0x to 3.9x | 17 (27.4%) | 37 (31.9%) |
| 4.0x or more | 13 (21.0%) | 21 (18.1%) |
| Total | 62 (100.0%) | 116 (100.0%) |
Real Estate Taxes by Mortgage Status in Milner
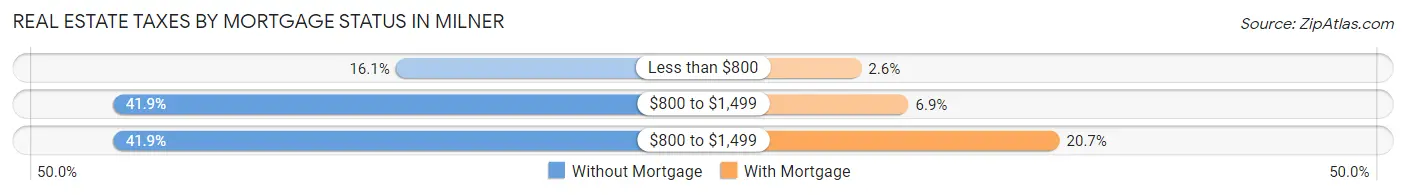
| Property Taxes | Without Mortgage | With Mortgage |
| Less than $800 | 10 (16.1%) | 3 (2.6%) |
| $800 to $1,499 | 26 (41.9%) | 8 (6.9%) |
| $800 to $1,499 | 26 (41.9%) | 24 (20.7%) |
| Total | 62 (100.0%) | 116 (100.0%) |
Health & Disability in Milner
Health Insurance Coverage by Age in Milner
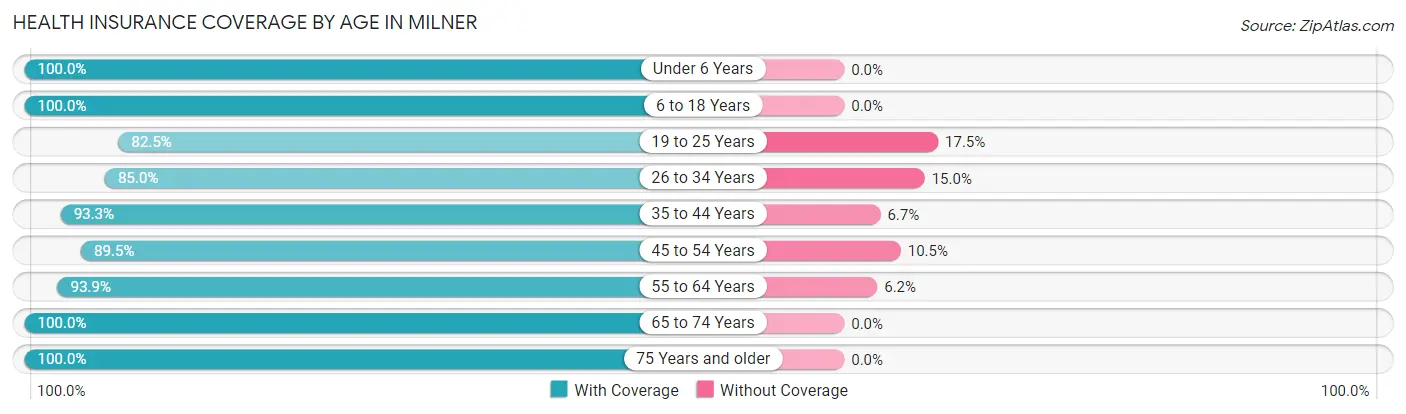
| Age Bracket | With Coverage | Without Coverage |
| Under 6 Years | 65 (100.0%) | 0 (0.0%) |
| 6 to 18 Years | 95 (100.0%) | 0 (0.0%) |
| 19 to 25 Years | 33 (82.5%) | 7 (17.5%) |
| 26 to 34 Years | 34 (85.0%) | 6 (15.0%) |
| 35 to 44 Years | 83 (93.3%) | 6 (6.7%) |
| 45 to 54 Years | 68 (89.5%) | 8 (10.5%) |
| 55 to 64 Years | 61 (93.9%) | 4 (6.1%) |
| 65 to 74 Years | 80 (100.0%) | 0 (0.0%) |
| 75 Years and older | 66 (100.0%) | 0 (0.0%) |
| Total | 585 (95.0%) | 31 (5.0%) |
Health Insurance Coverage by Citizenship Status in Milner
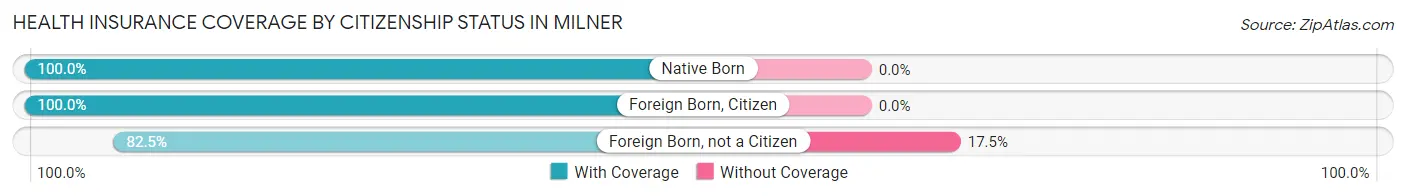
| Citizenship Status | With Coverage | Without Coverage |
| Native Born | 65 (100.0%) | 0 (0.0%) |
| Foreign Born, Citizen | 95 (100.0%) | 0 (0.0%) |
| Foreign Born, not a Citizen | 33 (82.5%) | 7 (17.5%) |
Health Insurance Coverage by Household Income in Milner
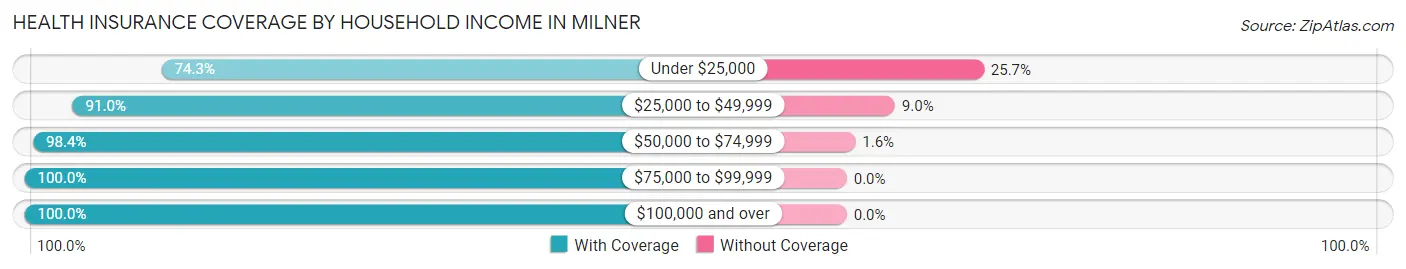
| Household Income | With Coverage | Without Coverage |
| Under $25,000 | 55 (74.3%) | 19 (25.7%) |
| $25,000 to $49,999 | 101 (91.0%) | 10 (9.0%) |
| $50,000 to $74,999 | 122 (98.4%) | 2 (1.6%) |
| $75,000 to $99,999 | 95 (100.0%) | 0 (0.0%) |
| $100,000 and over | 212 (100.0%) | 0 (0.0%) |
Public vs Private Health Insurance Coverage by Age in Milner
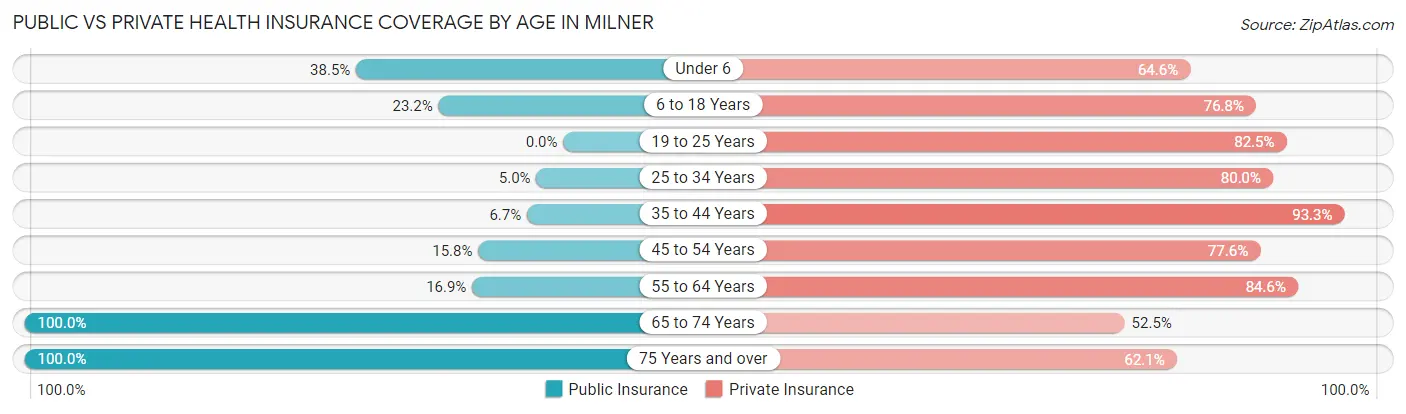
| Age Bracket | Public Insurance | Private Insurance |
| Under 6 | 25 (38.5%) | 42 (64.6%) |
| 6 to 18 Years | 22 (23.2%) | 73 (76.8%) |
| 19 to 25 Years | 0 (0.0%) | 33 (82.5%) |
| 25 to 34 Years | 2 (5.0%) | 32 (80.0%) |
| 35 to 44 Years | 6 (6.7%) | 83 (93.3%) |
| 45 to 54 Years | 12 (15.8%) | 59 (77.6%) |
| 55 to 64 Years | 11 (16.9%) | 55 (84.6%) |
| 65 to 74 Years | 80 (100.0%) | 42 (52.5%) |
| 75 Years and over | 66 (100.0%) | 41 (62.1%) |
| Total | 224 (36.4%) | 460 (74.7%) |
Disability Status by Sex by Age in Milner
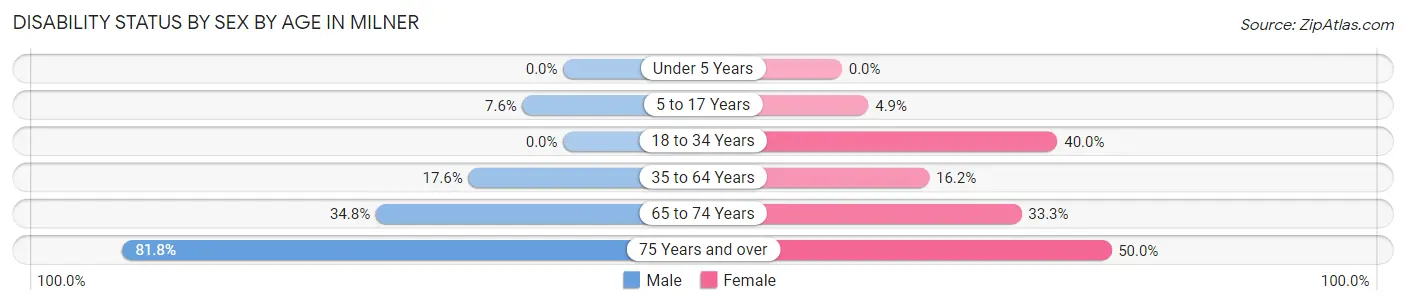
| Age Bracket | Male | Female |
| Under 5 Years | 0 (0.0%) | 0 (0.0%) |
| 5 to 17 Years | 4 (7.5%) | 3 (4.9%) |
| 18 to 34 Years | 0 (0.0%) | 18 (40.0%) |
| 35 to 64 Years | 22 (17.6%) | 17 (16.2%) |
| 65 to 74 Years | 8 (34.8%) | 19 (33.3%) |
| 75 Years and over | 36 (81.8%) | 11 (50.0%) |
Disability Class by Sex by Age in Milner
Disability Class: Hearing Difficulty
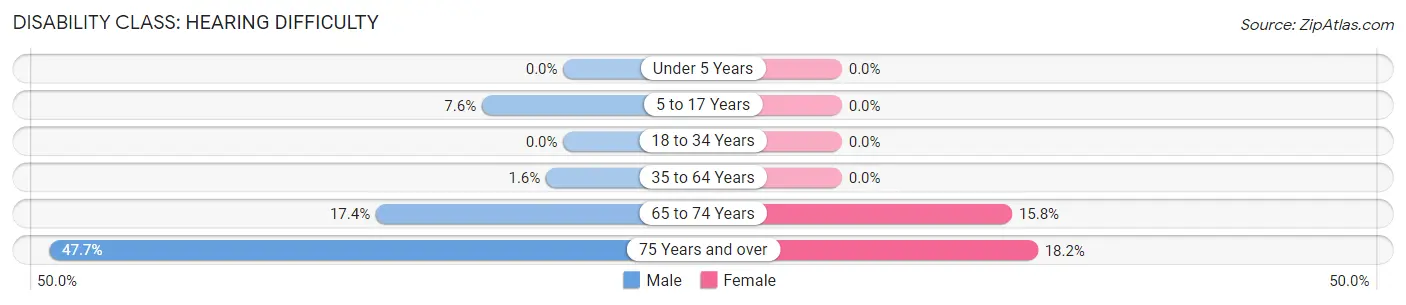
| Age Bracket | Male | Female |
| Under 5 Years | 0 (0.0%) | 0 (0.0%) |
| 5 to 17 Years | 4 (7.5%) | 0 (0.0%) |
| 18 to 34 Years | 0 (0.0%) | 0 (0.0%) |
| 35 to 64 Years | 2 (1.6%) | 0 (0.0%) |
| 65 to 74 Years | 4 (17.4%) | 9 (15.8%) |
| 75 Years and over | 21 (47.7%) | 4 (18.2%) |
Disability Class: Vision Difficulty
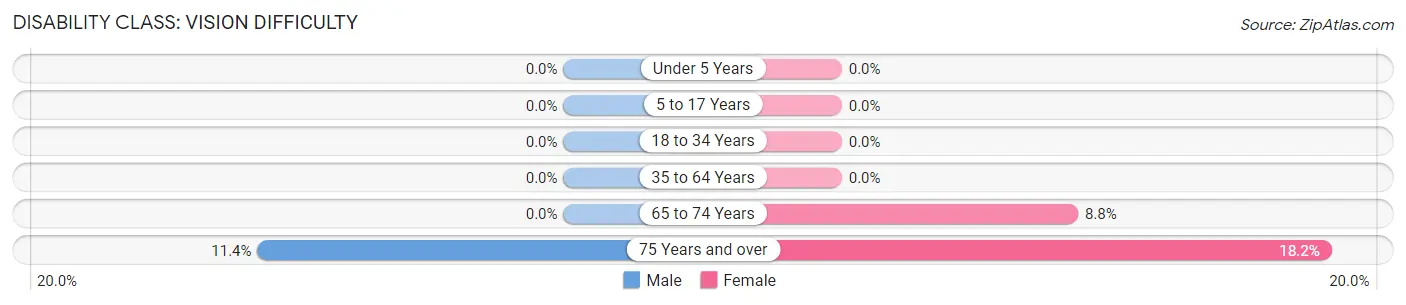
| Age Bracket | Male | Female |
| Under 5 Years | 0 (0.0%) | 0 (0.0%) |
| 5 to 17 Years | 0 (0.0%) | 0 (0.0%) |
| 18 to 34 Years | 0 (0.0%) | 0 (0.0%) |
| 35 to 64 Years | 0 (0.0%) | 0 (0.0%) |
| 65 to 74 Years | 0 (0.0%) | 5 (8.8%) |
| 75 Years and over | 5 (11.4%) | 4 (18.2%) |
Disability Class: Cognitive Difficulty
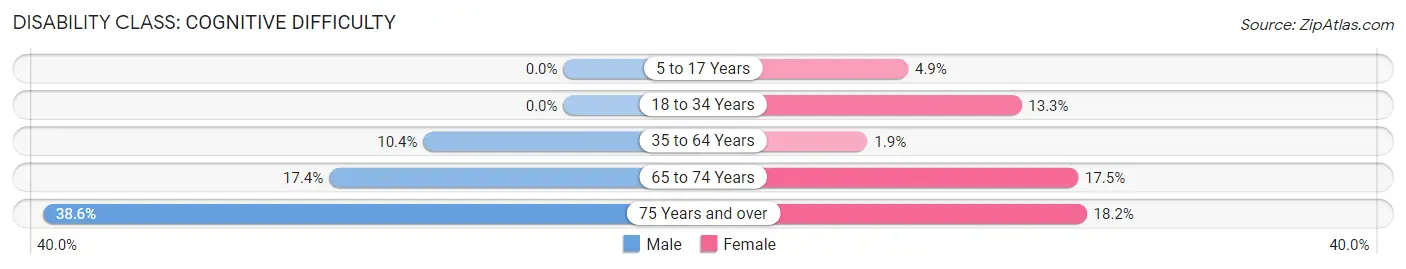
| Age Bracket | Male | Female |
| 5 to 17 Years | 0 (0.0%) | 3 (4.9%) |
| 18 to 34 Years | 0 (0.0%) | 6 (13.3%) |
| 35 to 64 Years | 13 (10.4%) | 2 (1.9%) |
| 65 to 74 Years | 4 (17.4%) | 10 (17.5%) |
| 75 Years and over | 17 (38.6%) | 4 (18.2%) |
Disability Class: Ambulatory Difficulty
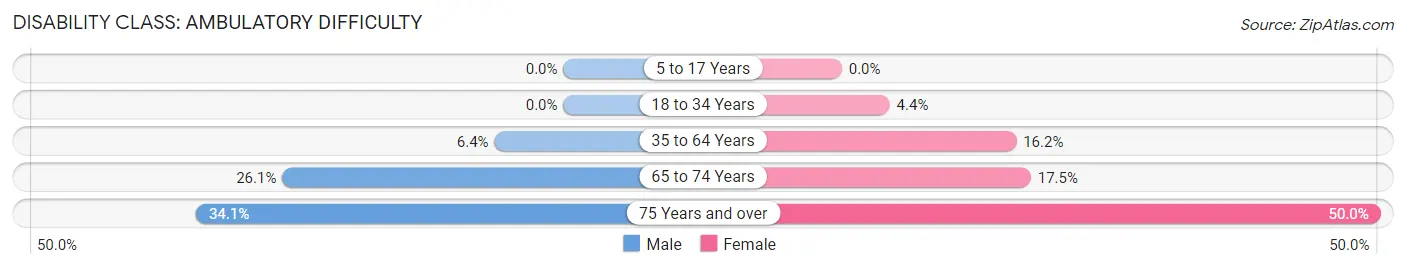
| Age Bracket | Male | Female |
| 5 to 17 Years | 0 (0.0%) | 0 (0.0%) |
| 18 to 34 Years | 0 (0.0%) | 2 (4.4%) |
| 35 to 64 Years | 8 (6.4%) | 17 (16.2%) |
| 65 to 74 Years | 6 (26.1%) | 10 (17.5%) |
| 75 Years and over | 15 (34.1%) | 11 (50.0%) |
Disability Class: Self-Care Difficulty
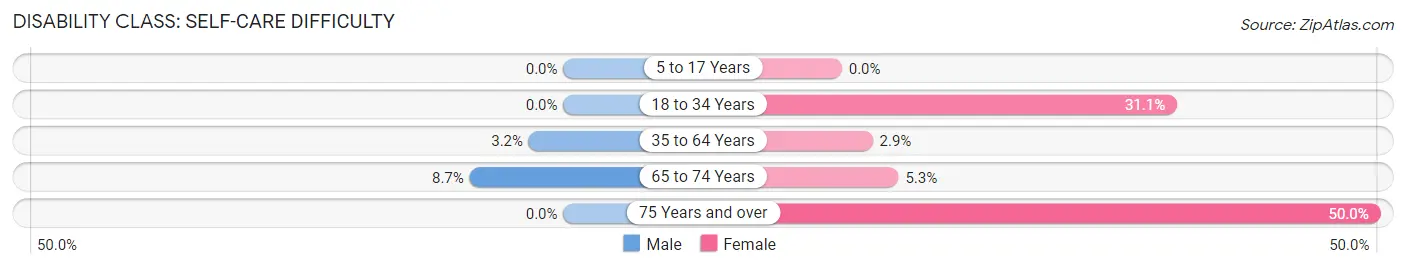
| Age Bracket | Male | Female |
| 5 to 17 Years | 0 (0.0%) | 0 (0.0%) |
| 18 to 34 Years | 0 (0.0%) | 14 (31.1%) |
| 35 to 64 Years | 4 (3.2%) | 3 (2.9%) |
| 65 to 74 Years | 2 (8.7%) | 3 (5.3%) |
| 75 Years and over | 0 (0.0%) | 11 (50.0%) |
Technology Access in Milner
Computing Device Access in Milner
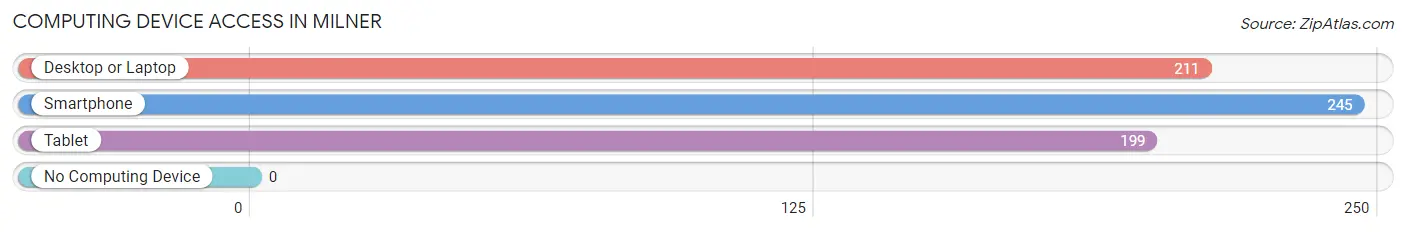
| Device Type | # Households | % Households |
| Desktop or Laptop | 211 | 80.5% |
| Smartphone | 245 | 93.5% |
| Tablet | 199 | 75.9% |
| No Computing Device | 0 | 0.0% |
| Total | 262 | 100.0% |
Internet Access in Milner
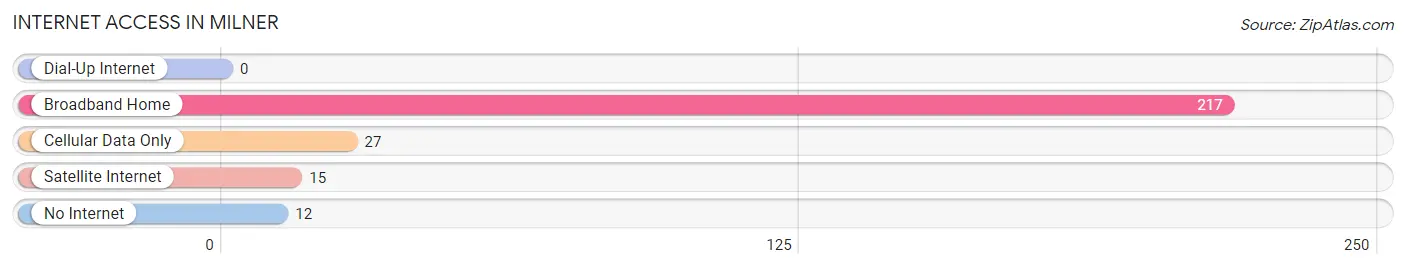
| Internet Type | # Households | % Households |
| Dial-Up Internet | 0 | 0.0% |
| Broadband Home | 217 | 82.8% |
| Cellular Data Only | 27 | 10.3% |
| Satellite Internet | 15 | 5.7% |
| No Internet | 12 | 4.6% |
| Total | 262 | 100.0% |
Milner Summary
History
The small town of Milner, Georgia is located in Lamar County, approximately 70 miles south of Atlanta. The town was founded in 1882 by the Milner family, who had moved to the area from South Carolina. The town was named after the family’s patriarch, William Milner. The town was originally a farming community, but it soon developed into a small industrial center. The town’s first industry was a cotton mill, which was built in 1883. The mill was a major employer in the area and provided jobs for many of the town’s residents.
In the early 1900s, Milner began to experience a period of growth and development. The town was incorporated in 1906 and the population grew to over 1,000 by 1910. During this time, the town also saw the construction of a number of new businesses, including a bank, a hotel, and a movie theater.
In the 1920s, Milner experienced a period of decline. The cotton mill closed in 1925 and the population began to decline. The town was hit hard by the Great Depression and many of the businesses closed. The population continued to decline until the 1950s, when the town began to experience a period of growth and revitalization.
Geography
Milner is located in Lamar County, Georgia, approximately 70 miles south of Atlanta. The town is situated in the foothills of the Appalachian Mountains and is surrounded by rolling hills and forests. The town is located on the banks of the Ocmulgee River, which provides a scenic backdrop for the town.
The climate in Milner is mild and humid. Summers are hot and humid, with temperatures reaching into the 90s. Winters are mild, with temperatures rarely dropping below freezing. The town receives an average of 48 inches of rain per year.
Economy
The economy of Milner is largely based on agriculture and manufacturing. The town is home to a number of small businesses, including a grocery store, a hardware store, and a few restaurants. The town also has a number of small manufacturing companies, which produce a variety of products, including furniture, clothing, and automotive parts.
The town is also home to a number of farms, which produce a variety of crops, including corn, soybeans, and cotton. The town is also home to a number of timber companies, which harvest timber from the surrounding forests.
Demographics
As of the 2010 census, the population of Milner was 1,845. The town is predominantly white, with a small African American population. The median household income in Milner is $35,000, which is slightly lower than the state average. The town has a poverty rate of 17.3%, which is slightly higher than the state average. The town has a high school graduation rate of 79.3%, which is slightly higher than the state average.
Common Questions
What is Per Capita Income in Milner?
Per Capita income in Milner is $28,897.
What is the Median Family Income in Milner?
Median Family Income in Milner is $69,107.
What is the Median Household income in Milner?
Median Household Income in Milner is $66,125.
What is Income or Wage Gap in Milner?
Income or Wage Gap in Milner is 28.1%.
Women in Milner earn 71.9 cents for every dollar earned by a man.
What is Inequality or Gini Index in Milner?
Inequality or Gini Index in Milner is 0.34.
What is the Total Population of Milner?
Total Population of Milner is 616.
What is the Total Male Population of Milner?
Total Male Population of Milner is 313.
What is the Total Female Population of Milner?
Total Female Population of Milner is 303.
What is the Ratio of Males per 100 Females in Milner?
There are 103.30 Males per 100 Females in Milner.
What is the Ratio of Females per 100 Males in Milner?
There are 96.81 Females per 100 Males in Milner.
What is the Median Population Age in Milner?
Median Population Age in Milner is 39.9 Years.
What is the Average Family Size in Milner
Average Family Size in Milner is 3.0 People.
What is the Average Household Size in Milner
Average Household Size in Milner is 2.4 People.
How Large is the Labor Force in Milner?
There are 285 People in the Labor Forcein in Milner.
What is the Percentage of People in the Labor Force in Milner?
60.6% of People are in the Labor Force in Milner.
What is the Unemployment Rate in Milner?
Unemployment Rate in Milner is 3.5%.