Rincon, GA Map & Demographics
Rincon Map
Rincon Overview
$37,098
PER CAPITA INCOME
$90,285
AVG FAMILY INCOME
$73,708
AVG HOUSEHOLD INCOME
44.2%
WAGE / INCOME GAP [ % ]
55.8¢/ $1
WAGE / INCOME GAP [ $ ]
0.40
INEQUALITY / GINI INDEX
10,910
TOTAL POPULATION
5,876
MALE POPULATION
5,034
FEMALE POPULATION
116.73
MALES / 100 FEMALES
85.67
FEMALES / 100 MALES
31.4
MEDIAN AGE
3.2
AVG FAMILY SIZE
2.5
AVG HOUSEHOLD SIZE
5,643
LABOR FORCE [ PEOPLE ]
71.9%
PERCENT IN LABOR FORCE
5.9%
UNEMPLOYMENT RATE
Rincon Zip Codes
Rincon Area Codes
Income in Rincon
Income Overview in Rincon
Per Capita Income in Rincon is $37,098, while median incomes of families and households are $90,285 and $73,708 respectively.
| Characteristic | Number | Measure |
| Per Capita Income | 10,910 | $37,098 |
| Median Family Income | 2,808 | $90,285 |
| Mean Family Income | 2,808 | $96,736 |
| Median Household Income | 4,339 | $73,708 |
| Mean Household Income | 4,339 | $90,206 |
| Income Deficit | 2,808 | $0 |
| Wage / Income Gap (%) | 10,910 | 44.25% |
| Wage / Income Gap ($) | 10,910 | 55.75¢ per $1 |
| Gini / Inequality Index | 10,910 | 0.40 |
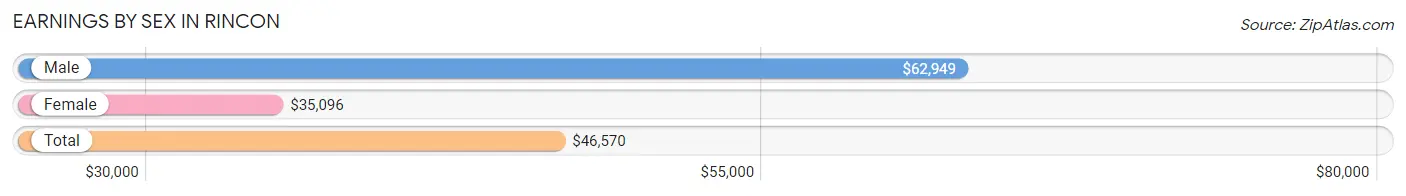
Earnings by Sex in Rincon
Average Earnings in Rincon are $46,570, $62,949 for men and $35,096 for women, a difference of 44.3%.
| Sex | Number | Average Earnings |
| Male | 3,217 (53.1%) | $62,949 |
| Female | 2,846 (46.9%) | $35,096 |
| Total | 6,063 (100.0%) | $46,570 |
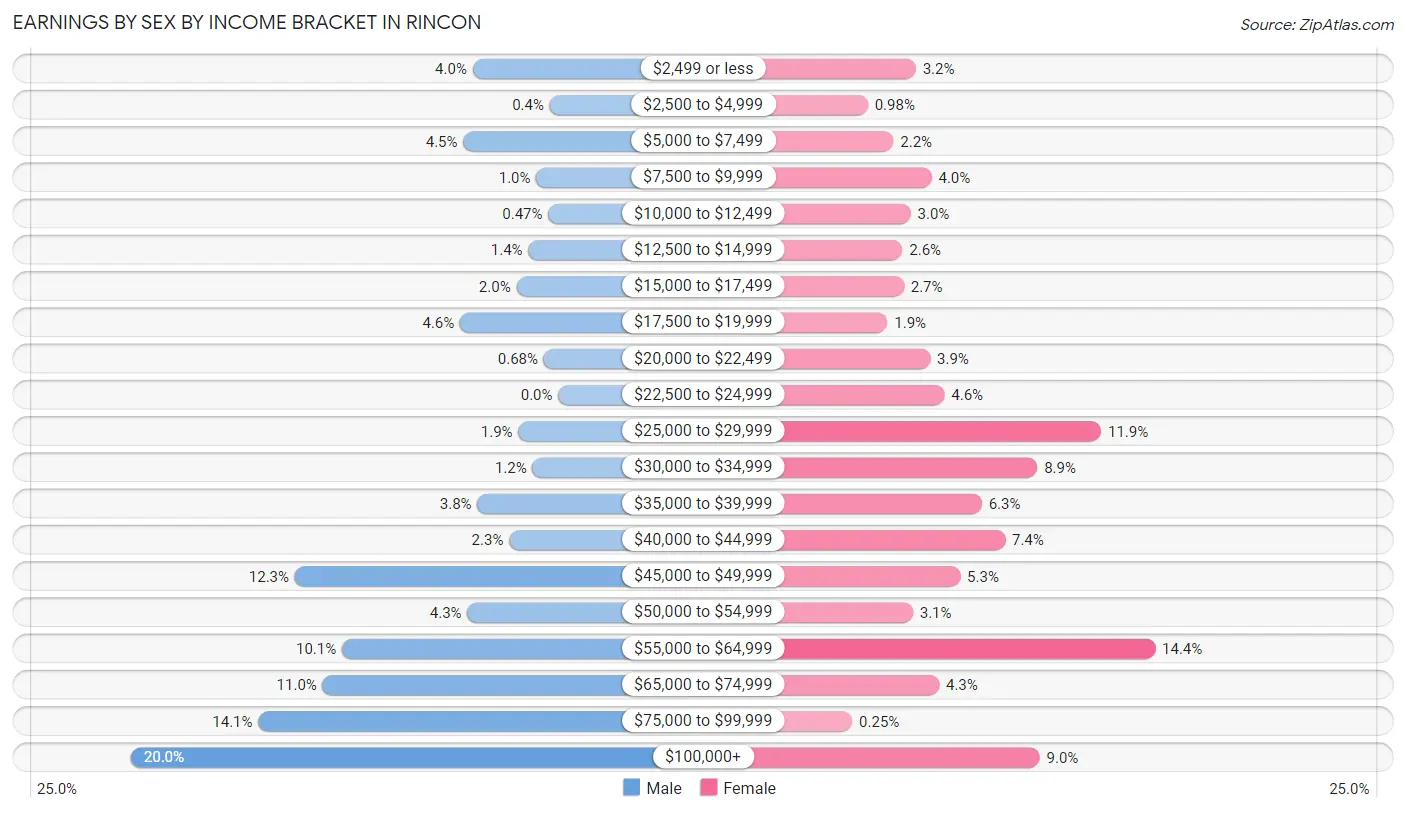
Earnings by Sex by Income Bracket in Rincon
The most common earnings brackets in Rincon are $100,000+ for men (644 | 20.0%) and $55,000 to $64,999 for women (411 | 14.4%).
| Income | Male | Female |
| $2,499 or less | 129 (4.0%) | 92 (3.2%) |
| $2,500 to $4,999 | 13 (0.4%) | 28 (1.0%) |
| $5,000 to $7,499 | 143 (4.4%) | 62 (2.2%) |
| $7,500 to $9,999 | 33 (1.0%) | 113 (4.0%) |
| $10,000 to $12,499 | 15 (0.5%) | 85 (3.0%) |
| $12,500 to $14,999 | 45 (1.4%) | 74 (2.6%) |
| $15,000 to $17,499 | 63 (2.0%) | 76 (2.7%) |
| $17,500 to $19,999 | 148 (4.6%) | 54 (1.9%) |
| $20,000 to $22,499 | 22 (0.7%) | 111 (3.9%) |
| $22,500 to $24,999 | 0 (0.0%) | 130 (4.6%) |
| $25,000 to $29,999 | 60 (1.9%) | 339 (11.9%) |
| $30,000 to $34,999 | 39 (1.2%) | 254 (8.9%) |
| $35,000 to $39,999 | 122 (3.8%) | 180 (6.3%) |
| $40,000 to $44,999 | 74 (2.3%) | 211 (7.4%) |
| $45,000 to $49,999 | 397 (12.3%) | 151 (5.3%) |
| $50,000 to $54,999 | 137 (4.3%) | 88 (3.1%) |
| $55,000 to $64,999 | 326 (10.1%) | 411 (14.4%) |
| $65,000 to $74,999 | 355 (11.0%) | 123 (4.3%) |
| $75,000 to $99,999 | 452 (14.1%) | 7 (0.3%) |
| $100,000+ | 644 (20.0%) | 257 (9.0%) |
| Total | 3,217 (100.0%) | 2,846 (100.0%) |
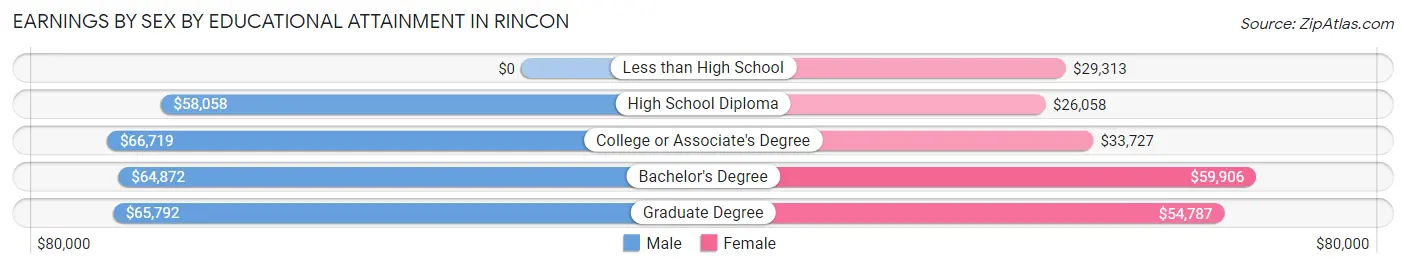
Earnings by Sex by Educational Attainment in Rincon
Average earnings in Rincon are $64,928 for men and $37,250 for women, a difference of 42.6%. Men with an educational attainment of college or associate's degree enjoy the highest average annual earnings of $66,719, while those with high school diploma education earn the least with $58,058. Women with an educational attainment of bachelor's degree earn the most with the average annual earnings of $59,906, while those with high school diploma education have the smallest earnings of $26,058.
| Educational Attainment | Male Income | Female Income |
| Less than High School | - | - |
| High School Diploma | $58,058 | $26,058 |
| College or Associate's Degree | $66,719 | $33,727 |
| Bachelor's Degree | $64,872 | $59,906 |
| Graduate Degree | $65,792 | $54,787 |
| Total | $64,928 | $37,250 |
Family Income in Rincon
Family Income Brackets in Rincon
According to the Rincon family income data, there are 764 families falling into the $100,000 to $149,999 income range, which is the most common income bracket and makes up 27.2% of all families.
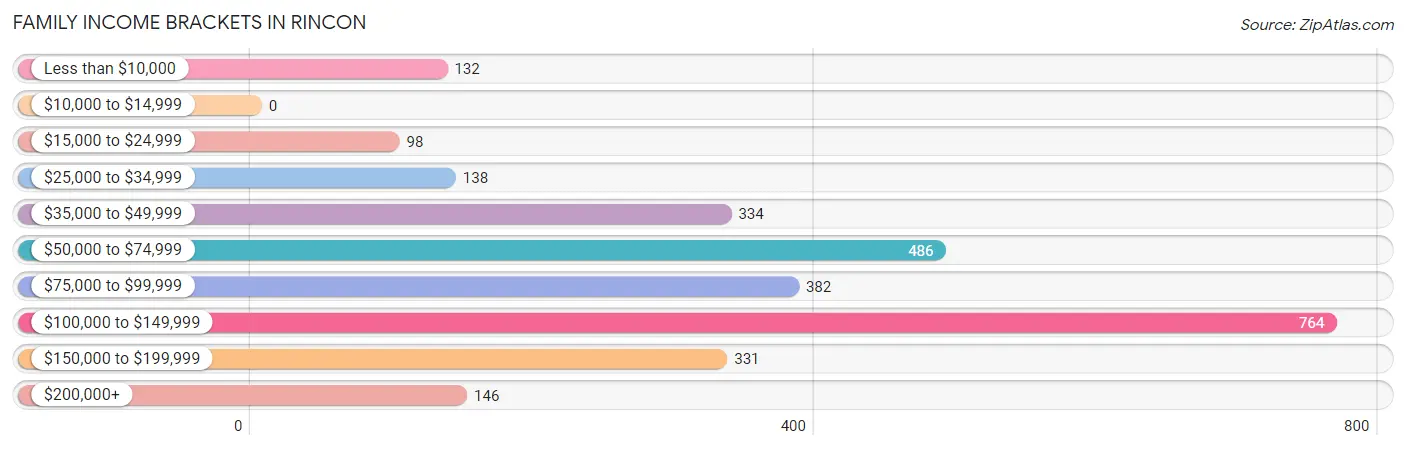
| Income Bracket | # Families | % Families |
| Less than $10,000 | 132 | 4.7% |
| $10,000 to $14,999 | 0 | 0.0% |
| $15,000 to $24,999 | 98 | 3.5% |
| $25,000 to $34,999 | 138 | 4.9% |
| $35,000 to $49,999 | 334 | 11.9% |
| $50,000 to $74,999 | 486 | 17.3% |
| $75,000 to $99,999 | 382 | 13.6% |
| $100,000 to $149,999 | 764 | 27.2% |
| $150,000 to $199,999 | 331 | 11.8% |
| $200,000+ | 146 | 5.2% |
Family Income by Famaliy Size in Rincon
7+ person families (23 | 0.8%) account for the highest median family income in Rincon with $188,750 per family, while 2-person families (1,281 | 45.6%) have the highest median income of $40,672 per family member.
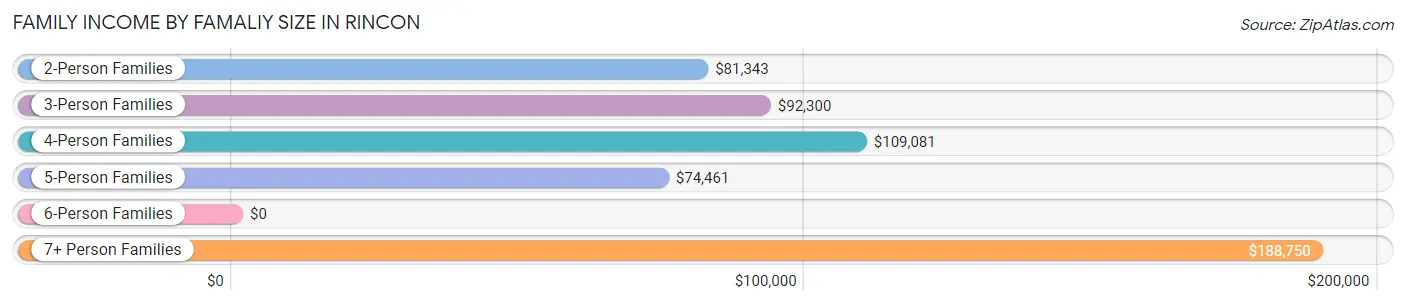
| Income Bracket | # Families | Median Income |
| 2-Person Families | 1,281 (45.6%) | $81,343 |
| 3-Person Families | 776 (27.6%) | $92,300 |
| 4-Person Families | 401 (14.3%) | $109,081 |
| 5-Person Families | 282 (10.0%) | $74,461 |
| 6-Person Families | 45 (1.6%) | $0 |
| 7+ Person Families | 23 (0.8%) | $188,750 |
| Total | 2,808 (100.0%) | $90,285 |
Family Income by Number of Earners in Rincon
The median family income in Rincon is $90,285, with families comprising 3+ earners (101) having the highest median family income of $161,179, while families with no earners (223) have the lowest median family income of $29,139, accounting for 3.6% and 7.9% of families, respectively.
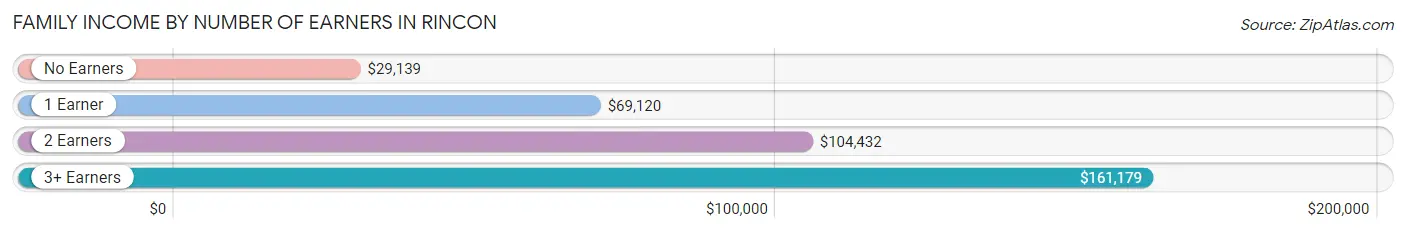
| Number of Earners | # Families | Median Income |
| No Earners | 223 (7.9%) | $29,139 |
| 1 Earner | 1,132 (40.3%) | $69,120 |
| 2 Earners | 1,352 (48.1%) | $104,432 |
| 3+ Earners | 101 (3.6%) | $161,179 |
| Total | 2,808 (100.0%) | $90,285 |
Household Income in Rincon
Household Income Brackets in Rincon
With 903 households falling in the category, the $100,000 to $149,999 income range is the most frequent in Rincon, accounting for 20.8% of all households. In contrast, only 30 households (0.7%) fall into the $10,000 to $14,999 income bracket, making it the least populous group.
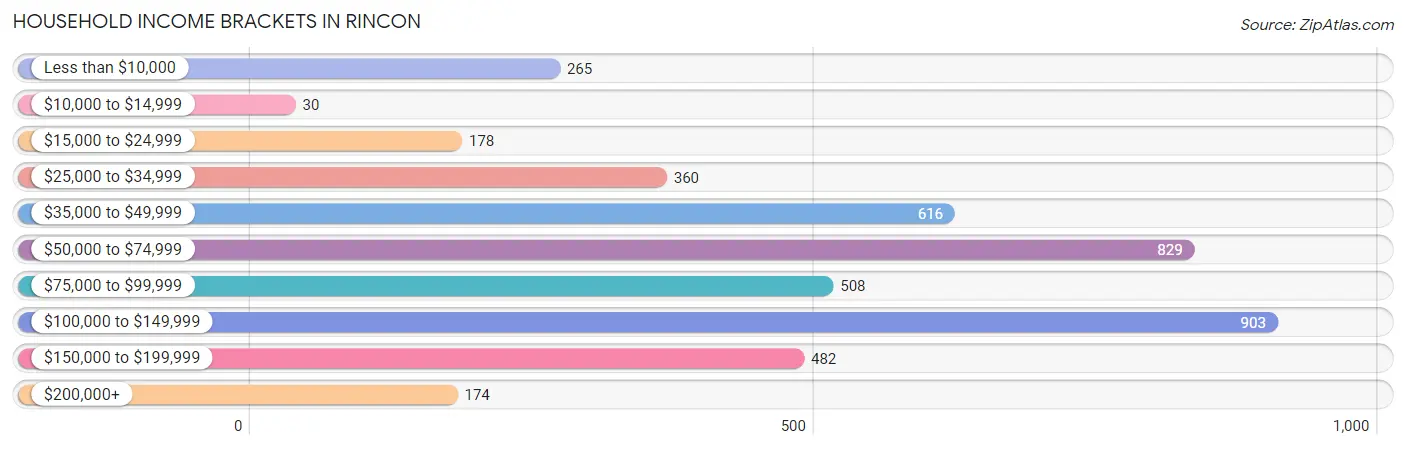
| Income Bracket | # Households | % Households |
| Less than $10,000 | 265 | 6.1% |
| $10,000 to $14,999 | 30 | 0.7% |
| $15,000 to $24,999 | 178 | 4.1% |
| $25,000 to $34,999 | 360 | 8.3% |
| $35,000 to $49,999 | 616 | 14.2% |
| $50,000 to $74,999 | 829 | 19.1% |
| $75,000 to $99,999 | 508 | 11.7% |
| $100,000 to $149,999 | 903 | 20.8% |
| $150,000 to $199,999 | 482 | 11.1% |
| $200,000+ | 174 | 4.0% |
Household Income by Householder Age in Rincon
The median household income in Rincon is $73,708, with the highest median household income of $78,095 found in the 25 to 44 years age bracket for the primary householder. A total of 1,908 households (44.0%) fall into this category. Meanwhile, the 15 to 24 years age bracket for the primary householder has the lowest median household income of $0, with 189 households (4.4%) in this group.
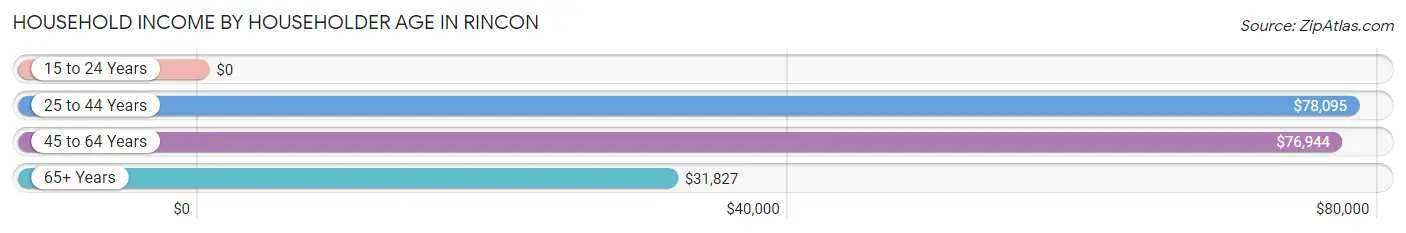
| Income Bracket | # Households | Median Income |
| 15 to 24 Years | 189 (4.4%) | $0 |
| 25 to 44 Years | 1,908 (44.0%) | $78,095 |
| 45 to 64 Years | 1,754 (40.4%) | $76,944 |
| 65+ Years | 488 (11.3%) | $31,827 |
| Total | 4,339 (100.0%) | $73,708 |
Poverty in Rincon
Income Below Poverty by Sex and Age in Rincon
With 8.3% poverty level for males and 9.1% for females among the residents of Rincon, 16 and 17 year old males and 15 year old females are the most vulnerable to poverty, with 88 males (66.2%) and 13 females (100.0%) in their respective age groups living below the poverty level.
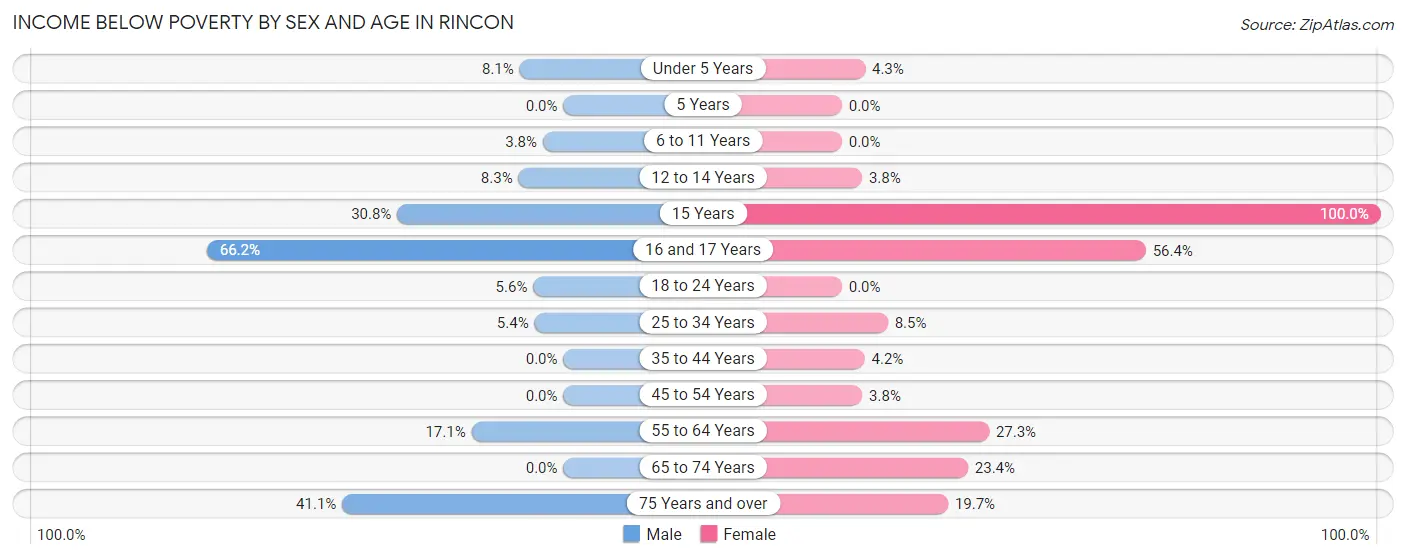
| Age Bracket | Male | Female |
| Under 5 Years | 41 (8.1%) | 19 (4.3%) |
| 5 Years | 0 (0.0%) | 0 (0.0%) |
| 6 to 11 Years | 32 (3.8%) | 0 (0.0%) |
| 12 to 14 Years | 26 (8.3%) | 10 (3.7%) |
| 15 Years | 70 (30.8%) | 13 (100.0%) |
| 16 and 17 Years | 88 (66.2%) | 44 (56.4%) |
| 18 to 24 Years | 28 (5.6%) | 0 (0.0%) |
| 25 to 34 Years | 55 (5.4%) | 93 (8.5%) |
| 35 to 44 Years | 0 (0.0%) | 27 (4.2%) |
| 45 to 54 Years | 0 (0.0%) | 34 (3.8%) |
| 55 to 64 Years | 88 (17.1%) | 118 (27.3%) |
| 65 to 74 Years | 0 (0.0%) | 73 (23.4%) |
| 75 Years and over | 62 (41.1%) | 26 (19.7%) |
| Total | 490 (8.3%) | 457 (9.1%) |
Income Above Poverty by Sex and Age in Rincon
According to the poverty statistics in Rincon, males aged 35 to 44 years and females aged 5 years are the age groups that are most secure financially, with 100.0% of males and 100.0% of females in these age groups living above the poverty line.
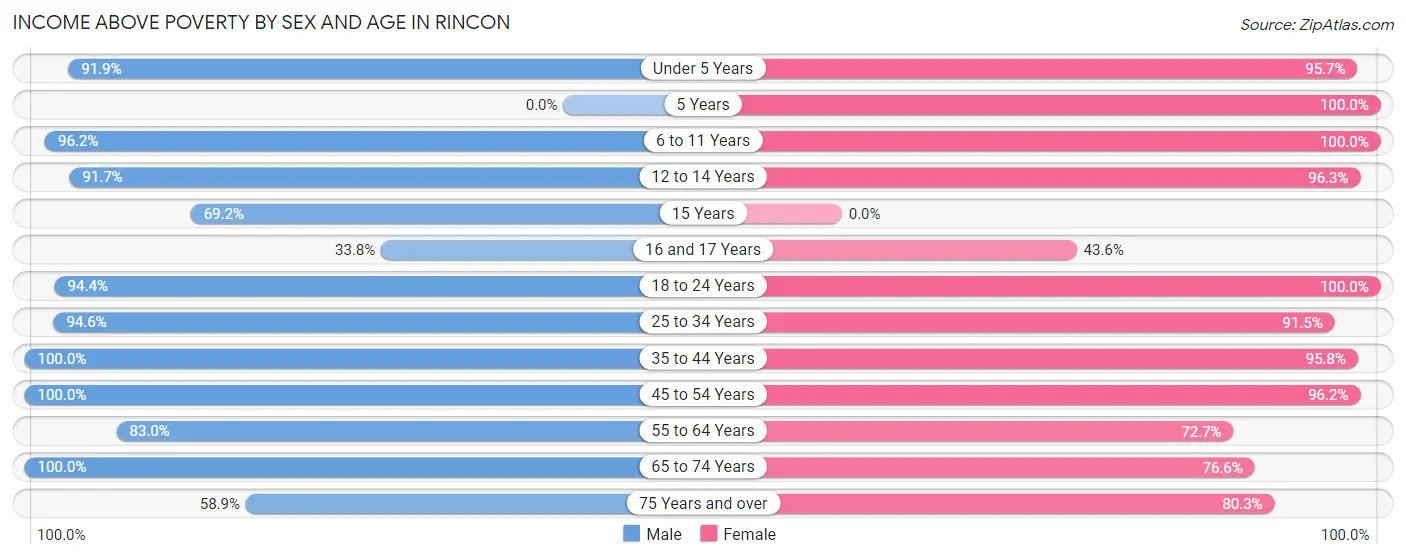
| Age Bracket | Male | Female |
| Under 5 Years | 464 (91.9%) | 422 (95.7%) |
| 5 Years | 0 (0.0%) | 21 (100.0%) |
| 6 to 11 Years | 809 (96.2%) | 435 (100.0%) |
| 12 to 14 Years | 286 (91.7%) | 257 (96.3%) |
| 15 Years | 157 (69.2%) | 0 (0.0%) |
| 16 and 17 Years | 45 (33.8%) | 34 (43.6%) |
| 18 to 24 Years | 473 (94.4%) | 273 (100.0%) |
| 25 to 34 Years | 972 (94.6%) | 999 (91.5%) |
| 35 to 44 Years | 778 (100.0%) | 611 (95.8%) |
| 45 to 54 Years | 731 (100.0%) | 866 (96.2%) |
| 55 to 64 Years | 428 (83.0%) | 314 (72.7%) |
| 65 to 74 Years | 154 (100.0%) | 239 (76.6%) |
| 75 Years and over | 89 (58.9%) | 106 (80.3%) |
| Total | 5,386 (91.7%) | 4,577 (90.9%) |
Income Below Poverty Among Married-Couple Families in Rincon
The poverty statistics for married-couple families in Rincon show that 3.7% or 80 of the total 2,181 families live below the poverty line. Families with 3 or 4 children have the highest poverty rate of 10.7%, comprising of 28 families. On the other hand, families with 1 or 2 children have the lowest poverty rate of 0.0%, which includes 0 families.
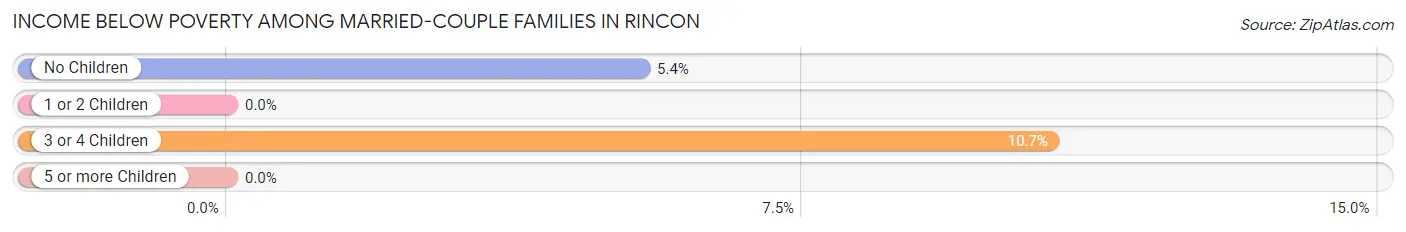
| Children | Above Poverty | Below Poverty |
| No Children | 914 (94.6%) | 52 (5.4%) |
| 1 or 2 Children | 943 (100.0%) | 0 (0.0%) |
| 3 or 4 Children | 233 (89.3%) | 28 (10.7%) |
| 5 or more Children | 11 (100.0%) | 0 (0.0%) |
| Total | 2,101 (96.3%) | 80 (3.7%) |
Income Below Poverty Among Single-Parent Households in Rincon
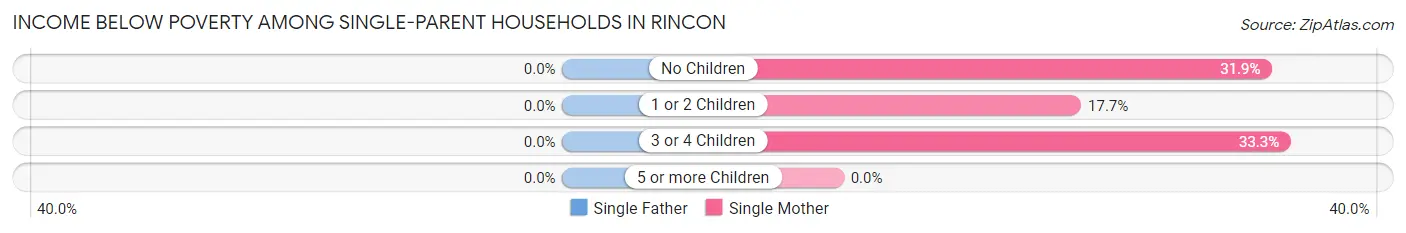
| Children | Single Father | Single Mother |
| No Children | 0 (0.0%) | 53 (31.9%) |
| 1 or 2 Children | 0 (0.0%) | 49 (17.7%) |
| 3 or 4 Children | 0 (0.0%) | 17 (33.3%) |
| 5 or more Children | 0 (0.0%) | 0 (0.0%) |
| Total | 0 (0.0%) | 119 (24.1%) |
Income Below Poverty Among Married-Couple vs Single-Parent Households in Rincon
The poverty data for Rincon shows that 80 of the married-couple family households (3.7%) and 119 of the single-parent households (19.0%) are living below the poverty level. Within the married-couple family households, those with 3 or 4 children have the highest poverty rate, with 28 households (10.7%) falling below the poverty line. Among the single-parent households, those with 3 or 4 children have the highest poverty rate, with 17 household (26.6%) living below poverty.
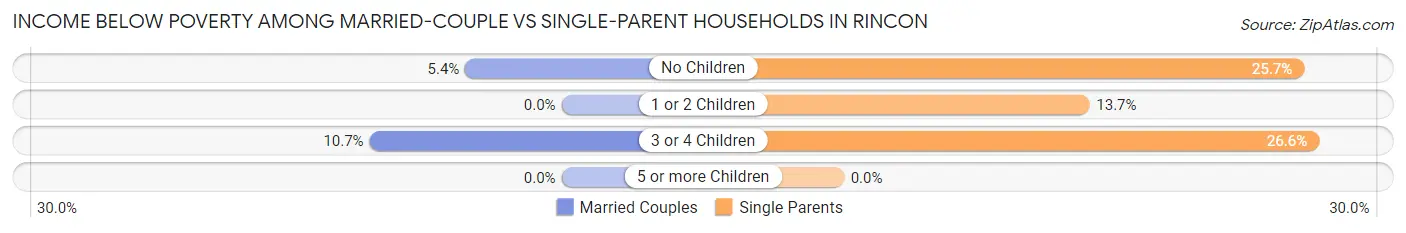
| Children | Married-Couple Families | Single-Parent Households |
| No Children | 52 (5.4%) | 53 (25.7%) |
| 1 or 2 Children | 0 (0.0%) | 49 (13.7%) |
| 3 or 4 Children | 28 (10.7%) | 17 (26.6%) |
| 5 or more Children | 0 (0.0%) | 0 (0.0%) |
| Total | 80 (3.7%) | 119 (19.0%) |
Race in Rincon
The most populous races in Rincon are White / Caucasian (7,959 | 73.0%), Black / African American (2,120 | 19.4%), and Hispanic or Latino (722 | 6.6%).
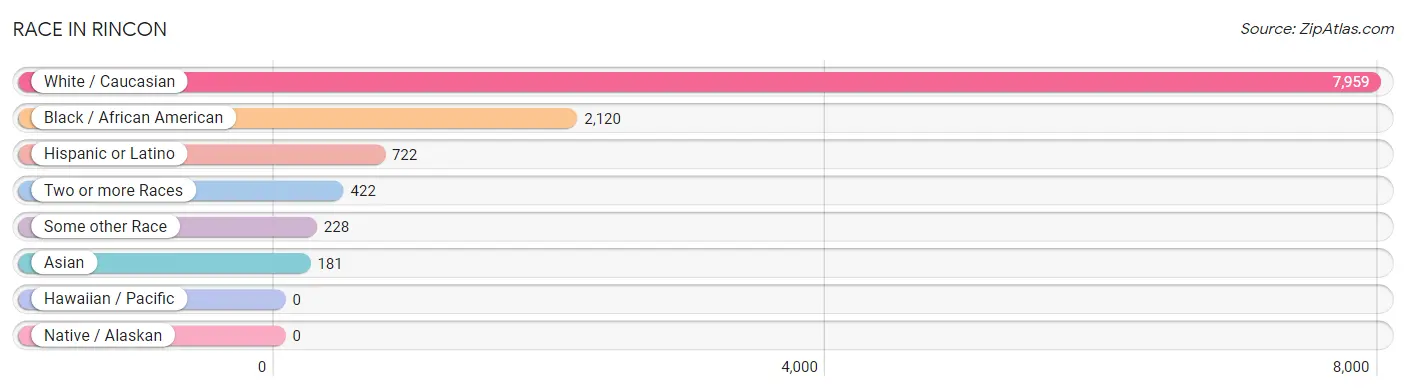
| Race | # Population | % Population |
| Asian | 181 | 1.7% |
| Black / African American | 2,120 | 19.4% |
| Hawaiian / Pacific | 0 | 0.0% |
| Hispanic or Latino | 722 | 6.6% |
| Native / Alaskan | 0 | 0.0% |
| White / Caucasian | 7,959 | 73.0% |
| Two or more Races | 422 | 3.9% |
| Some other Race | 228 | 2.1% |
| Total | 10,910 | 100.0% |
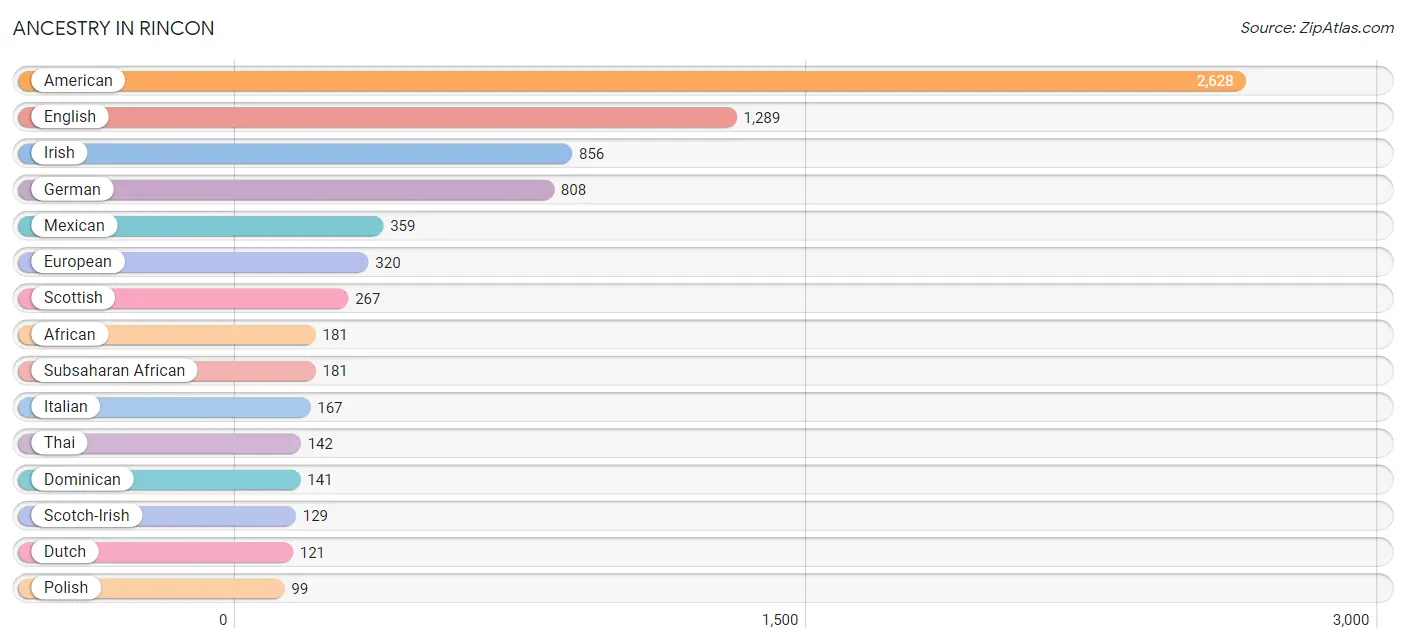
Ancestry in Rincon
The most populous ancestries reported in Rincon are American (2,628 | 24.1%), English (1,289 | 11.8%), Irish (856 | 7.9%), German (808 | 7.4%), and Mexican (359 | 3.3%), together accounting for 54.5% of all Rincon residents.
| Ancestry | # Population | % Population |
| African | 181 | 1.7% |
| American | 2,628 | 24.1% |
| Argentinean | 48 | 0.4% |
| Austrian | 17 | 0.2% |
| Cajun | 12 | 0.1% |
| Celtic | 43 | 0.4% |
| Central American | 91 | 0.8% |
| Costa Rican | 32 | 0.3% |
| Danish | 24 | 0.2% |
| Dominican | 141 | 1.3% |
| Dutch | 121 | 1.1% |
| English | 1,289 | 11.8% |
| European | 320 | 2.9% |
| Finnish | 59 | 0.5% |
| French | 42 | 0.4% |
| French Canadian | 81 | 0.7% |
| German | 808 | 7.4% |
| Guatemalan | 59 | 0.5% |
| Indian (Asian) | 19 | 0.2% |
| Irish | 856 | 7.9% |
| Italian | 167 | 1.5% |
| Jamaican | 9 | 0.1% |
| Korean | 51 | 0.5% |
| Mexican | 359 | 3.3% |
| Norwegian | 8 | 0.1% |
| Pakistani | 78 | 0.7% |
| Polish | 99 | 0.9% |
| Portuguese | 39 | 0.4% |
| Puerto Rican | 9 | 0.1% |
| Romanian | 19 | 0.2% |
| Russian | 16 | 0.2% |
| Scotch-Irish | 129 | 1.2% |
| Scottish | 267 | 2.5% |
| South American | 48 | 0.4% |
| Spaniard | 52 | 0.5% |
| Spanish | 22 | 0.2% |
| Sri Lankan | 47 | 0.4% |
| Subsaharan African | 181 | 1.7% |
| Swedish | 32 | 0.3% |
| Swiss | 14 | 0.1% |
| Thai | 142 | 1.3% | View All 41 Rows |
Immigrants in Rincon
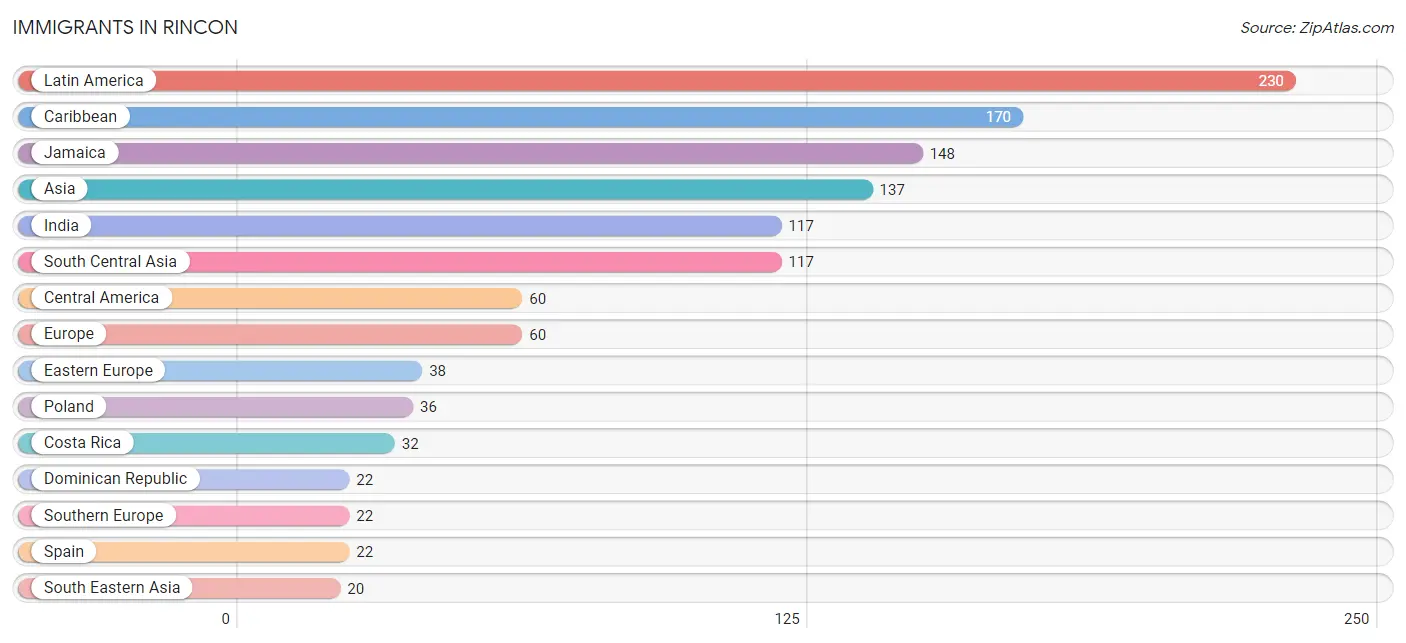
The most numerous immigrant groups reported in Rincon came from Latin America (230 | 2.1%), Caribbean (170 | 1.6%), Jamaica (148 | 1.4%), Asia (137 | 1.3%), and India (117 | 1.1%), together accounting for 7.4% of all Rincon residents.
| Immigration Origin | # Population | % Population |
| Asia | 137 | 1.3% |
| Canada | 10 | 0.1% |
| Caribbean | 170 | 1.6% |
| Central America | 60 | 0.5% |
| Costa Rica | 32 | 0.3% |
| Dominican Republic | 22 | 0.2% |
| Eastern Europe | 38 | 0.4% |
| Europe | 60 | 0.5% |
| Guatemala | 11 | 0.1% |
| India | 117 | 1.1% |
| Jamaica | 148 | 1.4% |
| Latin America | 230 | 2.1% |
| Mexico | 17 | 0.2% |
| Philippines | 4 | 0.0% |
| Poland | 36 | 0.3% |
| Romania | 2 | 0.0% |
| South Central Asia | 117 | 1.1% |
| South Eastern Asia | 20 | 0.2% |
| Southern Europe | 22 | 0.2% |
| Spain | 22 | 0.2% |
| Thailand | 16 | 0.2% | View All 21 Rows |
Sex and Age in Rincon
Sex and Age in Rincon
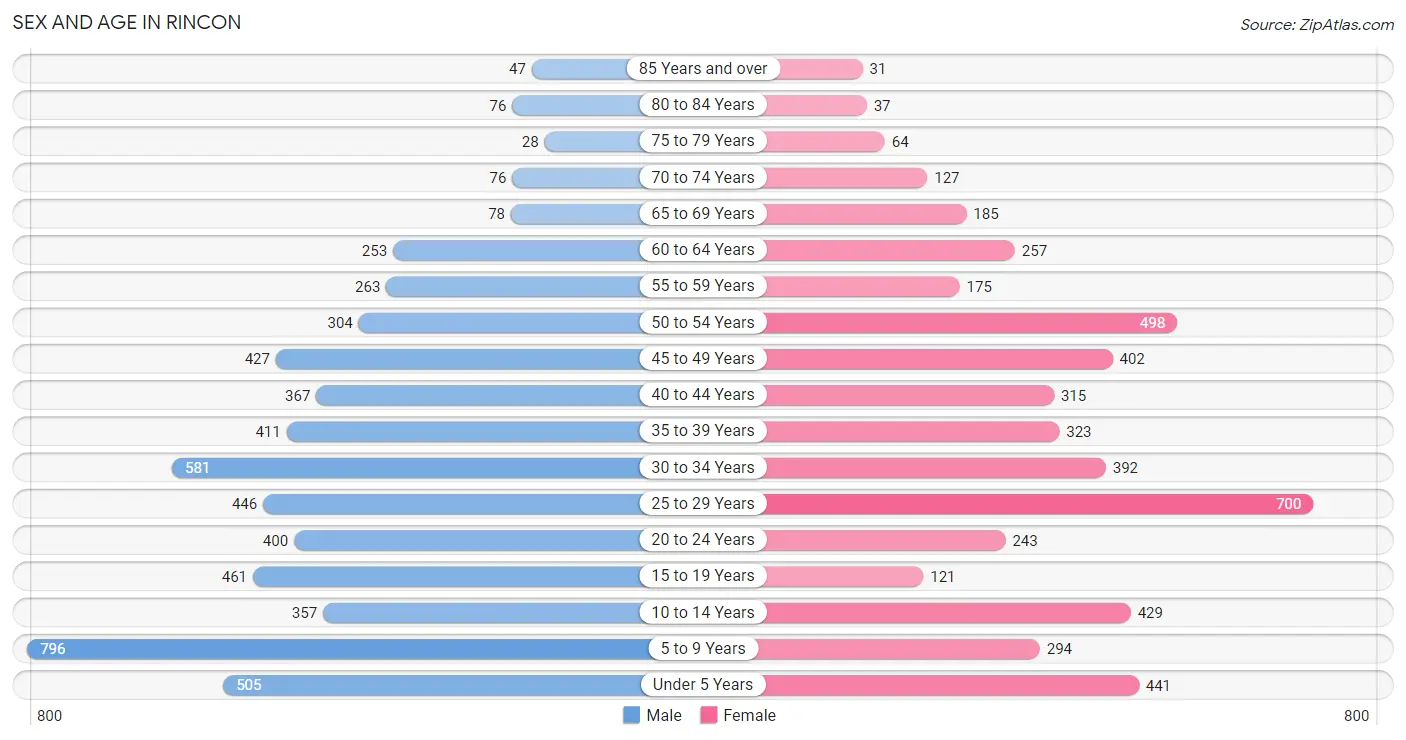
The most populous age groups in Rincon are 5 to 9 Years (796 | 13.6%) for men and 25 to 29 Years (700 | 13.9%) for women.
| Age Bracket | Male | Female |
| Under 5 Years | 505 (8.6%) | 441 (8.8%) |
| 5 to 9 Years | 796 (13.6%) | 294 (5.8%) |
| 10 to 14 Years | 357 (6.1%) | 429 (8.5%) |
| 15 to 19 Years | 461 (7.9%) | 121 (2.4%) |
| 20 to 24 Years | 400 (6.8%) | 243 (4.8%) |
| 25 to 29 Years | 446 (7.6%) | 700 (13.9%) |
| 30 to 34 Years | 581 (9.9%) | 392 (7.8%) |
| 35 to 39 Years | 411 (7.0%) | 323 (6.4%) |
| 40 to 44 Years | 367 (6.2%) | 315 (6.3%) |
| 45 to 49 Years | 427 (7.3%) | 402 (8.0%) |
| 50 to 54 Years | 304 (5.2%) | 498 (9.9%) |
| 55 to 59 Years | 263 (4.5%) | 175 (3.5%) |
| 60 to 64 Years | 253 (4.3%) | 257 (5.1%) |
| 65 to 69 Years | 78 (1.3%) | 185 (3.7%) |
| 70 to 74 Years | 76 (1.3%) | 127 (2.5%) |
| 75 to 79 Years | 28 (0.5%) | 64 (1.3%) |
| 80 to 84 Years | 76 (1.3%) | 37 (0.7%) |
| 85 Years and over | 47 (0.8%) | 31 (0.6%) |
| Total | 5,876 (100.0%) | 5,034 (100.0%) |
Families and Households in Rincon
Median Family Size in Rincon
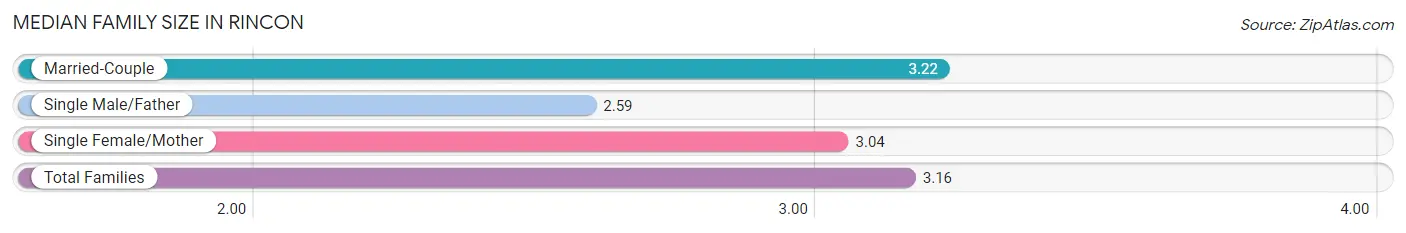
The median family size in Rincon is 3.16 persons per family, with married-couple families (2,181 | 77.7%) accounting for the largest median family size of 3.22 persons per family. On the other hand, single male/father families (133 | 4.7%) represent the smallest median family size with 2.59 persons per family.
| Family Type | # Families | Family Size |
| Married-Couple | 2,181 (77.7%) | 3.22 |
| Single Male/Father | 133 (4.7%) | 2.59 |
| Single Female/Mother | 494 (17.6%) | 3.04 |
| Total Families | 2,808 (100.0%) | 3.16 |
Median Household Size in Rincon
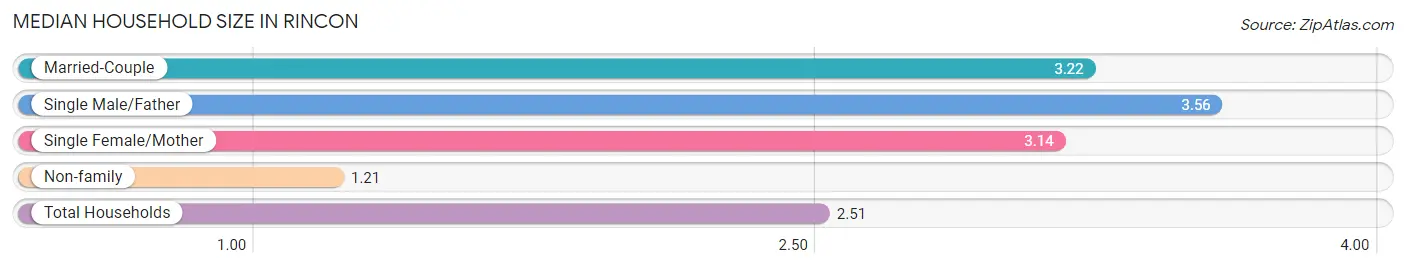
The median household size in Rincon is 2.51 persons per household, with single male/father households (133 | 3.1%) accounting for the largest median household size of 3.56 persons per household. non-family households (1,531 | 35.3%) represent the smallest median household size with 1.21 persons per household.
| Household Type | # Households | Household Size |
| Married-Couple | 2,181 (50.3%) | 3.22 |
| Single Male/Father | 133 (3.1%) | 3.56 |
| Single Female/Mother | 494 (11.4%) | 3.14 |
| Non-family | 1,531 (35.3%) | 1.21 |
| Total Households | 4,339 (100.0%) | 2.51 |
Household Size by Marriage Status in Rincon
Out of a total of 4,339 households in Rincon, 2,808 (64.7%) are family households, while 1,531 (35.3%) are nonfamily households. The most numerous type of family households are 2-person households, comprising 1,148, and the most common type of nonfamily households are 1-person households, comprising 1,398.
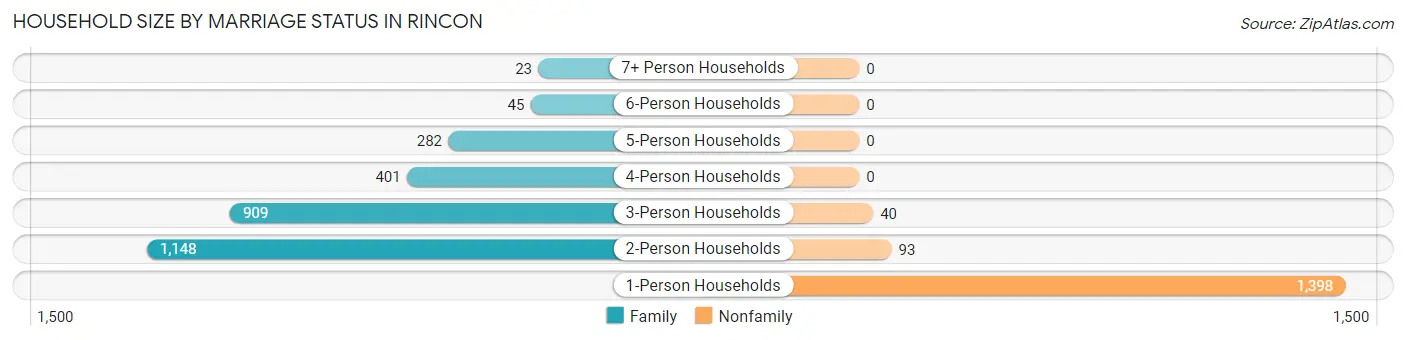
| Household Size | Family Households | Nonfamily Households |
| 1-Person Households | - | 1,398 (32.2%) |
| 2-Person Households | 1,148 (26.5%) | 93 (2.1%) |
| 3-Person Households | 909 (20.9%) | 40 (0.9%) |
| 4-Person Households | 401 (9.2%) | 0 (0.0%) |
| 5-Person Households | 282 (6.5%) | 0 (0.0%) |
| 6-Person Households | 45 (1.0%) | 0 (0.0%) |
| 7+ Person Households | 23 (0.5%) | 0 (0.0%) |
| Total | 2,808 (64.7%) | 1,531 (35.3%) |
Female Fertility in Rincon
Fertility by Age in Rincon
Average fertility rate in Rincon is 73.0 births per 1,000 women. Women in the age bracket of 20 to 34 years have the highest fertility rate with 134.0 births per 1,000 women. Women in the age bracket of 20 to 34 years acount for 95.7% of all women with births.
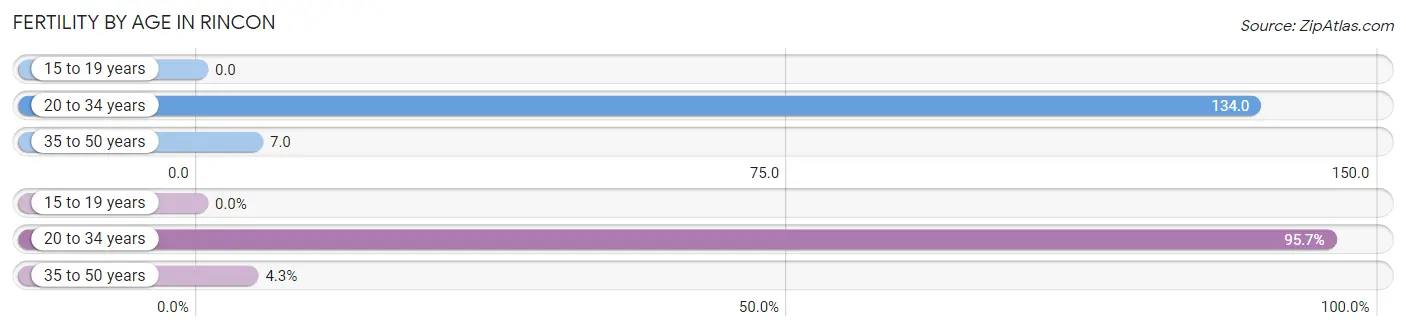
| Age Bracket | Women with Births | Births / 1,000 Women |
| 15 to 19 years | 0 (0.0%) | 0.0 |
| 20 to 34 years | 179 (95.7%) | 134.0 |
| 35 to 50 years | 8 (4.3%) | 7.0 |
| Total | 187 (100.0%) | 73.0 |
Fertility by Age by Marriage Status in Rincon
81.8% of women with births (187) in Rincon are married. The highest percentage of unmarried women with births falls into 20 to 34 years age bracket with 19.0% of them unmarried at the time of birth, while the lowest percentage of unmarried women with births belong to 35 to 50 years age bracket with 0.0% of them unmarried.
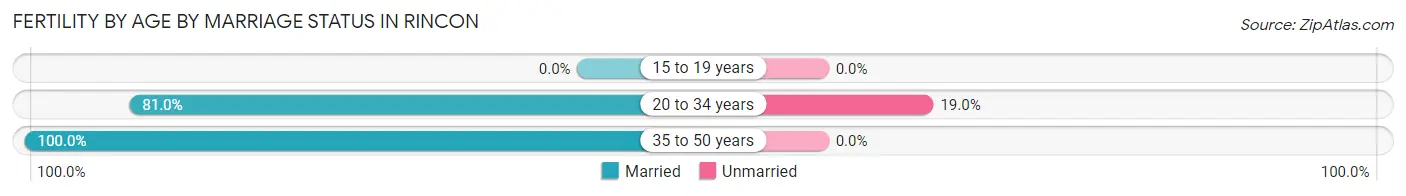
| Age Bracket | Married | Unmarried |
| 15 to 19 years | 0 (0.0%) | 0 (0.0%) |
| 20 to 34 years | 145 (81.0%) | 34 (19.0%) |
| 35 to 50 years | 8 (100.0%) | 0 (0.0%) |
| Total | 153 (81.8%) | 34 (18.2%) |
Fertility by Education in Rincon
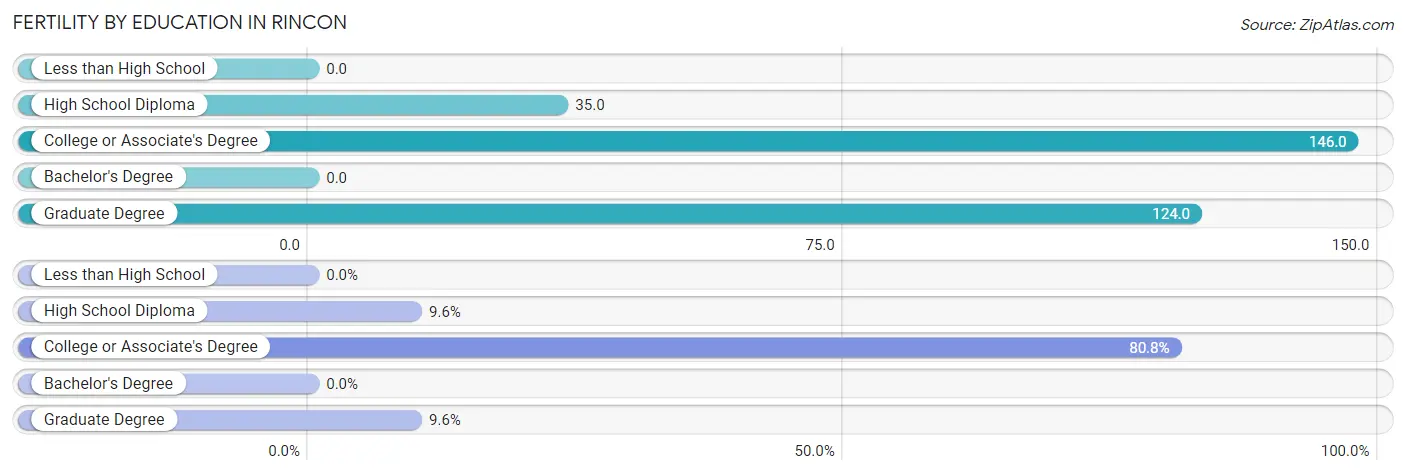
| Educational Attainment | Women with Births | Births / 1,000 Women |
| Less than High School | 0 (0.0%) | 0.0 |
| High School Diploma | 18 (9.6%) | 35.0 |
| College or Associate's Degree | 151 (80.7%) | 146.0 |
| Bachelor's Degree | 0 (0.0%) | 0.0 |
| Graduate Degree | 18 (9.6%) | 124.0 |
| Total | 187 (100.0%) | 73.0 |
Fertility by Education by Marriage Status in Rincon
18.2% of women with births in Rincon are unmarried. Women with the educational attainment of high school diploma are most likely to be married with 100.0% of them married at childbirth, while women with the educational attainment of college or associate's degree are least likely to be married with 22.5% of them unmarried at childbirth.
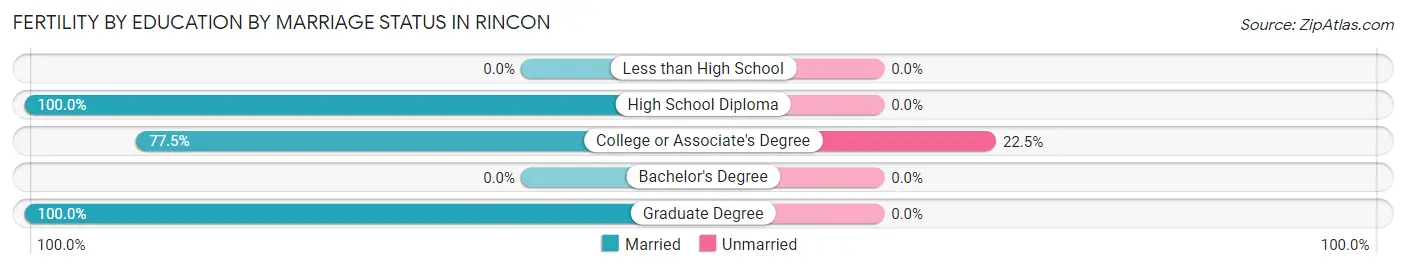
| Educational Attainment | Married | Unmarried |
| Less than High School | 0 (0.0%) | 0 (0.0%) |
| High School Diploma | 18 (100.0%) | 0 (0.0%) |
| College or Associate's Degree | 117 (77.5%) | 34 (22.5%) |
| Bachelor's Degree | 0 (0.0%) | 0 (0.0%) |
| Graduate Degree | 18 (100.0%) | 0 (0.0%) |
| Total | 153 (81.8%) | 34 (18.2%) |
Employment Characteristics in Rincon
Employment by Class of Employer in Rincon
Among the 5,265 employed individuals in Rincon, private company employees (4,144 | 78.7%), state government employees (247 | 4.7%), and federal government employees (216 | 4.1%) make up the most common classes of employment.
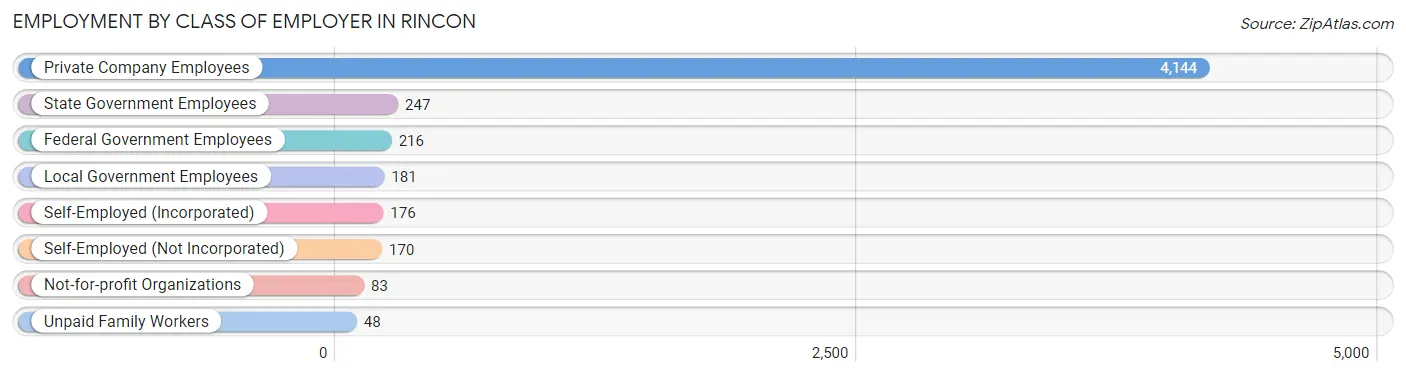
| Employer Class | # Employees | % Employees |
| Private Company Employees | 4,144 | 78.7% |
| Self-Employed (Incorporated) | 176 | 3.3% |
| Self-Employed (Not Incorporated) | 170 | 3.2% |
| Not-for-profit Organizations | 83 | 1.6% |
| Local Government Employees | 181 | 3.4% |
| State Government Employees | 247 | 4.7% |
| Federal Government Employees | 216 | 4.1% |
| Unpaid Family Workers | 48 | 0.9% |
| Total | 5,265 | 100.0% |
Employment Status by Age in Rincon
According to the labor force statistics for Rincon, out of the total population over 16 years of age (7,848), 71.9% or 5,643 individuals are in the labor force, with 5.9% or 333 of them unemployed. The age group with the highest labor force participation rate is 20 to 24 years, with 93.8% or 603 individuals in the labor force. Within the labor force, the 16 to 19 years age range has the highest percentage of unemployed individuals, with 27.9% or 31 of them being unemployed.
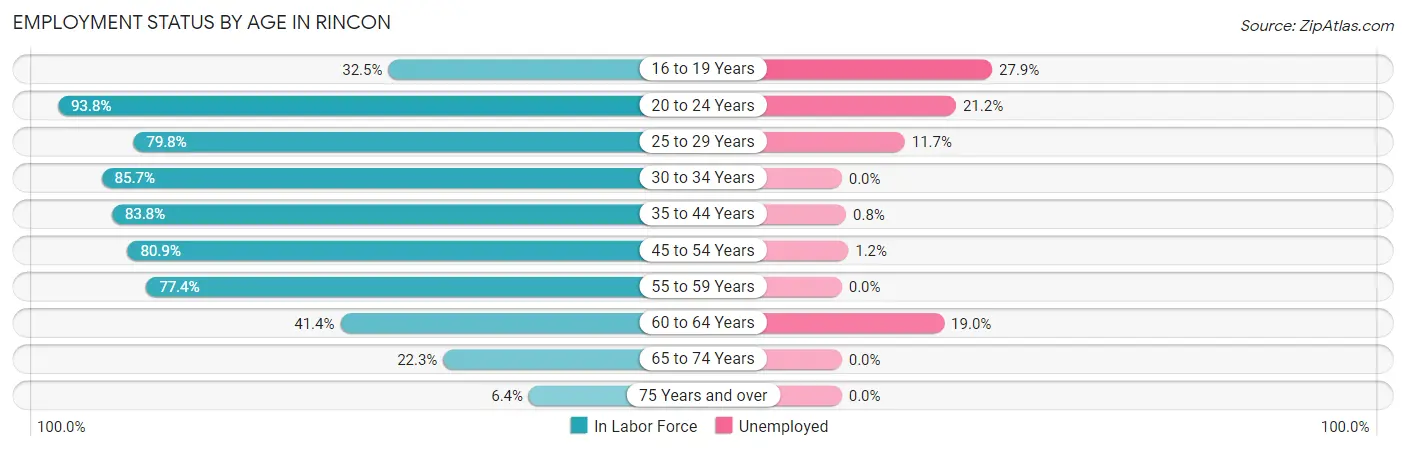
| Age Bracket | In Labor Force | Unemployed |
| 16 to 19 Years | 111 (32.5%) | 31 (27.9%) |
| 20 to 24 Years | 603 (93.8%) | 128 (21.2%) |
| 25 to 29 Years | 915 (79.8%) | 107 (11.7%) |
| 30 to 34 Years | 834 (85.7%) | 0 (0.0%) |
| 35 to 44 Years | 1,187 (83.8%) | 9 (0.8%) |
| 45 to 54 Years | 1,319 (80.9%) | 16 (1.2%) |
| 55 to 59 Years | 339 (77.4%) | 0 (0.0%) |
| 60 to 64 Years | 211 (41.4%) | 40 (19.0%) |
| 65 to 74 Years | 104 (22.3%) | 0 (0.0%) |
| 75 Years and over | 18 (6.4%) | 0 (0.0%) |
| Total | 5,643 (71.9%) | 333 (5.9%) |
Employment Status by Educational Attainment in Rincon
According to labor force statistics for Rincon, 78.6% of individuals (4,806) out of the total population between 25 and 64 years of age (6,114) are in the labor force, with 3.6% or 173 of them being unemployed. The group with the highest labor force participation rate are those with the educational attainment of bachelor's degree or higher, with 92.6% or 1,443 individuals in the labor force. Within the labor force, individuals with high school diploma education have the highest percentage of unemployment, with 8.8% or 98 of them being unemployed.
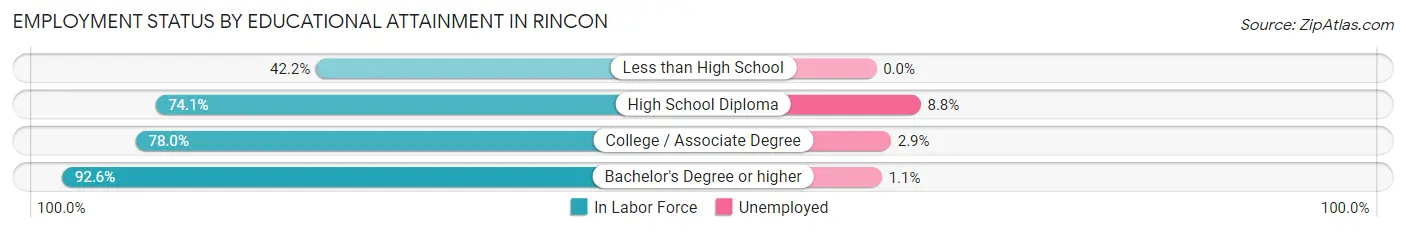
| Educational Attainment | In Labor Force | Unemployed |
| Less than High School | 155 (42.2%) | 0 (0.0%) |
| High School Diploma | 1,111 (74.1%) | 132 (8.8%) |
| College / Associate Degree | 2,097 (78.0%) | 78 (2.9%) |
| Bachelor's Degree or higher | 1,443 (92.6%) | 17 (1.1%) |
| Total | 4,806 (78.6%) | 220 (3.6%) |
Employment Occupations by Sex in Rincon
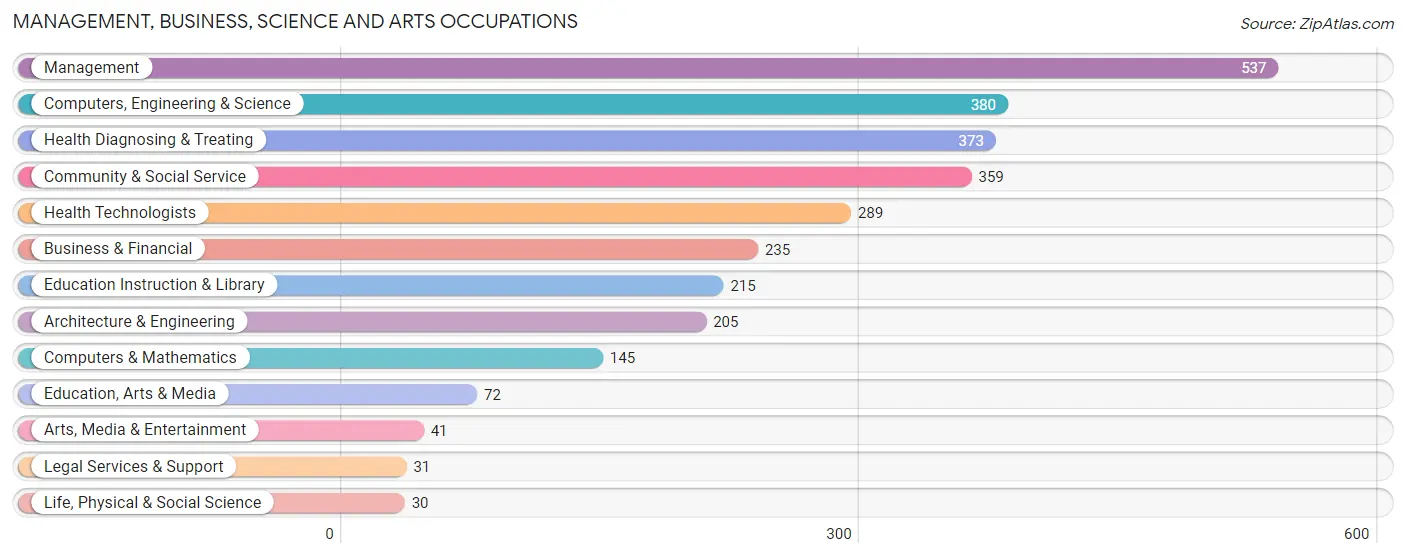
Management, Business, Science and Arts Occupations
The most common Management, Business, Science and Arts occupations in Rincon are Management (537 | 10.3%), Computers, Engineering & Science (380 | 7.3%), Health Diagnosing & Treating (373 | 7.1%), Community & Social Service (359 | 6.9%), and Health Technologists (289 | 5.5%).
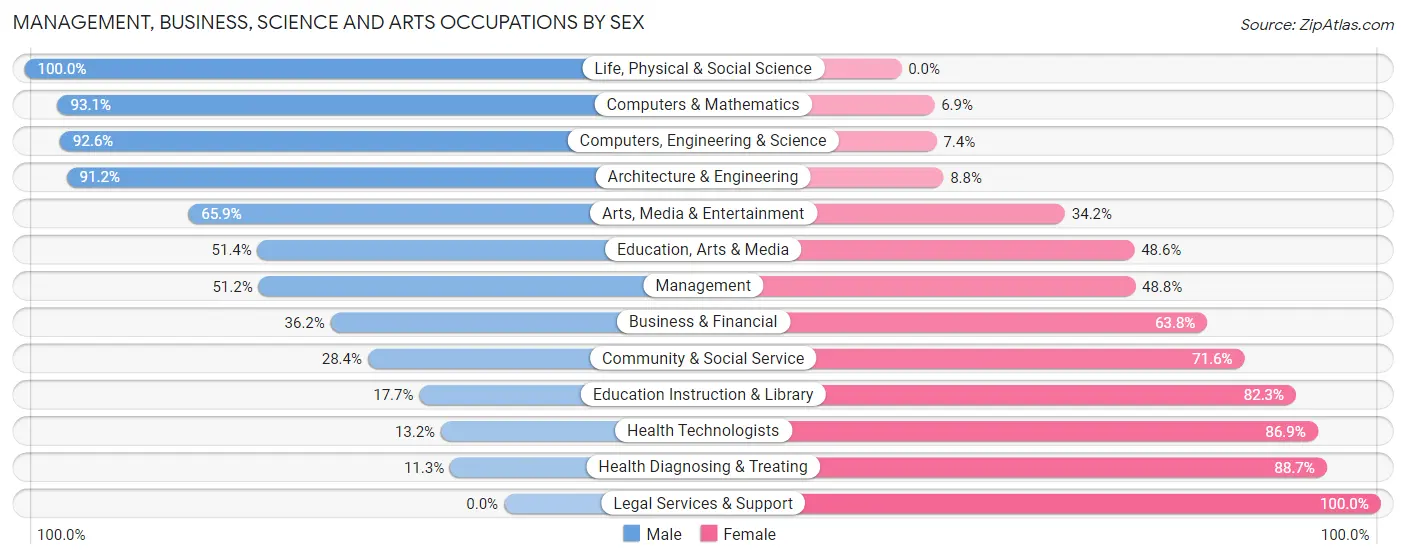
Management, Business, Science and Arts Occupations by Sex
Within the Management, Business, Science and Arts occupations in Rincon, the most male-oriented occupations are Life, Physical & Social Science (100.0%), Computers & Mathematics (93.1%), and Computers, Engineering & Science (92.6%), while the most female-oriented occupations are Legal Services & Support (100.0%), Health Diagnosing & Treating (88.7%), and Health Technologists (86.9%).
| Occupation | Male | Female |
| Management | 275 (51.2%) | 262 (48.8%) |
| Business & Financial | 85 (36.2%) | 150 (63.8%) |
| Computers, Engineering & Science | 352 (92.6%) | 28 (7.4%) |
| Computers & Mathematics | 135 (93.1%) | 10 (6.9%) |
| Architecture & Engineering | 187 (91.2%) | 18 (8.8%) |
| Life, Physical & Social Science | 30 (100.0%) | 0 (0.0%) |
| Community & Social Service | 102 (28.4%) | 257 (71.6%) |
| Education, Arts & Media | 37 (51.4%) | 35 (48.6%) |
| Legal Services & Support | 0 (0.0%) | 31 (100.0%) |
| Education Instruction & Library | 38 (17.7%) | 177 (82.3%) |
| Arts, Media & Entertainment | 27 (65.8%) | 14 (34.2%) |
| Health Diagnosing & Treating | 42 (11.3%) | 331 (88.7%) |
| Health Technologists | 38 (13.2%) | 251 (86.9%) |
| Total (Category) | 856 (45.4%) | 1,028 (54.6%) |
| Total (Overall) | 2,715 (52.1%) | 2,500 (47.9%) |
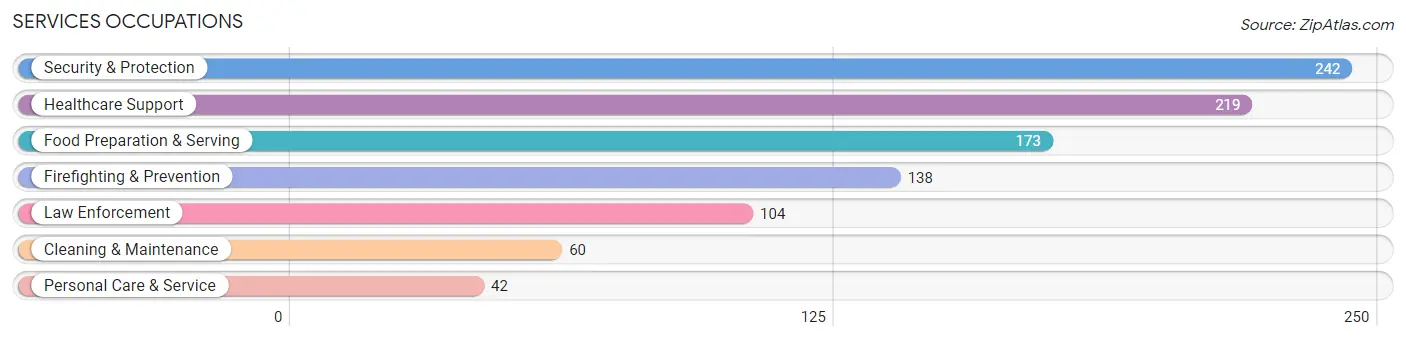
Services Occupations
The most common Services occupations in Rincon are Security & Protection (242 | 4.6%), Healthcare Support (219 | 4.2%), Food Preparation & Serving (173 | 3.3%), Firefighting & Prevention (138 | 2.6%), and Law Enforcement (104 | 2.0%).
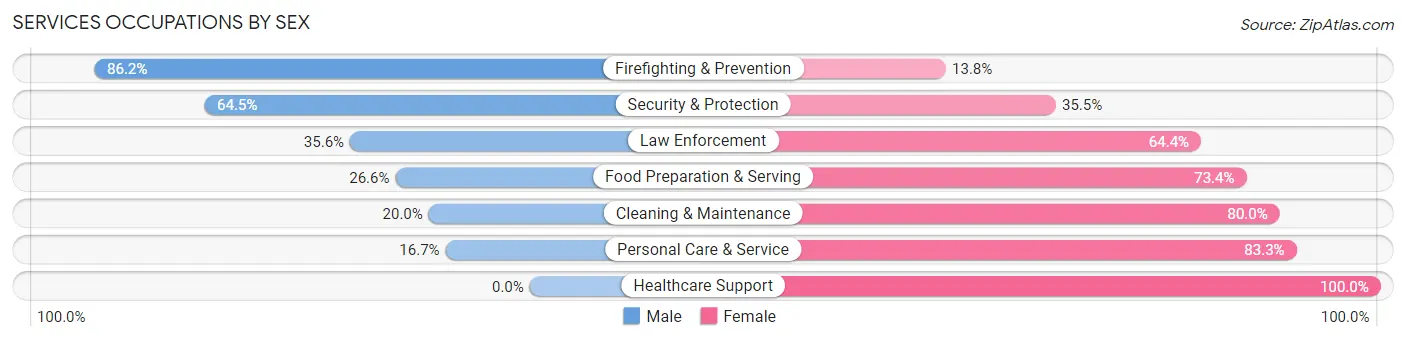
Services Occupations by Sex
Within the Services occupations in Rincon, the most male-oriented occupations are Firefighting & Prevention (86.2%), Security & Protection (64.5%), and Law Enforcement (35.6%), while the most female-oriented occupations are Healthcare Support (100.0%), Personal Care & Service (83.3%), and Cleaning & Maintenance (80.0%).
| Occupation | Male | Female |
| Healthcare Support | 0 (0.0%) | 219 (100.0%) |
| Security & Protection | 156 (64.5%) | 86 (35.5%) |
| Firefighting & Prevention | 119 (86.2%) | 19 (13.8%) |
| Law Enforcement | 37 (35.6%) | 67 (64.4%) |
| Food Preparation & Serving | 46 (26.6%) | 127 (73.4%) |
| Cleaning & Maintenance | 12 (20.0%) | 48 (80.0%) |
| Personal Care & Service | 7 (16.7%) | 35 (83.3%) |
| Total (Category) | 221 (30.0%) | 515 (70.0%) |
| Total (Overall) | 2,715 (52.1%) | 2,500 (47.9%) |
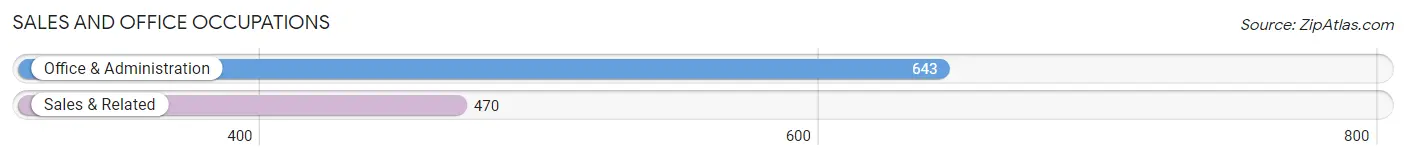
Sales and Office Occupations
The most common Sales and Office occupations in Rincon are Office & Administration (643 | 12.3%), and Sales & Related (470 | 9.0%).
Sales and Office Occupations by Sex
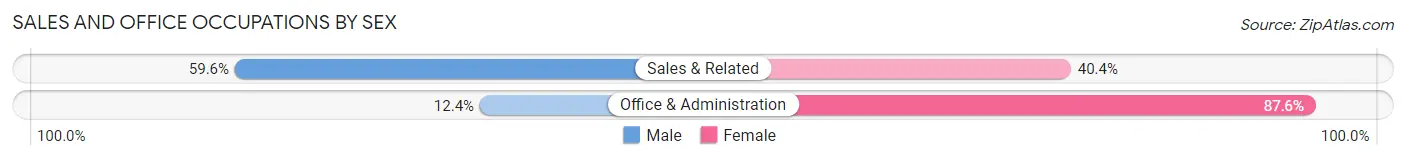
| Occupation | Male | Female |
| Sales & Related | 280 (59.6%) | 190 (40.4%) |
| Office & Administration | 80 (12.4%) | 563 (87.6%) |
| Total (Category) | 360 (32.4%) | 753 (67.6%) |
| Total (Overall) | 2,715 (52.1%) | 2,500 (47.9%) |
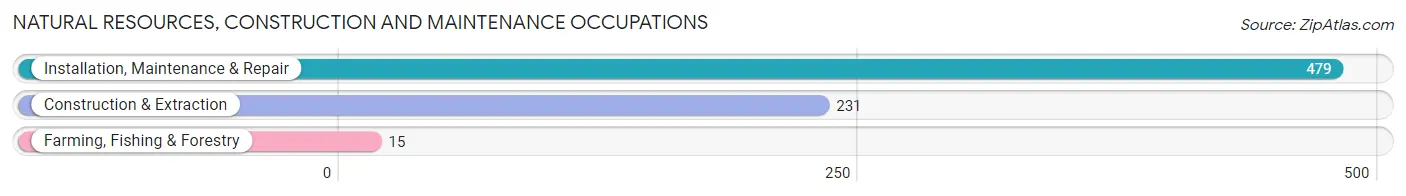
Natural Resources, Construction and Maintenance Occupations
The most common Natural Resources, Construction and Maintenance occupations in Rincon are Installation, Maintenance & Repair (479 | 9.2%), Construction & Extraction (231 | 4.4%), and Farming, Fishing & Forestry (15 | 0.3%).
Natural Resources, Construction and Maintenance Occupations by Sex
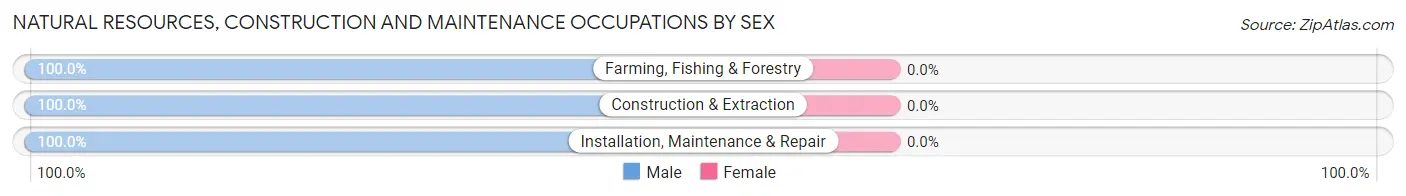
| Occupation | Male | Female |
| Farming, Fishing & Forestry | 15 (100.0%) | 0 (0.0%) |
| Construction & Extraction | 231 (100.0%) | 0 (0.0%) |
| Installation, Maintenance & Repair | 479 (100.0%) | 0 (0.0%) |
| Total (Category) | 725 (100.0%) | 0 (0.0%) |
| Total (Overall) | 2,715 (52.1%) | 2,500 (47.9%) |
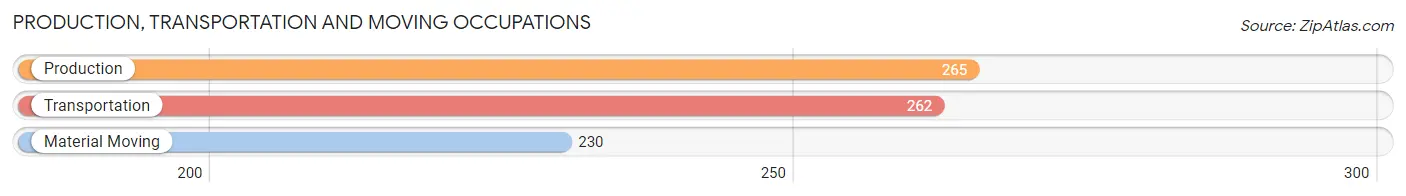
Production, Transportation and Moving Occupations
The most common Production, Transportation and Moving occupations in Rincon are Production (265 | 5.1%), Transportation (262 | 5.0%), and Material Moving (230 | 4.4%).
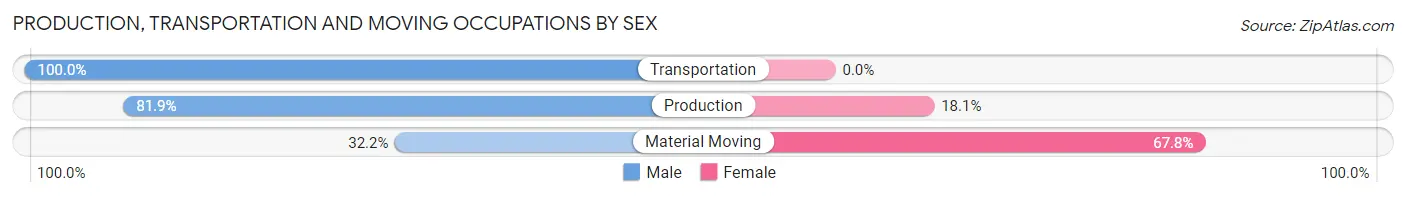
Production, Transportation and Moving Occupations by Sex
| Occupation | Male | Female |
| Production | 217 (81.9%) | 48 (18.1%) |
| Transportation | 262 (100.0%) | 0 (0.0%) |
| Material Moving | 74 (32.2%) | 156 (67.8%) |
| Total (Category) | 553 (73.1%) | 204 (27.0%) |
| Total (Overall) | 2,715 (52.1%) | 2,500 (47.9%) |
Employment Industries by Sex in Rincon
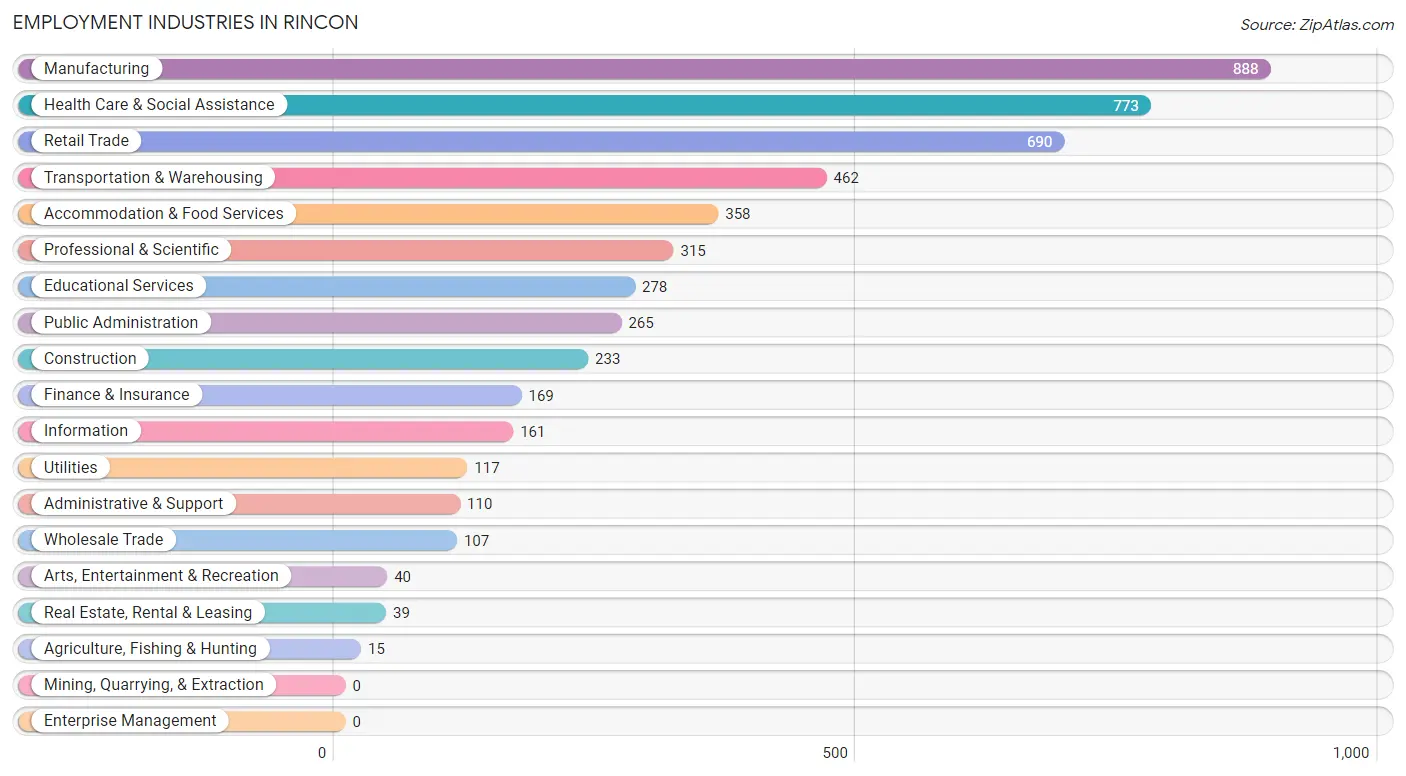
Employment Industries in Rincon
The major employment industries in Rincon include Manufacturing (888 | 17.0%), Health Care & Social Assistance (773 | 14.8%), Retail Trade (690 | 13.2%), Transportation & Warehousing (462 | 8.9%), and Accommodation & Food Services (358 | 6.9%).
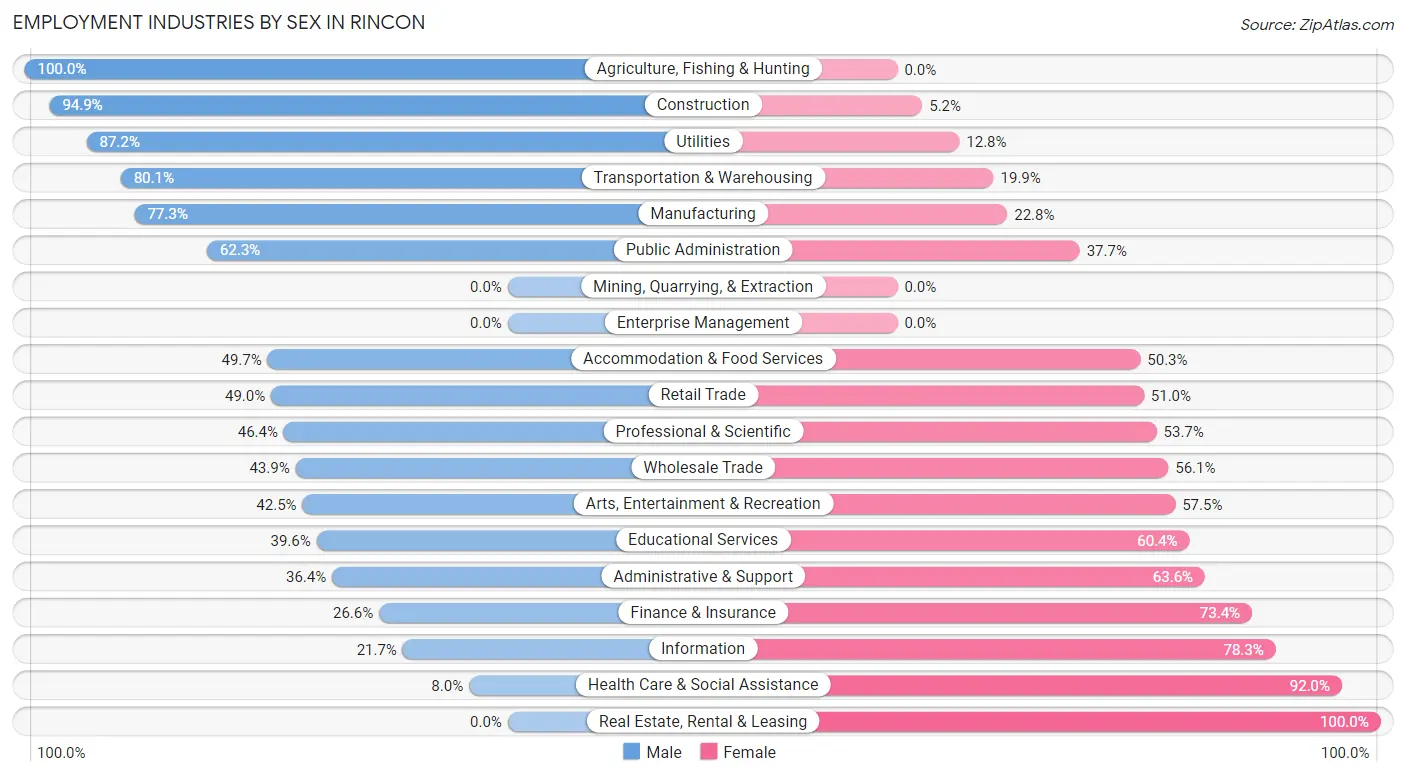
Employment Industries by Sex in Rincon
The Rincon industries that see more men than women are Agriculture, Fishing & Hunting (100.0%), Construction (94.9%), and Utilities (87.2%), whereas the industries that tend to have a higher number of women are Real Estate, Rental & Leasing (100.0%), Health Care & Social Assistance (92.0%), and Information (78.3%).
| Industry | Male | Female |
| Agriculture, Fishing & Hunting | 15 (100.0%) | 0 (0.0%) |
| Mining, Quarrying, & Extraction | 0 (0.0%) | 0 (0.0%) |
| Construction | 221 (94.9%) | 12 (5.1%) |
| Manufacturing | 686 (77.2%) | 202 (22.8%) |
| Wholesale Trade | 47 (43.9%) | 60 (56.1%) |
| Retail Trade | 338 (49.0%) | 352 (51.0%) |
| Transportation & Warehousing | 370 (80.1%) | 92 (19.9%) |
| Utilities | 102 (87.2%) | 15 (12.8%) |
| Information | 35 (21.7%) | 126 (78.3%) |
| Finance & Insurance | 45 (26.6%) | 124 (73.4%) |
| Real Estate, Rental & Leasing | 0 (0.0%) | 39 (100.0%) |
| Professional & Scientific | 146 (46.4%) | 169 (53.6%) |
| Enterprise Management | 0 (0.0%) | 0 (0.0%) |
| Administrative & Support | 40 (36.4%) | 70 (63.6%) |
| Educational Services | 110 (39.6%) | 168 (60.4%) |
| Health Care & Social Assistance | 62 (8.0%) | 711 (92.0%) |
| Arts, Entertainment & Recreation | 17 (42.5%) | 23 (57.5%) |
| Accommodation & Food Services | 178 (49.7%) | 180 (50.3%) |
| Public Administration | 165 (62.3%) | 100 (37.7%) |
| Total | 2,715 (52.1%) | 2,500 (47.9%) |
Education in Rincon
School Enrollment in Rincon
The most common levels of schooling among the 2,952 students in Rincon are elementary school (1,067 | 36.1%), middle school (719 | 24.4%), and high school (502 | 17.0%).
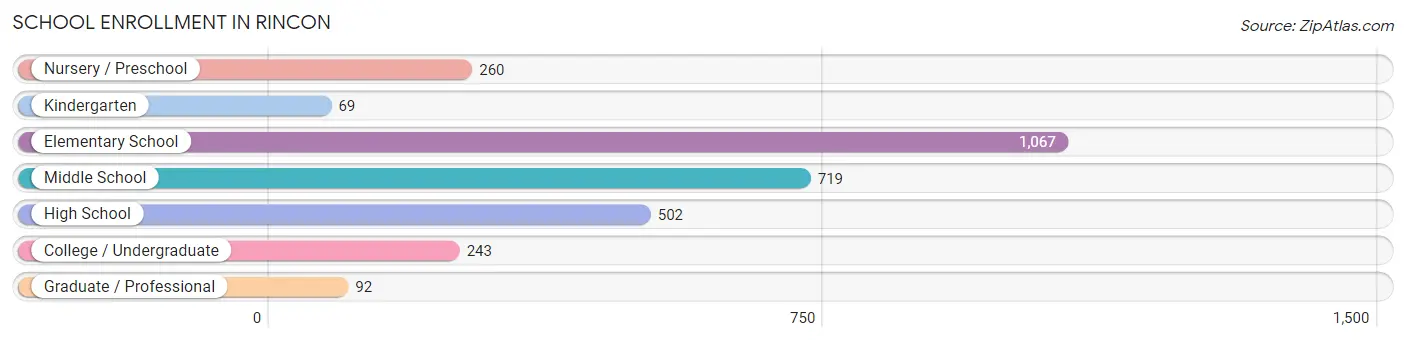
| School Level | # Students | % Students |
| Nursery / Preschool | 260 | 8.8% |
| Kindergarten | 69 | 2.3% |
| Elementary School | 1,067 | 36.1% |
| Middle School | 719 | 24.4% |
| High School | 502 | 17.0% |
| College / Undergraduate | 243 | 8.2% |
| Graduate / Professional | 92 | 3.1% |
| Total | 2,952 | 100.0% |
School Enrollment by Age by Funding Source in Rincon
Out of a total of 2,952 students who are enrolled in schools in Rincon, 269 (9.1%) attend a private institution, while the remaining 2,683 (90.9%) are enrolled in public schools. The age group of 3 to 4 year olds has the highest likelihood of being enrolled in private schools, with 116 (40.7% in the age bracket) enrolled. Conversely, the age group of 18 to 19 year olds has the lowest likelihood of being enrolled in a private school, with 41 (100.0% in the age bracket) attending a public institution.
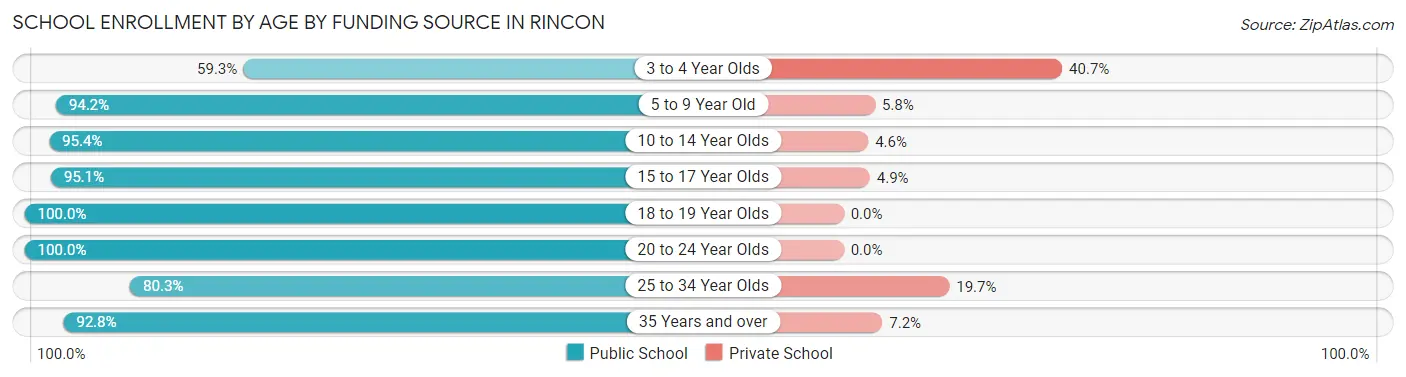
| Age Bracket | Public School | Private School |
| 3 to 4 Year Olds | 169 (59.3%) | 116 (40.7%) |
| 5 to 9 Year Old | 1,002 (94.2%) | 62 (5.8%) |
| 10 to 14 Year Olds | 750 (95.4%) | 36 (4.6%) |
| 15 to 17 Year Olds | 429 (95.1%) | 22 (4.9%) |
| 18 to 19 Year Olds | 41 (100.0%) | 0 (0.0%) |
| 20 to 24 Year Olds | 92 (100.0%) | 0 (0.0%) |
| 25 to 34 Year Olds | 98 (80.3%) | 24 (19.7%) |
| 35 Years and over | 103 (92.8%) | 8 (7.2%) |
| Total | 2,683 (90.9%) | 269 (9.1%) |
Educational Attainment by Field of Study in Rincon
Business (623 | 32.9%), education (307 | 16.2%), science & technology (285 | 15.1%), liberal arts & history (123 | 6.5%), and psychology (101 | 5.3%) are the most common fields of study among 1,892 individuals in Rincon who have obtained a bachelor's degree or higher.
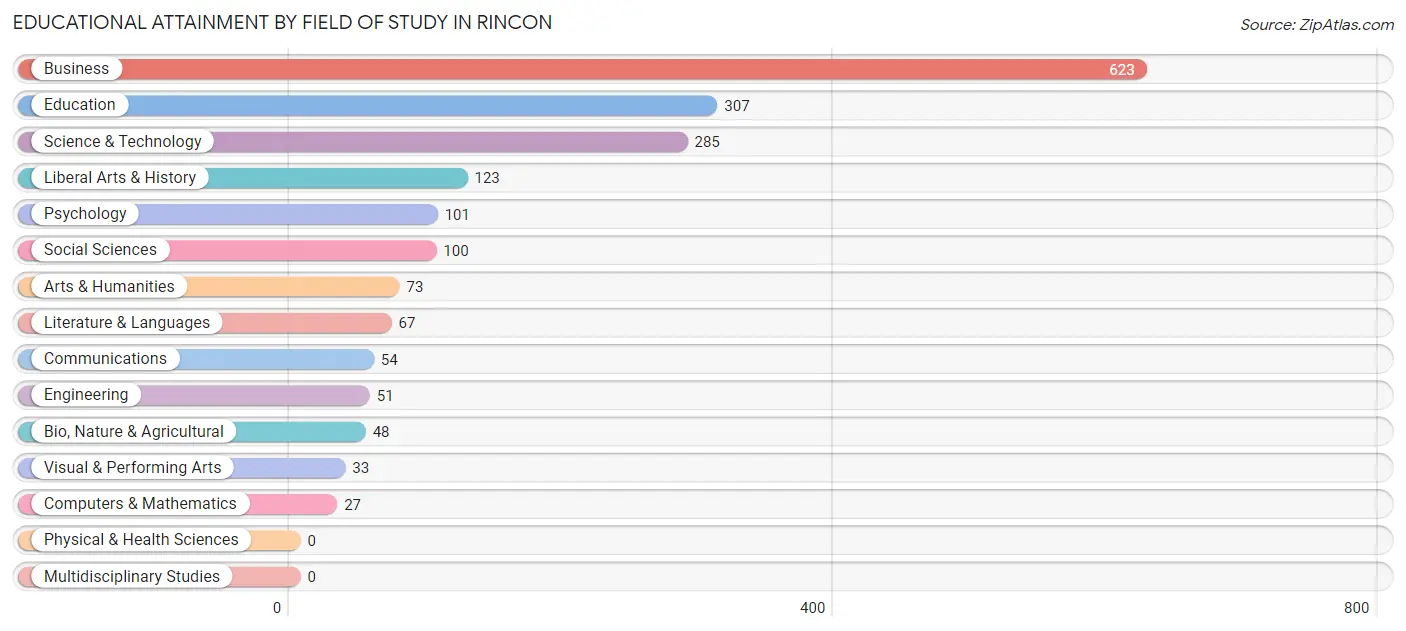
| Field of Study | # Graduates | % Graduates |
| Computers & Mathematics | 27 | 1.4% |
| Bio, Nature & Agricultural | 48 | 2.5% |
| Physical & Health Sciences | 0 | 0.0% |
| Psychology | 101 | 5.3% |
| Social Sciences | 100 | 5.3% |
| Engineering | 51 | 2.7% |
| Multidisciplinary Studies | 0 | 0.0% |
| Science & Technology | 285 | 15.1% |
| Business | 623 | 32.9% |
| Education | 307 | 16.2% |
| Literature & Languages | 67 | 3.5% |
| Liberal Arts & History | 123 | 6.5% |
| Visual & Performing Arts | 33 | 1.7% |
| Communications | 54 | 2.9% |
| Arts & Humanities | 73 | 3.9% |
| Total | 1,892 | 100.0% |
Transportation & Commute in Rincon
Vehicle Availability by Sex in Rincon
The most prevalent vehicle ownership categories in Rincon are males with 2 vehicles (1,494, accounting for 53.8%) and females with 2 vehicles (1,210, making up 60.0%).
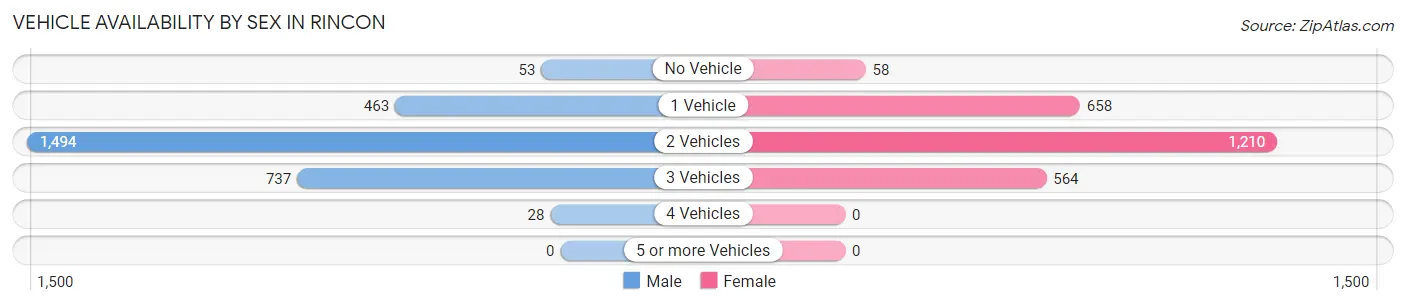
| Vehicles Available | Male | Female |
| No Vehicle | 53 (1.9%) | 58 (2.3%) |
| 1 Vehicle | 463 (16.7%) | 658 (26.4%) |
| 2 Vehicles | 1,494 (53.8%) | 1,210 (48.6%) |
| 3 Vehicles | 737 (26.6%) | 564 (22.7%) |
| 4 Vehicles | 28 (1.0%) | 0 (0.0%) |
| 5 or more Vehicles | 0 (0.0%) | 0 (0.0%) |
| Total | 2,775 (100.0%) | 2,490 (100.0%) |
Commute Time in Rincon
The most frequently occuring commute durations in Rincon are 30 to 34 minutes (963 commuters, 19.1%), 20 to 24 minutes (936 commuters, 18.6%), and 45 to 59 minutes (638 commuters, 12.7%).
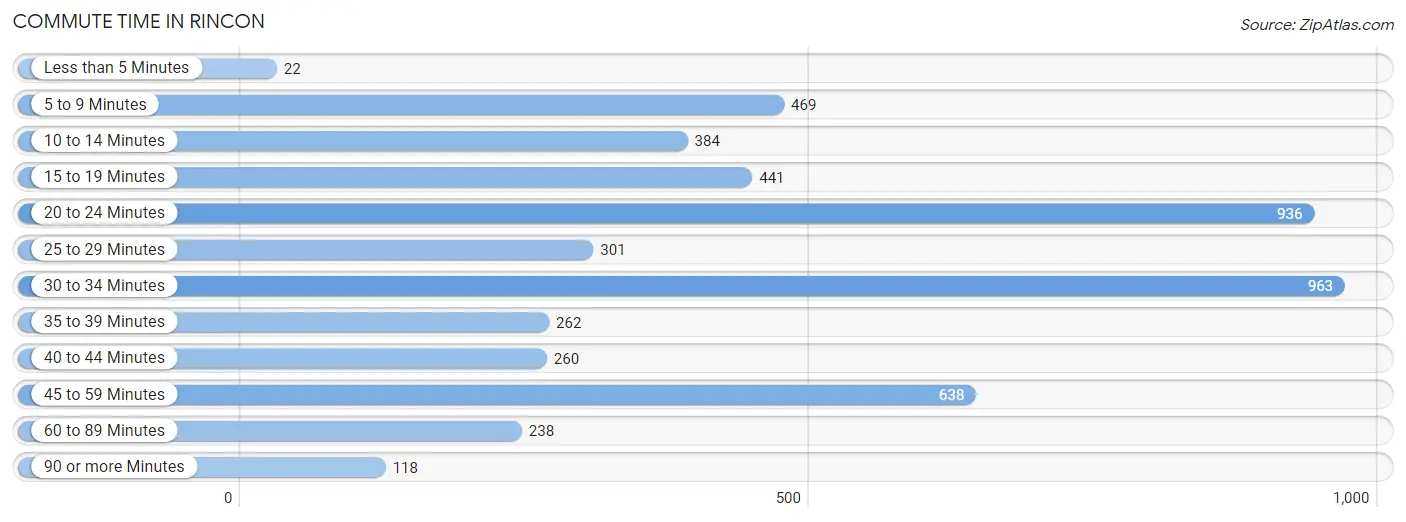
| Commute Time | # Commuters | % Commuters |
| Less than 5 Minutes | 22 | 0.4% |
| 5 to 9 Minutes | 469 | 9.3% |
| 10 to 14 Minutes | 384 | 7.6% |
| 15 to 19 Minutes | 441 | 8.8% |
| 20 to 24 Minutes | 936 | 18.6% |
| 25 to 29 Minutes | 301 | 6.0% |
| 30 to 34 Minutes | 963 | 19.1% |
| 35 to 39 Minutes | 262 | 5.2% |
| 40 to 44 Minutes | 260 | 5.2% |
| 45 to 59 Minutes | 638 | 12.7% |
| 60 to 89 Minutes | 238 | 4.7% |
| 90 or more Minutes | 118 | 2.3% |
Commute Time by Sex in Rincon
The most common commute times in Rincon are 20 to 24 minutes (684 commuters, 25.2%) for males and 5 to 9 minutes (401 commuters, 17.3%) for females.
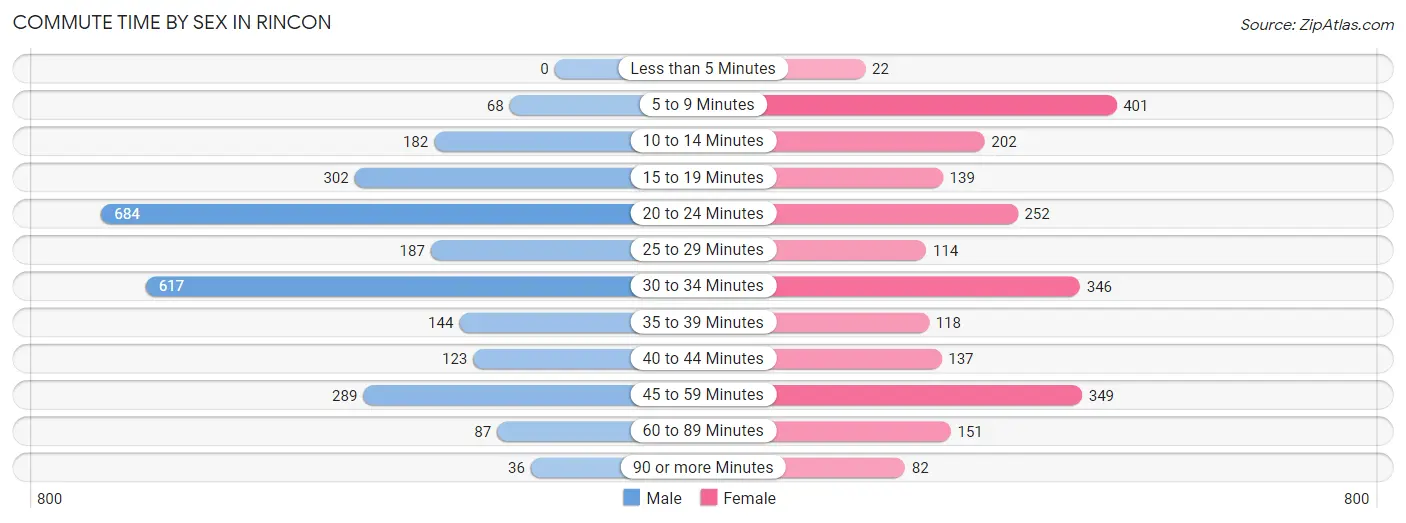
| Commute Time | Male | Female |
| Less than 5 Minutes | 0 (0.0%) | 22 (0.9%) |
| 5 to 9 Minutes | 68 (2.5%) | 401 (17.3%) |
| 10 to 14 Minutes | 182 (6.7%) | 202 (8.7%) |
| 15 to 19 Minutes | 302 (11.1%) | 139 (6.0%) |
| 20 to 24 Minutes | 684 (25.2%) | 252 (10.9%) |
| 25 to 29 Minutes | 187 (6.9%) | 114 (4.9%) |
| 30 to 34 Minutes | 617 (22.7%) | 346 (15.0%) |
| 35 to 39 Minutes | 144 (5.3%) | 118 (5.1%) |
| 40 to 44 Minutes | 123 (4.5%) | 137 (5.9%) |
| 45 to 59 Minutes | 289 (10.6%) | 349 (15.1%) |
| 60 to 89 Minutes | 87 (3.2%) | 151 (6.5%) |
| 90 or more Minutes | 36 (1.3%) | 82 (3.5%) |
Time of Departure to Work by Sex in Rincon
The most frequent times of departure to work in Rincon are 7:00 AM to 7:29 AM (494, 18.2%) for males and 6:30 AM to 6:59 AM (435, 18.8%) for females.
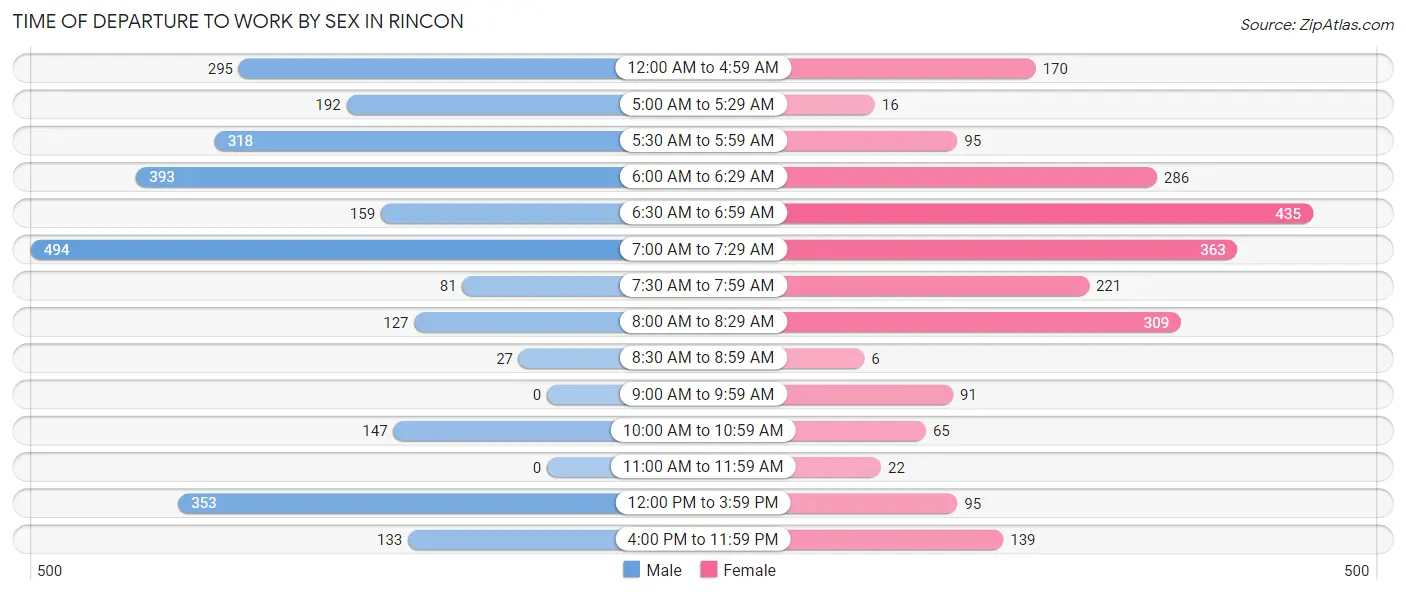
| Time of Departure | Male | Female |
| 12:00 AM to 4:59 AM | 295 (10.8%) | 170 (7.3%) |
| 5:00 AM to 5:29 AM | 192 (7.1%) | 16 (0.7%) |
| 5:30 AM to 5:59 AM | 318 (11.7%) | 95 (4.1%) |
| 6:00 AM to 6:29 AM | 393 (14.4%) | 286 (12.4%) |
| 6:30 AM to 6:59 AM | 159 (5.9%) | 435 (18.8%) |
| 7:00 AM to 7:29 AM | 494 (18.2%) | 363 (15.7%) |
| 7:30 AM to 7:59 AM | 81 (3.0%) | 221 (9.6%) |
| 8:00 AM to 8:29 AM | 127 (4.7%) | 309 (13.4%) |
| 8:30 AM to 8:59 AM | 27 (1.0%) | 6 (0.3%) |
| 9:00 AM to 9:59 AM | 0 (0.0%) | 91 (3.9%) |
| 10:00 AM to 10:59 AM | 147 (5.4%) | 65 (2.8%) |
| 11:00 AM to 11:59 AM | 0 (0.0%) | 22 (0.9%) |
| 12:00 PM to 3:59 PM | 353 (13.0%) | 95 (4.1%) |
| 4:00 PM to 11:59 PM | 133 (4.9%) | 139 (6.0%) |
| Total | 2,719 (100.0%) | 2,313 (100.0%) |
Housing Occupancy in Rincon
Occupancy by Ownership in Rincon
Of the total 4,339 dwellings in Rincon, owner-occupied units account for 2,439 (56.2%), while renter-occupied units make up 1,900 (43.8%).
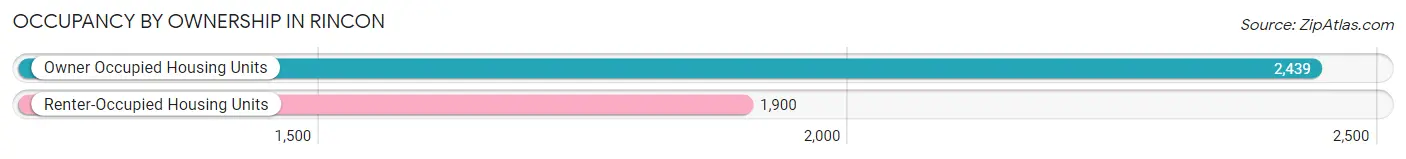
| Occupancy | # Housing Units | % Housing Units |
| Owner Occupied Housing Units | 2,439 | 56.2% |
| Renter-Occupied Housing Units | 1,900 | 43.8% |
| Total Occupied Housing Units | 4,339 | 100.0% |
Occupancy by Household Size in Rincon
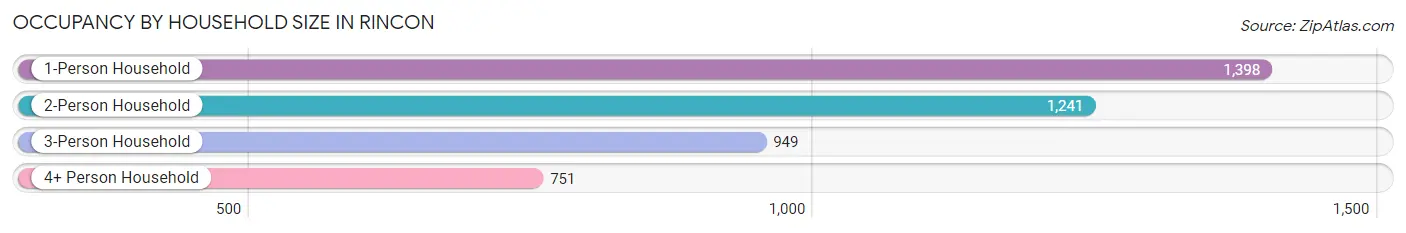
| Household Size | # Housing Units | % Housing Units |
| 1-Person Household | 1,398 | 32.2% |
| 2-Person Household | 1,241 | 28.6% |
| 3-Person Household | 949 | 21.9% |
| 4+ Person Household | 751 | 17.3% |
| Total Housing Units | 4,339 | 100.0% |
Occupancy by Ownership by Household Size in Rincon
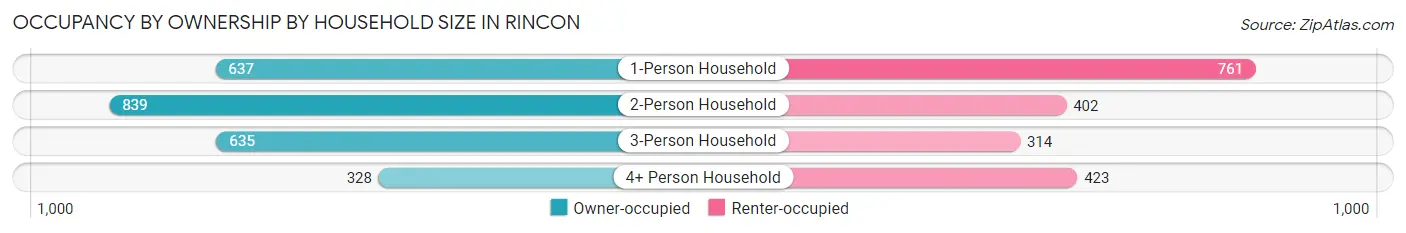
| Household Size | Owner-occupied | Renter-occupied |
| 1-Person Household | 637 (45.6%) | 761 (54.4%) |
| 2-Person Household | 839 (67.6%) | 402 (32.4%) |
| 3-Person Household | 635 (66.9%) | 314 (33.1%) |
| 4+ Person Household | 328 (43.7%) | 423 (56.3%) |
| Total Housing Units | 2,439 (56.2%) | 1,900 (43.8%) |
Occupancy by Educational Attainment in Rincon
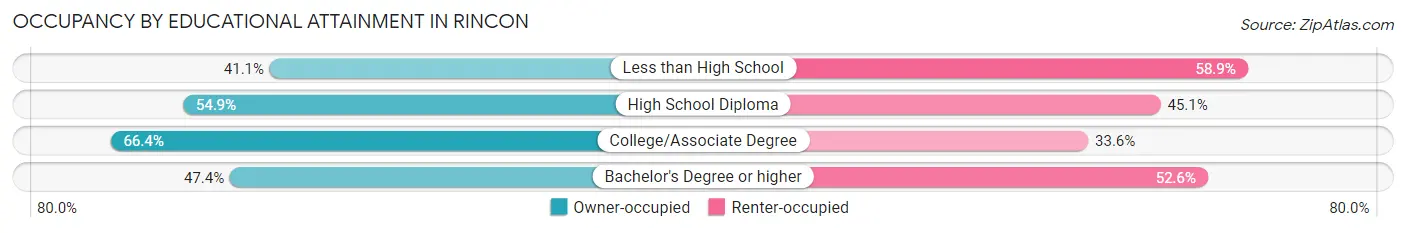
| Household Size | Owner-occupied | Renter-occupied |
| Less than High School | 127 (41.1%) | 182 (58.9%) |
| High School Diploma | 719 (54.9%) | 591 (45.1%) |
| College/Associate Degree | 1,062 (66.4%) | 538 (33.6%) |
| Bachelor's Degree or higher | 531 (47.4%) | 589 (52.6%) |
Occupancy by Age of Householder in Rincon
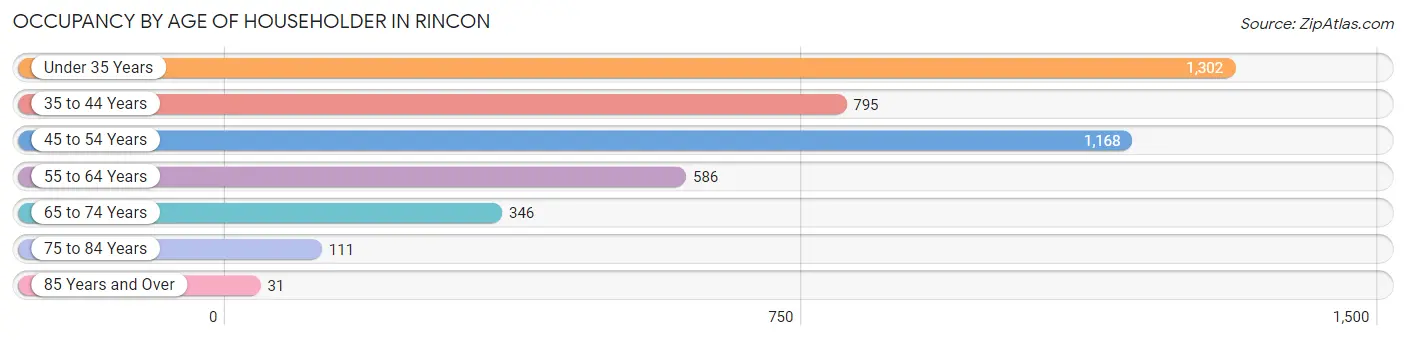
| Age Bracket | # Households | % Households |
| Under 35 Years | 1,302 | 30.0% |
| 35 to 44 Years | 795 | 18.3% |
| 45 to 54 Years | 1,168 | 26.9% |
| 55 to 64 Years | 586 | 13.5% |
| 65 to 74 Years | 346 | 8.0% |
| 75 to 84 Years | 111 | 2.6% |
| 85 Years and Over | 31 | 0.7% |
| Total | 4,339 | 100.0% |
Housing Finances in Rincon
Median Income by Occupancy in Rincon
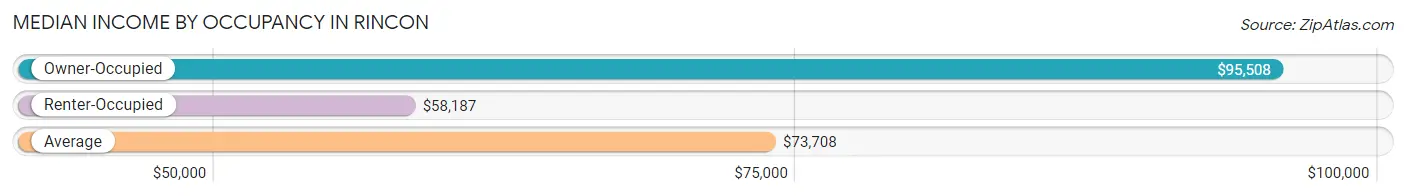
| Occupancy Type | # Households | Median Income |
| Owner-Occupied | 2,439 (56.2%) | $95,508 |
| Renter-Occupied | 1,900 (43.8%) | $58,187 |
| Average | 4,339 (100.0%) | $73,708 |
Occupancy by Householder Income Bracket in Rincon
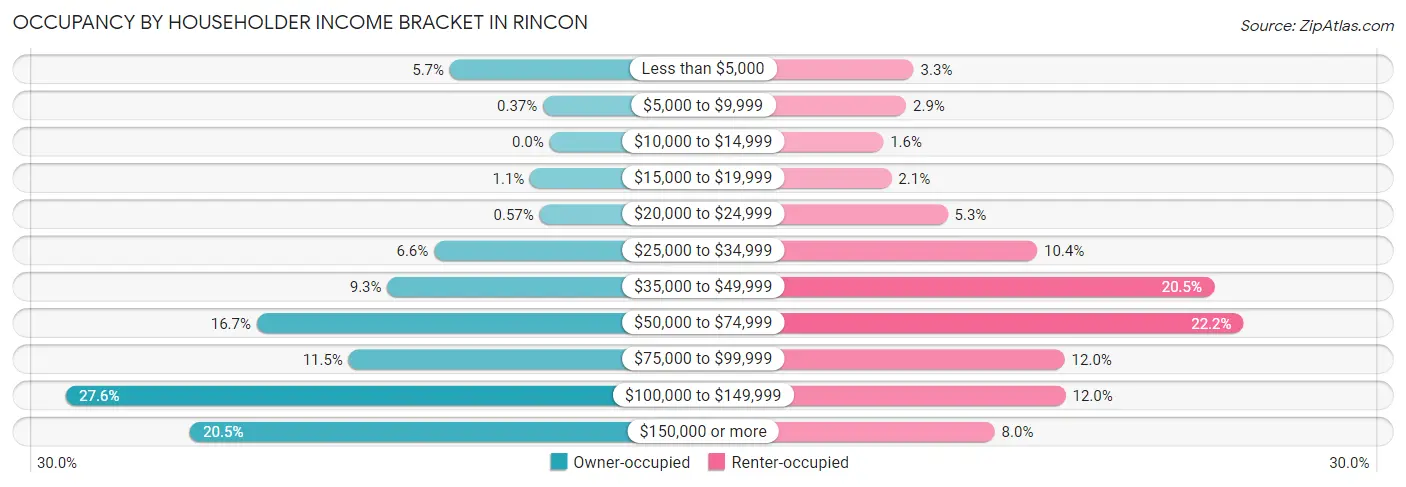
| Income Bracket | Owner-occupied | Renter-occupied |
| Less than $5,000 | 139 (5.7%) | 63 (3.3%) |
| $5,000 to $9,999 | 9 (0.4%) | 55 (2.9%) |
| $10,000 to $14,999 | 0 (0.0%) | 30 (1.6%) |
| $15,000 to $19,999 | 27 (1.1%) | 39 (2.1%) |
| $20,000 to $24,999 | 14 (0.6%) | 100 (5.3%) |
| $25,000 to $34,999 | 161 (6.6%) | 197 (10.4%) |
| $35,000 to $49,999 | 226 (9.3%) | 389 (20.5%) |
| $50,000 to $74,999 | 408 (16.7%) | 421 (22.2%) |
| $75,000 to $99,999 | 280 (11.5%) | 227 (11.9%) |
| $100,000 to $149,999 | 674 (27.6%) | 228 (12.0%) |
| $150,000 or more | 501 (20.5%) | 151 (8.0%) |
| Total | 2,439 (100.0%) | 1,900 (100.0%) |
Monthly Housing Cost Tiers in Rincon
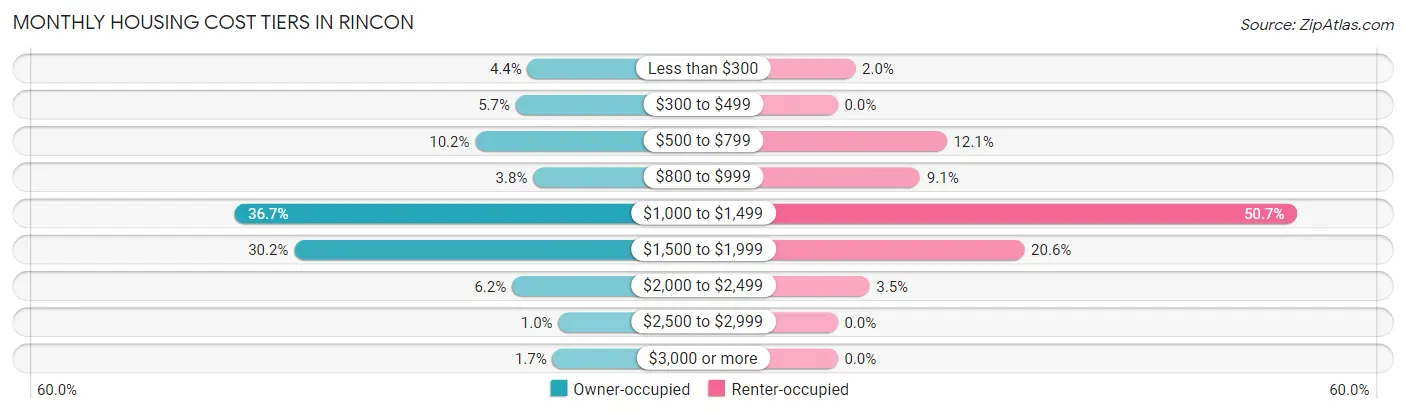
| Monthly Cost | Owner-occupied | Renter-occupied |
| Less than $300 | 108 (4.4%) | 37 (1.9%) |
| $300 to $499 | 140 (5.7%) | 0 (0.0%) |
| $500 to $799 | 249 (10.2%) | 229 (12.0%) |
| $800 to $999 | 93 (3.8%) | 173 (9.1%) |
| $1,000 to $1,499 | 896 (36.7%) | 963 (50.7%) |
| $1,500 to $1,999 | 737 (30.2%) | 392 (20.6%) |
| $2,000 to $2,499 | 150 (6.1%) | 67 (3.5%) |
| $2,500 to $2,999 | 25 (1.0%) | 0 (0.0%) |
| $3,000 or more | 41 (1.7%) | 0 (0.0%) |
| Total | 2,439 (100.0%) | 1,900 (100.0%) |
Physical Housing Characteristics in Rincon
Housing Structures in Rincon
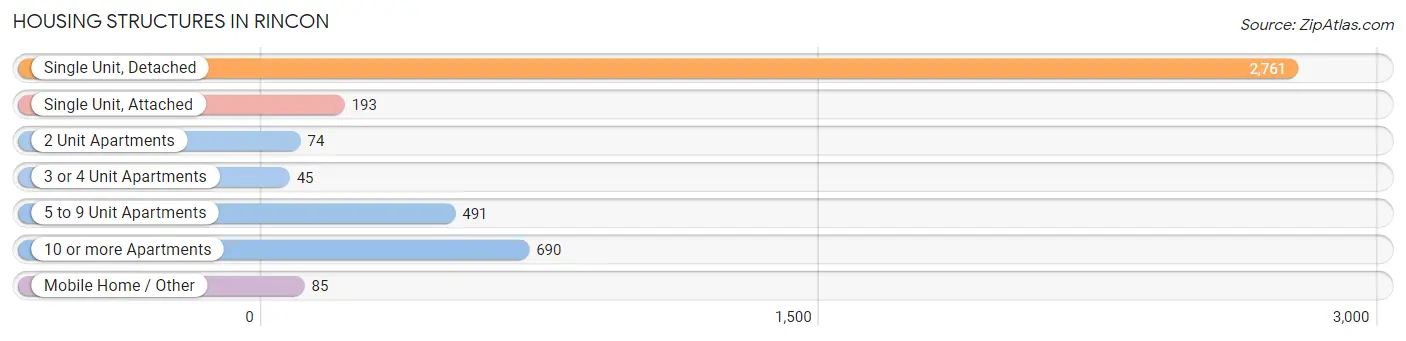
| Structure Type | # Housing Units | % Housing Units |
| Single Unit, Detached | 2,761 | 63.6% |
| Single Unit, Attached | 193 | 4.4% |
| 2 Unit Apartments | 74 | 1.7% |
| 3 or 4 Unit Apartments | 45 | 1.0% |
| 5 to 9 Unit Apartments | 491 | 11.3% |
| 10 or more Apartments | 690 | 15.9% |
| Mobile Home / Other | 85 | 2.0% |
| Total | 4,339 | 100.0% |
Housing Structures by Occupancy in Rincon
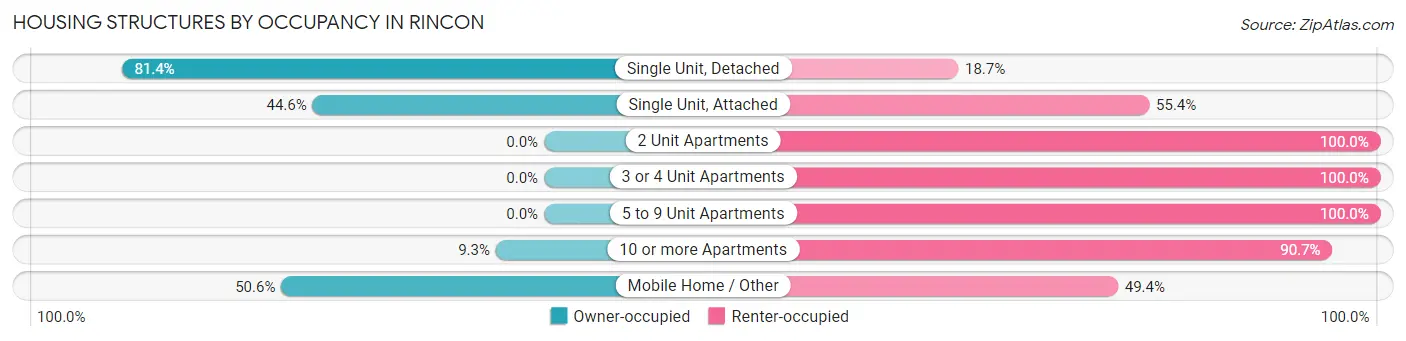
| Structure Type | Owner-occupied | Renter-occupied |
| Single Unit, Detached | 2,246 (81.4%) | 515 (18.6%) |
| Single Unit, Attached | 86 (44.6%) | 107 (55.4%) |
| 2 Unit Apartments | 0 (0.0%) | 74 (100.0%) |
| 3 or 4 Unit Apartments | 0 (0.0%) | 45 (100.0%) |
| 5 to 9 Unit Apartments | 0 (0.0%) | 491 (100.0%) |
| 10 or more Apartments | 64 (9.3%) | 626 (90.7%) |
| Mobile Home / Other | 43 (50.6%) | 42 (49.4%) |
| Total | 2,439 (56.2%) | 1,900 (43.8%) |
Housing Structures by Number of Rooms in Rincon
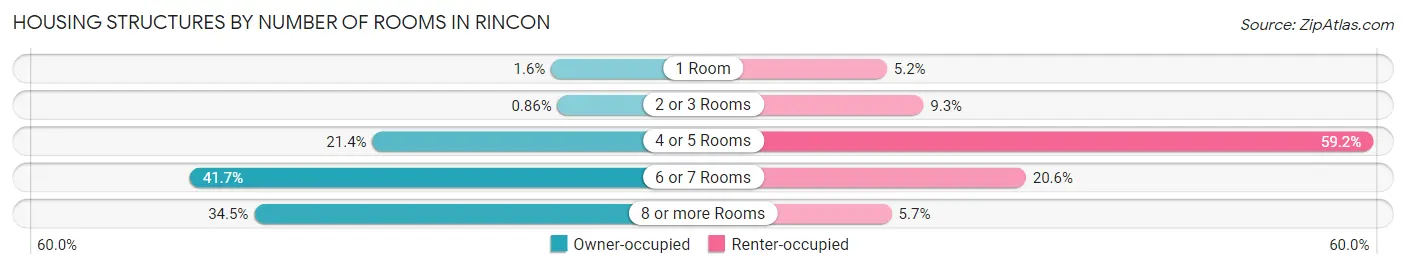
| Number of Rooms | Owner-occupied | Renter-occupied |
| 1 Room | 38 (1.6%) | 99 (5.2%) |
| 2 or 3 Rooms | 21 (0.9%) | 176 (9.3%) |
| 4 or 5 Rooms | 522 (21.4%) | 1,124 (59.2%) |
| 6 or 7 Rooms | 1,016 (41.7%) | 392 (20.6%) |
| 8 or more Rooms | 842 (34.5%) | 109 (5.7%) |
| Total | 2,439 (100.0%) | 1,900 (100.0%) |
Housing Structure by Heating Type in Rincon
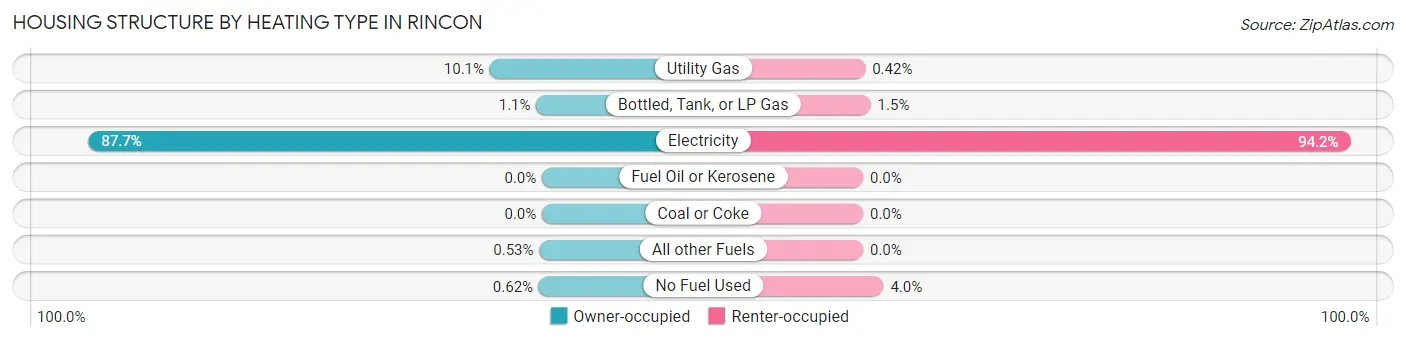
| Heating Type | Owner-occupied | Renter-occupied |
| Utility Gas | 246 (10.1%) | 8 (0.4%) |
| Bottled, Tank, or LP Gas | 27 (1.1%) | 28 (1.5%) |
| Electricity | 2,138 (87.7%) | 1,789 (94.2%) |
| Fuel Oil or Kerosene | 0 (0.0%) | 0 (0.0%) |
| Coal or Coke | 0 (0.0%) | 0 (0.0%) |
| All other Fuels | 13 (0.5%) | 0 (0.0%) |
| No Fuel Used | 15 (0.6%) | 75 (4.0%) |
| Total | 2,439 (100.0%) | 1,900 (100.0%) |
Household Vehicle Usage in Rincon
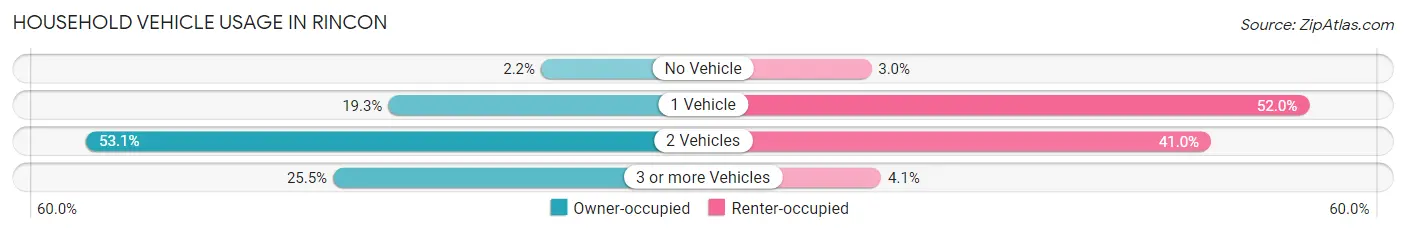
| Vehicles per Household | Owner-occupied | Renter-occupied |
| No Vehicle | 53 (2.2%) | 56 (2.9%) |
| 1 Vehicle | 470 (19.3%) | 988 (52.0%) |
| 2 Vehicles | 1,295 (53.1%) | 779 (41.0%) |
| 3 or more Vehicles | 621 (25.5%) | 77 (4.1%) |
| Total | 2,439 (100.0%) | 1,900 (100.0%) |
Real Estate & Mortgages in Rincon
Real Estate and Mortgage Overview in Rincon
| Characteristic | Without Mortgage | With Mortgage |
| Housing Units | 496 | 1,943 |
| Median Property Value | $178,300 | $226,600 |
| Median Household Income | - | - |
| Monthly Housing Costs | $586 | $41 |
| Real Estate Taxes | $1,662 | $75 |
Property Value by Mortgage Status in Rincon
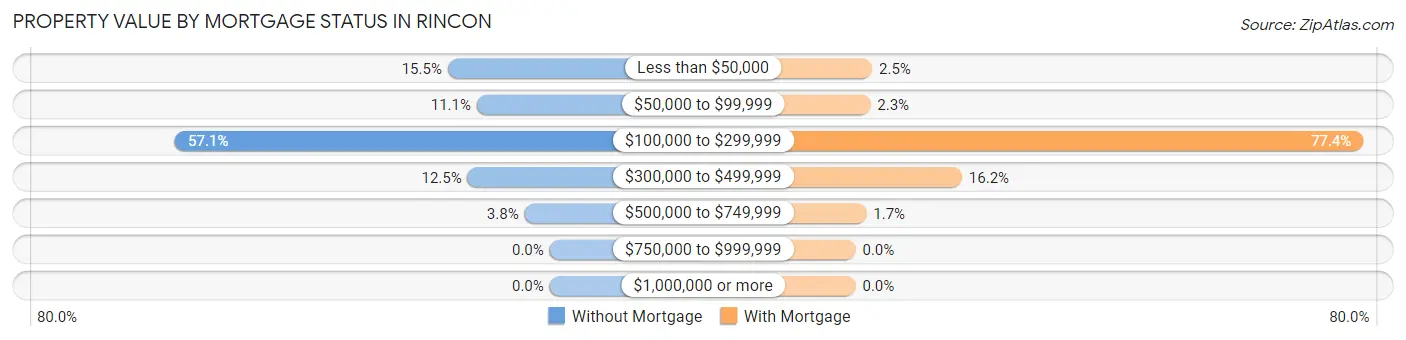
| Property Value | Without Mortgage | With Mortgage |
| Less than $50,000 | 77 (15.5%) | 49 (2.5%) |
| $50,000 to $99,999 | 55 (11.1%) | 44 (2.3%) |
| $100,000 to $299,999 | 283 (57.1%) | 1,503 (77.3%) |
| $300,000 to $499,999 | 62 (12.5%) | 315 (16.2%) |
| $500,000 to $749,999 | 19 (3.8%) | 32 (1.7%) |
| $750,000 to $999,999 | 0 (0.0%) | 0 (0.0%) |
| $1,000,000 or more | 0 (0.0%) | 0 (0.0%) |
| Total | 496 (100.0%) | 1,943 (100.0%) |
Household Income by Mortgage Status in Rincon
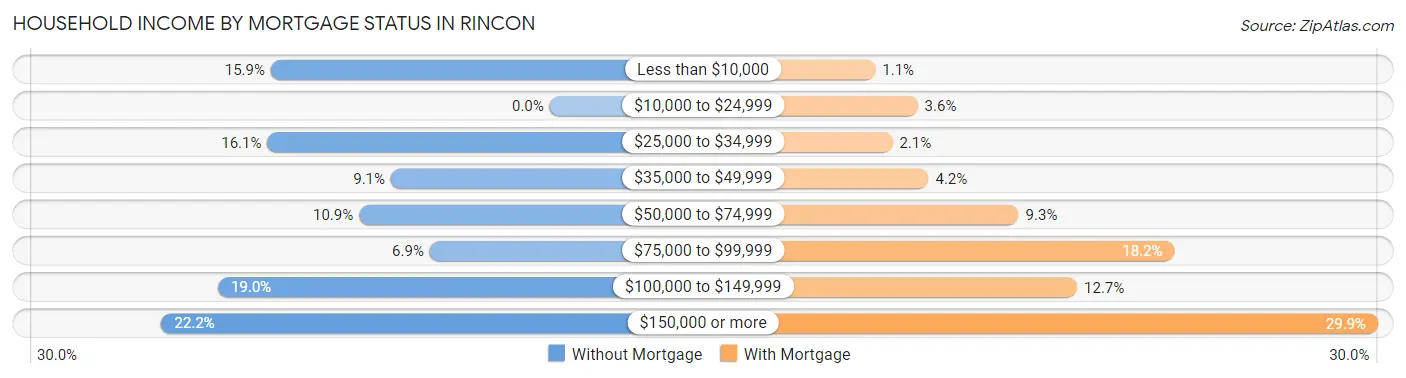
| Household Income | Without Mortgage | With Mortgage |
| Less than $10,000 | 79 (15.9%) | 22 (1.1%) |
| $10,000 to $24,999 | 0 (0.0%) | 69 (3.5%) |
| $25,000 to $34,999 | 80 (16.1%) | 41 (2.1%) |
| $35,000 to $49,999 | 45 (9.1%) | 81 (4.2%) |
| $50,000 to $74,999 | 54 (10.9%) | 181 (9.3%) |
| $75,000 to $99,999 | 34 (6.9%) | 354 (18.2%) |
| $100,000 to $149,999 | 94 (19.0%) | 246 (12.7%) |
| $150,000 or more | 110 (22.2%) | 580 (29.8%) |
| Total | 496 (100.0%) | 1,943 (100.0%) |
Property Value to Household Income Ratio in Rincon
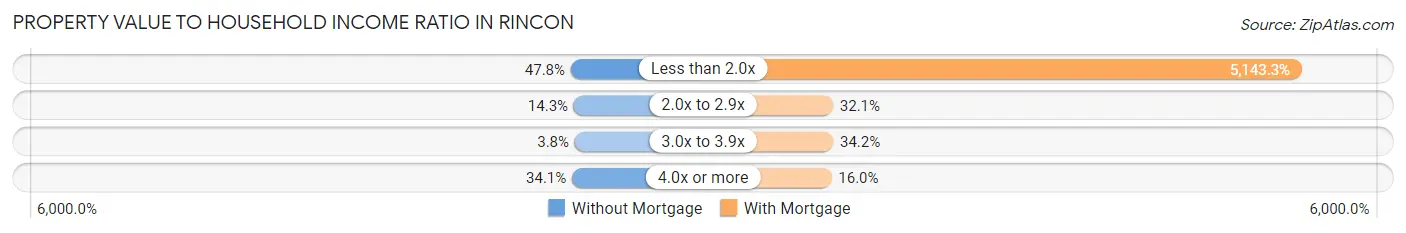
| Value-to-Income Ratio | Without Mortgage | With Mortgage |
| Less than 2.0x | 237 (47.8%) | 99,934 (5,143.3%) |
| 2.0x to 2.9x | 71 (14.3%) | 624 (32.1%) |
| 3.0x to 3.9x | 19 (3.8%) | 664 (34.2%) |
| 4.0x or more | 169 (34.1%) | 310 (16.0%) |
| Total | 496 (100.0%) | 1,943 (100.0%) |
Real Estate Taxes by Mortgage Status in Rincon
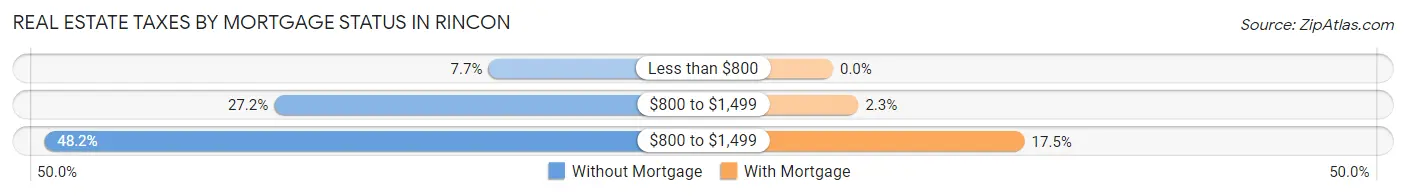
| Property Taxes | Without Mortgage | With Mortgage |
| Less than $800 | 38 (7.7%) | 0 (0.0%) |
| $800 to $1,499 | 135 (27.2%) | 45 (2.3%) |
| $800 to $1,499 | 239 (48.2%) | 340 (17.5%) |
| Total | 496 (100.0%) | 1,943 (100.0%) |
Health & Disability in Rincon
Health Insurance Coverage by Age in Rincon
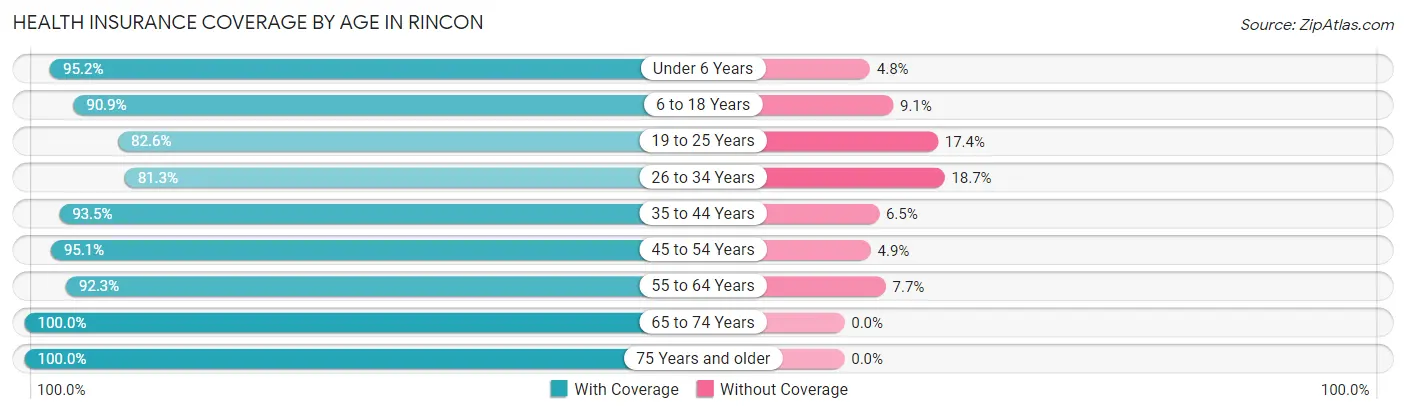
| Age Bracket | With Coverage | Without Coverage |
| Under 6 Years | 921 (95.2%) | 46 (4.8%) |
| 6 to 18 Years | 2,161 (90.9%) | 216 (9.1%) |
| 19 to 25 Years | 616 (82.6%) | 130 (17.4%) |
| 26 to 34 Years | 1,663 (81.3%) | 382 (18.7%) |
| 35 to 44 Years | 1,259 (93.5%) | 87 (6.5%) |
| 45 to 54 Years | 1,551 (95.1%) | 80 (4.9%) |
| 55 to 64 Years | 875 (92.3%) | 73 (7.7%) |
| 65 to 74 Years | 466 (100.0%) | 0 (0.0%) |
| 75 Years and older | 283 (100.0%) | 0 (0.0%) |
| Total | 9,795 (90.6%) | 1,014 (9.4%) |
Health Insurance Coverage by Citizenship Status in Rincon
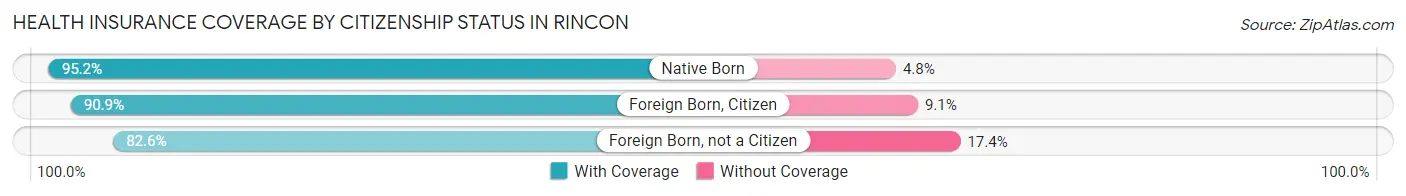
| Citizenship Status | With Coverage | Without Coverage |
| Native Born | 921 (95.2%) | 46 (4.8%) |
| Foreign Born, Citizen | 2,161 (90.9%) | 216 (9.1%) |
| Foreign Born, not a Citizen | 616 (82.6%) | 130 (17.4%) |
Health Insurance Coverage by Household Income in Rincon
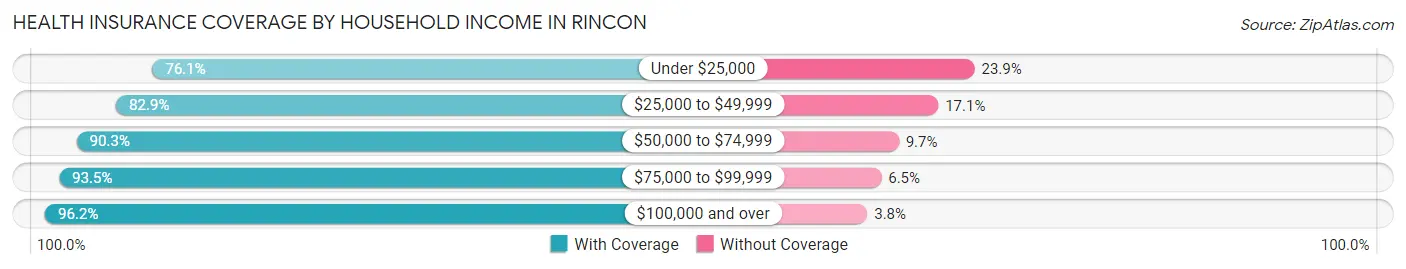
| Household Income | With Coverage | Without Coverage |
| Under $25,000 | 677 (76.1%) | 213 (23.9%) |
| $25,000 to $49,999 | 1,514 (82.9%) | 313 (17.1%) |
| $50,000 to $74,999 | 2,180 (90.3%) | 235 (9.7%) |
| $75,000 to $99,999 | 1,246 (93.5%) | 86 (6.5%) |
| $100,000 and over | 4,178 (96.2%) | 167 (3.8%) |
Public vs Private Health Insurance Coverage by Age in Rincon
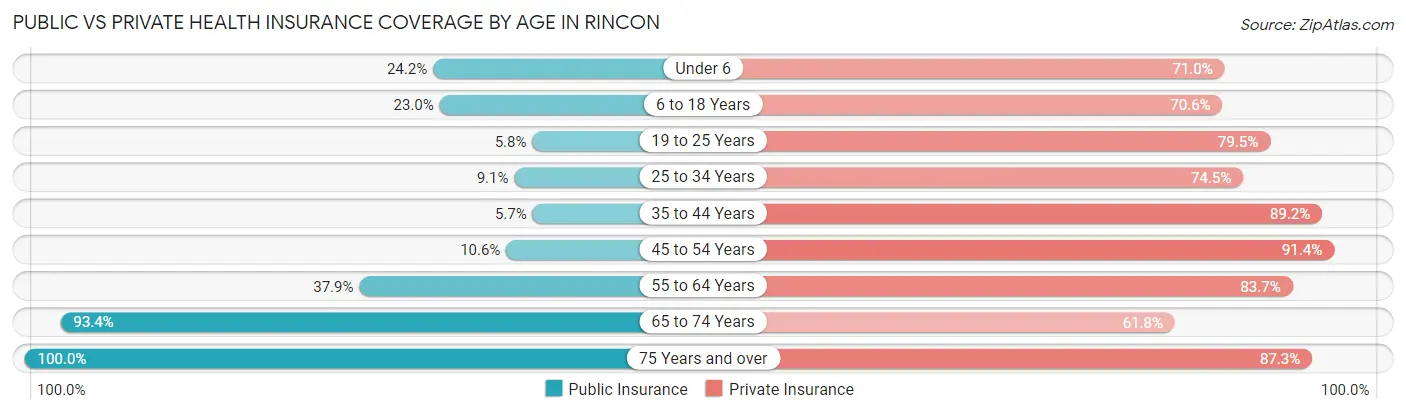
| Age Bracket | Public Insurance | Private Insurance |
| Under 6 | 234 (24.2%) | 687 (71.0%) |
| 6 to 18 Years | 546 (23.0%) | 1,679 (70.6%) |
| 19 to 25 Years | 43 (5.8%) | 593 (79.5%) |
| 25 to 34 Years | 186 (9.1%) | 1,523 (74.5%) |
| 35 to 44 Years | 77 (5.7%) | 1,200 (89.1%) |
| 45 to 54 Years | 173 (10.6%) | 1,490 (91.3%) |
| 55 to 64 Years | 359 (37.9%) | 793 (83.7%) |
| 65 to 74 Years | 435 (93.3%) | 288 (61.8%) |
| 75 Years and over | 283 (100.0%) | 247 (87.3%) |
| Total | 2,336 (21.6%) | 8,500 (78.6%) |
Disability Status by Sex by Age in Rincon
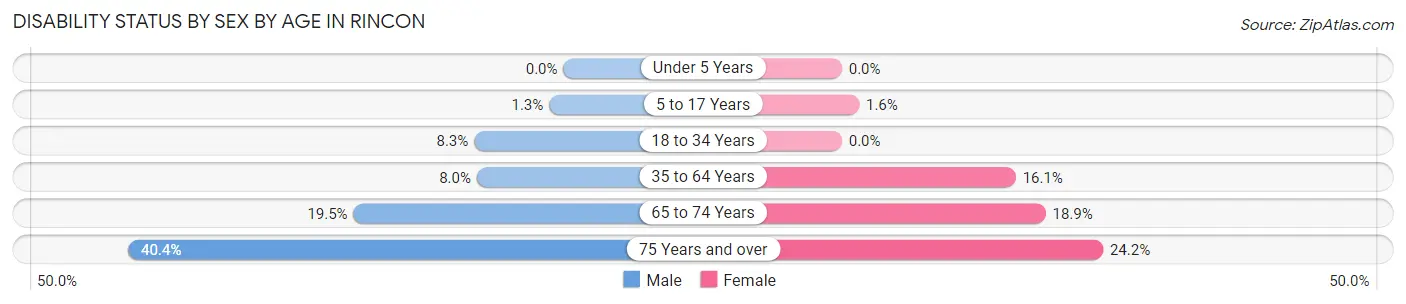
| Age Bracket | Male | Female |
| Under 5 Years | 0 (0.0%) | 0 (0.0%) |
| 5 to 17 Years | 20 (1.3%) | 13 (1.6%) |
| 18 to 34 Years | 124 (8.3%) | 0 (0.0%) |
| 35 to 64 Years | 157 (8.0%) | 318 (16.1%) |
| 65 to 74 Years | 30 (19.5%) | 59 (18.9%) |
| 75 Years and over | 61 (40.4%) | 32 (24.2%) |
Disability Class by Sex by Age in Rincon
Disability Class: Hearing Difficulty
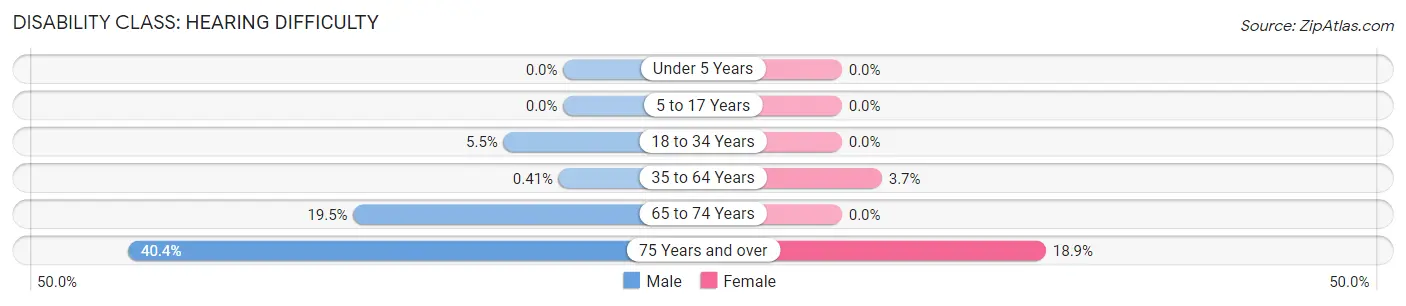
| Age Bracket | Male | Female |
| Under 5 Years | 0 (0.0%) | 0 (0.0%) |
| 5 to 17 Years | 0 (0.0%) | 0 (0.0%) |
| 18 to 34 Years | 83 (5.5%) | 0 (0.0%) |
| 35 to 64 Years | 8 (0.4%) | 73 (3.7%) |
| 65 to 74 Years | 30 (19.5%) | 0 (0.0%) |
| 75 Years and over | 61 (40.4%) | 25 (18.9%) |
Disability Class: Vision Difficulty
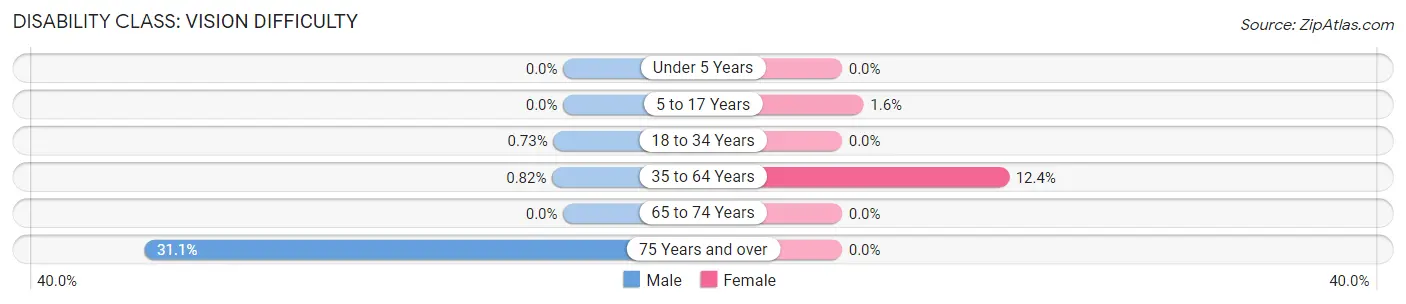
| Age Bracket | Male | Female |
| Under 5 Years | 0 (0.0%) | 0 (0.0%) |
| 5 to 17 Years | 0 (0.0%) | 13 (1.6%) |
| 18 to 34 Years | 11 (0.7%) | 0 (0.0%) |
| 35 to 64 Years | 16 (0.8%) | 244 (12.4%) |
| 65 to 74 Years | 0 (0.0%) | 0 (0.0%) |
| 75 Years and over | 47 (31.1%) | 0 (0.0%) |
Disability Class: Cognitive Difficulty
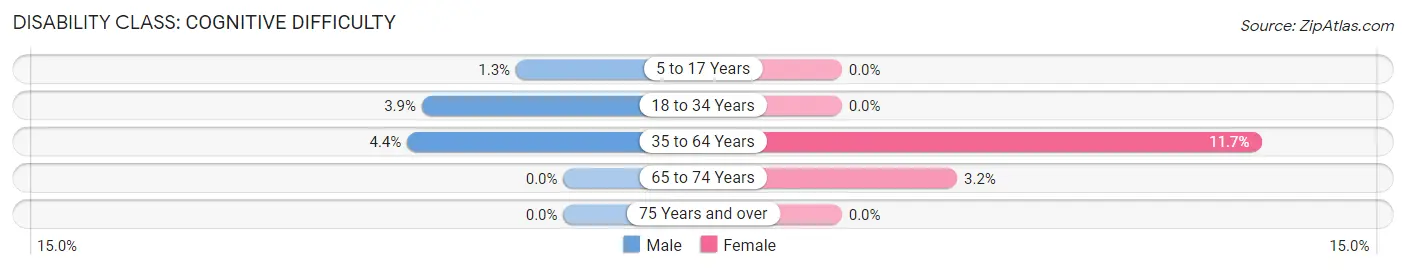
| Age Bracket | Male | Female |
| 5 to 17 Years | 20 (1.3%) | 0 (0.0%) |
| 18 to 34 Years | 59 (3.9%) | 0 (0.0%) |
| 35 to 64 Years | 85 (4.3%) | 230 (11.7%) |
| 65 to 74 Years | 0 (0.0%) | 10 (3.2%) |
| 75 Years and over | 0 (0.0%) | 0 (0.0%) |
Disability Class: Ambulatory Difficulty
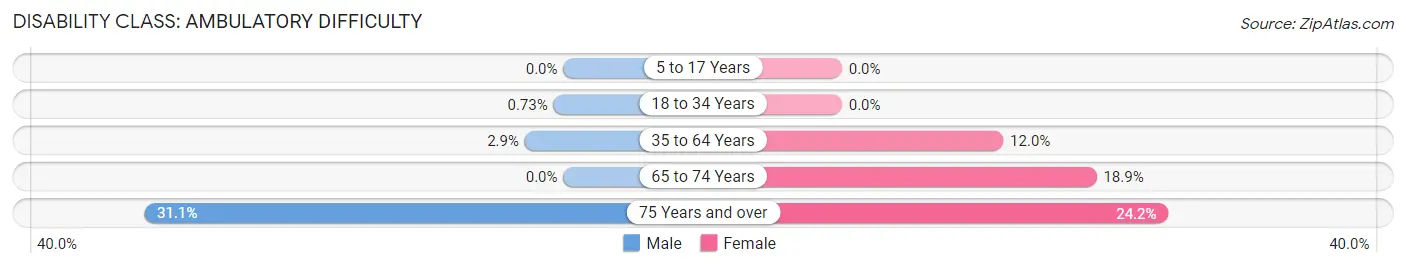
| Age Bracket | Male | Female |
| 5 to 17 Years | 0 (0.0%) | 0 (0.0%) |
| 18 to 34 Years | 11 (0.7%) | 0 (0.0%) |
| 35 to 64 Years | 56 (2.9%) | 236 (12.0%) |
| 65 to 74 Years | 0 (0.0%) | 59 (18.9%) |
| 75 Years and over | 47 (31.1%) | 32 (24.2%) |
Disability Class: Self-Care Difficulty
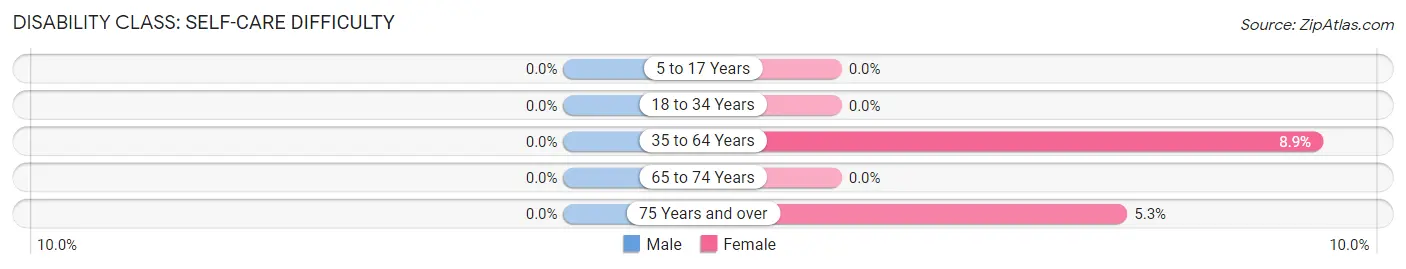
| Age Bracket | Male | Female |
| 5 to 17 Years | 0 (0.0%) | 0 (0.0%) |
| 18 to 34 Years | 0 (0.0%) | 0 (0.0%) |
| 35 to 64 Years | 0 (0.0%) | 176 (8.9%) |
| 65 to 74 Years | 0 (0.0%) | 0 (0.0%) |
| 75 Years and over | 0 (0.0%) | 7 (5.3%) |
Technology Access in Rincon
Computing Device Access in Rincon
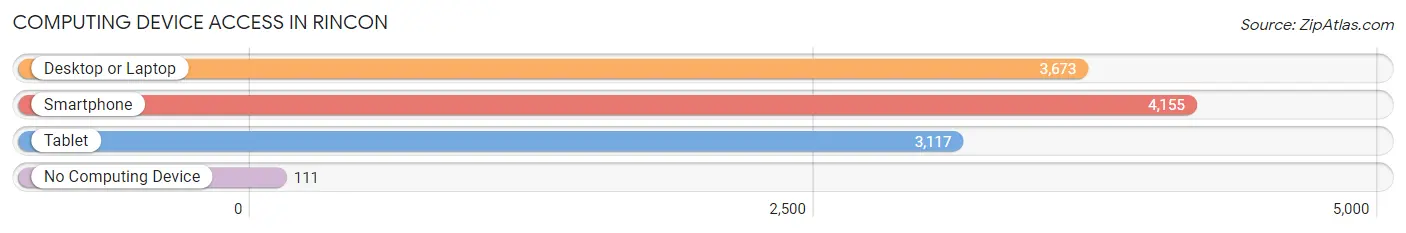
| Device Type | # Households | % Households |
| Desktop or Laptop | 3,673 | 84.7% |
| Smartphone | 4,155 | 95.8% |
| Tablet | 3,117 | 71.8% |
| No Computing Device | 111 | 2.6% |
| Total | 4,339 | 100.0% |
Internet Access in Rincon
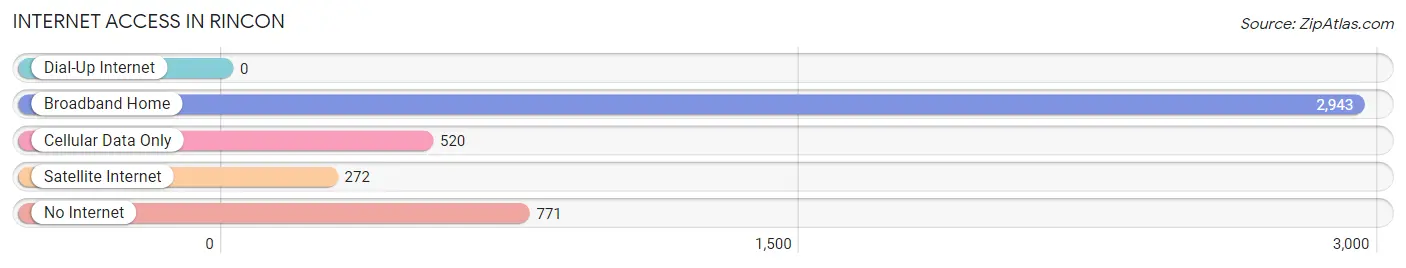
| Internet Type | # Households | % Households |
| Dial-Up Internet | 0 | 0.0% |
| Broadband Home | 2,943 | 67.8% |
| Cellular Data Only | 520 | 12.0% |
| Satellite Internet | 272 | 6.3% |
| No Internet | 771 | 17.8% |
| Total | 4,339 | 100.0% |
Rincon Summary
Rincon is a city located in Effingham County, Georgia, United States. The population was 7,260 at the 2010 census, up from 5,839 at the 2000 census. It is part of the Savannah Metropolitan Statistical Area.
History
Rincon was founded in 1872 by the Georgia Railroad and Banking Company. The city was named after the Spanish word for “corner”, as it was located at the intersection of two railroads. The city was incorporated in 1875.
Geography
Rincon is located in central Effingham County at 32°14′N 81°17′W (32.2345, -81.2845). It is bordered to the north by the city of Springfield, to the east by the city of Guyton, to the south by the city of Bloomingdale, and to the west by the city of Port Wentworth. U.S. Route 80 passes through the center of Rincon, leading east 8 miles (13 km) to Guyton and west 8 miles (13 km) to Port Wentworth. Savannah is 20 miles (32 km) to the east.
According to the United States Census Bureau, Rincon has a total area of 8.3 square miles (21.5 km2), of which 8.2 square miles (21.3 km2) is land and 0.1 square miles (0.2 km2), or 1.17%, is water.
Economy
Rincon is home to several businesses, including a Walmart Supercenter, a Lowe's Home Improvement store, and a variety of restaurants and retail stores. The city is also home to several industrial parks, including the Rincon Industrial Park, which is home to several manufacturing and distribution companies.
Demographics
As of the census of 2000, there were 5,839 people, 2,093 households, and 1,619 families residing in the city. The population density was 714.3 people per square mile (275.7/km2). There were 2,223 housing units at an average density of 271.7 per square mile (104.9/km2). The racial makeup of the city was 79.17% White, 16.90% African American, 0.17% Native American, 1.17% Asian, 0.03% Pacific Islander, 1.45% from other races, and 1.11% from two or more races. Hispanic or Latino of any race were 3.45% of the population.
There were 2,093 households, out of which 41.2% had children under the age of 18 living with them, 58.2% were married couples living together, 13.7% had a female householder with no husband present, and 23.7% were non-families. 19.7% of all households were made up of individuals, and 6.2% had someone living alone who was 65 years of age or older. The average household size was 2.78 and the average family size was 3.19.
In the city, the population was spread out, with 30.2% under the age of 18, 8.7% from 18 to 24, 33.2% from 25 to 44, 19.3% from 45 to 64, and 8.6% who were 65 years of age or older. The median age was 32 years. For every 100 females, there were 94.2 males. For every 100 females age 18 and over, there were 90.2 males.
The median income for a household in the city was $41,944, and the median income for a family was $46,912. Males had a median income of $32,917 versus $23,906 for females. The per capita income for the city was $17,945. About 8.2% of families and 10.2% of the population were below the poverty line, including 13.2% of those under age 18 and 8.2% of those age 65 or over.
Common Questions
What is Per Capita Income in Rincon?
Per Capita income in Rincon is $37,098.
What is the Median Family Income in Rincon?
Median Family Income in Rincon is $90,285.
What is the Median Household income in Rincon?
Median Household Income in Rincon is $73,708.
What is Income or Wage Gap in Rincon?
Income or Wage Gap in Rincon is 44.2%.
Women in Rincon earn 55.8 cents for every dollar earned by a man.
What is Inequality or Gini Index in Rincon?
Inequality or Gini Index in Rincon is 0.40.
What is the Total Population of Rincon?
Total Population of Rincon is 10,910.
What is the Total Male Population of Rincon?
Total Male Population of Rincon is 5,876.
What is the Total Female Population of Rincon?
Total Female Population of Rincon is 5,034.
What is the Ratio of Males per 100 Females in Rincon?
There are 116.73 Males per 100 Females in Rincon.
What is the Ratio of Females per 100 Males in Rincon?
There are 85.67 Females per 100 Males in Rincon.
What is the Median Population Age in Rincon?
Median Population Age in Rincon is 31.4 Years.
What is the Average Family Size in Rincon
Average Family Size in Rincon is 3.2 People.
What is the Average Household Size in Rincon
Average Household Size in Rincon is 2.5 People.
How Large is the Labor Force in Rincon?
There are 5,643 People in the Labor Forcein in Rincon.
What is the Percentage of People in the Labor Force in Rincon?
71.9% of People are in the Labor Force in Rincon.
What is the Unemployment Rate in Rincon?
Unemployment Rate in Rincon is 5.9%.