Turin, GA Map & Demographics
Turin Map
Turin Overview
$51,966
PER CAPITA INCOME
$168,125
AVG FAMILY INCOME
$139,167
AVG HOUSEHOLD INCOME
59.1%
WAGE / INCOME GAP [ % ]
40.9¢/ $1
WAGE / INCOME GAP [ $ ]
0.38
INEQUALITY / GINI INDEX
378
TOTAL POPULATION
172
MALE POPULATION
206
FEMALE POPULATION
83.50
MALES / 100 FEMALES
119.77
FEMALES / 100 MALES
41.4
MEDIAN AGE
3.2
AVG FAMILY SIZE
2.8
AVG HOUSEHOLD SIZE
204
LABOR FORCE [ PEOPLE ]
66.2%
PERCENT IN LABOR FORCE
Turin Zip Codes
Turin Area Codes
Income in Turin
Income Overview in Turin
Per Capita Income in Turin is $51,966, while median incomes of families and households are $168,125 and $139,167 respectively.
| Characteristic | Number | Measure |
| Per Capita Income | 378 | $51,966 |
| Median Family Income | 107 | $168,125 |
| Mean Family Income | 107 | $166,026 |
| Median Household Income | 134 | $139,167 |
| Mean Household Income | 134 | $145,059 |
| Income Deficit | 107 | $0 |
| Wage / Income Gap (%) | 378 | 59.07% |
| Wage / Income Gap ($) | 378 | 40.93¢ per $1 |
| Gini / Inequality Index | 378 | 0.38 |
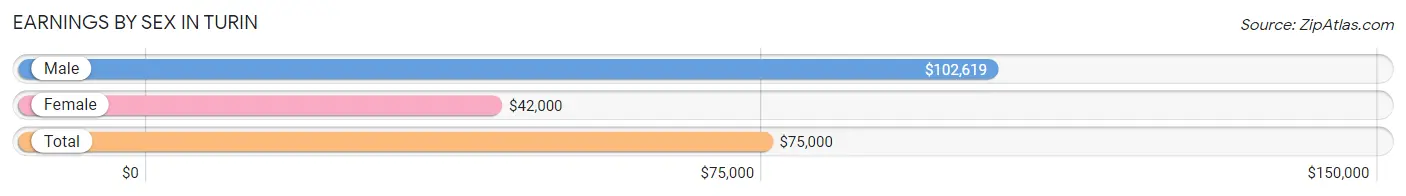
Earnings by Sex in Turin
Average Earnings in Turin are $75,000, $102,619 for men and $42,000 for women, a difference of 59.1%.
| Sex | Number | Average Earnings |
| Male | 106 (49.1%) | $102,619 |
| Female | 110 (50.9%) | $42,000 |
| Total | 216 (100.0%) | $75,000 |
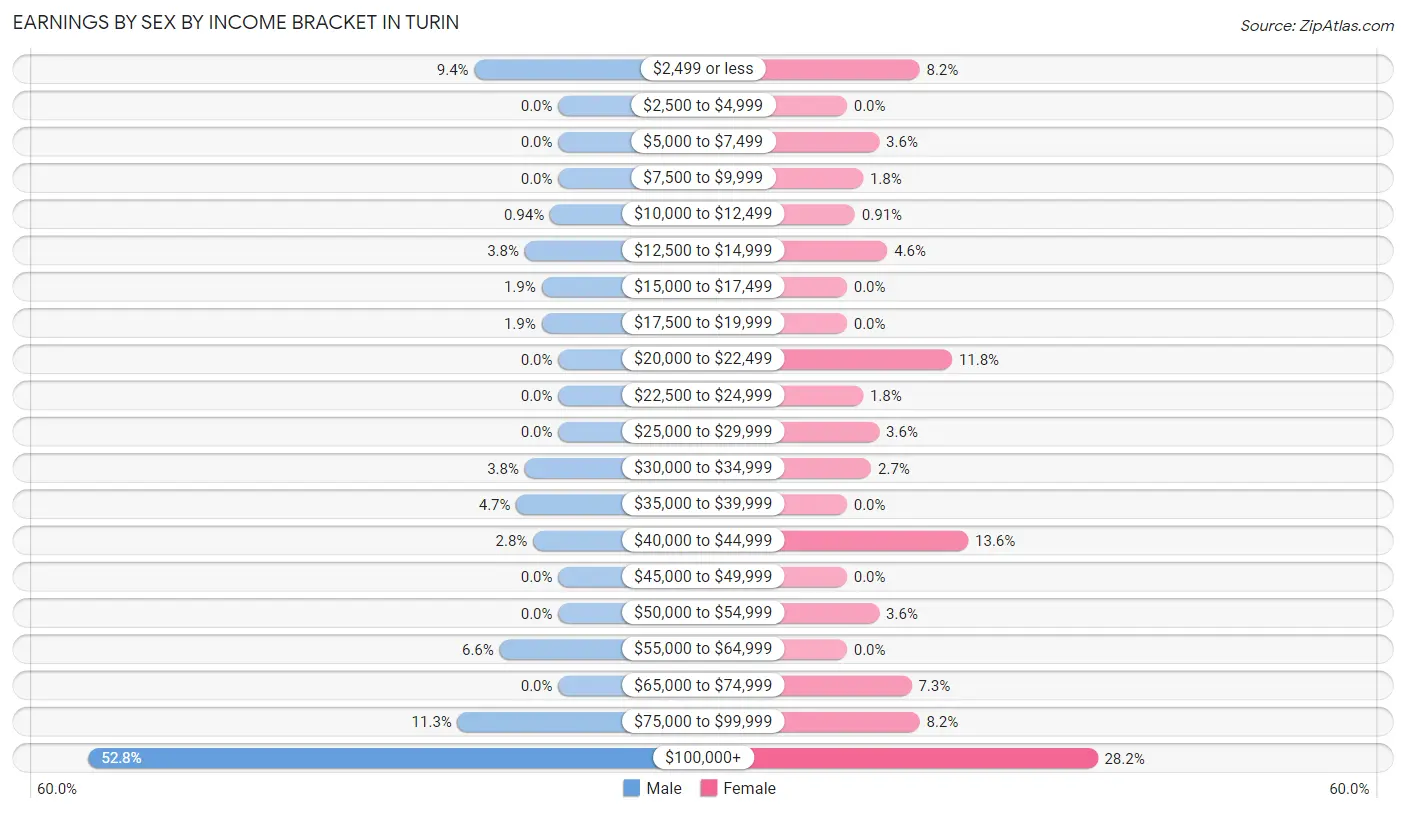
Earnings by Sex by Income Bracket in Turin
The most common earnings brackets in Turin are $100,000+ for men (56 | 52.8%) and $100,000+ for women (31 | 28.2%).
| Income | Male | Female |
| $2,499 or less | 10 (9.4%) | 9 (8.2%) |
| $2,500 to $4,999 | 0 (0.0%) | 0 (0.0%) |
| $5,000 to $7,499 | 0 (0.0%) | 4 (3.6%) |
| $7,500 to $9,999 | 0 (0.0%) | 2 (1.8%) |
| $10,000 to $12,499 | 1 (0.9%) | 1 (0.9%) |
| $12,500 to $14,999 | 4 (3.8%) | 5 (4.5%) |
| $15,000 to $17,499 | 2 (1.9%) | 0 (0.0%) |
| $17,500 to $19,999 | 2 (1.9%) | 0 (0.0%) |
| $20,000 to $22,499 | 0 (0.0%) | 13 (11.8%) |
| $22,500 to $24,999 | 0 (0.0%) | 2 (1.8%) |
| $25,000 to $29,999 | 0 (0.0%) | 4 (3.6%) |
| $30,000 to $34,999 | 4 (3.8%) | 3 (2.7%) |
| $35,000 to $39,999 | 5 (4.7%) | 0 (0.0%) |
| $40,000 to $44,999 | 3 (2.8%) | 15 (13.6%) |
| $45,000 to $49,999 | 0 (0.0%) | 0 (0.0%) |
| $50,000 to $54,999 | 0 (0.0%) | 4 (3.6%) |
| $55,000 to $64,999 | 7 (6.6%) | 0 (0.0%) |
| $65,000 to $74,999 | 0 (0.0%) | 8 (7.3%) |
| $75,000 to $99,999 | 12 (11.3%) | 9 (8.2%) |
| $100,000+ | 56 (52.8%) | 31 (28.2%) |
| Total | 106 (100.0%) | 110 (100.0%) |
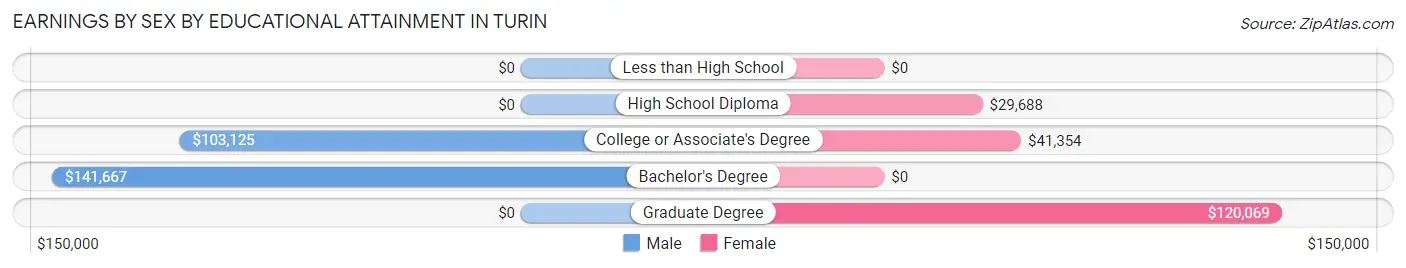
Earnings by Sex by Educational Attainment in Turin
Average earnings in Turin are $102,976 for men and $51,875 for women, a difference of 49.6%. Men with an educational attainment of bachelor's degree enjoy the highest average annual earnings of $141,667, while those with college or associate's degree education earn the least with $103,125. Women with an educational attainment of graduate degree earn the most with the average annual earnings of $120,069, while those with high school diploma education have the smallest earnings of $29,688.
| Educational Attainment | Male Income | Female Income |
| Less than High School | - | - |
| High School Diploma | - | - |
| College or Associate's Degree | $103,125 | $41,354 |
| Bachelor's Degree | $141,667 | $0 |
| Graduate Degree | - | - |
| Total | $102,976 | $51,875 |
Family Income in Turin
Family Income Brackets in Turin
According to the Turin family income data, there are 45 families falling into the $200,000+ income range, which is the most common income bracket and makes up 42.1% of all families.
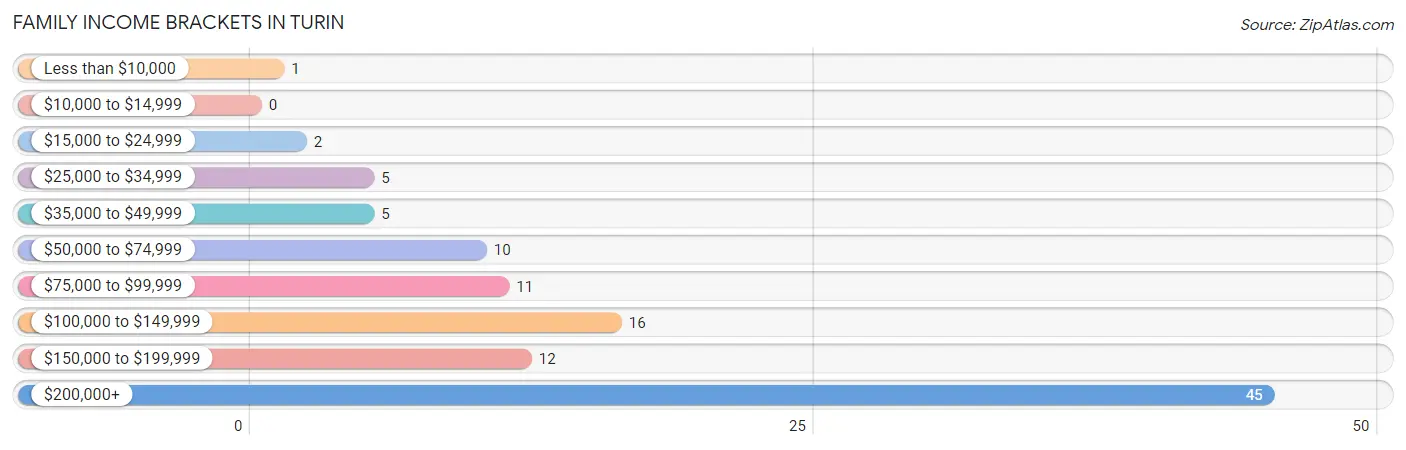
| Income Bracket | # Families | % Families |
| Less than $10,000 | 1 | 0.9% |
| $10,000 to $14,999 | 0 | 0.0% |
| $15,000 to $24,999 | 2 | 1.9% |
| $25,000 to $34,999 | 5 | 4.7% |
| $35,000 to $49,999 | 5 | 4.7% |
| $50,000 to $74,999 | 10 | 9.3% |
| $75,000 to $99,999 | 11 | 10.3% |
| $100,000 to $149,999 | 16 | 15.0% |
| $150,000 to $199,999 | 12 | 11.2% |
| $200,000+ | 45 | 42.1% |
Family Income by Famaliy Size in Turin
6-person families (9 | 8.4%) account for the highest median family income in Turin with $200,938 per family, while 2-person families (58 | 54.2%) have the highest median income of $69,584 per family member.
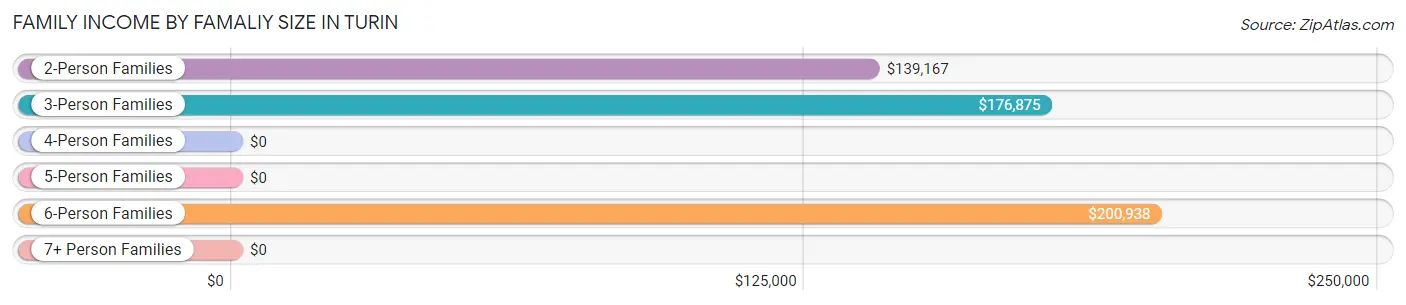
| Income Bracket | # Families | Median Income |
| 2-Person Families | 58 (54.2%) | $139,167 |
| 3-Person Families | 24 (22.4%) | $176,875 |
| 4-Person Families | 6 (5.6%) | $0 |
| 5-Person Families | 7 (6.5%) | $0 |
| 6-Person Families | 9 (8.4%) | $200,938 |
| 7+ Person Families | 3 (2.8%) | $0 |
| Total | 107 (100.0%) | $168,125 |
Family Income by Number of Earners in Turin
The median family income in Turin is $168,125, with families comprising 2 earners (42) having the highest median family income of $248,750, while families with no earners (12) have the lowest median family income of $98,125, accounting for 39.3% and 11.2% of families, respectively.
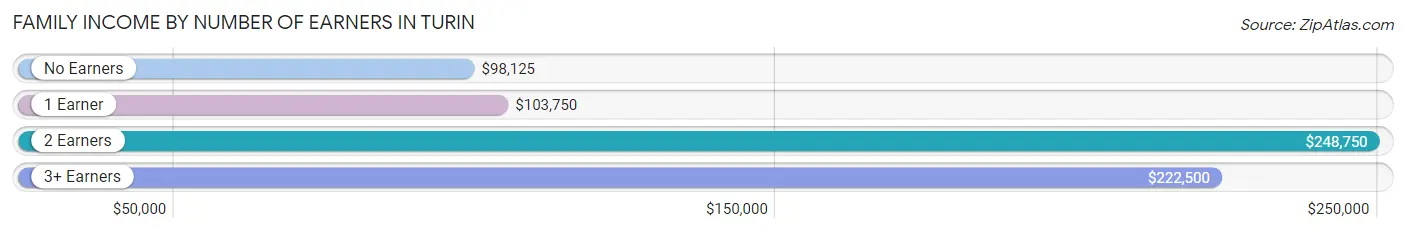
| Number of Earners | # Families | Median Income |
| No Earners | 12 (11.2%) | $98,125 |
| 1 Earner | 33 (30.8%) | $103,750 |
| 2 Earners | 42 (39.3%) | $248,750 |
| 3+ Earners | 20 (18.7%) | $222,500 |
| Total | 107 (100.0%) | $168,125 |
Household Income in Turin
Household Income Brackets in Turin
With 48 households falling in the category, the $200,000+ income range is the most frequent in Turin, accounting for 35.8% of all households. In contrast, only 3 households (2.2%) fall into the $10,000 to $14,999 income bracket, making it the least populous group.
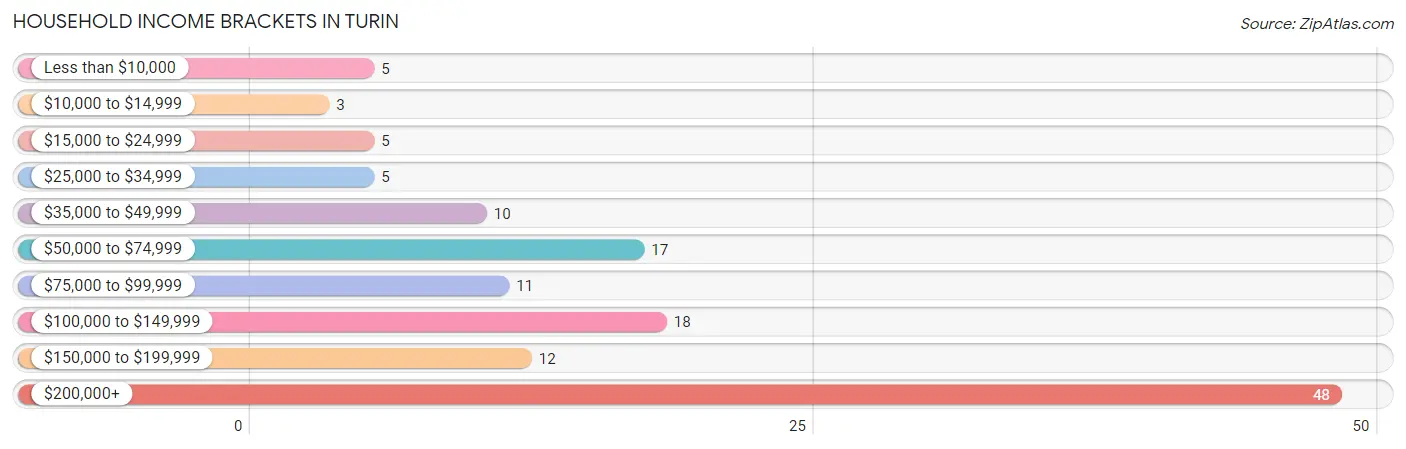
| Income Bracket | # Households | % Households |
| Less than $10,000 | 5 | 3.7% |
| $10,000 to $14,999 | 3 | 2.2% |
| $15,000 to $24,999 | 5 | 3.7% |
| $25,000 to $34,999 | 5 | 3.7% |
| $35,000 to $49,999 | 10 | 7.5% |
| $50,000 to $74,999 | 17 | 12.7% |
| $75,000 to $99,999 | 11 | 8.2% |
| $100,000 to $149,999 | 18 | 13.4% |
| $150,000 to $199,999 | 12 | 9.0% |
| $200,000+ | 48 | 35.8% |
Household Income by Householder Age in Turin
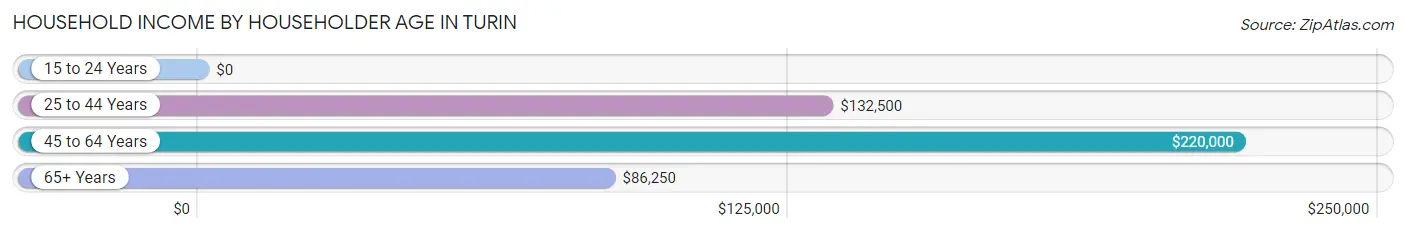
The median household income in Turin is $139,167, with the highest median household income of $220,000 found in the 45 to 64 years age bracket for the primary householder. A total of 60 households (44.8%) fall into this category.
| Income Bracket | # Households | Median Income |
| 15 to 24 Years | 0 (0.0%) | $0 |
| 25 to 44 Years | 38 (28.4%) | $132,500 |
| 45 to 64 Years | 60 (44.8%) | $220,000 |
| 65+ Years | 36 (26.9%) | $86,250 |
| Total | 134 (100.0%) | $139,167 |
Poverty in Turin
Income Below Poverty by Sex and Age in Turin
With 2.9% poverty level for males and 11.2% for females among the residents of Turin, 45 to 54 year old males and 12 to 14 year old females are the most vulnerable to poverty, with 2 males (18.2%) and 3 females (50.0%) in their respective age groups living below the poverty level.
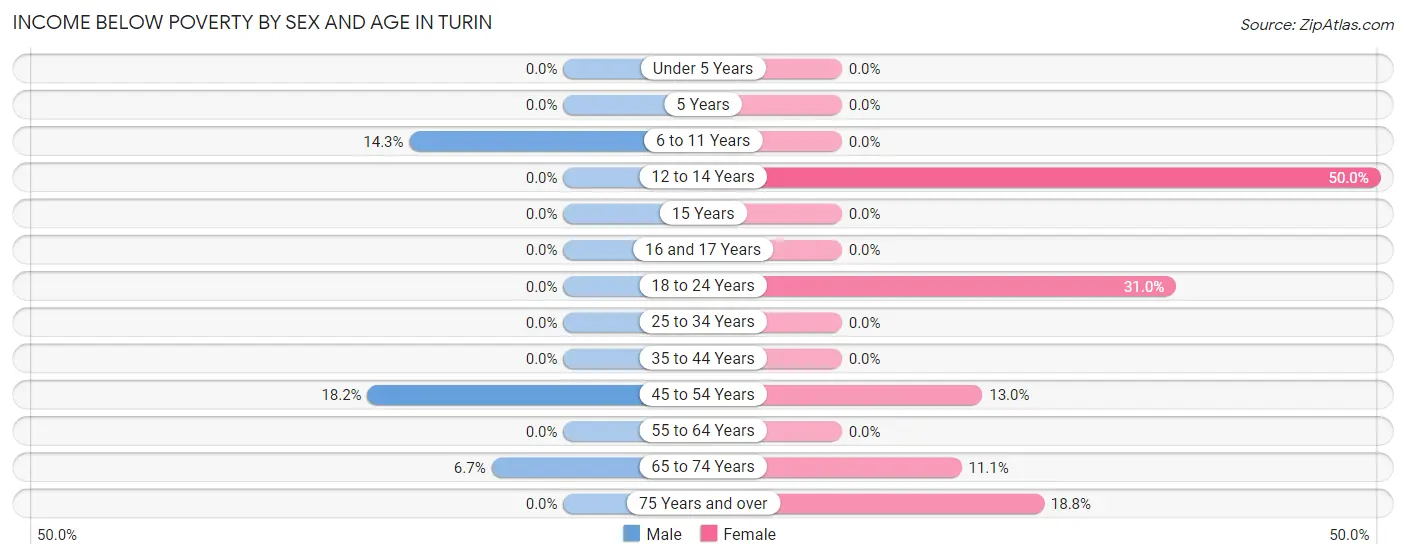
| Age Bracket | Male | Female |
| Under 5 Years | 0 (0.0%) | 0 (0.0%) |
| 5 Years | 0 (0.0%) | 0 (0.0%) |
| 6 to 11 Years | 2 (14.3%) | 0 (0.0%) |
| 12 to 14 Years | 0 (0.0%) | 3 (50.0%) |
| 15 Years | 0 (0.0%) | 0 (0.0%) |
| 16 and 17 Years | 0 (0.0%) | 0 (0.0%) |
| 18 to 24 Years | 0 (0.0%) | 9 (31.0%) |
| 25 to 34 Years | 0 (0.0%) | 0 (0.0%) |
| 35 to 44 Years | 0 (0.0%) | 0 (0.0%) |
| 45 to 54 Years | 2 (18.2%) | 6 (13.0%) |
| 55 to 64 Years | 0 (0.0%) | 0 (0.0%) |
| 65 to 74 Years | 1 (6.7%) | 2 (11.1%) |
| 75 Years and over | 0 (0.0%) | 3 (18.8%) |
| Total | 5 (2.9%) | 23 (11.2%) |
Income Above Poverty by Sex and Age in Turin
According to the poverty statistics in Turin, males aged under 5 years and females aged under 5 years are the age groups that are most secure financially, with 100.0% of males and 100.0% of females in these age groups living above the poverty line.
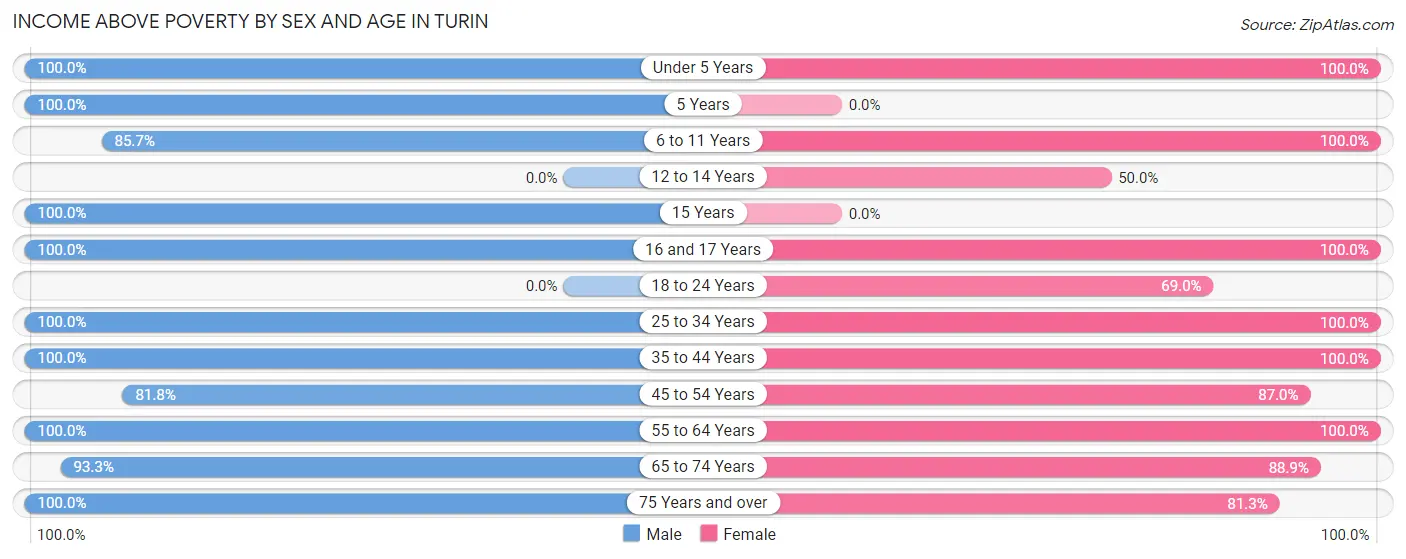
| Age Bracket | Male | Female |
| Under 5 Years | 21 (100.0%) | 10 (100.0%) |
| 5 Years | 2 (100.0%) | 0 (0.0%) |
| 6 to 11 Years | 12 (85.7%) | 13 (100.0%) |
| 12 to 14 Years | 0 (0.0%) | 3 (50.0%) |
| 15 Years | 4 (100.0%) | 0 (0.0%) |
| 16 and 17 Years | 6 (100.0%) | 1 (100.0%) |
| 18 to 24 Years | 0 (0.0%) | 20 (69.0%) |
| 25 to 34 Years | 21 (100.0%) | 15 (100.0%) |
| 35 to 44 Years | 29 (100.0%) | 29 (100.0%) |
| 45 to 54 Years | 9 (81.8%) | 40 (87.0%) |
| 55 to 64 Years | 37 (100.0%) | 23 (100.0%) |
| 65 to 74 Years | 14 (93.3%) | 16 (88.9%) |
| 75 Years and over | 12 (100.0%) | 13 (81.2%) |
| Total | 167 (97.1%) | 183 (88.8%) |
Income Below Poverty Among Married-Couple Families in Turin
The poverty statistics for married-couple families in Turin show that 3.2% or 3 of the total 93 families live below the poverty line. Families with 1 or 2 children have the highest poverty rate of 10.0%, comprising of 2 families. On the other hand, families with 3 or 4 children have the lowest poverty rate of 0.0%, which includes 0 families.
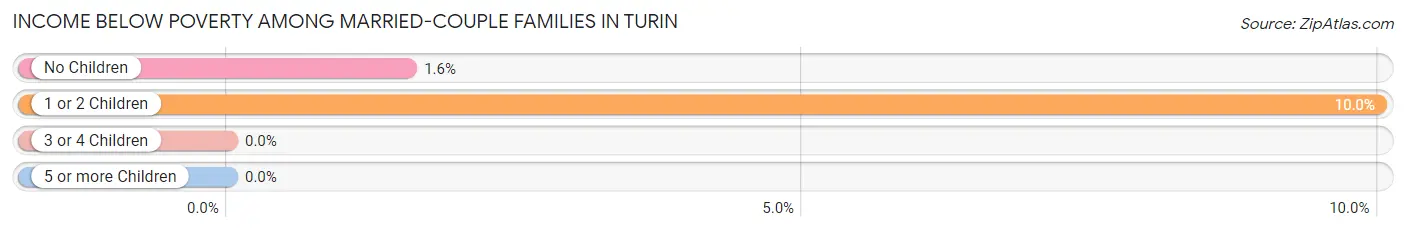
| Children | Above Poverty | Below Poverty |
| No Children | 63 (98.4%) | 1 (1.6%) |
| 1 or 2 Children | 18 (90.0%) | 2 (10.0%) |
| 3 or 4 Children | 9 (100.0%) | 0 (0.0%) |
| 5 or more Children | 0 (0.0%) | 0 (0.0%) |
| Total | 90 (96.8%) | 3 (3.2%) |
Income Below Poverty Among Single-Parent Households in Turin
| Children | Single Father | Single Mother |
| No Children | 0 (0.0%) | 0 (0.0%) |
| 1 or 2 Children | 0 (0.0%) | 0 (0.0%) |
| 3 or 4 Children | 0 (0.0%) | 0 (0.0%) |
| 5 or more Children | 0 (0.0%) | 0 (0.0%) |
| Total | 0 (0.0%) | 0 (0.0%) |
Income Below Poverty Among Married-Couple vs Single-Parent Households in Turin
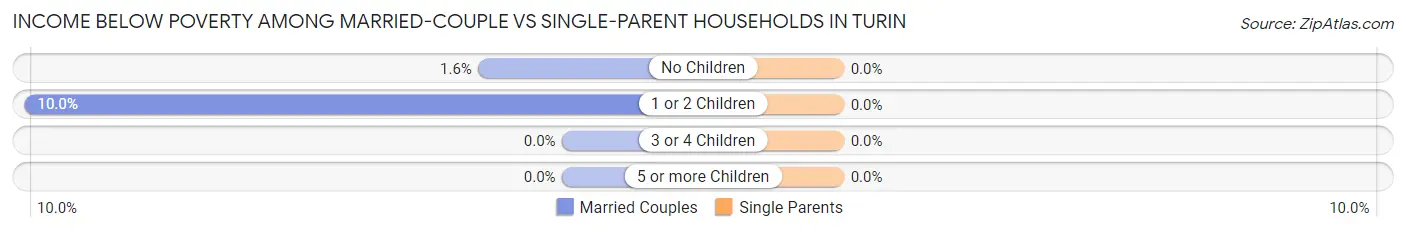
| Children | Married-Couple Families | Single-Parent Households |
| No Children | 1 (1.6%) | 0 (0.0%) |
| 1 or 2 Children | 2 (10.0%) | 0 (0.0%) |
| 3 or 4 Children | 0 (0.0%) | 0 (0.0%) |
| 5 or more Children | 0 (0.0%) | 0 (0.0%) |
| Total | 3 (3.2%) | 0 (0.0%) |
Race in Turin
The most populous races in Turin are White / Caucasian (363 | 96.0%), Hispanic or Latino (20 | 5.3%), and Black / African American (13 | 3.4%).
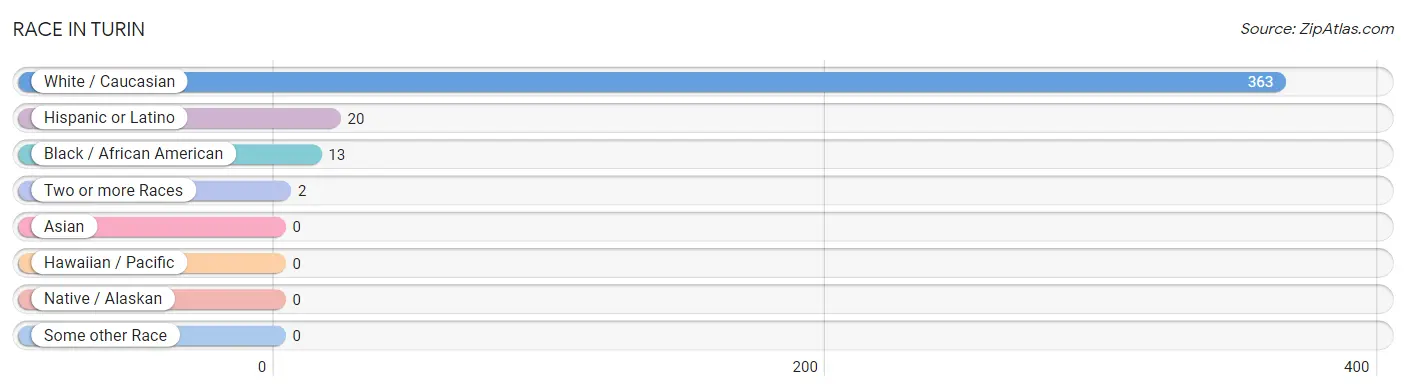
| Race | # Population | % Population |
| Asian | 0 | 0.0% |
| Black / African American | 13 | 3.4% |
| Hawaiian / Pacific | 0 | 0.0% |
| Hispanic or Latino | 20 | 5.3% |
| Native / Alaskan | 0 | 0.0% |
| White / Caucasian | 363 | 96.0% |
| Two or more Races | 2 | 0.5% |
| Some other Race | 0 | 0.0% |
| Total | 378 | 100.0% |
Ancestry in Turin
The most populous ancestries reported in Turin are American (112 | 29.6%), English (66 | 17.5%), Irish (33 | 8.7%), German (23 | 6.1%), and Colombian (16 | 4.2%), together accounting for 66.1% of all Turin residents.
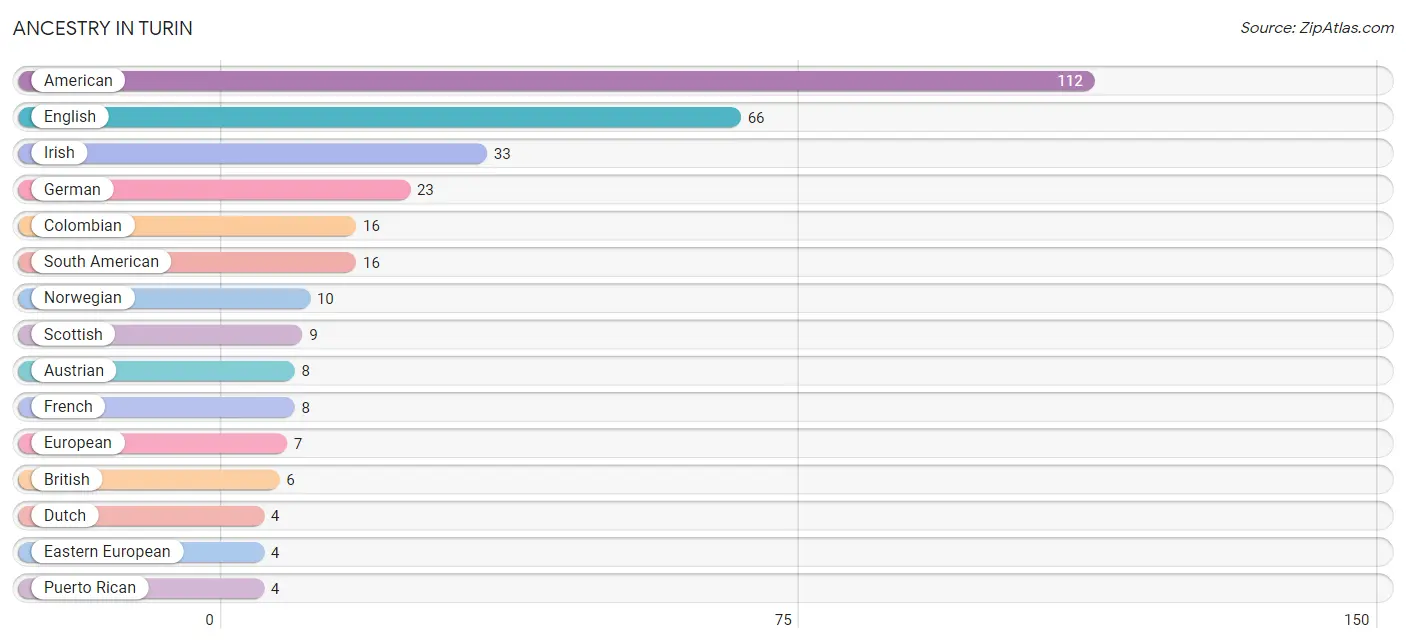
| Ancestry | # Population | % Population |
| American | 112 | 29.6% |
| Austrian | 8 | 2.1% |
| British | 6 | 1.6% |
| Cherokee | 2 | 0.5% |
| Colombian | 16 | 4.2% |
| Czechoslovakian | 1 | 0.3% |
| Dutch | 4 | 1.1% |
| Eastern European | 4 | 1.1% |
| English | 66 | 17.5% |
| European | 7 | 1.8% |
| French | 8 | 2.1% |
| French Canadian | 3 | 0.8% |
| German | 23 | 6.1% |
| Irish | 33 | 8.7% |
| Italian | 2 | 0.5% |
| Norwegian | 10 | 2.6% |
| Puerto Rican | 4 | 1.1% |
| Scottish | 9 | 2.4% |
| South American | 16 | 4.2% |
| Ukrainian | 2 | 0.5% | View All 20 Rows |
Immigrants in Turin
The most numerous immigrant groups reported in Turin came from Colombia (8 | 2.1%), Latin America (8 | 2.1%), South America (8 | 2.1%), Europe (1 | 0.3%), and Italy (1 | 0.3%), together accounting for 6.9% of all Turin residents.
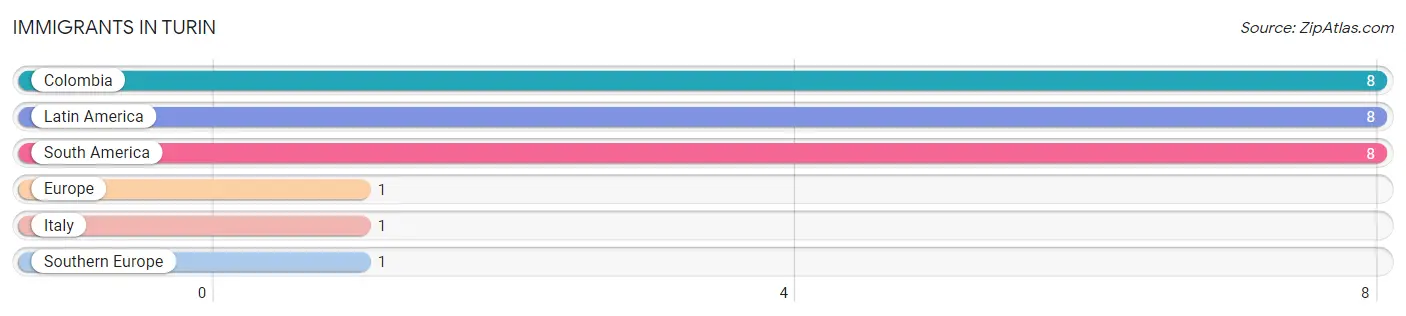
| Immigration Origin | # Population | % Population |
| Colombia | 8 | 2.1% |
| Europe | 1 | 0.3% |
| Italy | 1 | 0.3% |
| Latin America | 8 | 2.1% |
| South America | 8 | 2.1% |
| Southern Europe | 1 | 0.3% | View All 6 Rows |
Sex and Age in Turin
Sex and Age in Turin
The most populous age groups in Turin are 60 to 64 Years (31 | 18.0%) for men and 50 to 54 Years (29 | 14.1%) for women.
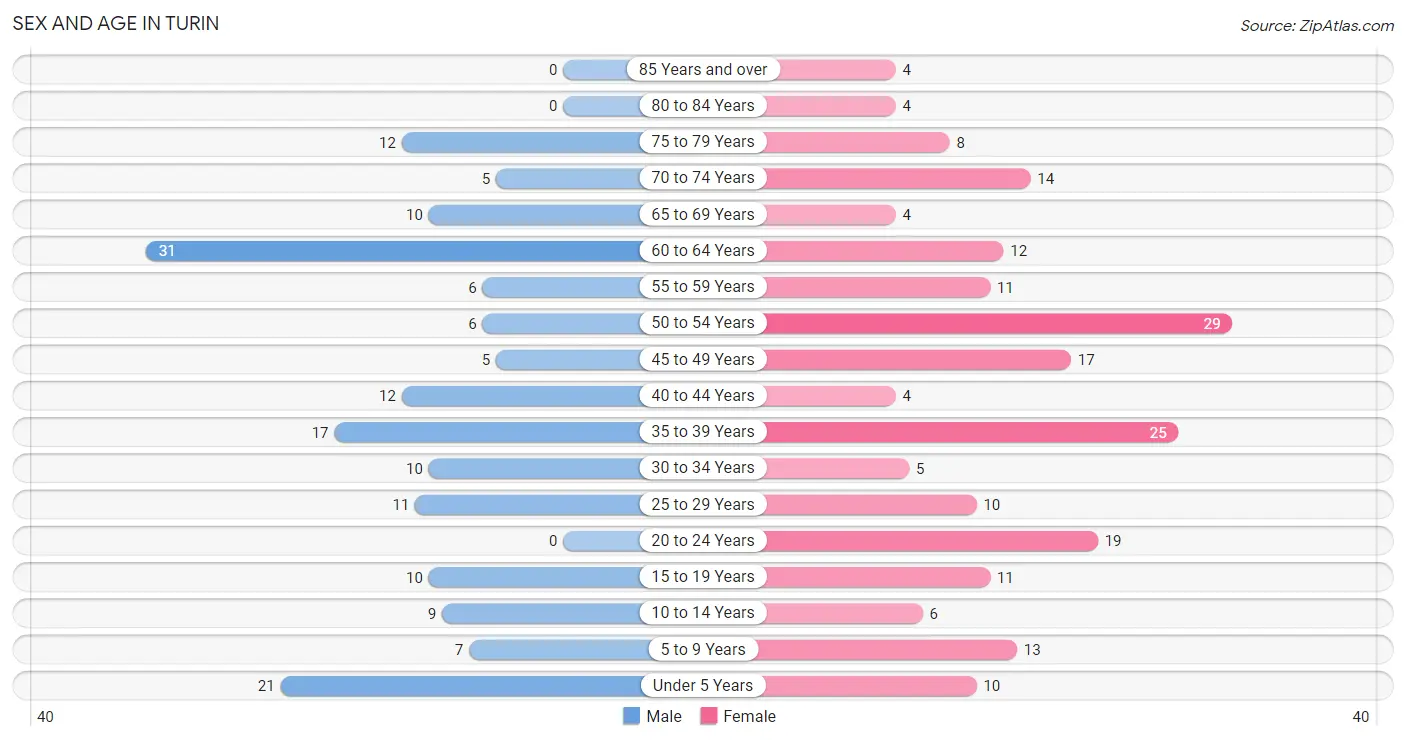
| Age Bracket | Male | Female |
| Under 5 Years | 21 (12.2%) | 10 (4.9%) |
| 5 to 9 Years | 7 (4.1%) | 13 (6.3%) |
| 10 to 14 Years | 9 (5.2%) | 6 (2.9%) |
| 15 to 19 Years | 10 (5.8%) | 11 (5.3%) |
| 20 to 24 Years | 0 (0.0%) | 19 (9.2%) |
| 25 to 29 Years | 11 (6.4%) | 10 (4.9%) |
| 30 to 34 Years | 10 (5.8%) | 5 (2.4%) |
| 35 to 39 Years | 17 (9.9%) | 25 (12.1%) |
| 40 to 44 Years | 12 (7.0%) | 4 (1.9%) |
| 45 to 49 Years | 5 (2.9%) | 17 (8.3%) |
| 50 to 54 Years | 6 (3.5%) | 29 (14.1%) |
| 55 to 59 Years | 6 (3.5%) | 11 (5.3%) |
| 60 to 64 Years | 31 (18.0%) | 12 (5.8%) |
| 65 to 69 Years | 10 (5.8%) | 4 (1.9%) |
| 70 to 74 Years | 5 (2.9%) | 14 (6.8%) |
| 75 to 79 Years | 12 (7.0%) | 8 (3.9%) |
| 80 to 84 Years | 0 (0.0%) | 4 (1.9%) |
| 85 Years and over | 0 (0.0%) | 4 (1.9%) |
| Total | 172 (100.0%) | 206 (100.0%) |
Families and Households in Turin
Median Family Size in Turin
The median family size in Turin is 3.18 persons per family, with single female/mother families (7 | 6.5%) accounting for the largest median family size of 5.29 persons per family. On the other hand, single male/father families (7 | 6.5%) represent the smallest median family size with 2.00 persons per family.
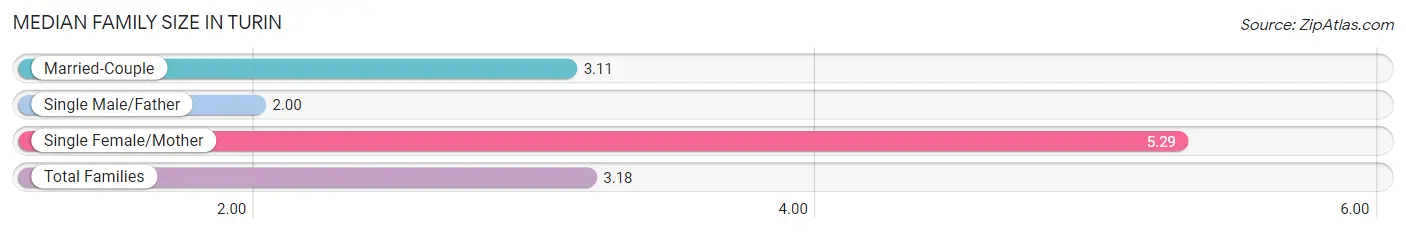
| Family Type | # Families | Family Size |
| Married-Couple | 93 (86.9%) | 3.11 |
| Single Male/Father | 7 (6.5%) | 2.00 |
| Single Female/Mother | 7 (6.5%) | 5.29 |
| Total Families | 107 (100.0%) | 3.18 |
Median Household Size in Turin
The median household size in Turin is 2.82 persons per household, with single female/mother households (7 | 5.2%) accounting for the largest median household size of 5.29 persons per household. non-family households (27 | 20.2%) represent the smallest median household size with 1.07 persons per household.
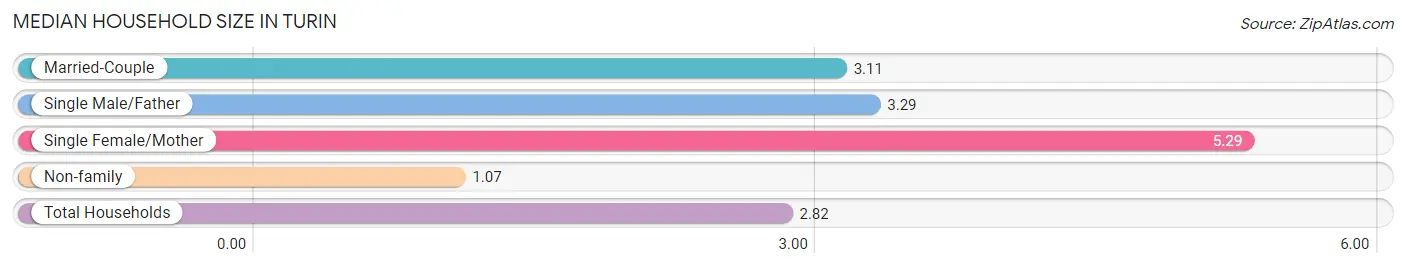
| Household Type | # Households | Household Size |
| Married-Couple | 93 (69.4%) | 3.11 |
| Single Male/Father | 7 (5.2%) | 3.29 |
| Single Female/Mother | 7 (5.2%) | 5.29 |
| Non-family | 27 (20.2%) | 1.07 |
| Total Households | 134 (100.0%) | 2.82 |
Household Size by Marriage Status in Turin
Out of a total of 134 households in Turin, 107 (79.8%) are family households, while 27 (20.2%) are nonfamily households. The most numerous type of family households are 2-person households, comprising 51, and the most common type of nonfamily households are 1-person households, comprising 25.
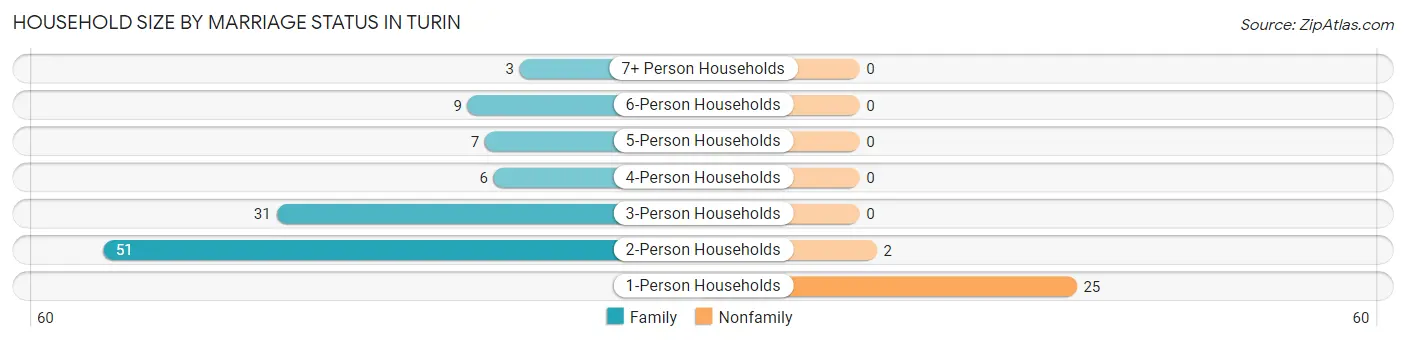
| Household Size | Family Households | Nonfamily Households |
| 1-Person Households | - | 25 (18.7%) |
| 2-Person Households | 51 (38.1%) | 2 (1.5%) |
| 3-Person Households | 31 (23.1%) | 0 (0.0%) |
| 4-Person Households | 6 (4.5%) | 0 (0.0%) |
| 5-Person Households | 7 (5.2%) | 0 (0.0%) |
| 6-Person Households | 9 (6.7%) | 0 (0.0%) |
| 7+ Person Households | 3 (2.2%) | 0 (0.0%) |
| Total | 107 (79.8%) | 27 (20.2%) |
Female Fertility in Turin
Fertility by Age in Turin
Average fertility rate in Turin is 121.0 births per 1,000 women. Women in the age bracket of 15 to 19 years have the highest fertility rate with 364.0 births per 1,000 women. Women in the age bracket of 20 to 34 years acount for 45.5% of all women with births.
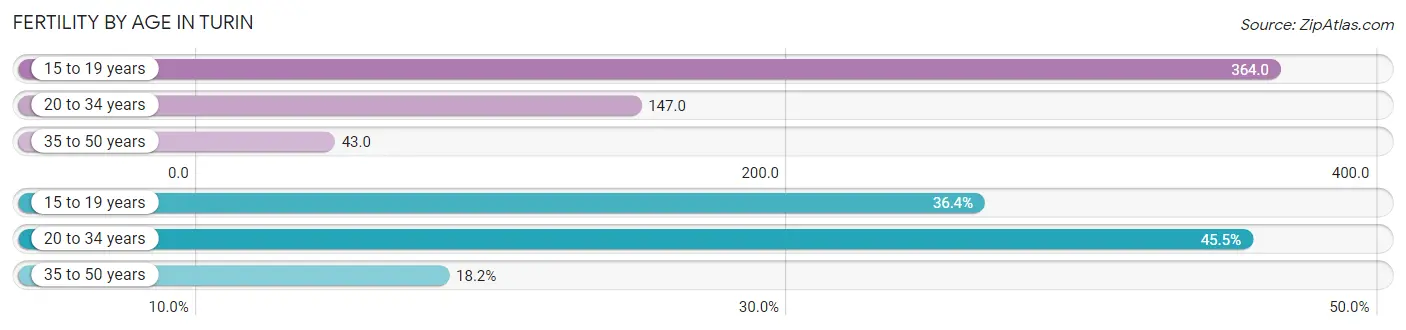
| Age Bracket | Women with Births | Births / 1,000 Women |
| 15 to 19 years | 4 (36.4%) | 364.0 |
| 20 to 34 years | 5 (45.5%) | 147.0 |
| 35 to 50 years | 2 (18.2%) | 43.0 |
| Total | 11 (100.0%) | 121.0 |
Fertility by Age by Marriage Status in Turin
63.6% of women with births (11) in Turin are married. The highest percentage of unmarried women with births falls into 15 to 19 years age bracket with 100.0% of them unmarried at the time of birth, while the lowest percentage of unmarried women with births belong to 20 to 34 years age bracket with 0.0% of them unmarried.
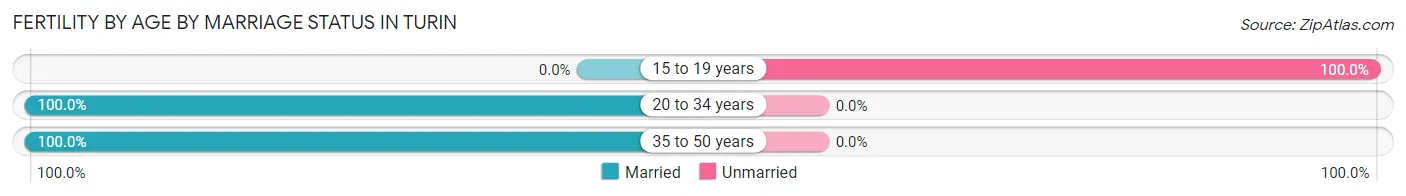
| Age Bracket | Married | Unmarried |
| 15 to 19 years | 0 (0.0%) | 4 (100.0%) |
| 20 to 34 years | 5 (100.0%) | 0 (0.0%) |
| 35 to 50 years | 2 (100.0%) | 0 (0.0%) |
| Total | 7 (63.6%) | 4 (36.4%) |
Fertility by Education in Turin
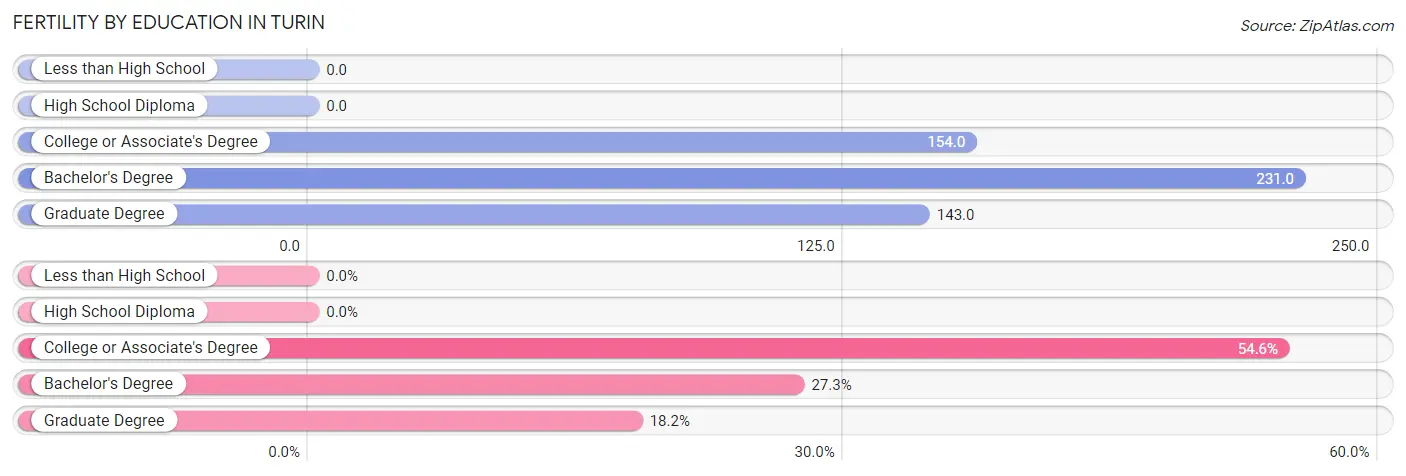
| Educational Attainment | Women with Births | Births / 1,000 Women |
| Less than High School | 0 (0.0%) | 0.0 |
| High School Diploma | 0 (0.0%) | 0.0 |
| College or Associate's Degree | 6 (54.5%) | 154.0 |
| Bachelor's Degree | 3 (27.3%) | 231.0 |
| Graduate Degree | 2 (18.2%) | 143.0 |
| Total | 11 (100.0%) | 121.0 |
Fertility by Education by Marriage Status in Turin
36.4% of women with births in Turin are unmarried. Women with the educational attainment of bachelor's degree are most likely to be married with 100.0% of them married at childbirth, while women with the educational attainment of college or associate's degree are least likely to be married with 66.7% of them unmarried at childbirth.
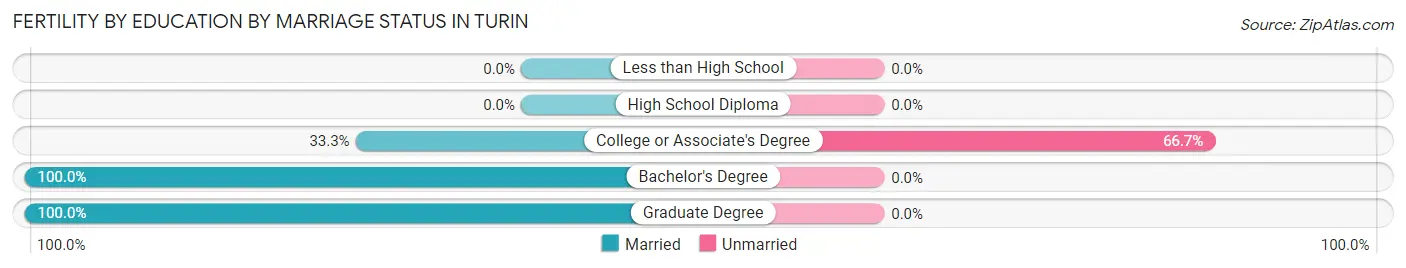
| Educational Attainment | Married | Unmarried |
| Less than High School | 0 (0.0%) | 0 (0.0%) |
| High School Diploma | 0 (0.0%) | 0 (0.0%) |
| College or Associate's Degree | 2 (33.3%) | 4 (66.7%) |
| Bachelor's Degree | 3 (100.0%) | 0 (0.0%) |
| Graduate Degree | 2 (100.0%) | 0 (0.0%) |
| Total | 7 (63.6%) | 4 (36.4%) |
Employment Characteristics in Turin
Employment by Class of Employer in Turin
Among the 201 employed individuals in Turin, private company employees (107 | 53.2%), local government employees (48 | 23.9%), and self-employed (not incorporated) (20 | 10.0%) make up the most common classes of employment.
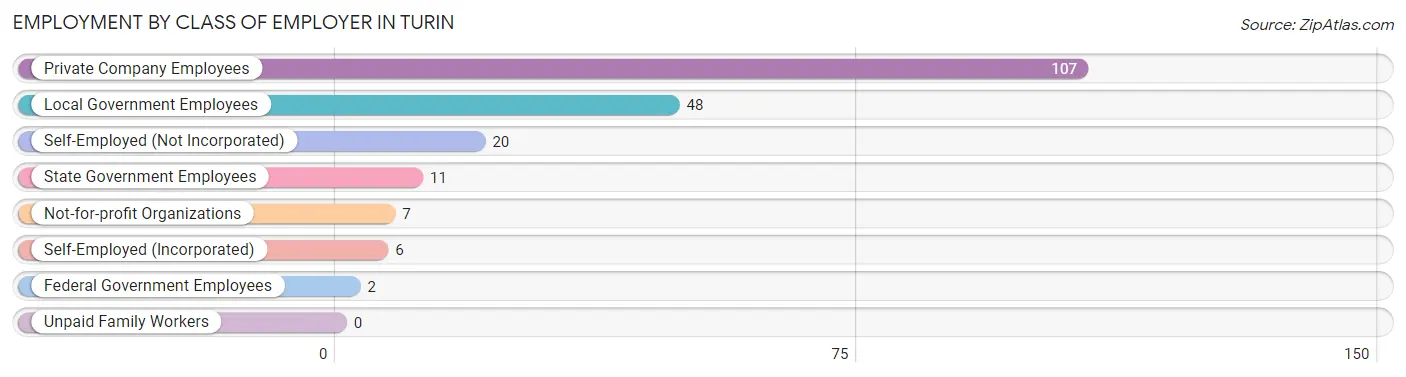
| Employer Class | # Employees | % Employees |
| Private Company Employees | 107 | 53.2% |
| Self-Employed (Incorporated) | 6 | 3.0% |
| Self-Employed (Not Incorporated) | 20 | 10.0% |
| Not-for-profit Organizations | 7 | 3.5% |
| Local Government Employees | 48 | 23.9% |
| State Government Employees | 11 | 5.5% |
| Federal Government Employees | 2 | 1.0% |
| Unpaid Family Workers | 0 | 0.0% |
| Total | 201 | 100.0% |
Employment Status by Age in Turin
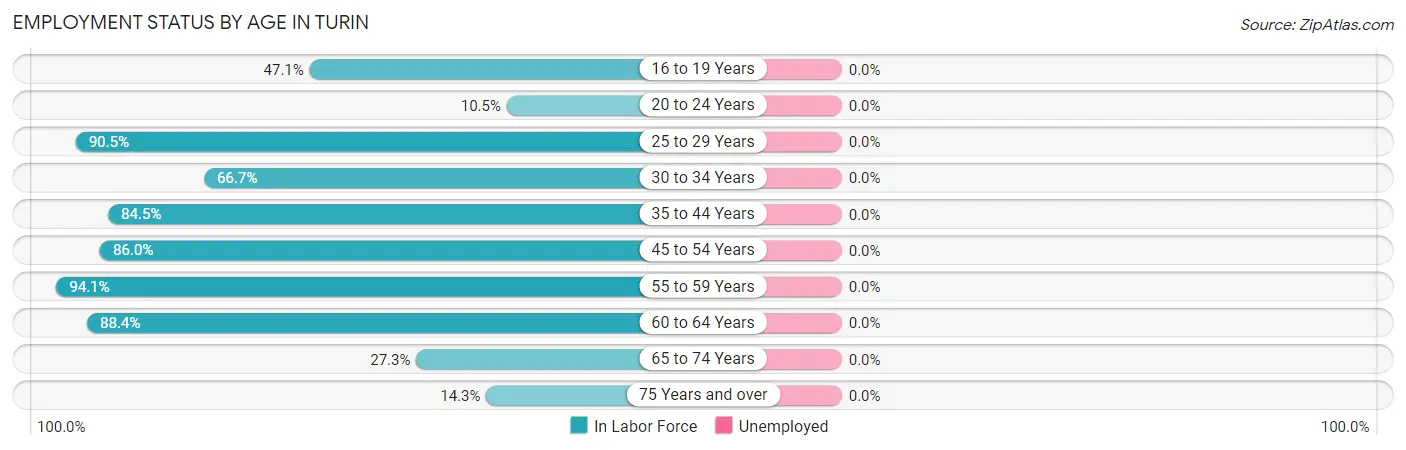
| Age Bracket | In Labor Force | Unemployed |
| 16 to 19 Years | 8 (47.1%) | 0 (0.0%) |
| 20 to 24 Years | 2 (10.5%) | 0 (0.0%) |
| 25 to 29 Years | 19 (90.5%) | 0 (0.0%) |
| 30 to 34 Years | 10 (66.7%) | 0 (0.0%) |
| 35 to 44 Years | 49 (84.5%) | 0 (0.0%) |
| 45 to 54 Years | 49 (86.0%) | 0 (0.0%) |
| 55 to 59 Years | 16 (94.1%) | 0 (0.0%) |
| 60 to 64 Years | 38 (88.4%) | 0 (0.0%) |
| 65 to 74 Years | 9 (27.3%) | 0 (0.0%) |
| 75 Years and over | 4 (14.3%) | 0 (0.0%) |
| Total | 204 (66.2%) | 0 (0.0%) |
Employment Status by Educational Attainment in Turin
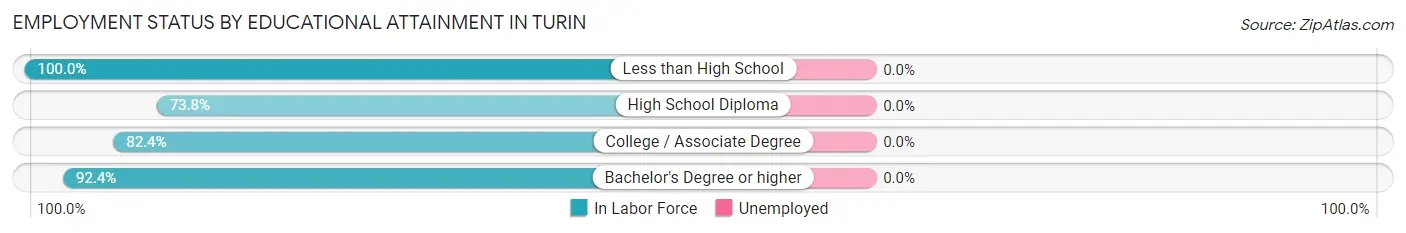
| Educational Attainment | In Labor Force | Unemployed |
| Less than High School | 16 (100.0%) | 0 (0.0%) |
| High School Diploma | 31 (73.8%) | 0 (0.0%) |
| College / Associate Degree | 61 (82.4%) | 0 (0.0%) |
| Bachelor's Degree or higher | 73 (92.4%) | 0 (0.0%) |
| Total | 181 (85.8%) | 0 (0.0%) |
Employment Occupations by Sex in Turin
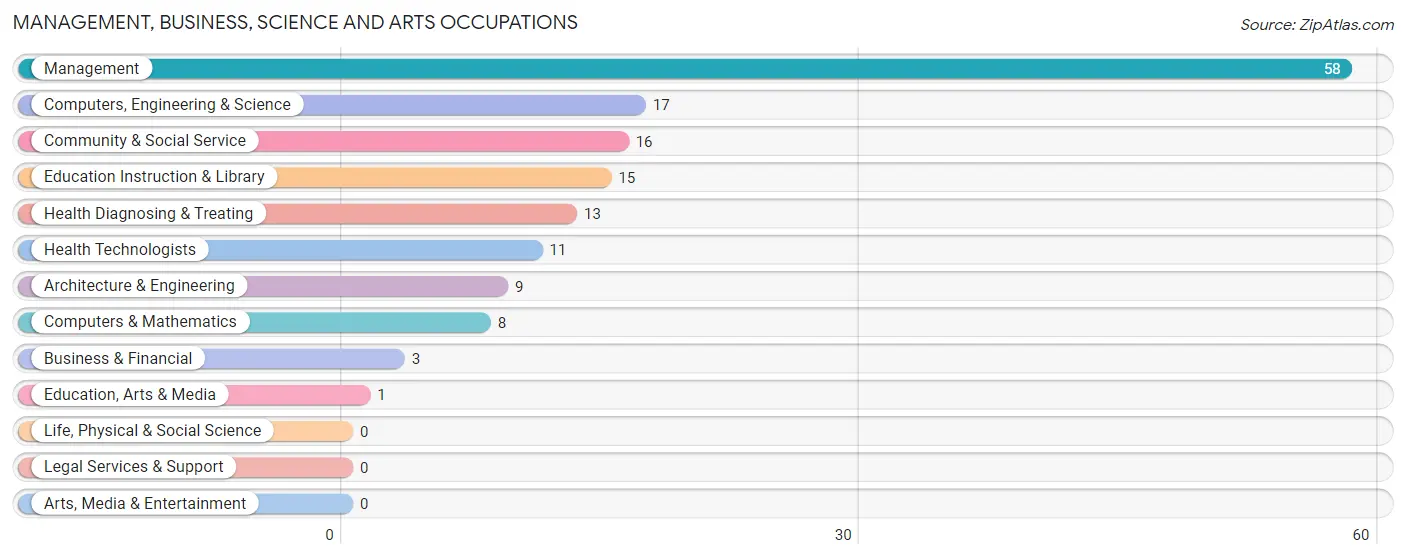
Management, Business, Science and Arts Occupations
The most common Management, Business, Science and Arts occupations in Turin are Management (58 | 28.4%), Computers, Engineering & Science (17 | 8.3%), Community & Social Service (16 | 7.8%), Education Instruction & Library (15 | 7.3%), and Health Diagnosing & Treating (13 | 6.4%).
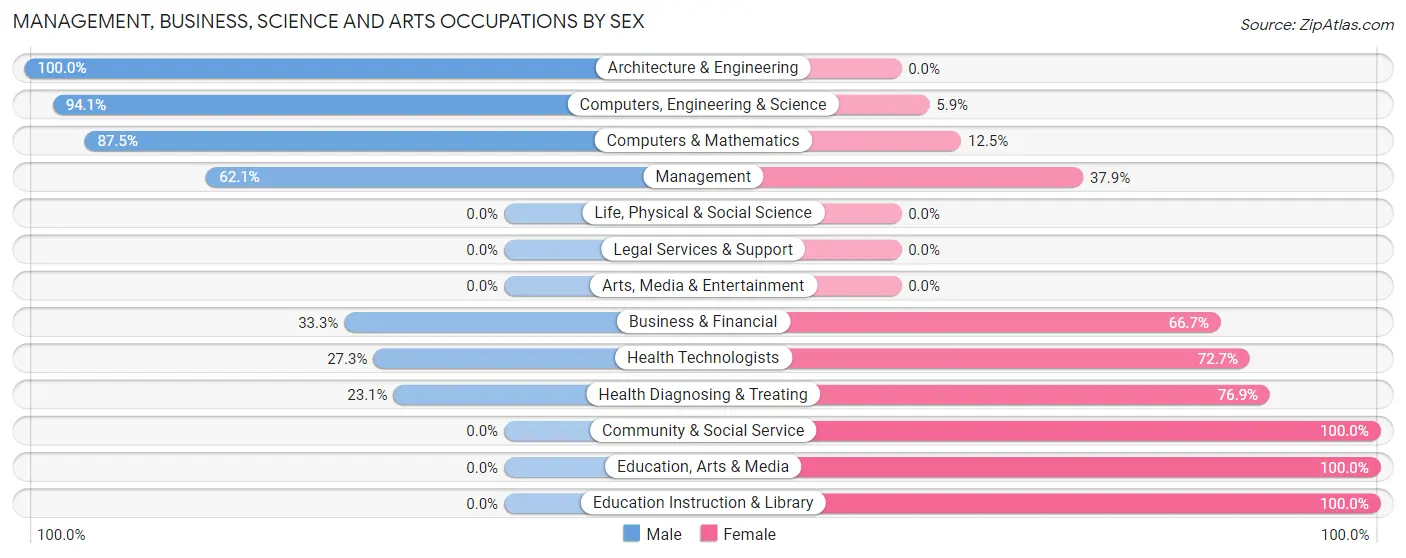
Management, Business, Science and Arts Occupations by Sex
Within the Management, Business, Science and Arts occupations in Turin, the most male-oriented occupations are Architecture & Engineering (100.0%), Computers, Engineering & Science (94.1%), and Computers & Mathematics (87.5%), while the most female-oriented occupations are Community & Social Service (100.0%), Education, Arts & Media (100.0%), and Education Instruction & Library (100.0%).
| Occupation | Male | Female |
| Management | 36 (62.1%) | 22 (37.9%) |
| Business & Financial | 1 (33.3%) | 2 (66.7%) |
| Computers, Engineering & Science | 16 (94.1%) | 1 (5.9%) |
| Computers & Mathematics | 7 (87.5%) | 1 (12.5%) |
| Architecture & Engineering | 9 (100.0%) | 0 (0.0%) |
| Life, Physical & Social Science | 0 (0.0%) | 0 (0.0%) |
| Community & Social Service | 0 (0.0%) | 16 (100.0%) |
| Education, Arts & Media | 0 (0.0%) | 1 (100.0%) |
| Legal Services & Support | 0 (0.0%) | 0 (0.0%) |
| Education Instruction & Library | 0 (0.0%) | 15 (100.0%) |
| Arts, Media & Entertainment | 0 (0.0%) | 0 (0.0%) |
| Health Diagnosing & Treating | 3 (23.1%) | 10 (76.9%) |
| Health Technologists | 3 (27.3%) | 8 (72.7%) |
| Total (Category) | 56 (52.3%) | 51 (47.7%) |
| Total (Overall) | 99 (48.5%) | 105 (51.5%) |
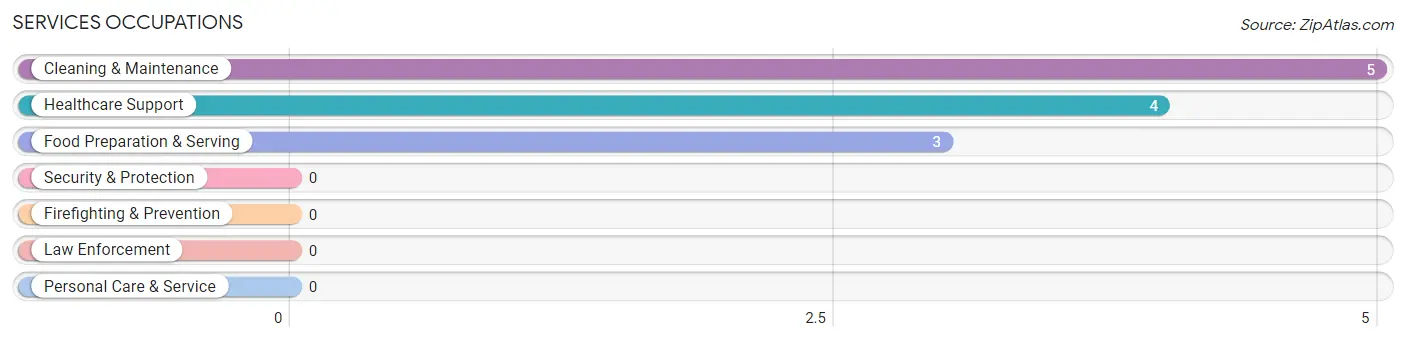
Services Occupations
The most common Services occupations in Turin are Cleaning & Maintenance (5 | 2.5%), Healthcare Support (4 | 2.0%), and Food Preparation & Serving (3 | 1.5%).
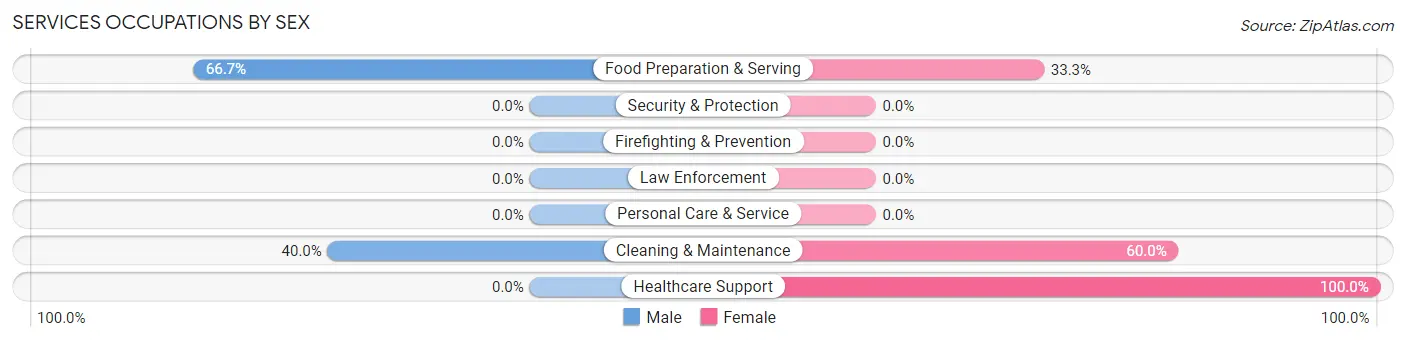
Services Occupations by Sex
Within the Services occupations in Turin, the most male-oriented occupations are Food Preparation & Serving (66.7%), and Cleaning & Maintenance (40.0%), while the most female-oriented occupations are Healthcare Support (100.0%), Cleaning & Maintenance (60.0%), and Food Preparation & Serving (33.3%).
| Occupation | Male | Female |
| Healthcare Support | 0 (0.0%) | 4 (100.0%) |
| Security & Protection | 0 (0.0%) | 0 (0.0%) |
| Firefighting & Prevention | 0 (0.0%) | 0 (0.0%) |
| Law Enforcement | 0 (0.0%) | 0 (0.0%) |
| Food Preparation & Serving | 2 (66.7%) | 1 (33.3%) |
| Cleaning & Maintenance | 2 (40.0%) | 3 (60.0%) |
| Personal Care & Service | 0 (0.0%) | 0 (0.0%) |
| Total (Category) | 4 (33.3%) | 8 (66.7%) |
| Total (Overall) | 99 (48.5%) | 105 (51.5%) |
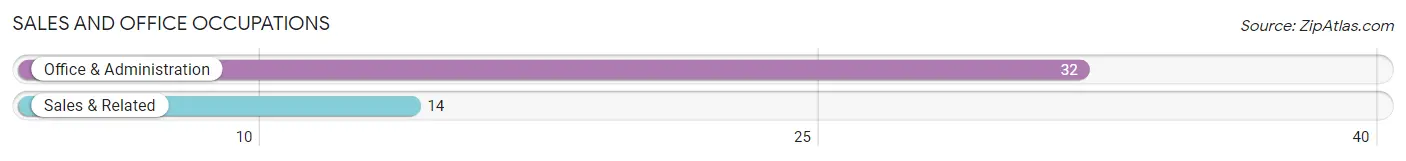
Sales and Office Occupations
The most common Sales and Office occupations in Turin are Office & Administration (32 | 15.7%), and Sales & Related (14 | 6.9%).
Sales and Office Occupations by Sex
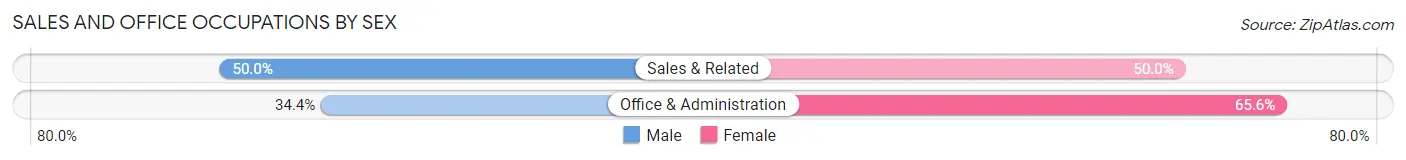
| Occupation | Male | Female |
| Sales & Related | 7 (50.0%) | 7 (50.0%) |
| Office & Administration | 11 (34.4%) | 21 (65.6%) |
| Total (Category) | 18 (39.1%) | 28 (60.9%) |
| Total (Overall) | 99 (48.5%) | 105 (51.5%) |
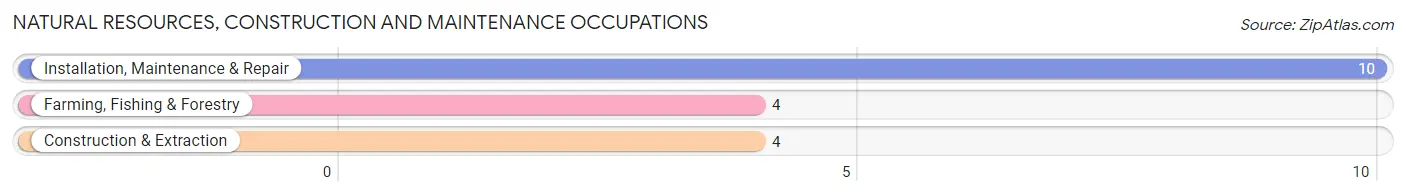
Natural Resources, Construction and Maintenance Occupations
The most common Natural Resources, Construction and Maintenance occupations in Turin are Installation, Maintenance & Repair (10 | 4.9%), Farming, Fishing & Forestry (4 | 2.0%), and Construction & Extraction (4 | 2.0%).
Natural Resources, Construction and Maintenance Occupations by Sex
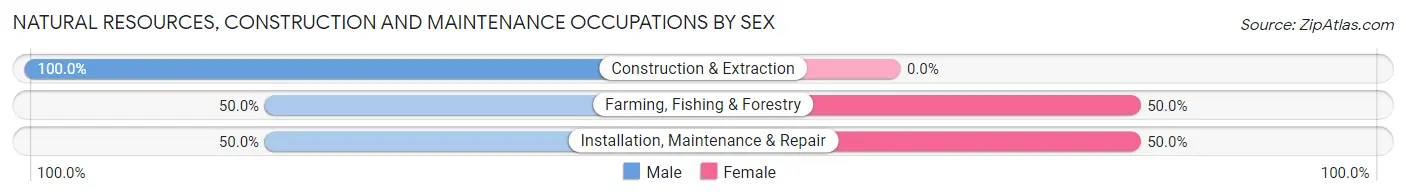
| Occupation | Male | Female |
| Farming, Fishing & Forestry | 2 (50.0%) | 2 (50.0%) |
| Construction & Extraction | 4 (100.0%) | 0 (0.0%) |
| Installation, Maintenance & Repair | 5 (50.0%) | 5 (50.0%) |
| Total (Category) | 11 (61.1%) | 7 (38.9%) |
| Total (Overall) | 99 (48.5%) | 105 (51.5%) |
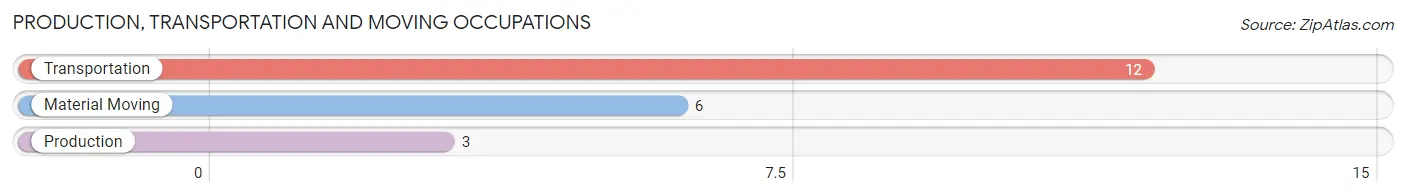
Production, Transportation and Moving Occupations
The most common Production, Transportation and Moving occupations in Turin are Transportation (12 | 5.9%), Material Moving (6 | 2.9%), and Production (3 | 1.5%).
Production, Transportation and Moving Occupations by Sex
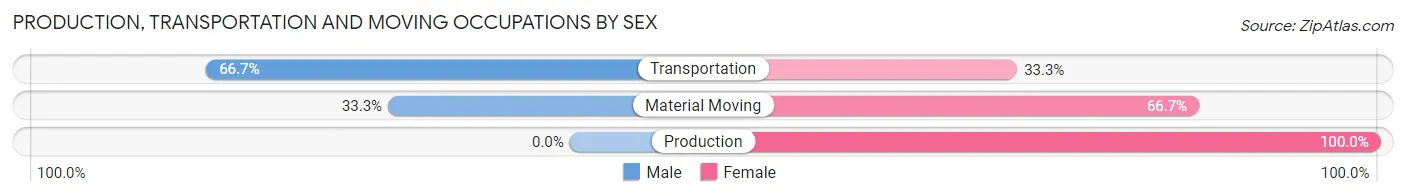
| Occupation | Male | Female |
| Production | 0 (0.0%) | 3 (100.0%) |
| Transportation | 8 (66.7%) | 4 (33.3%) |
| Material Moving | 2 (33.3%) | 4 (66.7%) |
| Total (Category) | 10 (47.6%) | 11 (52.4%) |
| Total (Overall) | 99 (48.5%) | 105 (51.5%) |
Employment Industries by Sex in Turin
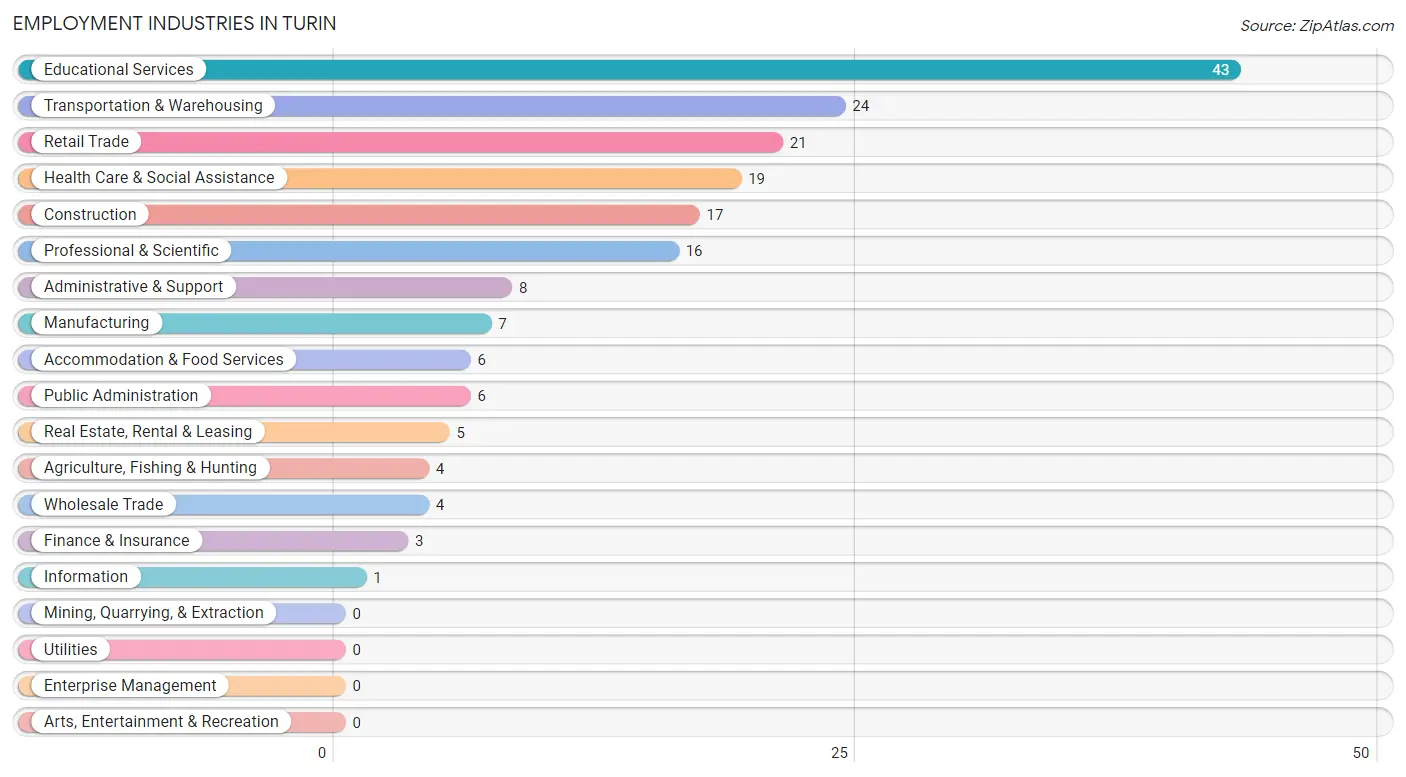
Employment Industries in Turin
The major employment industries in Turin include Educational Services (43 | 21.1%), Transportation & Warehousing (24 | 11.8%), Retail Trade (21 | 10.3%), Health Care & Social Assistance (19 | 9.3%), and Construction (17 | 8.3%).
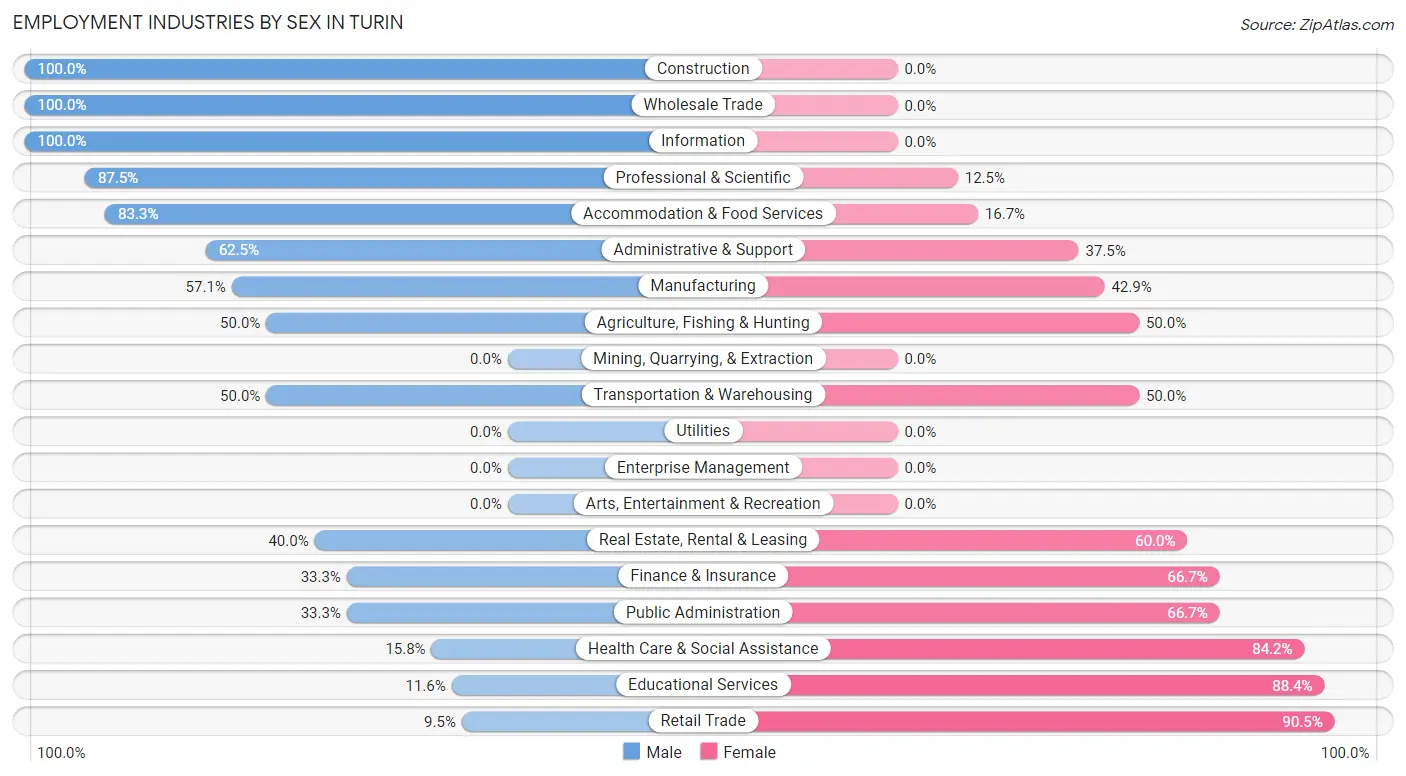
Employment Industries by Sex in Turin
The Turin industries that see more men than women are Construction (100.0%), Wholesale Trade (100.0%), and Information (100.0%), whereas the industries that tend to have a higher number of women are Retail Trade (90.5%), Educational Services (88.4%), and Health Care & Social Assistance (84.2%).
| Industry | Male | Female |
| Agriculture, Fishing & Hunting | 2 (50.0%) | 2 (50.0%) |
| Mining, Quarrying, & Extraction | 0 (0.0%) | 0 (0.0%) |
| Construction | 17 (100.0%) | 0 (0.0%) |
| Manufacturing | 4 (57.1%) | 3 (42.9%) |
| Wholesale Trade | 4 (100.0%) | 0 (0.0%) |
| Retail Trade | 2 (9.5%) | 19 (90.5%) |
| Transportation & Warehousing | 12 (50.0%) | 12 (50.0%) |
| Utilities | 0 (0.0%) | 0 (0.0%) |
| Information | 1 (100.0%) | 0 (0.0%) |
| Finance & Insurance | 1 (33.3%) | 2 (66.7%) |
| Real Estate, Rental & Leasing | 2 (40.0%) | 3 (60.0%) |
| Professional & Scientific | 14 (87.5%) | 2 (12.5%) |
| Enterprise Management | 0 (0.0%) | 0 (0.0%) |
| Administrative & Support | 5 (62.5%) | 3 (37.5%) |
| Educational Services | 5 (11.6%) | 38 (88.4%) |
| Health Care & Social Assistance | 3 (15.8%) | 16 (84.2%) |
| Arts, Entertainment & Recreation | 0 (0.0%) | 0 (0.0%) |
| Accommodation & Food Services | 5 (83.3%) | 1 (16.7%) |
| Public Administration | 2 (33.3%) | 4 (66.7%) |
| Total | 99 (48.5%) | 105 (51.5%) |
Education in Turin
School Enrollment in Turin
The most common levels of schooling among the 74 students in Turin are elementary school (20 | 27.0%), college / undergraduate (19 | 25.7%), and high school (14 | 18.9%).
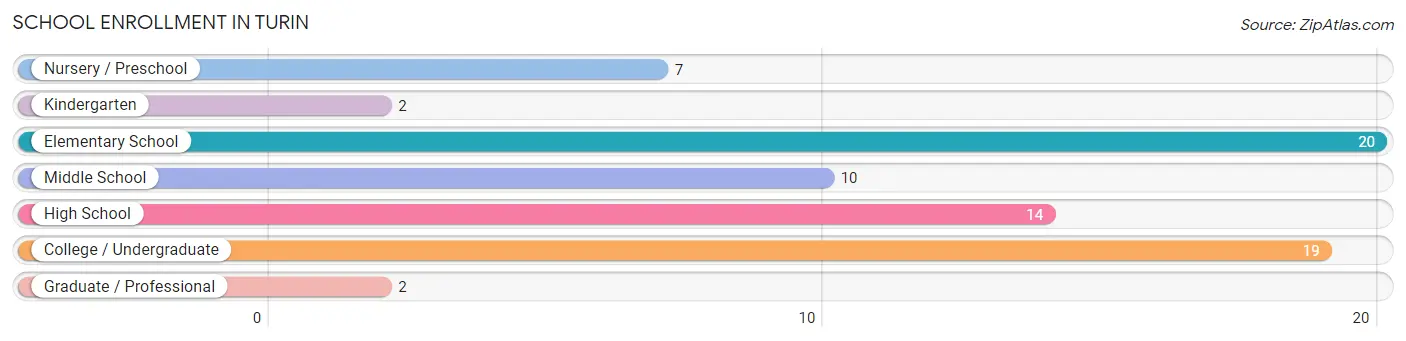
| School Level | # Students | % Students |
| Nursery / Preschool | 7 | 9.5% |
| Kindergarten | 2 | 2.7% |
| Elementary School | 20 | 27.0% |
| Middle School | 10 | 13.5% |
| High School | 14 | 18.9% |
| College / Undergraduate | 19 | 25.7% |
| Graduate / Professional | 2 | 2.7% |
| Total | 74 | 100.0% |
School Enrollment by Age by Funding Source in Turin
Out of a total of 74 students who are enrolled in schools in Turin, 16 (21.6%) attend a private institution, while the remaining 58 (78.4%) are enrolled in public schools. The age group of 3 to 4 year olds has the highest likelihood of being enrolled in private schools, with 5 (71.4% in the age bracket) enrolled. Conversely, the age group of 15 to 17 year olds has the lowest likelihood of being enrolled in a private school, with 11 (100.0% in the age bracket) attending a public institution.
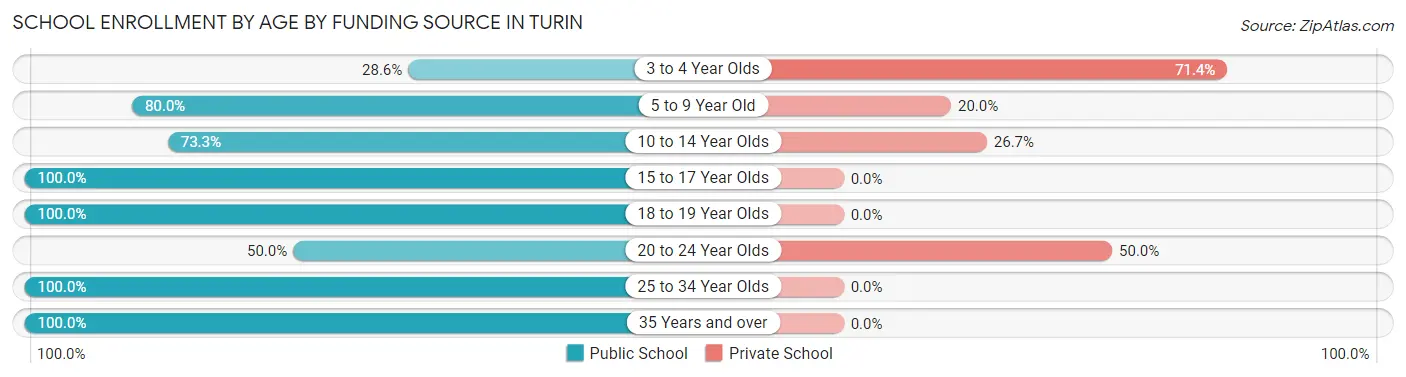
| Age Bracket | Public School | Private School |
| 3 to 4 Year Olds | 2 (28.6%) | 5 (71.4%) |
| 5 to 9 Year Old | 16 (80.0%) | 4 (20.0%) |
| 10 to 14 Year Olds | 11 (73.3%) | 4 (26.7%) |
| 15 to 17 Year Olds | 11 (100.0%) | 0 (0.0%) |
| 18 to 19 Year Olds | 5 (100.0%) | 0 (0.0%) |
| 20 to 24 Year Olds | 3 (50.0%) | 3 (50.0%) |
| 25 to 34 Year Olds | 6 (100.0%) | 0 (0.0%) |
| 35 Years and over | 4 (100.0%) | 0 (0.0%) |
| Total | 58 (78.4%) | 16 (21.6%) |
Educational Attainment by Field of Study in Turin
Education (32 | 31.7%), business (12 | 11.9%), communications (10 | 9.9%), engineering (9 | 8.9%), and science & technology (9 | 8.9%) are the most common fields of study among 101 individuals in Turin who have obtained a bachelor's degree or higher.
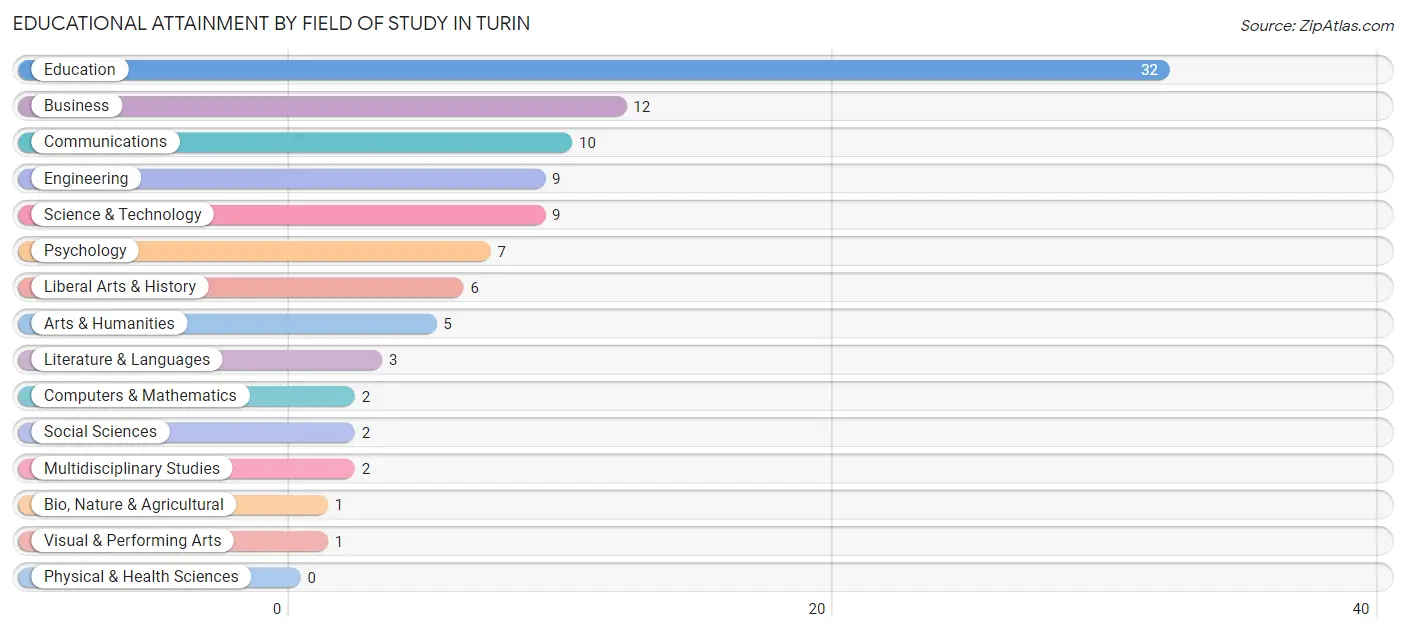
| Field of Study | # Graduates | % Graduates |
| Computers & Mathematics | 2 | 2.0% |
| Bio, Nature & Agricultural | 1 | 1.0% |
| Physical & Health Sciences | 0 | 0.0% |
| Psychology | 7 | 6.9% |
| Social Sciences | 2 | 2.0% |
| Engineering | 9 | 8.9% |
| Multidisciplinary Studies | 2 | 2.0% |
| Science & Technology | 9 | 8.9% |
| Business | 12 | 11.9% |
| Education | 32 | 31.7% |
| Literature & Languages | 3 | 3.0% |
| Liberal Arts & History | 6 | 5.9% |
| Visual & Performing Arts | 1 | 1.0% |
| Communications | 10 | 9.9% |
| Arts & Humanities | 5 | 5.0% |
| Total | 101 | 100.0% |
Transportation & Commute in Turin
Vehicle Availability by Sex in Turin
The most prevalent vehicle ownership categories in Turin are males with 2 vehicles (62, accounting for 62.6%) and females with 2 vehicles (49, making up 60.8%).
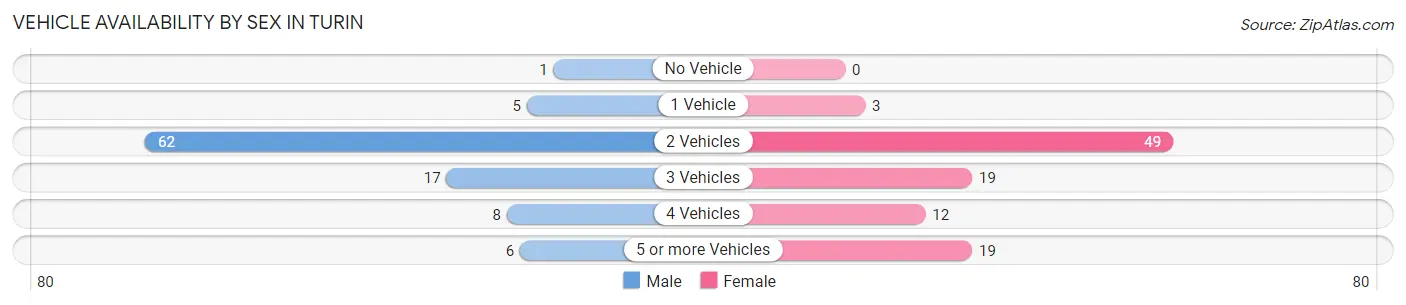
| Vehicles Available | Male | Female |
| No Vehicle | 1 (1.0%) | 0 (0.0%) |
| 1 Vehicle | 5 (5.1%) | 3 (2.9%) |
| 2 Vehicles | 62 (62.6%) | 49 (48.0%) |
| 3 Vehicles | 17 (17.2%) | 19 (18.6%) |
| 4 Vehicles | 8 (8.1%) | 12 (11.8%) |
| 5 or more Vehicles | 6 (6.1%) | 19 (18.6%) |
| Total | 99 (100.0%) | 102 (100.0%) |
Commute Time in Turin
The most frequently occuring commute durations in Turin are 20 to 24 minutes (43 commuters, 25.2%), 40 to 44 minutes (22 commuters, 12.9%), and 5 to 9 minutes (19 commuters, 11.1%).
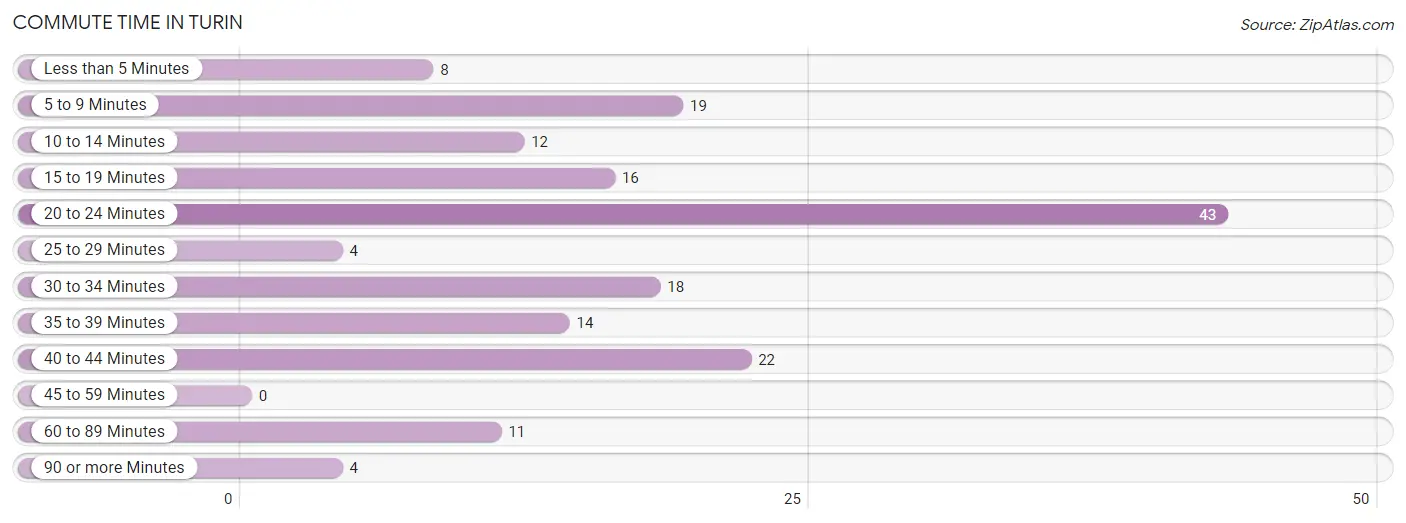
| Commute Time | # Commuters | % Commuters |
| Less than 5 Minutes | 8 | 4.7% |
| 5 to 9 Minutes | 19 | 11.1% |
| 10 to 14 Minutes | 12 | 7.0% |
| 15 to 19 Minutes | 16 | 9.4% |
| 20 to 24 Minutes | 43 | 25.2% |
| 25 to 29 Minutes | 4 | 2.3% |
| 30 to 34 Minutes | 18 | 10.5% |
| 35 to 39 Minutes | 14 | 8.2% |
| 40 to 44 Minutes | 22 | 12.9% |
| 45 to 59 Minutes | 0 | 0.0% |
| 60 to 89 Minutes | 11 | 6.4% |
| 90 or more Minutes | 4 | 2.3% |
Commute Time by Sex in Turin
The most common commute times in Turin are 40 to 44 minutes (20 commuters, 23.3%) for males and 20 to 24 minutes (33 commuters, 38.8%) for females.
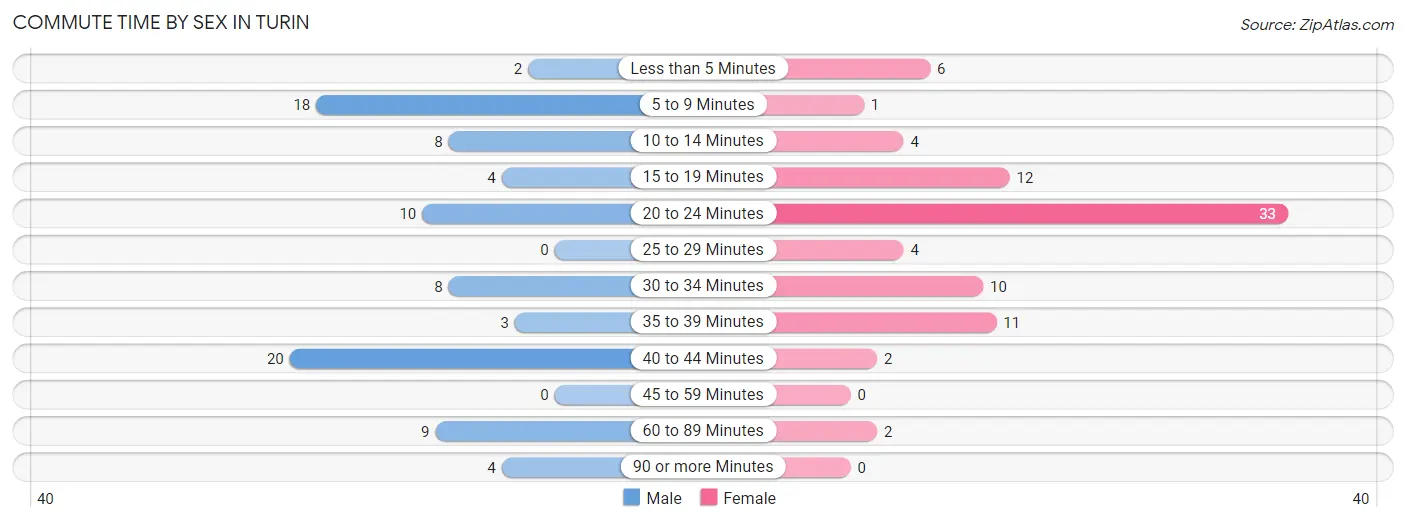
| Commute Time | Male | Female |
| Less than 5 Minutes | 2 (2.3%) | 6 (7.1%) |
| 5 to 9 Minutes | 18 (20.9%) | 1 (1.2%) |
| 10 to 14 Minutes | 8 (9.3%) | 4 (4.7%) |
| 15 to 19 Minutes | 4 (4.6%) | 12 (14.1%) |
| 20 to 24 Minutes | 10 (11.6%) | 33 (38.8%) |
| 25 to 29 Minutes | 0 (0.0%) | 4 (4.7%) |
| 30 to 34 Minutes | 8 (9.3%) | 10 (11.8%) |
| 35 to 39 Minutes | 3 (3.5%) | 11 (12.9%) |
| 40 to 44 Minutes | 20 (23.3%) | 2 (2.4%) |
| 45 to 59 Minutes | 0 (0.0%) | 0 (0.0%) |
| 60 to 89 Minutes | 9 (10.5%) | 2 (2.4%) |
| 90 or more Minutes | 4 (4.6%) | 0 (0.0%) |
Time of Departure to Work by Sex in Turin
The most frequent times of departure to work in Turin are 6:30 AM to 6:59 AM (23, 26.7%) for males and 7:30 AM to 7:59 AM (34, 40.0%) for females.
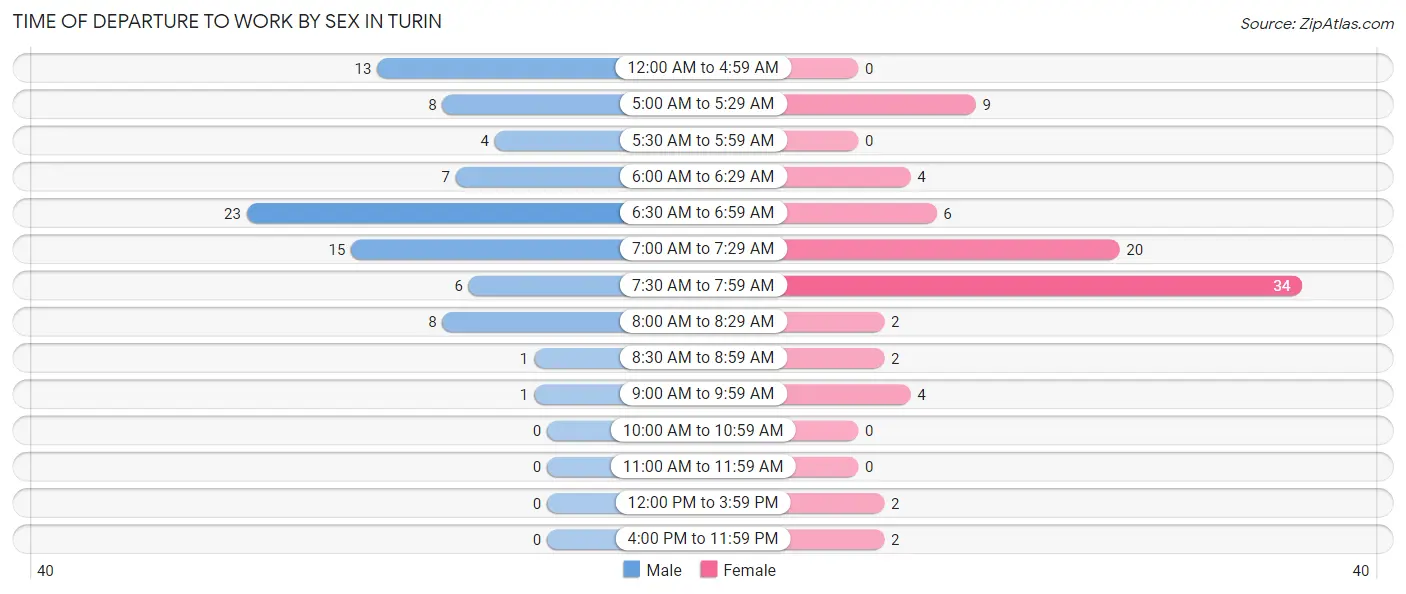
| Time of Departure | Male | Female |
| 12:00 AM to 4:59 AM | 13 (15.1%) | 0 (0.0%) |
| 5:00 AM to 5:29 AM | 8 (9.3%) | 9 (10.6%) |
| 5:30 AM to 5:59 AM | 4 (4.6%) | 0 (0.0%) |
| 6:00 AM to 6:29 AM | 7 (8.1%) | 4 (4.7%) |
| 6:30 AM to 6:59 AM | 23 (26.7%) | 6 (7.1%) |
| 7:00 AM to 7:29 AM | 15 (17.4%) | 20 (23.5%) |
| 7:30 AM to 7:59 AM | 6 (7.0%) | 34 (40.0%) |
| 8:00 AM to 8:29 AM | 8 (9.3%) | 2 (2.4%) |
| 8:30 AM to 8:59 AM | 1 (1.2%) | 2 (2.4%) |
| 9:00 AM to 9:59 AM | 1 (1.2%) | 4 (4.7%) |
| 10:00 AM to 10:59 AM | 0 (0.0%) | 0 (0.0%) |
| 11:00 AM to 11:59 AM | 0 (0.0%) | 0 (0.0%) |
| 12:00 PM to 3:59 PM | 0 (0.0%) | 2 (2.4%) |
| 4:00 PM to 11:59 PM | 0 (0.0%) | 2 (2.4%) |
| Total | 86 (100.0%) | 85 (100.0%) |
Housing Occupancy in Turin
Occupancy by Ownership in Turin
Of the total 134 dwellings in Turin, owner-occupied units account for 111 (82.8%), while renter-occupied units make up 23 (17.2%).
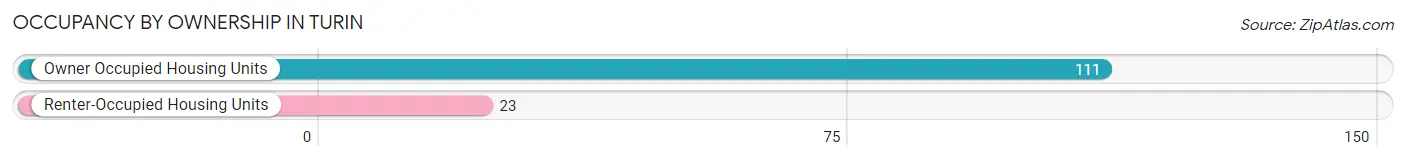
| Occupancy | # Housing Units | % Housing Units |
| Owner Occupied Housing Units | 111 | 82.8% |
| Renter-Occupied Housing Units | 23 | 17.2% |
| Total Occupied Housing Units | 134 | 100.0% |
Occupancy by Household Size in Turin
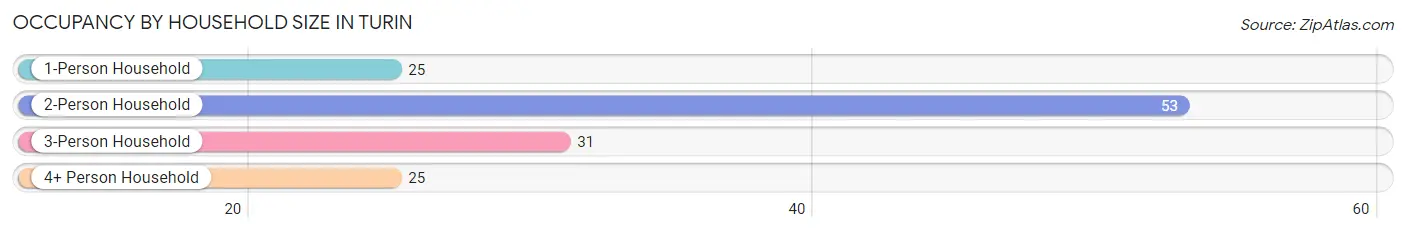
| Household Size | # Housing Units | % Housing Units |
| 1-Person Household | 25 | 18.7% |
| 2-Person Household | 53 | 39.6% |
| 3-Person Household | 31 | 23.1% |
| 4+ Person Household | 25 | 18.7% |
| Total Housing Units | 134 | 100.0% |
Occupancy by Ownership by Household Size in Turin
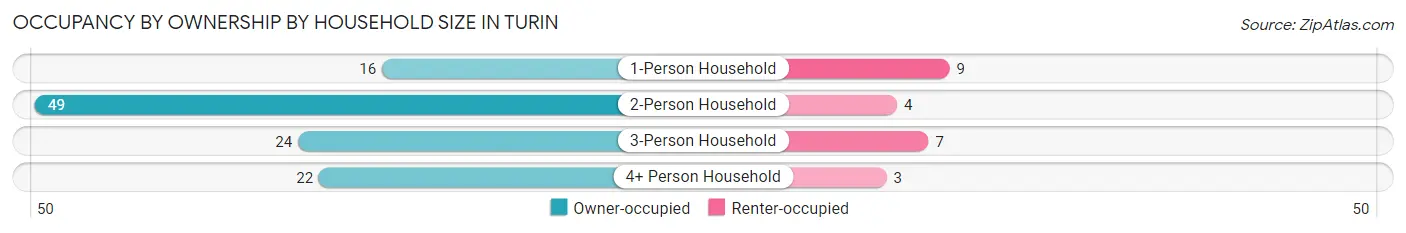
| Household Size | Owner-occupied | Renter-occupied |
| 1-Person Household | 16 (64.0%) | 9 (36.0%) |
| 2-Person Household | 49 (92.4%) | 4 (7.5%) |
| 3-Person Household | 24 (77.4%) | 7 (22.6%) |
| 4+ Person Household | 22 (88.0%) | 3 (12.0%) |
| Total Housing Units | 111 (82.8%) | 23 (17.2%) |
Occupancy by Educational Attainment in Turin
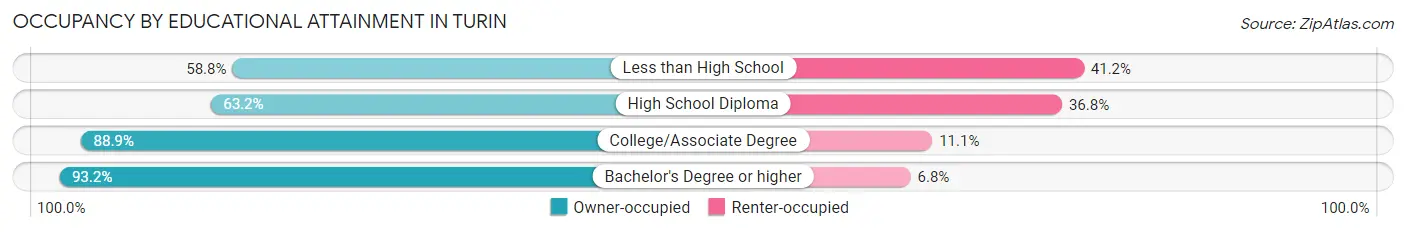
| Household Size | Owner-occupied | Renter-occupied |
| Less than High School | 10 (58.8%) | 7 (41.2%) |
| High School Diploma | 12 (63.2%) | 7 (36.8%) |
| College/Associate Degree | 48 (88.9%) | 6 (11.1%) |
| Bachelor's Degree or higher | 41 (93.2%) | 3 (6.8%) |
Occupancy by Age of Householder in Turin
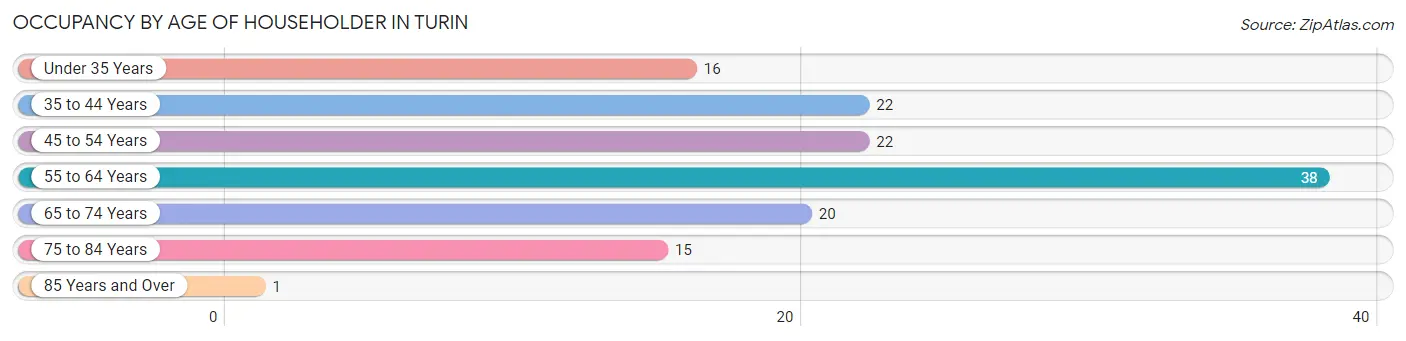
| Age Bracket | # Households | % Households |
| Under 35 Years | 16 | 11.9% |
| 35 to 44 Years | 22 | 16.4% |
| 45 to 54 Years | 22 | 16.4% |
| 55 to 64 Years | 38 | 28.4% |
| 65 to 74 Years | 20 | 14.9% |
| 75 to 84 Years | 15 | 11.2% |
| 85 Years and Over | 1 | 0.7% |
| Total | 134 | 100.0% |
Housing Finances in Turin
Median Income by Occupancy in Turin
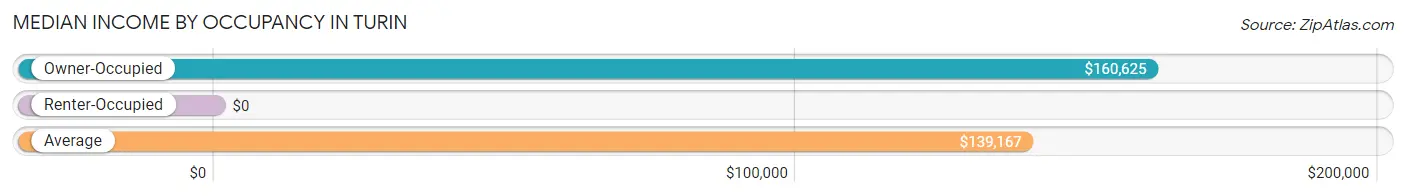
| Occupancy Type | # Households | Median Income |
| Owner-Occupied | 111 (82.8%) | $160,625 |
| Renter-Occupied | 23 (17.2%) | $0 |
| Average | 134 (100.0%) | $139,167 |
Occupancy by Householder Income Bracket in Turin
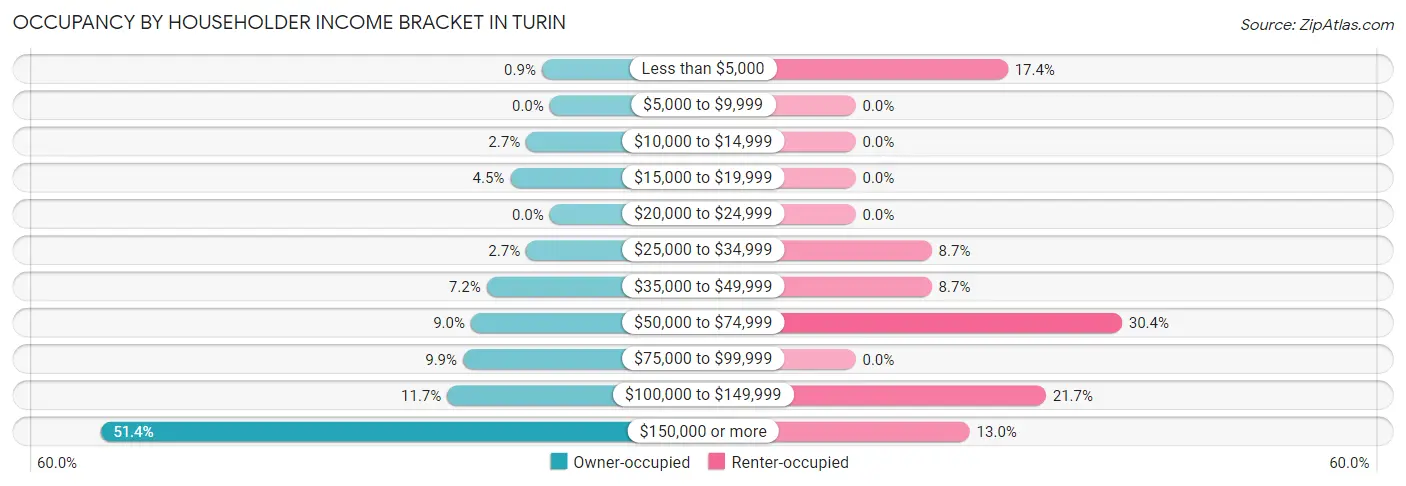
| Income Bracket | Owner-occupied | Renter-occupied |
| Less than $5,000 | 1 (0.9%) | 4 (17.4%) |
| $5,000 to $9,999 | 0 (0.0%) | 0 (0.0%) |
| $10,000 to $14,999 | 3 (2.7%) | 0 (0.0%) |
| $15,000 to $19,999 | 5 (4.5%) | 0 (0.0%) |
| $20,000 to $24,999 | 0 (0.0%) | 0 (0.0%) |
| $25,000 to $34,999 | 3 (2.7%) | 2 (8.7%) |
| $35,000 to $49,999 | 8 (7.2%) | 2 (8.7%) |
| $50,000 to $74,999 | 10 (9.0%) | 7 (30.4%) |
| $75,000 to $99,999 | 11 (9.9%) | 0 (0.0%) |
| $100,000 to $149,999 | 13 (11.7%) | 5 (21.7%) |
| $150,000 or more | 57 (51.3%) | 3 (13.0%) |
| Total | 111 (100.0%) | 23 (100.0%) |
Monthly Housing Cost Tiers in Turin
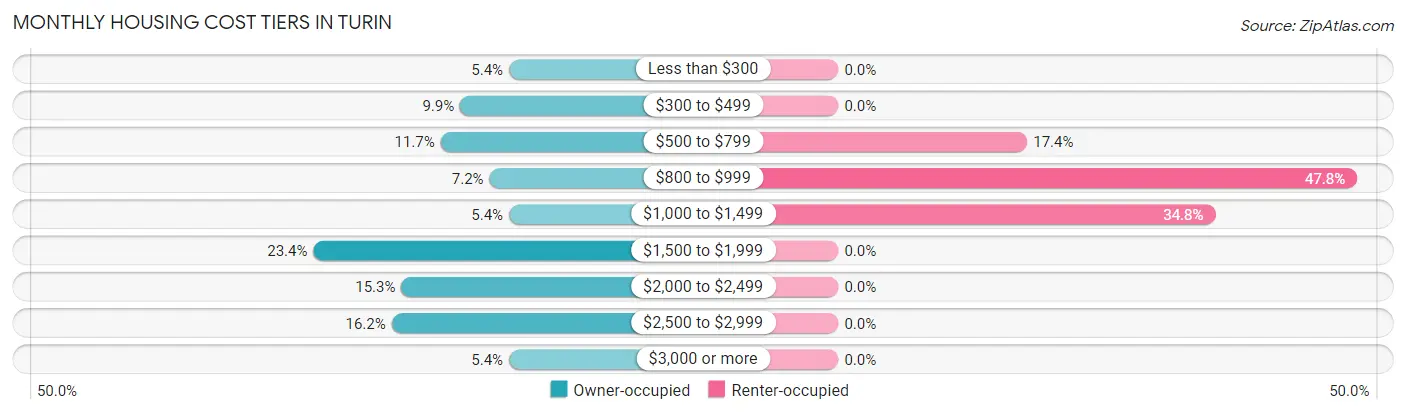
| Monthly Cost | Owner-occupied | Renter-occupied |
| Less than $300 | 6 (5.4%) | 0 (0.0%) |
| $300 to $499 | 11 (9.9%) | 0 (0.0%) |
| $500 to $799 | 13 (11.7%) | 4 (17.4%) |
| $800 to $999 | 8 (7.2%) | 11 (47.8%) |
| $1,000 to $1,499 | 6 (5.4%) | 8 (34.8%) |
| $1,500 to $1,999 | 26 (23.4%) | 0 (0.0%) |
| $2,000 to $2,499 | 17 (15.3%) | 0 (0.0%) |
| $2,500 to $2,999 | 18 (16.2%) | 0 (0.0%) |
| $3,000 or more | 6 (5.4%) | 0 (0.0%) |
| Total | 111 (100.0%) | 23 (100.0%) |
Physical Housing Characteristics in Turin
Housing Structures in Turin
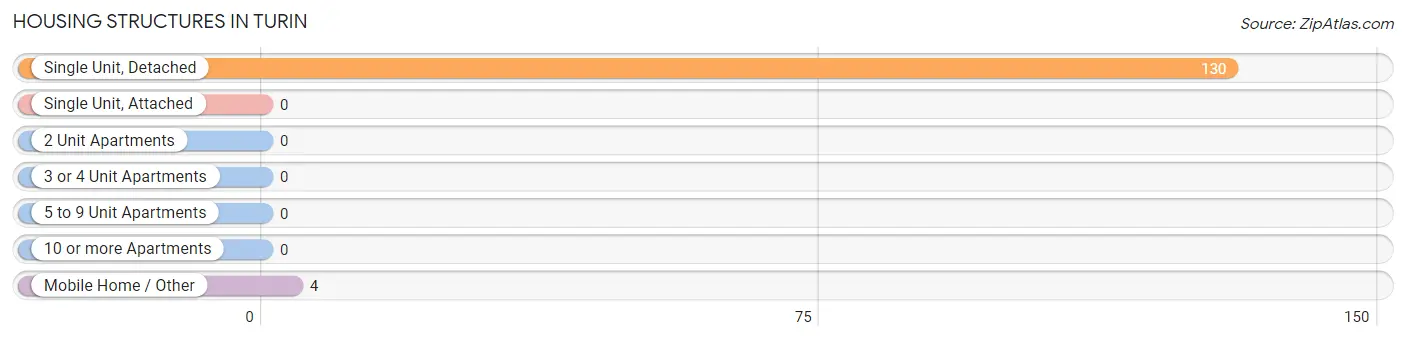
| Structure Type | # Housing Units | % Housing Units |
| Single Unit, Detached | 130 | 97.0% |
| Single Unit, Attached | 0 | 0.0% |
| 2 Unit Apartments | 0 | 0.0% |
| 3 or 4 Unit Apartments | 0 | 0.0% |
| 5 to 9 Unit Apartments | 0 | 0.0% |
| 10 or more Apartments | 0 | 0.0% |
| Mobile Home / Other | 4 | 3.0% |
| Total | 134 | 100.0% |
Housing Structures by Occupancy in Turin
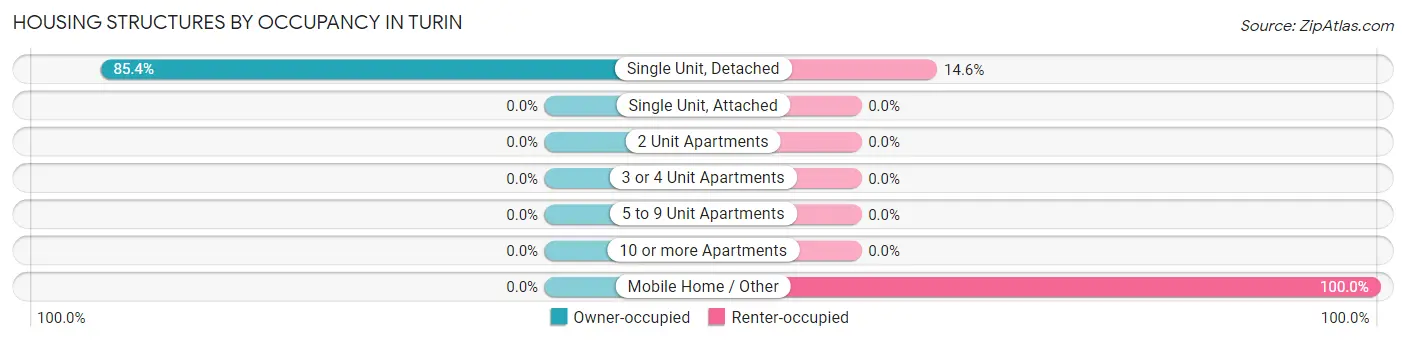
| Structure Type | Owner-occupied | Renter-occupied |
| Single Unit, Detached | 111 (85.4%) | 19 (14.6%) |
| Single Unit, Attached | 0 (0.0%) | 0 (0.0%) |
| 2 Unit Apartments | 0 (0.0%) | 0 (0.0%) |
| 3 or 4 Unit Apartments | 0 (0.0%) | 0 (0.0%) |
| 5 to 9 Unit Apartments | 0 (0.0%) | 0 (0.0%) |
| 10 or more Apartments | 0 (0.0%) | 0 (0.0%) |
| Mobile Home / Other | 0 (0.0%) | 4 (100.0%) |
| Total | 111 (82.8%) | 23 (17.2%) |
Housing Structures by Number of Rooms in Turin
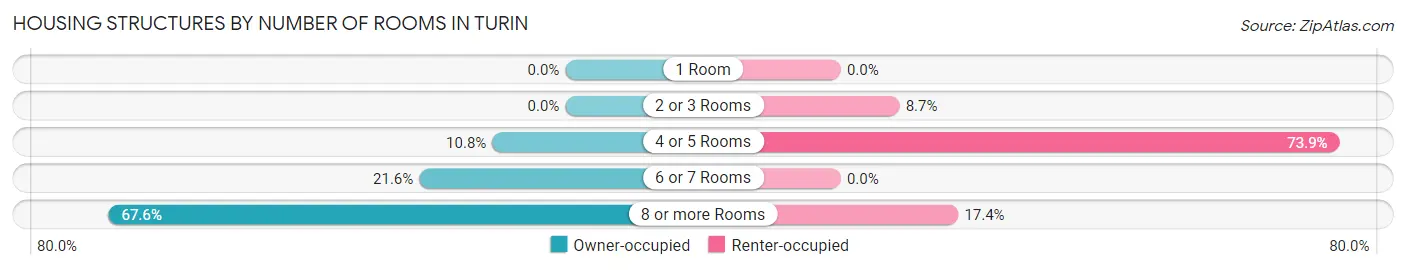
| Number of Rooms | Owner-occupied | Renter-occupied |
| 1 Room | 0 (0.0%) | 0 (0.0%) |
| 2 or 3 Rooms | 0 (0.0%) | 2 (8.7%) |
| 4 or 5 Rooms | 12 (10.8%) | 17 (73.9%) |
| 6 or 7 Rooms | 24 (21.6%) | 0 (0.0%) |
| 8 or more Rooms | 75 (67.6%) | 4 (17.4%) |
| Total | 111 (100.0%) | 23 (100.0%) |
Housing Structure by Heating Type in Turin
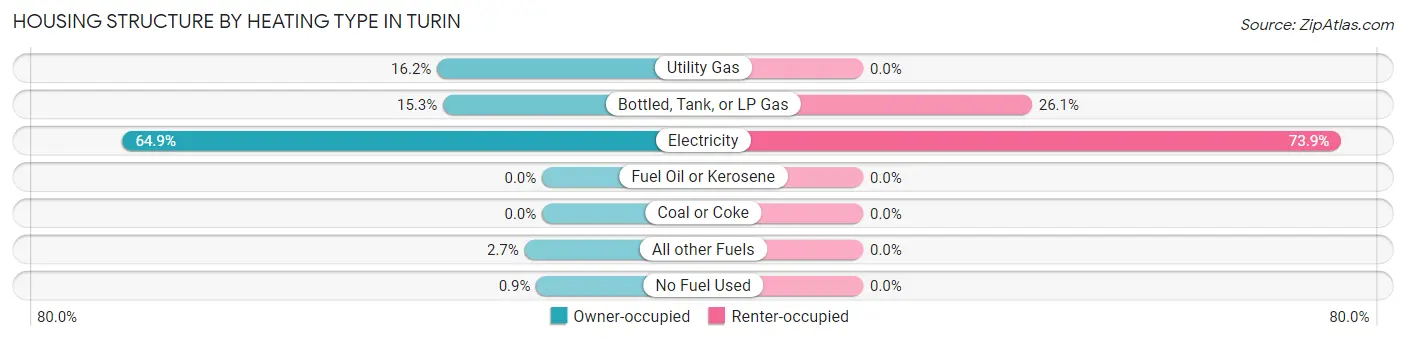
| Heating Type | Owner-occupied | Renter-occupied |
| Utility Gas | 18 (16.2%) | 0 (0.0%) |
| Bottled, Tank, or LP Gas | 17 (15.3%) | 6 (26.1%) |
| Electricity | 72 (64.9%) | 17 (73.9%) |
| Fuel Oil or Kerosene | 0 (0.0%) | 0 (0.0%) |
| Coal or Coke | 0 (0.0%) | 0 (0.0%) |
| All other Fuels | 3 (2.7%) | 0 (0.0%) |
| No Fuel Used | 1 (0.9%) | 0 (0.0%) |
| Total | 111 (100.0%) | 23 (100.0%) |
Household Vehicle Usage in Turin
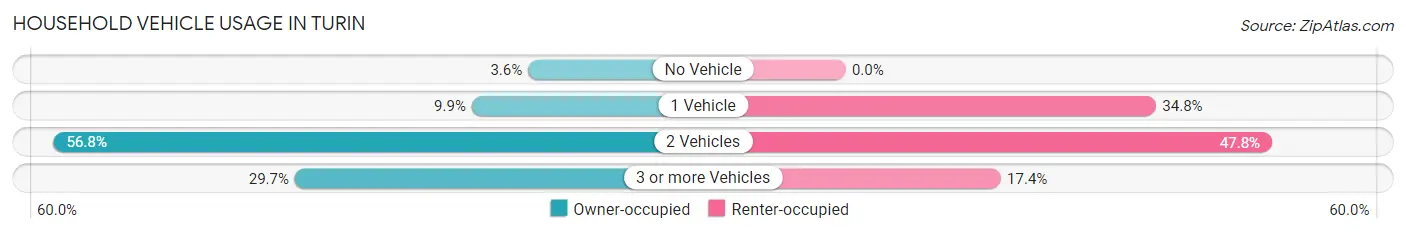
| Vehicles per Household | Owner-occupied | Renter-occupied |
| No Vehicle | 4 (3.6%) | 0 (0.0%) |
| 1 Vehicle | 11 (9.9%) | 8 (34.8%) |
| 2 Vehicles | 63 (56.8%) | 11 (47.8%) |
| 3 or more Vehicles | 33 (29.7%) | 4 (17.4%) |
| Total | 111 (100.0%) | 23 (100.0%) |
Real Estate & Mortgages in Turin
Real Estate and Mortgage Overview in Turin
| Characteristic | Without Mortgage | With Mortgage |
| Housing Units | 29 | 82 |
| Median Property Value | $404,500 | $454,100 |
| Median Household Income | $59,688 | $50 |
| Monthly Housing Costs | $650 | $6 |
| Real Estate Taxes | $3,500 | $0 |
Property Value by Mortgage Status in Turin
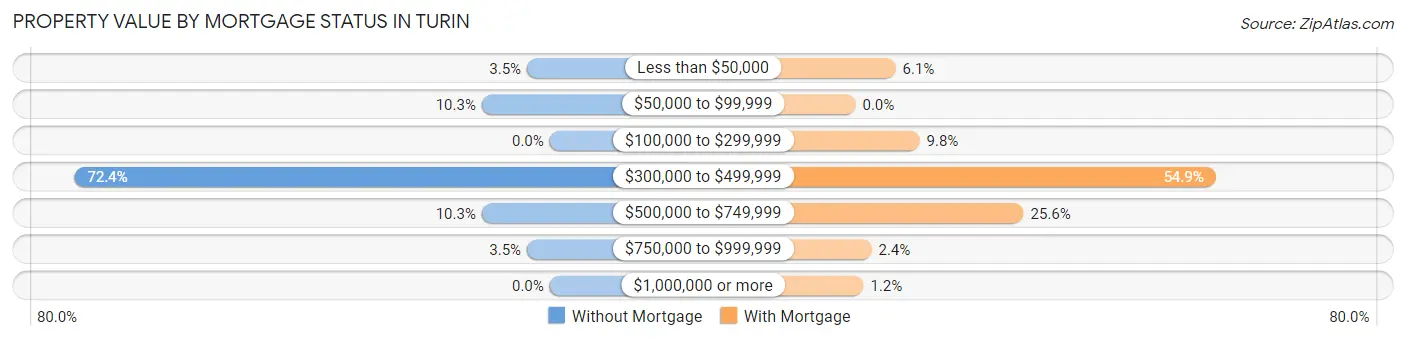
| Property Value | Without Mortgage | With Mortgage |
| Less than $50,000 | 1 (3.5%) | 5 (6.1%) |
| $50,000 to $99,999 | 3 (10.3%) | 0 (0.0%) |
| $100,000 to $299,999 | 0 (0.0%) | 8 (9.8%) |
| $300,000 to $499,999 | 21 (72.4%) | 45 (54.9%) |
| $500,000 to $749,999 | 3 (10.3%) | 21 (25.6%) |
| $750,000 to $999,999 | 1 (3.5%) | 2 (2.4%) |
| $1,000,000 or more | 0 (0.0%) | 1 (1.2%) |
| Total | 29 (100.0%) | 82 (100.0%) |
Household Income by Mortgage Status in Turin
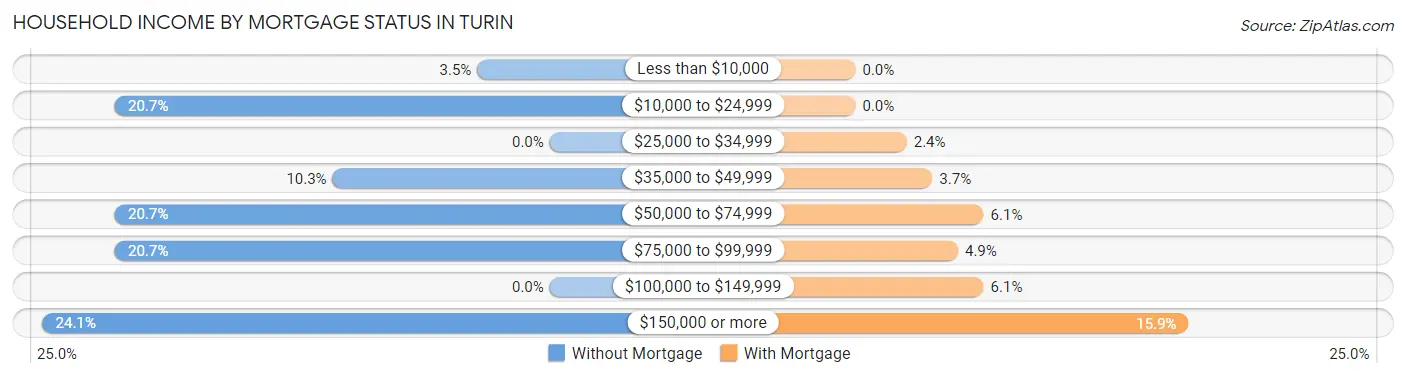
| Household Income | Without Mortgage | With Mortgage |
| Less than $10,000 | 1 (3.5%) | 0 (0.0%) |
| $10,000 to $24,999 | 6 (20.7%) | 0 (0.0%) |
| $25,000 to $34,999 | 0 (0.0%) | 2 (2.4%) |
| $35,000 to $49,999 | 3 (10.3%) | 3 (3.7%) |
| $50,000 to $74,999 | 6 (20.7%) | 5 (6.1%) |
| $75,000 to $99,999 | 6 (20.7%) | 4 (4.9%) |
| $100,000 to $149,999 | 0 (0.0%) | 5 (6.1%) |
| $150,000 or more | 7 (24.1%) | 13 (15.9%) |
| Total | 29 (100.0%) | 82 (100.0%) |
Property Value to Household Income Ratio in Turin
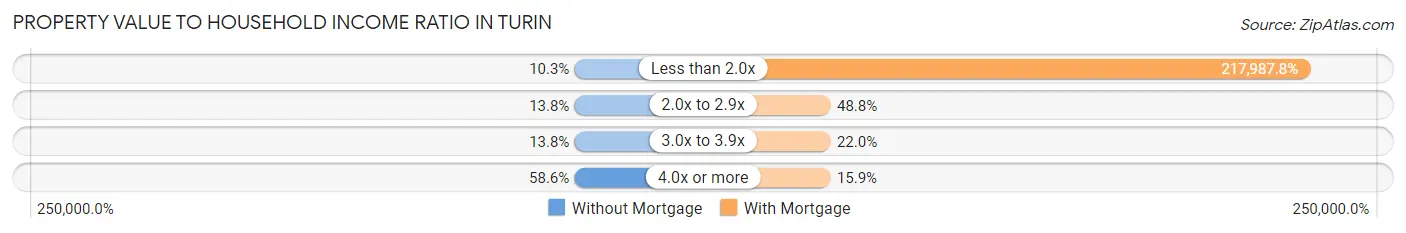
| Value-to-Income Ratio | Without Mortgage | With Mortgage |
| Less than 2.0x | 3 (10.3%) | 178,750 (217,987.8%) |
| 2.0x to 2.9x | 4 (13.8%) | 40 (48.8%) |
| 3.0x to 3.9x | 4 (13.8%) | 18 (22.0%) |
| 4.0x or more | 17 (58.6%) | 13 (15.9%) |
| Total | 29 (100.0%) | 82 (100.0%) |
Real Estate Taxes by Mortgage Status in Turin
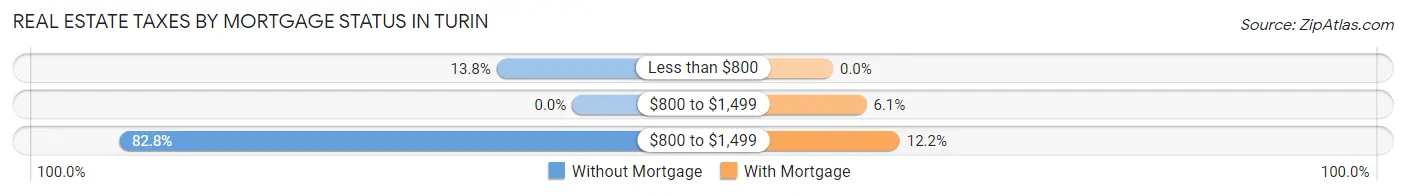
| Property Taxes | Without Mortgage | With Mortgage |
| Less than $800 | 4 (13.8%) | 0 (0.0%) |
| $800 to $1,499 | 0 (0.0%) | 5 (6.1%) |
| $800 to $1,499 | 24 (82.8%) | 10 (12.2%) |
| Total | 29 (100.0%) | 82 (100.0%) |
Health & Disability in Turin
Health Insurance Coverage by Age in Turin
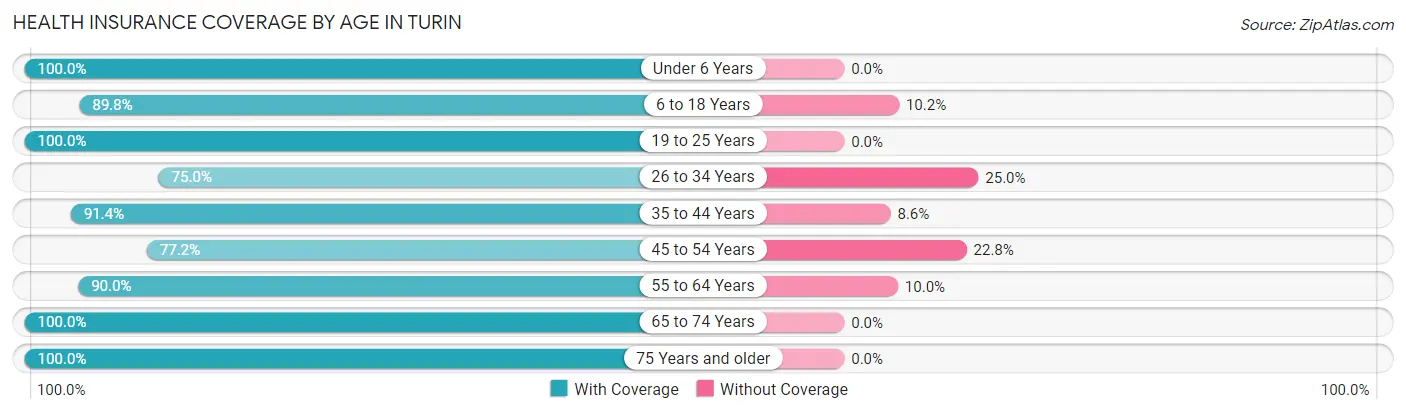
| Age Bracket | With Coverage | Without Coverage |
| Under 6 Years | 33 (100.0%) | 0 (0.0%) |
| 6 to 18 Years | 44 (89.8%) | 5 (10.2%) |
| 19 to 25 Years | 24 (100.0%) | 0 (0.0%) |
| 26 to 34 Years | 27 (75.0%) | 9 (25.0%) |
| 35 to 44 Years | 53 (91.4%) | 5 (8.6%) |
| 45 to 54 Years | 44 (77.2%) | 13 (22.8%) |
| 55 to 64 Years | 54 (90.0%) | 6 (10.0%) |
| 65 to 74 Years | 33 (100.0%) | 0 (0.0%) |
| 75 Years and older | 28 (100.0%) | 0 (0.0%) |
| Total | 340 (89.9%) | 38 (10.1%) |
Health Insurance Coverage by Citizenship Status in Turin
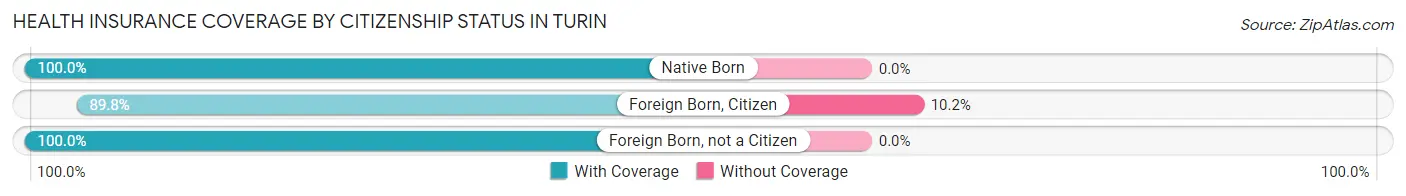
| Citizenship Status | With Coverage | Without Coverage |
| Native Born | 33 (100.0%) | 0 (0.0%) |
| Foreign Born, Citizen | 44 (89.8%) | 5 (10.2%) |
| Foreign Born, not a Citizen | 24 (100.0%) | 0 (0.0%) |
Health Insurance Coverage by Household Income in Turin
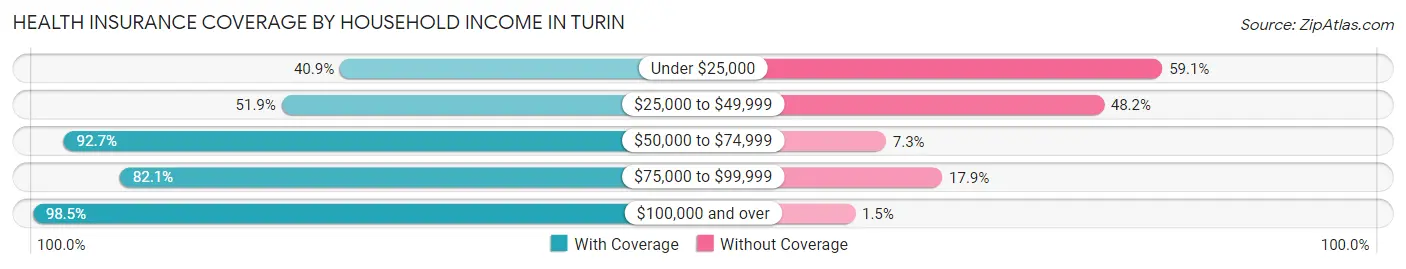
| Household Income | With Coverage | Without Coverage |
| Under $25,000 | 9 (40.9%) | 13 (59.1%) |
| $25,000 to $49,999 | 14 (51.8%) | 13 (48.1%) |
| $50,000 to $74,999 | 38 (92.7%) | 3 (7.3%) |
| $75,000 to $99,999 | 23 (82.1%) | 5 (17.9%) |
| $100,000 and over | 256 (98.5%) | 4 (1.5%) |
Public vs Private Health Insurance Coverage by Age in Turin
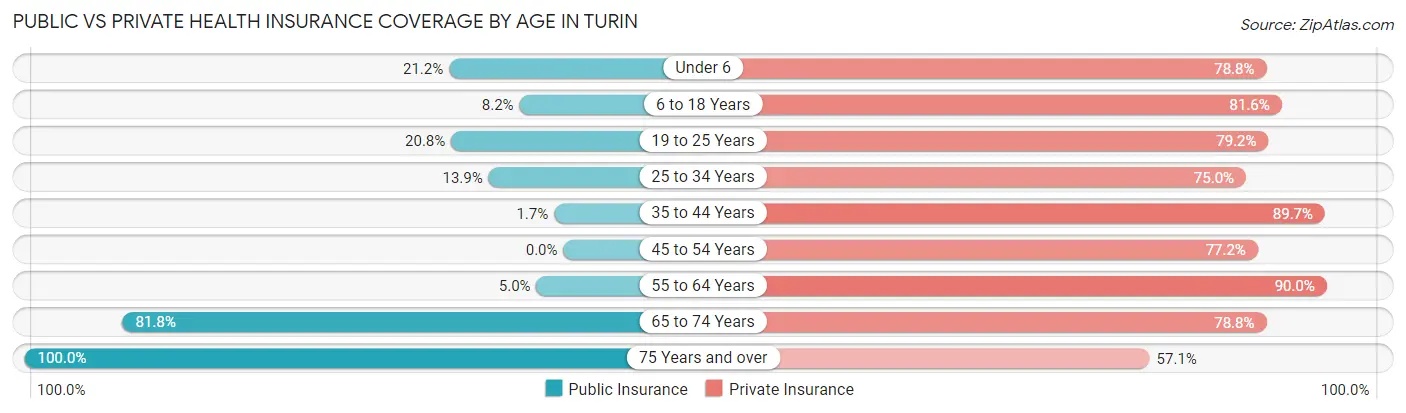
| Age Bracket | Public Insurance | Private Insurance |
| Under 6 | 7 (21.2%) | 26 (78.8%) |
| 6 to 18 Years | 4 (8.2%) | 40 (81.6%) |
| 19 to 25 Years | 5 (20.8%) | 19 (79.2%) |
| 25 to 34 Years | 5 (13.9%) | 27 (75.0%) |
| 35 to 44 Years | 1 (1.7%) | 52 (89.7%) |
| 45 to 54 Years | 0 (0.0%) | 44 (77.2%) |
| 55 to 64 Years | 3 (5.0%) | 54 (90.0%) |
| 65 to 74 Years | 27 (81.8%) | 26 (78.8%) |
| 75 Years and over | 28 (100.0%) | 16 (57.1%) |
| Total | 80 (21.2%) | 304 (80.4%) |
Disability Status by Sex by Age in Turin
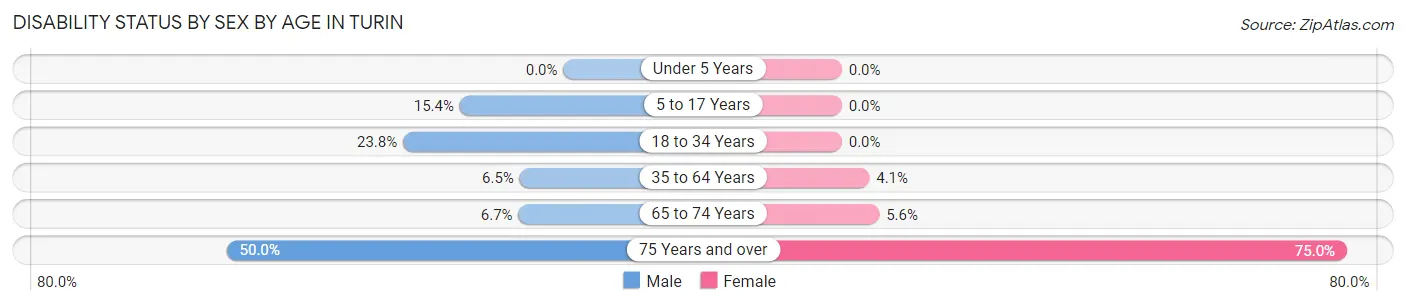
| Age Bracket | Male | Female |
| Under 5 Years | 0 (0.0%) | 0 (0.0%) |
| 5 to 17 Years | 4 (15.4%) | 0 (0.0%) |
| 18 to 34 Years | 5 (23.8%) | 0 (0.0%) |
| 35 to 64 Years | 5 (6.5%) | 4 (4.1%) |
| 65 to 74 Years | 1 (6.7%) | 1 (5.6%) |
| 75 Years and over | 6 (50.0%) | 12 (75.0%) |
Disability Class by Sex by Age in Turin
Disability Class: Hearing Difficulty
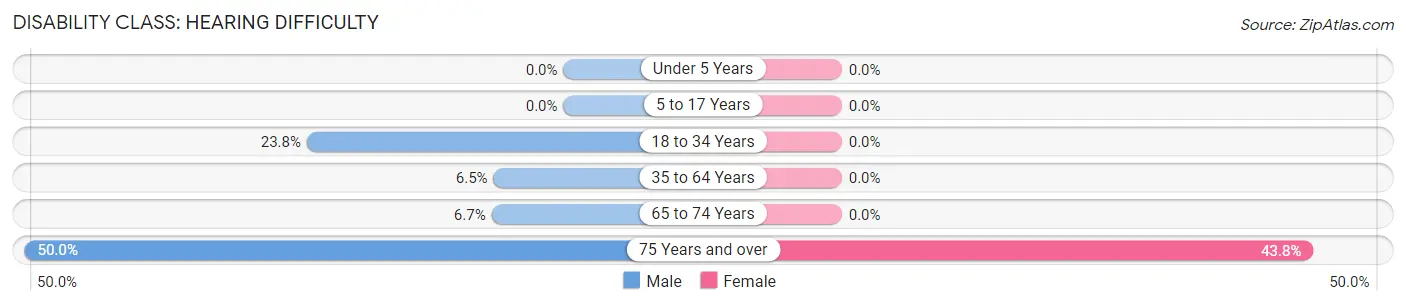
| Age Bracket | Male | Female |
| Under 5 Years | 0 (0.0%) | 0 (0.0%) |
| 5 to 17 Years | 0 (0.0%) | 0 (0.0%) |
| 18 to 34 Years | 5 (23.8%) | 0 (0.0%) |
| 35 to 64 Years | 5 (6.5%) | 0 (0.0%) |
| 65 to 74 Years | 1 (6.7%) | 0 (0.0%) |
| 75 Years and over | 6 (50.0%) | 7 (43.8%) |
Disability Class: Vision Difficulty
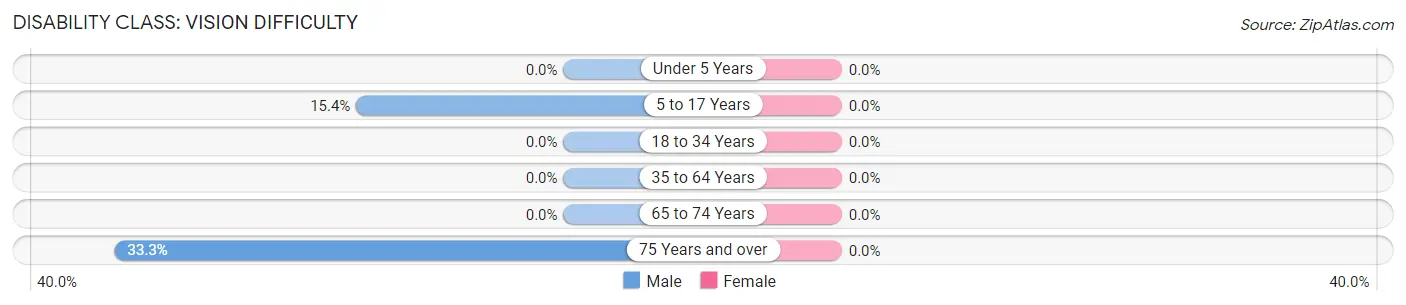
| Age Bracket | Male | Female |
| Under 5 Years | 0 (0.0%) | 0 (0.0%) |
| 5 to 17 Years | 4 (15.4%) | 0 (0.0%) |
| 18 to 34 Years | 0 (0.0%) | 0 (0.0%) |
| 35 to 64 Years | 0 (0.0%) | 0 (0.0%) |
| 65 to 74 Years | 0 (0.0%) | 0 (0.0%) |
| 75 Years and over | 4 (33.3%) | 0 (0.0%) |
Disability Class: Cognitive Difficulty
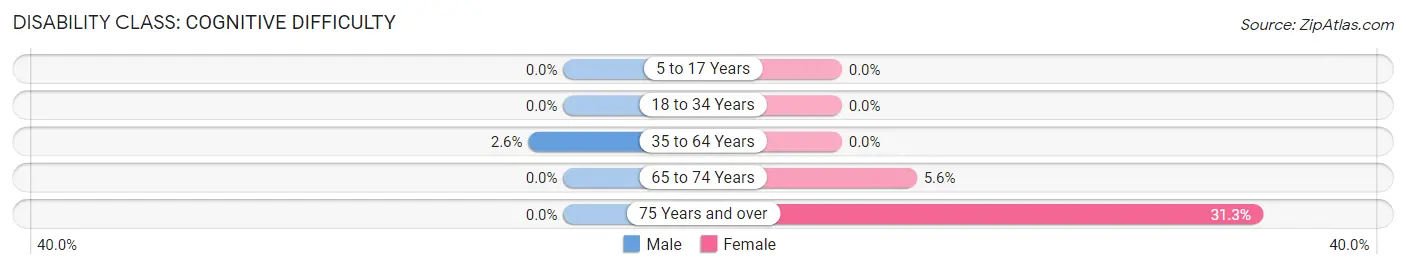
| Age Bracket | Male | Female |
| 5 to 17 Years | 0 (0.0%) | 0 (0.0%) |
| 18 to 34 Years | 0 (0.0%) | 0 (0.0%) |
| 35 to 64 Years | 2 (2.6%) | 0 (0.0%) |
| 65 to 74 Years | 0 (0.0%) | 1 (5.6%) |
| 75 Years and over | 0 (0.0%) | 5 (31.2%) |
Disability Class: Ambulatory Difficulty
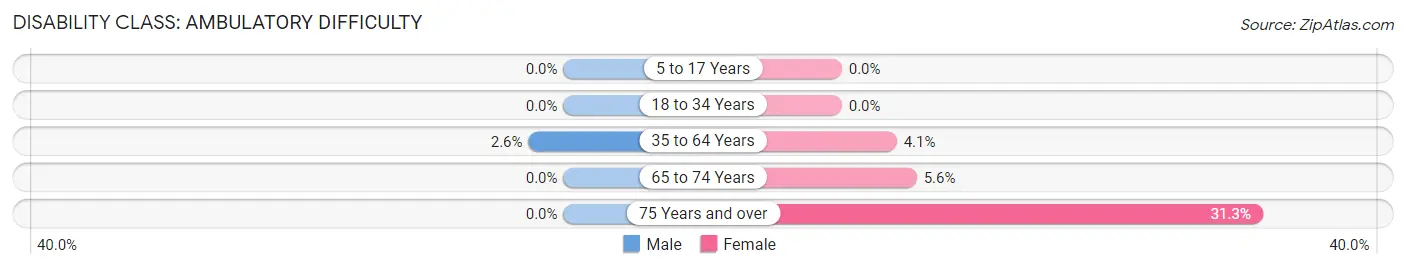
| Age Bracket | Male | Female |
| 5 to 17 Years | 0 (0.0%) | 0 (0.0%) |
| 18 to 34 Years | 0 (0.0%) | 0 (0.0%) |
| 35 to 64 Years | 2 (2.6%) | 4 (4.1%) |
| 65 to 74 Years | 0 (0.0%) | 1 (5.6%) |
| 75 Years and over | 0 (0.0%) | 5 (31.2%) |
Disability Class: Self-Care Difficulty
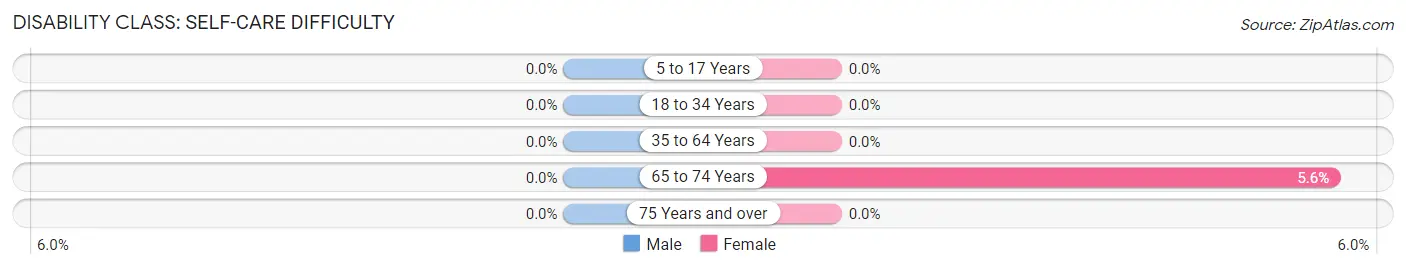
| Age Bracket | Male | Female |
| 5 to 17 Years | 0 (0.0%) | 0 (0.0%) |
| 18 to 34 Years | 0 (0.0%) | 0 (0.0%) |
| 35 to 64 Years | 0 (0.0%) | 0 (0.0%) |
| 65 to 74 Years | 0 (0.0%) | 1 (5.6%) |
| 75 Years and over | 0 (0.0%) | 0 (0.0%) |
Technology Access in Turin
Computing Device Access in Turin
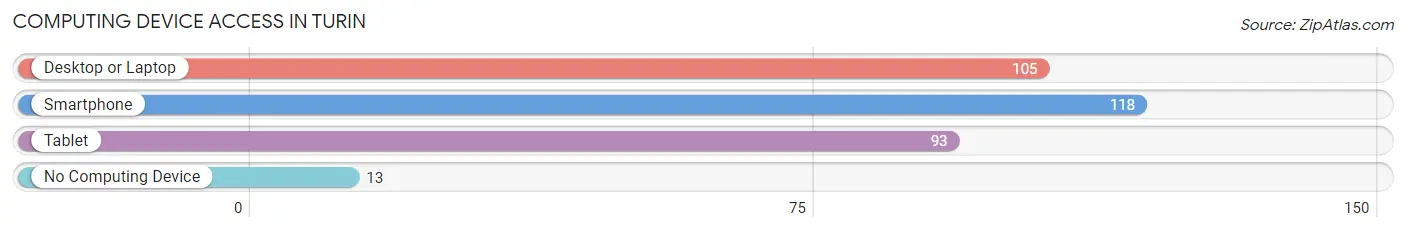
| Device Type | # Households | % Households |
| Desktop or Laptop | 105 | 78.4% |
| Smartphone | 118 | 88.1% |
| Tablet | 93 | 69.4% |
| No Computing Device | 13 | 9.7% |
| Total | 134 | 100.0% |
Internet Access in Turin
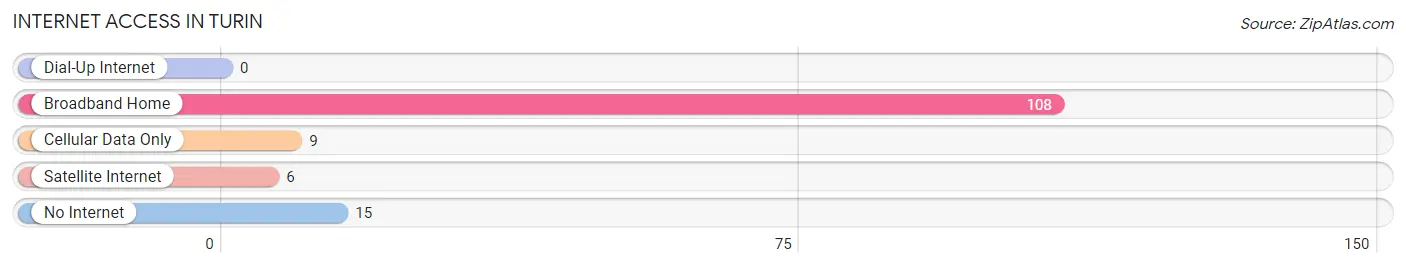
| Internet Type | # Households | % Households |
| Dial-Up Internet | 0 | 0.0% |
| Broadband Home | 108 | 80.6% |
| Cellular Data Only | 9 | 6.7% |
| Satellite Internet | 6 | 4.5% |
| No Internet | 15 | 11.2% |
| Total | 134 | 100.0% |
Turin Summary
Turin, Georgia is a small town located in the foothills of the Appalachian Mountains in the northwest corner of the state. It is situated in the county of Coweta, and is part of the Atlanta metropolitan area. The town has a population of approximately 1,500 people, and is known for its rural charm and small-town atmosphere.
History
The area that is now Turin was first settled in the early 1800s by settlers from the Carolinas and Virginia. The town was originally known as “Crossroads” due to its location at the intersection of two major roads. In 1832, the town was renamed Turin after Turin, Italy, by a local postmaster.
The town was incorporated in 1883 and quickly became a center of commerce and industry. The town was home to several mills, including a cotton mill, a grist mill, and a sawmill. The town also had a number of stores, a hotel, and a bank.
In the early 1900s, the town began to decline as the mills closed and the population began to move away. The town was nearly abandoned by the 1950s, but in the late 1960s, the town began to experience a resurgence. The town was revitalized by the construction of a new highway, which brought new businesses and residents to the area.
Geography
Turin is located in the foothills of the Appalachian Mountains in the northwest corner of the state. The town is situated in the county of Coweta, and is part of the Atlanta metropolitan area. The town is located at the intersection of two major roads, US Highway 29 and Georgia State Route 16.
The town is surrounded by rolling hills and forests, and is located near the Chattahoochee River. The town is located approximately 30 miles south of Atlanta, and is approximately an hour’s drive from the city.
Economy
The economy of Turin is largely based on agriculture and tourism. The town is home to several farms, which produce a variety of crops, including corn, soybeans, and cotton. The town is also home to several wineries, which produce a variety of wines.
The town is also home to several small businesses, including restaurants, shops, and a variety of services. The town is also home to a number of bed and breakfasts, which attract visitors from around the region.
Demographics
As of the 2010 census, the population of Turin was 1,500 people. The town is predominantly white, with approximately 90% of the population being white. The town is also home to a small African American population, as well as a small Hispanic population. The median household income in the town is approximately $40,000.
Common Questions
What is Per Capita Income in Turin?
Per Capita income in Turin is $51,966.
What is the Median Family Income in Turin?
Median Family Income in Turin is $168,125.
What is the Median Household income in Turin?
Median Household Income in Turin is $139,167.
What is Income or Wage Gap in Turin?
Income or Wage Gap in Turin is 59.1%.
Women in Turin earn 40.9 cents for every dollar earned by a man.
What is Inequality or Gini Index in Turin?
Inequality or Gini Index in Turin is 0.38.
What is the Total Population of Turin?
Total Population of Turin is 378.
What is the Total Male Population of Turin?
Total Male Population of Turin is 172.
What is the Total Female Population of Turin?
Total Female Population of Turin is 206.
What is the Ratio of Males per 100 Females in Turin?
There are 83.50 Males per 100 Females in Turin.
What is the Ratio of Females per 100 Males in Turin?
There are 119.77 Females per 100 Males in Turin.
What is the Median Population Age in Turin?
Median Population Age in Turin is 41.4 Years.
What is the Average Family Size in Turin
Average Family Size in Turin is 3.2 People.
What is the Average Household Size in Turin
Average Household Size in Turin is 2.8 People.
How Large is the Labor Force in Turin?
There are 204 People in the Labor Forcein in Turin.
What is the Percentage of People in the Labor Force in Turin?
66.2% of People are in the Labor Force in Turin.