Decatur, GA Map & Demographics
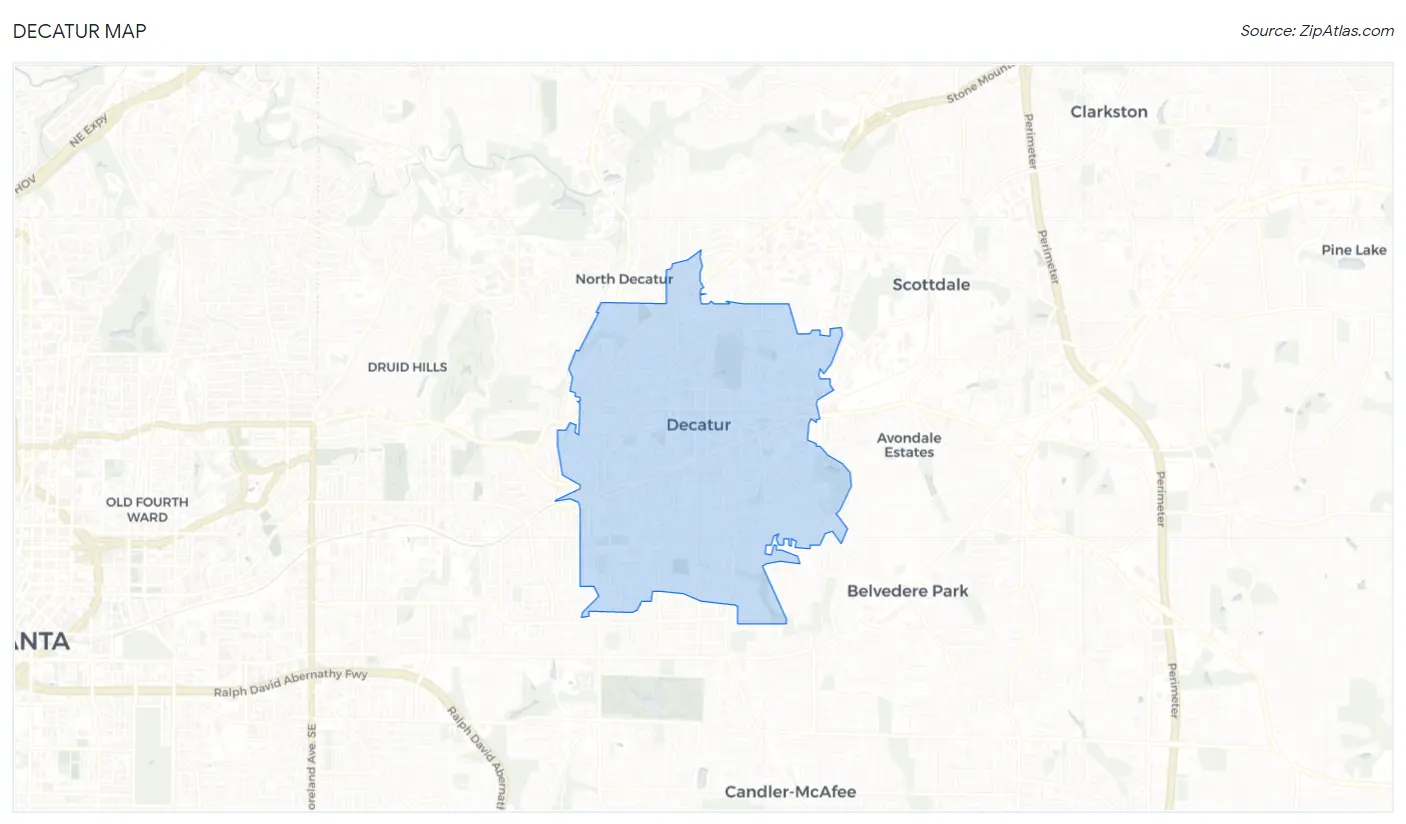
Decatur Map
Decatur Overview
$68,394
PER CAPITA INCOME
$201,477
AVG FAMILY INCOME
$129,992
AVG HOUSEHOLD INCOME
36.9%
WAGE / INCOME GAP [ % ]
63.1¢/ $1
WAGE / INCOME GAP [ $ ]
0.49
INEQUALITY / GINI INDEX
24,421
TOTAL POPULATION
11,884
MALE POPULATION
12,537
FEMALE POPULATION
94.79
MALES / 100 FEMALES
105.49
FEMALES / 100 MALES
38.7
MEDIAN AGE
3.4
AVG FAMILY SIZE
2.6
AVG HOUSEHOLD SIZE
11,418
LABOR FORCE [ PEOPLE ]
64.8%
PERCENT IN LABOR FORCE
3.8%
UNEMPLOYMENT RATE
Income in Decatur
Income Overview in Decatur
Per Capita Income in Decatur is $68,394, while median incomes of families and households are $201,477 and $129,992 respectively.
| Characteristic | Number | Measure |
| Per Capita Income | 24,421 | $68,394 |
| Median Family Income | 5,785 | $201,477 |
| Mean Family Income | 5,785 | $237,703 |
| Median Household Income | 9,053 | $129,992 |
| Mean Household Income | 9,053 | $182,303 |
| Income Deficit | 5,785 | $0 |
| Wage / Income Gap (%) | 24,421 | 36.85% |
| Wage / Income Gap ($) | 24,421 | 63.15¢ per $1 |
| Gini / Inequality Index | 24,421 | 0.49 |
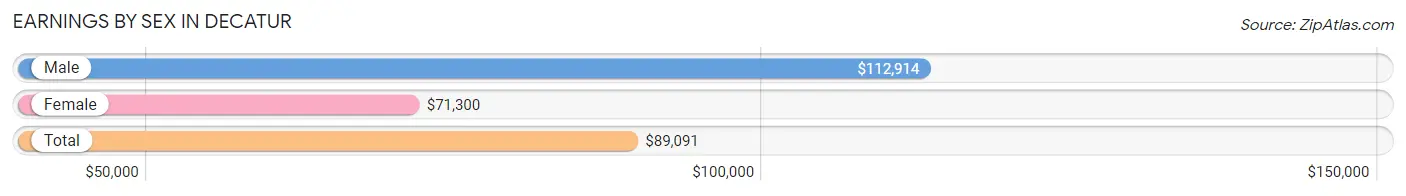
Earnings by Sex in Decatur
Average Earnings in Decatur are $89,091, $112,914 for men and $71,300 for women, a difference of 36.8%.
| Sex | Number | Average Earnings |
| Male | 5,858 (49.1%) | $112,914 |
| Female | 6,080 (50.9%) | $71,300 |
| Total | 11,938 (100.0%) | $89,091 |
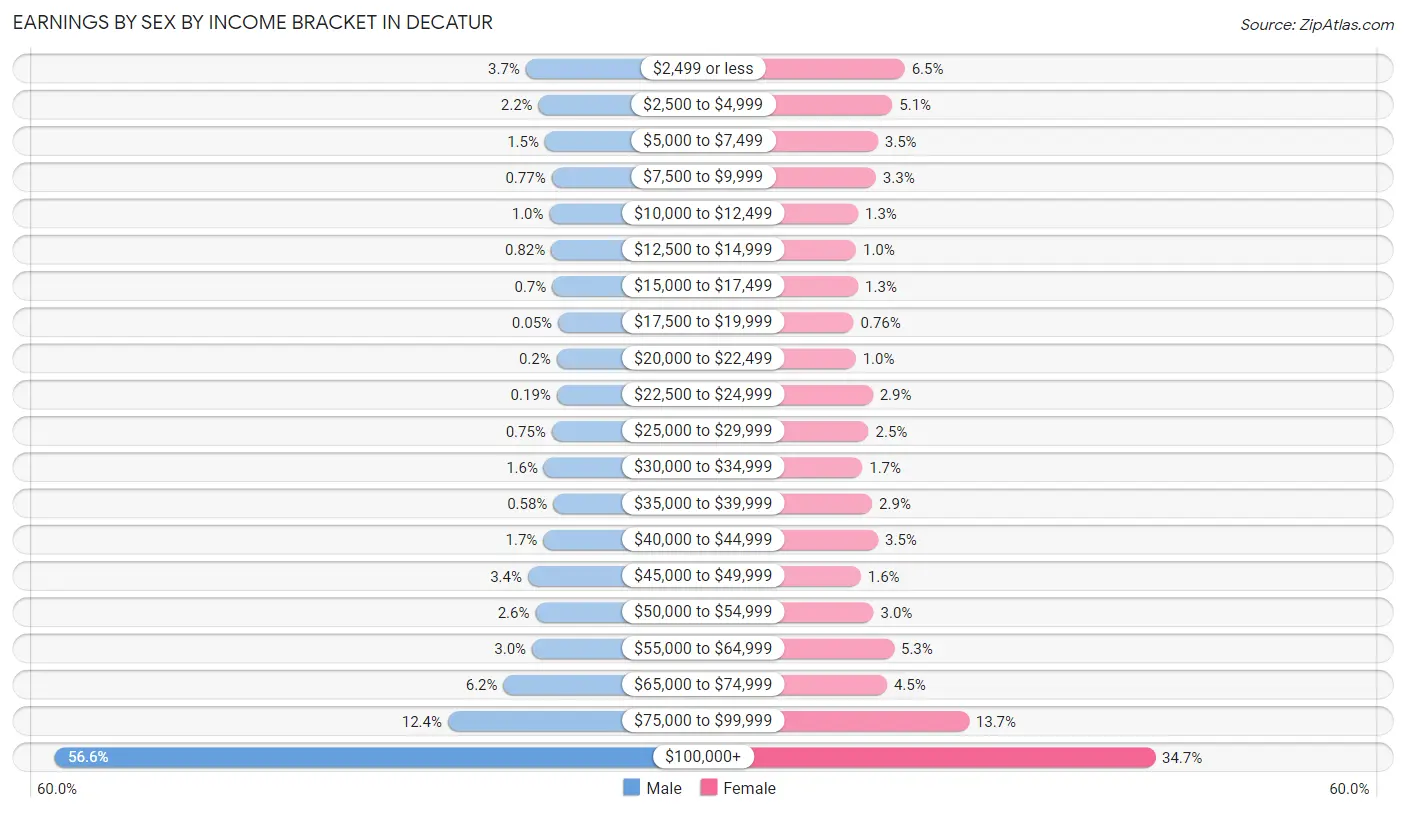
Earnings by Sex by Income Bracket in Decatur
The most common earnings brackets in Decatur are $100,000+ for men (3,313 | 56.6%) and $100,000+ for women (2,107 | 34.6%).
| Income | Male | Female |
| $2,499 or less | 215 (3.7%) | 396 (6.5%) |
| $2,500 to $4,999 | 131 (2.2%) | 311 (5.1%) |
| $5,000 to $7,499 | 89 (1.5%) | 212 (3.5%) |
| $7,500 to $9,999 | 45 (0.8%) | 199 (3.3%) |
| $10,000 to $12,499 | 59 (1.0%) | 77 (1.3%) |
| $12,500 to $14,999 | 48 (0.8%) | 63 (1.0%) |
| $15,000 to $17,499 | 41 (0.7%) | 78 (1.3%) |
| $17,500 to $19,999 | 3 (0.1%) | 46 (0.8%) |
| $20,000 to $22,499 | 12 (0.2%) | 61 (1.0%) |
| $22,500 to $24,999 | 11 (0.2%) | 177 (2.9%) |
| $25,000 to $29,999 | 44 (0.7%) | 149 (2.5%) |
| $30,000 to $34,999 | 96 (1.6%) | 106 (1.7%) |
| $35,000 to $39,999 | 34 (0.6%) | 173 (2.9%) |
| $40,000 to $44,999 | 100 (1.7%) | 214 (3.5%) |
| $45,000 to $49,999 | 201 (3.4%) | 96 (1.6%) |
| $50,000 to $54,999 | 152 (2.6%) | 183 (3.0%) |
| $55,000 to $64,999 | 174 (3.0%) | 323 (5.3%) |
| $65,000 to $74,999 | 362 (6.2%) | 275 (4.5%) |
| $75,000 to $99,999 | 728 (12.4%) | 834 (13.7%) |
| $100,000+ | 3,313 (56.6%) | 2,107 (34.6%) |
| Total | 5,858 (100.0%) | 6,080 (100.0%) |
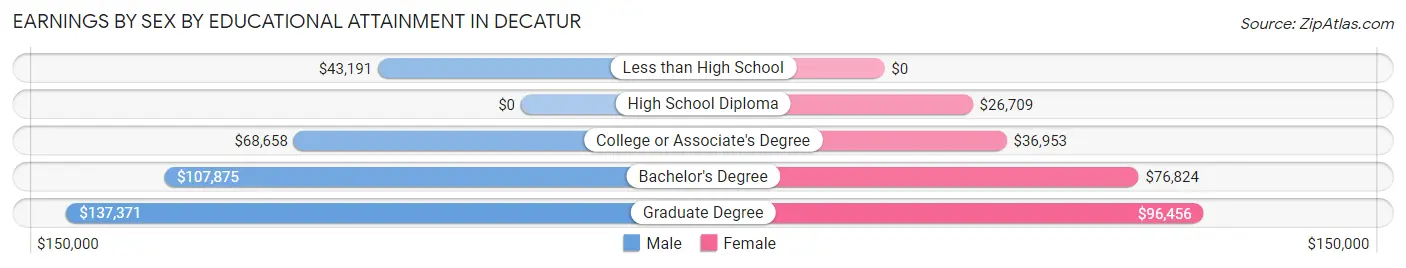
Earnings by Sex by Educational Attainment in Decatur
Average earnings in Decatur are $116,582 for men and $80,761 for women, a difference of 30.7%. Men with an educational attainment of graduate degree enjoy the highest average annual earnings of $137,371, while those with less than high school education earn the least with $43,191. Women with an educational attainment of graduate degree earn the most with the average annual earnings of $96,456, while those with high school diploma education have the smallest earnings of $26,709.
| Educational Attainment | Male Income | Female Income |
| Less than High School | $43,191 | $0 |
| High School Diploma | - | - |
| College or Associate's Degree | $68,658 | $36,953 |
| Bachelor's Degree | $107,875 | $76,824 |
| Graduate Degree | $137,371 | $96,456 |
| Total | $116,582 | $80,761 |
Family Income in Decatur
Family Income Brackets in Decatur
According to the Decatur family income data, there are 2,910 families falling into the $200,000+ income range, which is the most common income bracket and makes up 50.3% of all families. Conversely, the less than $10,000 income bracket is the least frequent group with only 52 families (0.9%) belonging to this category.
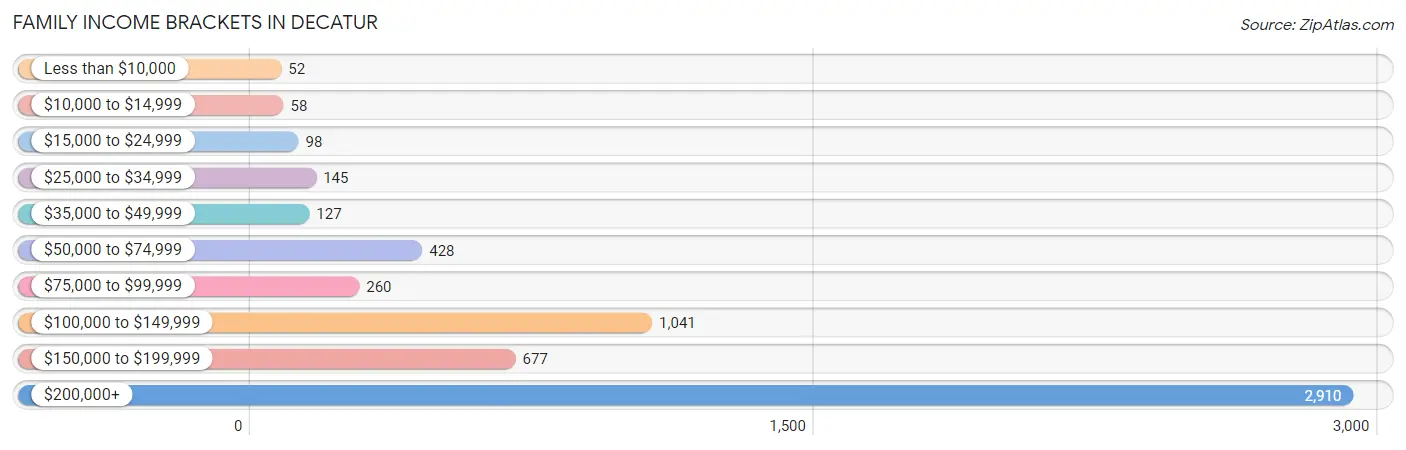
| Income Bracket | # Families | % Families |
| Less than $10,000 | 52 | 0.9% |
| $10,000 to $14,999 | 58 | 1.0% |
| $15,000 to $24,999 | 98 | 1.7% |
| $25,000 to $34,999 | 145 | 2.5% |
| $35,000 to $49,999 | 127 | 2.2% |
| $50,000 to $74,999 | 428 | 7.4% |
| $75,000 to $99,999 | 260 | 4.5% |
| $100,000 to $149,999 | 1,041 | 18.0% |
| $150,000 to $199,999 | 677 | 11.7% |
| $200,000+ | 2,910 | 50.3% |
Family Income by Famaliy Size in Decatur
3-person families (1,284 | 22.2%) account for the highest median family income in Decatur with $250,001 per family, while 3-person families (1,284 | 22.2%) have the highest median income of $83,334 per family member.
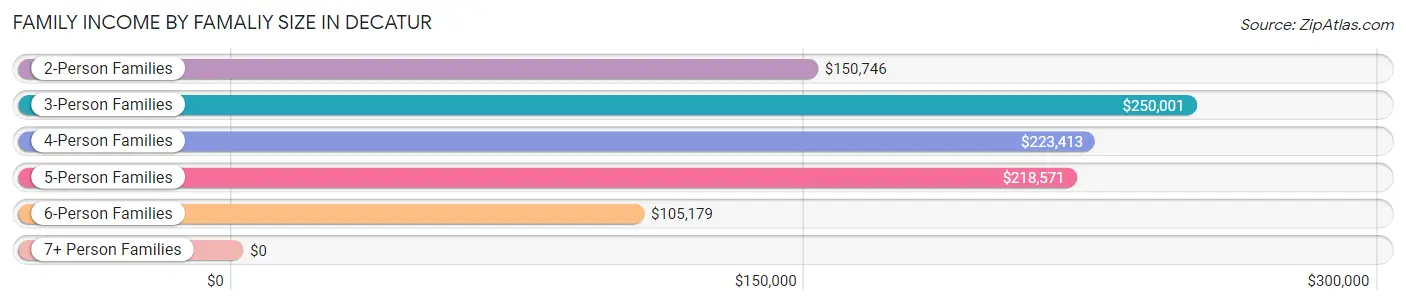
| Income Bracket | # Families | Median Income |
| 2-Person Families | 2,154 (37.2%) | $150,746 |
| 3-Person Families | 1,284 (22.2%) | $250,001 |
| 4-Person Families | 1,647 (28.5%) | $223,413 |
| 5-Person Families | 518 (8.9%) | $218,571 |
| 6-Person Families | 145 (2.5%) | $105,179 |
| 7+ Person Families | 37 (0.6%) | $0 |
| Total | 5,785 (100.0%) | $201,477 |
Family Income by Number of Earners in Decatur
The median family income in Decatur is $201,477, with families comprising 2 earners (3,066) having the highest median family income of $230,625, while families with no earners (506) have the lowest median family income of $84,643, accounting for 53.0% and 8.7% of families, respectively.
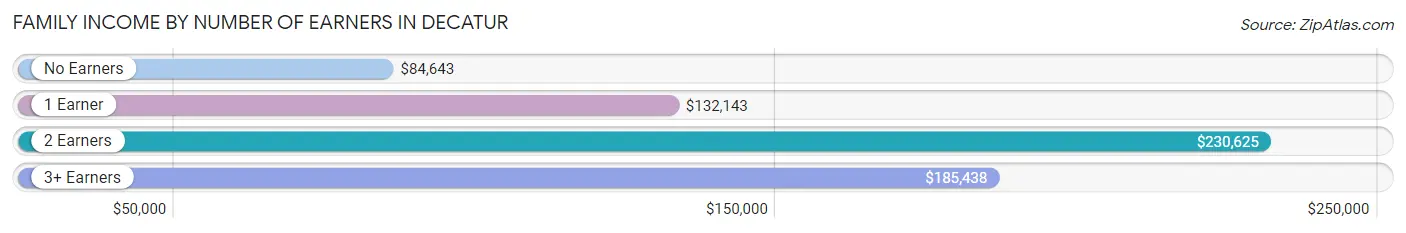
| Number of Earners | # Families | Median Income |
| No Earners | 506 (8.7%) | $84,643 |
| 1 Earner | 1,782 (30.8%) | $132,143 |
| 2 Earners | 3,066 (53.0%) | $230,625 |
| 3+ Earners | 431 (7.4%) | $185,438 |
| Total | 5,785 (100.0%) | $201,477 |
Household Income in Decatur
Household Income Brackets in Decatur
With 3,232 households falling in the category, the $200,000+ income range is the most frequent in Decatur, accounting for 35.7% of all households. In contrast, only 253 households (2.8%) fall into the less than $10,000 income bracket, making it the least populous group.
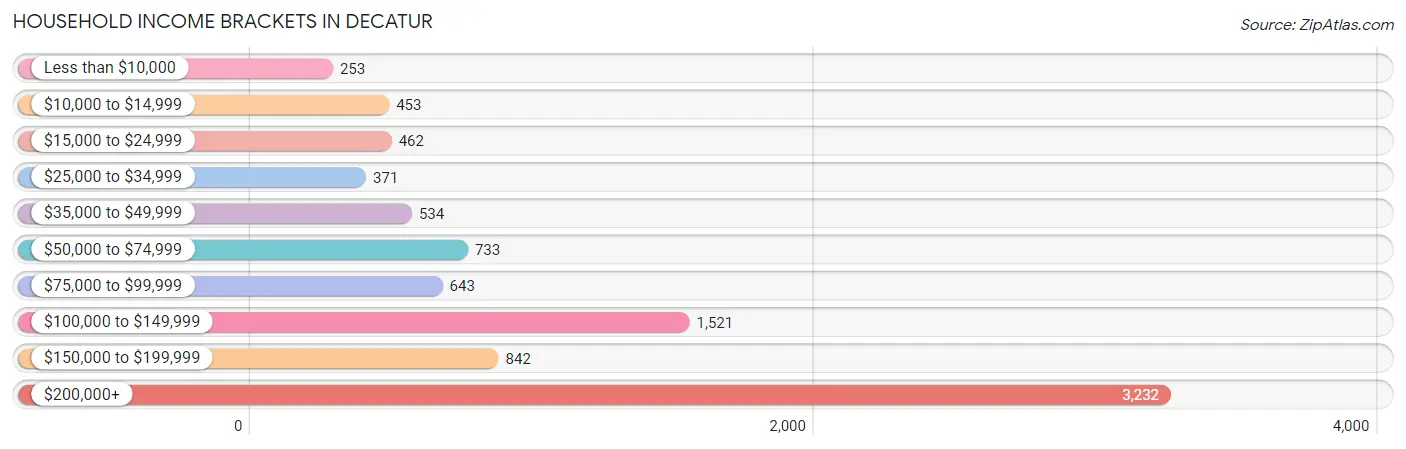
| Income Bracket | # Households | % Households |
| Less than $10,000 | 253 | 2.8% |
| $10,000 to $14,999 | 453 | 5.0% |
| $15,000 to $24,999 | 462 | 5.1% |
| $25,000 to $34,999 | 371 | 4.1% |
| $35,000 to $49,999 | 534 | 5.9% |
| $50,000 to $74,999 | 733 | 8.1% |
| $75,000 to $99,999 | 643 | 7.1% |
| $100,000 to $149,999 | 1,521 | 16.8% |
| $150,000 to $199,999 | 842 | 9.3% |
| $200,000+ | 3,232 | 35.7% |
Household Income by Householder Age in Decatur
The median household income in Decatur is $129,992, with the highest median household income of $200,403 found in the 45 to 64 years age bracket for the primary householder. A total of 3,877 households (42.8%) fall into this category. Meanwhile, the 15 to 24 years age bracket for the primary householder has the lowest median household income of $39,375, with 58 households (0.6%) in this group.
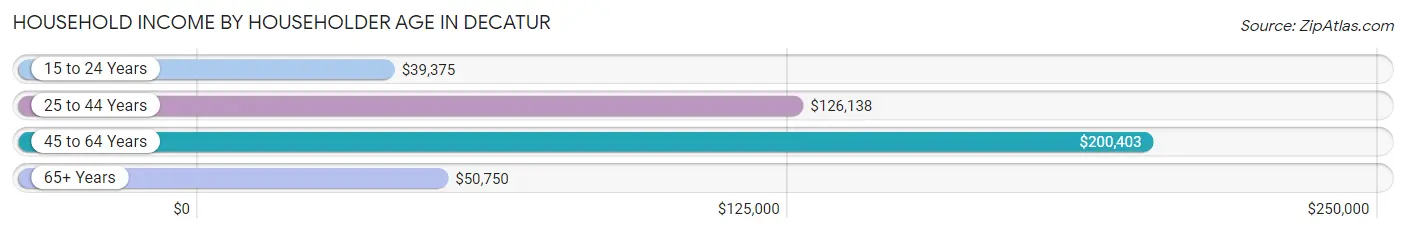
| Income Bracket | # Households | Median Income |
| 15 to 24 Years | 58 (0.6%) | $39,375 |
| 25 to 44 Years | 2,945 (32.5%) | $126,138 |
| 45 to 64 Years | 3,877 (42.8%) | $200,403 |
| 65+ Years | 2,173 (24.0%) | $50,750 |
| Total | 9,053 (100.0%) | $129,992 |
Poverty in Decatur
Income Below Poverty by Sex and Age in Decatur
With 6.6% poverty level for males and 6.1% for females among the residents of Decatur, 75 year old and over males and 16 and 17 year old females are the most vulnerable to poverty, with 120 males (24.1%) and 96 females (38.9%) in their respective age groups living below the poverty level.
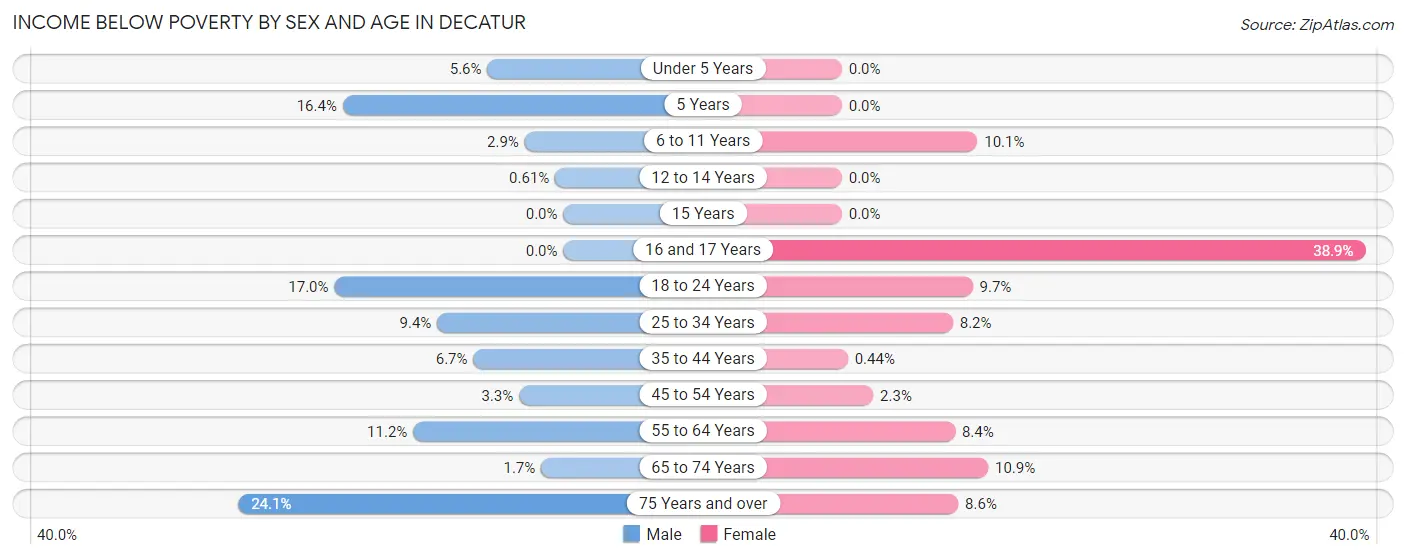
| Age Bracket | Male | Female |
| Under 5 Years | 62 (5.6%) | 0 (0.0%) |
| 5 Years | 47 (16.4%) | 0 (0.0%) |
| 6 to 11 Years | 40 (2.9%) | 144 (10.1%) |
| 12 to 14 Years | 5 (0.6%) | 0 (0.0%) |
| 15 Years | 0 (0.0%) | 0 (0.0%) |
| 16 and 17 Years | 0 (0.0%) | 96 (38.9%) |
| 18 to 24 Years | 76 (17.0%) | 44 (9.7%) |
| 25 to 34 Years | 93 (9.4%) | 78 (8.2%) |
| 35 to 44 Years | 110 (6.7%) | 8 (0.4%) |
| 45 to 54 Years | 62 (3.3%) | 51 (2.3%) |
| 55 to 64 Years | 149 (11.2%) | 110 (8.4%) |
| 65 to 74 Years | 12 (1.7%) | 124 (10.9%) |
| 75 Years and over | 120 (24.1%) | 72 (8.6%) |
| Total | 776 (6.6%) | 727 (6.1%) |
Income Above Poverty by Sex and Age in Decatur
According to the poverty statistics in Decatur, males aged 15 years and females aged under 5 years are the age groups that are most secure financially, with 100.0% of males and 100.0% of females in these age groups living above the poverty line.
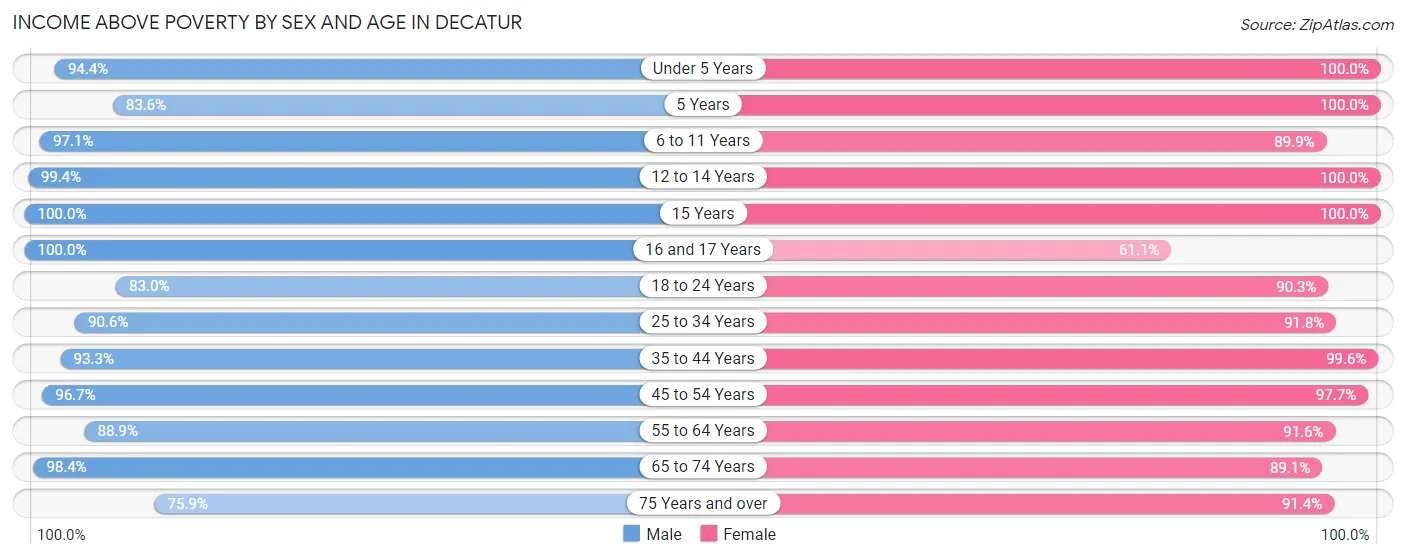
| Age Bracket | Male | Female |
| Under 5 Years | 1,037 (94.4%) | 469 (100.0%) |
| 5 Years | 240 (83.6%) | 228 (100.0%) |
| 6 to 11 Years | 1,355 (97.1%) | 1,287 (89.9%) |
| 12 to 14 Years | 816 (99.4%) | 637 (100.0%) |
| 15 Years | 242 (100.0%) | 148 (100.0%) |
| 16 and 17 Years | 397 (100.0%) | 151 (61.1%) |
| 18 to 24 Years | 371 (83.0%) | 409 (90.3%) |
| 25 to 34 Years | 900 (90.6%) | 869 (91.8%) |
| 35 to 44 Years | 1,536 (93.3%) | 1,809 (99.6%) |
| 45 to 54 Years | 1,823 (96.7%) | 2,134 (97.7%) |
| 55 to 64 Years | 1,187 (88.8%) | 1,200 (91.6%) |
| 65 to 74 Years | 716 (98.4%) | 1,018 (89.1%) |
| 75 Years and over | 377 (75.9%) | 761 (91.4%) |
| Total | 10,997 (93.4%) | 11,120 (93.9%) |
Income Below Poverty Among Married-Couple Families in Decatur
The poverty statistics for married-couple families in Decatur show that 1.4% or 70 of the total 4,923 families live below the poverty line. Families with no children have the highest poverty rate of 3.3%, comprising of 63 families. On the other hand, families with 3 or 4 children have the lowest poverty rate of 0.0%, which includes 0 families.
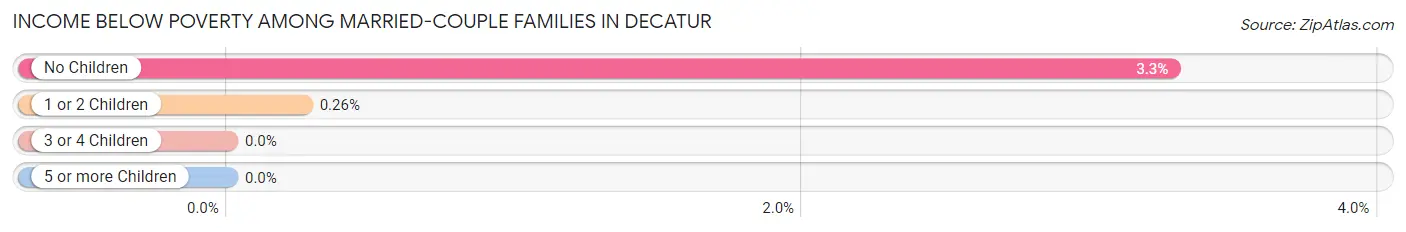
| Children | Above Poverty | Below Poverty |
| No Children | 1,857 (96.7%) | 63 (3.3%) |
| 1 or 2 Children | 2,662 (99.7%) | 7 (0.3%) |
| 3 or 4 Children | 334 (100.0%) | 0 (0.0%) |
| 5 or more Children | 0 (0.0%) | 0 (0.0%) |
| Total | 4,853 (98.6%) | 70 (1.4%) |
Income Below Poverty Among Single-Parent Households in Decatur
According to the poverty data in Decatur, 6.4% or 8 single-father households and 11.6% or 85 single-mother households are living below the poverty line. Among single-father households, those with no children have the highest poverty rate, with 8 households (20.5%) experiencing poverty. Likewise, among single-mother households, those with 5 or more children have the highest poverty rate, with 37 households (100.0%) falling below the poverty line.
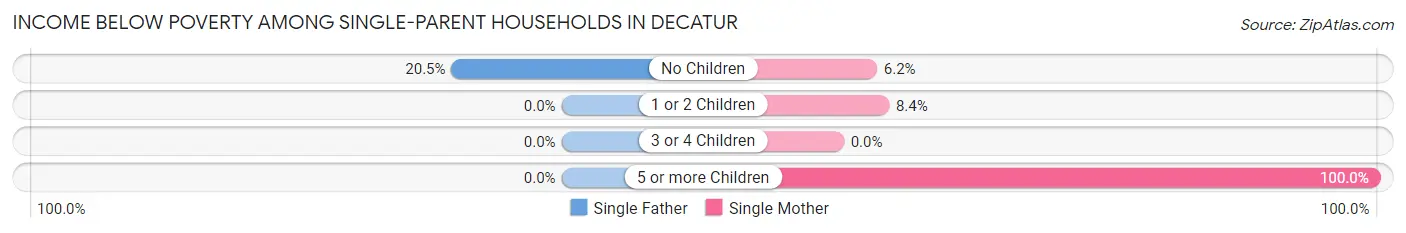
| Children | Single Father | Single Mother |
| No Children | 8 (20.5%) | 11 (6.2%) |
| 1 or 2 Children | 0 (0.0%) | 37 (8.4%) |
| 3 or 4 Children | 0 (0.0%) | 0 (0.0%) |
| 5 or more Children | 0 (0.0%) | 37 (100.0%) |
| Total | 8 (6.4%) | 85 (11.6%) |
Income Below Poverty Among Married-Couple vs Single-Parent Households in Decatur
The poverty data for Decatur shows that 70 of the married-couple family households (1.4%) and 93 of the single-parent households (10.8%) are living below the poverty level. Within the married-couple family households, those with no children have the highest poverty rate, with 63 households (3.3%) falling below the poverty line. Among the single-parent households, those with 5 or more children have the highest poverty rate, with 37 household (100.0%) living below poverty.
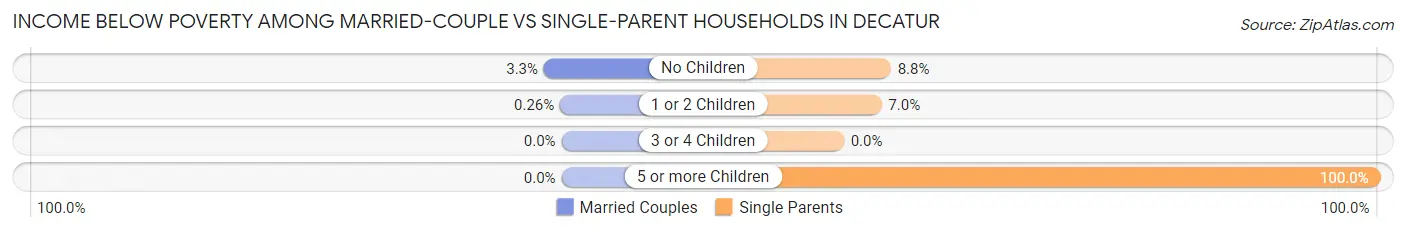
| Children | Married-Couple Families | Single-Parent Households |
| No Children | 63 (3.3%) | 19 (8.8%) |
| 1 or 2 Children | 7 (0.3%) | 37 (7.0%) |
| 3 or 4 Children | 0 (0.0%) | 0 (0.0%) |
| 5 or more Children | 0 (0.0%) | 37 (100.0%) |
| Total | 70 (1.4%) | 93 (10.8%) |
Race in Decatur
The most populous races in Decatur are White / Caucasian (16,759 | 68.6%), Black / African American (3,557 | 14.6%), and Two or more Races (2,891 | 11.8%).
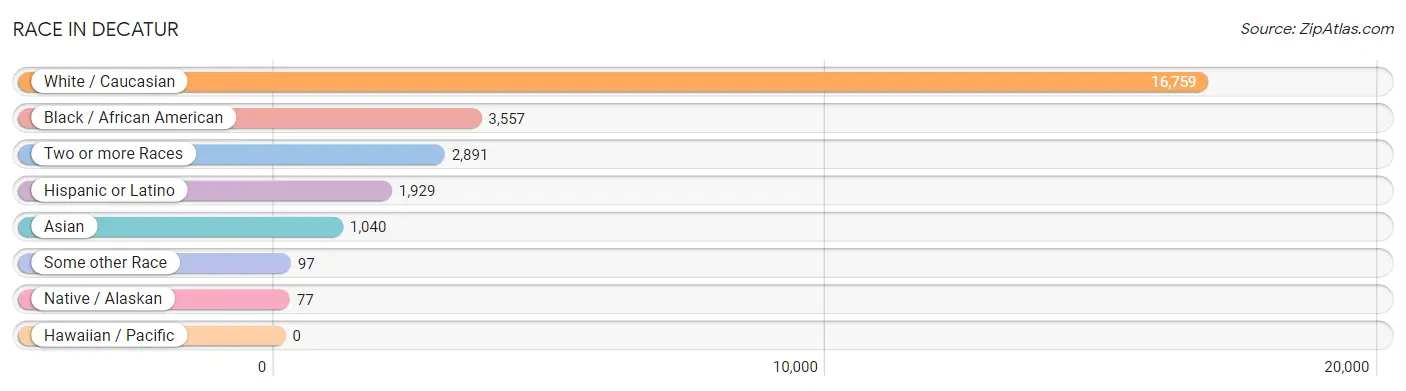
| Race | # Population | % Population |
| Asian | 1,040 | 4.3% |
| Black / African American | 3,557 | 14.6% |
| Hawaiian / Pacific | 0 | 0.0% |
| Hispanic or Latino | 1,929 | 7.9% |
| Native / Alaskan | 77 | 0.3% |
| White / Caucasian | 16,759 | 68.6% |
| Two or more Races | 2,891 | 11.8% |
| Some other Race | 97 | 0.4% |
| Total | 24,421 | 100.0% |
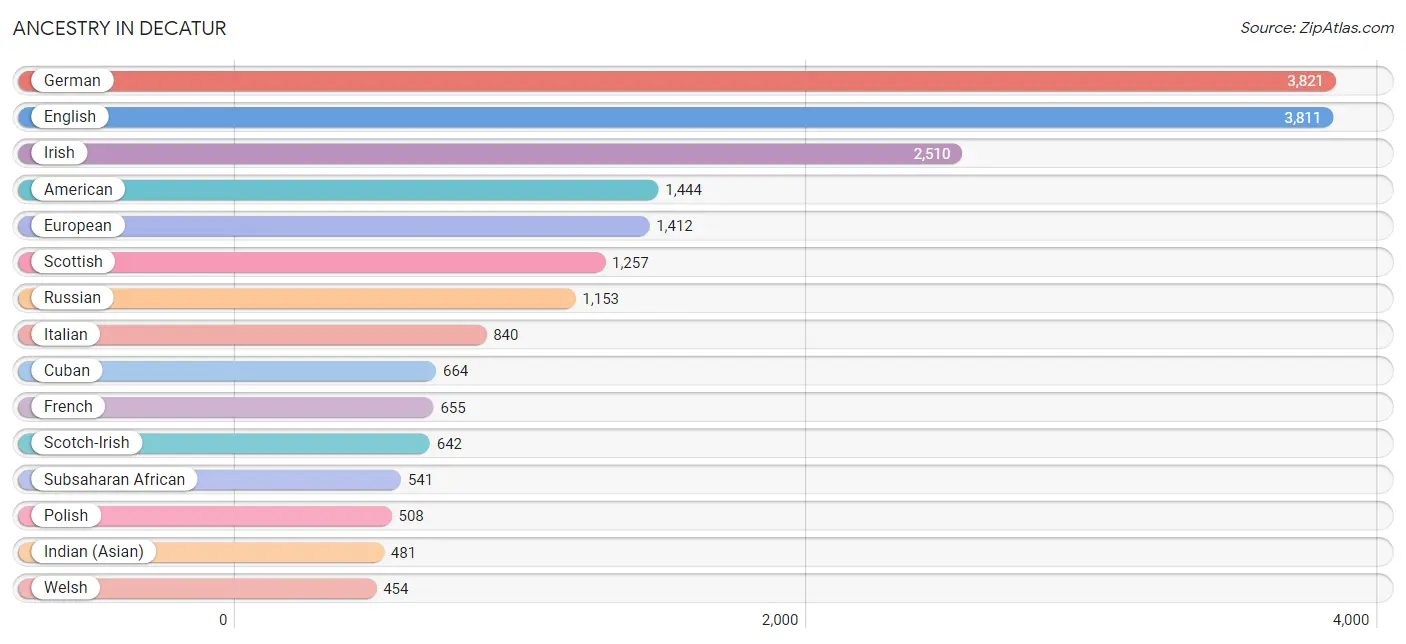
Ancestry in Decatur
The most populous ancestries reported in Decatur are German (3,821 | 15.7%), English (3,811 | 15.6%), Irish (2,510 | 10.3%), American (1,444 | 5.9%), and European (1,412 | 5.8%), together accounting for 53.2% of all Decatur residents.
| Ancestry | # Population | % Population |
| Afghan | 96 | 0.4% |
| African | 133 | 0.5% |
| American | 1,444 | 5.9% |
| Arab | 264 | 1.1% |
| Argentinean | 223 | 0.9% |
| Armenian | 43 | 0.2% |
| Austrian | 153 | 0.6% |
| Bhutanese | 301 | 1.2% |
| Brazilian | 18 | 0.1% |
| British | 339 | 1.4% |
| British West Indian | 19 | 0.1% |
| Burmese | 440 | 1.8% |
| Canadian | 58 | 0.2% |
| Cape Verdean | 28 | 0.1% |
| Central American | 120 | 0.5% |
| Cherokee | 168 | 0.7% |
| Chickasaw | 49 | 0.2% |
| Chilean | 7 | 0.0% |
| Choctaw | 49 | 0.2% |
| Colombian | 43 | 0.2% |
| Costa Rican | 41 | 0.2% |
| Creek | 45 | 0.2% |
| Croatian | 15 | 0.1% |
| Crow | 4 | 0.0% |
| Cuban | 664 | 2.7% |
| Czech | 145 | 0.6% |
| Czechoslovakian | 12 | 0.1% |
| Danish | 87 | 0.4% |
| Dominican | 44 | 0.2% |
| Dutch | 356 | 1.5% |
| Eastern European | 207 | 0.9% |
| Ecuadorian | 4 | 0.0% |
| Egyptian | 20 | 0.1% |
| English | 3,811 | 15.6% |
| Ethiopian | 309 | 1.3% |
| European | 1,412 | 5.8% |
| Filipino | 126 | 0.5% |
| Finnish | 92 | 0.4% |
| French | 655 | 2.7% |
| French Canadian | 77 | 0.3% |
| German | 3,821 | 15.7% |
| Greek | 96 | 0.4% |
| Guamanian / Chamorro | 16 | 0.1% |
| Guatemalan | 10 | 0.0% |
| Guyanese | 31 | 0.1% |
| Haitian | 9 | 0.0% |
| Honduran | 31 | 0.1% |
| Hungarian | 41 | 0.2% |
| Indian (Asian) | 481 | 2.0% |
| Irish | 2,510 | 10.3% |
| Israeli | 9 | 0.0% |
| Italian | 840 | 3.4% |
| Jamaican | 7 | 0.0% |
| Japanese | 14 | 0.1% |
| Jordanian | 99 | 0.4% |
| Korean | 119 | 0.5% |
| Laotian | 4 | 0.0% |
| Latvian | 13 | 0.1% |
| Lebanese | 80 | 0.3% |
| Lithuanian | 17 | 0.1% |
| Mexican | 393 | 1.6% |
| Mexican American Indian | 70 | 0.3% |
| Mongolian | 40 | 0.2% |
| Moroccan | 15 | 0.1% |
| Native Hawaiian | 18 | 0.1% |
| Nigerian | 30 | 0.1% |
| Northern European | 18 | 0.1% |
| Norwegian | 105 | 0.4% |
| Palestinian | 13 | 0.1% |
| Panamanian | 18 | 0.1% |
| Peruvian | 6 | 0.0% |
| Polish | 508 | 2.1% |
| Portuguese | 51 | 0.2% |
| Puerto Rican | 173 | 0.7% |
| Romanian | 85 | 0.4% |
| Russian | 1,153 | 4.7% |
| Salvadoran | 20 | 0.1% |
| Scandinavian | 109 | 0.4% |
| Scotch-Irish | 642 | 2.6% |
| Scottish | 1,257 | 5.1% |
| Slovak | 21 | 0.1% |
| South African | 11 | 0.1% |
| South American | 312 | 1.3% |
| Spaniard | 153 | 0.6% |
| Spanish | 13 | 0.1% |
| Sri Lankan | 103 | 0.4% |
| Subsaharan African | 541 | 2.2% |
| Sudanese | 30 | 0.1% |
| Swedish | 344 | 1.4% |
| Swiss | 272 | 1.1% |
| Thai | 352 | 1.4% |
| Turkish | 111 | 0.4% |
| Ukrainian | 86 | 0.4% |
| Venezuelan | 29 | 0.1% |
| Welsh | 454 | 1.9% |
| Yugoslavian | 70 | 0.3% | View All 96 Rows |
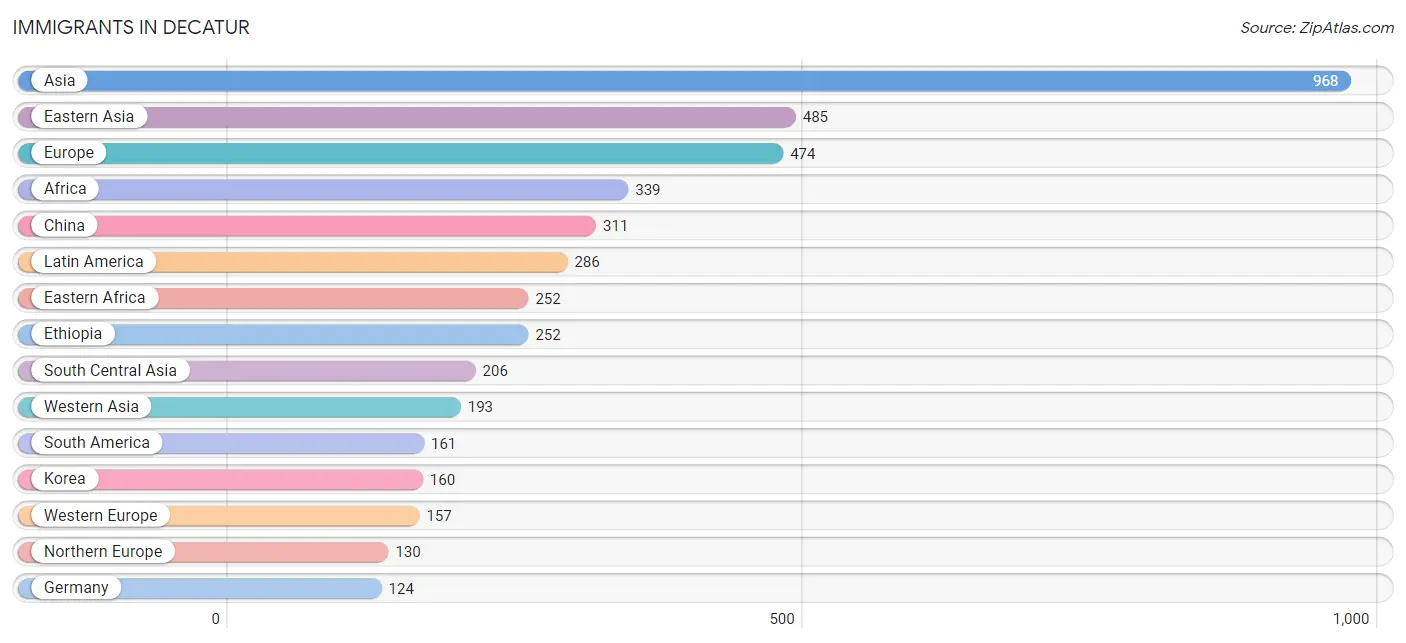
Immigrants in Decatur
The most numerous immigrant groups reported in Decatur came from Asia (968 | 4.0%), Eastern Asia (485 | 2.0%), Europe (474 | 1.9%), Africa (339 | 1.4%), and China (311 | 1.3%), together accounting for 10.5% of all Decatur residents.
| Immigration Origin | # Population | % Population |
| Afghanistan | 96 | 0.4% |
| Africa | 339 | 1.4% |
| Argentina | 90 | 0.4% |
| Asia | 968 | 4.0% |
| Bosnia and Herzegovina | 37 | 0.2% |
| Brazil | 18 | 0.1% |
| Canada | 110 | 0.4% |
| Caribbean | 33 | 0.1% |
| Central America | 92 | 0.4% |
| Chile | 10 | 0.0% |
| China | 311 | 1.3% |
| Colombia | 13 | 0.1% |
| Costa Rica | 7 | 0.0% |
| Cuba | 33 | 0.1% |
| Denmark | 51 | 0.2% |
| Eastern Africa | 252 | 1.0% |
| Eastern Asia | 485 | 2.0% |
| Eastern Europe | 71 | 0.3% |
| Ecuador | 4 | 0.0% |
| Egypt | 21 | 0.1% |
| England | 62 | 0.3% |
| Ethiopia | 252 | 1.0% |
| Europe | 474 | 1.9% |
| Germany | 124 | 0.5% |
| Greece | 11 | 0.1% |
| Guyana | 12 | 0.1% |
| Hong Kong | 25 | 0.1% |
| India | 98 | 0.4% |
| Iran | 12 | 0.1% |
| Iraq | 28 | 0.1% |
| Israel | 17 | 0.1% |
| Italy | 87 | 0.4% |
| Japan | 14 | 0.1% |
| Jordan | 64 | 0.3% |
| Korea | 160 | 0.7% |
| Latin America | 286 | 1.2% |
| Malaysia | 40 | 0.2% |
| Mexico | 51 | 0.2% |
| Nicaragua | 16 | 0.1% |
| Nigeria | 55 | 0.2% |
| Northern Africa | 21 | 0.1% |
| Northern Europe | 130 | 0.5% |
| Panama | 18 | 0.1% |
| Peru | 6 | 0.0% |
| Philippines | 19 | 0.1% |
| Russia | 20 | 0.1% |
| South Africa | 11 | 0.1% |
| South America | 161 | 0.7% |
| South Central Asia | 206 | 0.8% |
| South Eastern Asia | 84 | 0.3% |
| Southern Europe | 116 | 0.5% |
| Spain | 18 | 0.1% |
| Switzerland | 33 | 0.1% |
| Syria | 21 | 0.1% |
| Taiwan | 49 | 0.2% |
| Turkey | 50 | 0.2% |
| Ukraine | 14 | 0.1% |
| Venezuela | 8 | 0.0% |
| Vietnam | 25 | 0.1% |
| Western Africa | 55 | 0.2% |
| Western Asia | 193 | 0.8% |
| Western Europe | 157 | 0.6% | View All 62 Rows |
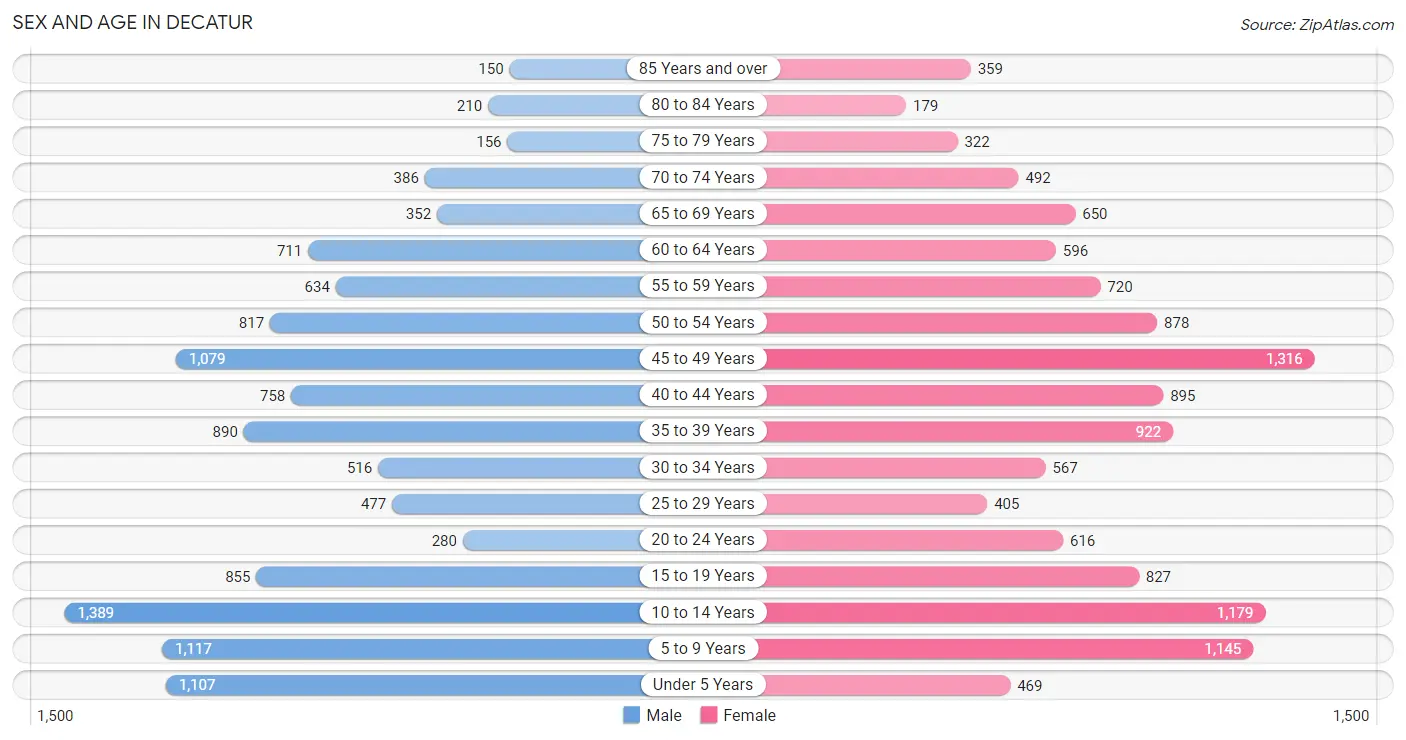
Sex and Age in Decatur
Sex and Age in Decatur
The most populous age groups in Decatur are 10 to 14 Years (1,389 | 11.7%) for men and 45 to 49 Years (1,316 | 10.5%) for women.
| Age Bracket | Male | Female |
| Under 5 Years | 1,107 (9.3%) | 469 (3.7%) |
| 5 to 9 Years | 1,117 (9.4%) | 1,145 (9.1%) |
| 10 to 14 Years | 1,389 (11.7%) | 1,179 (9.4%) |
| 15 to 19 Years | 855 (7.2%) | 827 (6.6%) |
| 20 to 24 Years | 280 (2.4%) | 616 (4.9%) |
| 25 to 29 Years | 477 (4.0%) | 405 (3.2%) |
| 30 to 34 Years | 516 (4.3%) | 567 (4.5%) |
| 35 to 39 Years | 890 (7.5%) | 922 (7.3%) |
| 40 to 44 Years | 758 (6.4%) | 895 (7.1%) |
| 45 to 49 Years | 1,079 (9.1%) | 1,316 (10.5%) |
| 50 to 54 Years | 817 (6.9%) | 878 (7.0%) |
| 55 to 59 Years | 634 (5.3%) | 720 (5.7%) |
| 60 to 64 Years | 711 (6.0%) | 596 (4.8%) |
| 65 to 69 Years | 352 (3.0%) | 650 (5.2%) |
| 70 to 74 Years | 386 (3.3%) | 492 (3.9%) |
| 75 to 79 Years | 156 (1.3%) | 322 (2.6%) |
| 80 to 84 Years | 210 (1.8%) | 179 (1.4%) |
| 85 Years and over | 150 (1.3%) | 359 (2.9%) |
| Total | 11,884 (100.0%) | 12,537 (100.0%) |
Families and Households in Decatur
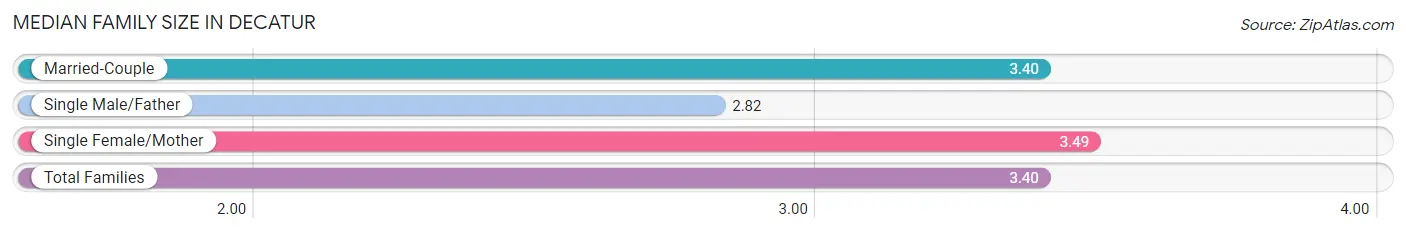
Median Family Size in Decatur
The median family size in Decatur is 3.40 persons per family, with single female/mother families (736 | 12.7%) accounting for the largest median family size of 3.49 persons per family. On the other hand, single male/father families (126 | 2.2%) represent the smallest median family size with 2.82 persons per family.
| Family Type | # Families | Family Size |
| Married-Couple | 4,923 (85.1%) | 3.40 |
| Single Male/Father | 126 (2.2%) | 2.82 |
| Single Female/Mother | 736 (12.7%) | 3.49 |
| Total Families | 5,785 (100.0%) | 3.40 |
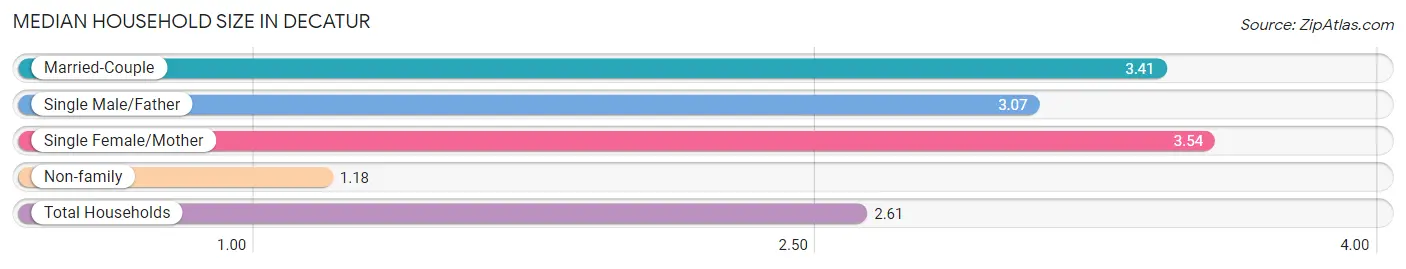
Median Household Size in Decatur
The median household size in Decatur is 2.61 persons per household, with single female/mother households (736 | 8.1%) accounting for the largest median household size of 3.54 persons per household. non-family households (3,268 | 36.1%) represent the smallest median household size with 1.18 persons per household.
| Household Type | # Households | Household Size |
| Married-Couple | 4,923 (54.4%) | 3.41 |
| Single Male/Father | 126 (1.4%) | 3.07 |
| Single Female/Mother | 736 (8.1%) | 3.54 |
| Non-family | 3,268 (36.1%) | 1.18 |
| Total Households | 9,053 (100.0%) | 2.61 |
Household Size by Marriage Status in Decatur
Out of a total of 9,053 households in Decatur, 5,785 (63.9%) are family households, while 3,268 (36.1%) are nonfamily households. The most numerous type of family households are 2-person households, comprising 2,122, and the most common type of nonfamily households are 1-person households, comprising 2,780.
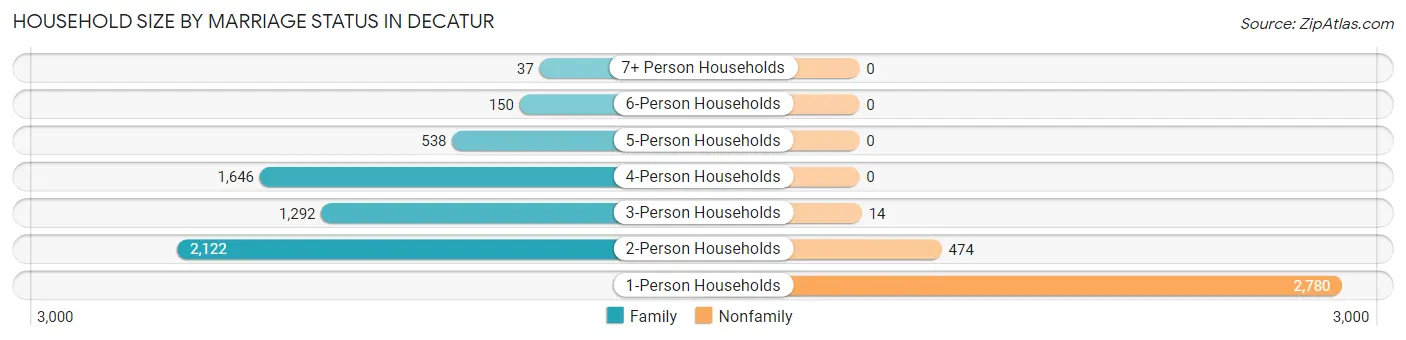
| Household Size | Family Households | Nonfamily Households |
| 1-Person Households | - | 2,780 (30.7%) |
| 2-Person Households | 2,122 (23.4%) | 474 (5.2%) |
| 3-Person Households | 1,292 (14.3%) | 14 (0.2%) |
| 4-Person Households | 1,646 (18.2%) | 0 (0.0%) |
| 5-Person Households | 538 (5.9%) | 0 (0.0%) |
| 6-Person Households | 150 (1.7%) | 0 (0.0%) |
| 7+ Person Households | 37 (0.4%) | 0 (0.0%) |
| Total | 5,785 (63.9%) | 3,268 (36.1%) |
Female Fertility in Decatur
Fertility by Age in Decatur
Average fertility rate in Decatur is 44.0 births per 1,000 women. Women in the age bracket of 20 to 34 years have the highest fertility rate with 81.0 births per 1,000 women. Women in the age bracket of 20 to 34 years acount for 50.4% of all women with births.
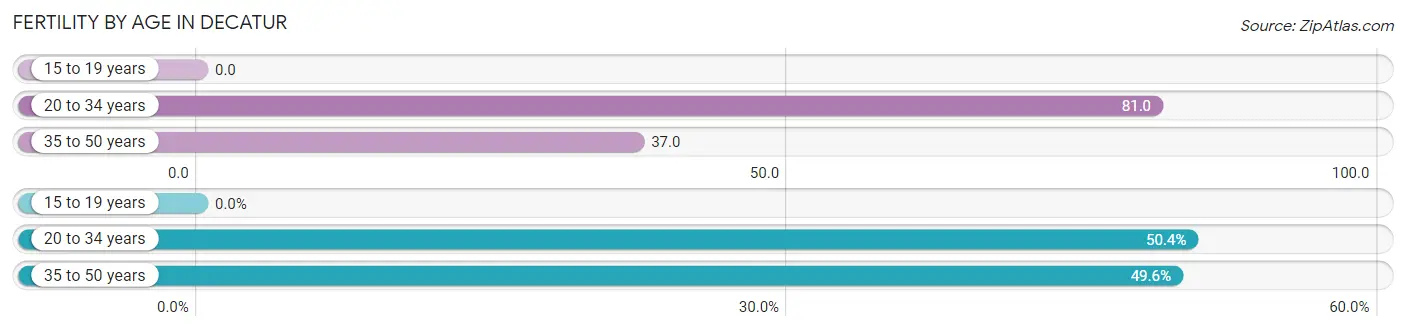
| Age Bracket | Women with Births | Births / 1,000 Women |
| 15 to 19 years | 0 (0.0%) | 0.0 |
| 20 to 34 years | 128 (50.4%) | 81.0 |
| 35 to 50 years | 126 (49.6%) | 37.0 |
| Total | 254 (100.0%) | 44.0 |
Fertility by Age by Marriage Status in Decatur
81.5% of women with births (254) in Decatur are married. The highest percentage of unmarried women with births falls into 20 to 34 years age bracket with 36.7% of them unmarried at the time of birth, while the lowest percentage of unmarried women with births belong to 35 to 50 years age bracket with 0.0% of them unmarried.
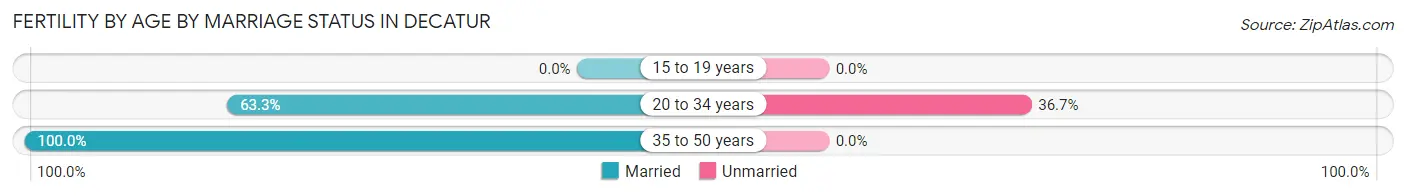
| Age Bracket | Married | Unmarried |
| 15 to 19 years | 0 (0.0%) | 0 (0.0%) |
| 20 to 34 years | 81 (63.3%) | 47 (36.7%) |
| 35 to 50 years | 126 (100.0%) | 0 (0.0%) |
| Total | 207 (81.5%) | 47 (18.5%) |
Fertility by Education in Decatur
Average fertility rate in Decatur is 44.0 births per 1,000 women. Women with the education attainment of high school diploma have the highest fertility rate of 108.0 births per 1,000 women, while women with the education attainment of less than high school have the lowest fertility at 15.0 births per 1,000 women. Women with the education attainment of graduate degree represent 45.7% of all women with births.
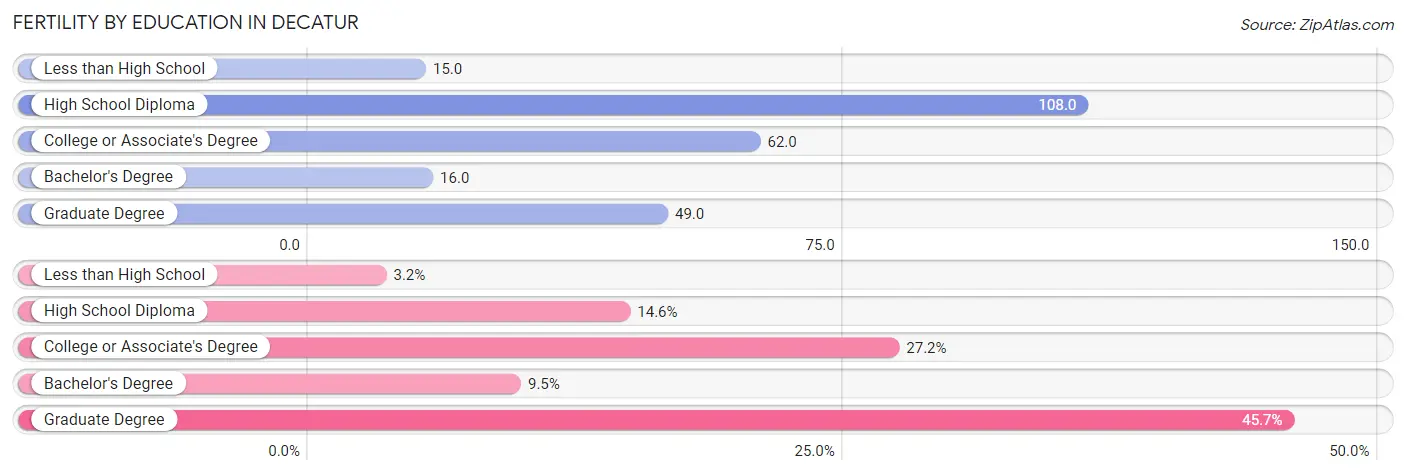
| Educational Attainment | Women with Births | Births / 1,000 Women |
| Less than High School | 8 (3.2%) | 15.0 |
| High School Diploma | 37 (14.6%) | 108.0 |
| College or Associate's Degree | 69 (27.2%) | 62.0 |
| Bachelor's Degree | 24 (9.5%) | 16.0 |
| Graduate Degree | 116 (45.7%) | 49.0 |
| Total | 254 (100.0%) | 44.0 |
Fertility by Education by Marriage Status in Decatur
18.5% of women with births in Decatur are unmarried. Women with the educational attainment of less than high school are most likely to be married with 100.0% of them married at childbirth, while women with the educational attainment of high school diploma are least likely to be married with 100.0% of them unmarried at childbirth.
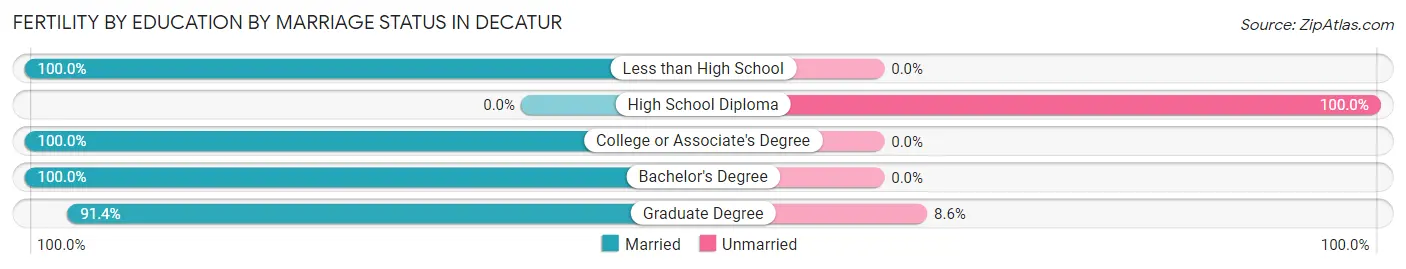
| Educational Attainment | Married | Unmarried |
| Less than High School | 8 (100.0%) | 0 (0.0%) |
| High School Diploma | 0 (0.0%) | 37 (100.0%) |
| College or Associate's Degree | 69 (100.0%) | 0 (0.0%) |
| Bachelor's Degree | 24 (100.0%) | 0 (0.0%) |
| Graduate Degree | 106 (91.4%) | 10 (8.6%) |
| Total | 207 (81.5%) | 47 (18.5%) |
Employment Characteristics in Decatur
Employment by Class of Employer in Decatur
Among the 10,841 employed individuals in Decatur, private company employees (5,483 | 50.6%), not-for-profit organizations (2,084 | 19.2%), and self-employed (incorporated) (919 | 8.5%) make up the most common classes of employment.
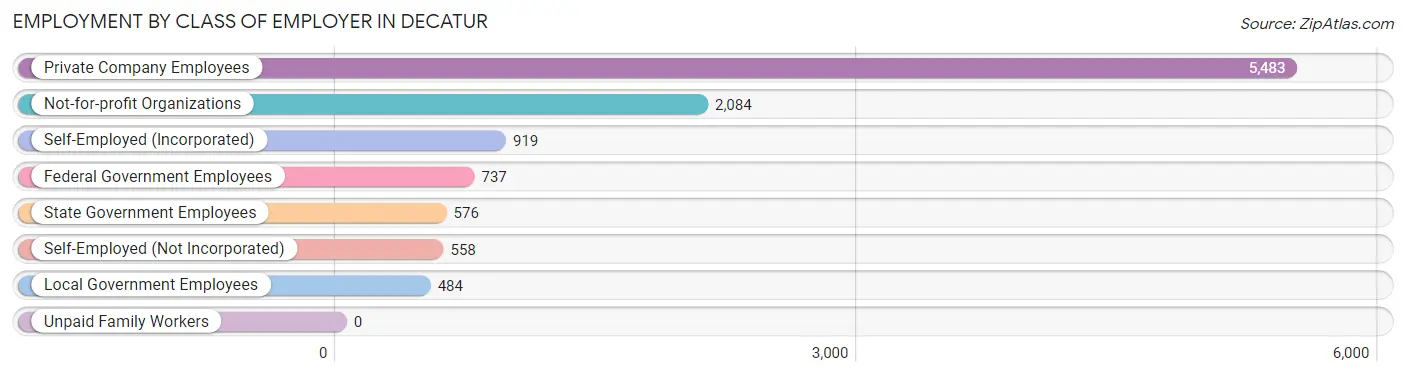
| Employer Class | # Employees | % Employees |
| Private Company Employees | 5,483 | 50.6% |
| Self-Employed (Incorporated) | 919 | 8.5% |
| Self-Employed (Not Incorporated) | 558 | 5.1% |
| Not-for-profit Organizations | 2,084 | 19.2% |
| Local Government Employees | 484 | 4.5% |
| State Government Employees | 576 | 5.3% |
| Federal Government Employees | 737 | 6.8% |
| Unpaid Family Workers | 0 | 0.0% |
| Total | 10,841 | 100.0% |
Employment Status by Age in Decatur
According to the labor force statistics for Decatur, out of the total population over 16 years of age (17,620), 64.8% or 11,418 individuals are in the labor force, with 3.8% or 434 of them unemployed. The age group with the highest labor force participation rate is 25 to 29 years, with 89.8% or 792 individuals in the labor force. Within the labor force, the 20 to 24 years age range has the highest percentage of unemployed individuals, with 17.9% or 77 of them being unemployed.
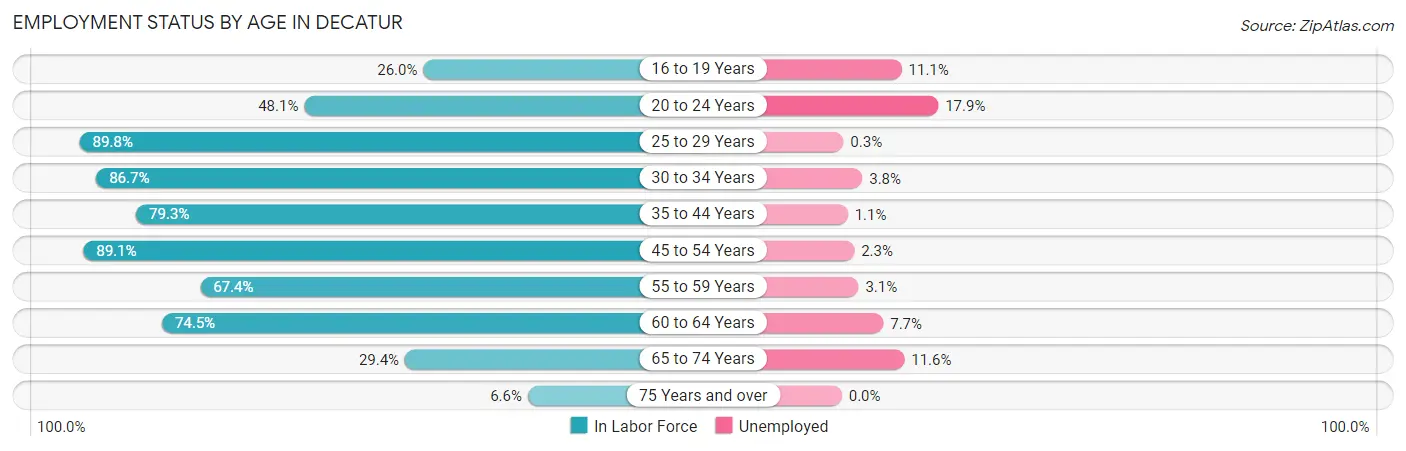
| Age Bracket | In Labor Force | Unemployed |
| 16 to 19 Years | 335 (26.0%) | 37 (11.1%) |
| 20 to 24 Years | 431 (48.1%) | 77 (17.9%) |
| 25 to 29 Years | 792 (89.8%) | 2 (0.3%) |
| 30 to 34 Years | 939 (86.7%) | 36 (3.8%) |
| 35 to 44 Years | 2,748 (79.3%) | 30 (1.1%) |
| 45 to 54 Years | 3,644 (89.1%) | 84 (2.3%) |
| 55 to 59 Years | 913 (67.4%) | 28 (3.1%) |
| 60 to 64 Years | 974 (74.5%) | 75 (7.7%) |
| 65 to 74 Years | 553 (29.4%) | 64 (11.6%) |
| 75 Years and over | 91 (6.6%) | 0 (0.0%) |
| Total | 11,418 (64.8%) | 434 (3.8%) |
Employment Status by Educational Attainment in Decatur
According to labor force statistics for Decatur, 82.2% of individuals (10,013) out of the total population between 25 and 64 years of age (12,181) are in the labor force, with 2.5% or 250 of them being unemployed. The group with the highest labor force participation rate are those with the educational attainment of bachelor's degree or higher, with 87.0% or 8,292 individuals in the labor force. Within the labor force, individuals with less than high school education have the highest percentage of unemployment, with 17.1% or 22 of them being unemployed.
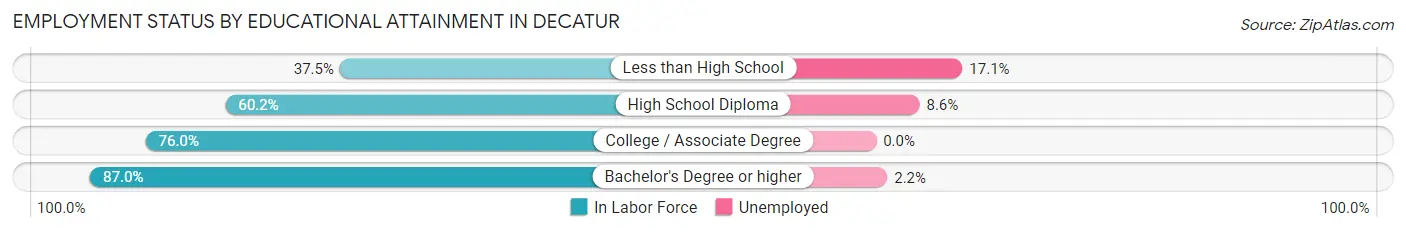
| Educational Attainment | In Labor Force | Unemployed |
| Less than High School | 129 (37.5%) | 59 (17.1%) |
| High School Diploma | 627 (60.2%) | 90 (8.6%) |
| College / Associate Degree | 961 (76.0%) | 0 (0.0%) |
| Bachelor's Degree or higher | 8,292 (87.0%) | 210 (2.2%) |
| Total | 10,013 (82.2%) | 305 (2.5%) |
Employment Occupations by Sex in Decatur
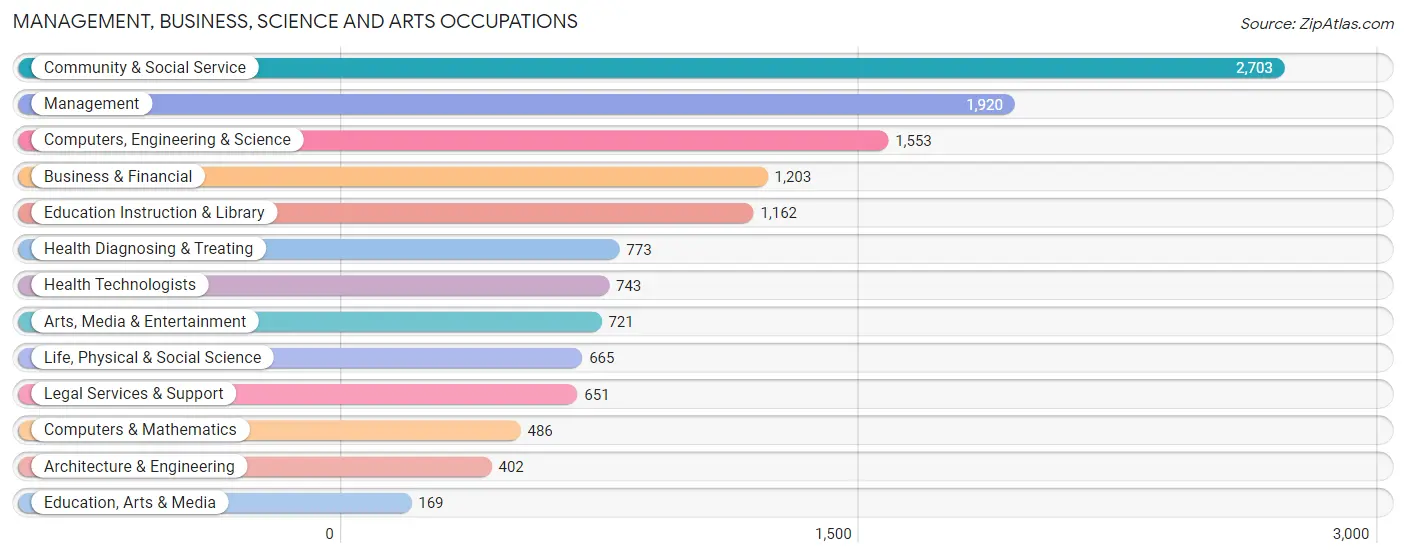
Management, Business, Science and Arts Occupations
The most common Management, Business, Science and Arts occupations in Decatur are Community & Social Service (2,703 | 24.6%), Management (1,920 | 17.5%), Computers, Engineering & Science (1,553 | 14.1%), Business & Financial (1,203 | 11.0%), and Education Instruction & Library (1,162 | 10.6%).
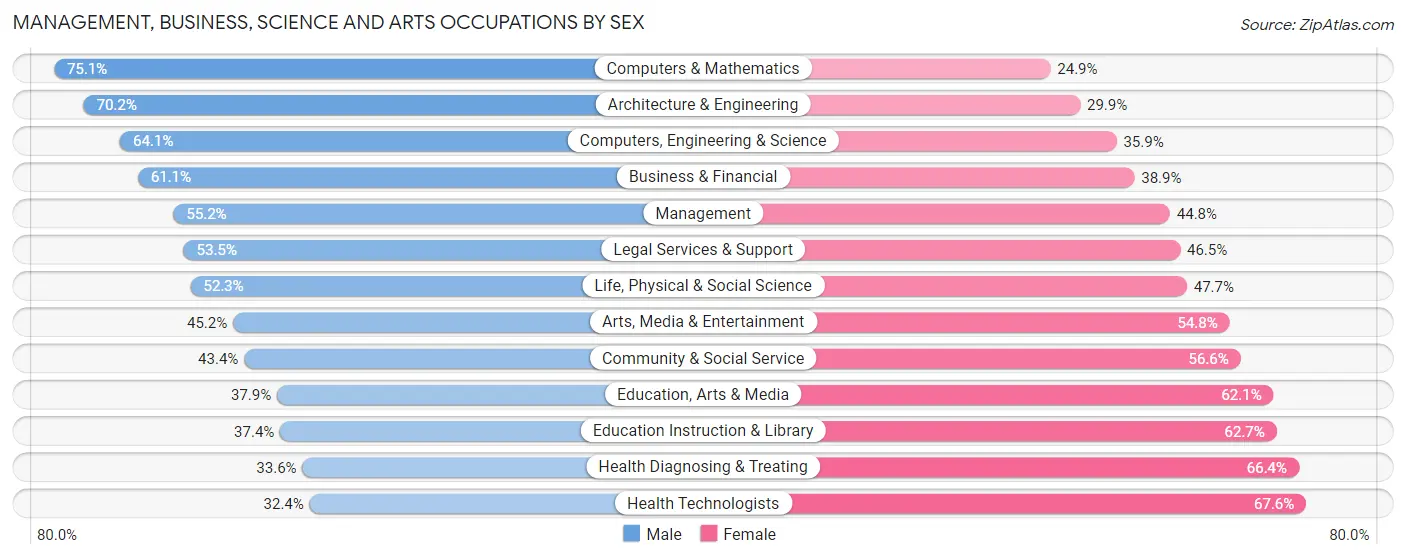
Management, Business, Science and Arts Occupations by Sex
Within the Management, Business, Science and Arts occupations in Decatur, the most male-oriented occupations are Computers & Mathematics (75.1%), Architecture & Engineering (70.2%), and Computers, Engineering & Science (64.1%), while the most female-oriented occupations are Health Technologists (67.6%), Health Diagnosing & Treating (66.4%), and Education Instruction & Library (62.6%).
| Occupation | Male | Female |
| Management | 1,059 (55.2%) | 861 (44.8%) |
| Business & Financial | 735 (61.1%) | 468 (38.9%) |
| Computers, Engineering & Science | 995 (64.1%) | 558 (35.9%) |
| Computers & Mathematics | 365 (75.1%) | 121 (24.9%) |
| Architecture & Engineering | 282 (70.2%) | 120 (29.8%) |
| Life, Physical & Social Science | 348 (52.3%) | 317 (47.7%) |
| Community & Social Service | 1,172 (43.4%) | 1,531 (56.6%) |
| Education, Arts & Media | 64 (37.9%) | 105 (62.1%) |
| Legal Services & Support | 348 (53.5%) | 303 (46.5%) |
| Education Instruction & Library | 434 (37.3%) | 728 (62.6%) |
| Arts, Media & Entertainment | 326 (45.2%) | 395 (54.8%) |
| Health Diagnosing & Treating | 260 (33.6%) | 513 (66.4%) |
| Health Technologists | 241 (32.4%) | 502 (67.6%) |
| Total (Category) | 4,221 (51.8%) | 3,931 (48.2%) |
| Total (Overall) | 5,497 (50.0%) | 5,492 (50.0%) |
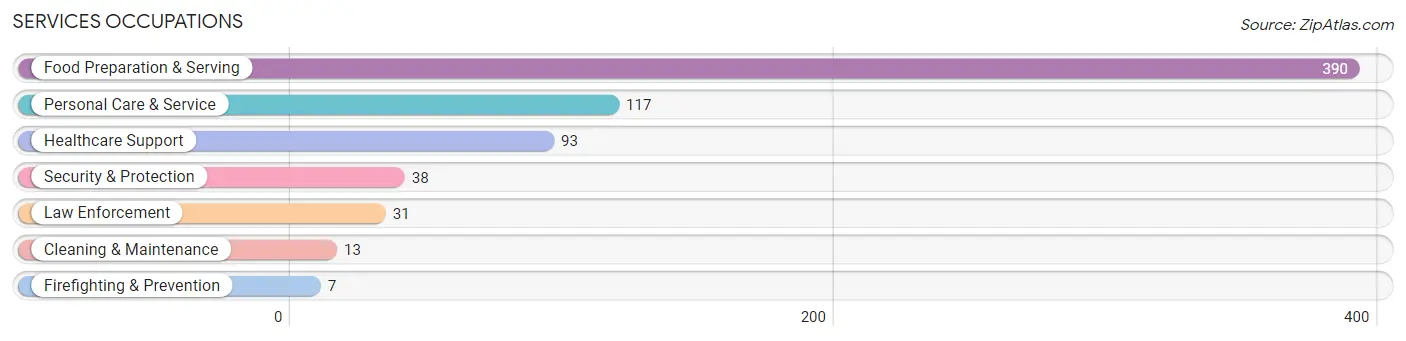
Services Occupations
The most common Services occupations in Decatur are Food Preparation & Serving (390 | 3.5%), Personal Care & Service (117 | 1.1%), Healthcare Support (93 | 0.9%), Security & Protection (38 | 0.4%), and Law Enforcement (31 | 0.3%).
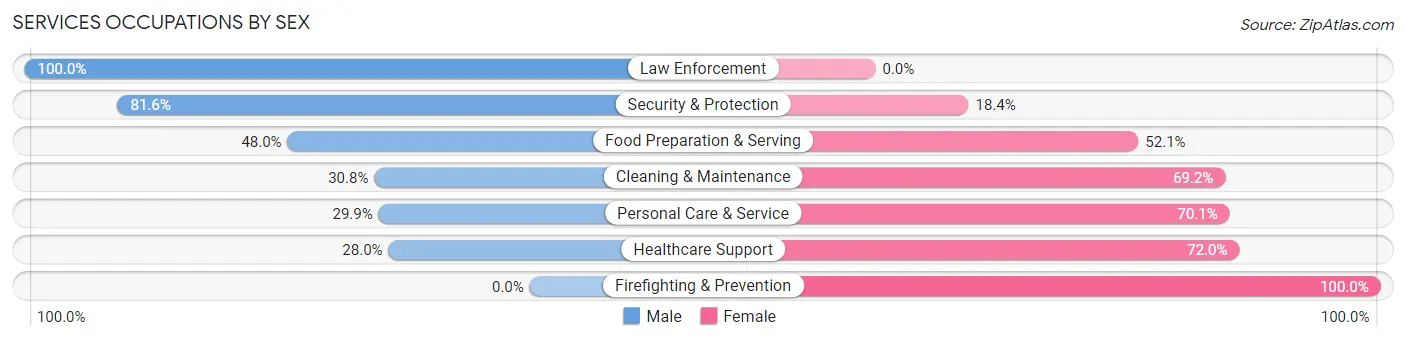
Services Occupations by Sex
Within the Services occupations in Decatur, the most male-oriented occupations are Law Enforcement (100.0%), Security & Protection (81.6%), and Food Preparation & Serving (47.9%), while the most female-oriented occupations are Firefighting & Prevention (100.0%), Healthcare Support (72.0%), and Personal Care & Service (70.1%).
| Occupation | Male | Female |
| Healthcare Support | 26 (28.0%) | 67 (72.0%) |
| Security & Protection | 31 (81.6%) | 7 (18.4%) |
| Firefighting & Prevention | 0 (0.0%) | 7 (100.0%) |
| Law Enforcement | 31 (100.0%) | 0 (0.0%) |
| Food Preparation & Serving | 187 (47.9%) | 203 (52.0%) |
| Cleaning & Maintenance | 4 (30.8%) | 9 (69.2%) |
| Personal Care & Service | 35 (29.9%) | 82 (70.1%) |
| Total (Category) | 283 (43.5%) | 368 (56.5%) |
| Total (Overall) | 5,497 (50.0%) | 5,492 (50.0%) |
Sales and Office Occupations
The most common Sales and Office occupations in Decatur are Sales & Related (1,293 | 11.8%), and Office & Administration (498 | 4.5%).
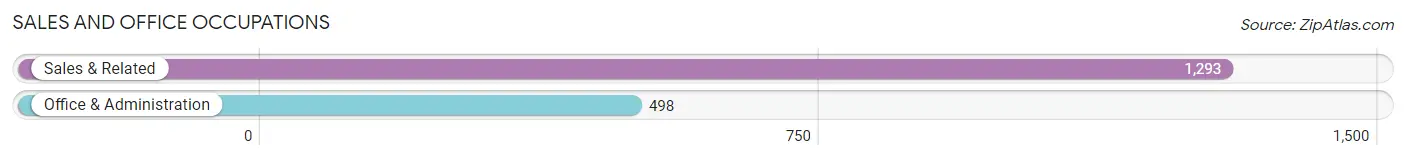
Sales and Office Occupations by Sex
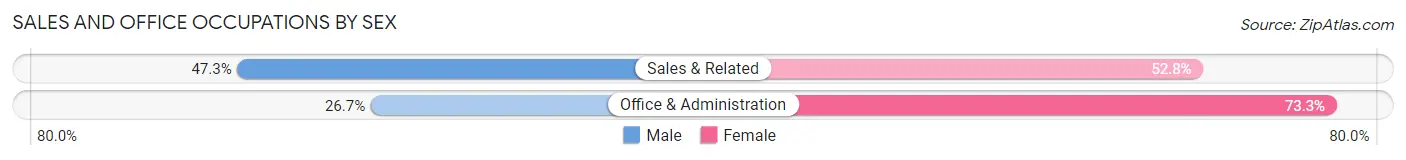
| Occupation | Male | Female |
| Sales & Related | 611 (47.2%) | 682 (52.7%) |
| Office & Administration | 133 (26.7%) | 365 (73.3%) |
| Total (Category) | 744 (41.5%) | 1,047 (58.5%) |
| Total (Overall) | 5,497 (50.0%) | 5,492 (50.0%) |
Natural Resources, Construction and Maintenance Occupations
The most common Natural Resources, Construction and Maintenance occupations in Decatur are Installation, Maintenance & Repair (35 | 0.3%), Farming, Fishing & Forestry (32 | 0.3%), and Construction & Extraction (5 | 0.1%).
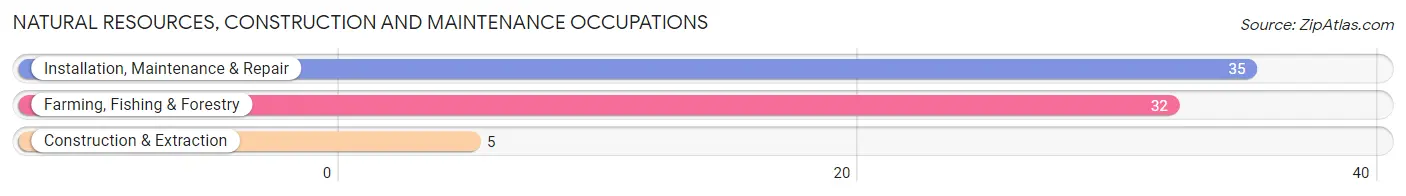
Natural Resources, Construction and Maintenance Occupations by Sex
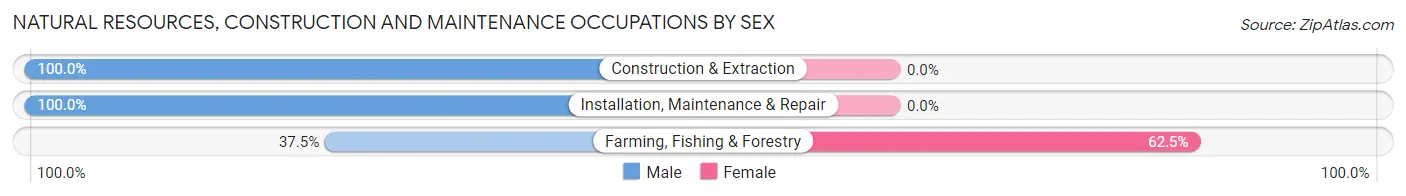
| Occupation | Male | Female |
| Farming, Fishing & Forestry | 12 (37.5%) | 20 (62.5%) |
| Construction & Extraction | 5 (100.0%) | 0 (0.0%) |
| Installation, Maintenance & Repair | 35 (100.0%) | 0 (0.0%) |
| Total (Category) | 52 (72.2%) | 20 (27.8%) |
| Total (Overall) | 5,497 (50.0%) | 5,492 (50.0%) |
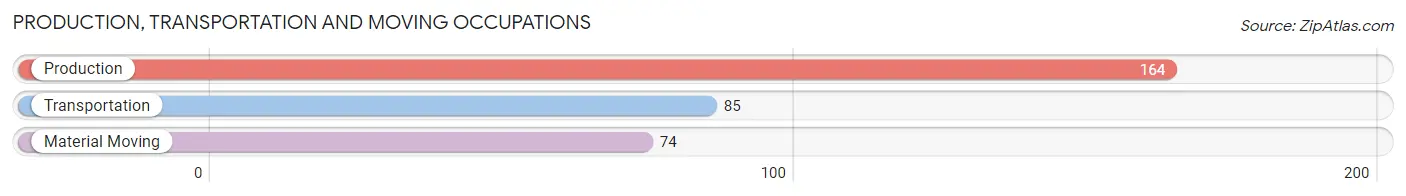
Production, Transportation and Moving Occupations
The most common Production, Transportation and Moving occupations in Decatur are Production (164 | 1.5%), Transportation (85 | 0.8%), and Material Moving (74 | 0.7%).
Production, Transportation and Moving Occupations by Sex
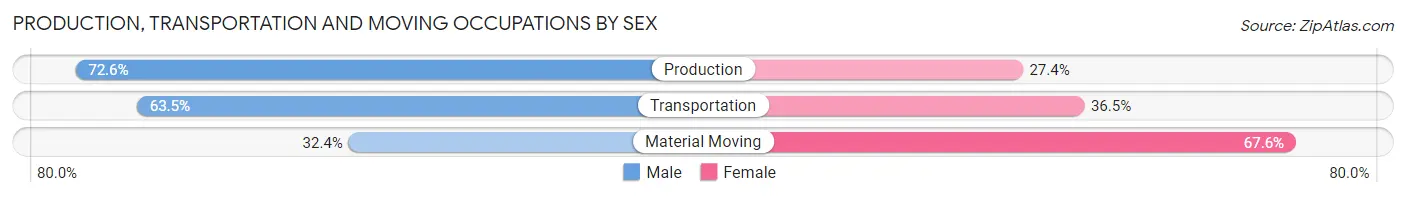
| Occupation | Male | Female |
| Production | 119 (72.6%) | 45 (27.4%) |
| Transportation | 54 (63.5%) | 31 (36.5%) |
| Material Moving | 24 (32.4%) | 50 (67.6%) |
| Total (Category) | 197 (61.0%) | 126 (39.0%) |
| Total (Overall) | 5,497 (50.0%) | 5,492 (50.0%) |
Employment Industries by Sex in Decatur
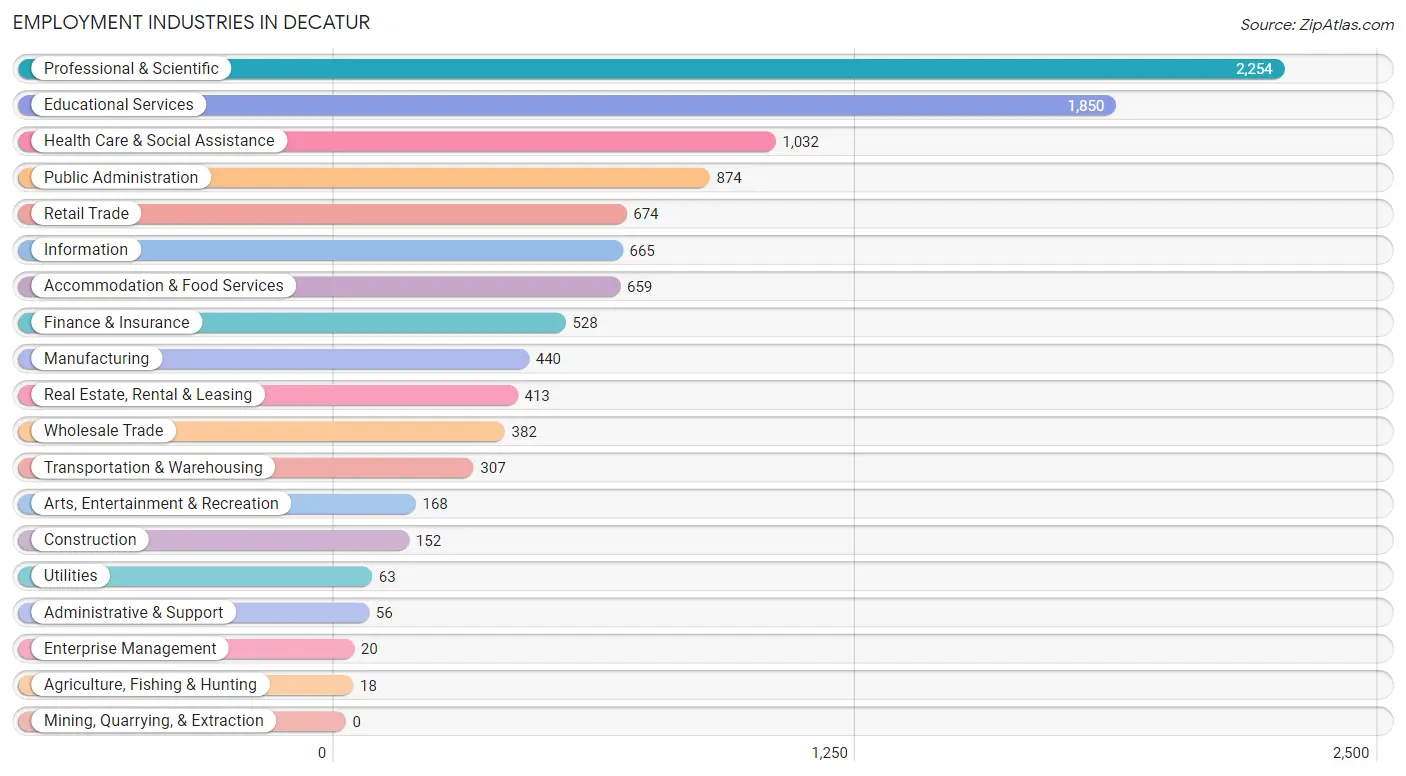
Employment Industries in Decatur
The major employment industries in Decatur include Professional & Scientific (2,254 | 20.5%), Educational Services (1,850 | 16.8%), Health Care & Social Assistance (1,032 | 9.4%), Public Administration (874 | 8.0%), and Retail Trade (674 | 6.1%).
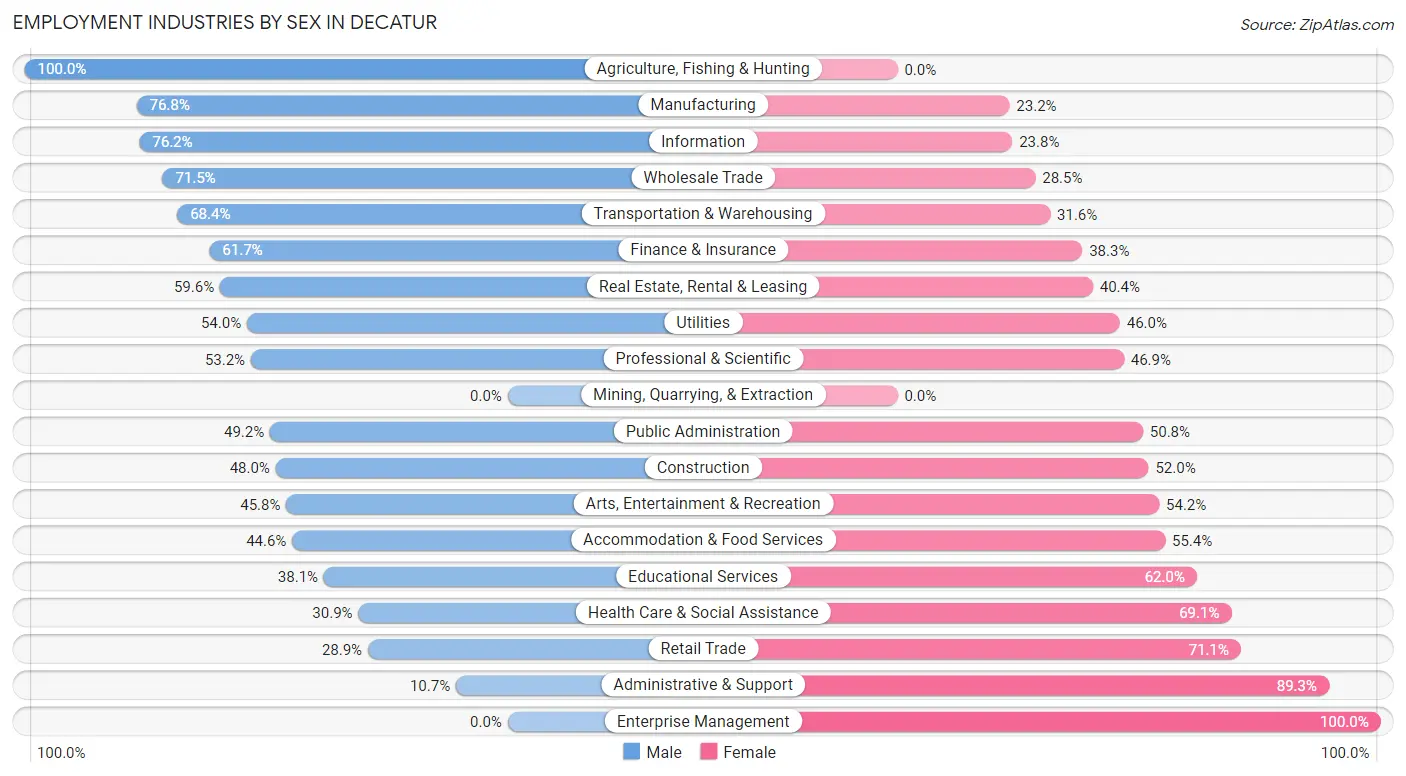
Employment Industries by Sex in Decatur
The Decatur industries that see more men than women are Agriculture, Fishing & Hunting (100.0%), Manufacturing (76.8%), and Information (76.2%), whereas the industries that tend to have a higher number of women are Enterprise Management (100.0%), Administrative & Support (89.3%), and Retail Trade (71.1%).
| Industry | Male | Female |
| Agriculture, Fishing & Hunting | 18 (100.0%) | 0 (0.0%) |
| Mining, Quarrying, & Extraction | 0 (0.0%) | 0 (0.0%) |
| Construction | 73 (48.0%) | 79 (52.0%) |
| Manufacturing | 338 (76.8%) | 102 (23.2%) |
| Wholesale Trade | 273 (71.5%) | 109 (28.5%) |
| Retail Trade | 195 (28.9%) | 479 (71.1%) |
| Transportation & Warehousing | 210 (68.4%) | 97 (31.6%) |
| Utilities | 34 (54.0%) | 29 (46.0%) |
| Information | 507 (76.2%) | 158 (23.8%) |
| Finance & Insurance | 326 (61.7%) | 202 (38.3%) |
| Real Estate, Rental & Leasing | 246 (59.6%) | 167 (40.4%) |
| Professional & Scientific | 1,198 (53.1%) | 1,056 (46.9%) |
| Enterprise Management | 0 (0.0%) | 20 (100.0%) |
| Administrative & Support | 6 (10.7%) | 50 (89.3%) |
| Educational Services | 704 (38.1%) | 1,146 (62.0%) |
| Health Care & Social Assistance | 319 (30.9%) | 713 (69.1%) |
| Arts, Entertainment & Recreation | 77 (45.8%) | 91 (54.2%) |
| Accommodation & Food Services | 294 (44.6%) | 365 (55.4%) |
| Public Administration | 430 (49.2%) | 444 (50.8%) |
| Total | 5,497 (50.0%) | 5,492 (50.0%) |
Education in Decatur
School Enrollment in Decatur
The most common levels of schooling among the 7,980 students in Decatur are middle school (2,015 | 25.3%), elementary school (1,614 | 20.2%), and high school (1,587 | 19.9%).
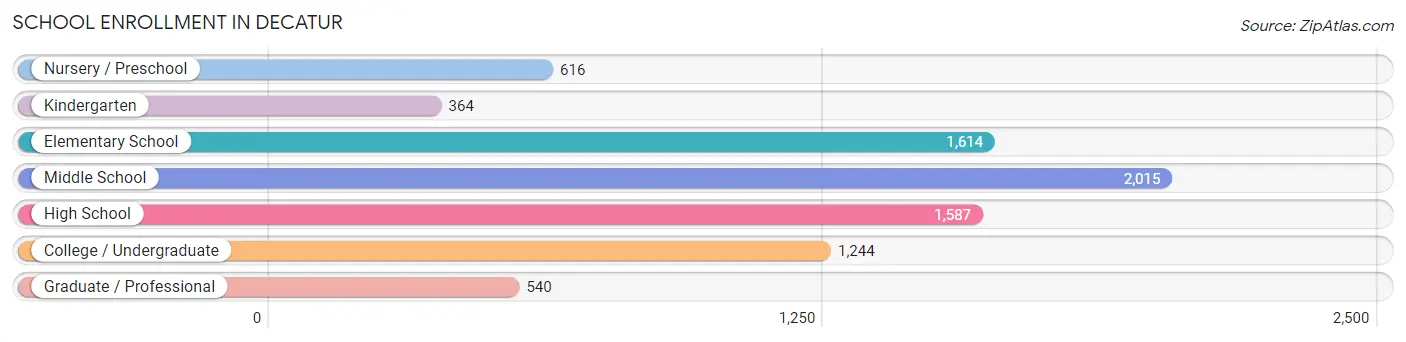
| School Level | # Students | % Students |
| Nursery / Preschool | 616 | 7.7% |
| Kindergarten | 364 | 4.6% |
| Elementary School | 1,614 | 20.2% |
| Middle School | 2,015 | 25.3% |
| High School | 1,587 | 19.9% |
| College / Undergraduate | 1,244 | 15.6% |
| Graduate / Professional | 540 | 6.8% |
| Total | 7,980 | 100.0% |
School Enrollment by Age by Funding Source in Decatur
Out of a total of 7,980 students who are enrolled in schools in Decatur, 1,716 (21.5%) attend a private institution, while the remaining 6,264 (78.5%) are enrolled in public schools. The age group of 20 to 24 year olds has the highest likelihood of being enrolled in private schools, with 422 (54.4% in the age bracket) enrolled. Conversely, the age group of 5 to 9 year old has the lowest likelihood of being enrolled in a private school, with 1,792 (92.7% in the age bracket) attending a public institution.
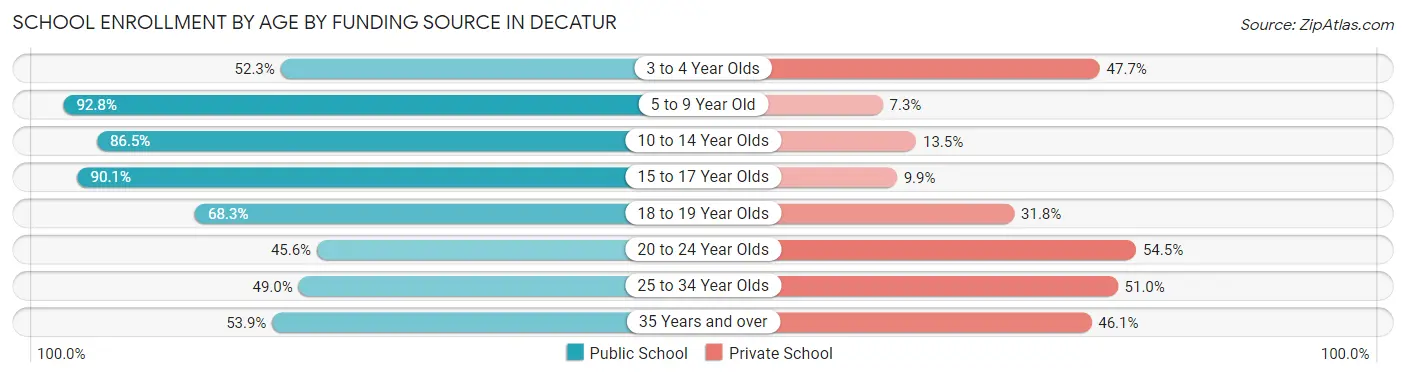
| Age Bracket | Public School | Private School |
| 3 to 4 Year Olds | 214 (52.3%) | 195 (47.7%) |
| 5 to 9 Year Old | 1,792 (92.7%) | 140 (7.2%) |
| 10 to 14 Year Olds | 2,215 (86.5%) | 345 (13.5%) |
| 15 to 17 Year Olds | 930 (90.1%) | 102 (9.9%) |
| 18 to 19 Year Olds | 432 (68.2%) | 201 (31.8%) |
| 20 to 24 Year Olds | 353 (45.6%) | 422 (54.4%) |
| 25 to 34 Year Olds | 193 (49.0%) | 201 (51.0%) |
| 35 Years and over | 132 (53.9%) | 113 (46.1%) |
| Total | 6,264 (78.5%) | 1,716 (21.5%) |
Educational Attainment by Field of Study in Decatur
Business (1,603 | 12.9%), literature & languages (1,578 | 12.7%), social sciences (1,562 | 12.6%), bio, nature & agricultural (977 | 7.9%), and communications (941 | 7.6%) are the most common fields of study among 12,405 individuals in Decatur who have obtained a bachelor's degree or higher.
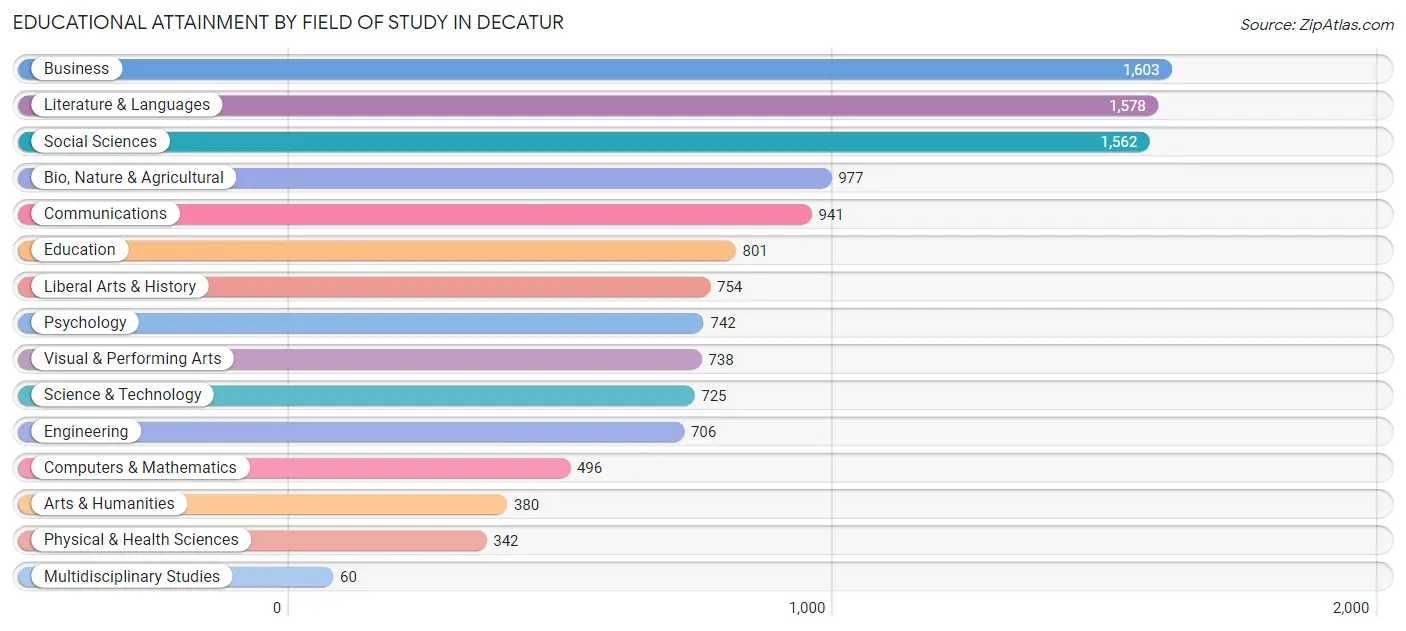
| Field of Study | # Graduates | % Graduates |
| Computers & Mathematics | 496 | 4.0% |
| Bio, Nature & Agricultural | 977 | 7.9% |
| Physical & Health Sciences | 342 | 2.8% |
| Psychology | 742 | 6.0% |
| Social Sciences | 1,562 | 12.6% |
| Engineering | 706 | 5.7% |
| Multidisciplinary Studies | 60 | 0.5% |
| Science & Technology | 725 | 5.8% |
| Business | 1,603 | 12.9% |
| Education | 801 | 6.5% |
| Literature & Languages | 1,578 | 12.7% |
| Liberal Arts & History | 754 | 6.1% |
| Visual & Performing Arts | 738 | 5.9% |
| Communications | 941 | 7.6% |
| Arts & Humanities | 380 | 3.1% |
| Total | 12,405 | 100.0% |
Transportation & Commute in Decatur
Vehicle Availability by Sex in Decatur
The most prevalent vehicle ownership categories in Decatur are males with 2 vehicles (3,524, accounting for 64.7%) and females with 2 vehicles (3,108, making up 67.7%).
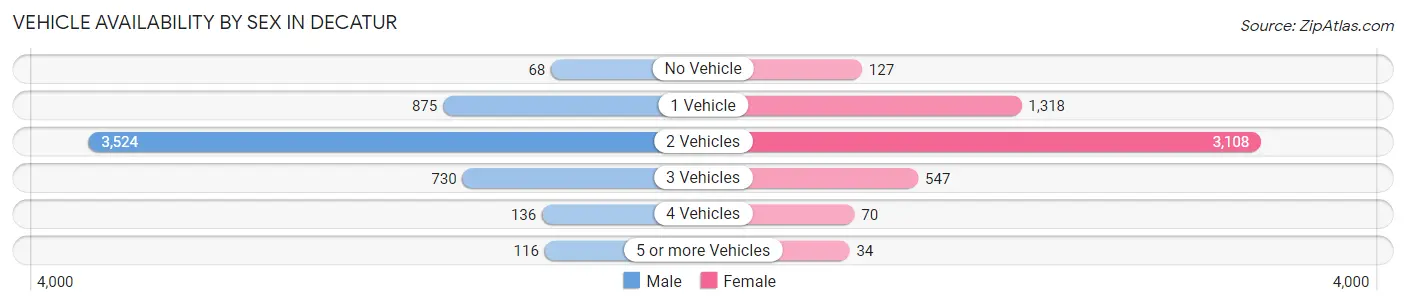
| Vehicles Available | Male | Female |
| No Vehicle | 68 (1.3%) | 127 (2.4%) |
| 1 Vehicle | 875 (16.1%) | 1,318 (25.3%) |
| 2 Vehicles | 3,524 (64.7%) | 3,108 (59.7%) |
| 3 Vehicles | 730 (13.4%) | 547 (10.5%) |
| 4 Vehicles | 136 (2.5%) | 70 (1.3%) |
| 5 or more Vehicles | 116 (2.1%) | 34 (0.6%) |
| Total | 5,449 (100.0%) | 5,204 (100.0%) |
Commute Time in Decatur
The most frequently occuring commute durations in Decatur are 30 to 34 minutes (1,269 commuters, 16.7%), 20 to 24 minutes (1,076 commuters, 14.2%), and 10 to 14 minutes (958 commuters, 12.6%).
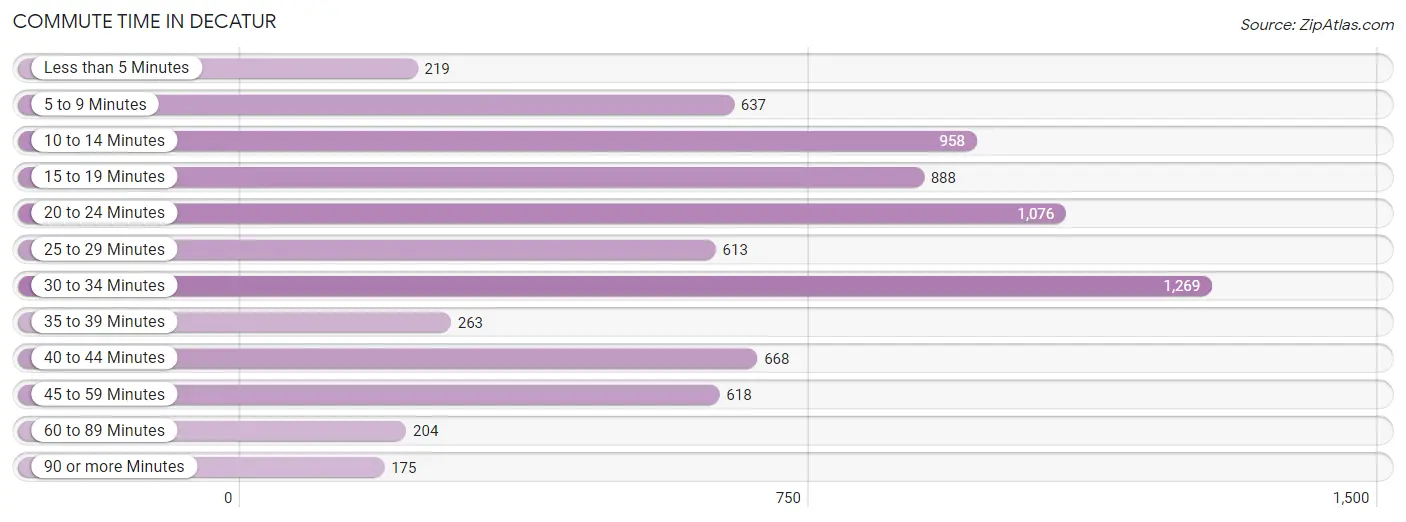
| Commute Time | # Commuters | % Commuters |
| Less than 5 Minutes | 219 | 2.9% |
| 5 to 9 Minutes | 637 | 8.4% |
| 10 to 14 Minutes | 958 | 12.6% |
| 15 to 19 Minutes | 888 | 11.7% |
| 20 to 24 Minutes | 1,076 | 14.2% |
| 25 to 29 Minutes | 613 | 8.1% |
| 30 to 34 Minutes | 1,269 | 16.7% |
| 35 to 39 Minutes | 263 | 3.5% |
| 40 to 44 Minutes | 668 | 8.8% |
| 45 to 59 Minutes | 618 | 8.1% |
| 60 to 89 Minutes | 204 | 2.7% |
| 90 or more Minutes | 175 | 2.3% |
Commute Time by Sex in Decatur
The most common commute times in Decatur are 30 to 34 minutes (831 commuters, 21.4%) for males and 10 to 14 minutes (754 commuters, 20.4%) for females.
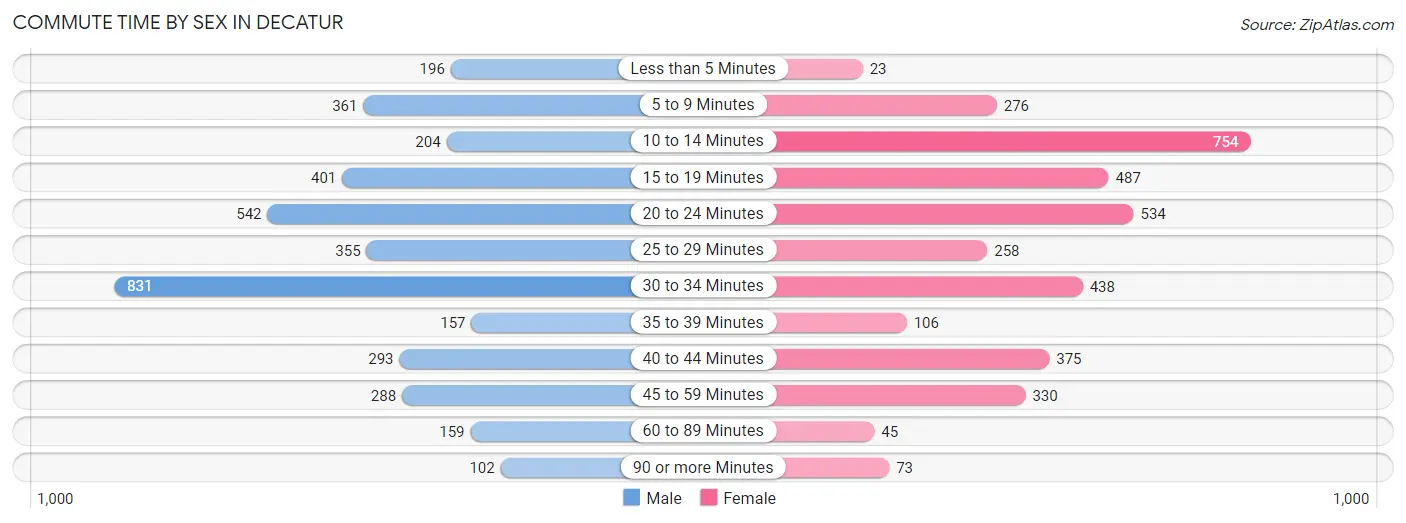
| Commute Time | Male | Female |
| Less than 5 Minutes | 196 (5.0%) | 23 (0.6%) |
| 5 to 9 Minutes | 361 (9.3%) | 276 (7.5%) |
| 10 to 14 Minutes | 204 (5.2%) | 754 (20.4%) |
| 15 to 19 Minutes | 401 (10.3%) | 487 (13.2%) |
| 20 to 24 Minutes | 542 (13.9%) | 534 (14.4%) |
| 25 to 29 Minutes | 355 (9.1%) | 258 (7.0%) |
| 30 to 34 Minutes | 831 (21.4%) | 438 (11.8%) |
| 35 to 39 Minutes | 157 (4.0%) | 106 (2.9%) |
| 40 to 44 Minutes | 293 (7.5%) | 375 (10.1%) |
| 45 to 59 Minutes | 288 (7.4%) | 330 (8.9%) |
| 60 to 89 Minutes | 159 (4.1%) | 45 (1.2%) |
| 90 or more Minutes | 102 (2.6%) | 73 (2.0%) |
Time of Departure to Work by Sex in Decatur
The most frequent times of departure to work in Decatur are 8:00 AM to 8:29 AM (710, 18.3%) for males and 8:00 AM to 8:29 AM (740, 20.0%) for females.
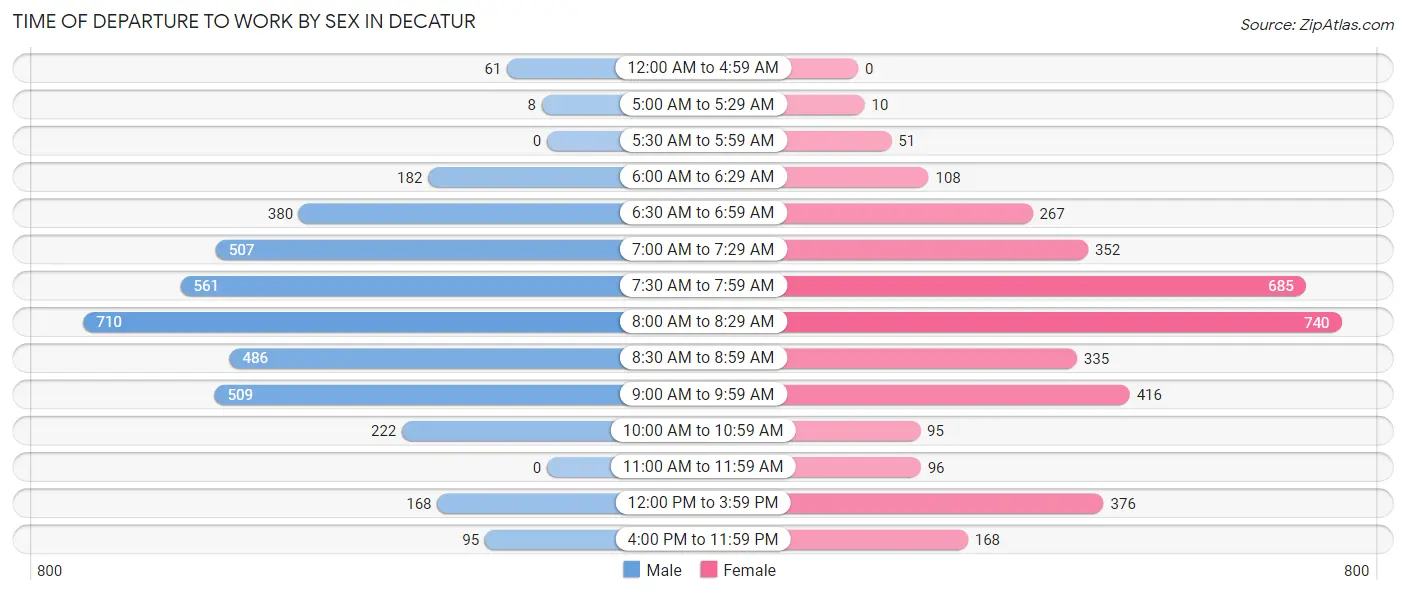
| Time of Departure | Male | Female |
| 12:00 AM to 4:59 AM | 61 (1.6%) | 0 (0.0%) |
| 5:00 AM to 5:29 AM | 8 (0.2%) | 10 (0.3%) |
| 5:30 AM to 5:59 AM | 0 (0.0%) | 51 (1.4%) |
| 6:00 AM to 6:29 AM | 182 (4.7%) | 108 (2.9%) |
| 6:30 AM to 6:59 AM | 380 (9.8%) | 267 (7.2%) |
| 7:00 AM to 7:29 AM | 507 (13.0%) | 352 (9.5%) |
| 7:30 AM to 7:59 AM | 561 (14.4%) | 685 (18.5%) |
| 8:00 AM to 8:29 AM | 710 (18.3%) | 740 (20.0%) |
| 8:30 AM to 8:59 AM | 486 (12.5%) | 335 (9.1%) |
| 9:00 AM to 9:59 AM | 509 (13.1%) | 416 (11.3%) |
| 10:00 AM to 10:59 AM | 222 (5.7%) | 95 (2.6%) |
| 11:00 AM to 11:59 AM | 0 (0.0%) | 96 (2.6%) |
| 12:00 PM to 3:59 PM | 168 (4.3%) | 376 (10.2%) |
| 4:00 PM to 11:59 PM | 95 (2.4%) | 168 (4.5%) |
| Total | 3,889 (100.0%) | 3,699 (100.0%) |
Housing Occupancy in Decatur
Occupancy by Ownership in Decatur
Of the total 9,053 dwellings in Decatur, owner-occupied units account for 5,812 (64.2%), while renter-occupied units make up 3,241 (35.8%).
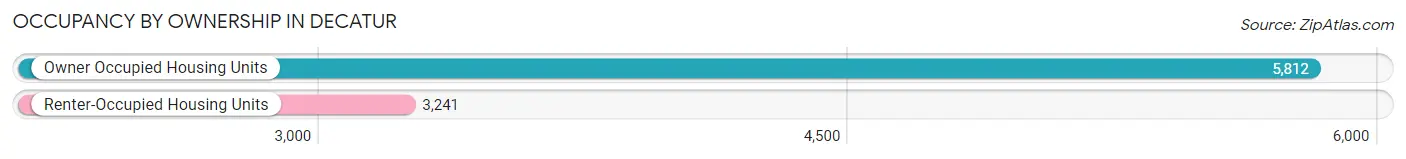
| Occupancy | # Housing Units | % Housing Units |
| Owner Occupied Housing Units | 5,812 | 64.2% |
| Renter-Occupied Housing Units | 3,241 | 35.8% |
| Total Occupied Housing Units | 9,053 | 100.0% |
Occupancy by Household Size in Decatur
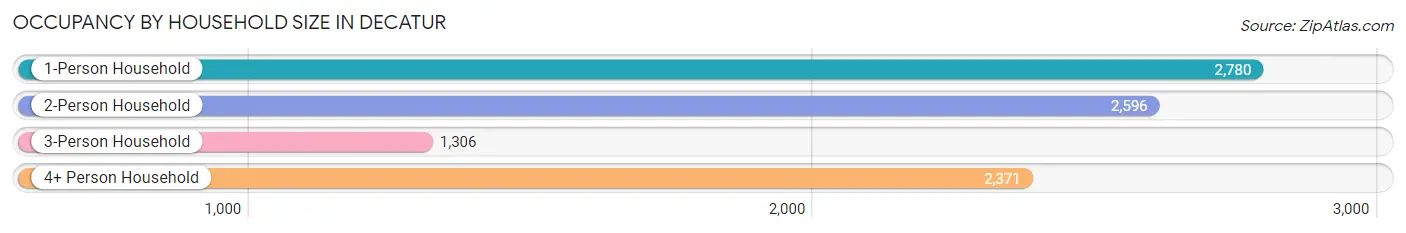
| Household Size | # Housing Units | % Housing Units |
| 1-Person Household | 2,780 | 30.7% |
| 2-Person Household | 2,596 | 28.7% |
| 3-Person Household | 1,306 | 14.4% |
| 4+ Person Household | 2,371 | 26.2% |
| Total Housing Units | 9,053 | 100.0% |
Occupancy by Ownership by Household Size in Decatur
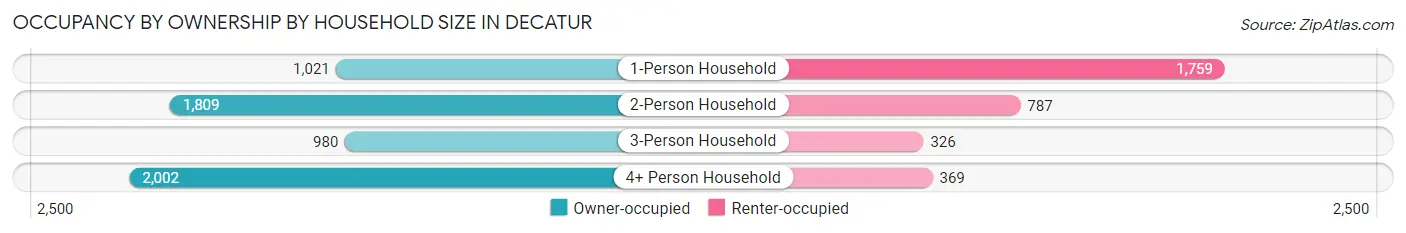
| Household Size | Owner-occupied | Renter-occupied |
| 1-Person Household | 1,021 (36.7%) | 1,759 (63.3%) |
| 2-Person Household | 1,809 (69.7%) | 787 (30.3%) |
| 3-Person Household | 980 (75.0%) | 326 (25.0%) |
| 4+ Person Household | 2,002 (84.4%) | 369 (15.6%) |
| Total Housing Units | 5,812 (64.2%) | 3,241 (35.8%) |
Occupancy by Educational Attainment in Decatur
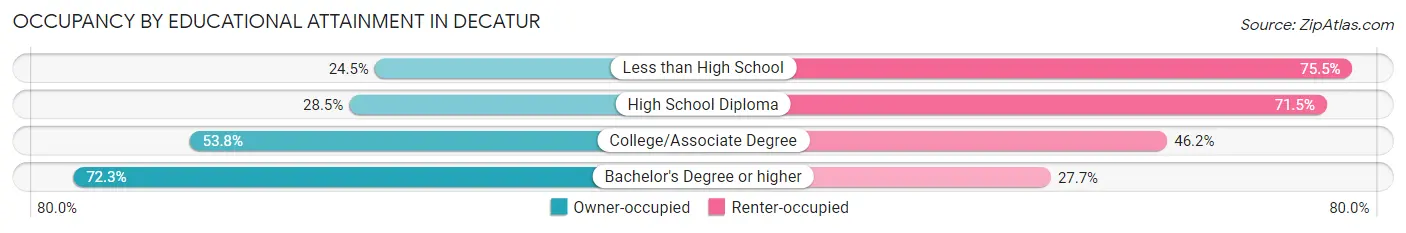
| Household Size | Owner-occupied | Renter-occupied |
| Less than High School | 103 (24.5%) | 318 (75.5%) |
| High School Diploma | 212 (28.5%) | 531 (71.5%) |
| College/Associate Degree | 599 (53.8%) | 514 (46.2%) |
| Bachelor's Degree or higher | 4,898 (72.3%) | 1,878 (27.7%) |
Occupancy by Age of Householder in Decatur
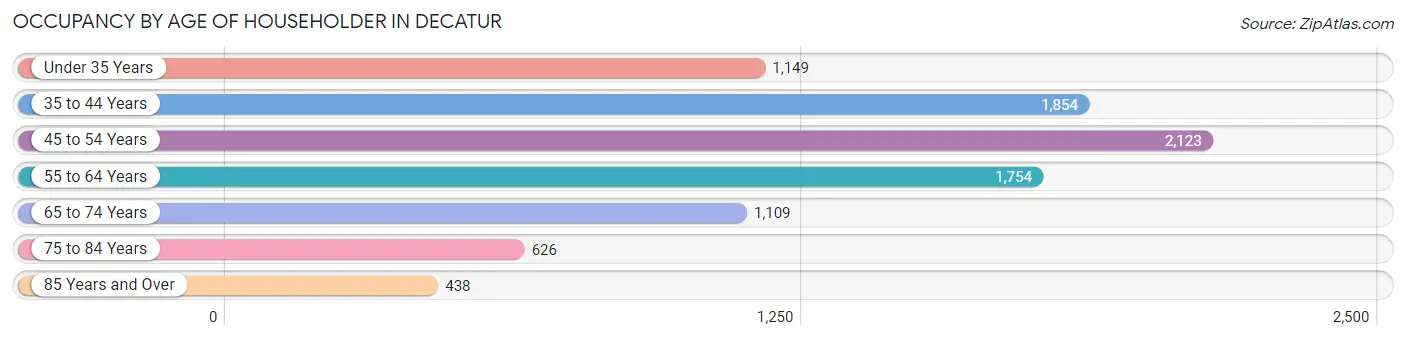
| Age Bracket | # Households | % Households |
| Under 35 Years | 1,149 | 12.7% |
| 35 to 44 Years | 1,854 | 20.5% |
| 45 to 54 Years | 2,123 | 23.4% |
| 55 to 64 Years | 1,754 | 19.4% |
| 65 to 74 Years | 1,109 | 12.2% |
| 75 to 84 Years | 626 | 6.9% |
| 85 Years and Over | 438 | 4.8% |
| Total | 9,053 | 100.0% |
Housing Finances in Decatur
Median Income by Occupancy in Decatur
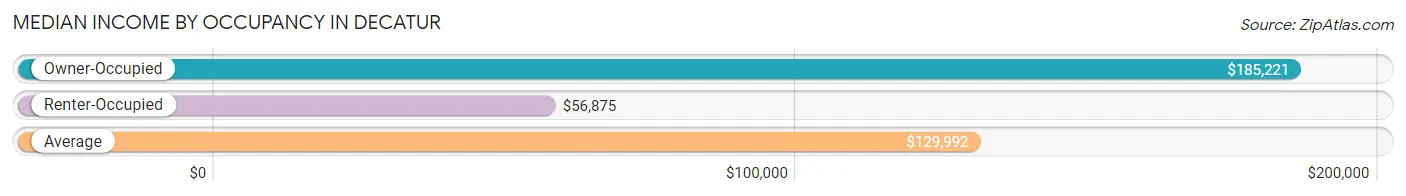
| Occupancy Type | # Households | Median Income |
| Owner-Occupied | 5,812 (64.2%) | $185,221 |
| Renter-Occupied | 3,241 (35.8%) | $56,875 |
| Average | 9,053 (100.0%) | $129,992 |
Occupancy by Householder Income Bracket in Decatur
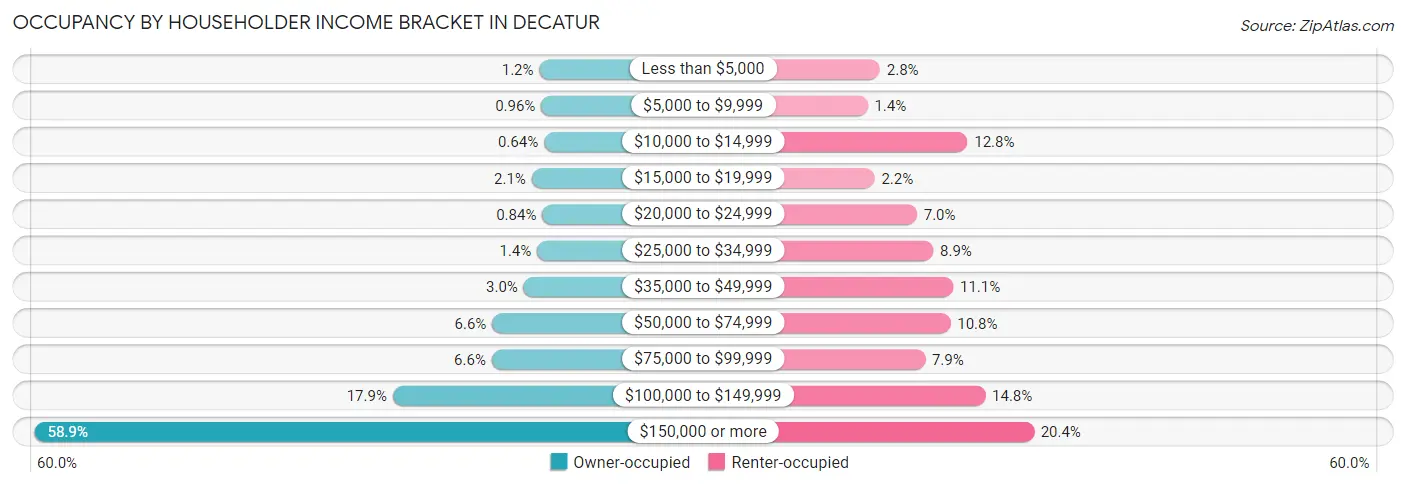
| Income Bracket | Owner-occupied | Renter-occupied |
| Less than $5,000 | 68 (1.2%) | 90 (2.8%) |
| $5,000 to $9,999 | 56 (1.0%) | 44 (1.4%) |
| $10,000 to $14,999 | 37 (0.6%) | 414 (12.8%) |
| $15,000 to $19,999 | 119 (2.1%) | 70 (2.2%) |
| $20,000 to $24,999 | 49 (0.8%) | 227 (7.0%) |
| $25,000 to $34,999 | 83 (1.4%) | 287 (8.9%) |
| $35,000 to $49,999 | 172 (3.0%) | 361 (11.1%) |
| $50,000 to $74,999 | 381 (6.6%) | 351 (10.8%) |
| $75,000 to $99,999 | 384 (6.6%) | 257 (7.9%) |
| $100,000 to $149,999 | 1,042 (17.9%) | 480 (14.8%) |
| $150,000 or more | 3,421 (58.9%) | 660 (20.4%) |
| Total | 5,812 (100.0%) | 3,241 (100.0%) |
Monthly Housing Cost Tiers in Decatur
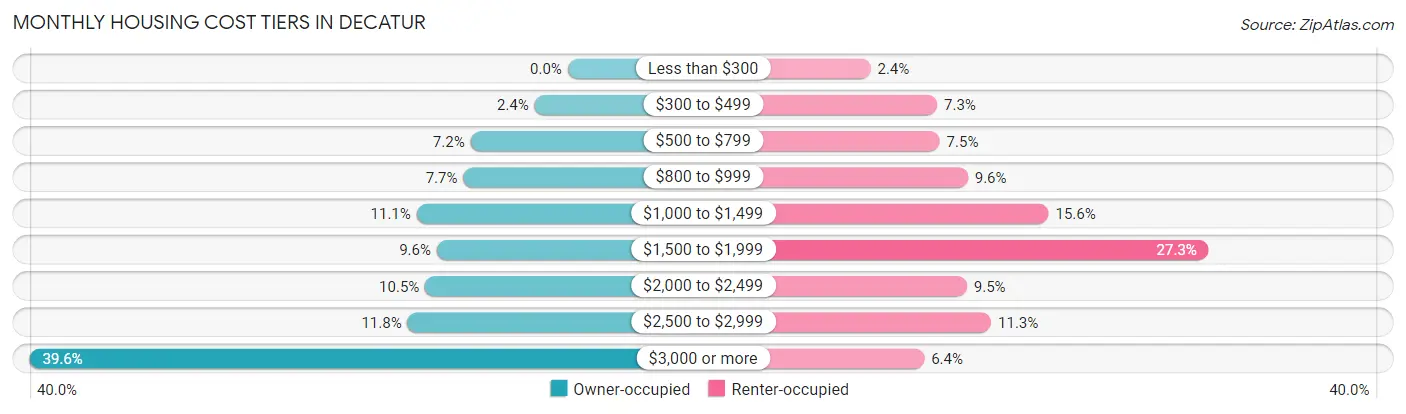
| Monthly Cost | Owner-occupied | Renter-occupied |
| Less than $300 | 0 (0.0%) | 79 (2.4%) |
| $300 to $499 | 142 (2.4%) | 238 (7.3%) |
| $500 to $799 | 416 (7.2%) | 244 (7.5%) |
| $800 to $999 | 447 (7.7%) | 311 (9.6%) |
| $1,000 to $1,499 | 647 (11.1%) | 504 (15.5%) |
| $1,500 to $1,999 | 560 (9.6%) | 886 (27.3%) |
| $2,000 to $2,499 | 610 (10.5%) | 309 (9.5%) |
| $2,500 to $2,999 | 686 (11.8%) | 367 (11.3%) |
| $3,000 or more | 2,304 (39.6%) | 207 (6.4%) |
| Total | 5,812 (100.0%) | 3,241 (100.0%) |
Physical Housing Characteristics in Decatur
Housing Structures in Decatur
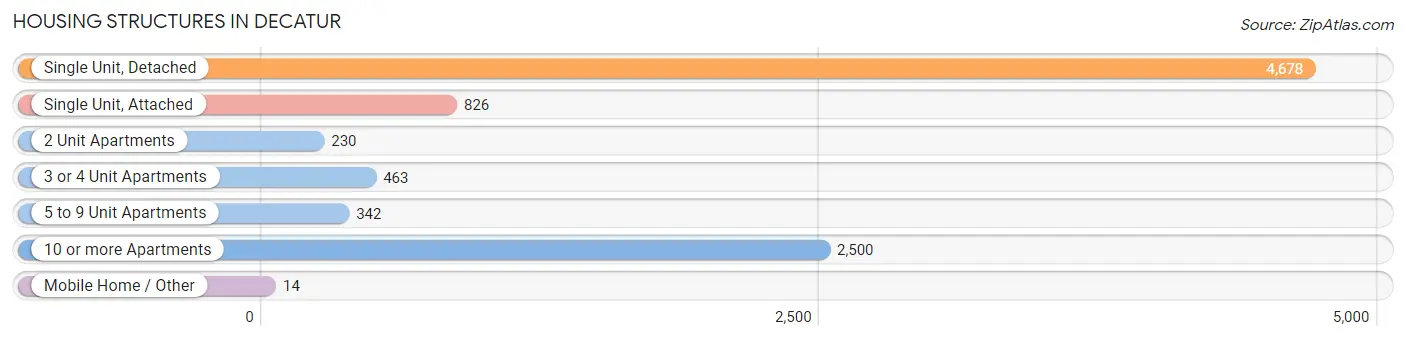
| Structure Type | # Housing Units | % Housing Units |
| Single Unit, Detached | 4,678 | 51.7% |
| Single Unit, Attached | 826 | 9.1% |
| 2 Unit Apartments | 230 | 2.5% |
| 3 or 4 Unit Apartments | 463 | 5.1% |
| 5 to 9 Unit Apartments | 342 | 3.8% |
| 10 or more Apartments | 2,500 | 27.6% |
| Mobile Home / Other | 14 | 0.2% |
| Total | 9,053 | 100.0% |
Housing Structures by Occupancy in Decatur
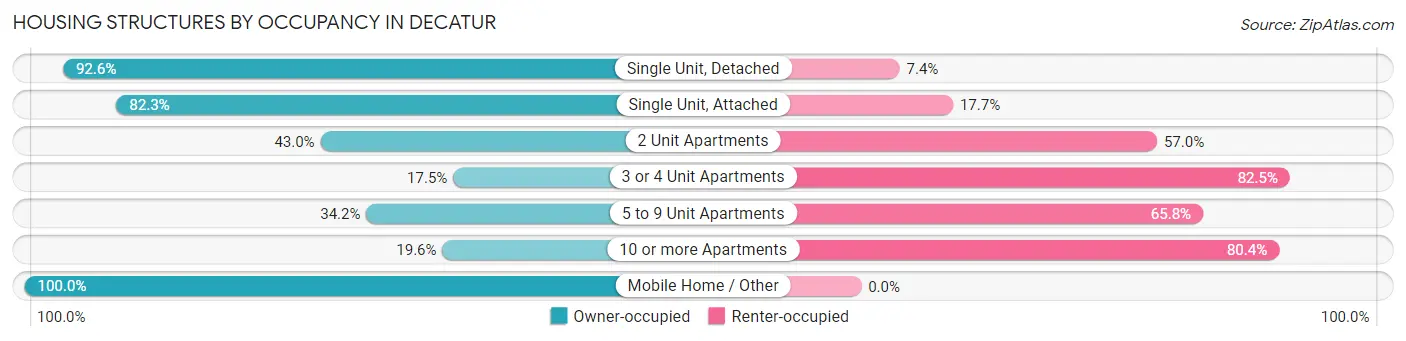
| Structure Type | Owner-occupied | Renter-occupied |
| Single Unit, Detached | 4,332 (92.6%) | 346 (7.4%) |
| Single Unit, Attached | 680 (82.3%) | 146 (17.7%) |
| 2 Unit Apartments | 99 (43.0%) | 131 (57.0%) |
| 3 or 4 Unit Apartments | 81 (17.5%) | 382 (82.5%) |
| 5 to 9 Unit Apartments | 117 (34.2%) | 225 (65.8%) |
| 10 or more Apartments | 489 (19.6%) | 2,011 (80.4%) |
| Mobile Home / Other | 14 (100.0%) | 0 (0.0%) |
| Total | 5,812 (64.2%) | 3,241 (35.8%) |
Housing Structures by Number of Rooms in Decatur
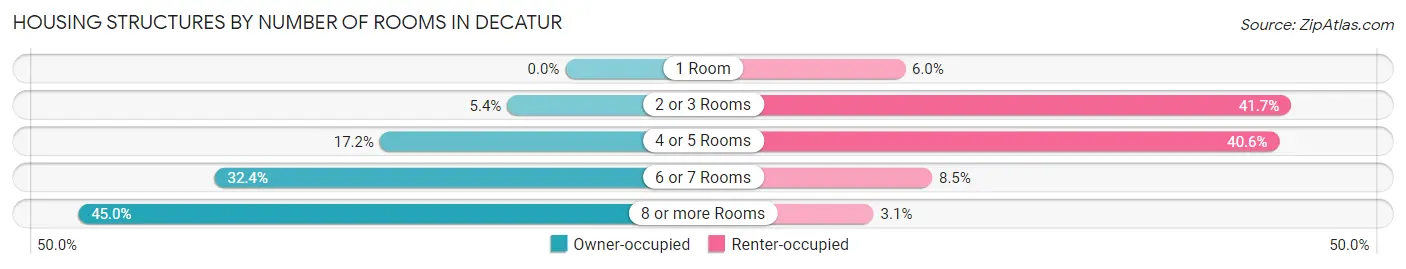
| Number of Rooms | Owner-occupied | Renter-occupied |
| 1 Room | 0 (0.0%) | 195 (6.0%) |
| 2 or 3 Rooms | 312 (5.4%) | 1,352 (41.7%) |
| 4 or 5 Rooms | 997 (17.2%) | 1,317 (40.6%) |
| 6 or 7 Rooms | 1,885 (32.4%) | 276 (8.5%) |
| 8 or more Rooms | 2,618 (45.0%) | 101 (3.1%) |
| Total | 5,812 (100.0%) | 3,241 (100.0%) |
Housing Structure by Heating Type in Decatur
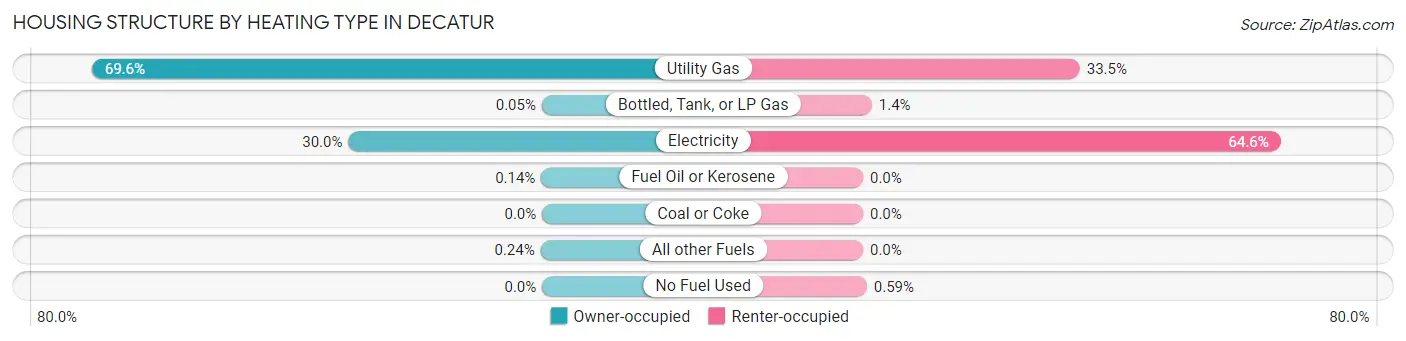
| Heating Type | Owner-occupied | Renter-occupied |
| Utility Gas | 4,046 (69.6%) | 1,086 (33.5%) |
| Bottled, Tank, or LP Gas | 3 (0.1%) | 44 (1.4%) |
| Electricity | 1,741 (30.0%) | 2,092 (64.5%) |
| Fuel Oil or Kerosene | 8 (0.1%) | 0 (0.0%) |
| Coal or Coke | 0 (0.0%) | 0 (0.0%) |
| All other Fuels | 14 (0.2%) | 0 (0.0%) |
| No Fuel Used | 0 (0.0%) | 19 (0.6%) |
| Total | 5,812 (100.0%) | 3,241 (100.0%) |
Household Vehicle Usage in Decatur
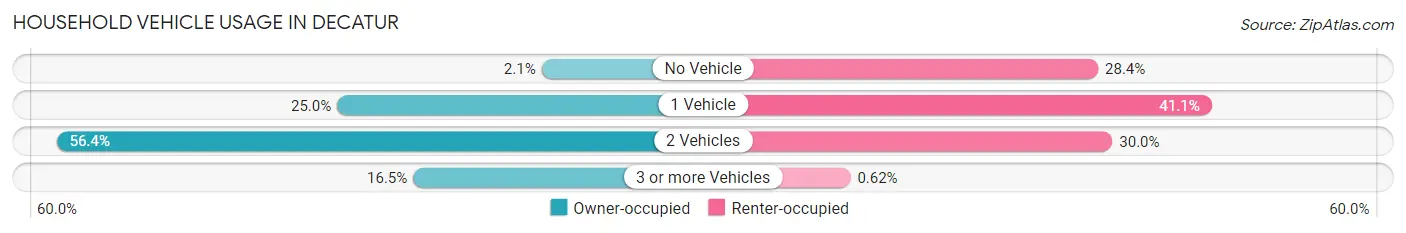
| Vehicles per Household | Owner-occupied | Renter-occupied |
| No Vehicle | 122 (2.1%) | 919 (28.4%) |
| 1 Vehicle | 1,453 (25.0%) | 1,331 (41.1%) |
| 2 Vehicles | 3,279 (56.4%) | 971 (30.0%) |
| 3 or more Vehicles | 958 (16.5%) | 20 (0.6%) |
| Total | 5,812 (100.0%) | 3,241 (100.0%) |
Real Estate & Mortgages in Decatur
Real Estate and Mortgage Overview in Decatur
| Characteristic | Without Mortgage | With Mortgage |
| Housing Units | 1,643 | 4,169 |
| Median Property Value | $621,800 | $669,700 |
| Median Household Income | $113,539 | $2,717 |
| Monthly Housing Costs | $947 | $2,304 |
| Real Estate Taxes | $6,175 | $19 |
Property Value by Mortgage Status in Decatur
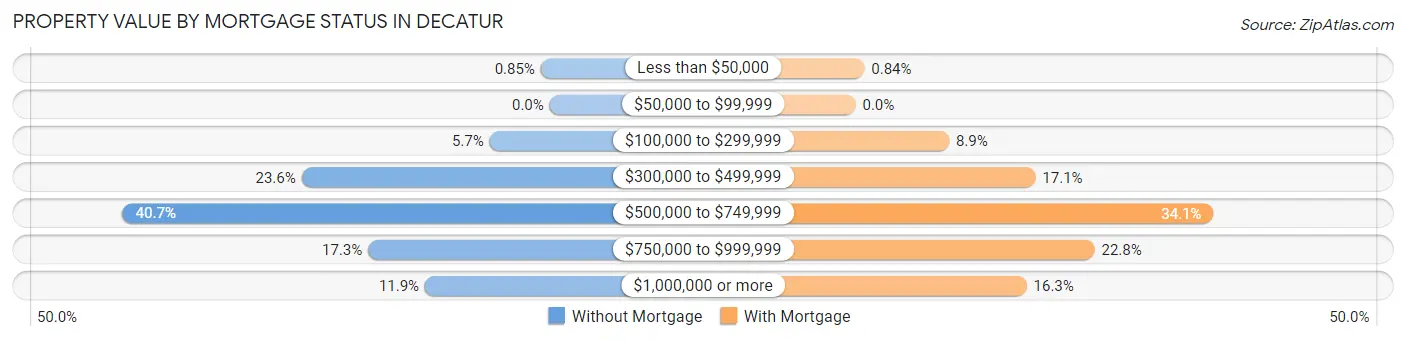
| Property Value | Without Mortgage | With Mortgage |
| Less than $50,000 | 14 (0.9%) | 35 (0.8%) |
| $50,000 to $99,999 | 0 (0.0%) | 0 (0.0%) |
| $100,000 to $299,999 | 94 (5.7%) | 371 (8.9%) |
| $300,000 to $499,999 | 388 (23.6%) | 714 (17.1%) |
| $500,000 to $749,999 | 668 (40.7%) | 1,421 (34.1%) |
| $750,000 to $999,999 | 284 (17.3%) | 949 (22.8%) |
| $1,000,000 or more | 195 (11.9%) | 679 (16.3%) |
| Total | 1,643 (100.0%) | 4,169 (100.0%) |
Household Income by Mortgage Status in Decatur
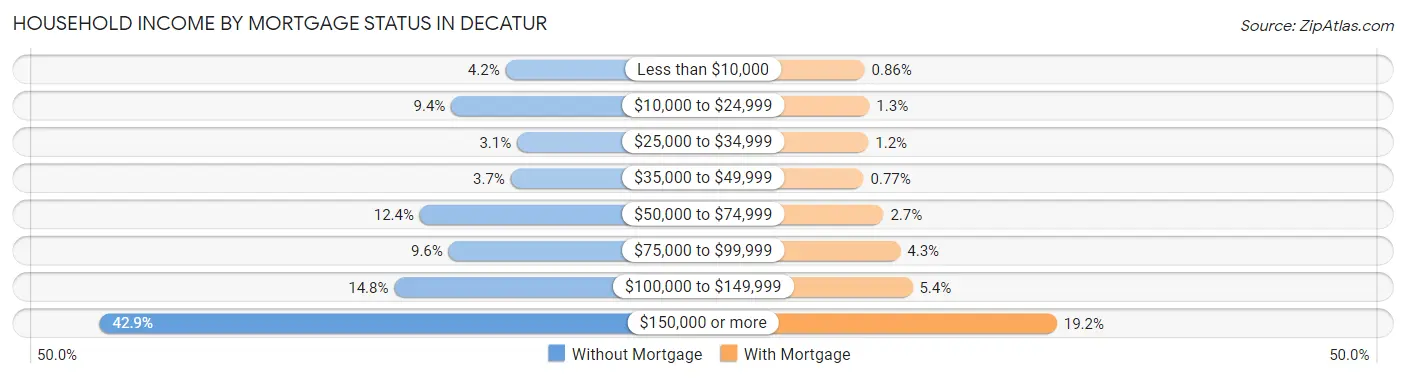
| Household Income | Without Mortgage | With Mortgage |
| Less than $10,000 | 69 (4.2%) | 36 (0.9%) |
| $10,000 to $24,999 | 154 (9.4%) | 55 (1.3%) |
| $25,000 to $34,999 | 51 (3.1%) | 51 (1.2%) |
| $35,000 to $49,999 | 61 (3.7%) | 32 (0.8%) |
| $50,000 to $74,999 | 203 (12.4%) | 111 (2.7%) |
| $75,000 to $99,999 | 158 (9.6%) | 178 (4.3%) |
| $100,000 to $149,999 | 243 (14.8%) | 226 (5.4%) |
| $150,000 or more | 704 (42.8%) | 799 (19.2%) |
| Total | 1,643 (100.0%) | 4,169 (100.0%) |
Property Value to Household Income Ratio in Decatur
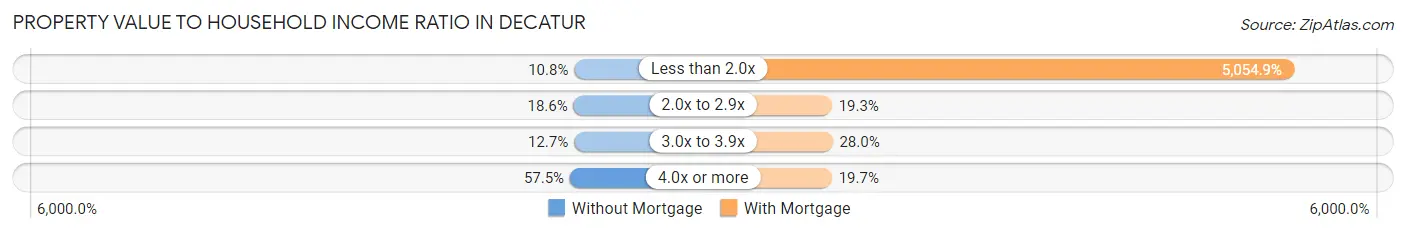
| Value-to-Income Ratio | Without Mortgage | With Mortgage |
| Less than 2.0x | 177 (10.8%) | 210,737 (5,054.9%) |
| 2.0x to 2.9x | 306 (18.6%) | 804 (19.3%) |
| 3.0x to 3.9x | 209 (12.7%) | 1,169 (28.0%) |
| 4.0x or more | 945 (57.5%) | 823 (19.7%) |
| Total | 1,643 (100.0%) | 4,169 (100.0%) |
Real Estate Taxes by Mortgage Status in Decatur
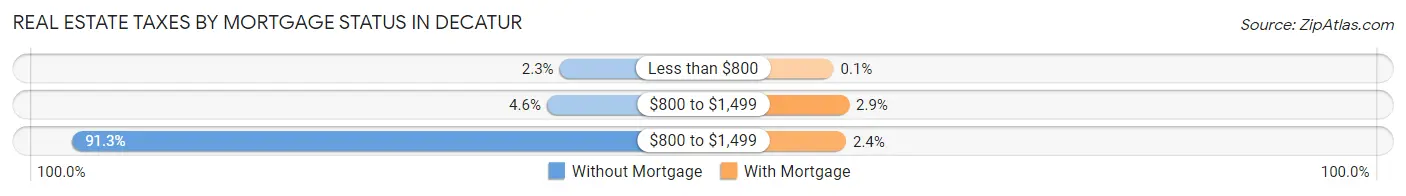
| Property Taxes | Without Mortgage | With Mortgage |
| Less than $800 | 38 (2.3%) | 4 (0.1%) |
| $800 to $1,499 | 76 (4.6%) | 122 (2.9%) |
| $800 to $1,499 | 1,500 (91.3%) | 99 (2.4%) |
| Total | 1,643 (100.0%) | 4,169 (100.0%) |
Health & Disability in Decatur
Health Insurance Coverage by Age in Decatur
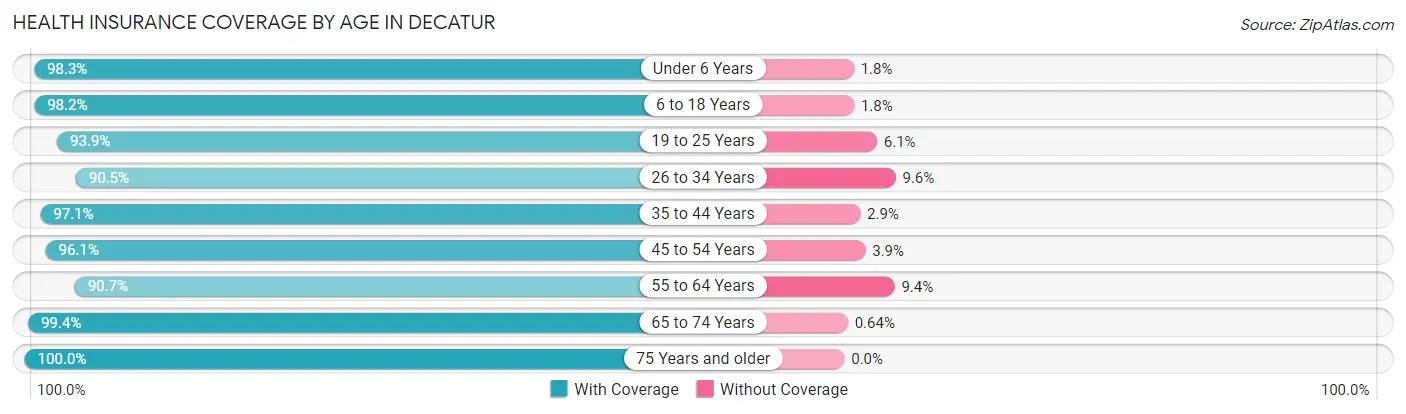
| Age Bracket | With Coverage | Without Coverage |
| Under 6 Years | 2,082 (98.3%) | 37 (1.8%) |
| 6 to 18 Years | 5,618 (98.2%) | 103 (1.8%) |
| 19 to 25 Years | 1,192 (93.9%) | 77 (6.1%) |
| 26 to 34 Years | 1,648 (90.4%) | 174 (9.6%) |
| 35 to 44 Years | 3,363 (97.1%) | 102 (2.9%) |
| 45 to 54 Years | 3,911 (96.1%) | 159 (3.9%) |
| 55 to 64 Years | 2,404 (90.6%) | 248 (9.3%) |
| 65 to 74 Years | 1,858 (99.4%) | 12 (0.6%) |
| 75 Years and older | 1,330 (100.0%) | 0 (0.0%) |
| Total | 23,406 (96.3%) | 912 (3.7%) |
Health Insurance Coverage by Citizenship Status in Decatur
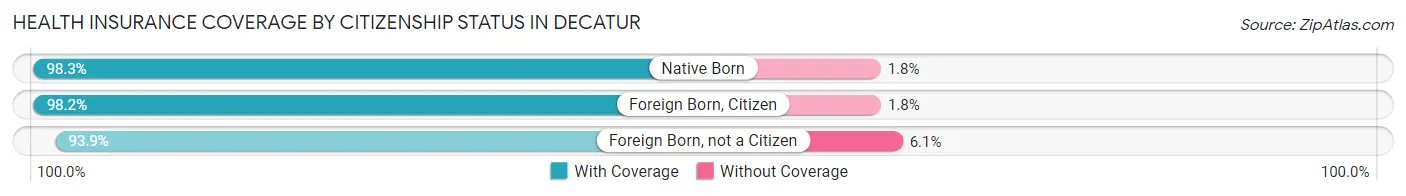
| Citizenship Status | With Coverage | Without Coverage |
| Native Born | 2,082 (98.3%) | 37 (1.8%) |
| Foreign Born, Citizen | 5,618 (98.2%) | 103 (1.8%) |
| Foreign Born, not a Citizen | 1,192 (93.9%) | 77 (6.1%) |
Health Insurance Coverage by Household Income in Decatur
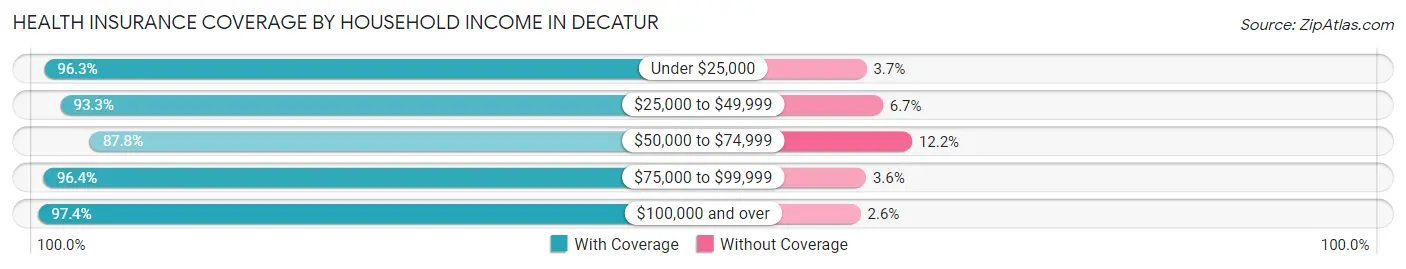
| Household Income | With Coverage | Without Coverage |
| Under $25,000 | 1,747 (96.3%) | 67 (3.7%) |
| $25,000 to $49,999 | 1,522 (93.3%) | 110 (6.7%) |
| $50,000 to $74,999 | 1,459 (87.8%) | 203 (12.2%) |
| $75,000 to $99,999 | 1,150 (96.4%) | 43 (3.6%) |
| $100,000 and over | 16,880 (97.4%) | 449 (2.6%) |
Public vs Private Health Insurance Coverage by Age in Decatur
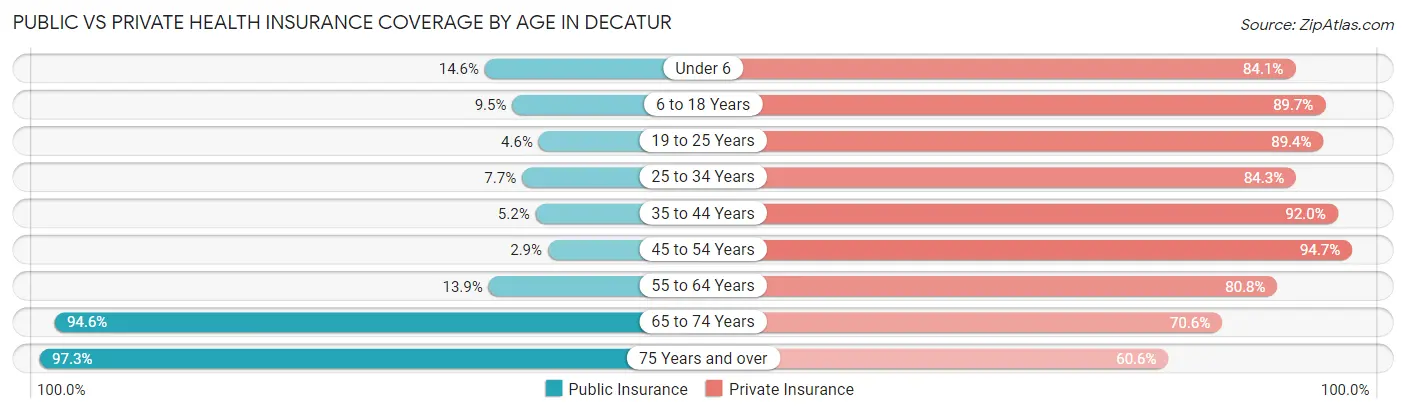
| Age Bracket | Public Insurance | Private Insurance |
| Under 6 | 309 (14.6%) | 1,783 (84.1%) |
| 6 to 18 Years | 542 (9.5%) | 5,133 (89.7%) |
| 19 to 25 Years | 58 (4.6%) | 1,134 (89.4%) |
| 25 to 34 Years | 140 (7.7%) | 1,536 (84.3%) |
| 35 to 44 Years | 179 (5.2%) | 3,188 (92.0%) |
| 45 to 54 Years | 117 (2.9%) | 3,855 (94.7%) |
| 55 to 64 Years | 368 (13.9%) | 2,144 (80.8%) |
| 65 to 74 Years | 1,768 (94.6%) | 1,320 (70.6%) |
| 75 Years and over | 1,294 (97.3%) | 806 (60.6%) |
| Total | 4,775 (19.6%) | 20,899 (85.9%) |
Disability Status by Sex by Age in Decatur
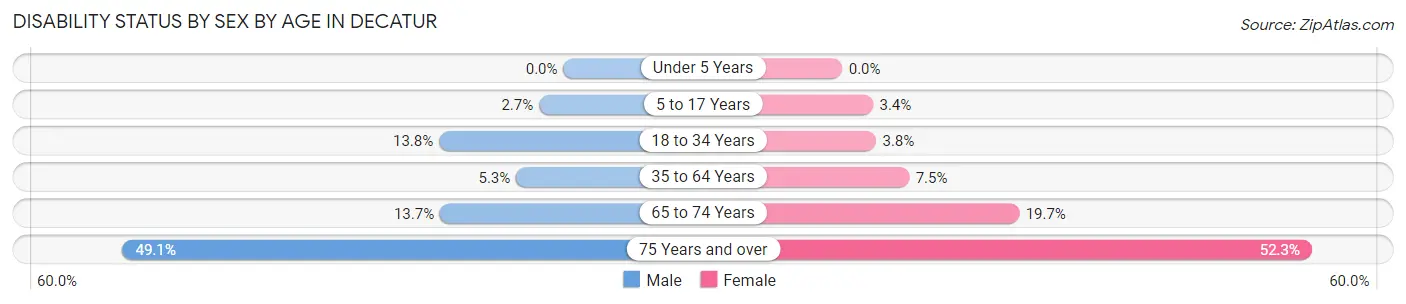
| Age Bracket | Male | Female |
| Under 5 Years | 0 (0.0%) | 0 (0.0%) |
| 5 to 17 Years | 85 (2.7%) | 93 (3.4%) |
| 18 to 34 Years | 204 (13.8%) | 76 (3.8%) |
| 35 to 64 Years | 256 (5.3%) | 396 (7.4%) |
| 65 to 74 Years | 100 (13.7%) | 225 (19.7%) |
| 75 Years and over | 244 (49.1%) | 436 (52.3%) |
Disability Class by Sex by Age in Decatur
Disability Class: Hearing Difficulty
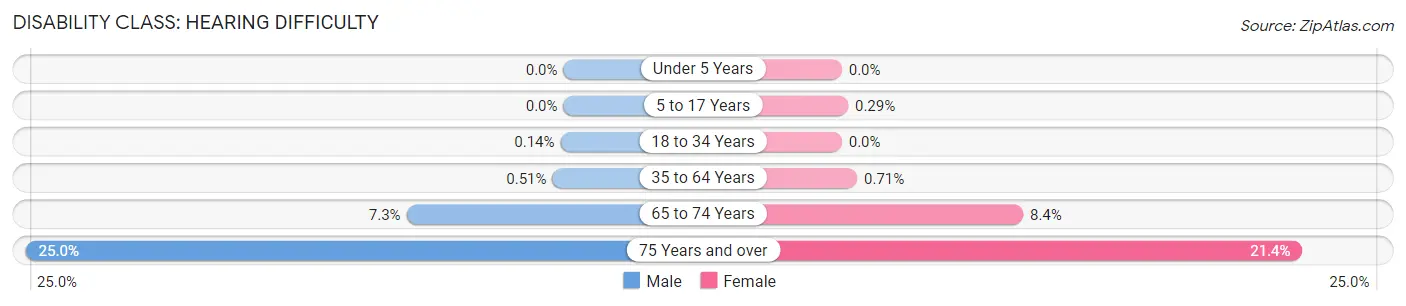
| Age Bracket | Male | Female |
| Under 5 Years | 0 (0.0%) | 0 (0.0%) |
| 5 to 17 Years | 0 (0.0%) | 8 (0.3%) |
| 18 to 34 Years | 2 (0.1%) | 0 (0.0%) |
| 35 to 64 Years | 25 (0.5%) | 38 (0.7%) |
| 65 to 74 Years | 53 (7.3%) | 96 (8.4%) |
| 75 Years and over | 124 (24.9%) | 178 (21.4%) |
Disability Class: Vision Difficulty
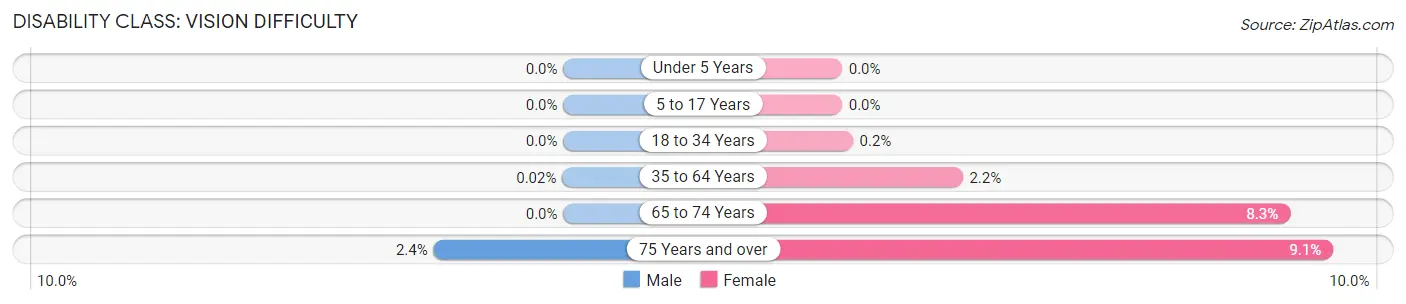
| Age Bracket | Male | Female |
| Under 5 Years | 0 (0.0%) | 0 (0.0%) |
| 5 to 17 Years | 0 (0.0%) | 0 (0.0%) |
| 18 to 34 Years | 0 (0.0%) | 4 (0.2%) |
| 35 to 64 Years | 1 (0.0%) | 119 (2.2%) |
| 65 to 74 Years | 0 (0.0%) | 95 (8.3%) |
| 75 Years and over | 12 (2.4%) | 76 (9.1%) |
Disability Class: Cognitive Difficulty
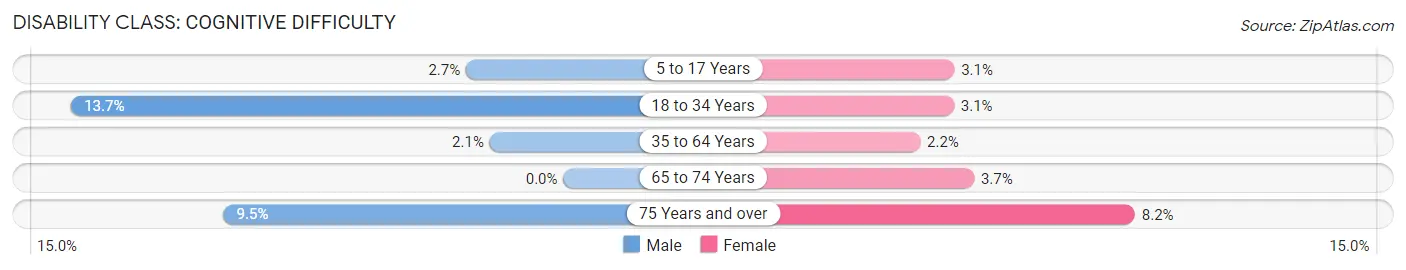
| Age Bracket | Male | Female |
| 5 to 17 Years | 85 (2.7%) | 85 (3.1%) |
| 18 to 34 Years | 202 (13.7%) | 63 (3.1%) |
| 35 to 64 Years | 100 (2.1%) | 116 (2.2%) |
| 65 to 74 Years | 0 (0.0%) | 42 (3.7%) |
| 75 Years and over | 47 (9.5%) | 68 (8.2%) |
Disability Class: Ambulatory Difficulty
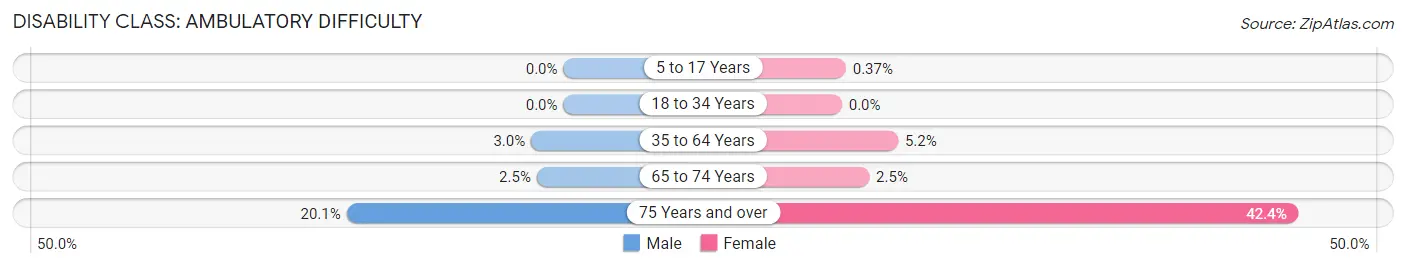
| Age Bracket | Male | Female |
| 5 to 17 Years | 0 (0.0%) | 10 (0.4%) |
| 18 to 34 Years | 0 (0.0%) | 0 (0.0%) |
| 35 to 64 Years | 146 (3.0%) | 277 (5.2%) |
| 65 to 74 Years | 18 (2.5%) | 29 (2.5%) |
| 75 Years and over | 100 (20.1%) | 353 (42.4%) |
Disability Class: Self-Care Difficulty
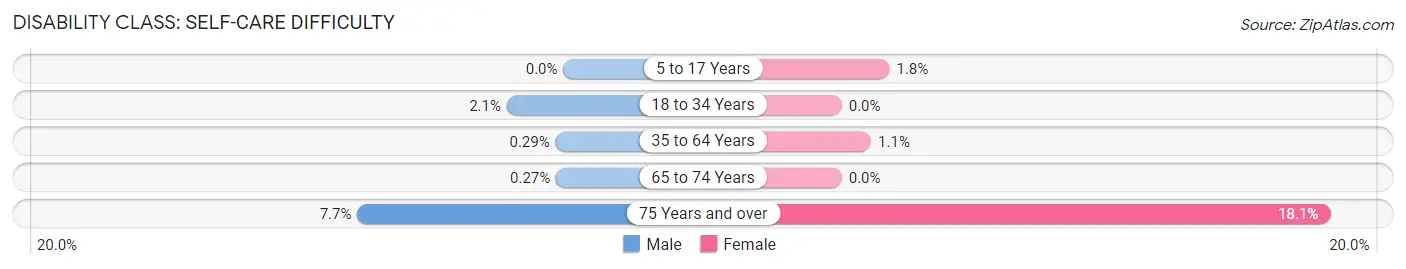
| Age Bracket | Male | Female |
| 5 to 17 Years | 0 (0.0%) | 48 (1.8%) |
| 18 to 34 Years | 31 (2.1%) | 0 (0.0%) |
| 35 to 64 Years | 14 (0.3%) | 58 (1.1%) |
| 65 to 74 Years | 2 (0.3%) | 0 (0.0%) |
| 75 Years and over | 38 (7.6%) | 151 (18.1%) |
Technology Access in Decatur
Computing Device Access in Decatur
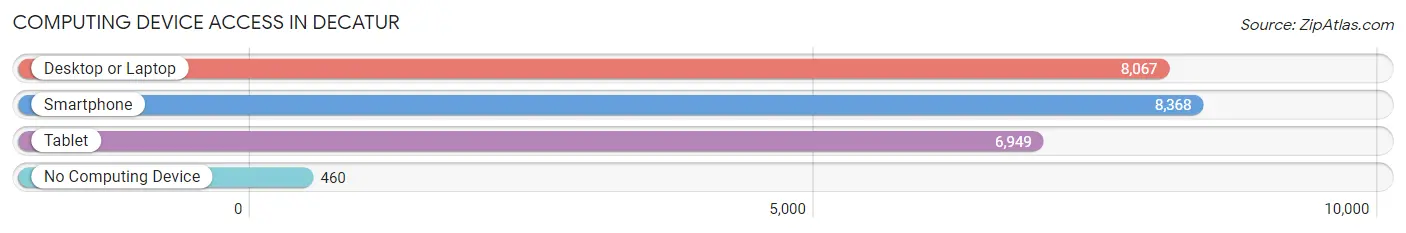
| Device Type | # Households | % Households |
| Desktop or Laptop | 8,067 | 89.1% |
| Smartphone | 8,368 | 92.4% |
| Tablet | 6,949 | 76.8% |
| No Computing Device | 460 | 5.1% |
| Total | 9,053 | 100.0% |
Internet Access in Decatur
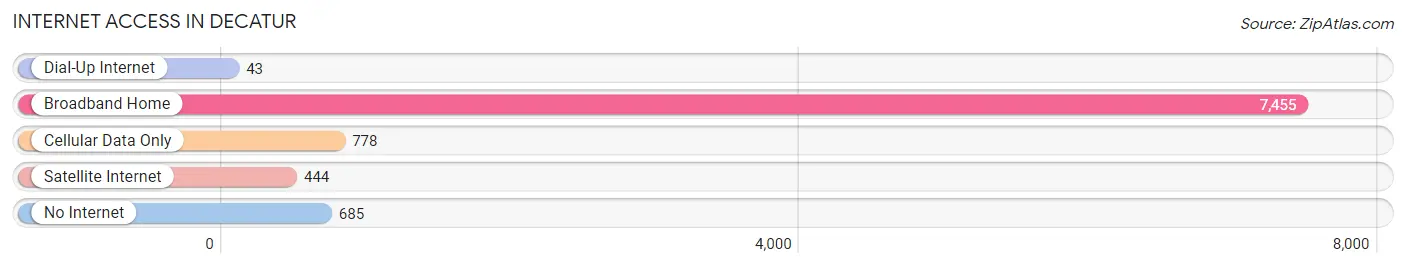
| Internet Type | # Households | % Households |
| Dial-Up Internet | 43 | 0.5% |
| Broadband Home | 7,455 | 82.4% |
| Cellular Data Only | 778 | 8.6% |
| Satellite Internet | 444 | 4.9% |
| No Internet | 685 | 7.6% |
| Total | 9,053 | 100.0% |
Decatur Summary
Decatur, Georgia is a city located in DeKalb County, Georgia, United States. It is part of the Atlanta metropolitan area and is located approximately 5 miles northeast of downtown Atlanta. The city was founded in 1823 and is named after Stephen Decatur, a naval hero of the War of 1812. Decatur is a vibrant and diverse city with a population of approximately 20,000 people.
Geography
Decatur is located in the northern part of DeKalb County, Georgia, approximately 5 miles northeast of downtown Atlanta. The city is situated on the banks of the South River and is bordered by the cities of Avondale Estates, Clarkston, and Stone Mountain. Decatur has a total area of 4.2 square miles, all of which is land. The city is located at an elevation of 1,037 feet above sea level.
Climate
Decatur has a humid subtropical climate, with hot, humid summers and mild winters. The average annual temperature is 61°F, with an average high of 79°F in July and an average low of 43°F in January. The average annual precipitation is 50.2 inches, with an average of 4.3 inches of snowfall per year.
Demographics
As of the 2010 census, Decatur had a population of 19,335 people. The racial makeup of the city was 57.2% White, 32.2% African American, 0.2% Native American, 4.2% Asian, 0.1% Pacific Islander, 4.3% from other races, and 1.9% from two or more races. Hispanic or Latino of any race were 8.7% of the population.
Economy
Decatur is home to a diverse economy, with a variety of businesses and industries. The city is home to several corporate headquarters, including the headquarters of the Georgia-Pacific Corporation, the Georgia Institute of Technology, and the Centers for Disease Control and Prevention. Decatur is also home to a number of small businesses, including restaurants, retail stores, and professional services.
The city is served by the MARTA public transportation system, which provides access to downtown Atlanta and other nearby cities. Decatur is also served by the DeKalb-Peachtree Airport, which provides regional air service.
History
Decatur was founded in 1823 by William Decatur, a veteran of the War of 1812. The city was named after his father, Stephen Decatur, a naval hero of the War of 1812. Decatur was incorporated as a city in 1823 and was the county seat of DeKalb County until 1854, when the county seat was moved to Atlanta.
Decatur grew rapidly in the late 19th and early 20th centuries, becoming a major industrial center. The city was home to several large factories, including the Georgia-Pacific Corporation, which was founded in Decatur in 1927.
Decatur experienced a period of decline in the mid-20th century, as many of the city’s factories closed or moved away. The city has since experienced a resurgence, with a growing population and a vibrant economy.
Common Questions
What is Per Capita Income in Decatur?
Per Capita income in Decatur is $68,394.
What is the Median Family Income in Decatur?
Median Family Income in Decatur is $201,477.
What is the Median Household income in Decatur?
Median Household Income in Decatur is $129,992.
What is Income or Wage Gap in Decatur?
Income or Wage Gap in Decatur is 36.9%.
Women in Decatur earn 63.1 cents for every dollar earned by a man.
What is Inequality or Gini Index in Decatur?
Inequality or Gini Index in Decatur is 0.49.
What is the Total Population of Decatur?
Total Population of Decatur is 24,421.
What is the Total Male Population of Decatur?
Total Male Population of Decatur is 11,884.
What is the Total Female Population of Decatur?
Total Female Population of Decatur is 12,537.
What is the Ratio of Males per 100 Females in Decatur?
There are 94.79 Males per 100 Females in Decatur.
What is the Ratio of Females per 100 Males in Decatur?
There are 105.49 Females per 100 Males in Decatur.
What is the Median Population Age in Decatur?
Median Population Age in Decatur is 38.7 Years.
What is the Average Family Size in Decatur
Average Family Size in Decatur is 3.4 People.
What is the Average Household Size in Decatur
Average Household Size in Decatur is 2.6 People.
How Large is the Labor Force in Decatur?
There are 11,418 People in the Labor Forcein in Decatur.
What is the Percentage of People in the Labor Force in Decatur?
64.8% of People are in the Labor Force in Decatur.
What is the Unemployment Rate in Decatur?
Unemployment Rate in Decatur is 3.8%.