Putney, GA Map & Demographics
Putney Map
Putney Overview
$29,662
PER CAPITA INCOME
$80,625
AVG FAMILY INCOME
$64,182
AVG HOUSEHOLD INCOME
18.0%
WAGE / INCOME GAP [ % ]
82.0¢/ $1
WAGE / INCOME GAP [ $ ]
0.45
INEQUALITY / GINI INDEX
3,295
TOTAL POPULATION
1,490
MALE POPULATION
1,805
FEMALE POPULATION
82.55
MALES / 100 FEMALES
121.14
FEMALES / 100 MALES
39.5
MEDIAN AGE
3.1
AVG FAMILY SIZE
2.8
AVG HOUSEHOLD SIZE
1,633
LABOR FORCE [ PEOPLE ]
61.6%
PERCENT IN LABOR FORCE
15.6%
UNEMPLOYMENT RATE
Putney Area Codes
Income in Putney
Income Overview in Putney
Per Capita Income in Putney is $29,662, while median incomes of families and households are $80,625 and $64,182 respectively.
| Characteristic | Number | Measure |
| Per Capita Income | 3,295 | $29,662 |
| Median Family Income | 830 | $80,625 |
| Mean Family Income | 830 | $96,375 |
| Median Household Income | 1,178 | $64,182 |
| Mean Household Income | 1,178 | $82,226 |
| Income Deficit | 830 | $0 |
| Wage / Income Gap (%) | 3,295 | 18.03% |
| Wage / Income Gap ($) | 3,295 | 81.97¢ per $1 |
| Gini / Inequality Index | 3,295 | 0.45 |
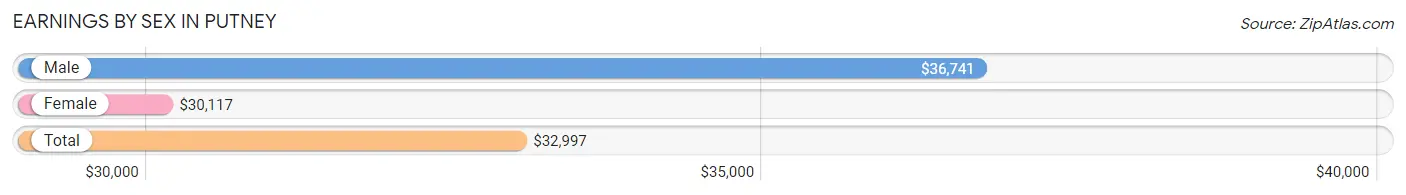
Earnings by Sex in Putney
Average Earnings in Putney are $32,997, $36,741 for men and $30,117 for women, a difference of 18.0%.
| Sex | Number | Average Earnings |
| Male | 849 (52.6%) | $36,741 |
| Female | 764 (47.4%) | $30,117 |
| Total | 1,613 (100.0%) | $32,997 |
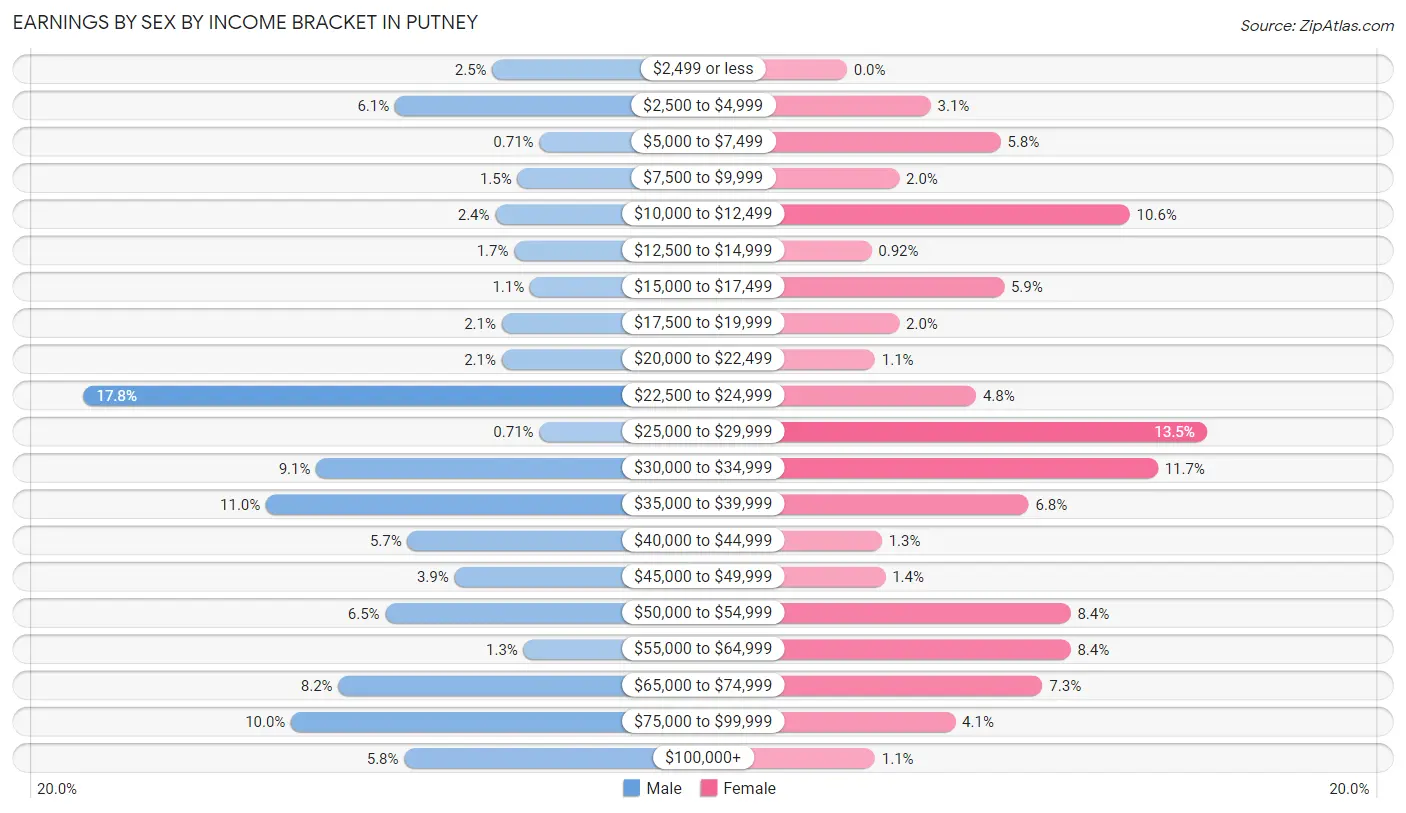
Earnings by Sex by Income Bracket in Putney
The most common earnings brackets in Putney are $22,500 to $24,999 for men (151 | 17.8%) and $25,000 to $29,999 for women (103 | 13.5%).
| Income | Male | Female |
| $2,499 or less | 21 (2.5%) | 0 (0.0%) |
| $2,500 to $4,999 | 52 (6.1%) | 24 (3.1%) |
| $5,000 to $7,499 | 6 (0.7%) | 44 (5.8%) |
| $7,500 to $9,999 | 13 (1.5%) | 15 (2.0%) |
| $10,000 to $12,499 | 20 (2.4%) | 81 (10.6%) |
| $12,500 to $14,999 | 14 (1.7%) | 7 (0.9%) |
| $15,000 to $17,499 | 9 (1.1%) | 45 (5.9%) |
| $17,500 to $19,999 | 18 (2.1%) | 15 (2.0%) |
| $20,000 to $22,499 | 18 (2.1%) | 8 (1.1%) |
| $22,500 to $24,999 | 151 (17.8%) | 37 (4.8%) |
| $25,000 to $29,999 | 6 (0.7%) | 103 (13.5%) |
| $30,000 to $34,999 | 77 (9.1%) | 89 (11.7%) |
| $35,000 to $39,999 | 93 (11.0%) | 52 (6.8%) |
| $40,000 to $44,999 | 48 (5.7%) | 10 (1.3%) |
| $45,000 to $49,999 | 33 (3.9%) | 11 (1.4%) |
| $50,000 to $54,999 | 55 (6.5%) | 64 (8.4%) |
| $55,000 to $64,999 | 11 (1.3%) | 64 (8.4%) |
| $65,000 to $74,999 | 70 (8.2%) | 56 (7.3%) |
| $75,000 to $99,999 | 85 (10.0%) | 31 (4.1%) |
| $100,000+ | 49 (5.8%) | 8 (1.1%) |
| Total | 849 (100.0%) | 764 (100.0%) |
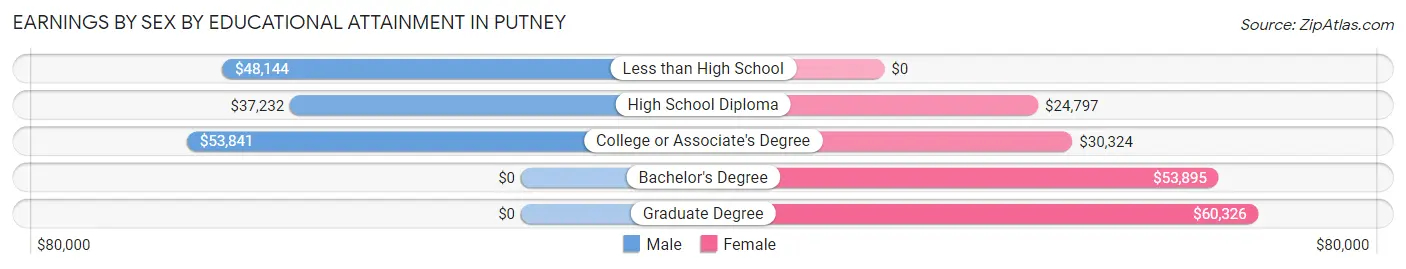
Earnings by Sex by Educational Attainment in Putney
Average earnings in Putney are $44,199 for men and $31,758 for women, a difference of 28.1%. Men with an educational attainment of college or associate's degree enjoy the highest average annual earnings of $53,841, while those with high school diploma education earn the least with $37,232. Women with an educational attainment of graduate degree earn the most with the average annual earnings of $60,326, while those with high school diploma education have the smallest earnings of $24,797.
| Educational Attainment | Male Income | Female Income |
| Less than High School | $48,144 | $0 |
| High School Diploma | $37,232 | $24,797 |
| College or Associate's Degree | $53,841 | $30,324 |
| Bachelor's Degree | - | - |
| Graduate Degree | - | - |
| Total | $44,199 | $31,758 |
Family Income in Putney
Family Income Brackets in Putney
According to the Putney family income data, there are 283 families falling into the $100,000 to $149,999 income range, which is the most common income bracket and makes up 34.1% of all families. Conversely, the $200,000+ income bracket is the least frequent group with only 8 families (1.0%) belonging to this category.
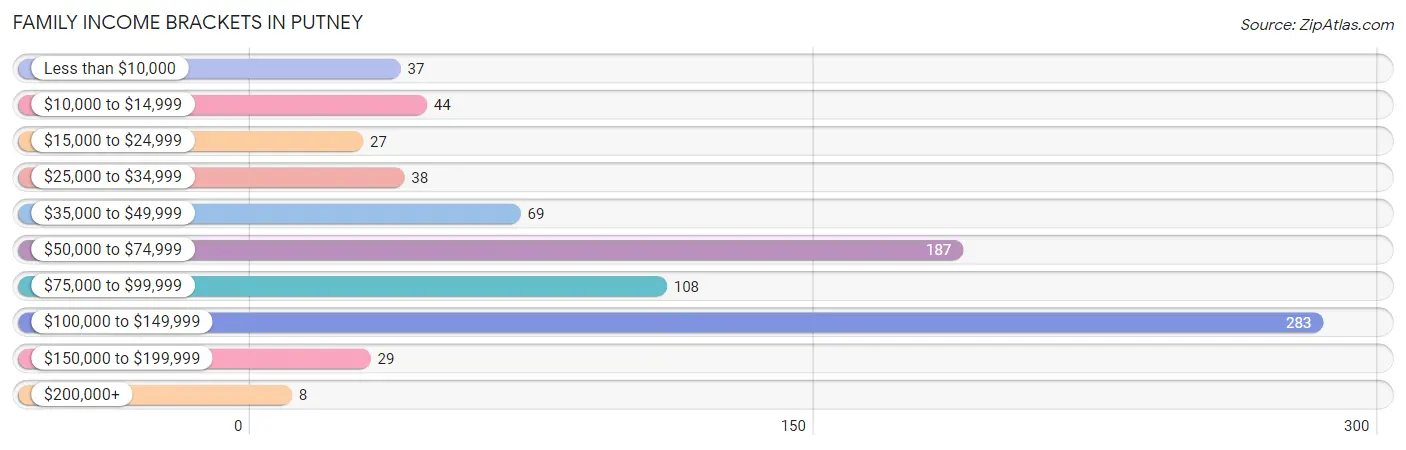
| Income Bracket | # Families | % Families |
| Less than $10,000 | 37 | 4.5% |
| $10,000 to $14,999 | 44 | 5.3% |
| $15,000 to $24,999 | 27 | 3.3% |
| $25,000 to $34,999 | 38 | 4.6% |
| $35,000 to $49,999 | 69 | 8.3% |
| $50,000 to $74,999 | 187 | 22.5% |
| $75,000 to $99,999 | 108 | 13.0% |
| $100,000 to $149,999 | 283 | 34.1% |
| $150,000 to $199,999 | 29 | 3.5% |
| $200,000+ | 8 | 1.0% |
Family Income by Famaliy Size in Putney
4-person families (154 | 18.5%) account for the highest median family income in Putney with $137,857 per family, while 4-person families (154 | 18.5%) have the highest median income of $34,464 per family member.
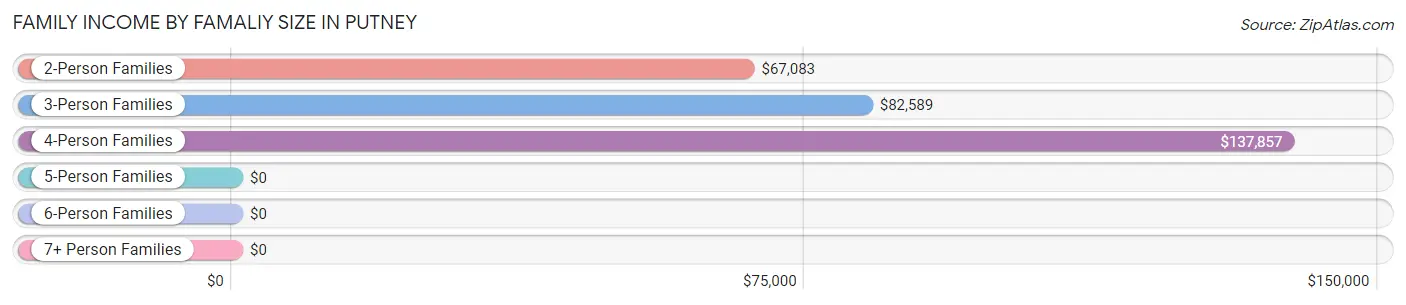
| Income Bracket | # Families | Median Income |
| 2-Person Families | 349 (42.0%) | $67,083 |
| 3-Person Families | 275 (33.1%) | $82,589 |
| 4-Person Families | 154 (18.5%) | $137,857 |
| 5-Person Families | 27 (3.3%) | $0 |
| 6-Person Families | 13 (1.6%) | $0 |
| 7+ Person Families | 12 (1.5%) | $0 |
| Total | 830 (100.0%) | $80,625 |
Family Income by Number of Earners in Putney
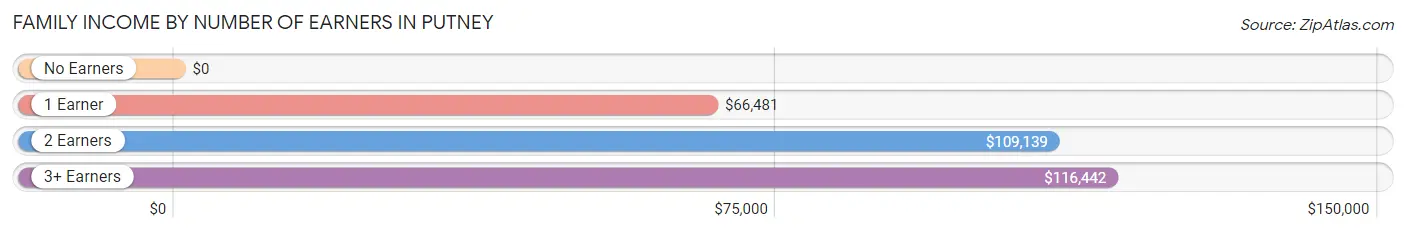
| Number of Earners | # Families | Median Income |
| No Earners | 114 (13.7%) | $0 |
| 1 Earner | 250 (30.1%) | $66,481 |
| 2 Earners | 409 (49.3%) | $109,139 |
| 3+ Earners | 57 (6.9%) | $116,442 |
| Total | 830 (100.0%) | $80,625 |
Household Income in Putney
Household Income Brackets in Putney
With 299 households falling in the category, the $100,000 to $149,999 income range is the most frequent in Putney, accounting for 25.4% of all households. In contrast, only 8 households (0.7%) fall into the $200,000+ income bracket, making it the least populous group.
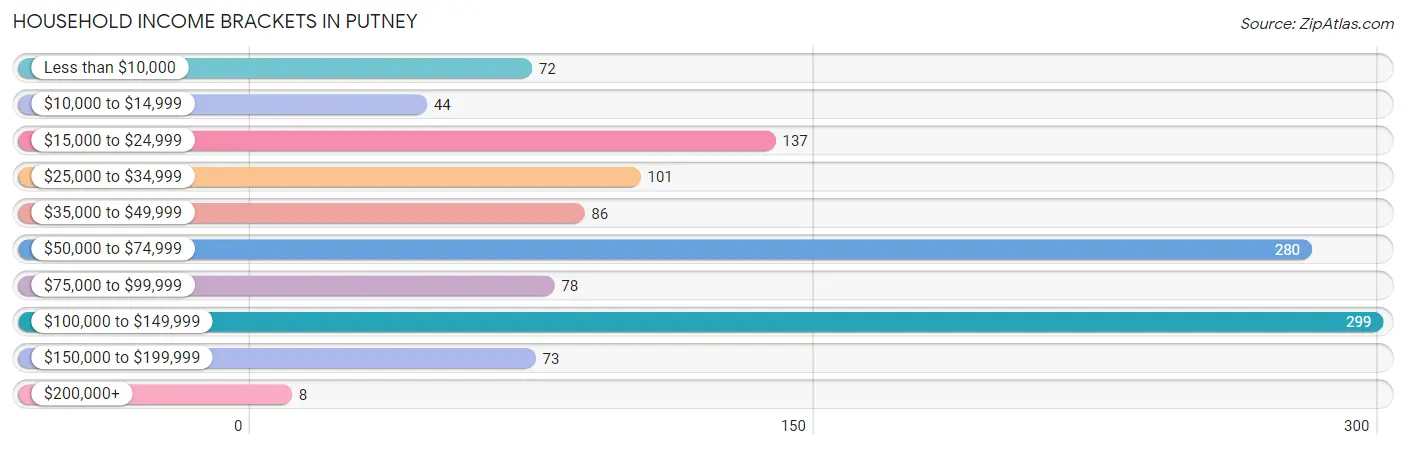
| Income Bracket | # Households | % Households |
| Less than $10,000 | 72 | 6.1% |
| $10,000 to $14,999 | 44 | 3.7% |
| $15,000 to $24,999 | 137 | 11.6% |
| $25,000 to $34,999 | 101 | 8.6% |
| $35,000 to $49,999 | 86 | 7.3% |
| $50,000 to $74,999 | 280 | 23.8% |
| $75,000 to $99,999 | 78 | 6.6% |
| $100,000 to $149,999 | 299 | 25.4% |
| $150,000 to $199,999 | 73 | 6.2% |
| $200,000+ | 8 | 0.7% |
Household Income by Householder Age in Putney
The median household income in Putney is $64,182, with the highest median household income of $70,625 found in the 45 to 64 years age bracket for the primary householder. A total of 467 households (39.6%) fall into this category. Meanwhile, the 15 to 24 years age bracket for the primary householder has the lowest median household income of $0, with 129 households (11.0%) in this group.
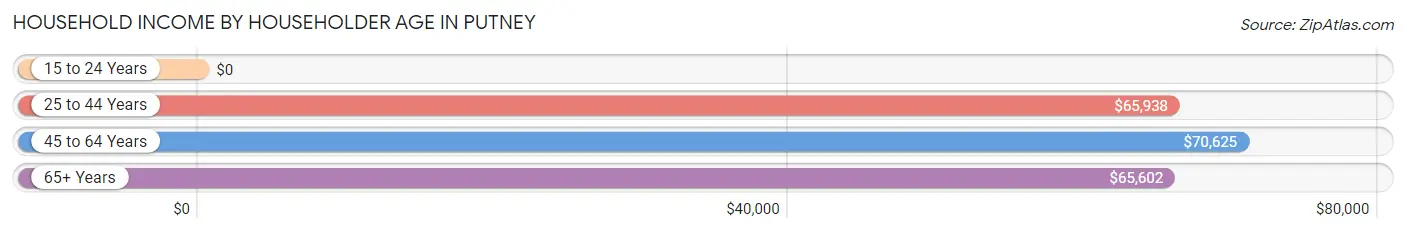
| Income Bracket | # Households | Median Income |
| 15 to 24 Years | 129 (11.0%) | $0 |
| 25 to 44 Years | 315 (26.7%) | $65,938 |
| 45 to 64 Years | 467 (39.6%) | $70,625 |
| 65+ Years | 267 (22.7%) | $65,602 |
| Total | 1,178 (100.0%) | $64,182 |
Poverty in Putney
Income Below Poverty by Sex and Age in Putney
With 17.2% poverty level for males and 21.3% for females among the residents of Putney, 15 year old males and 18 to 24 year old females are the most vulnerable to poverty, with 27 males (100.0%) and 94 females (52.8%) in their respective age groups living below the poverty level.
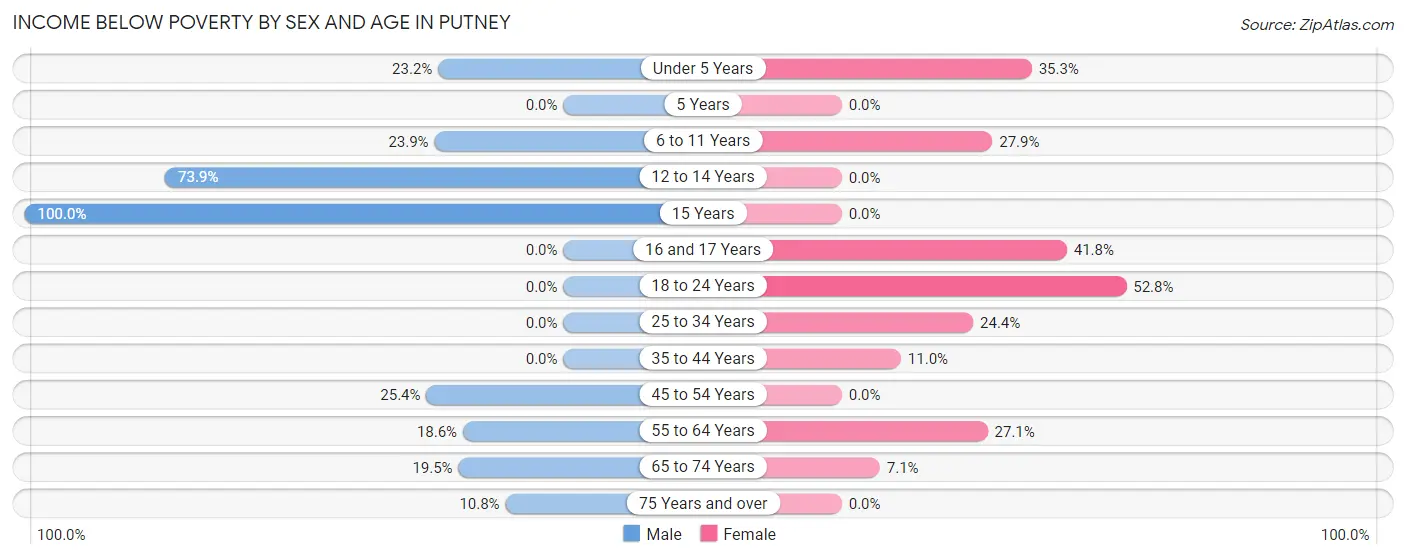
| Age Bracket | Male | Female |
| Under 5 Years | 33 (23.2%) | 43 (35.2%) |
| 5 Years | 0 (0.0%) | 0 (0.0%) |
| 6 to 11 Years | 28 (23.9%) | 38 (27.9%) |
| 12 to 14 Years | 34 (73.9%) | 0 (0.0%) |
| 15 Years | 27 (100.0%) | 0 (0.0%) |
| 16 and 17 Years | 0 (0.0%) | 33 (41.8%) |
| 18 to 24 Years | 0 (0.0%) | 94 (52.8%) |
| 25 to 34 Years | 0 (0.0%) | 58 (24.4%) |
| 35 to 44 Years | 0 (0.0%) | 35 (11.0%) |
| 45 to 54 Years | 59 (25.4%) | 0 (0.0%) |
| 55 to 64 Years | 44 (18.6%) | 72 (27.1%) |
| 65 to 74 Years | 22 (19.5%) | 12 (7.1%) |
| 75 Years and over | 10 (10.7%) | 0 (0.0%) |
| Total | 257 (17.2%) | 385 (21.3%) |
Income Above Poverty by Sex and Age in Putney
According to the poverty statistics in Putney, males aged 5 years and females aged 5 years are the age groups that are most secure financially, with 100.0% of males and 100.0% of females in these age groups living above the poverty line.
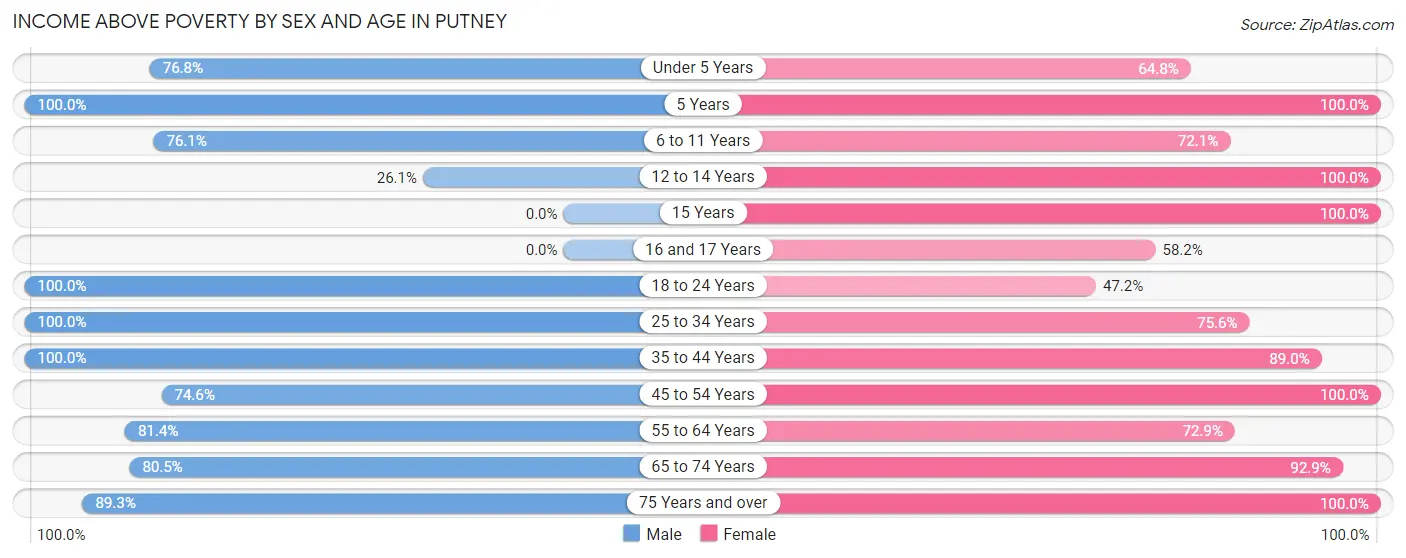
| Age Bracket | Male | Female |
| Under 5 Years | 109 (76.8%) | 79 (64.7%) |
| 5 Years | 9 (100.0%) | 38 (100.0%) |
| 6 to 11 Years | 89 (76.1%) | 98 (72.1%) |
| 12 to 14 Years | 12 (26.1%) | 4 (100.0%) |
| 15 Years | 0 (0.0%) | 3 (100.0%) |
| 16 and 17 Years | 0 (0.0%) | 46 (58.2%) |
| 18 to 24 Years | 218 (100.0%) | 84 (47.2%) |
| 25 to 34 Years | 140 (100.0%) | 180 (75.6%) |
| 35 to 44 Years | 117 (100.0%) | 284 (89.0%) |
| 45 to 54 Years | 173 (74.6%) | 200 (100.0%) |
| 55 to 64 Years | 192 (81.4%) | 194 (72.9%) |
| 65 to 74 Years | 91 (80.5%) | 158 (92.9%) |
| 75 Years and over | 83 (89.2%) | 52 (100.0%) |
| Total | 1,233 (82.8%) | 1,420 (78.7%) |
Income Below Poverty Among Married-Couple Families in Putney
The poverty statistics for married-couple families in Putney show that 2.4% or 12 of the total 504 families live below the poverty line. Families with no children have the highest poverty rate of 3.3%, comprising of 12 families. On the other hand, families with 1 or 2 children have the lowest poverty rate of 0.0%, which includes 0 families.
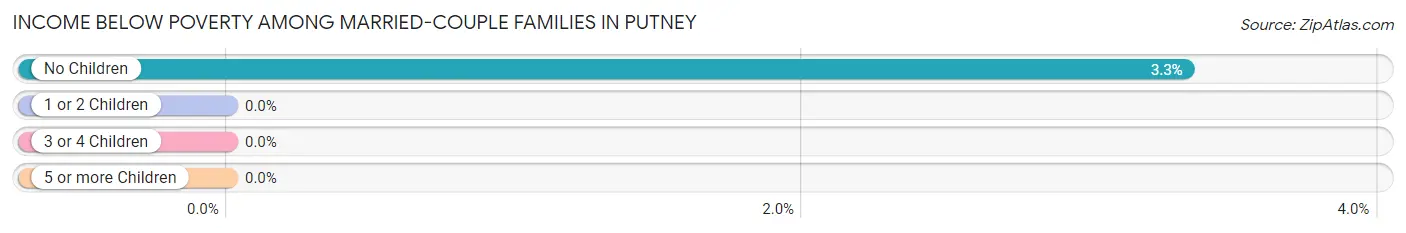
| Children | Above Poverty | Below Poverty |
| No Children | 348 (96.7%) | 12 (3.3%) |
| 1 or 2 Children | 119 (100.0%) | 0 (0.0%) |
| 3 or 4 Children | 25 (100.0%) | 0 (0.0%) |
| 5 or more Children | 0 (0.0%) | 0 (0.0%) |
| Total | 492 (97.6%) | 12 (2.4%) |
Income Below Poverty Among Single-Parent Households in Putney
According to the poverty data in Putney, 23.7% or 37 single-father households and 34.7% or 59 single-mother households are living below the poverty line. Among single-father households, those with 3 or 4 children have the highest poverty rate, with 37 households (92.5%) experiencing poverty. Likewise, among single-mother households, those with 1 or 2 children have the highest poverty rate, with 59 households (56.2%) falling below the poverty line.
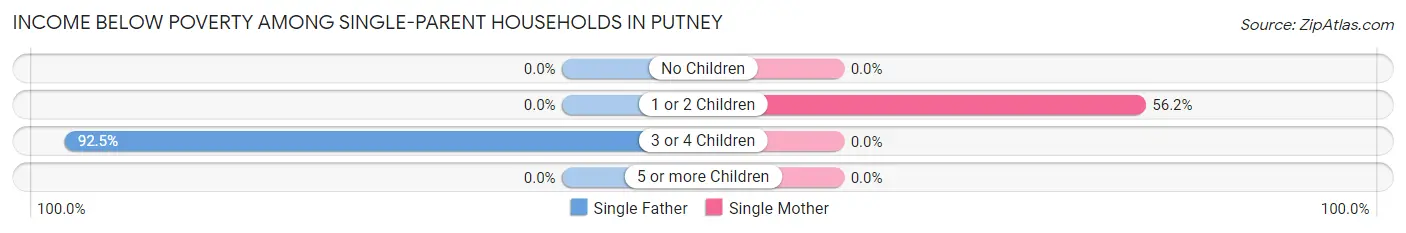
| Children | Single Father | Single Mother |
| No Children | 0 (0.0%) | 0 (0.0%) |
| 1 or 2 Children | 0 (0.0%) | 59 (56.2%) |
| 3 or 4 Children | 37 (92.5%) | 0 (0.0%) |
| 5 or more Children | 0 (0.0%) | 0 (0.0%) |
| Total | 37 (23.7%) | 59 (34.7%) |
Income Below Poverty Among Married-Couple vs Single-Parent Households in Putney
The poverty data for Putney shows that 12 of the married-couple family households (2.4%) and 96 of the single-parent households (29.4%) are living below the poverty level. Within the married-couple family households, those with no children have the highest poverty rate, with 12 households (3.3%) falling below the poverty line. Among the single-parent households, those with 3 or 4 children have the highest poverty rate, with 37 household (67.3%) living below poverty.
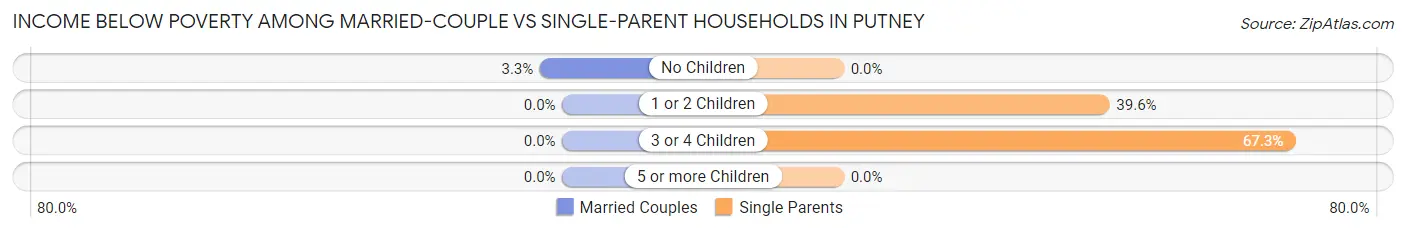
| Children | Married-Couple Families | Single-Parent Households |
| No Children | 12 (3.3%) | 0 (0.0%) |
| 1 or 2 Children | 0 (0.0%) | 59 (39.6%) |
| 3 or 4 Children | 0 (0.0%) | 37 (67.3%) |
| 5 or more Children | 0 (0.0%) | 0 (0.0%) |
| Total | 12 (2.4%) | 96 (29.4%) |
Race in Putney
The most populous races in Putney are Black / African American (1,544 | 46.9%), White / Caucasian (1,351 | 41.0%), and Two or more Races (233 | 7.1%).
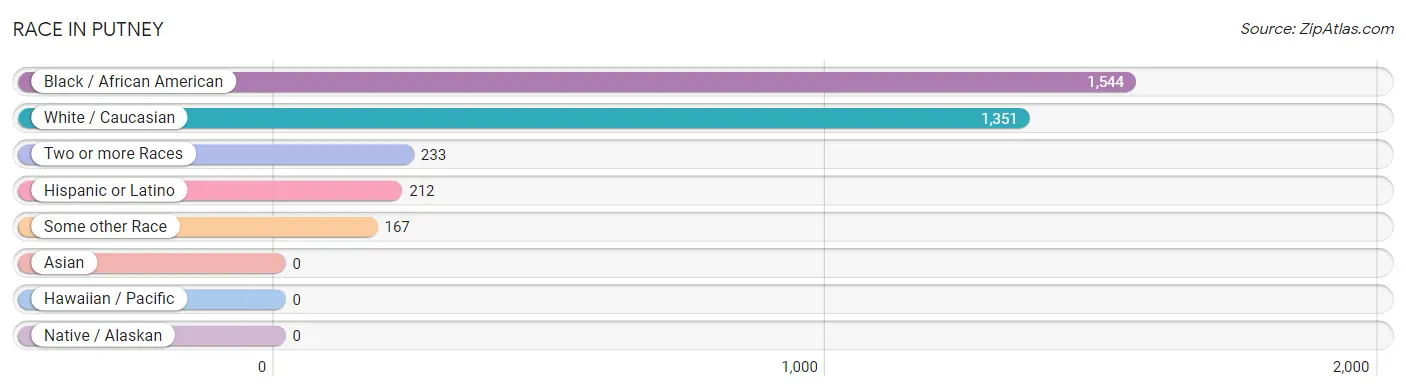
| Race | # Population | % Population |
| Asian | 0 | 0.0% |
| Black / African American | 1,544 | 46.9% |
| Hawaiian / Pacific | 0 | 0.0% |
| Hispanic or Latino | 212 | 6.4% |
| Native / Alaskan | 0 | 0.0% |
| White / Caucasian | 1,351 | 41.0% |
| Two or more Races | 233 | 7.1% |
| Some other Race | 167 | 5.1% |
| Total | 3,295 | 100.0% |
Ancestry in Putney
The most populous ancestries reported in Putney are American (248 | 7.5%), Irish (208 | 6.3%), English (186 | 5.6%), Central American (140 | 4.3%), and Guatemalan (140 | 4.3%), together accounting for 28.0% of all Putney residents.
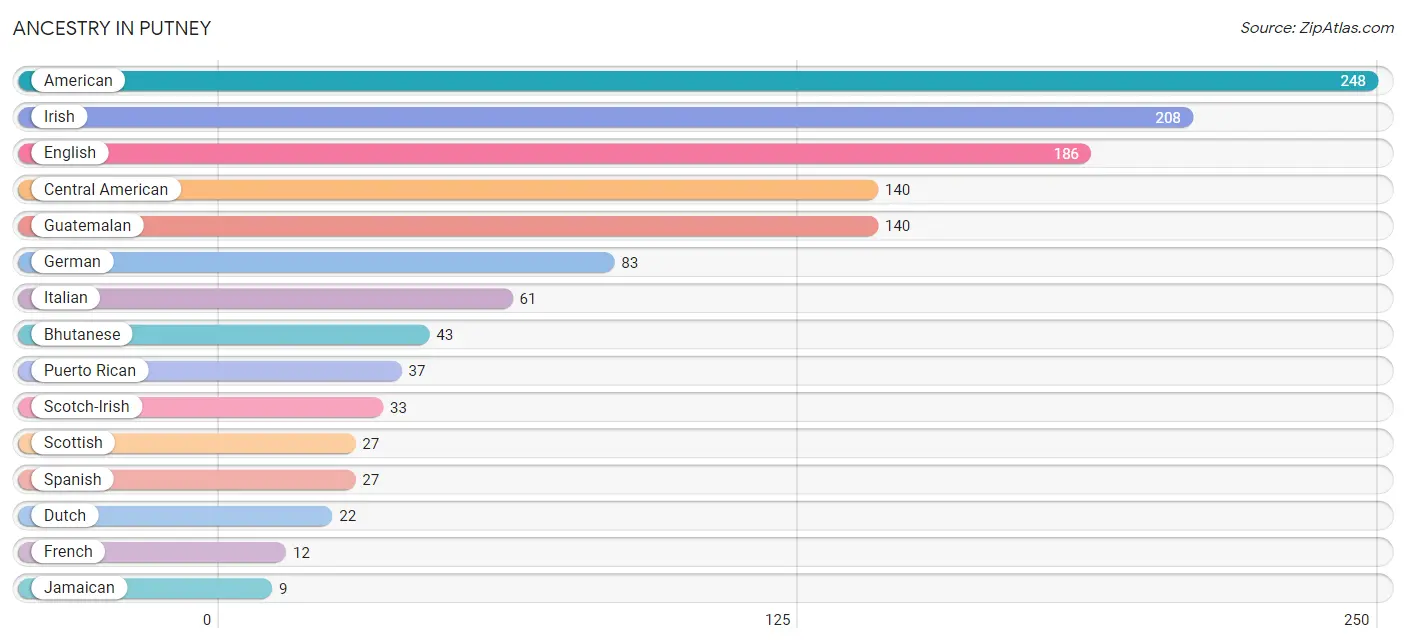
| Ancestry | # Population | % Population |
| American | 248 | 7.5% |
| Bhutanese | 43 | 1.3% |
| Central American | 140 | 4.3% |
| Cuban | 8 | 0.2% |
| Dutch | 22 | 0.7% |
| English | 186 | 5.6% |
| French | 12 | 0.4% |
| German | 83 | 2.5% |
| Guatemalan | 140 | 4.3% |
| Indian (Asian) | 8 | 0.2% |
| Irish | 208 | 6.3% |
| Italian | 61 | 1.8% |
| Jamaican | 9 | 0.3% |
| Puerto Rican | 37 | 1.1% |
| Scotch-Irish | 33 | 1.0% |
| Scottish | 27 | 0.8% |
| Spanish | 27 | 0.8% | View All 17 Rows |
Immigrants in Putney
The most numerous immigrant groups reported in Putney came from Latin America (68 | 2.1%), Central America (60 | 1.8%), Guatemala (60 | 1.8%), Europe (50 | 1.5%), and England (35 | 1.1%), together accounting for 8.3% of all Putney residents.
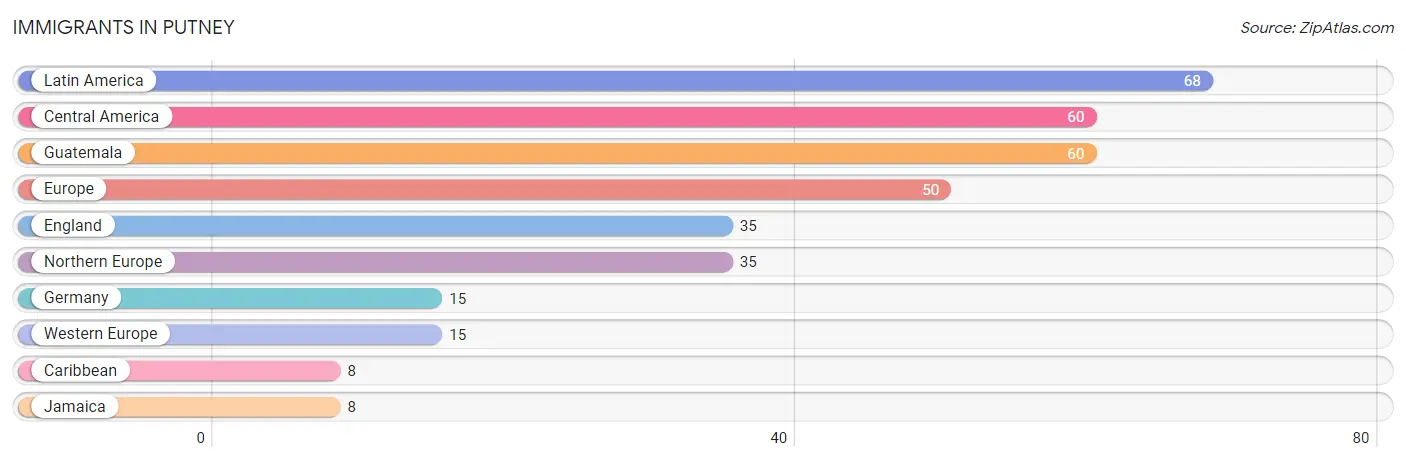
| Immigration Origin | # Population | % Population |
| Caribbean | 8 | 0.2% |
| Central America | 60 | 1.8% |
| England | 35 | 1.1% |
| Europe | 50 | 1.5% |
| Germany | 15 | 0.5% |
| Guatemala | 60 | 1.8% |
| Jamaica | 8 | 0.2% |
| Latin America | 68 | 2.1% |
| Northern Europe | 35 | 1.1% |
| Western Europe | 15 | 0.5% | View All 10 Rows |
Sex and Age in Putney
Sex and Age in Putney
The most populous age groups in Putney are 20 to 24 Years (187 | 12.6%) for men and 40 to 44 Years (196 | 10.9%) for women.
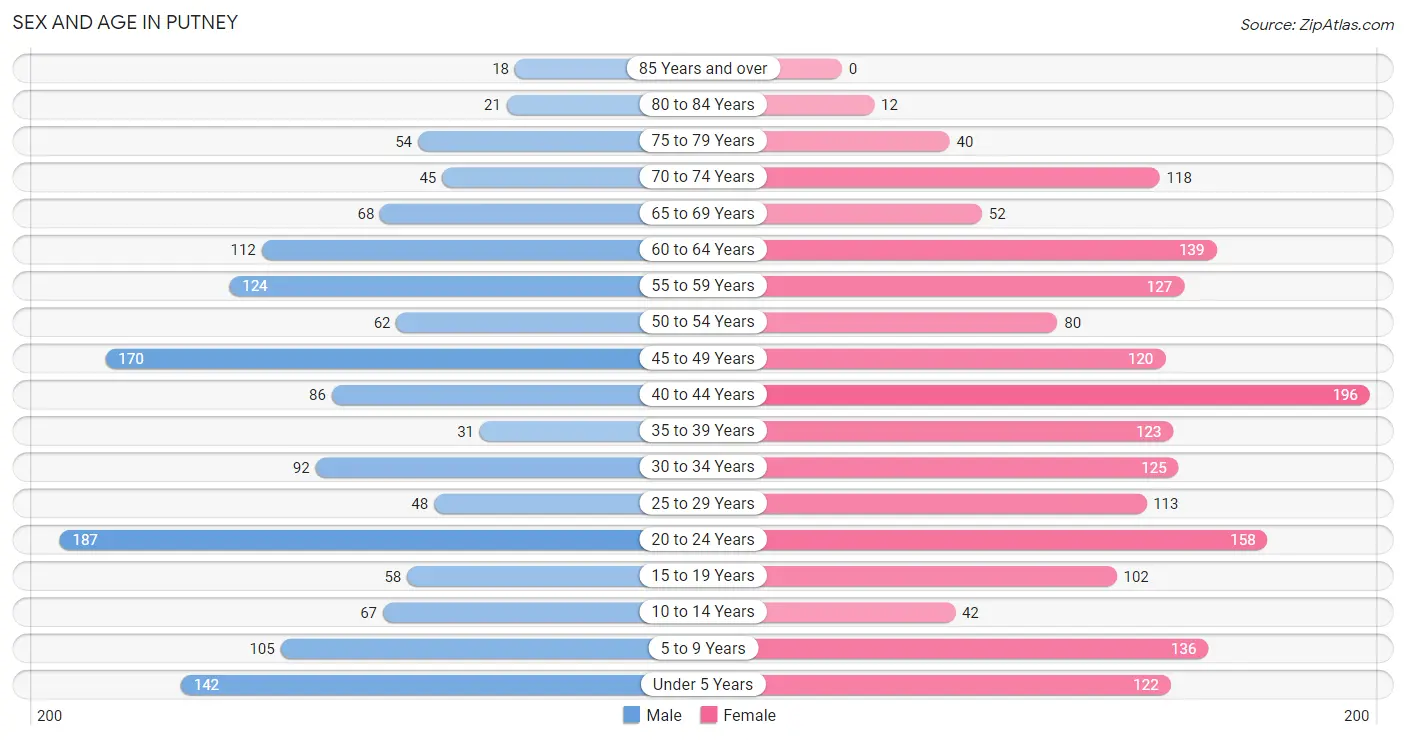
| Age Bracket | Male | Female |
| Under 5 Years | 142 (9.5%) | 122 (6.8%) |
| 5 to 9 Years | 105 (7.0%) | 136 (7.5%) |
| 10 to 14 Years | 67 (4.5%) | 42 (2.3%) |
| 15 to 19 Years | 58 (3.9%) | 102 (5.7%) |
| 20 to 24 Years | 187 (12.6%) | 158 (8.7%) |
| 25 to 29 Years | 48 (3.2%) | 113 (6.3%) |
| 30 to 34 Years | 92 (6.2%) | 125 (6.9%) |
| 35 to 39 Years | 31 (2.1%) | 123 (6.8%) |
| 40 to 44 Years | 86 (5.8%) | 196 (10.9%) |
| 45 to 49 Years | 170 (11.4%) | 120 (6.7%) |
| 50 to 54 Years | 62 (4.2%) | 80 (4.4%) |
| 55 to 59 Years | 124 (8.3%) | 127 (7.0%) |
| 60 to 64 Years | 112 (7.5%) | 139 (7.7%) |
| 65 to 69 Years | 68 (4.6%) | 52 (2.9%) |
| 70 to 74 Years | 45 (3.0%) | 118 (6.5%) |
| 75 to 79 Years | 54 (3.6%) | 40 (2.2%) |
| 80 to 84 Years | 21 (1.4%) | 12 (0.7%) |
| 85 Years and over | 18 (1.2%) | 0 (0.0%) |
| Total | 1,490 (100.0%) | 1,805 (100.0%) |
Families and Households in Putney
Median Family Size in Putney
The median family size in Putney is 3.09 persons per family, with single female/mother families (170 | 20.5%) accounting for the largest median family size of 3.89 persons per family. On the other hand, married-couple families (504 | 60.7%) represent the smallest median family size with 2.80 persons per family.
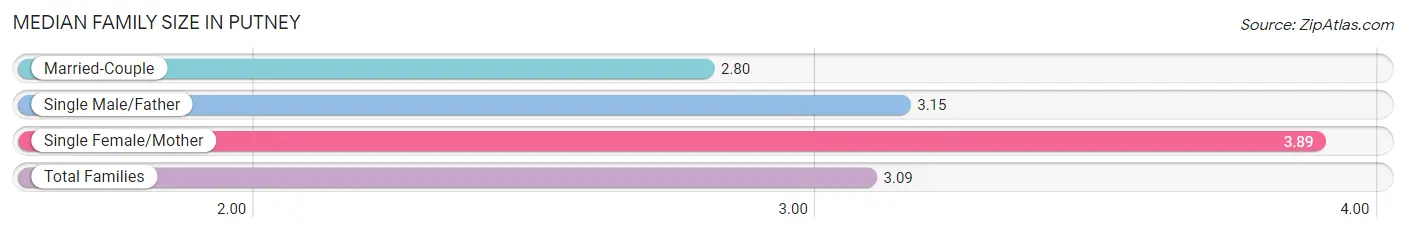
| Family Type | # Families | Family Size |
| Married-Couple | 504 (60.7%) | 2.80 |
| Single Male/Father | 156 (18.8%) | 3.15 |
| Single Female/Mother | 170 (20.5%) | 3.89 |
| Total Families | 830 (100.0%) | 3.09 |
Median Household Size in Putney
The median household size in Putney is 2.80 persons per household, with single female/mother households (170 | 14.4%) accounting for the largest median household size of 4.16 persons per household. non-family households (348 | 29.5%) represent the smallest median household size with 1.82 persons per household.
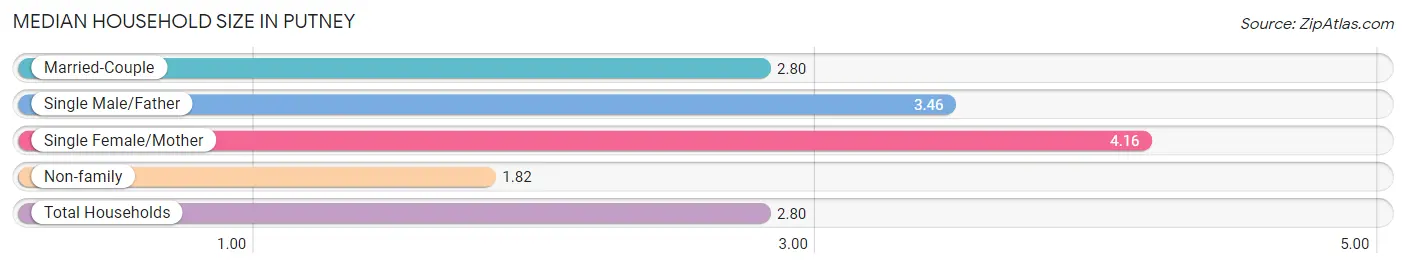
| Household Type | # Households | Household Size |
| Married-Couple | 504 (42.8%) | 2.80 |
| Single Male/Father | 156 (13.2%) | 3.46 |
| Single Female/Mother | 170 (14.4%) | 4.16 |
| Non-family | 348 (29.5%) | 1.82 |
| Total Households | 1,178 (100.0%) | 2.80 |
Household Size by Marriage Status in Putney
Out of a total of 1,178 households in Putney, 830 (70.5%) are family households, while 348 (29.5%) are nonfamily households. The most numerous type of family households are 2-person households, comprising 343, and the most common type of nonfamily households are 1-person households, comprising 181.
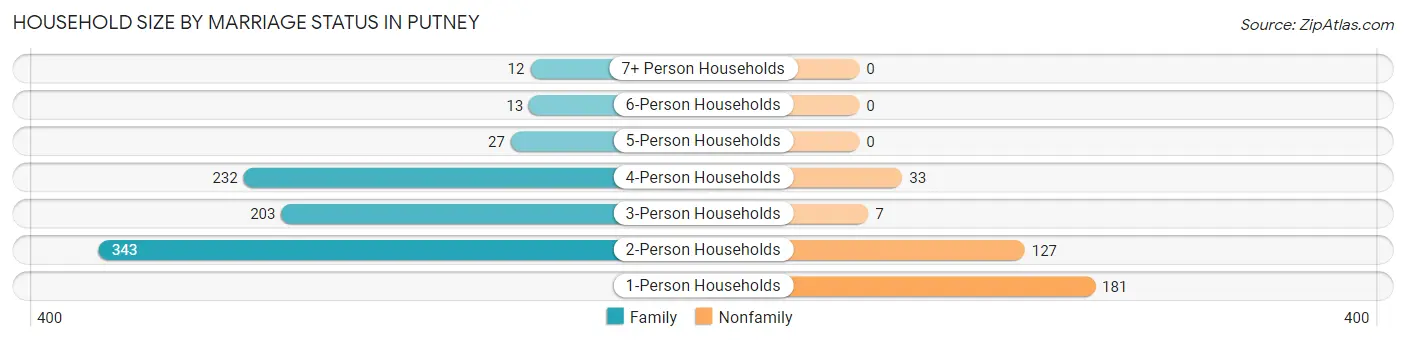
| Household Size | Family Households | Nonfamily Households |
| 1-Person Households | - | 181 (15.4%) |
| 2-Person Households | 343 (29.1%) | 127 (10.8%) |
| 3-Person Households | 203 (17.2%) | 7 (0.6%) |
| 4-Person Households | 232 (19.7%) | 33 (2.8%) |
| 5-Person Households | 27 (2.3%) | 0 (0.0%) |
| 6-Person Households | 13 (1.1%) | 0 (0.0%) |
| 7+ Person Households | 12 (1.0%) | 0 (0.0%) |
| Total | 830 (70.5%) | 348 (29.5%) |
Female Fertility in Putney
Fertility by Age in Putney
Average fertility rate in Putney is 76.0 births per 1,000 women. Women in the age bracket of 20 to 34 years have the highest fertility rate with 126.0 births per 1,000 women. Women in the age bracket of 20 to 34 years acount for 66.7% of all women with births.
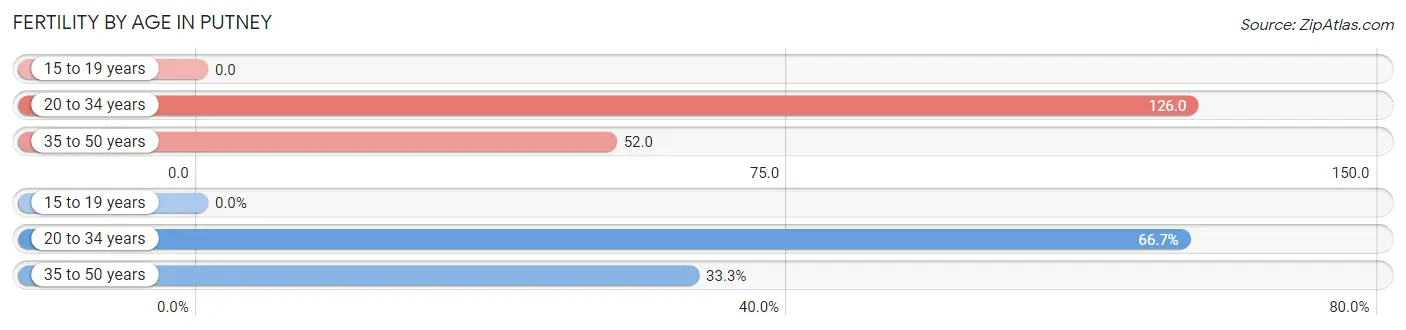
| Age Bracket | Women with Births | Births / 1,000 Women |
| 15 to 19 years | 0 (0.0%) | 0.0 |
| 20 to 34 years | 50 (66.7%) | 126.0 |
| 35 to 50 years | 25 (33.3%) | 52.0 |
| Total | 75 (100.0%) | 76.0 |
Fertility by Age by Marriage Status in Putney
66.7% of women with births (75) in Putney are married. The highest percentage of unmarried women with births falls into 35 to 50 years age bracket with 100.0% of them unmarried at the time of birth, while the lowest percentage of unmarried women with births belong to 20 to 34 years age bracket with 0.0% of them unmarried.
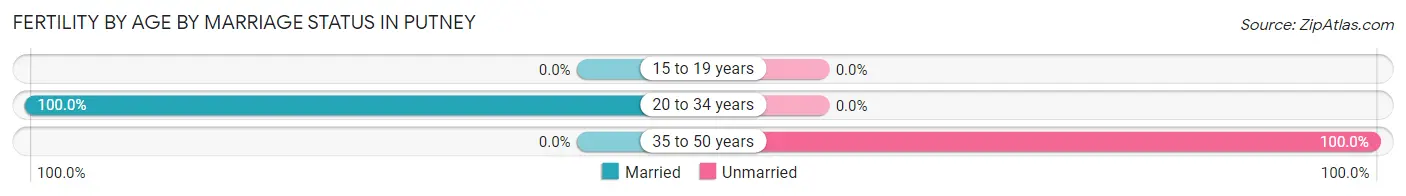
| Age Bracket | Married | Unmarried |
| 15 to 19 years | 0 (0.0%) | 0 (0.0%) |
| 20 to 34 years | 50 (100.0%) | 0 (0.0%) |
| 35 to 50 years | 0 (0.0%) | 25 (100.0%) |
| Total | 50 (66.7%) | 25 (33.3%) |
Fertility by Education in Putney
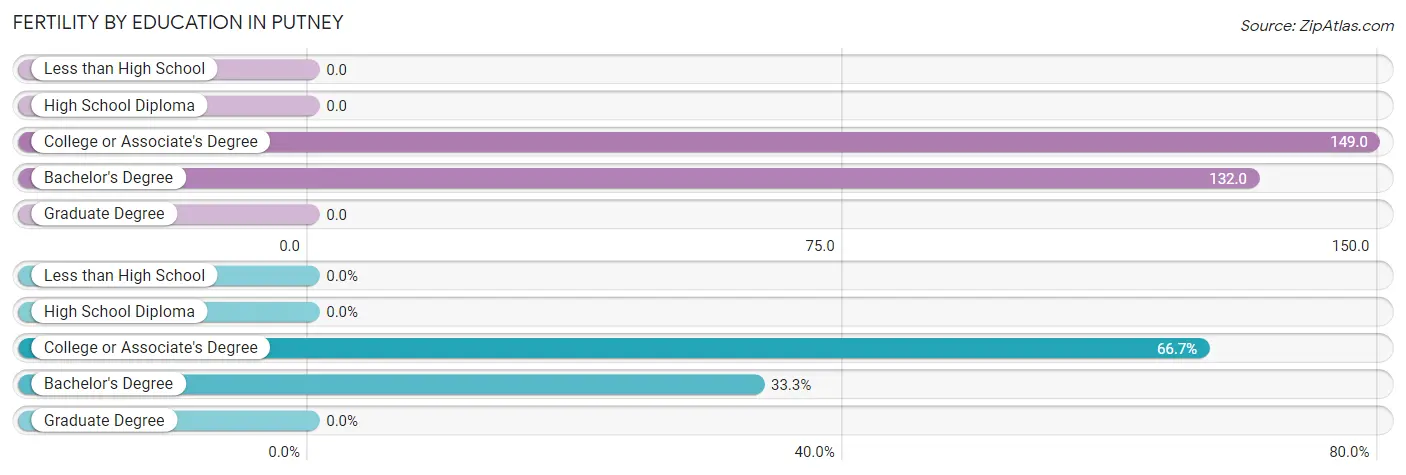
| Educational Attainment | Women with Births | Births / 1,000 Women |
| Less than High School | 0 (0.0%) | 0.0 |
| High School Diploma | 0 (0.0%) | 0.0 |
| College or Associate's Degree | 50 (66.7%) | 149.0 |
| Bachelor's Degree | 25 (33.3%) | 132.0 |
| Graduate Degree | 0 (0.0%) | 0.0 |
| Total | 75 (100.0%) | 76.0 |
Fertility by Education by Marriage Status in Putney
33.3% of women with births in Putney are unmarried. Women with the educational attainment of bachelor's degree are most likely to be married with 100.0% of them married at childbirth, while women with the educational attainment of college or associate's degree are least likely to be married with 50.0% of them unmarried at childbirth.
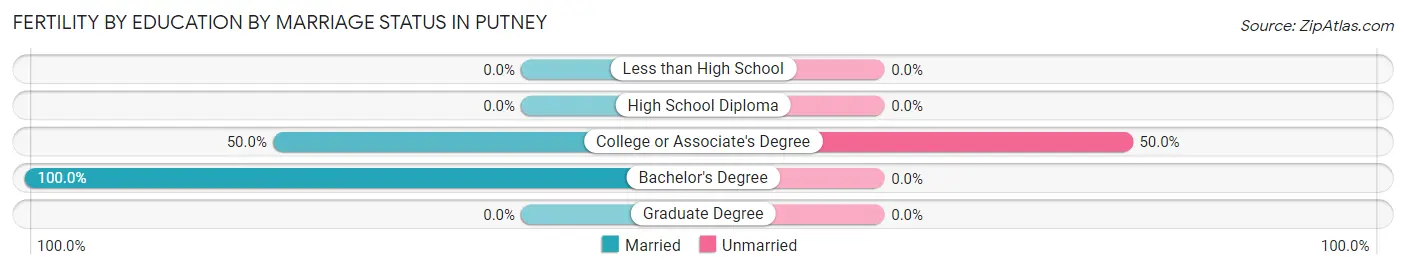
| Educational Attainment | Married | Unmarried |
| Less than High School | 0 (0.0%) | 0 (0.0%) |
| High School Diploma | 0 (0.0%) | 0 (0.0%) |
| College or Associate's Degree | 25 (50.0%) | 25 (50.0%) |
| Bachelor's Degree | 25 (100.0%) | 0 (0.0%) |
| Graduate Degree | 0 (0.0%) | 0 (0.0%) |
| Total | 50 (66.7%) | 25 (33.3%) |
Employment Characteristics in Putney
Employment by Class of Employer in Putney
Among the 1,338 employed individuals in Putney, private company employees (821 | 61.4%), local government employees (143 | 10.7%), and not-for-profit organizations (138 | 10.3%) make up the most common classes of employment.
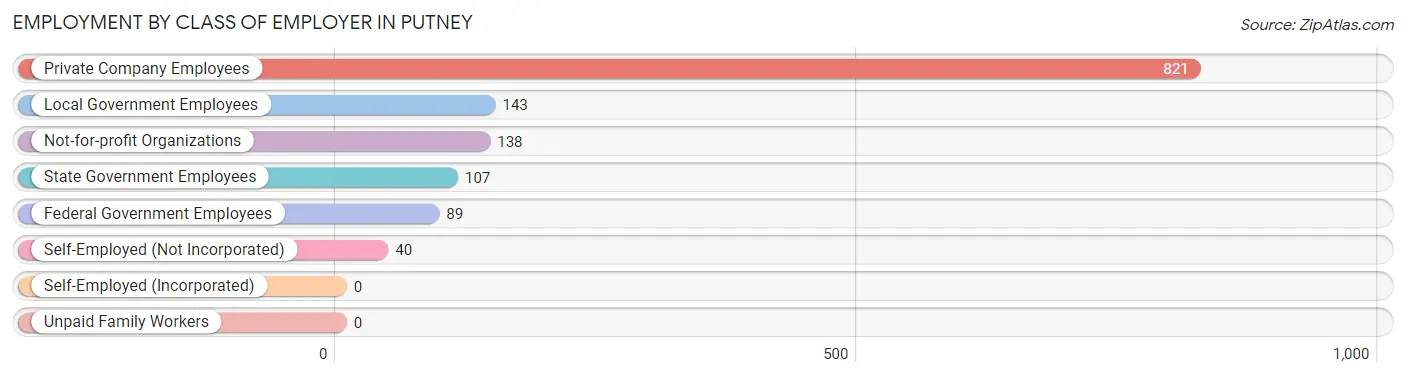
| Employer Class | # Employees | % Employees |
| Private Company Employees | 821 | 61.4% |
| Self-Employed (Incorporated) | 0 | 0.0% |
| Self-Employed (Not Incorporated) | 40 | 3.0% |
| Not-for-profit Organizations | 138 | 10.3% |
| Local Government Employees | 143 | 10.7% |
| State Government Employees | 107 | 8.0% |
| Federal Government Employees | 89 | 6.7% |
| Unpaid Family Workers | 0 | 0.0% |
| Total | 1,338 | 100.0% |
Employment Status by Age in Putney
According to the labor force statistics for Putney, out of the total population over 16 years of age (2,651), 61.6% or 1,633 individuals are in the labor force, with 15.6% or 255 of them unemployed. The age group with the highest labor force participation rate is 30 to 34 years, with 92.6% or 201 individuals in the labor force. Within the labor force, the 16 to 19 years age range has the highest percentage of unemployed individuals, with 54.9% or 28 of them being unemployed.
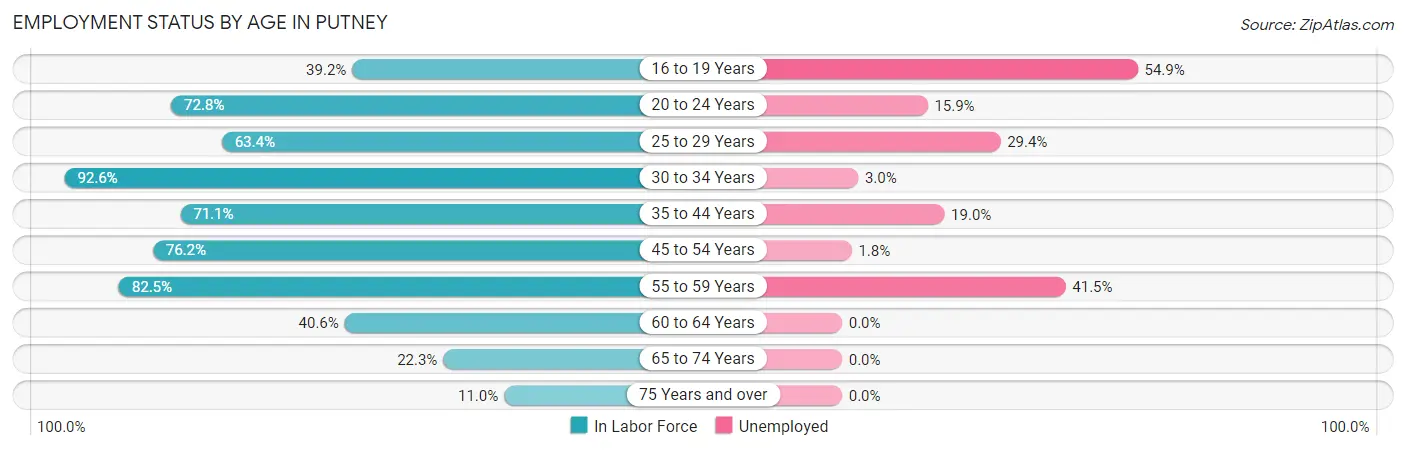
| Age Bracket | In Labor Force | Unemployed |
| 16 to 19 Years | 51 (39.2%) | 28 (54.9%) |
| 20 to 24 Years | 251 (72.8%) | 40 (15.9%) |
| 25 to 29 Years | 102 (63.4%) | 30 (29.4%) |
| 30 to 34 Years | 201 (92.6%) | 6 (3.0%) |
| 35 to 44 Years | 310 (71.1%) | 59 (19.0%) |
| 45 to 54 Years | 329 (76.2%) | 6 (1.8%) |
| 55 to 59 Years | 207 (82.5%) | 86 (41.5%) |
| 60 to 64 Years | 102 (40.6%) | 0 (0.0%) |
| 65 to 74 Years | 63 (22.3%) | 0 (0.0%) |
| 75 Years and over | 16 (11.0%) | 0 (0.0%) |
| Total | 1,633 (61.6%) | 255 (15.6%) |
Employment Status by Educational Attainment in Putney
According to labor force statistics for Putney, 71.6% of individuals (1,252) out of the total population between 25 and 64 years of age (1,748) are in the labor force, with 14.9% or 187 of them being unemployed. The group with the highest labor force participation rate are those with the educational attainment of bachelor's degree or higher, with 89.0% or 317 individuals in the labor force. Within the labor force, individuals with high school diploma education have the highest percentage of unemployment, with 35.3% or 132 of them being unemployed.
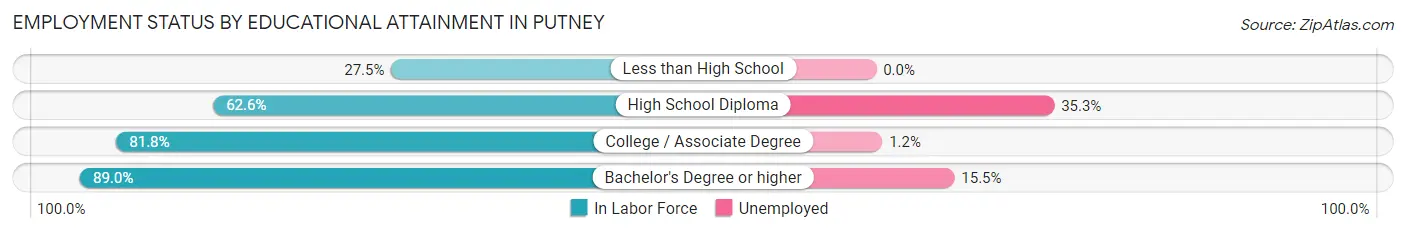
| Educational Attainment | In Labor Force | Unemployed |
| Less than High School | 46 (27.5%) | 0 (0.0%) |
| High School Diploma | 374 (62.6%) | 211 (35.3%) |
| College / Associate Degree | 514 (81.8%) | 8 (1.2%) |
| Bachelor's Degree or higher | 317 (89.0%) | 55 (15.5%) |
| Total | 1,252 (71.6%) | 260 (14.9%) |
Employment Occupations by Sex in Putney
Management, Business, Science and Arts Occupations
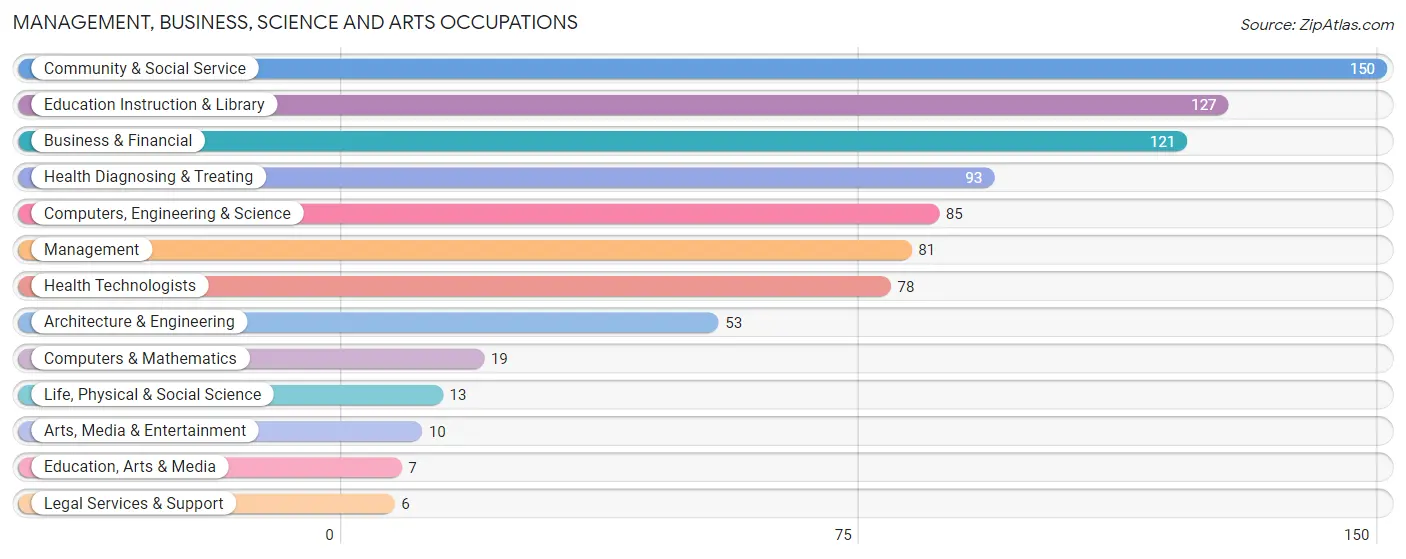
The most common Management, Business, Science and Arts occupations in Putney are Community & Social Service (150 | 10.9%), Education Instruction & Library (127 | 9.2%), Business & Financial (121 | 8.8%), Health Diagnosing & Treating (93 | 6.8%), and Computers, Engineering & Science (85 | 6.2%).
Management, Business, Science and Arts Occupations by Sex
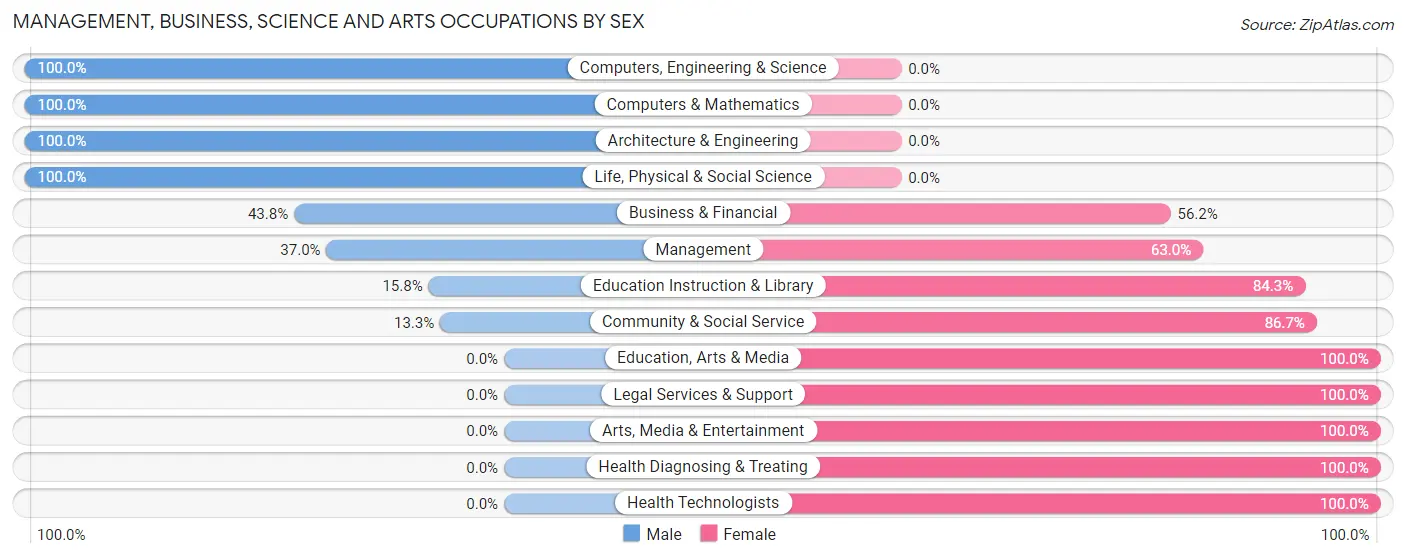
Within the Management, Business, Science and Arts occupations in Putney, the most male-oriented occupations are Computers, Engineering & Science (100.0%), Computers & Mathematics (100.0%), and Architecture & Engineering (100.0%), while the most female-oriented occupations are Education, Arts & Media (100.0%), Legal Services & Support (100.0%), and Arts, Media & Entertainment (100.0%).
| Occupation | Male | Female |
| Management | 30 (37.0%) | 51 (63.0%) |
| Business & Financial | 53 (43.8%) | 68 (56.2%) |
| Computers, Engineering & Science | 85 (100.0%) | 0 (0.0%) |
| Computers & Mathematics | 19 (100.0%) | 0 (0.0%) |
| Architecture & Engineering | 53 (100.0%) | 0 (0.0%) |
| Life, Physical & Social Science | 13 (100.0%) | 0 (0.0%) |
| Community & Social Service | 20 (13.3%) | 130 (86.7%) |
| Education, Arts & Media | 0 (0.0%) | 7 (100.0%) |
| Legal Services & Support | 0 (0.0%) | 6 (100.0%) |
| Education Instruction & Library | 20 (15.8%) | 107 (84.3%) |
| Arts, Media & Entertainment | 0 (0.0%) | 10 (100.0%) |
| Health Diagnosing & Treating | 0 (0.0%) | 93 (100.0%) |
| Health Technologists | 0 (0.0%) | 78 (100.0%) |
| Total (Category) | 188 (35.5%) | 342 (64.5%) |
| Total (Overall) | 706 (51.3%) | 671 (48.7%) |
Services Occupations
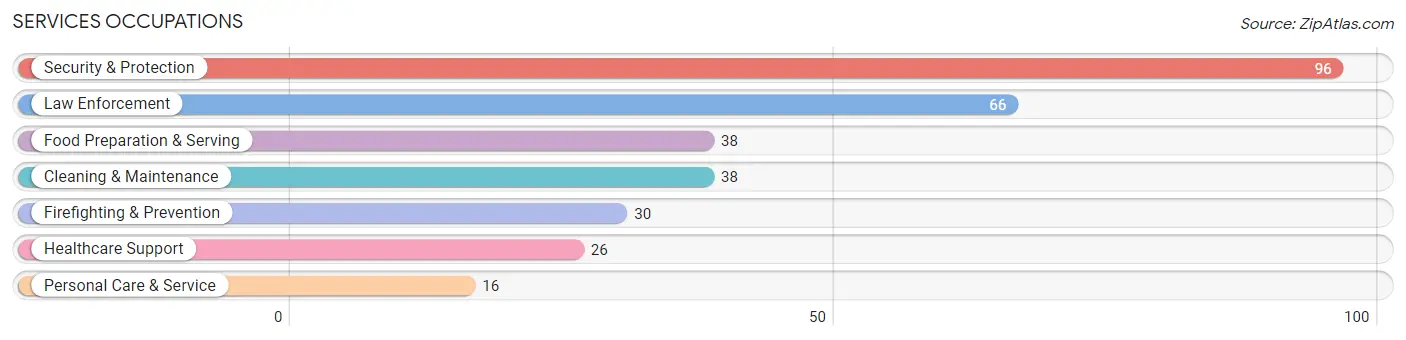
The most common Services occupations in Putney are Security & Protection (96 | 7.0%), Law Enforcement (66 | 4.8%), Food Preparation & Serving (38 | 2.8%), Cleaning & Maintenance (38 | 2.8%), and Firefighting & Prevention (30 | 2.2%).
Services Occupations by Sex
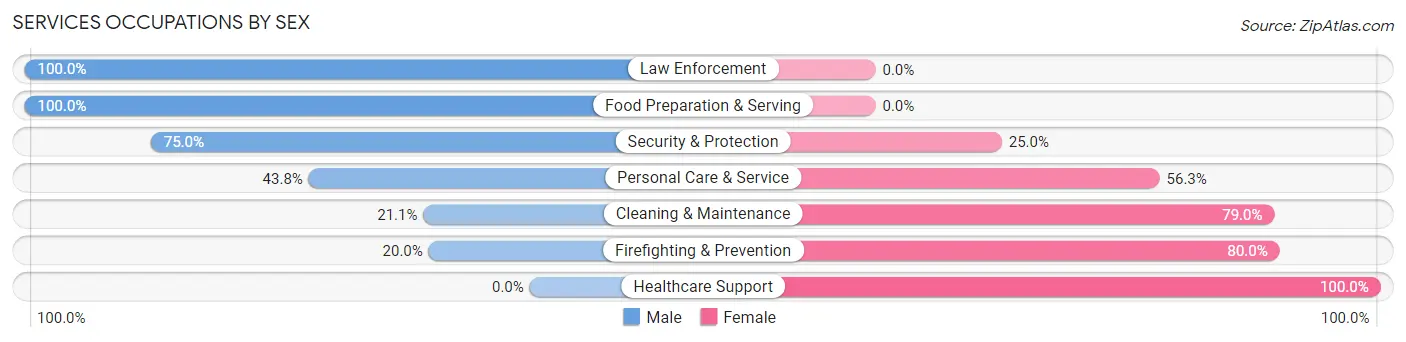
Within the Services occupations in Putney, the most male-oriented occupations are Law Enforcement (100.0%), Food Preparation & Serving (100.0%), and Security & Protection (75.0%), while the most female-oriented occupations are Healthcare Support (100.0%), Firefighting & Prevention (80.0%), and Cleaning & Maintenance (78.9%).
| Occupation | Male | Female |
| Healthcare Support | 0 (0.0%) | 26 (100.0%) |
| Security & Protection | 72 (75.0%) | 24 (25.0%) |
| Firefighting & Prevention | 6 (20.0%) | 24 (80.0%) |
| Law Enforcement | 66 (100.0%) | 0 (0.0%) |
| Food Preparation & Serving | 38 (100.0%) | 0 (0.0%) |
| Cleaning & Maintenance | 8 (21.0%) | 30 (78.9%) |
| Personal Care & Service | 7 (43.8%) | 9 (56.2%) |
| Total (Category) | 125 (58.4%) | 89 (41.6%) |
| Total (Overall) | 706 (51.3%) | 671 (48.7%) |
Sales and Office Occupations
The most common Sales and Office occupations in Putney are Office & Administration (87 | 6.3%), and Sales & Related (71 | 5.2%).
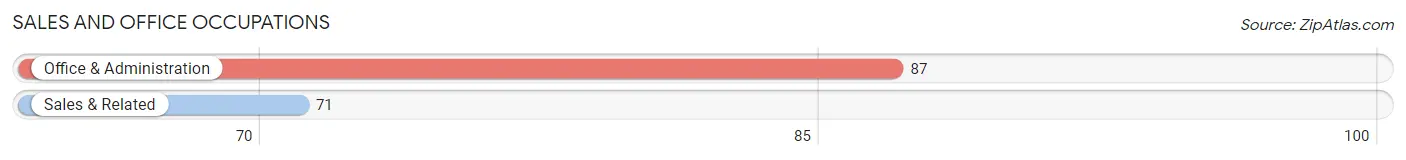
Sales and Office Occupations by Sex
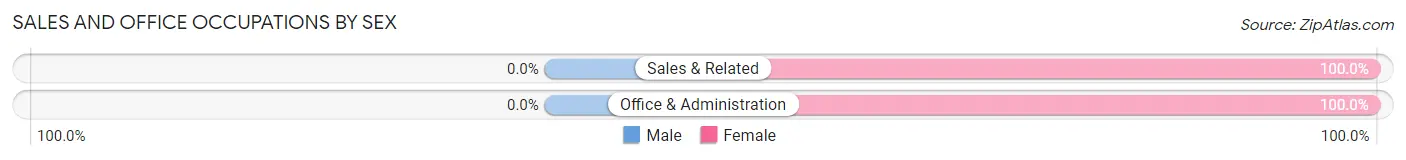
| Occupation | Male | Female |
| Sales & Related | 0 (0.0%) | 71 (100.0%) |
| Office & Administration | 0 (0.0%) | 87 (100.0%) |
| Total (Category) | 0 (0.0%) | 158 (100.0%) |
| Total (Overall) | 706 (51.3%) | 671 (48.7%) |
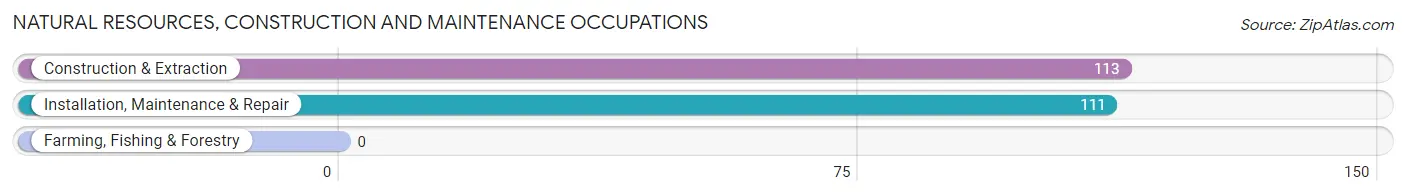
Natural Resources, Construction and Maintenance Occupations
The most common Natural Resources, Construction and Maintenance occupations in Putney are Construction & Extraction (113 | 8.2%), and Installation, Maintenance & Repair (111 | 8.1%).
Natural Resources, Construction and Maintenance Occupations by Sex
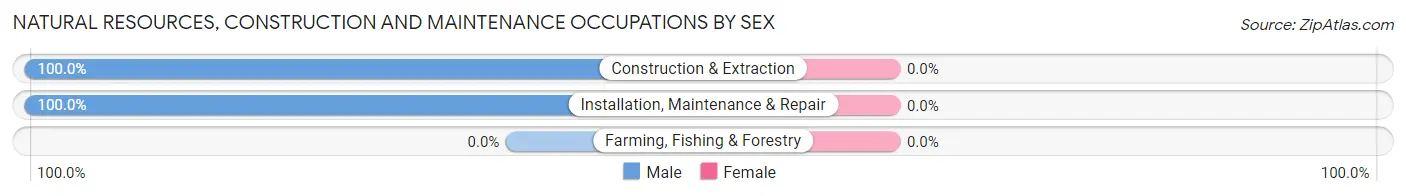
| Occupation | Male | Female |
| Farming, Fishing & Forestry | 0 (0.0%) | 0 (0.0%) |
| Construction & Extraction | 113 (100.0%) | 0 (0.0%) |
| Installation, Maintenance & Repair | 111 (100.0%) | 0 (0.0%) |
| Total (Category) | 224 (100.0%) | 0 (0.0%) |
| Total (Overall) | 706 (51.3%) | 671 (48.7%) |
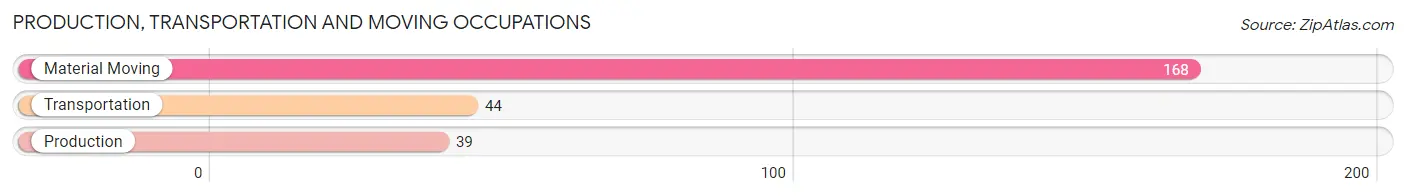
Production, Transportation and Moving Occupations
The most common Production, Transportation and Moving occupations in Putney are Material Moving (168 | 12.2%), Transportation (44 | 3.2%), and Production (39 | 2.8%).
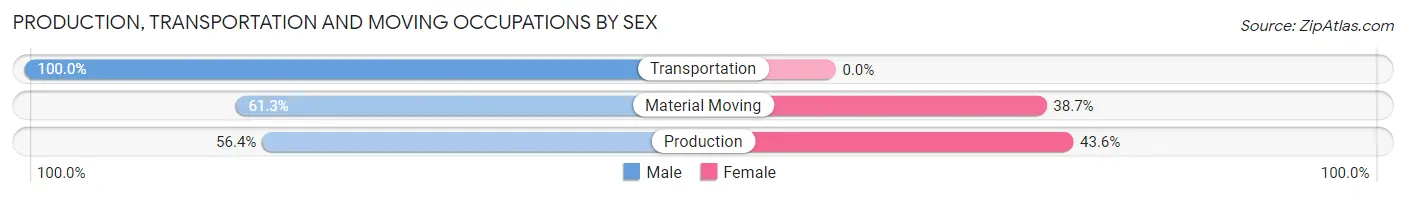
Production, Transportation and Moving Occupations by Sex
| Occupation | Male | Female |
| Production | 22 (56.4%) | 17 (43.6%) |
| Transportation | 44 (100.0%) | 0 (0.0%) |
| Material Moving | 103 (61.3%) | 65 (38.7%) |
| Total (Category) | 169 (67.3%) | 82 (32.7%) |
| Total (Overall) | 706 (51.3%) | 671 (48.7%) |
Employment Industries by Sex in Putney
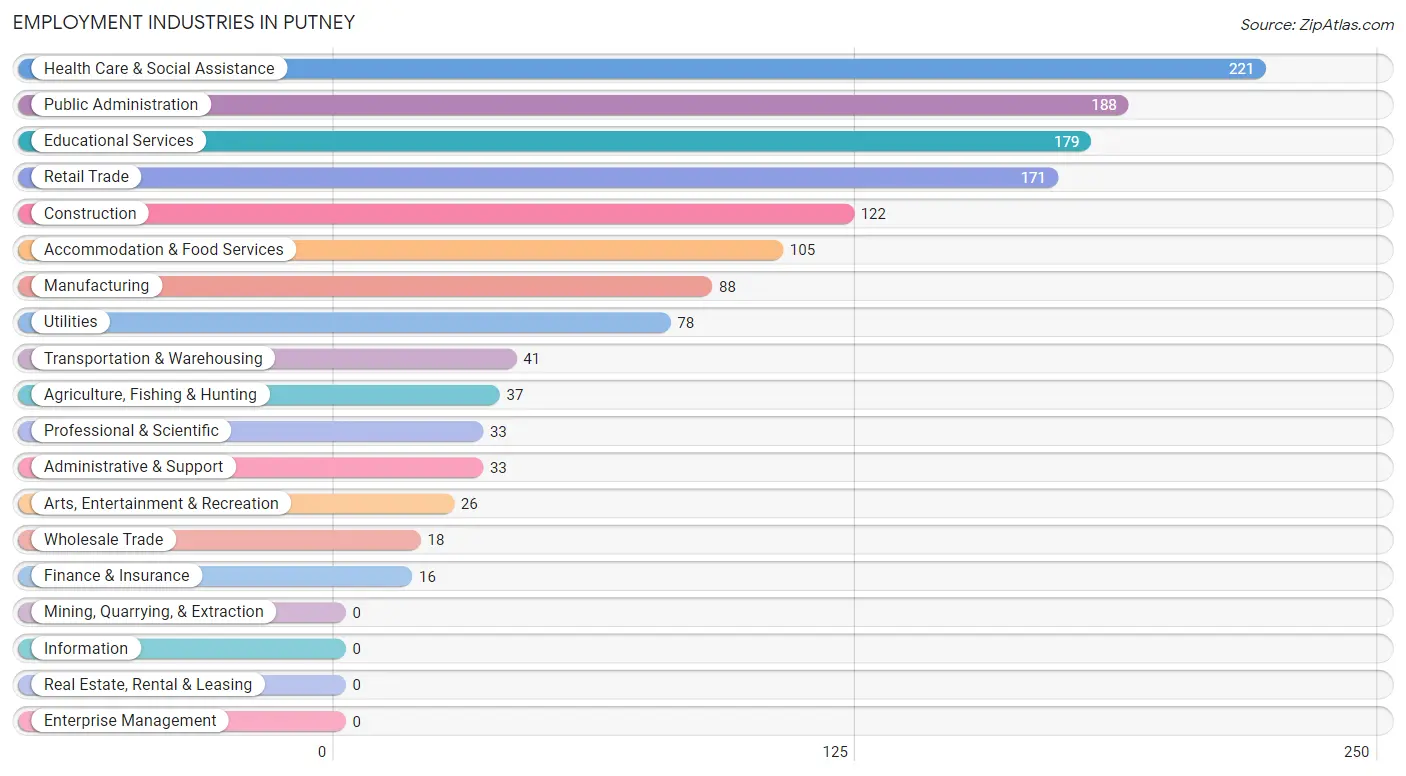
Employment Industries in Putney
The major employment industries in Putney include Health Care & Social Assistance (221 | 16.1%), Public Administration (188 | 13.7%), Educational Services (179 | 13.0%), Retail Trade (171 | 12.4%), and Construction (122 | 8.9%).
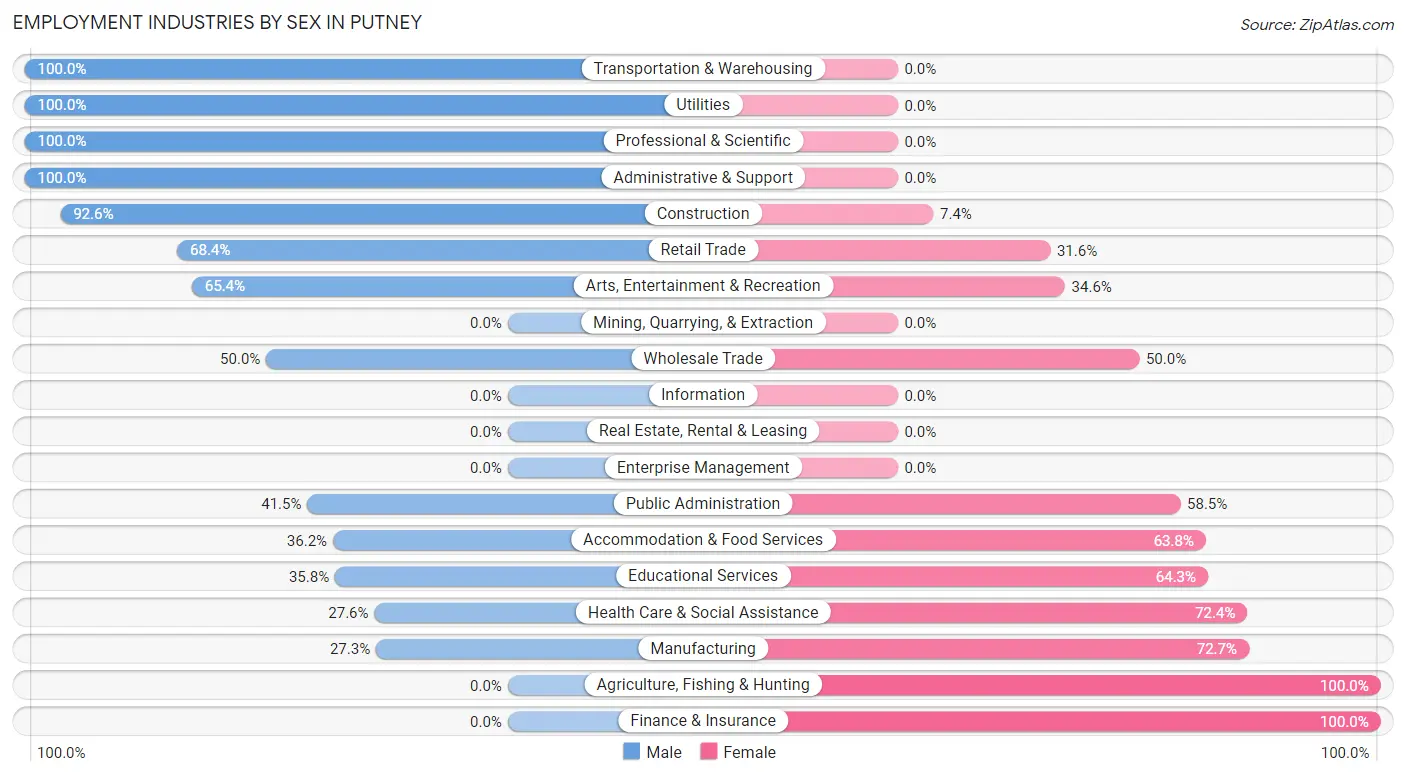
Employment Industries by Sex in Putney
The Putney industries that see more men than women are Transportation & Warehousing (100.0%), Utilities (100.0%), and Professional & Scientific (100.0%), whereas the industries that tend to have a higher number of women are Agriculture, Fishing & Hunting (100.0%), Finance & Insurance (100.0%), and Manufacturing (72.7%).
| Industry | Male | Female |
| Agriculture, Fishing & Hunting | 0 (0.0%) | 37 (100.0%) |
| Mining, Quarrying, & Extraction | 0 (0.0%) | 0 (0.0%) |
| Construction | 113 (92.6%) | 9 (7.4%) |
| Manufacturing | 24 (27.3%) | 64 (72.7%) |
| Wholesale Trade | 9 (50.0%) | 9 (50.0%) |
| Retail Trade | 117 (68.4%) | 54 (31.6%) |
| Transportation & Warehousing | 41 (100.0%) | 0 (0.0%) |
| Utilities | 78 (100.0%) | 0 (0.0%) |
| Information | 0 (0.0%) | 0 (0.0%) |
| Finance & Insurance | 0 (0.0%) | 16 (100.0%) |
| Real Estate, Rental & Leasing | 0 (0.0%) | 0 (0.0%) |
| Professional & Scientific | 33 (100.0%) | 0 (0.0%) |
| Enterprise Management | 0 (0.0%) | 0 (0.0%) |
| Administrative & Support | 33 (100.0%) | 0 (0.0%) |
| Educational Services | 64 (35.7%) | 115 (64.2%) |
| Health Care & Social Assistance | 61 (27.6%) | 160 (72.4%) |
| Arts, Entertainment & Recreation | 17 (65.4%) | 9 (34.6%) |
| Accommodation & Food Services | 38 (36.2%) | 67 (63.8%) |
| Public Administration | 78 (41.5%) | 110 (58.5%) |
| Total | 706 (51.3%) | 671 (48.7%) |
Education in Putney
School Enrollment in Putney
The most common levels of schooling among the 656 students in Putney are elementary school (235 | 35.8%), college / undergraduate (150 | 22.9%), and high school (111 | 16.9%).
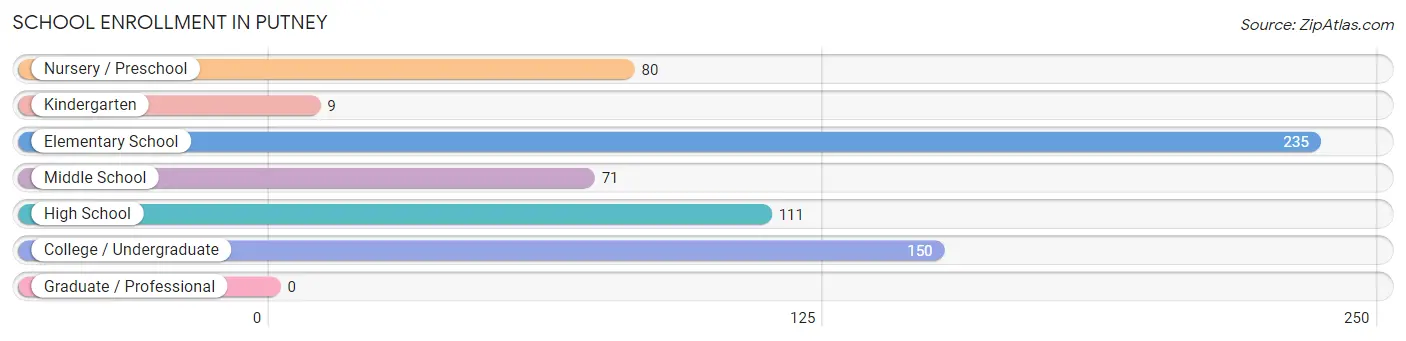
| School Level | # Students | % Students |
| Nursery / Preschool | 80 | 12.2% |
| Kindergarten | 9 | 1.4% |
| Elementary School | 235 | 35.8% |
| Middle School | 71 | 10.8% |
| High School | 111 | 16.9% |
| College / Undergraduate | 150 | 22.9% |
| Graduate / Professional | 0 | 0.0% |
| Total | 656 | 100.0% |
School Enrollment by Age by Funding Source in Putney
Out of a total of 656 students who are enrolled in schools in Putney, 85 (13.0%) attend a private institution, while the remaining 571 (87.0%) are enrolled in public schools. The age group of 5 to 9 year old has the highest likelihood of being enrolled in private schools, with 75 (32.8% in the age bracket) enrolled. Conversely, the age group of 3 to 4 year olds has the lowest likelihood of being enrolled in a private school, with 54 (100.0% in the age bracket) attending a public institution.
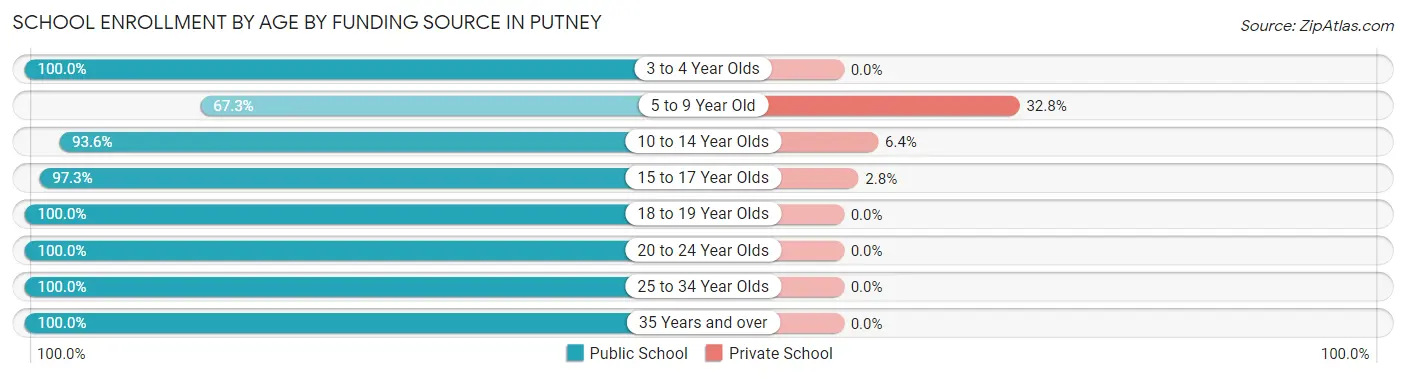
| Age Bracket | Public School | Private School |
| 3 to 4 Year Olds | 54 (100.0%) | 0 (0.0%) |
| 5 to 9 Year Old | 154 (67.2%) | 75 (32.8%) |
| 10 to 14 Year Olds | 102 (93.6%) | 7 (6.4%) |
| 15 to 17 Year Olds | 106 (97.3%) | 3 (2.8%) |
| 18 to 19 Year Olds | 5 (100.0%) | 0 (0.0%) |
| 20 to 24 Year Olds | 102 (100.0%) | 0 (0.0%) |
| 25 to 34 Year Olds | 40 (100.0%) | 0 (0.0%) |
| 35 Years and over | 8 (100.0%) | 0 (0.0%) |
| Total | 571 (87.0%) | 85 (13.0%) |
Educational Attainment by Field of Study in Putney
Education (118 | 26.5%), business (98 | 22.0%), science & technology (75 | 16.9%), arts & humanities (71 | 16.0%), and psychology (49 | 11.0%) are the most common fields of study among 445 individuals in Putney who have obtained a bachelor's degree or higher.
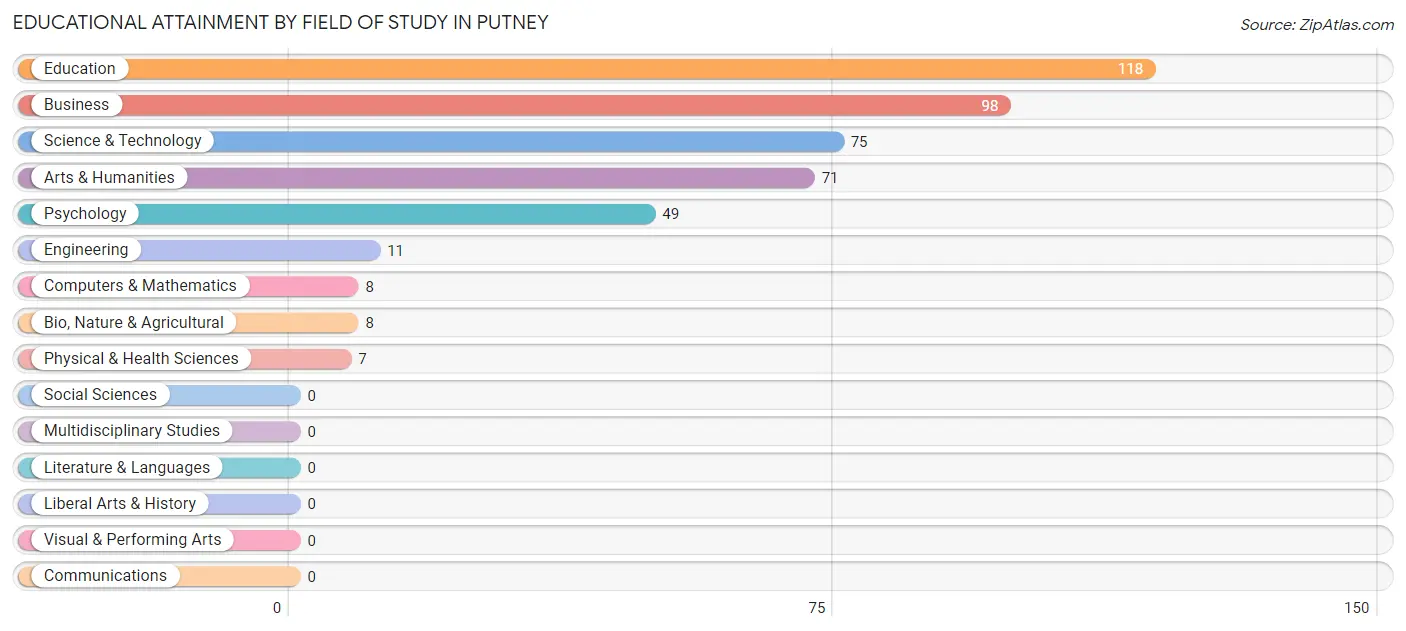
| Field of Study | # Graduates | % Graduates |
| Computers & Mathematics | 8 | 1.8% |
| Bio, Nature & Agricultural | 8 | 1.8% |
| Physical & Health Sciences | 7 | 1.6% |
| Psychology | 49 | 11.0% |
| Social Sciences | 0 | 0.0% |
| Engineering | 11 | 2.5% |
| Multidisciplinary Studies | 0 | 0.0% |
| Science & Technology | 75 | 16.9% |
| Business | 98 | 22.0% |
| Education | 118 | 26.5% |
| Literature & Languages | 0 | 0.0% |
| Liberal Arts & History | 0 | 0.0% |
| Visual & Performing Arts | 0 | 0.0% |
| Communications | 0 | 0.0% |
| Arts & Humanities | 71 | 16.0% |
| Total | 445 | 100.0% |
Transportation & Commute in Putney
Vehicle Availability by Sex in Putney
The most prevalent vehicle ownership categories in Putney are males with 2 vehicles (272, accounting for 38.9%) and females with 2 vehicles (182, making up 42.6%).
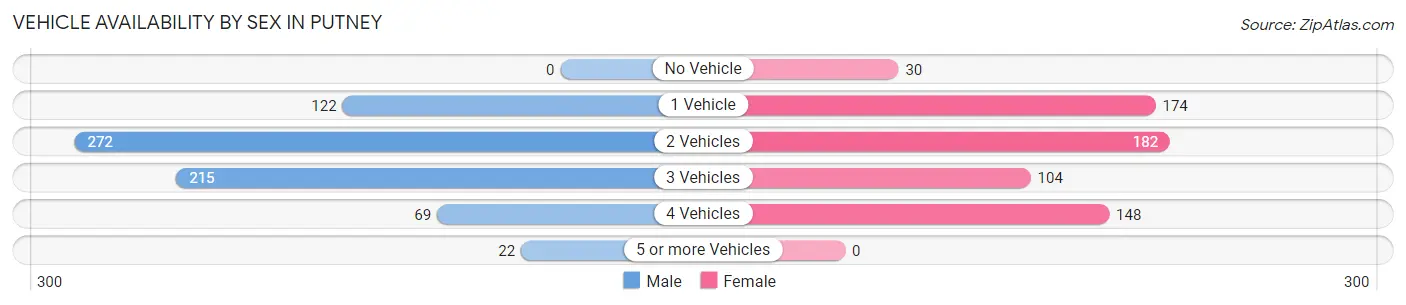
| Vehicles Available | Male | Female |
| No Vehicle | 0 (0.0%) | 30 (4.7%) |
| 1 Vehicle | 122 (17.4%) | 174 (27.3%) |
| 2 Vehicles | 272 (38.9%) | 182 (28.5%) |
| 3 Vehicles | 215 (30.7%) | 104 (16.3%) |
| 4 Vehicles | 69 (9.9%) | 148 (23.2%) |
| 5 or more Vehicles | 22 (3.1%) | 0 (0.0%) |
| Total | 700 (100.0%) | 638 (100.0%) |
Commute Time in Putney
The most frequently occuring commute durations in Putney are 20 to 24 minutes (483 commuters, 36.4%), 10 to 14 minutes (239 commuters, 18.0%), and 15 to 19 minutes (150 commuters, 11.3%).
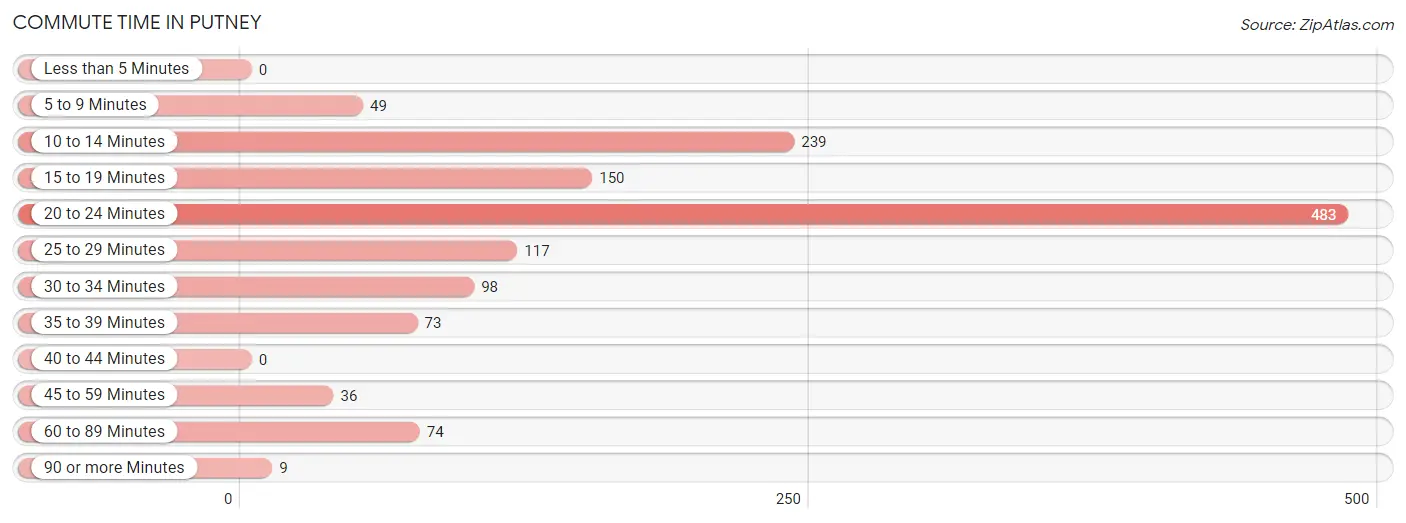
| Commute Time | # Commuters | % Commuters |
| Less than 5 Minutes | 0 | 0.0% |
| 5 to 9 Minutes | 49 | 3.7% |
| 10 to 14 Minutes | 239 | 18.0% |
| 15 to 19 Minutes | 150 | 11.3% |
| 20 to 24 Minutes | 483 | 36.4% |
| 25 to 29 Minutes | 117 | 8.8% |
| 30 to 34 Minutes | 98 | 7.4% |
| 35 to 39 Minutes | 73 | 5.5% |
| 40 to 44 Minutes | 0 | 0.0% |
| 45 to 59 Minutes | 36 | 2.7% |
| 60 to 89 Minutes | 74 | 5.6% |
| 90 or more Minutes | 9 | 0.7% |
Commute Time by Sex in Putney
The most common commute times in Putney are 20 to 24 minutes (286 commuters, 40.9%) for males and 20 to 24 minutes (197 commuters, 31.4%) for females.
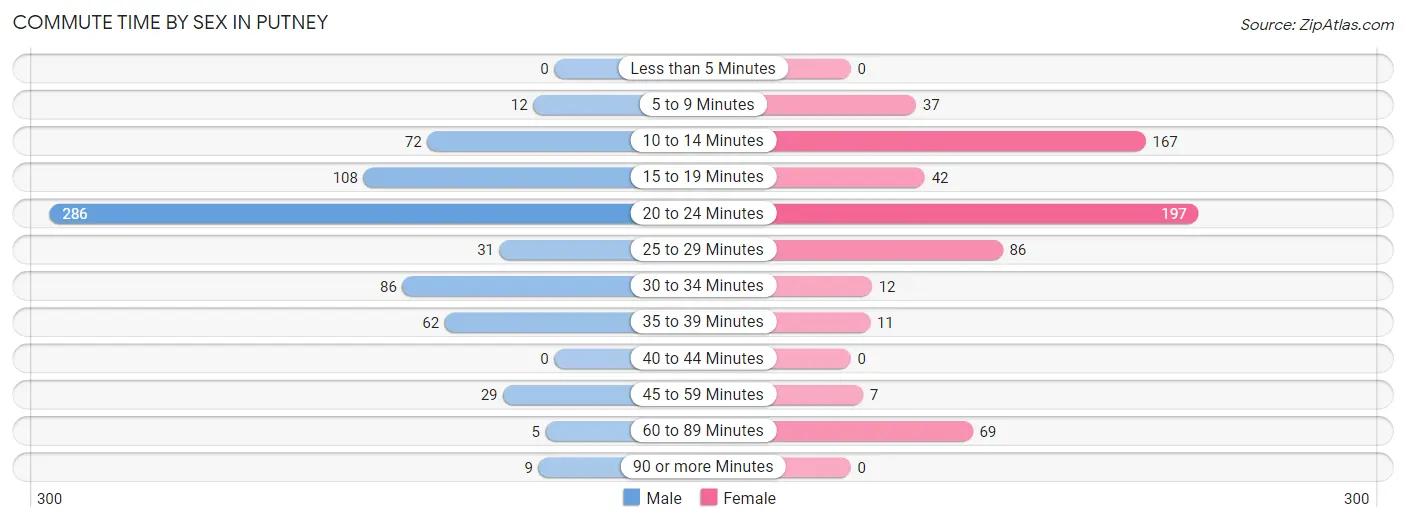
| Commute Time | Male | Female |
| Less than 5 Minutes | 0 (0.0%) | 0 (0.0%) |
| 5 to 9 Minutes | 12 (1.7%) | 37 (5.9%) |
| 10 to 14 Minutes | 72 (10.3%) | 167 (26.6%) |
| 15 to 19 Minutes | 108 (15.4%) | 42 (6.7%) |
| 20 to 24 Minutes | 286 (40.9%) | 197 (31.4%) |
| 25 to 29 Minutes | 31 (4.4%) | 86 (13.7%) |
| 30 to 34 Minutes | 86 (12.3%) | 12 (1.9%) |
| 35 to 39 Minutes | 62 (8.9%) | 11 (1.8%) |
| 40 to 44 Minutes | 0 (0.0%) | 0 (0.0%) |
| 45 to 59 Minutes | 29 (4.1%) | 7 (1.1%) |
| 60 to 89 Minutes | 5 (0.7%) | 69 (11.0%) |
| 90 or more Minutes | 9 (1.3%) | 0 (0.0%) |
Time of Departure to Work by Sex in Putney
The most frequent times of departure to work in Putney are 7:30 AM to 7:59 AM (220, 31.4%) for males and 7:00 AM to 7:29 AM (142, 22.6%) for females.
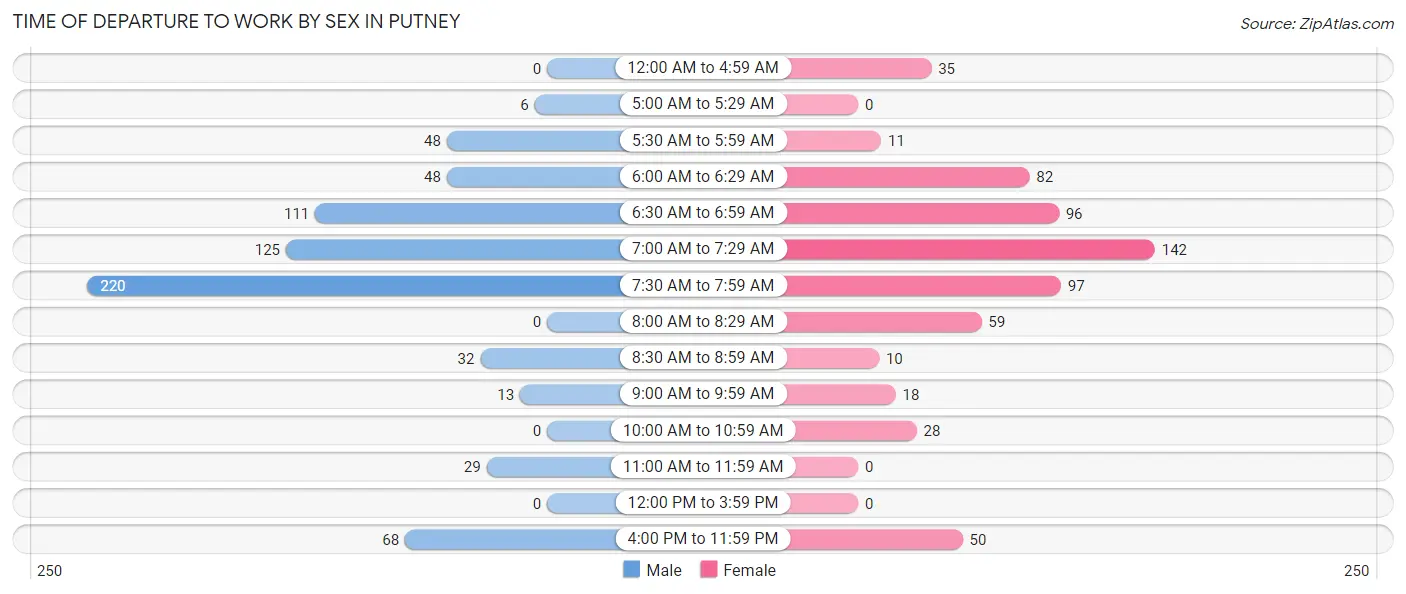
| Time of Departure | Male | Female |
| 12:00 AM to 4:59 AM | 0 (0.0%) | 35 (5.6%) |
| 5:00 AM to 5:29 AM | 6 (0.9%) | 0 (0.0%) |
| 5:30 AM to 5:59 AM | 48 (6.9%) | 11 (1.8%) |
| 6:00 AM to 6:29 AM | 48 (6.9%) | 82 (13.1%) |
| 6:30 AM to 6:59 AM | 111 (15.9%) | 96 (15.3%) |
| 7:00 AM to 7:29 AM | 125 (17.9%) | 142 (22.6%) |
| 7:30 AM to 7:59 AM | 220 (31.4%) | 97 (15.4%) |
| 8:00 AM to 8:29 AM | 0 (0.0%) | 59 (9.4%) |
| 8:30 AM to 8:59 AM | 32 (4.6%) | 10 (1.6%) |
| 9:00 AM to 9:59 AM | 13 (1.9%) | 18 (2.9%) |
| 10:00 AM to 10:59 AM | 0 (0.0%) | 28 (4.5%) |
| 11:00 AM to 11:59 AM | 29 (4.1%) | 0 (0.0%) |
| 12:00 PM to 3:59 PM | 0 (0.0%) | 0 (0.0%) |
| 4:00 PM to 11:59 PM | 68 (9.7%) | 50 (8.0%) |
| Total | 700 (100.0%) | 628 (100.0%) |
Housing Occupancy in Putney
Occupancy by Ownership in Putney
Of the total 1,178 dwellings in Putney, owner-occupied units account for 814 (69.1%), while renter-occupied units make up 364 (30.9%).
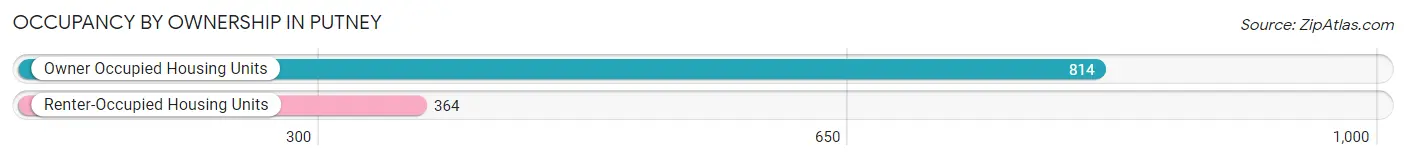
| Occupancy | # Housing Units | % Housing Units |
| Owner Occupied Housing Units | 814 | 69.1% |
| Renter-Occupied Housing Units | 364 | 30.9% |
| Total Occupied Housing Units | 1,178 | 100.0% |
Occupancy by Household Size in Putney
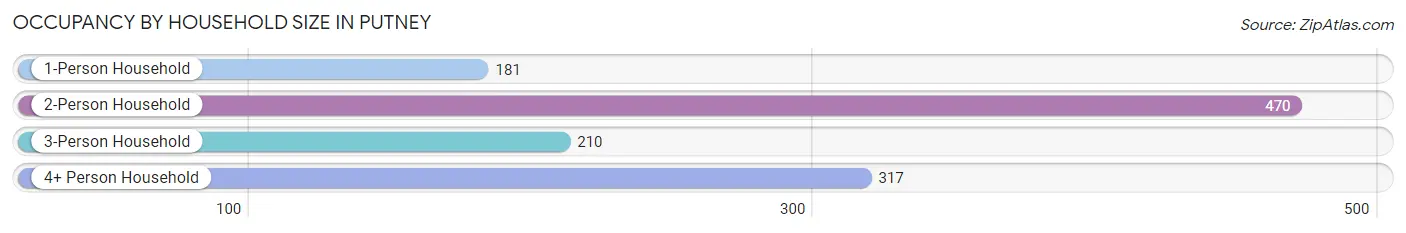
| Household Size | # Housing Units | % Housing Units |
| 1-Person Household | 181 | 15.4% |
| 2-Person Household | 470 | 39.9% |
| 3-Person Household | 210 | 17.8% |
| 4+ Person Household | 317 | 26.9% |
| Total Housing Units | 1,178 | 100.0% |
Occupancy by Ownership by Household Size in Putney
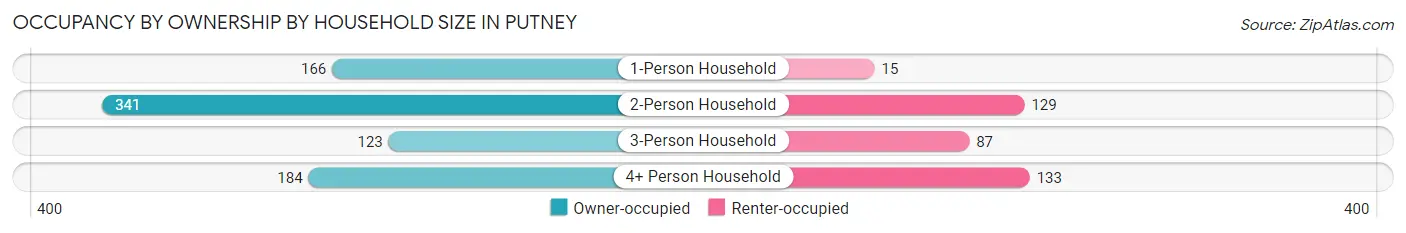
| Household Size | Owner-occupied | Renter-occupied |
| 1-Person Household | 166 (91.7%) | 15 (8.3%) |
| 2-Person Household | 341 (72.6%) | 129 (27.5%) |
| 3-Person Household | 123 (58.6%) | 87 (41.4%) |
| 4+ Person Household | 184 (58.0%) | 133 (42.0%) |
| Total Housing Units | 814 (69.1%) | 364 (30.9%) |
Occupancy by Educational Attainment in Putney
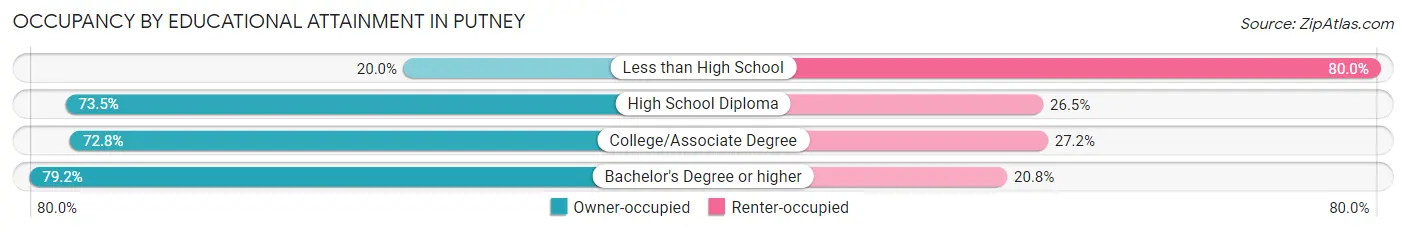
| Household Size | Owner-occupied | Renter-occupied |
| Less than High School | 22 (20.0%) | 88 (80.0%) |
| High School Diploma | 286 (73.5%) | 103 (26.5%) |
| College/Associate Degree | 361 (72.8%) | 135 (27.2%) |
| Bachelor's Degree or higher | 145 (79.2%) | 38 (20.8%) |
Occupancy by Age of Householder in Putney
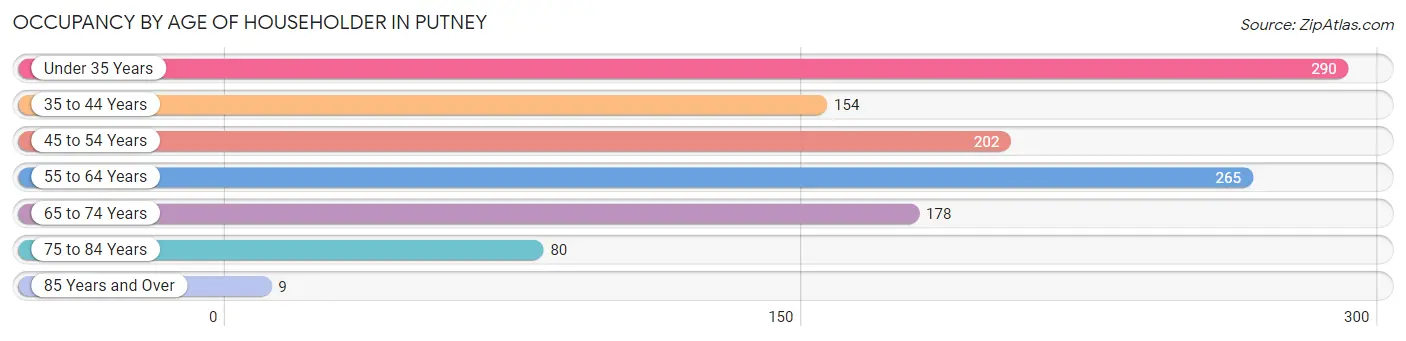
| Age Bracket | # Households | % Households |
| Under 35 Years | 290 | 24.6% |
| 35 to 44 Years | 154 | 13.1% |
| 45 to 54 Years | 202 | 17.2% |
| 55 to 64 Years | 265 | 22.5% |
| 65 to 74 Years | 178 | 15.1% |
| 75 to 84 Years | 80 | 6.8% |
| 85 Years and Over | 9 | 0.8% |
| Total | 1,178 | 100.0% |
Housing Finances in Putney
Median Income by Occupancy in Putney
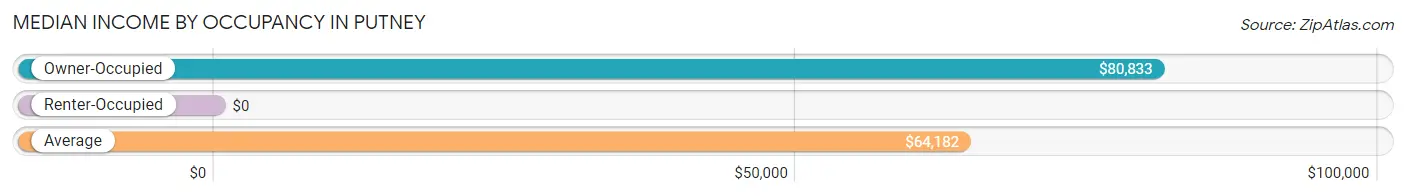
| Occupancy Type | # Households | Median Income |
| Owner-Occupied | 814 (69.1%) | $80,833 |
| Renter-Occupied | 364 (30.9%) | $0 |
| Average | 1,178 (100.0%) | $64,182 |
Occupancy by Householder Income Bracket in Putney
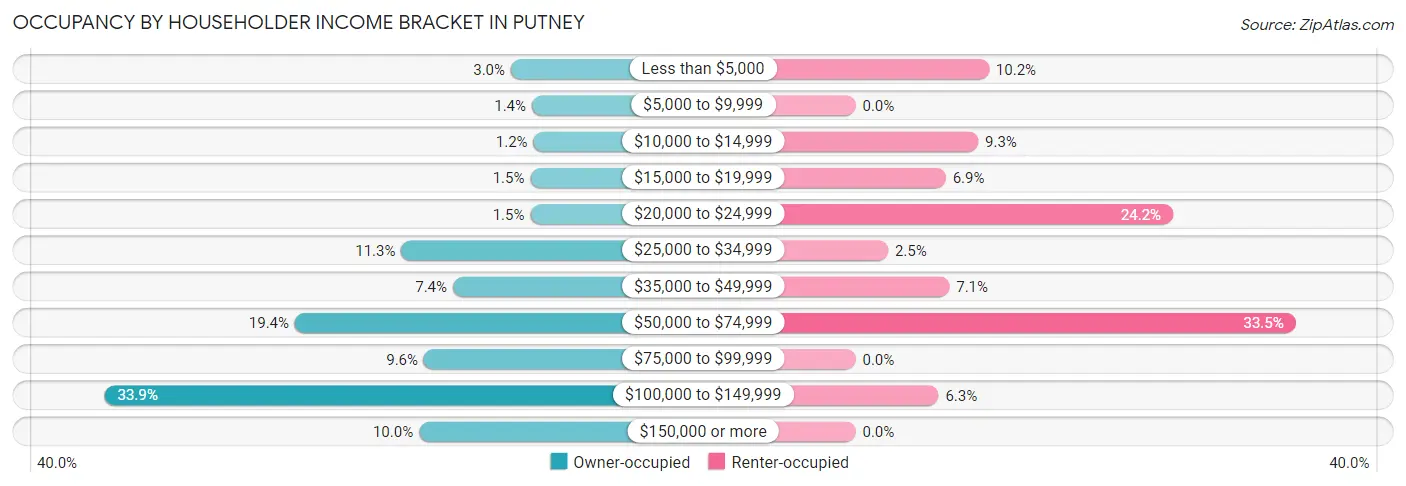
| Income Bracket | Owner-occupied | Renter-occupied |
| Less than $5,000 | 24 (2.9%) | 37 (10.2%) |
| $5,000 to $9,999 | 11 (1.3%) | 0 (0.0%) |
| $10,000 to $14,999 | 10 (1.2%) | 34 (9.3%) |
| $15,000 to $19,999 | 12 (1.5%) | 25 (6.9%) |
| $20,000 to $24,999 | 12 (1.5%) | 88 (24.2%) |
| $25,000 to $34,999 | 92 (11.3%) | 9 (2.5%) |
| $35,000 to $49,999 | 60 (7.4%) | 26 (7.1%) |
| $50,000 to $74,999 | 158 (19.4%) | 122 (33.5%) |
| $75,000 to $99,999 | 78 (9.6%) | 0 (0.0%) |
| $100,000 to $149,999 | 276 (33.9%) | 23 (6.3%) |
| $150,000 or more | 81 (10.0%) | 0 (0.0%) |
| Total | 814 (100.0%) | 364 (100.0%) |
Monthly Housing Cost Tiers in Putney
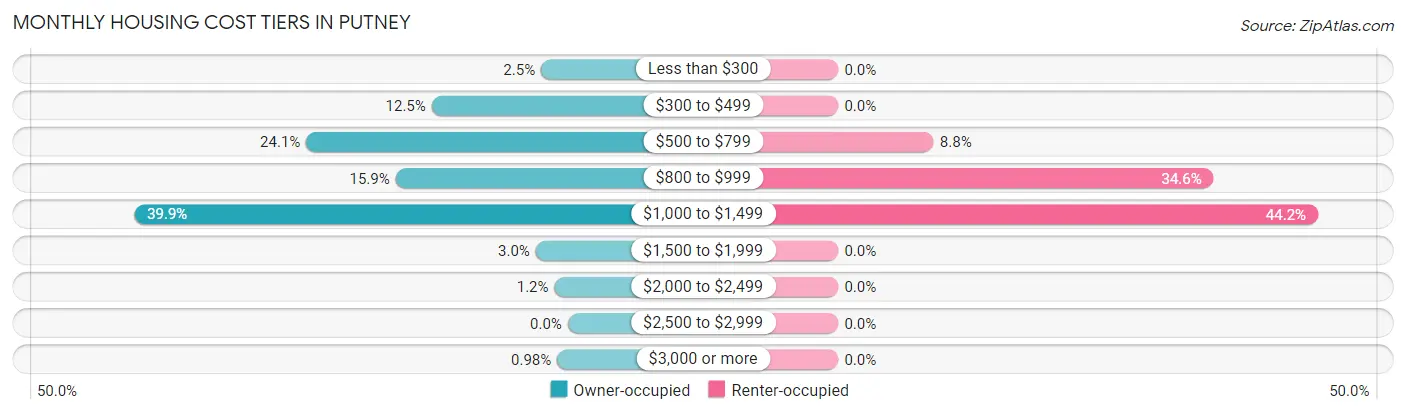
| Monthly Cost | Owner-occupied | Renter-occupied |
| Less than $300 | 20 (2.5%) | 0 (0.0%) |
| $300 to $499 | 102 (12.5%) | 0 (0.0%) |
| $500 to $799 | 196 (24.1%) | 32 (8.8%) |
| $800 to $999 | 129 (15.9%) | 126 (34.6%) |
| $1,000 to $1,499 | 325 (39.9%) | 161 (44.2%) |
| $1,500 to $1,999 | 24 (2.9%) | 0 (0.0%) |
| $2,000 to $2,499 | 10 (1.2%) | 0 (0.0%) |
| $2,500 to $2,999 | 0 (0.0%) | 0 (0.0%) |
| $3,000 or more | 8 (1.0%) | 0 (0.0%) |
| Total | 814 (100.0%) | 364 (100.0%) |
Physical Housing Characteristics in Putney
Housing Structures in Putney
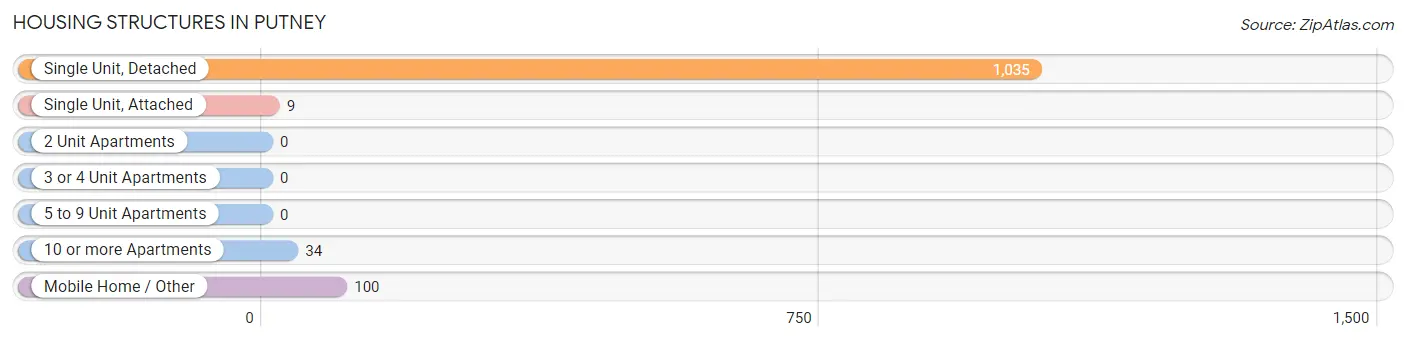
| Structure Type | # Housing Units | % Housing Units |
| Single Unit, Detached | 1,035 | 87.9% |
| Single Unit, Attached | 9 | 0.8% |
| 2 Unit Apartments | 0 | 0.0% |
| 3 or 4 Unit Apartments | 0 | 0.0% |
| 5 to 9 Unit Apartments | 0 | 0.0% |
| 10 or more Apartments | 34 | 2.9% |
| Mobile Home / Other | 100 | 8.5% |
| Total | 1,178 | 100.0% |
Housing Structures by Occupancy in Putney
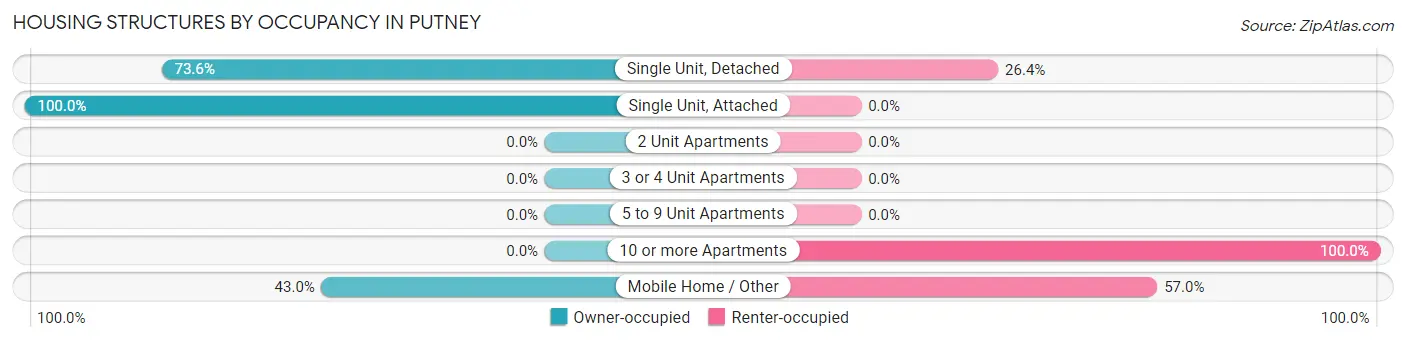
| Structure Type | Owner-occupied | Renter-occupied |
| Single Unit, Detached | 762 (73.6%) | 273 (26.4%) |
| Single Unit, Attached | 9 (100.0%) | 0 (0.0%) |
| 2 Unit Apartments | 0 (0.0%) | 0 (0.0%) |
| 3 or 4 Unit Apartments | 0 (0.0%) | 0 (0.0%) |
| 5 to 9 Unit Apartments | 0 (0.0%) | 0 (0.0%) |
| 10 or more Apartments | 0 (0.0%) | 34 (100.0%) |
| Mobile Home / Other | 43 (43.0%) | 57 (57.0%) |
| Total | 814 (69.1%) | 364 (30.9%) |
Housing Structures by Number of Rooms in Putney
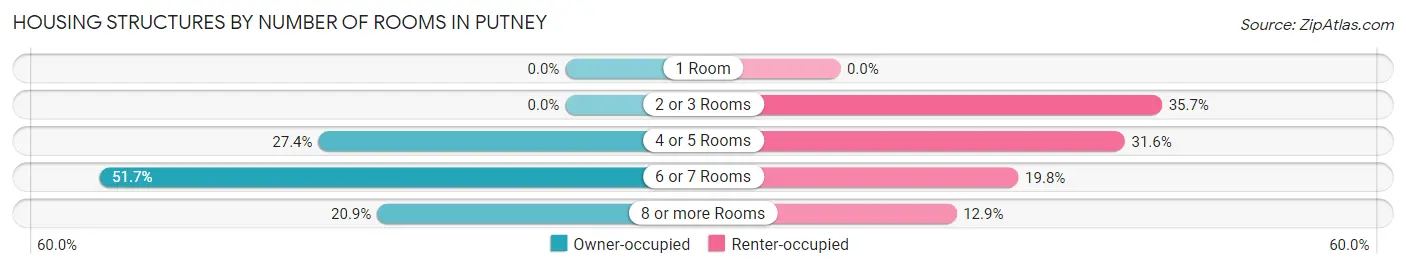
| Number of Rooms | Owner-occupied | Renter-occupied |
| 1 Room | 0 (0.0%) | 0 (0.0%) |
| 2 or 3 Rooms | 0 (0.0%) | 130 (35.7%) |
| 4 or 5 Rooms | 223 (27.4%) | 115 (31.6%) |
| 6 or 7 Rooms | 421 (51.7%) | 72 (19.8%) |
| 8 or more Rooms | 170 (20.9%) | 47 (12.9%) |
| Total | 814 (100.0%) | 364 (100.0%) |
Housing Structure by Heating Type in Putney
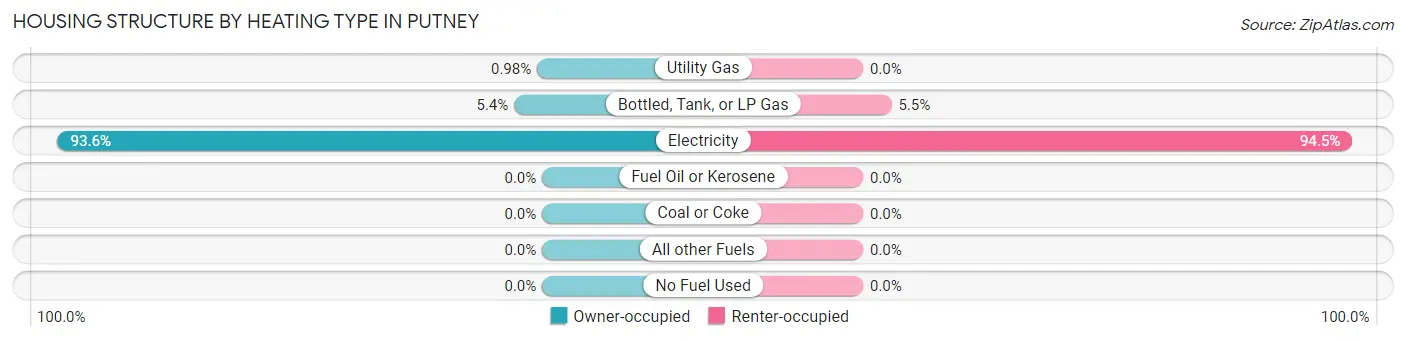
| Heating Type | Owner-occupied | Renter-occupied |
| Utility Gas | 8 (1.0%) | 0 (0.0%) |
| Bottled, Tank, or LP Gas | 44 (5.4%) | 20 (5.5%) |
| Electricity | 762 (93.6%) | 344 (94.5%) |
| Fuel Oil or Kerosene | 0 (0.0%) | 0 (0.0%) |
| Coal or Coke | 0 (0.0%) | 0 (0.0%) |
| All other Fuels | 0 (0.0%) | 0 (0.0%) |
| No Fuel Used | 0 (0.0%) | 0 (0.0%) |
| Total | 814 (100.0%) | 364 (100.0%) |
Household Vehicle Usage in Putney
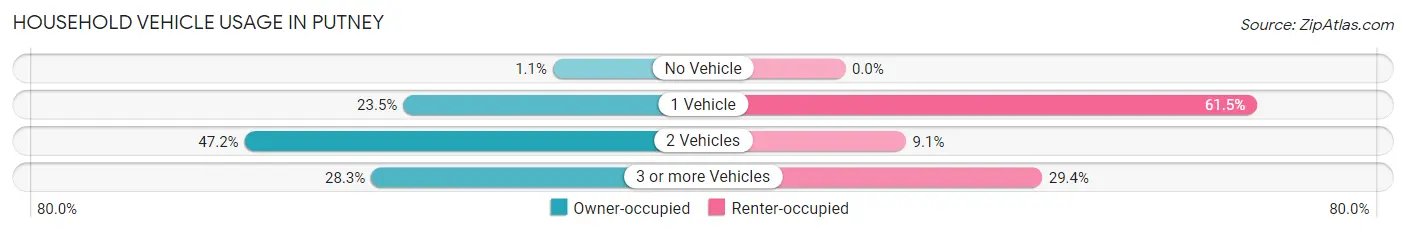
| Vehicles per Household | Owner-occupied | Renter-occupied |
| No Vehicle | 9 (1.1%) | 0 (0.0%) |
| 1 Vehicle | 191 (23.5%) | 224 (61.5%) |
| 2 Vehicles | 384 (47.2%) | 33 (9.1%) |
| 3 or more Vehicles | 230 (28.3%) | 107 (29.4%) |
| Total | 814 (100.0%) | 364 (100.0%) |
Real Estate & Mortgages in Putney
Real Estate and Mortgage Overview in Putney
| Characteristic | Without Mortgage | With Mortgage |
| Housing Units | 261 | 553 |
| Median Property Value | $127,900 | $121,500 |
| Median Household Income | - | - |
| Monthly Housing Costs | $510 | $8 |
| Real Estate Taxes | $1,543 | $29 |
Property Value by Mortgage Status in Putney
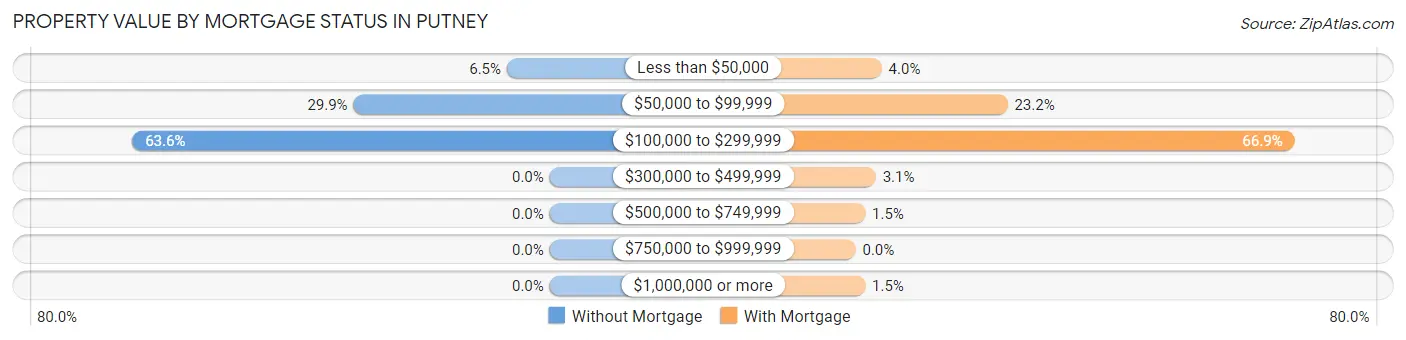
| Property Value | Without Mortgage | With Mortgage |
| Less than $50,000 | 17 (6.5%) | 22 (4.0%) |
| $50,000 to $99,999 | 78 (29.9%) | 128 (23.2%) |
| $100,000 to $299,999 | 166 (63.6%) | 370 (66.9%) |
| $300,000 to $499,999 | 0 (0.0%) | 17 (3.1%) |
| $500,000 to $749,999 | 0 (0.0%) | 8 (1.5%) |
| $750,000 to $999,999 | 0 (0.0%) | 0 (0.0%) |
| $1,000,000 or more | 0 (0.0%) | 8 (1.5%) |
| Total | 261 (100.0%) | 553 (100.0%) |
Household Income by Mortgage Status in Putney
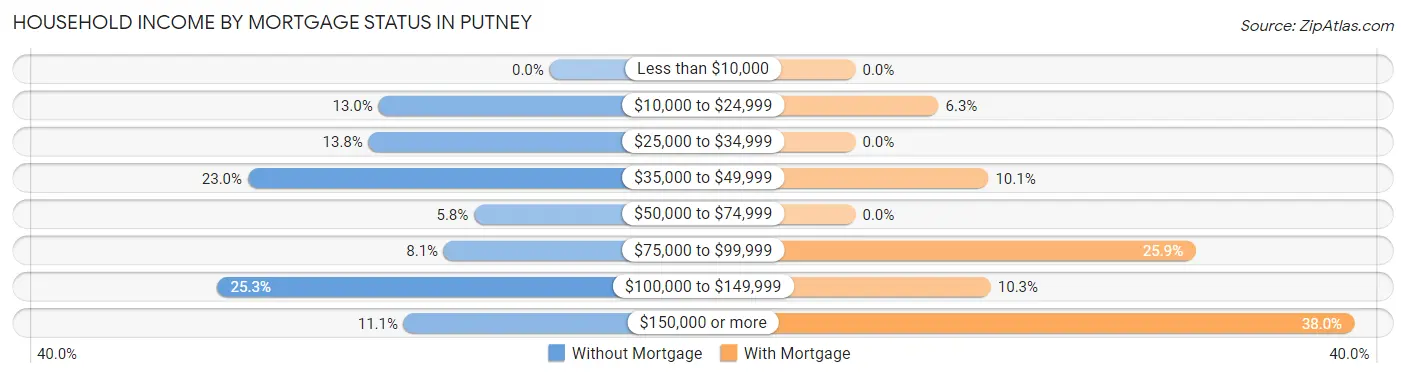
| Household Income | Without Mortgage | With Mortgage |
| Less than $10,000 | 0 (0.0%) | 0 (0.0%) |
| $10,000 to $24,999 | 34 (13.0%) | 35 (6.3%) |
| $25,000 to $34,999 | 36 (13.8%) | 0 (0.0%) |
| $35,000 to $49,999 | 60 (23.0%) | 56 (10.1%) |
| $50,000 to $74,999 | 15 (5.8%) | 0 (0.0%) |
| $75,000 to $99,999 | 21 (8.1%) | 143 (25.9%) |
| $100,000 to $149,999 | 66 (25.3%) | 57 (10.3%) |
| $150,000 or more | 29 (11.1%) | 210 (38.0%) |
| Total | 261 (100.0%) | 553 (100.0%) |
Property Value to Household Income Ratio in Putney
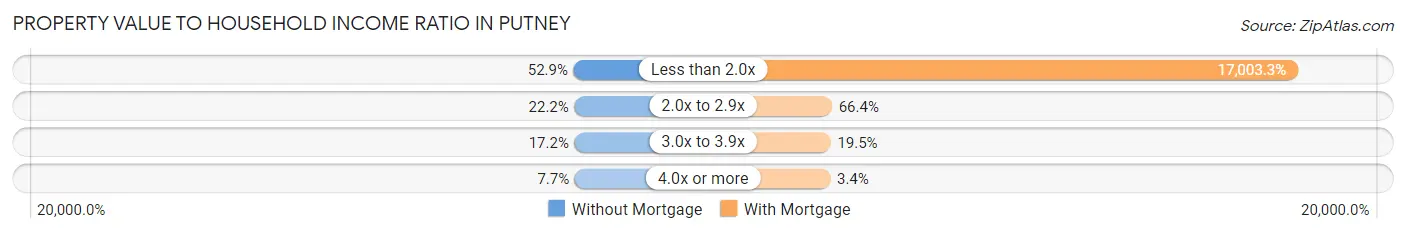
| Value-to-Income Ratio | Without Mortgage | With Mortgage |
| Less than 2.0x | 138 (52.9%) | 94,028 (17,003.2%) |
| 2.0x to 2.9x | 58 (22.2%) | 367 (66.4%) |
| 3.0x to 3.9x | 45 (17.2%) | 108 (19.5%) |
| 4.0x or more | 20 (7.7%) | 19 (3.4%) |
| Total | 261 (100.0%) | 553 (100.0%) |
Real Estate Taxes by Mortgage Status in Putney
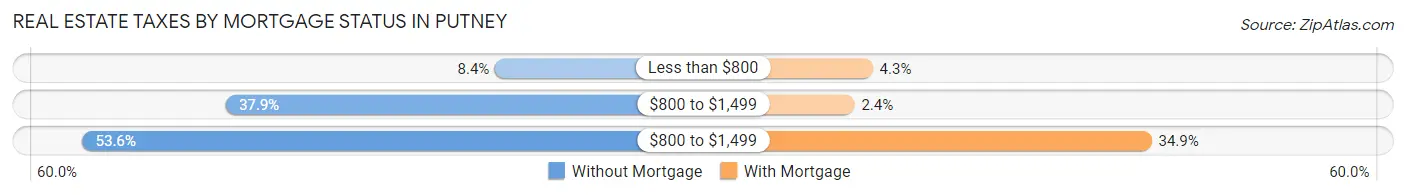
| Property Taxes | Without Mortgage | With Mortgage |
| Less than $800 | 22 (8.4%) | 24 (4.3%) |
| $800 to $1,499 | 99 (37.9%) | 13 (2.4%) |
| $800 to $1,499 | 140 (53.6%) | 193 (34.9%) |
| Total | 261 (100.0%) | 553 (100.0%) |
Health & Disability in Putney
Health Insurance Coverage by Age in Putney
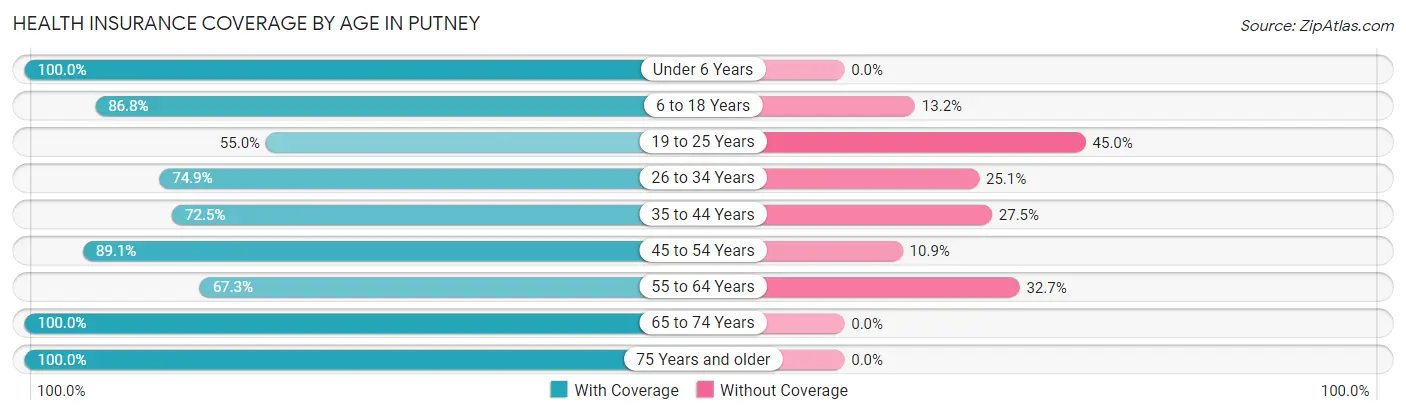
| Age Bracket | With Coverage | Without Coverage |
| Under 6 Years | 311 (100.0%) | 0 (0.0%) |
| 6 to 18 Years | 389 (86.8%) | 59 (13.2%) |
| 19 to 25 Years | 198 (55.0%) | 162 (45.0%) |
| 26 to 34 Years | 283 (74.9%) | 95 (25.1%) |
| 35 to 44 Years | 316 (72.5%) | 120 (27.5%) |
| 45 to 54 Years | 385 (89.1%) | 47 (10.9%) |
| 55 to 64 Years | 338 (67.3%) | 164 (32.7%) |
| 65 to 74 Years | 283 (100.0%) | 0 (0.0%) |
| 75 Years and older | 145 (100.0%) | 0 (0.0%) |
| Total | 2,648 (80.4%) | 647 (19.6%) |
Health Insurance Coverage by Citizenship Status in Putney
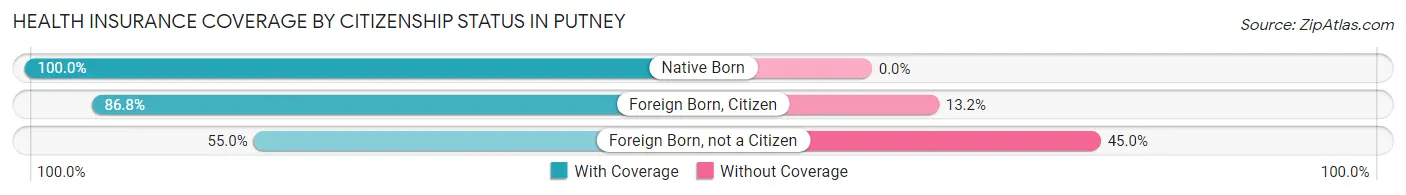
| Citizenship Status | With Coverage | Without Coverage |
| Native Born | 311 (100.0%) | 0 (0.0%) |
| Foreign Born, Citizen | 389 (86.8%) | 59 (13.2%) |
| Foreign Born, not a Citizen | 198 (55.0%) | 162 (45.0%) |
Health Insurance Coverage by Household Income in Putney
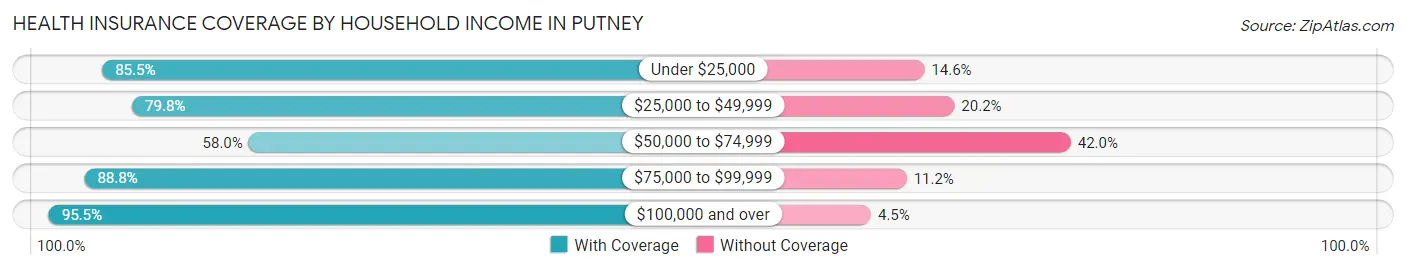
| Household Income | With Coverage | Without Coverage |
| Under $25,000 | 517 (85.5%) | 88 (14.5%) |
| $25,000 to $49,999 | 297 (79.8%) | 75 (20.2%) |
| $50,000 to $74,999 | 567 (58.0%) | 410 (42.0%) |
| $75,000 to $99,999 | 174 (88.8%) | 22 (11.2%) |
| $100,000 and over | 1,093 (95.5%) | 52 (4.5%) |
Public vs Private Health Insurance Coverage by Age in Putney
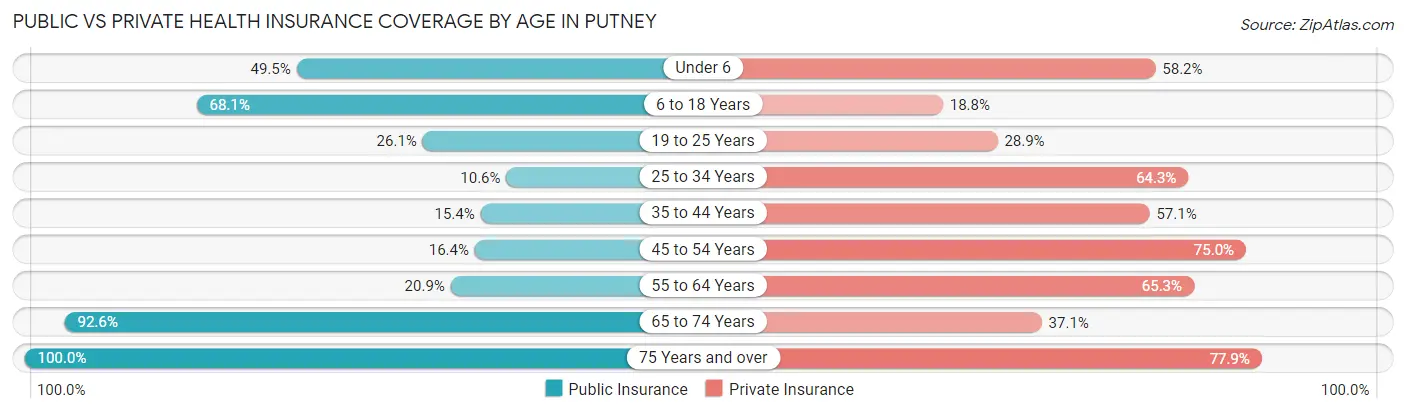
| Age Bracket | Public Insurance | Private Insurance |
| Under 6 | 154 (49.5%) | 181 (58.2%) |
| 6 to 18 Years | 305 (68.1%) | 84 (18.8%) |
| 19 to 25 Years | 94 (26.1%) | 104 (28.9%) |
| 25 to 34 Years | 40 (10.6%) | 243 (64.3%) |
| 35 to 44 Years | 67 (15.4%) | 249 (57.1%) |
| 45 to 54 Years | 71 (16.4%) | 324 (75.0%) |
| 55 to 64 Years | 105 (20.9%) | 328 (65.3%) |
| 65 to 74 Years | 262 (92.6%) | 105 (37.1%) |
| 75 Years and over | 145 (100.0%) | 113 (77.9%) |
| Total | 1,243 (37.7%) | 1,731 (52.5%) |
Disability Status by Sex by Age in Putney
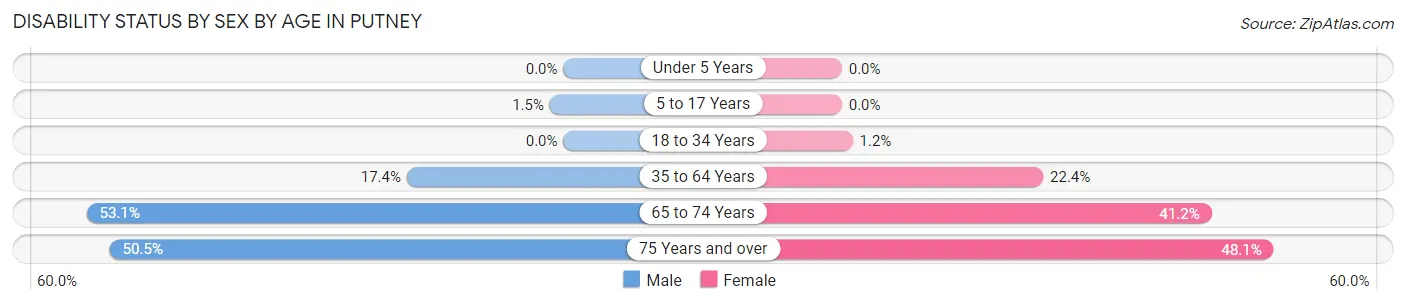
| Age Bracket | Male | Female |
| Under 5 Years | 0 (0.0%) | 0 (0.0%) |
| 5 to 17 Years | 3 (1.5%) | 0 (0.0%) |
| 18 to 34 Years | 0 (0.0%) | 5 (1.2%) |
| 35 to 64 Years | 102 (17.4%) | 176 (22.4%) |
| 65 to 74 Years | 60 (53.1%) | 70 (41.2%) |
| 75 Years and over | 47 (50.5%) | 25 (48.1%) |
Disability Class by Sex by Age in Putney
Disability Class: Hearing Difficulty
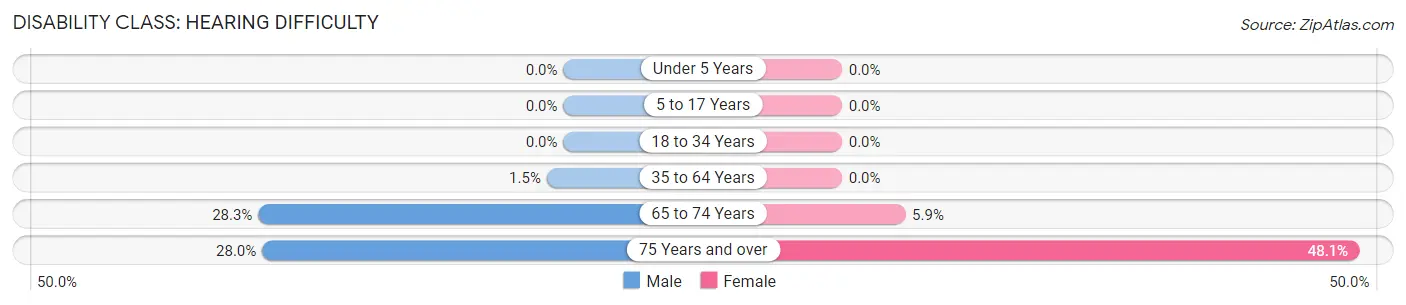
| Age Bracket | Male | Female |
| Under 5 Years | 0 (0.0%) | 0 (0.0%) |
| 5 to 17 Years | 0 (0.0%) | 0 (0.0%) |
| 18 to 34 Years | 0 (0.0%) | 0 (0.0%) |
| 35 to 64 Years | 9 (1.5%) | 0 (0.0%) |
| 65 to 74 Years | 32 (28.3%) | 10 (5.9%) |
| 75 Years and over | 26 (28.0%) | 25 (48.1%) |
Disability Class: Vision Difficulty
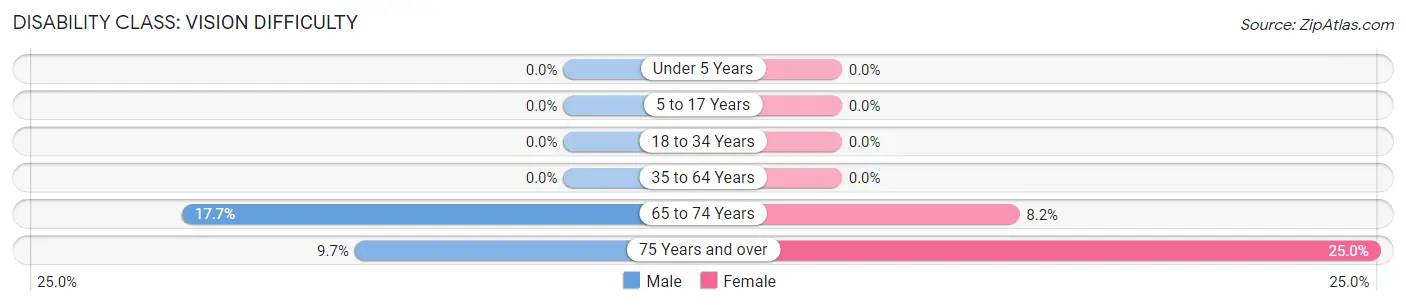
| Age Bracket | Male | Female |
| Under 5 Years | 0 (0.0%) | 0 (0.0%) |
| 5 to 17 Years | 0 (0.0%) | 0 (0.0%) |
| 18 to 34 Years | 0 (0.0%) | 0 (0.0%) |
| 35 to 64 Years | 0 (0.0%) | 0 (0.0%) |
| 65 to 74 Years | 20 (17.7%) | 14 (8.2%) |
| 75 Years and over | 9 (9.7%) | 13 (25.0%) |
Disability Class: Cognitive Difficulty
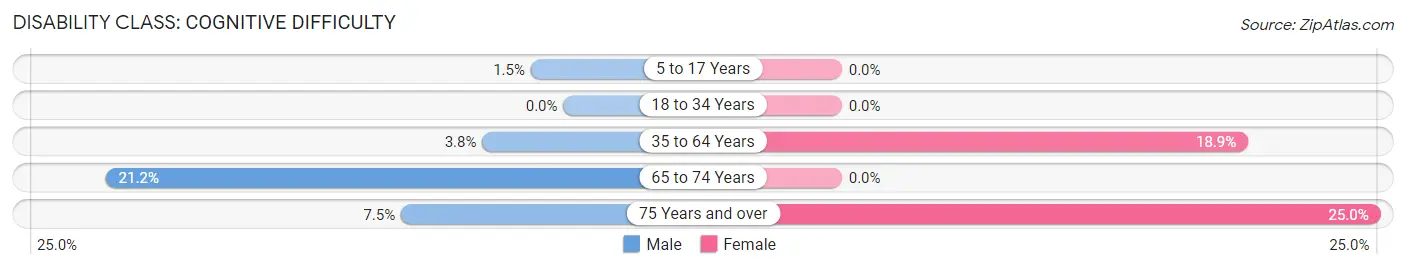
| Age Bracket | Male | Female |
| 5 to 17 Years | 3 (1.5%) | 0 (0.0%) |
| 18 to 34 Years | 0 (0.0%) | 0 (0.0%) |
| 35 to 64 Years | 22 (3.8%) | 148 (18.9%) |
| 65 to 74 Years | 24 (21.2%) | 0 (0.0%) |
| 75 Years and over | 7 (7.5%) | 13 (25.0%) |
Disability Class: Ambulatory Difficulty
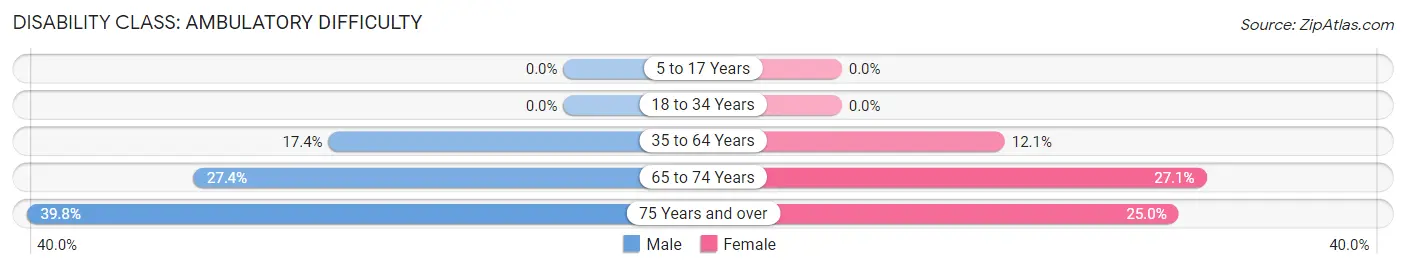
| Age Bracket | Male | Female |
| 5 to 17 Years | 0 (0.0%) | 0 (0.0%) |
| 18 to 34 Years | 0 (0.0%) | 0 (0.0%) |
| 35 to 64 Years | 102 (17.4%) | 95 (12.1%) |
| 65 to 74 Years | 31 (27.4%) | 46 (27.1%) |
| 75 Years and over | 37 (39.8%) | 13 (25.0%) |
Disability Class: Self-Care Difficulty
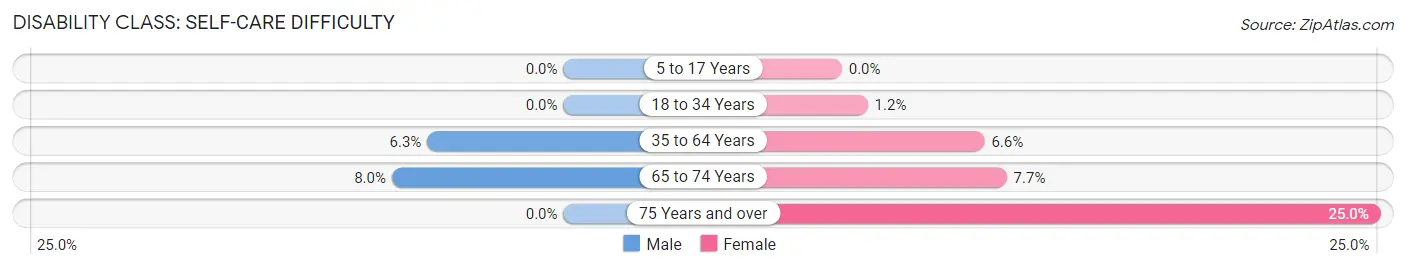
| Age Bracket | Male | Female |
| 5 to 17 Years | 0 (0.0%) | 0 (0.0%) |
| 18 to 34 Years | 0 (0.0%) | 5 (1.2%) |
| 35 to 64 Years | 37 (6.3%) | 52 (6.6%) |
| 65 to 74 Years | 9 (8.0%) | 13 (7.6%) |
| 75 Years and over | 0 (0.0%) | 13 (25.0%) |
Technology Access in Putney
Computing Device Access in Putney
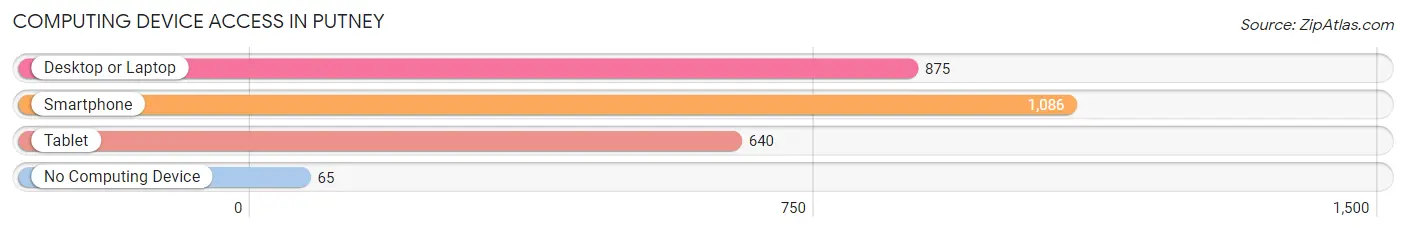
| Device Type | # Households | % Households |
| Desktop or Laptop | 875 | 74.3% |
| Smartphone | 1,086 | 92.2% |
| Tablet | 640 | 54.3% |
| No Computing Device | 65 | 5.5% |
| Total | 1,178 | 100.0% |
Internet Access in Putney
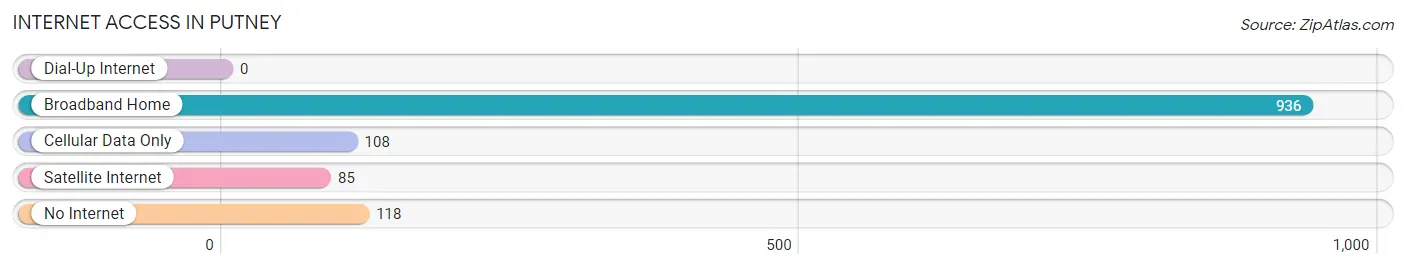
| Internet Type | # Households | % Households |
| Dial-Up Internet | 0 | 0.0% |
| Broadband Home | 936 | 79.5% |
| Cellular Data Only | 108 | 9.2% |
| Satellite Internet | 85 | 7.2% |
| No Internet | 118 | 10.0% |
| Total | 1,178 | 100.0% |
Putney Summary
Introduction
Putney, Georgia is a small town located in the southeastern corner of the state. It is situated in the foothills of the Appalachian Mountains and is part of the Chattahoochee National Forest. Putney is a rural community with a population of just over 1,000 people. The town is known for its scenic beauty and its close proximity to the Chattahoochee River. Putney is a great place to live and work, and it has a rich history and culture that make it a unique and special place.
History
Putney was founded in 1820 by a group of settlers from North Carolina. The town was named after a nearby creek, which was named after a local Native American chief. The town was originally a farming community, and it was home to a variety of crops, including cotton, corn, and tobacco. In the late 1800s, the town began to grow and develop, and it became a popular destination for tourists.
In the early 1900s, Putney was a thriving community with a variety of businesses, including a hotel, a general store, and a sawmill. The town also had a post office, a bank, and a school. In the 1920s, the town began to decline, and many of the businesses closed. In the 1940s, the town was revitalized when the U.S. Army Corps of Engineers built a dam on the Chattahoochee River, creating Lake Lanier. This brought new life to the town, and it became a popular destination for fishing and boating.
Geography
Putney is located in the southeastern corner of Georgia, in the foothills of the Appalachian Mountains. The town is situated on the banks of the Chattahoochee River, and it is surrounded by the Chattahoochee National Forest. The town is located about 30 miles north of Atlanta, and it is close to the cities of Gainesville and Dahlonega. The town is also close to the Blue Ridge Mountains, which offer a variety of outdoor activities, including hiking, camping, and fishing.
Economy
Putney’s economy is largely based on tourism. The town is a popular destination for fishing and boating on Lake Lanier, and it is also a popular destination for hikers and campers in the nearby Chattahoochee National Forest. The town also has a variety of small businesses, including restaurants, shops, and lodging.
Demographics
As of the 2010 census, Putney had a population of 1,072 people. The town is predominantly white, with a small African American population. The median household income is $37,500, and the median home value is $125,000. The town has a low unemployment rate of 4.2%.
Conclusion
Putney, Georgia is a small town located in the southeastern corner of the state. It is situated in the foothills of the Appalachian Mountains and is part of the Chattahoochee National Forest. Putney is a rural community with a population of just over 1,000 people. The town is known for its scenic beauty and its close proximity to the Chattahoochee River. Putney is a great place to live and work, and it has a rich history and culture that make it a unique and special place. The town’s economy is largely based on tourism, and it is a popular destination for fishing and boating on Lake Lanier, as well as for hikers and campers in the nearby Chattahoochee National Forest. Putney is a predominantly white town, with a small African American population. The median household income is $37,500, and the median home value is $125,000. The town has a low unemployment rate of 4.2%. Putney is a great place to live and work, and it is a great example of a small town with a rich history and culture.
Common Questions
What is Per Capita Income in Putney?
Per Capita income in Putney is $29,662.
What is the Median Family Income in Putney?
Median Family Income in Putney is $80,625.
What is the Median Household income in Putney?
Median Household Income in Putney is $64,182.
What is Income or Wage Gap in Putney?
Income or Wage Gap in Putney is 18.0%.
Women in Putney earn 82.0 cents for every dollar earned by a man.
What is Inequality or Gini Index in Putney?
Inequality or Gini Index in Putney is 0.45.
What is the Total Population of Putney?
Total Population of Putney is 3,295.
What is the Total Male Population of Putney?
Total Male Population of Putney is 1,490.
What is the Total Female Population of Putney?
Total Female Population of Putney is 1,805.
What is the Ratio of Males per 100 Females in Putney?
There are 82.55 Males per 100 Females in Putney.
What is the Ratio of Females per 100 Males in Putney?
There are 121.14 Females per 100 Males in Putney.
What is the Median Population Age in Putney?
Median Population Age in Putney is 39.5 Years.
What is the Average Family Size in Putney
Average Family Size in Putney is 3.1 People.
What is the Average Household Size in Putney
Average Household Size in Putney is 2.8 People.
How Large is the Labor Force in Putney?
There are 1,633 People in the Labor Forcein in Putney.
What is the Percentage of People in the Labor Force in Putney?
61.6% of People are in the Labor Force in Putney.
What is the Unemployment Rate in Putney?
Unemployment Rate in Putney is 15.6%.