Lone Oak, GA Map & Demographics
Lone Oak Map
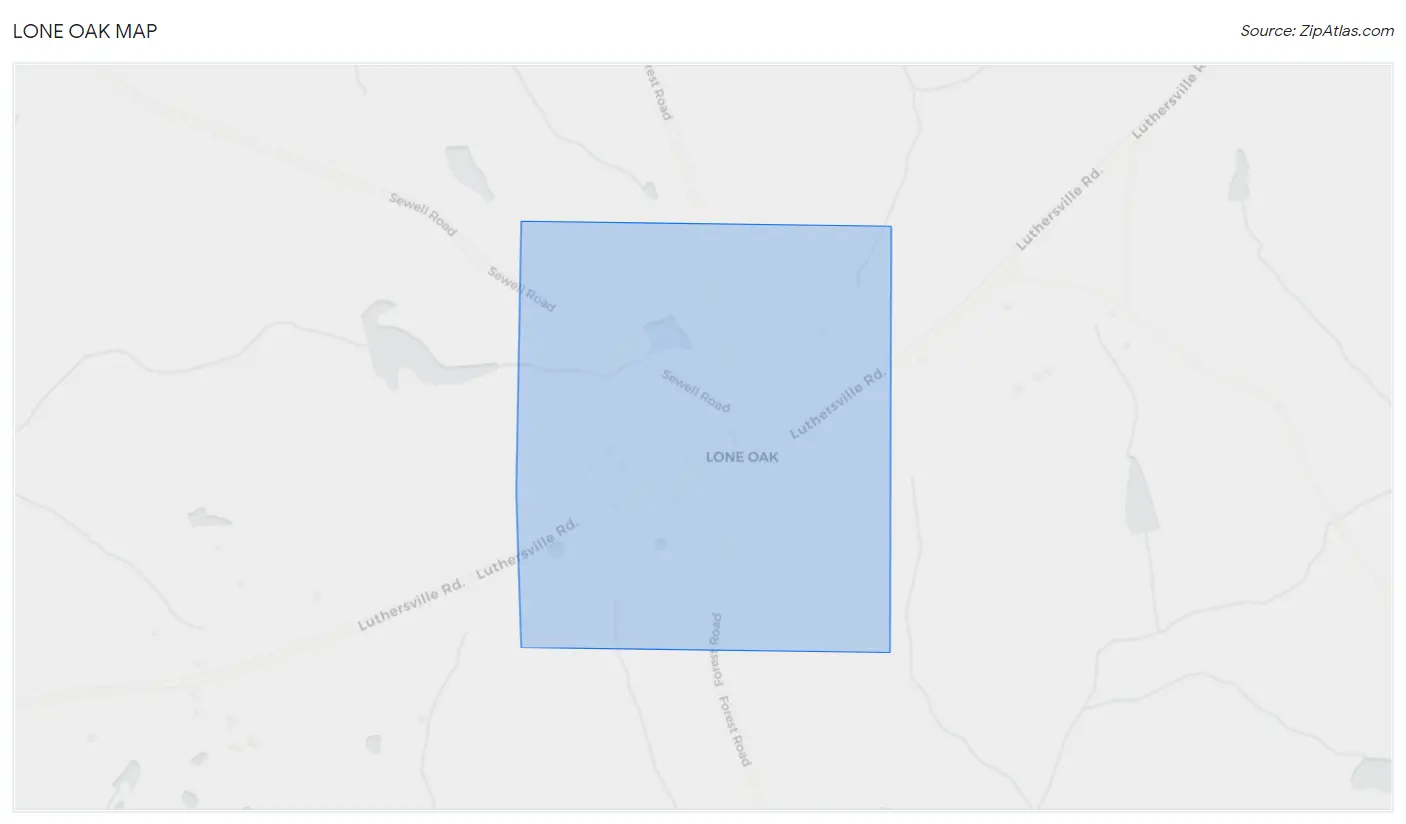
Lone Oak Overview
$19,069
PER CAPITA INCOME
43.0%
WAGE / INCOME GAP [ % ]
57.0¢/ $1
WAGE / INCOME GAP [ $ ]
0.35
INEQUALITY / GINI INDEX
182
TOTAL POPULATION
61
MALE POPULATION
121
FEMALE POPULATION
50.41
MALES / 100 FEMALES
198.36
FEMALES / 100 MALES
32.7
MEDIAN AGE
3.7
AVG FAMILY SIZE
3.6
AVG HOUSEHOLD SIZE
35
LABOR FORCE [ PEOPLE ]
28.0%
PERCENT IN LABOR FORCE
Income in Lone Oak
Income Overview in Lone Oak
| Characteristic | Number | Measure |
| Per Capita Income | 182 | $19,069 |
| Median Family Income | 48 | $0 |
| Mean Family Income | 48 | $74,842 |
| Median Household Income | 51 | $0 |
| Mean Household Income | 51 | $72,061 |
| Income Deficit | 48 | $0 |
| Wage / Income Gap (%) | 182 | 42.98% |
| Wage / Income Gap ($) | 182 | 57.02¢ per $1 |
| Gini / Inequality Index | 182 | 0.35 |
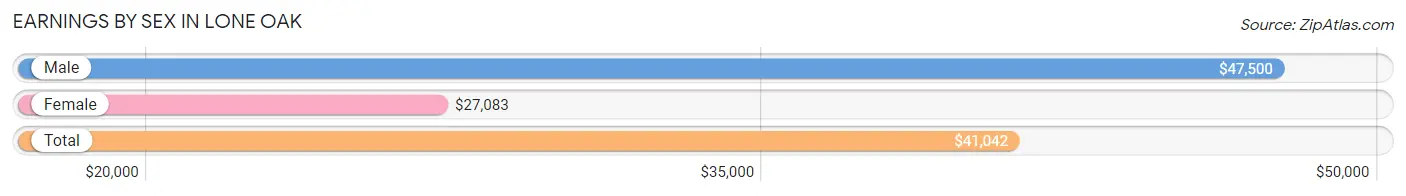
Earnings by Sex in Lone Oak
Average Earnings in Lone Oak are $41,042, $47,500 for men and $27,083 for women, a difference of 43.0%.
| Sex | Number | Average Earnings |
| Male | 22 (51.2%) | $47,500 |
| Female | 21 (48.8%) | $27,083 |
| Total | 43 (100.0%) | $41,042 |
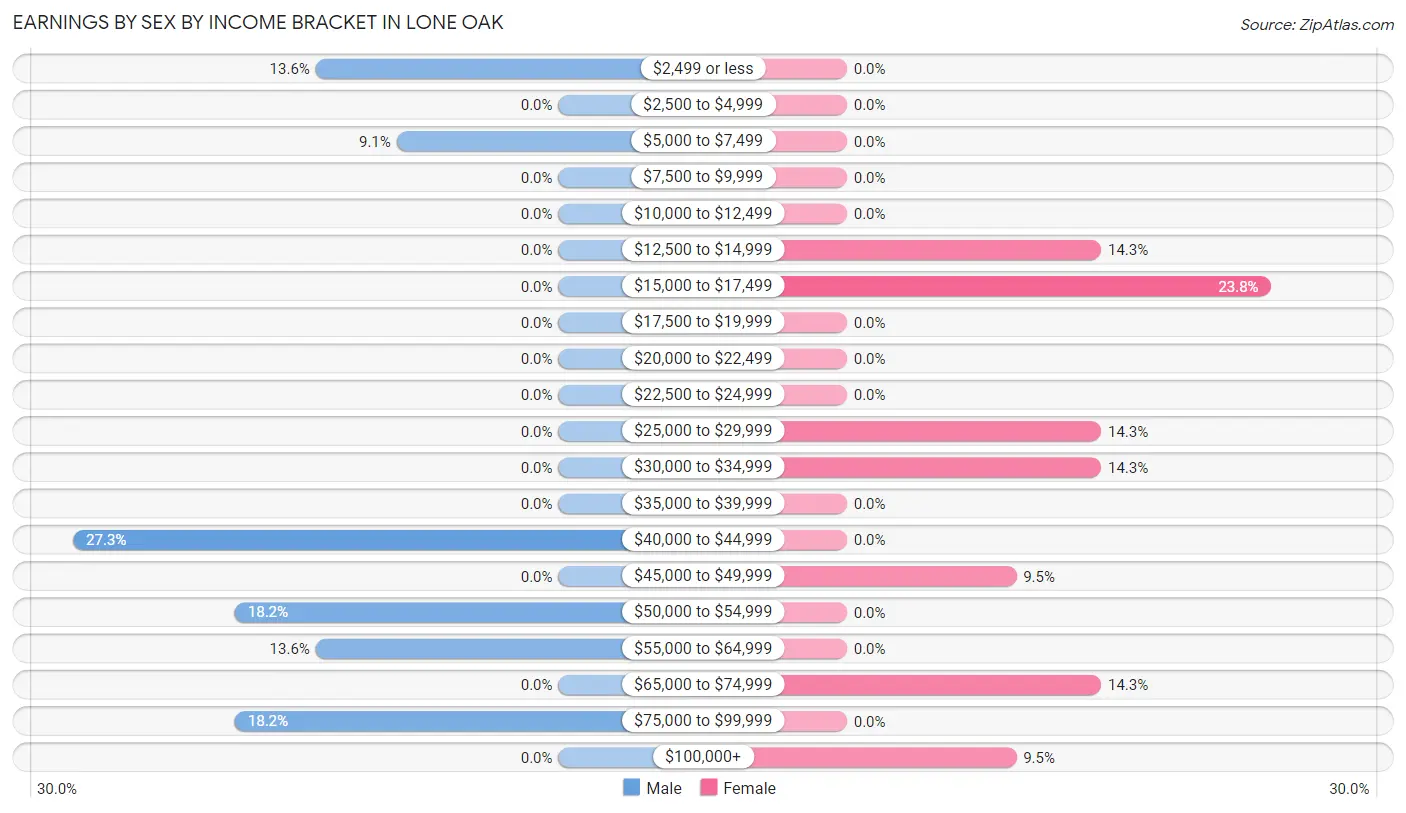
Earnings by Sex by Income Bracket in Lone Oak
The most common earnings brackets in Lone Oak are $40,000 to $44,999 for men (6 | 27.3%) and $15,000 to $17,499 for women (5 | 23.8%).
| Income | Male | Female |
| $2,499 or less | 3 (13.6%) | 0 (0.0%) |
| $2,500 to $4,999 | 0 (0.0%) | 0 (0.0%) |
| $5,000 to $7,499 | 2 (9.1%) | 0 (0.0%) |
| $7,500 to $9,999 | 0 (0.0%) | 0 (0.0%) |
| $10,000 to $12,499 | 0 (0.0%) | 0 (0.0%) |
| $12,500 to $14,999 | 0 (0.0%) | 3 (14.3%) |
| $15,000 to $17,499 | 0 (0.0%) | 5 (23.8%) |
| $17,500 to $19,999 | 0 (0.0%) | 0 (0.0%) |
| $20,000 to $22,499 | 0 (0.0%) | 0 (0.0%) |
| $22,500 to $24,999 | 0 (0.0%) | 0 (0.0%) |
| $25,000 to $29,999 | 0 (0.0%) | 3 (14.3%) |
| $30,000 to $34,999 | 0 (0.0%) | 3 (14.3%) |
| $35,000 to $39,999 | 0 (0.0%) | 0 (0.0%) |
| $40,000 to $44,999 | 6 (27.3%) | 0 (0.0%) |
| $45,000 to $49,999 | 0 (0.0%) | 2 (9.5%) |
| $50,000 to $54,999 | 4 (18.2%) | 0 (0.0%) |
| $55,000 to $64,999 | 3 (13.6%) | 0 (0.0%) |
| $65,000 to $74,999 | 0 (0.0%) | 3 (14.3%) |
| $75,000 to $99,999 | 4 (18.2%) | 0 (0.0%) |
| $100,000+ | 0 (0.0%) | 2 (9.5%) |
| Total | 22 (100.0%) | 21 (100.0%) |
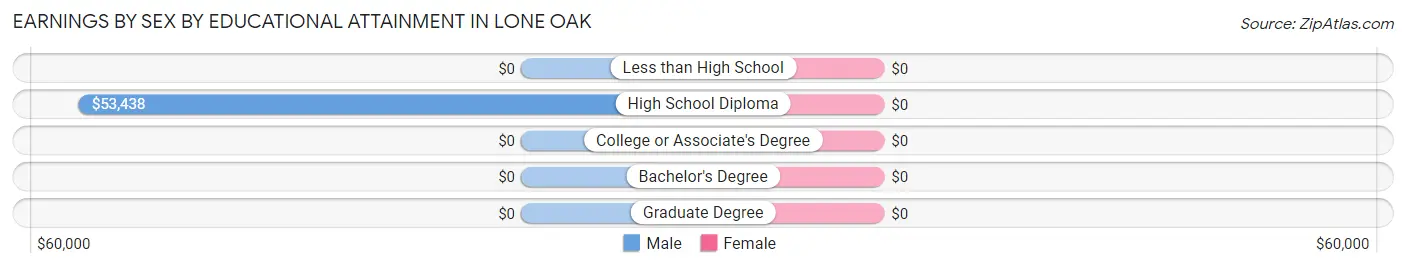
Earnings by Sex by Educational Attainment in Lone Oak
| Educational Attainment | Male Income | Female Income |
| Less than High School | - | - |
| High School Diploma | $53,438 | $0 |
| College or Associate's Degree | - | - |
| Bachelor's Degree | - | - |
| Graduate Degree | - | - |
| Total | $47,500 | $0 |
Family Income in Lone Oak
Family Income Brackets in Lone Oak
According to the Lone Oak family income data, there are 24 families falling into the $25,000 to $34,999 income range, which is the most common income bracket and makes up 50.0% of all families.
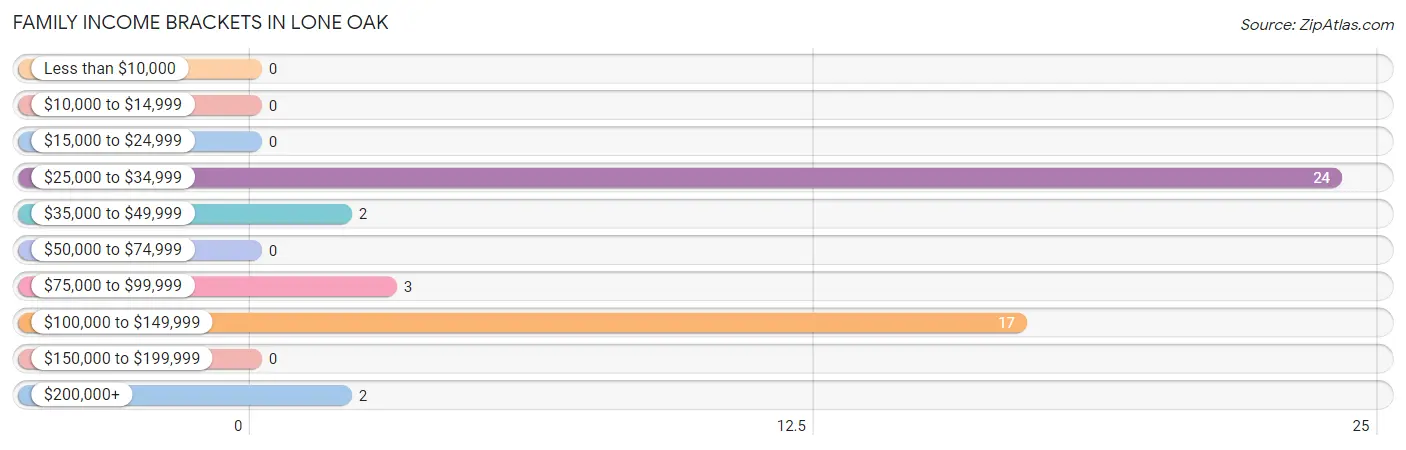
| Income Bracket | # Families | % Families |
| Less than $10,000 | 0 | 0.0% |
| $10,000 to $14,999 | 0 | 0.0% |
| $15,000 to $24,999 | 0 | 0.0% |
| $25,000 to $34,999 | 24 | 50.0% |
| $35,000 to $49,999 | 2 | 4.2% |
| $50,000 to $74,999 | 0 | 0.0% |
| $75,000 to $99,999 | 3 | 6.3% |
| $100,000 to $149,999 | 17 | 35.4% |
| $150,000 to $199,999 | 0 | 0.0% |
| $200,000+ | 2 | 4.2% |
Family Income by Famaliy Size in Lone Oak
3-person families (10 | 20.8%) account for the highest median family income in Lone Oak with $104,167 per family, while 3-person families (10 | 20.8%) have the highest median income of $34,722 per family member.
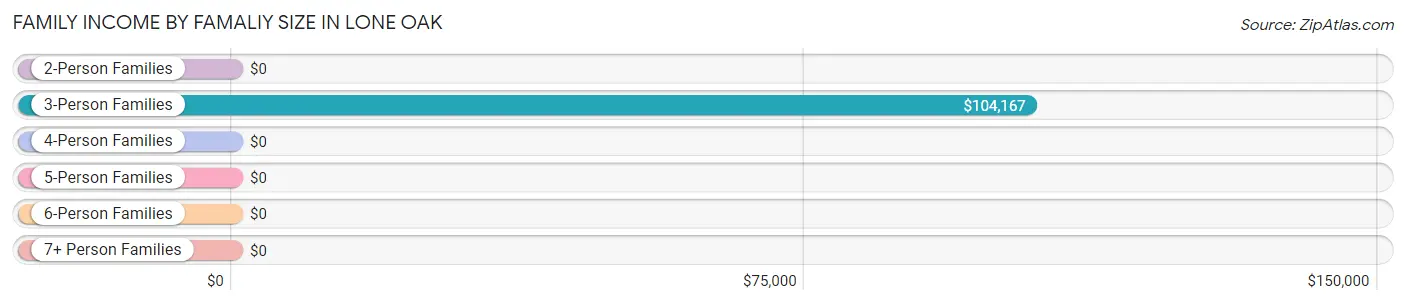
| Income Bracket | # Families | Median Income |
| 2-Person Families | 14 (29.2%) | $0 |
| 3-Person Families | 10 (20.8%) | $104,167 |
| 4-Person Families | 0 (0.0%) | $0 |
| 5-Person Families | 0 (0.0%) | $0 |
| 6-Person Families | 18 (37.5%) | $0 |
| 7+ Person Families | 6 (12.5%) | $0 |
| Total | 48 (100.0%) | $0 |
Family Income by Number of Earners in Lone Oak
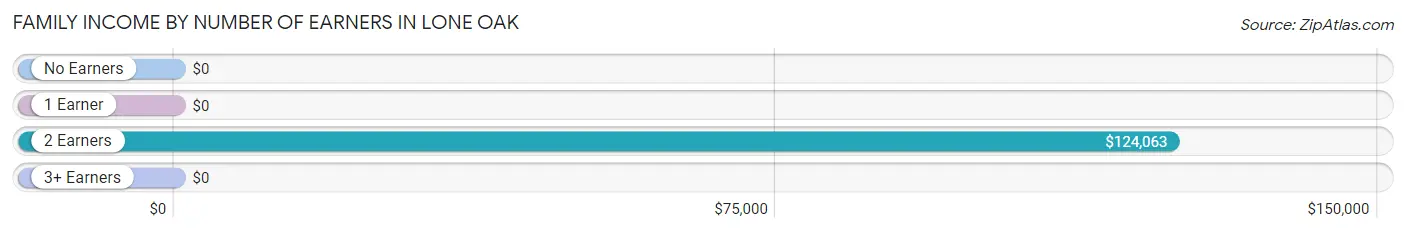
| Number of Earners | # Families | Median Income |
| No Earners | 19 (39.6%) | $0 |
| 1 Earner | 15 (31.2%) | $0 |
| 2 Earners | 11 (22.9%) | $124,063 |
| 3+ Earners | 3 (6.2%) | $0 |
| Total | 48 (100.0%) | $0 |
Household Income in Lone Oak
Household Income Brackets in Lone Oak
With 24 households falling in the category, the $25,000 to $34,999 income range is the most frequent in Lone Oak, accounting for 47.1% of all households.
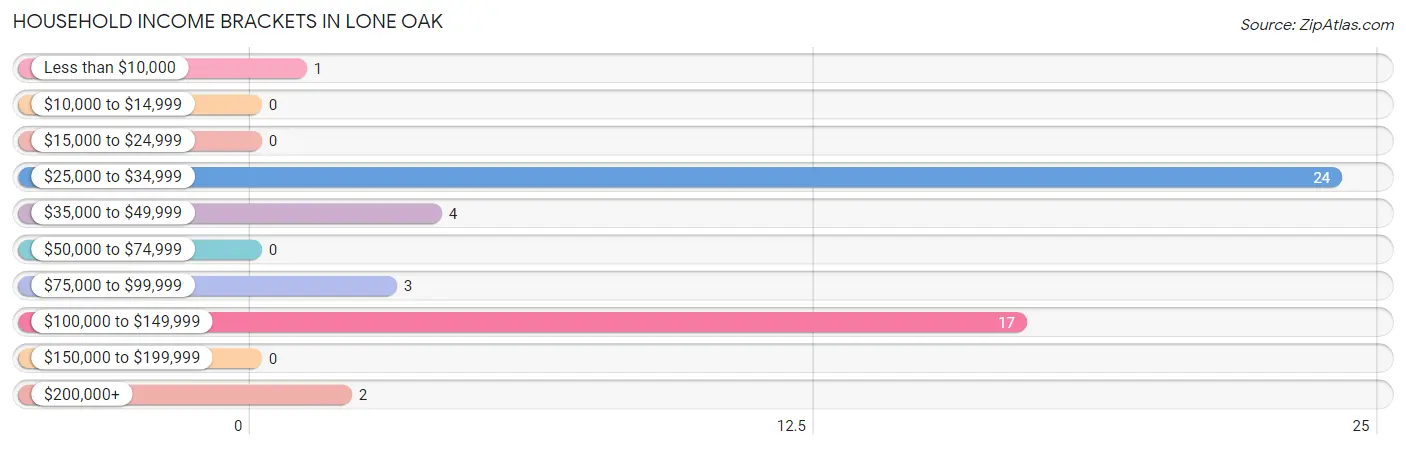
| Income Bracket | # Households | % Households |
| Less than $10,000 | 1 | 2.0% |
| $10,000 to $14,999 | 0 | 0.0% |
| $15,000 to $24,999 | 0 | 0.0% |
| $25,000 to $34,999 | 24 | 47.1% |
| $35,000 to $49,999 | 4 | 7.8% |
| $50,000 to $74,999 | 0 | 0.0% |
| $75,000 to $99,999 | 3 | 5.9% |
| $100,000 to $149,999 | 17 | 33.3% |
| $150,000 to $199,999 | 0 | 0.0% |
| $200,000+ | 2 | 3.9% |
Household Income by Householder Age in Lone Oak
| Income Bracket | # Households | Median Income |
| 15 to 24 Years | 0 (0.0%) | $0 |
| 25 to 44 Years | 4 (7.8%) | $0 |
| 45 to 64 Years | 14 (27.5%) | $0 |
| 65+ Years | 33 (64.7%) | $0 |
| Total | 51 (100.0%) | $0 |
Poverty in Lone Oak
Income Below Poverty by Sex and Age in Lone Oak
With 42.6% poverty level for males and 48.8% for females among the residents of Lone Oak, under 5 year old males and 12 to 14 year old females are the most vulnerable to poverty, with 9 males (100.0%) and 14 females (100.0%) in their respective age groups living below the poverty level.
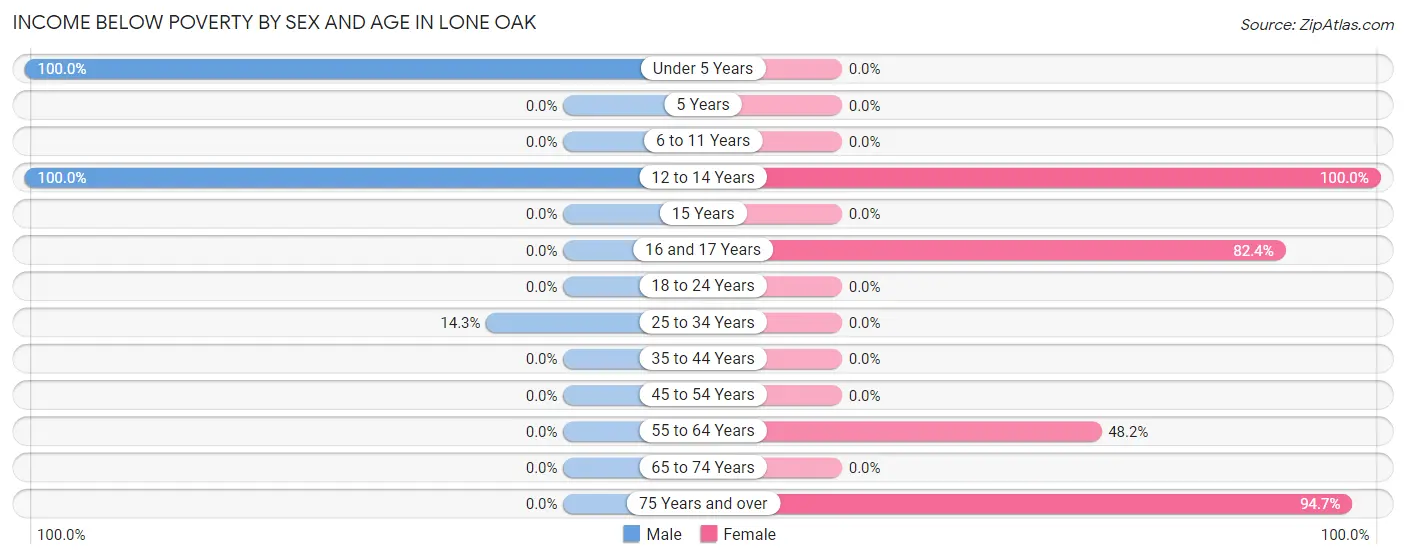
| Age Bracket | Male | Female |
| Under 5 Years | 9 (100.0%) | 0 (0.0%) |
| 5 Years | 0 (0.0%) | 0 (0.0%) |
| 6 to 11 Years | 0 (0.0%) | 0 (0.0%) |
| 12 to 14 Years | 16 (100.0%) | 14 (100.0%) |
| 15 Years | 0 (0.0%) | 0 (0.0%) |
| 16 and 17 Years | 0 (0.0%) | 14 (82.4%) |
| 18 to 24 Years | 0 (0.0%) | 0 (0.0%) |
| 25 to 34 Years | 1 (14.3%) | 0 (0.0%) |
| 35 to 44 Years | 0 (0.0%) | 0 (0.0%) |
| 45 to 54 Years | 0 (0.0%) | 0 (0.0%) |
| 55 to 64 Years | 0 (0.0%) | 13 (48.1%) |
| 65 to 74 Years | 0 (0.0%) | 0 (0.0%) |
| 75 Years and over | 0 (0.0%) | 18 (94.7%) |
| Total | 26 (42.6%) | 59 (48.8%) |
Income Above Poverty by Sex and Age in Lone Oak
According to the poverty statistics in Lone Oak, males aged 6 to 11 years and females aged under 5 years are the age groups that are most secure financially, with 100.0% of males and 100.0% of females in these age groups living above the poverty line.
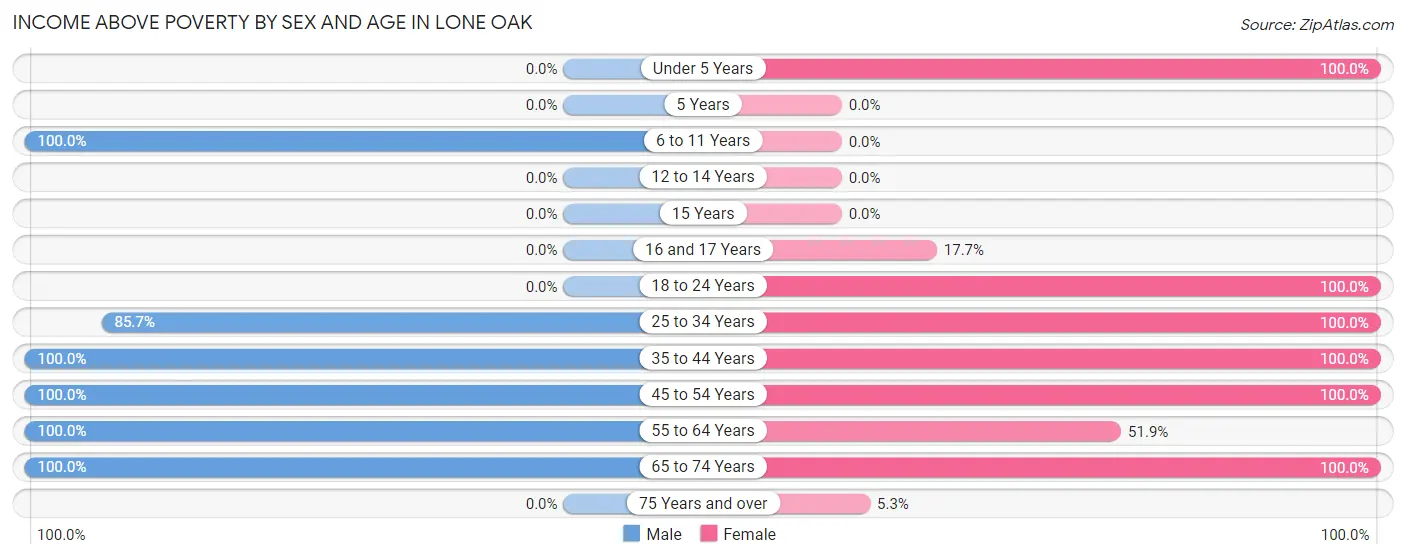
| Age Bracket | Male | Female |
| Under 5 Years | 0 (0.0%) | 12 (100.0%) |
| 5 Years | 0 (0.0%) | 0 (0.0%) |
| 6 to 11 Years | 6 (100.0%) | 0 (0.0%) |
| 12 to 14 Years | 0 (0.0%) | 0 (0.0%) |
| 15 Years | 0 (0.0%) | 0 (0.0%) |
| 16 and 17 Years | 0 (0.0%) | 3 (17.6%) |
| 18 to 24 Years | 0 (0.0%) | 3 (100.0%) |
| 25 to 34 Years | 6 (85.7%) | 9 (100.0%) |
| 35 to 44 Years | 3 (100.0%) | 5 (100.0%) |
| 45 to 54 Years | 5 (100.0%) | 8 (100.0%) |
| 55 to 64 Years | 5 (100.0%) | 14 (51.8%) |
| 65 to 74 Years | 10 (100.0%) | 7 (100.0%) |
| 75 Years and over | 0 (0.0%) | 1 (5.3%) |
| Total | 35 (57.4%) | 62 (51.2%) |
Income Below Poverty Among Married-Couple Families in Lone Oak
| Children | Above Poverty | Below Poverty |
| No Children | 13 (100.0%) | 0 (0.0%) |
| 1 or 2 Children | 0 (0.0%) | 0 (0.0%) |
| 3 or 4 Children | 6 (100.0%) | 0 (0.0%) |
| 5 or more Children | 0 (0.0%) | 0 (0.0%) |
| Total | 19 (100.0%) | 0 (0.0%) |
Income Below Poverty Among Single-Parent Households in Lone Oak
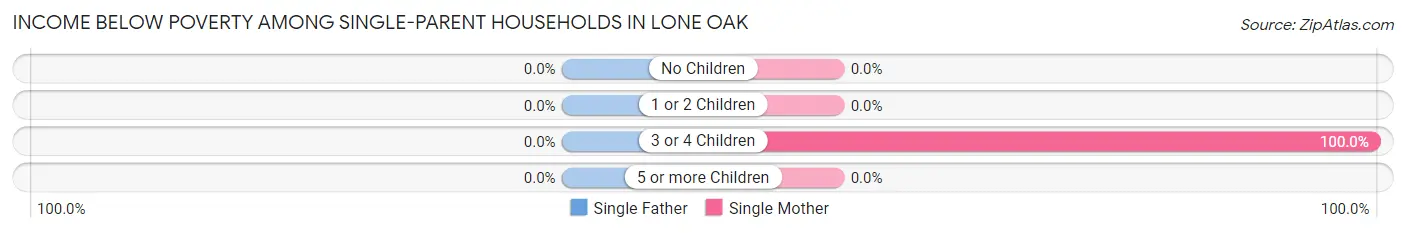
| Children | Single Father | Single Mother |
| No Children | 0 (0.0%) | 0 (0.0%) |
| 1 or 2 Children | 0 (0.0%) | 0 (0.0%) |
| 3 or 4 Children | 0 (0.0%) | 18 (100.0%) |
| 5 or more Children | 0 (0.0%) | 0 (0.0%) |
| Total | 0 (0.0%) | 18 (62.1%) |
Income Below Poverty Among Married-Couple vs Single-Parent Households in Lone Oak
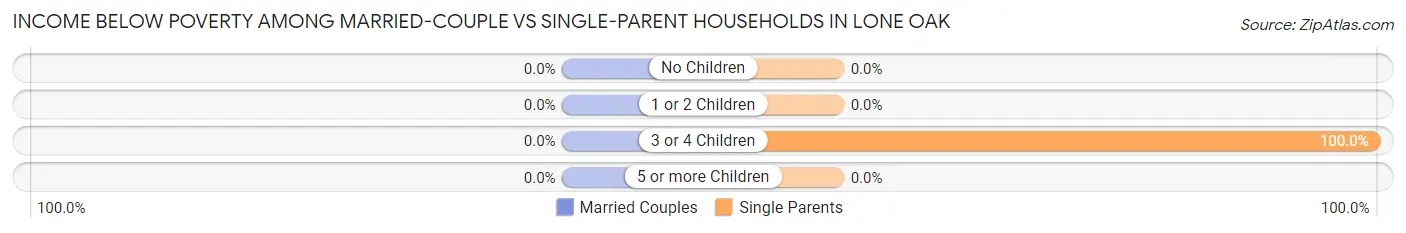
| Children | Married-Couple Families | Single-Parent Households |
| No Children | 0 (0.0%) | 0 (0.0%) |
| 1 or 2 Children | 0 (0.0%) | 0 (0.0%) |
| 3 or 4 Children | 0 (0.0%) | 18 (100.0%) |
| 5 or more Children | 0 (0.0%) | 0 (0.0%) |
| Total | 0 (0.0%) | 18 (62.1%) |
Race in Lone Oak
The most populous races in Lone Oak are White / Caucasian (177 | 97.3%), and Black / African American (5 | 2.8%).
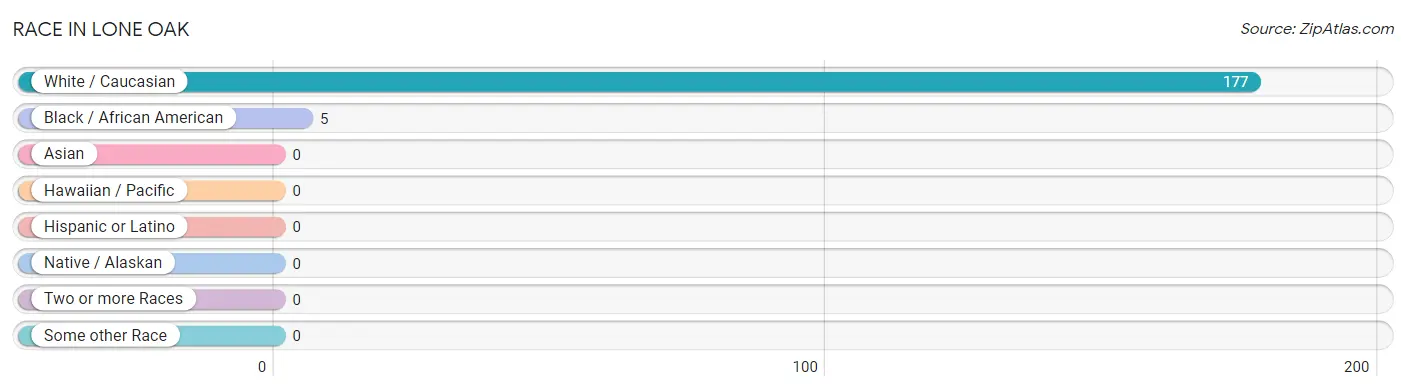
| Race | # Population | % Population |
| Asian | 0 | 0.0% |
| Black / African American | 5 | 2.8% |
| Hawaiian / Pacific | 0 | 0.0% |
| Hispanic or Latino | 0 | 0.0% |
| Native / Alaskan | 0 | 0.0% |
| White / Caucasian | 177 | 97.3% |
| Two or more Races | 0 | 0.0% |
| Some other Race | 0 | 0.0% |
| Total | 182 | 100.0% |
Ancestry in Lone Oak
The most populous ancestries reported in Lone Oak are American (89 | 48.9%), English (60 | 33.0%), Irish (10 | 5.5%), Scotch-Irish (8 | 4.4%), and German (4 | 2.2%), together accounting for 94.0% of all Lone Oak residents.
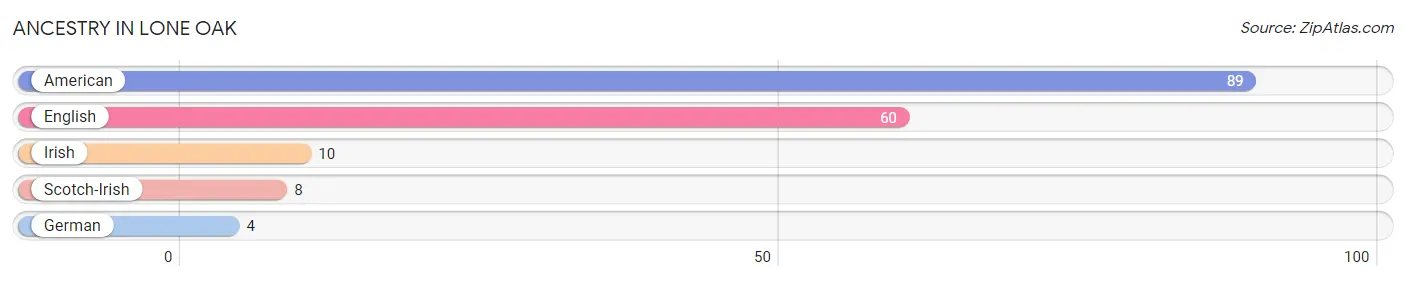
| Ancestry | # Population | % Population |
| American | 89 | 48.9% |
| English | 60 | 33.0% |
| German | 4 | 2.2% |
| Irish | 10 | 5.5% |
| Scotch-Irish | 8 | 4.4% | View All 5 Rows |
Immigrants in Lone Oak

| Immigration Origin | # Population | % Population | View All 0 Rows |
Sex and Age in Lone Oak
Sex and Age in Lone Oak
The most populous age groups in Lone Oak are 10 to 14 Years (16 | 26.2%) for men and 55 to 59 Years (25 | 20.7%) for women.
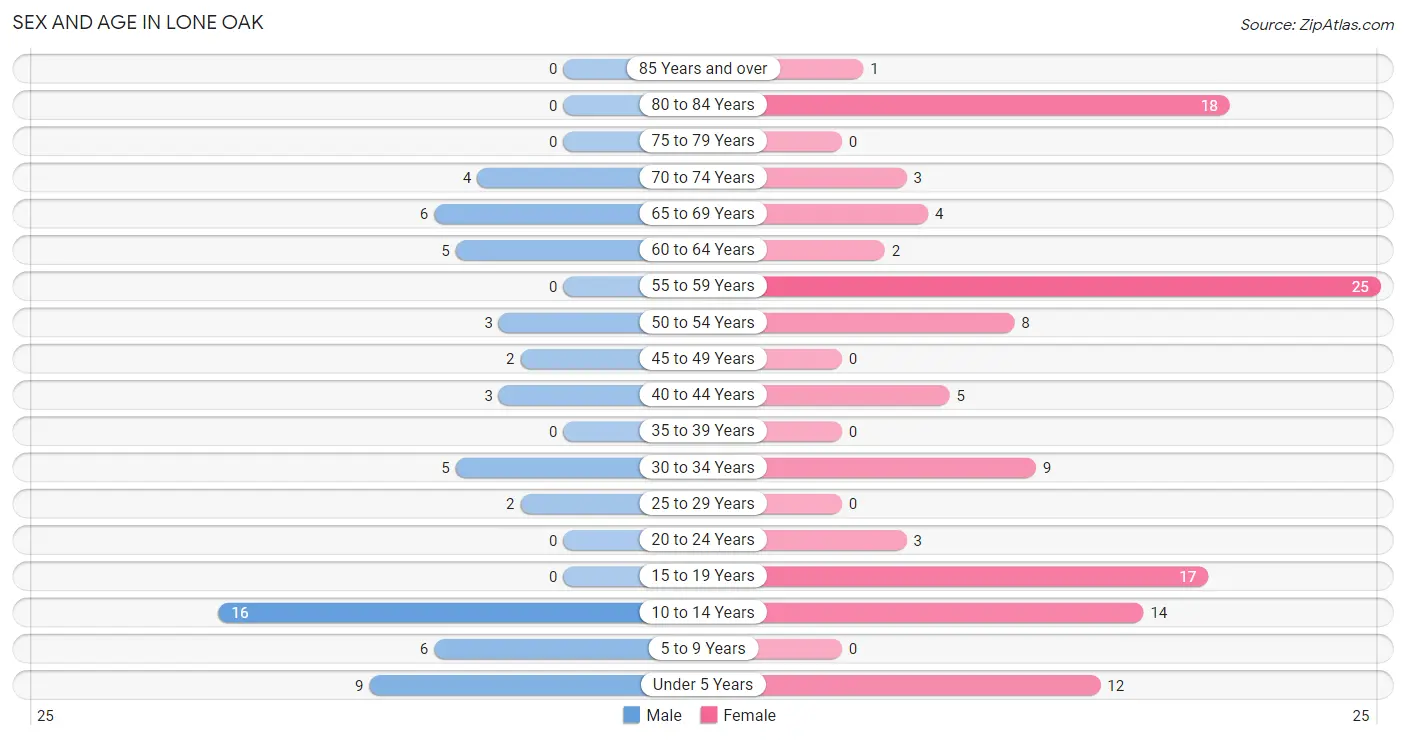
| Age Bracket | Male | Female |
| Under 5 Years | 9 (14.7%) | 12 (9.9%) |
| 5 to 9 Years | 6 (9.8%) | 0 (0.0%) |
| 10 to 14 Years | 16 (26.2%) | 14 (11.6%) |
| 15 to 19 Years | 0 (0.0%) | 17 (14.1%) |
| 20 to 24 Years | 0 (0.0%) | 3 (2.5%) |
| 25 to 29 Years | 2 (3.3%) | 0 (0.0%) |
| 30 to 34 Years | 5 (8.2%) | 9 (7.4%) |
| 35 to 39 Years | 0 (0.0%) | 0 (0.0%) |
| 40 to 44 Years | 3 (4.9%) | 5 (4.1%) |
| 45 to 49 Years | 2 (3.3%) | 0 (0.0%) |
| 50 to 54 Years | 3 (4.9%) | 8 (6.6%) |
| 55 to 59 Years | 0 (0.0%) | 25 (20.7%) |
| 60 to 64 Years | 5 (8.2%) | 2 (1.7%) |
| 65 to 69 Years | 6 (9.8%) | 4 (3.3%) |
| 70 to 74 Years | 4 (6.6%) | 3 (2.5%) |
| 75 to 79 Years | 0 (0.0%) | 0 (0.0%) |
| 80 to 84 Years | 0 (0.0%) | 18 (14.9%) |
| 85 Years and over | 0 (0.0%) | 1 (0.8%) |
| Total | 61 (100.0%) | 121 (100.0%) |
Families and Households in Lone Oak
Median Family Size in Lone Oak
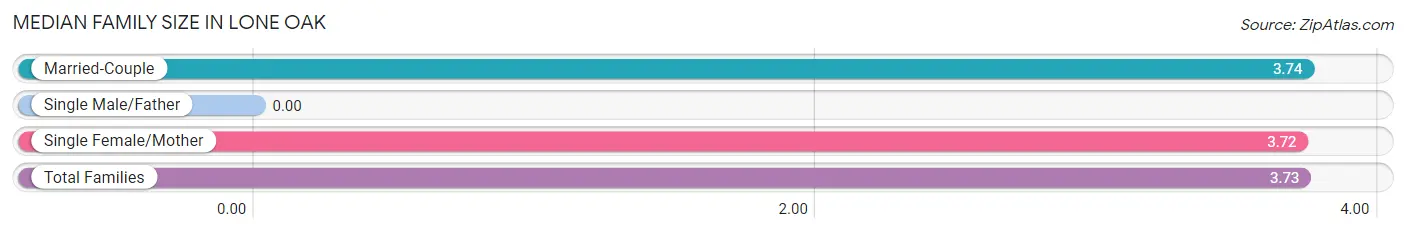
| Family Type | # Families | Family Size |
| Married-Couple | 19 (39.6%) | 3.74 |
| Single Male/Father | 0 (0.0%) | - |
| Single Female/Mother | 29 (60.4%) | 3.72 |
| Total Families | 48 (100.0%) | 3.73 |
Median Household Size in Lone Oak
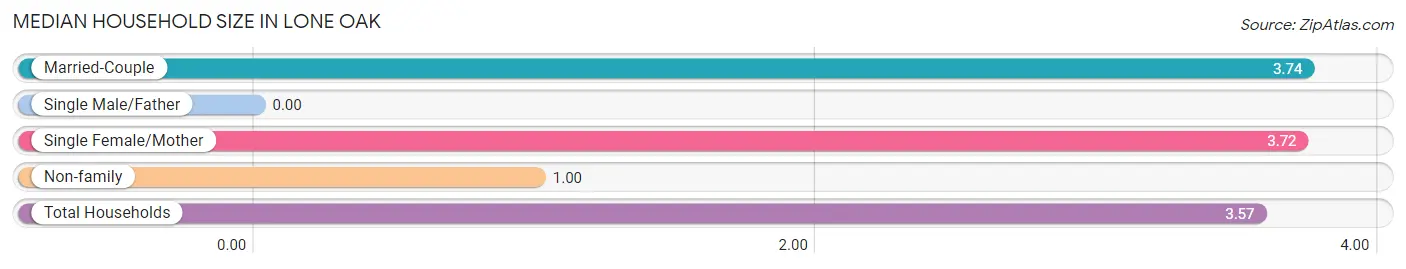
| Household Type | # Households | Household Size |
| Married-Couple | 19 (37.2%) | 3.74 |
| Single Male/Father | 0 (0.0%) | - |
| Single Female/Mother | 29 (56.9%) | 3.72 |
| Non-family | 3 (5.9%) | 1.00 |
| Total Households | 51 (100.0%) | 3.57 |
Household Size by Marriage Status in Lone Oak
Out of a total of 51 households in Lone Oak, 48 (94.1%) are family households, while 3 (5.9%) are nonfamily households. The most numerous type of family households are 6-person households, comprising 18, and the most common type of nonfamily households are 1-person households, comprising 3.
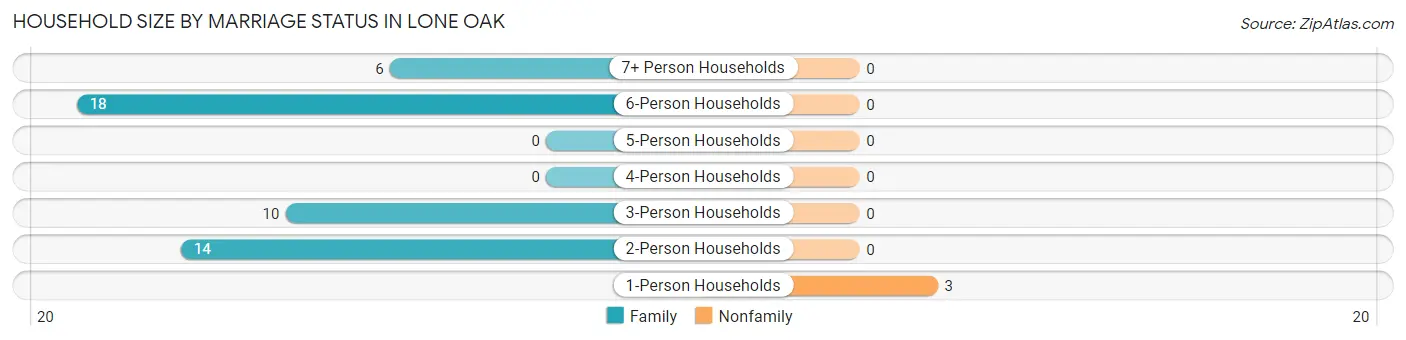
| Household Size | Family Households | Nonfamily Households |
| 1-Person Households | - | 3 (5.9%) |
| 2-Person Households | 14 (27.5%) | 0 (0.0%) |
| 3-Person Households | 10 (19.6%) | 0 (0.0%) |
| 4-Person Households | 0 (0.0%) | 0 (0.0%) |
| 5-Person Households | 0 (0.0%) | 0 (0.0%) |
| 6-Person Households | 18 (35.3%) | 0 (0.0%) |
| 7+ Person Households | 6 (11.8%) | 0 (0.0%) |
| Total | 48 (94.1%) | 3 (5.9%) |
Female Fertility in Lone Oak
Fertility by Age in Lone Oak
| Age Bracket | Women with Births | Births / 1,000 Women |
| 15 to 19 years | 0 (0.0%) | 0.0 |
| 20 to 34 years | 0 (0.0%) | 0.0 |
| 35 to 50 years | 0 (0.0%) | 0.0 |
| Total | 0 (0.0%) | 0.0 |
Fertility by Age by Marriage Status in Lone Oak
| Age Bracket | Married | Unmarried |
| 15 to 19 years | 0 (0.0%) | 0 (0.0%) |
| 20 to 34 years | 0 (0.0%) | 0 (0.0%) |
| 35 to 50 years | 0 (0.0%) | 0 (0.0%) |
| Total | 0 (0.0%) | 0 (0.0%) |
Fertility by Education in Lone Oak
| Educational Attainment | Women with Births | Births / 1,000 Women |
| Less than High School | 0 (0.0%) | 0.0 |
| High School Diploma | 0 (0.0%) | 0.0 |
| College or Associate's Degree | 0 (0.0%) | 0.0 |
| Bachelor's Degree | 0 (0.0%) | 0.0 |
| Graduate Degree | 0 (0.0%) | 0.0 |
| Total | 0 (0.0%) | 0.0 |
Fertility by Education by Marriage Status in Lone Oak
| Educational Attainment | Married | Unmarried |
| Less than High School | 0 (0.0%) | 0 (0.0%) |
| High School Diploma | 0 (0.0%) | 0 (0.0%) |
| College or Associate's Degree | 0 (0.0%) | 0 (0.0%) |
| Bachelor's Degree | 0 (0.0%) | 0 (0.0%) |
| Graduate Degree | 0 (0.0%) | 0 (0.0%) |
| Total | 0 (0.0%) | 0 (0.0%) |
Employment Characteristics in Lone Oak
Employment by Class of Employer in Lone Oak
Among the 35 employed individuals in Lone Oak, private company employees (24 | 68.6%), local government employees (9 | 25.7%), and self-employed (not incorporated) (2 | 5.7%) make up the most common classes of employment.
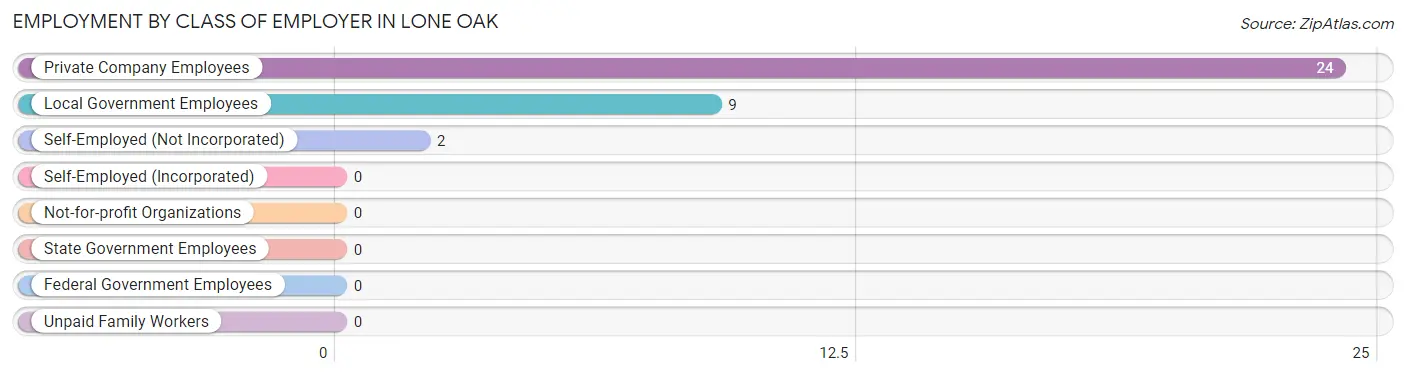
| Employer Class | # Employees | % Employees |
| Private Company Employees | 24 | 68.6% |
| Self-Employed (Incorporated) | 0 | 0.0% |
| Self-Employed (Not Incorporated) | 2 | 5.7% |
| Not-for-profit Organizations | 0 | 0.0% |
| Local Government Employees | 9 | 25.7% |
| State Government Employees | 0 | 0.0% |
| Federal Government Employees | 0 | 0.0% |
| Unpaid Family Workers | 0 | 0.0% |
| Total | 35 | 100.0% |
Employment Status by Age in Lone Oak
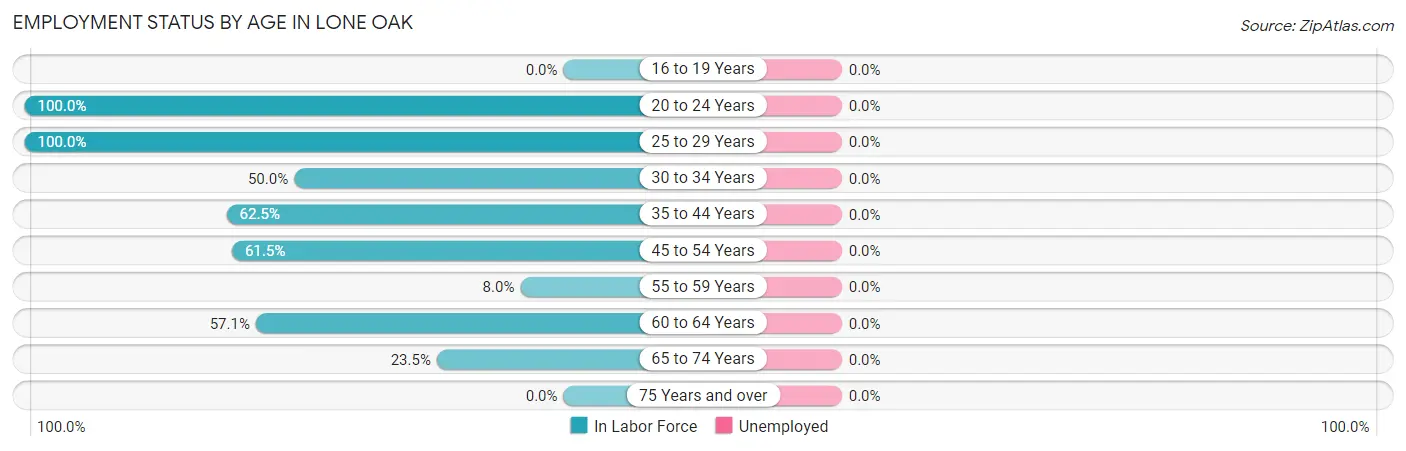
| Age Bracket | In Labor Force | Unemployed |
| 16 to 19 Years | 0 (0.0%) | 0 (0.0%) |
| 20 to 24 Years | 3 (100.0%) | 0 (0.0%) |
| 25 to 29 Years | 2 (100.0%) | 0 (0.0%) |
| 30 to 34 Years | 7 (50.0%) | 0 (0.0%) |
| 35 to 44 Years | 5 (62.5%) | 0 (0.0%) |
| 45 to 54 Years | 8 (61.5%) | 0 (0.0%) |
| 55 to 59 Years | 2 (8.0%) | 0 (0.0%) |
| 60 to 64 Years | 4 (57.1%) | 0 (0.0%) |
| 65 to 74 Years | 4 (23.5%) | 0 (0.0%) |
| 75 Years and over | 0 (0.0%) | 0 (0.0%) |
| Total | 35 (28.0%) | 0 (0.0%) |
Employment Status by Educational Attainment in Lone Oak
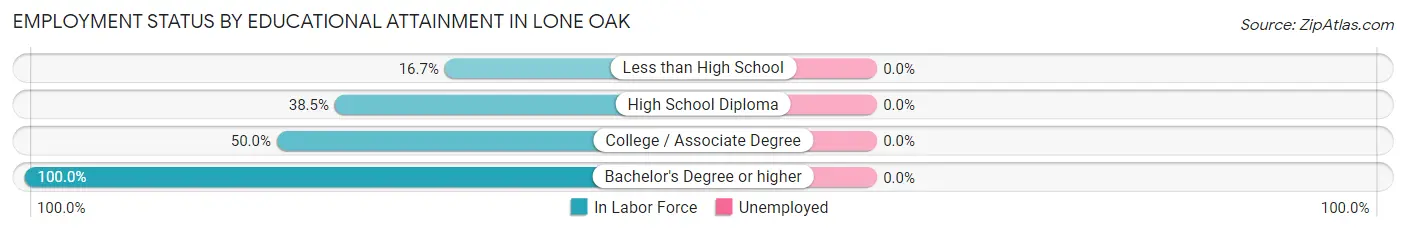
| Educational Attainment | In Labor Force | Unemployed |
| Less than High School | 3 (16.7%) | 0 (0.0%) |
| High School Diploma | 10 (38.5%) | 0 (0.0%) |
| College / Associate Degree | 10 (50.0%) | 0 (0.0%) |
| Bachelor's Degree or higher | 5 (100.0%) | 0 (0.0%) |
| Total | 28 (40.6%) | 0 (0.0%) |
Employment Occupations by Sex in Lone Oak
Management, Business, Science and Arts Occupations
The most common Management, Business, Science and Arts occupations in Lone Oak are Management (3 | 8.6%), Business & Financial (2 | 5.7%), Computers, Engineering & Science (2 | 5.7%), and Architecture & Engineering (2 | 5.7%).
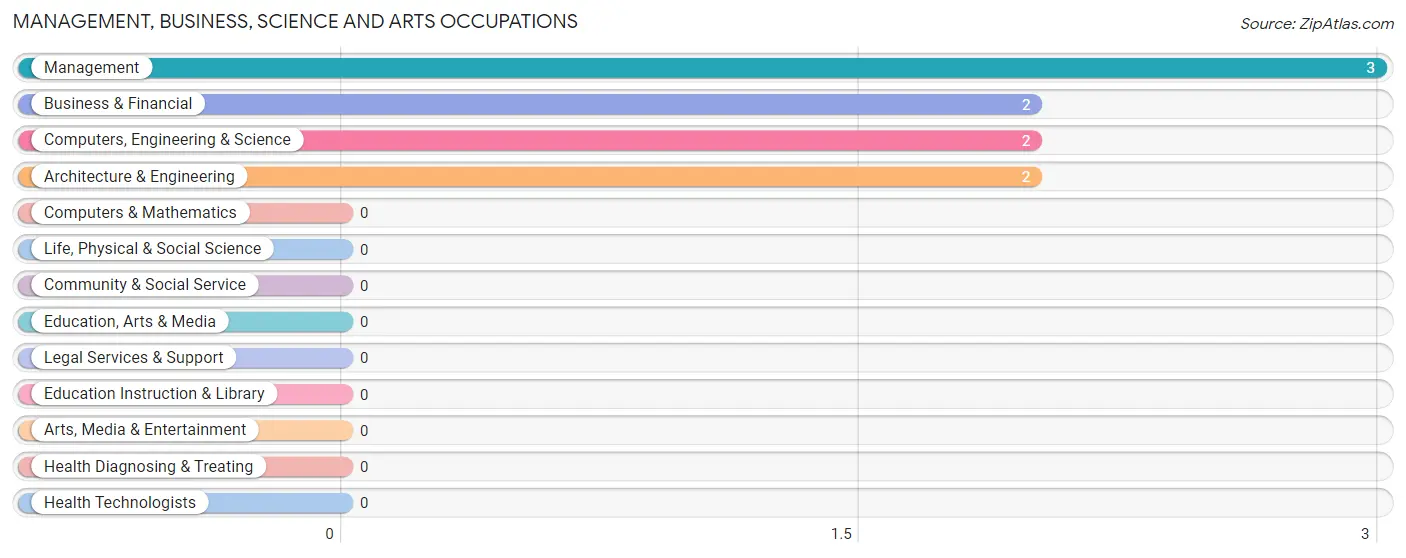
Management, Business, Science and Arts Occupations by Sex
Within the Management, Business, Science and Arts occupations in Lone Oak, the most male-oriented occupations are Computers, Engineering & Science (100.0%), and Architecture & Engineering (100.0%), while the most female-oriented occupations are Management (100.0%), and Business & Financial (100.0%).
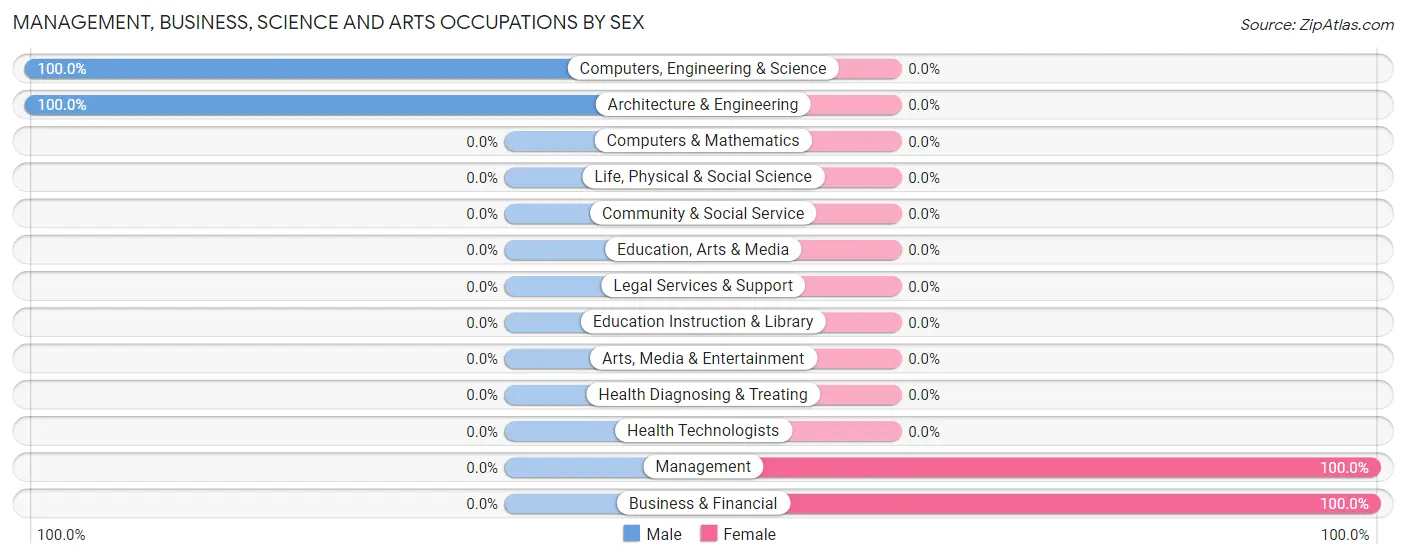
| Occupation | Male | Female |
| Management | 0 (0.0%) | 3 (100.0%) |
| Business & Financial | 0 (0.0%) | 2 (100.0%) |
| Computers, Engineering & Science | 2 (100.0%) | 0 (0.0%) |
| Computers & Mathematics | 0 (0.0%) | 0 (0.0%) |
| Architecture & Engineering | 2 (100.0%) | 0 (0.0%) |
| Life, Physical & Social Science | 0 (0.0%) | 0 (0.0%) |
| Community & Social Service | 0 (0.0%) | 0 (0.0%) |
| Education, Arts & Media | 0 (0.0%) | 0 (0.0%) |
| Legal Services & Support | 0 (0.0%) | 0 (0.0%) |
| Education Instruction & Library | 0 (0.0%) | 0 (0.0%) |
| Arts, Media & Entertainment | 0 (0.0%) | 0 (0.0%) |
| Health Diagnosing & Treating | 0 (0.0%) | 0 (0.0%) |
| Health Technologists | 0 (0.0%) | 0 (0.0%) |
| Total (Category) | 2 (28.6%) | 5 (71.4%) |
| Total (Overall) | 19 (54.3%) | 16 (45.7%) |
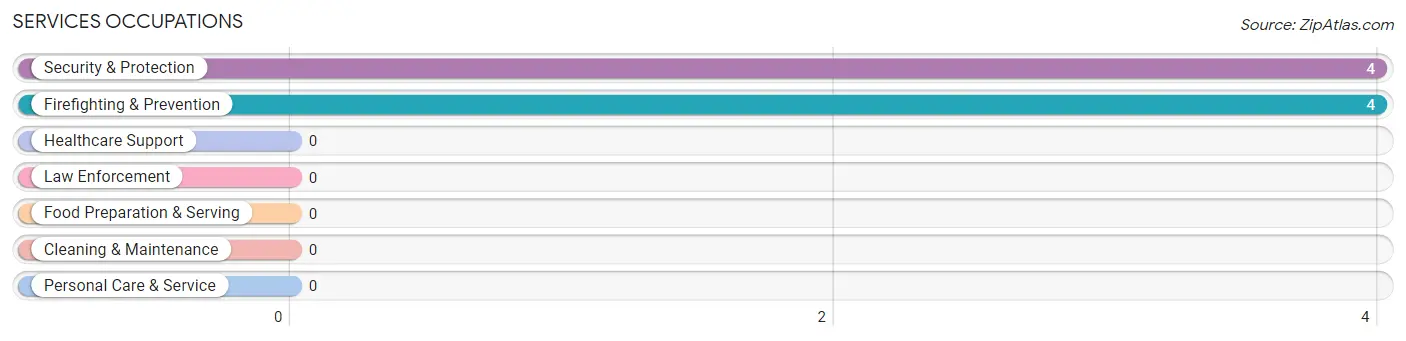
Services Occupations
The most common Services occupations in Lone Oak are Security & Protection (4 | 11.4%), and Firefighting & Prevention (4 | 11.4%).
Services Occupations by Sex
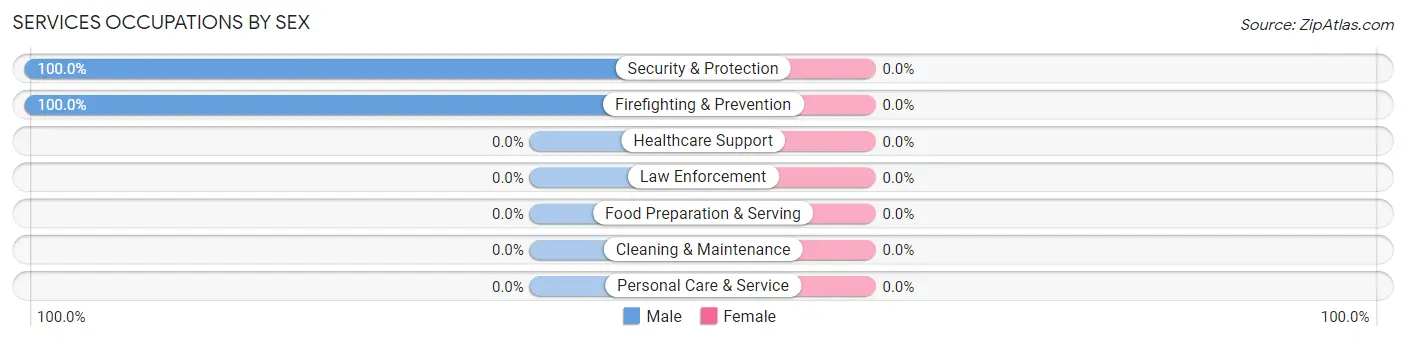
| Occupation | Male | Female |
| Healthcare Support | 0 (0.0%) | 0 (0.0%) |
| Security & Protection | 4 (100.0%) | 0 (0.0%) |
| Firefighting & Prevention | 4 (100.0%) | 0 (0.0%) |
| Law Enforcement | 0 (0.0%) | 0 (0.0%) |
| Food Preparation & Serving | 0 (0.0%) | 0 (0.0%) |
| Cleaning & Maintenance | 0 (0.0%) | 0 (0.0%) |
| Personal Care & Service | 0 (0.0%) | 0 (0.0%) |
| Total (Category) | 4 (100.0%) | 0 (0.0%) |
| Total (Overall) | 19 (54.3%) | 16 (45.7%) |
Sales and Office Occupations
The most common Sales and Office occupations in Lone Oak are Sales & Related (6 | 17.1%), and Office & Administration (5 | 14.3%).
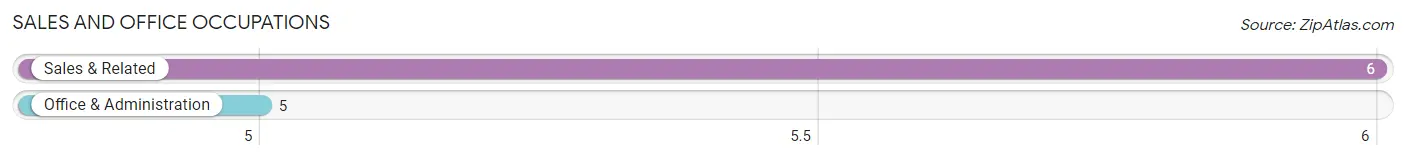
Sales and Office Occupations by Sex
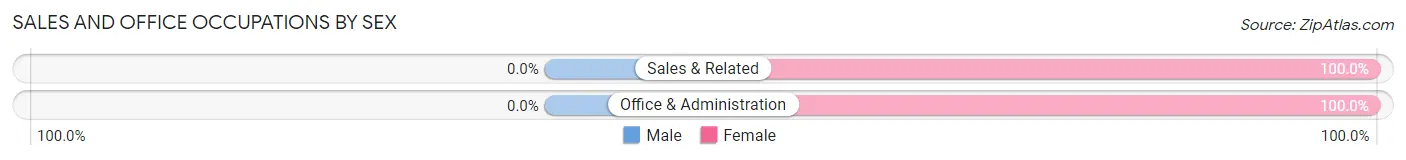
| Occupation | Male | Female |
| Sales & Related | 0 (0.0%) | 6 (100.0%) |
| Office & Administration | 0 (0.0%) | 5 (100.0%) |
| Total (Category) | 0 (0.0%) | 11 (100.0%) |
| Total (Overall) | 19 (54.3%) | 16 (45.7%) |
Natural Resources, Construction and Maintenance Occupations
The most common Natural Resources, Construction and Maintenance occupations in Lone Oak are , and Construction & Extraction (4 | 11.4%).
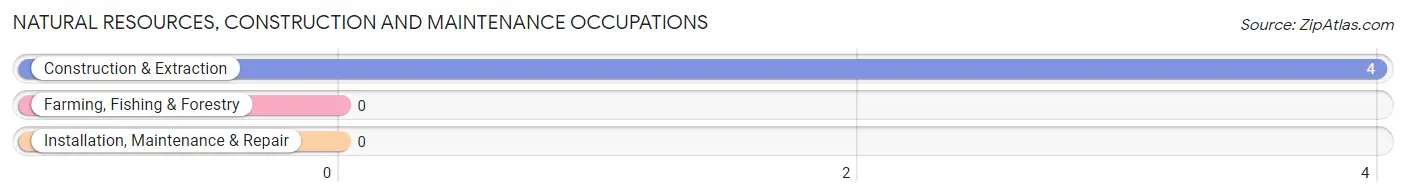
Natural Resources, Construction and Maintenance Occupations by Sex
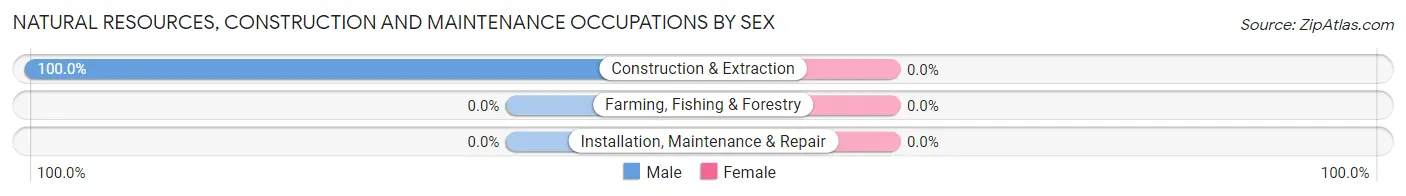
| Occupation | Male | Female |
| Farming, Fishing & Forestry | 0 (0.0%) | 0 (0.0%) |
| Construction & Extraction | 4 (100.0%) | 0 (0.0%) |
| Installation, Maintenance & Repair | 0 (0.0%) | 0 (0.0%) |
| Total (Category) | 4 (100.0%) | 0 (0.0%) |
| Total (Overall) | 19 (54.3%) | 16 (45.7%) |
Production, Transportation and Moving Occupations
The most common Production, Transportation and Moving occupations in Lone Oak are Material Moving (4 | 11.4%), Transportation (3 | 8.6%), and Production (2 | 5.7%).
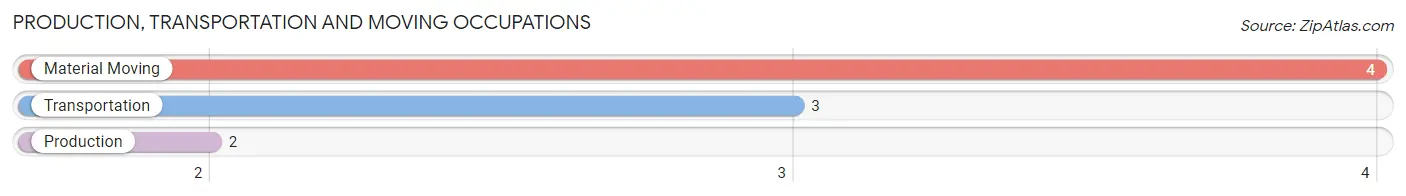
Production, Transportation and Moving Occupations by Sex
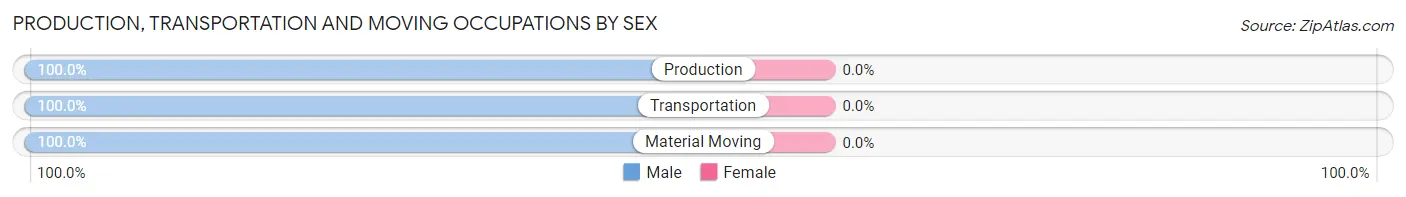
| Occupation | Male | Female |
| Production | 2 (100.0%) | 0 (0.0%) |
| Transportation | 3 (100.0%) | 0 (0.0%) |
| Material Moving | 4 (100.0%) | 0 (0.0%) |
| Total (Category) | 9 (100.0%) | 0 (0.0%) |
| Total (Overall) | 19 (54.3%) | 16 (45.7%) |
Employment Industries by Sex in Lone Oak
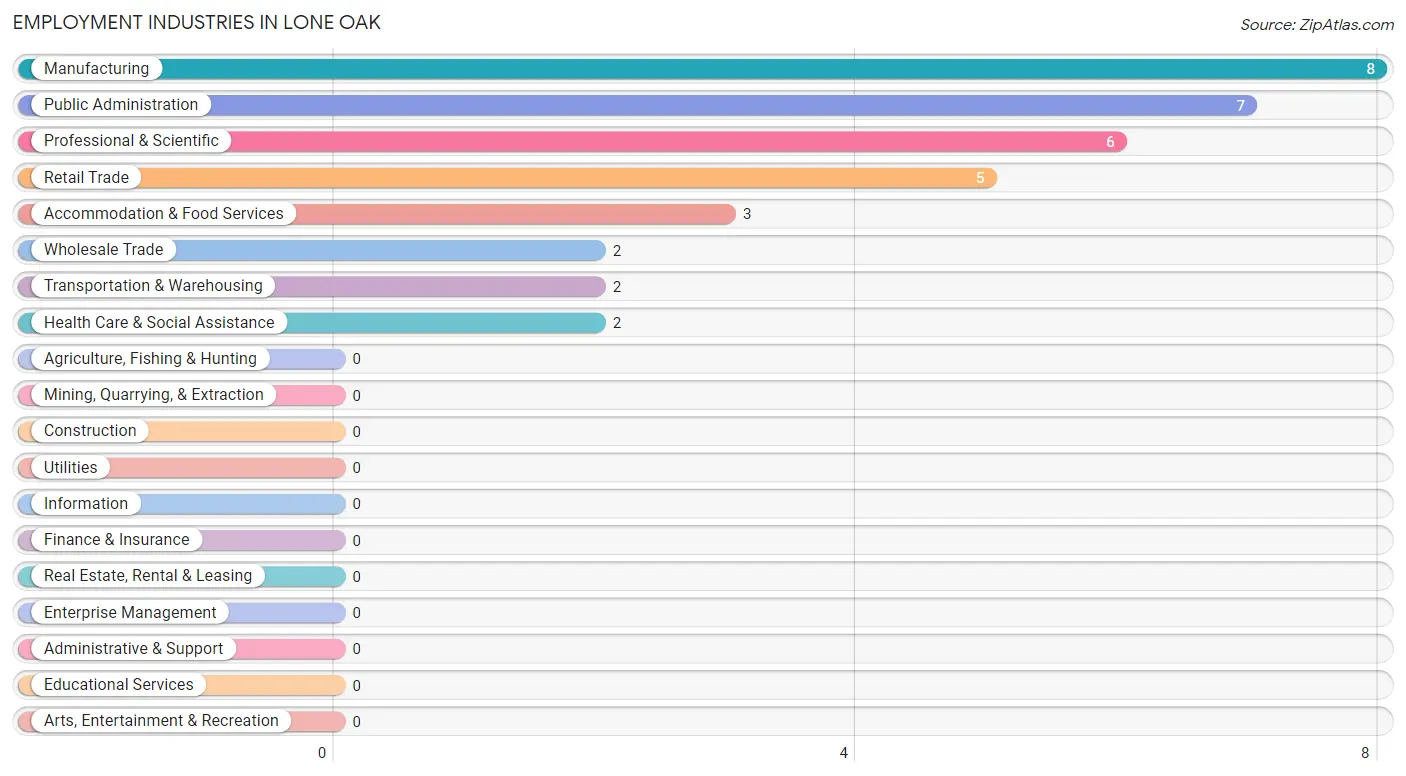
Employment Industries in Lone Oak
The major employment industries in Lone Oak include Manufacturing (8 | 22.9%), Public Administration (7 | 20.0%), Professional & Scientific (6 | 17.1%), Retail Trade (5 | 14.3%), and Accommodation & Food Services (3 | 8.6%).
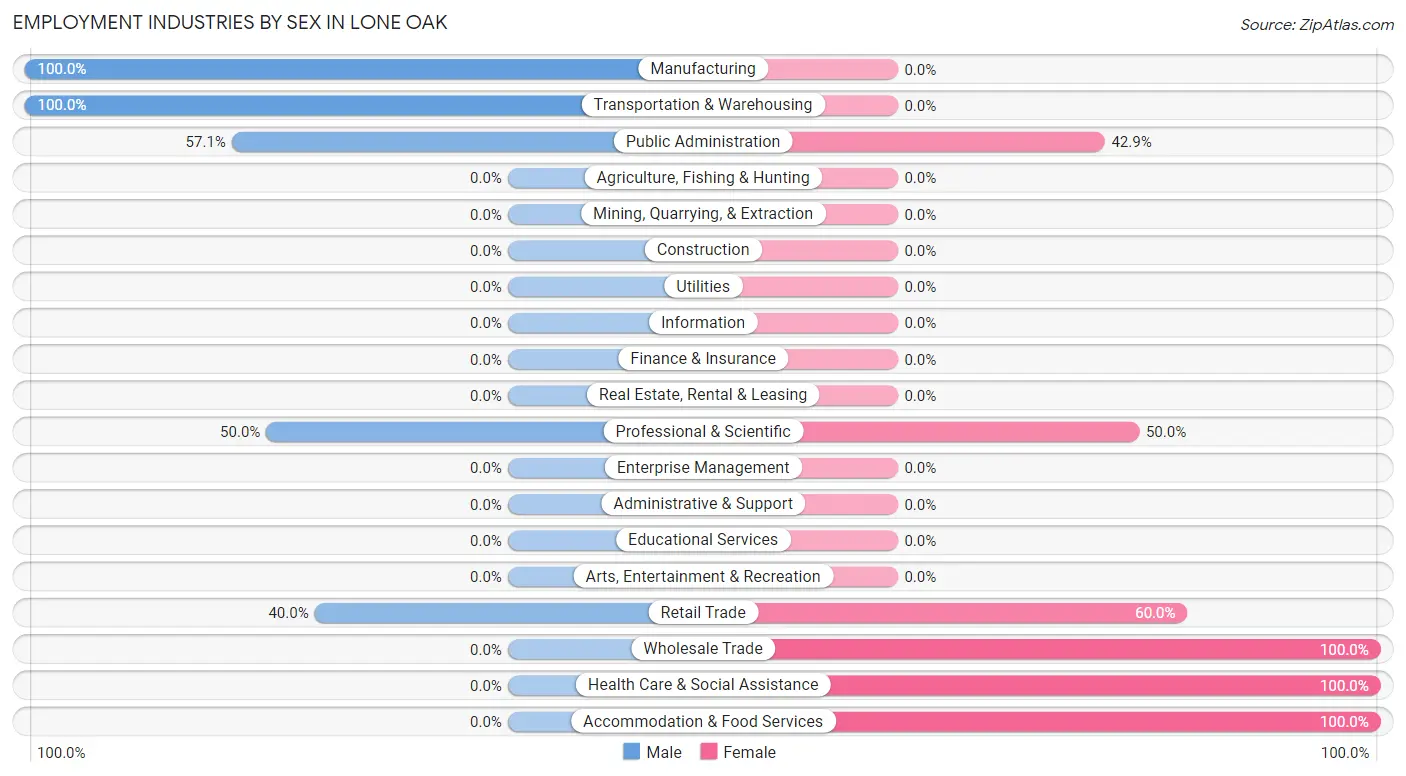
Employment Industries by Sex in Lone Oak
The Lone Oak industries that see more men than women are Manufacturing (100.0%), Transportation & Warehousing (100.0%), and Public Administration (57.1%), whereas the industries that tend to have a higher number of women are Wholesale Trade (100.0%), Health Care & Social Assistance (100.0%), and Accommodation & Food Services (100.0%).
| Industry | Male | Female |
| Agriculture, Fishing & Hunting | 0 (0.0%) | 0 (0.0%) |
| Mining, Quarrying, & Extraction | 0 (0.0%) | 0 (0.0%) |
| Construction | 0 (0.0%) | 0 (0.0%) |
| Manufacturing | 8 (100.0%) | 0 (0.0%) |
| Wholesale Trade | 0 (0.0%) | 2 (100.0%) |
| Retail Trade | 2 (40.0%) | 3 (60.0%) |
| Transportation & Warehousing | 2 (100.0%) | 0 (0.0%) |
| Utilities | 0 (0.0%) | 0 (0.0%) |
| Information | 0 (0.0%) | 0 (0.0%) |
| Finance & Insurance | 0 (0.0%) | 0 (0.0%) |
| Real Estate, Rental & Leasing | 0 (0.0%) | 0 (0.0%) |
| Professional & Scientific | 3 (50.0%) | 3 (50.0%) |
| Enterprise Management | 0 (0.0%) | 0 (0.0%) |
| Administrative & Support | 0 (0.0%) | 0 (0.0%) |
| Educational Services | 0 (0.0%) | 0 (0.0%) |
| Health Care & Social Assistance | 0 (0.0%) | 2 (100.0%) |
| Arts, Entertainment & Recreation | 0 (0.0%) | 0 (0.0%) |
| Accommodation & Food Services | 0 (0.0%) | 3 (100.0%) |
| Public Administration | 4 (57.1%) | 3 (42.9%) |
| Total | 19 (54.3%) | 16 (45.7%) |
Education in Lone Oak
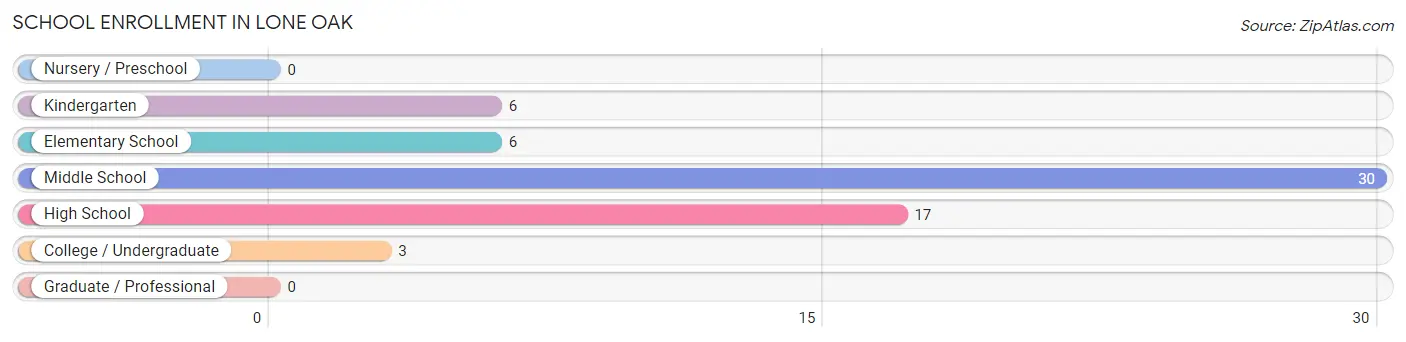
School Enrollment in Lone Oak
The most common levels of schooling among the 62 students in Lone Oak are middle school (30 | 48.4%), high school (17 | 27.4%), and kindergarten (6 | 9.7%).
| School Level | # Students | % Students |
| Nursery / Preschool | 0 | 0.0% |
| Kindergarten | 6 | 9.7% |
| Elementary School | 6 | 9.7% |
| Middle School | 30 | 48.4% |
| High School | 17 | 27.4% |
| College / Undergraduate | 3 | 4.8% |
| Graduate / Professional | 0 | 0.0% |
| Total | 62 | 100.0% |
School Enrollment by Age by Funding Source in Lone Oak
Out of a total of 62 students who are enrolled in schools in Lone Oak, 12 (19.4%) attend a private institution, while the remaining 50 (80.6%) are enrolled in public schools. The age group of 3 to 4 year olds has the highest likelihood of being enrolled in private schools, with 6 (100.0% in the age bracket) enrolled. Conversely, the age group of 10 to 14 year olds has the lowest likelihood of being enrolled in a private school, with 30 (100.0% in the age bracket) attending a public institution.
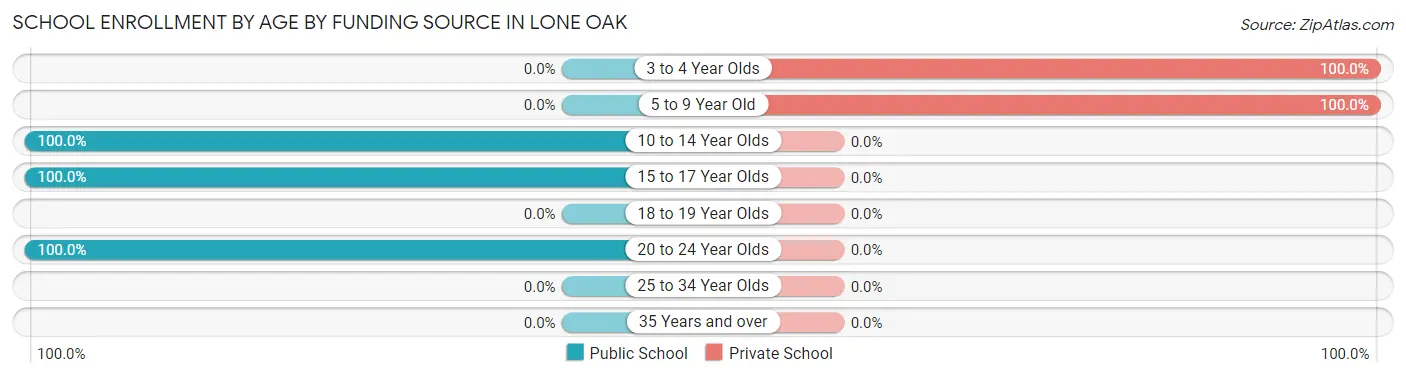
| Age Bracket | Public School | Private School |
| 3 to 4 Year Olds | 0 (0.0%) | 6 (100.0%) |
| 5 to 9 Year Old | 0 (0.0%) | 6 (100.0%) |
| 10 to 14 Year Olds | 30 (100.0%) | 0 (0.0%) |
| 15 to 17 Year Olds | 17 (100.0%) | 0 (0.0%) |
| 18 to 19 Year Olds | 0 (0.0%) | 0 (0.0%) |
| 20 to 24 Year Olds | 3 (100.0%) | 0 (0.0%) |
| 25 to 34 Year Olds | 0 (0.0%) | 0 (0.0%) |
| 35 Years and over | 0 (0.0%) | 0 (0.0%) |
| Total | 50 (80.6%) | 12 (19.4%) |
Educational Attainment by Field of Study in Lone Oak
Business (4 | 57.1%), and psychology (3 | 42.9%) are the most common fields of study among 7 individuals in Lone Oak who have obtained a bachelor's degree or higher.
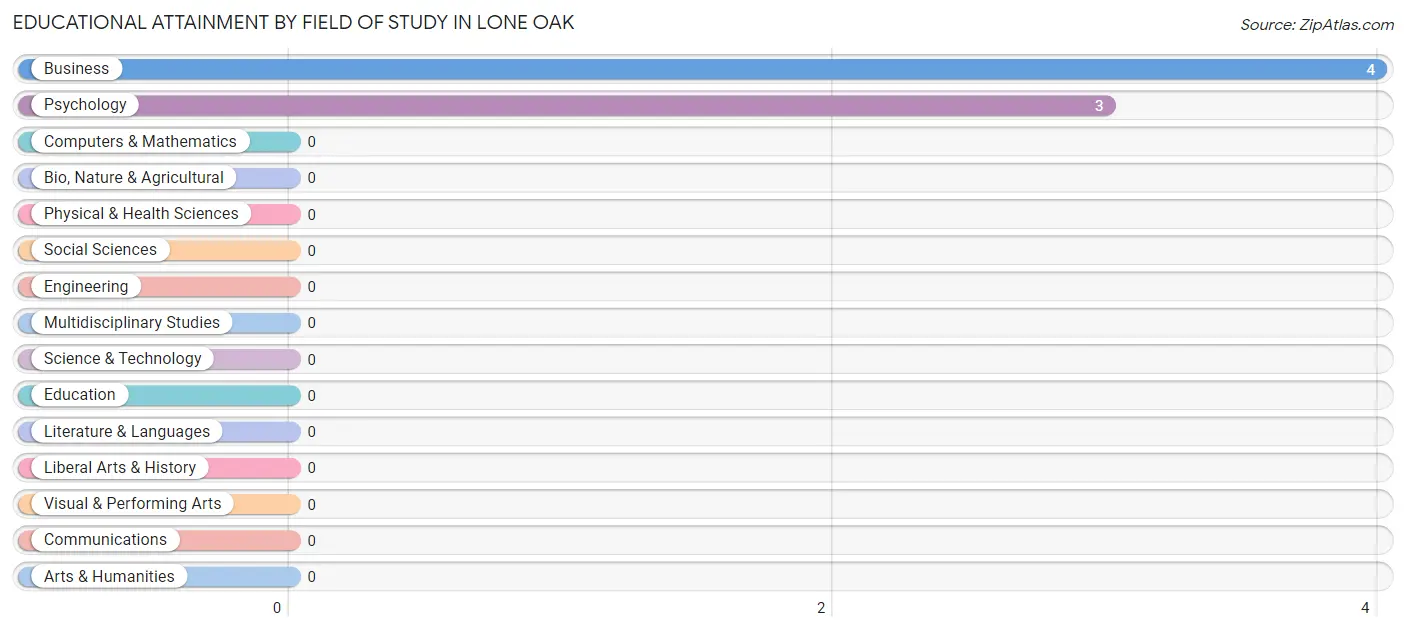
| Field of Study | # Graduates | % Graduates |
| Computers & Mathematics | 0 | 0.0% |
| Bio, Nature & Agricultural | 0 | 0.0% |
| Physical & Health Sciences | 0 | 0.0% |
| Psychology | 3 | 42.9% |
| Social Sciences | 0 | 0.0% |
| Engineering | 0 | 0.0% |
| Multidisciplinary Studies | 0 | 0.0% |
| Science & Technology | 0 | 0.0% |
| Business | 4 | 57.1% |
| Education | 0 | 0.0% |
| Literature & Languages | 0 | 0.0% |
| Liberal Arts & History | 0 | 0.0% |
| Visual & Performing Arts | 0 | 0.0% |
| Communications | 0 | 0.0% |
| Arts & Humanities | 0 | 0.0% |
| Total | 7 | 100.0% |
Transportation & Commute in Lone Oak
Vehicle Availability by Sex in Lone Oak
The most prevalent vehicle ownership categories in Lone Oak are males with 4 vehicles (7, accounting for 36.8%) and females with 4 vehicles (5, making up 43.8%).
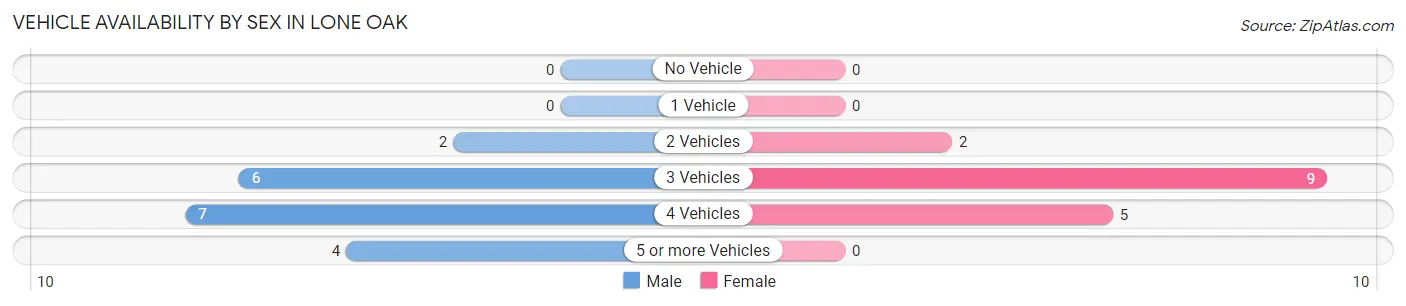
| Vehicles Available | Male | Female |
| No Vehicle | 0 (0.0%) | 0 (0.0%) |
| 1 Vehicle | 0 (0.0%) | 0 (0.0%) |
| 2 Vehicles | 2 (10.5%) | 2 (12.5%) |
| 3 Vehicles | 6 (31.6%) | 9 (56.2%) |
| 4 Vehicles | 7 (36.8%) | 5 (31.2%) |
| 5 or more Vehicles | 4 (21.0%) | 0 (0.0%) |
| Total | 19 (100.0%) | 16 (100.0%) |
Commute Time in Lone Oak
The most frequently occuring commute durations in Lone Oak are 30 to 34 minutes (10 commuters, 33.3%), 25 to 29 minutes (8 commuters, 26.7%), and 45 to 59 minutes (6 commuters, 20.0%).
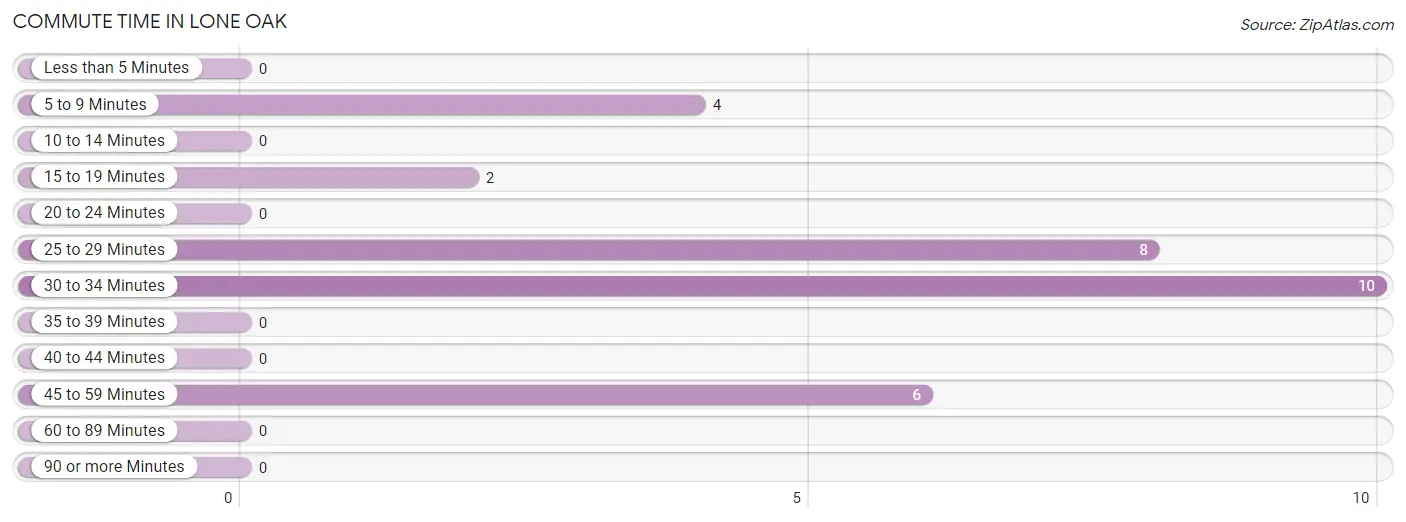
| Commute Time | # Commuters | % Commuters |
| Less than 5 Minutes | 0 | 0.0% |
| 5 to 9 Minutes | 4 | 13.3% |
| 10 to 14 Minutes | 0 | 0.0% |
| 15 to 19 Minutes | 2 | 6.7% |
| 20 to 24 Minutes | 0 | 0.0% |
| 25 to 29 Minutes | 8 | 26.7% |
| 30 to 34 Minutes | 10 | 33.3% |
| 35 to 39 Minutes | 0 | 0.0% |
| 40 to 44 Minutes | 0 | 0.0% |
| 45 to 59 Minutes | 6 | 20.0% |
| 60 to 89 Minutes | 0 | 0.0% |
| 90 or more Minutes | 0 | 0.0% |
Commute Time by Sex in Lone Oak
The most common commute times in Lone Oak are 30 to 34 minutes (7 commuters, 36.8%) for males and 25 to 29 minutes (8 commuters, 72.7%) for females.
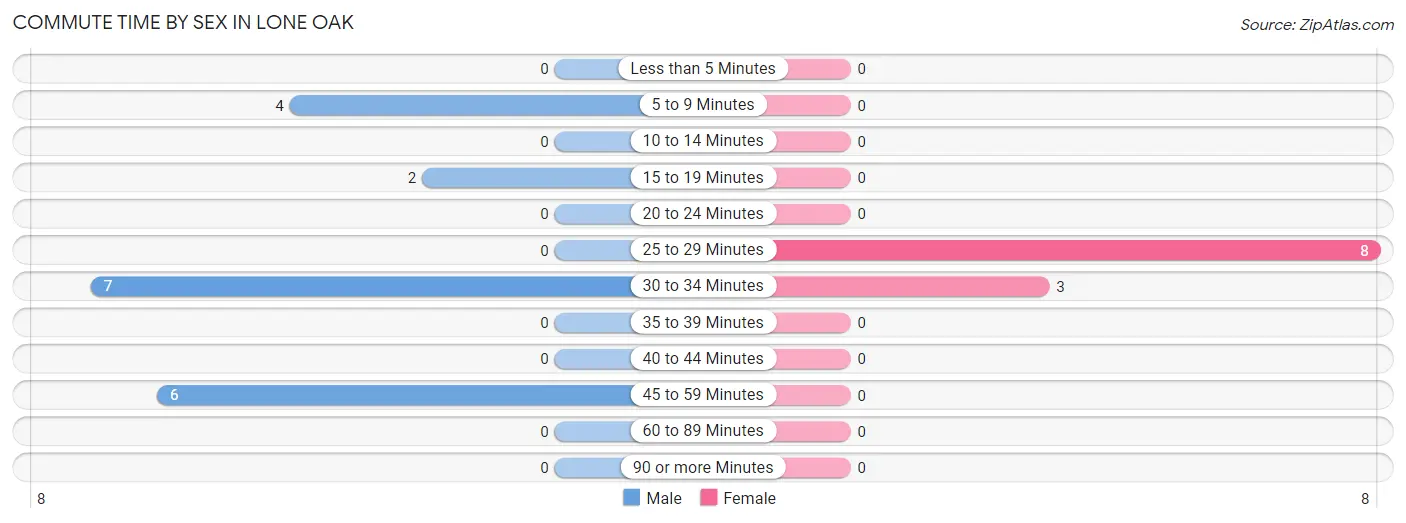
| Commute Time | Male | Female |
| Less than 5 Minutes | 0 (0.0%) | 0 (0.0%) |
| 5 to 9 Minutes | 4 (21.0%) | 0 (0.0%) |
| 10 to 14 Minutes | 0 (0.0%) | 0 (0.0%) |
| 15 to 19 Minutes | 2 (10.5%) | 0 (0.0%) |
| 20 to 24 Minutes | 0 (0.0%) | 0 (0.0%) |
| 25 to 29 Minutes | 0 (0.0%) | 8 (72.7%) |
| 30 to 34 Minutes | 7 (36.8%) | 3 (27.3%) |
| 35 to 39 Minutes | 0 (0.0%) | 0 (0.0%) |
| 40 to 44 Minutes | 0 (0.0%) | 0 (0.0%) |
| 45 to 59 Minutes | 6 (31.6%) | 0 (0.0%) |
| 60 to 89 Minutes | 0 (0.0%) | 0 (0.0%) |
| 90 or more Minutes | 0 (0.0%) | 0 (0.0%) |
Time of Departure to Work by Sex in Lone Oak
The most frequent times of departure to work in Lone Oak are 5:00 AM to 5:29 AM (4, 21.0%) for males and 12:00 AM to 4:59 AM (3, 27.3%) for females.
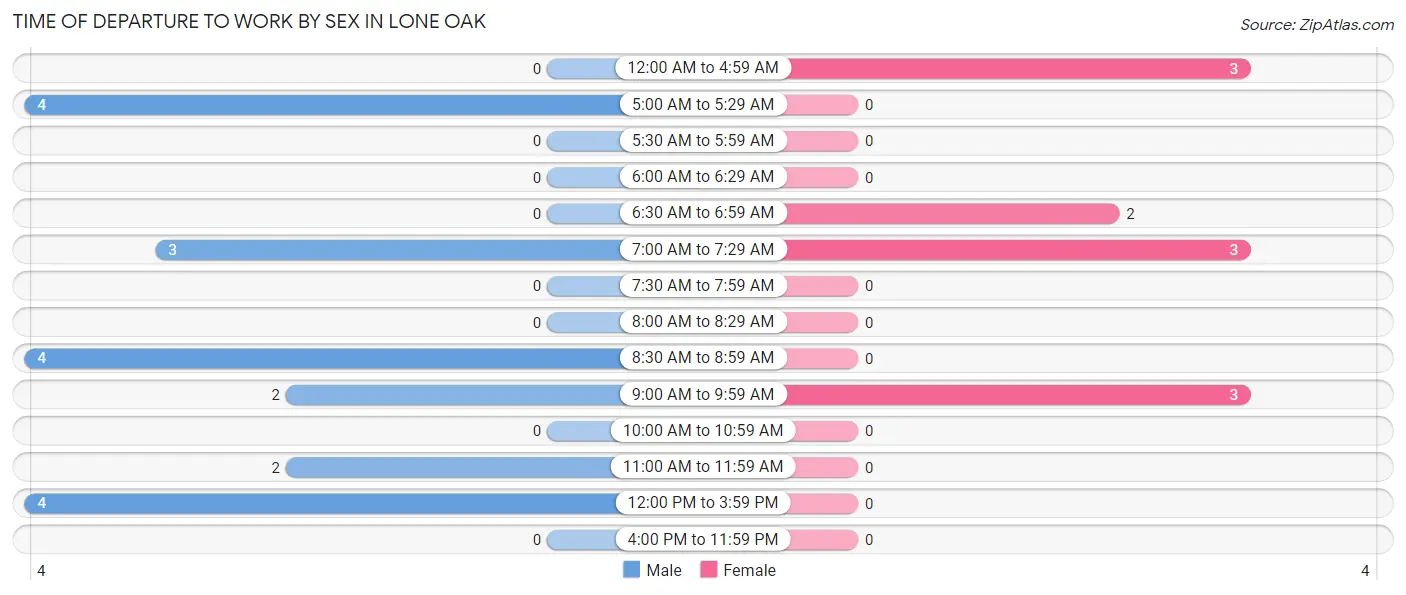
| Time of Departure | Male | Female |
| 12:00 AM to 4:59 AM | 0 (0.0%) | 3 (27.3%) |
| 5:00 AM to 5:29 AM | 4 (21.0%) | 0 (0.0%) |
| 5:30 AM to 5:59 AM | 0 (0.0%) | 0 (0.0%) |
| 6:00 AM to 6:29 AM | 0 (0.0%) | 0 (0.0%) |
| 6:30 AM to 6:59 AM | 0 (0.0%) | 2 (18.2%) |
| 7:00 AM to 7:29 AM | 3 (15.8%) | 3 (27.3%) |
| 7:30 AM to 7:59 AM | 0 (0.0%) | 0 (0.0%) |
| 8:00 AM to 8:29 AM | 0 (0.0%) | 0 (0.0%) |
| 8:30 AM to 8:59 AM | 4 (21.0%) | 0 (0.0%) |
| 9:00 AM to 9:59 AM | 2 (10.5%) | 3 (27.3%) |
| 10:00 AM to 10:59 AM | 0 (0.0%) | 0 (0.0%) |
| 11:00 AM to 11:59 AM | 2 (10.5%) | 0 (0.0%) |
| 12:00 PM to 3:59 PM | 4 (21.0%) | 0 (0.0%) |
| 4:00 PM to 11:59 PM | 0 (0.0%) | 0 (0.0%) |
| Total | 19 (100.0%) | 11 (100.0%) |
Housing Occupancy in Lone Oak
Occupancy by Ownership in Lone Oak
Of the total 51 dwellings in Lone Oak, owner-occupied units account for 50 (98.0%), while renter-occupied units make up 1 (2.0%).
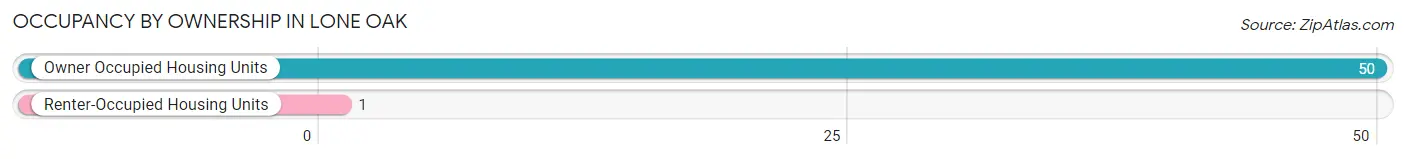
| Occupancy | # Housing Units | % Housing Units |
| Owner Occupied Housing Units | 50 | 98.0% |
| Renter-Occupied Housing Units | 1 | 2.0% |
| Total Occupied Housing Units | 51 | 100.0% |
Occupancy by Household Size in Lone Oak
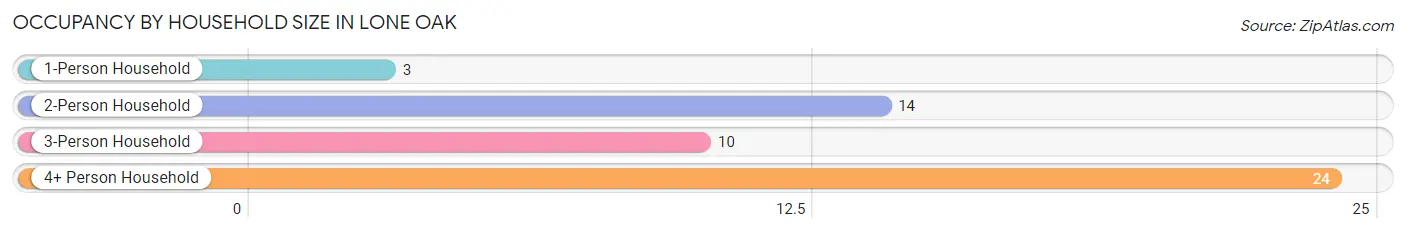
| Household Size | # Housing Units | % Housing Units |
| 1-Person Household | 3 | 5.9% |
| 2-Person Household | 14 | 27.5% |
| 3-Person Household | 10 | 19.6% |
| 4+ Person Household | 24 | 47.1% |
| Total Housing Units | 51 | 100.0% |
Occupancy by Ownership by Household Size in Lone Oak
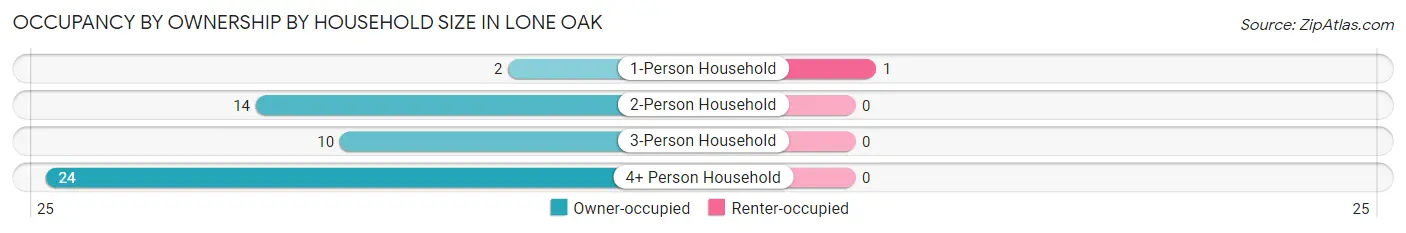
| Household Size | Owner-occupied | Renter-occupied |
| 1-Person Household | 2 (66.7%) | 1 (33.3%) |
| 2-Person Household | 14 (100.0%) | 0 (0.0%) |
| 3-Person Household | 10 (100.0%) | 0 (0.0%) |
| 4+ Person Household | 24 (100.0%) | 0 (0.0%) |
| Total Housing Units | 50 (98.0%) | 1 (2.0%) |
Occupancy by Educational Attainment in Lone Oak
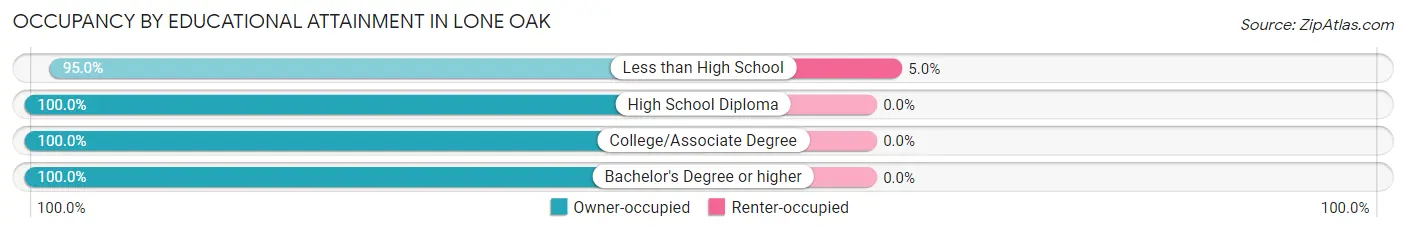
| Household Size | Owner-occupied | Renter-occupied |
| Less than High School | 19 (95.0%) | 1 (5.0%) |
| High School Diploma | 9 (100.0%) | 0 (0.0%) |
| College/Associate Degree | 15 (100.0%) | 0 (0.0%) |
| Bachelor's Degree or higher | 7 (100.0%) | 0 (0.0%) |
Occupancy by Age of Householder in Lone Oak
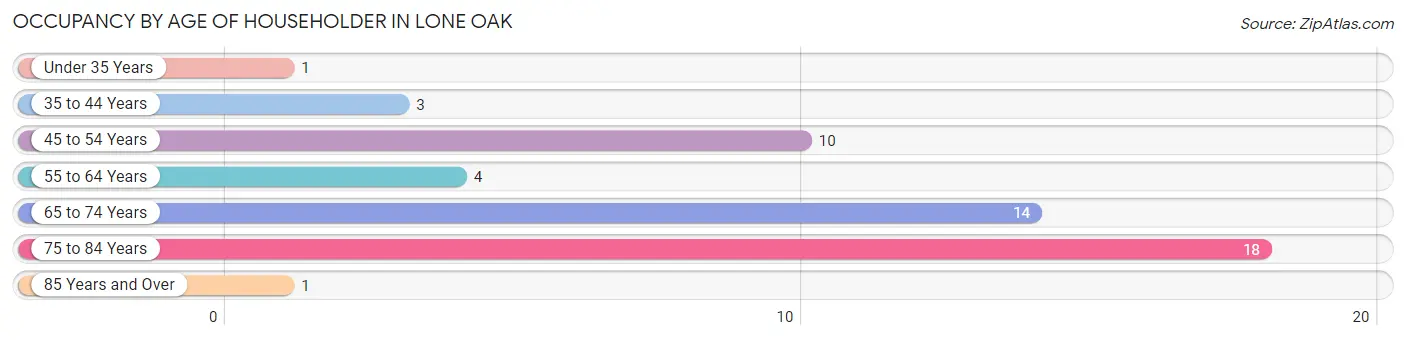
| Age Bracket | # Households | % Households |
| Under 35 Years | 1 | 2.0% |
| 35 to 44 Years | 3 | 5.9% |
| 45 to 54 Years | 10 | 19.6% |
| 55 to 64 Years | 4 | 7.8% |
| 65 to 74 Years | 14 | 27.5% |
| 75 to 84 Years | 18 | 35.3% |
| 85 Years and Over | 1 | 2.0% |
| Total | 51 | 100.0% |
Housing Finances in Lone Oak
Median Income by Occupancy in Lone Oak
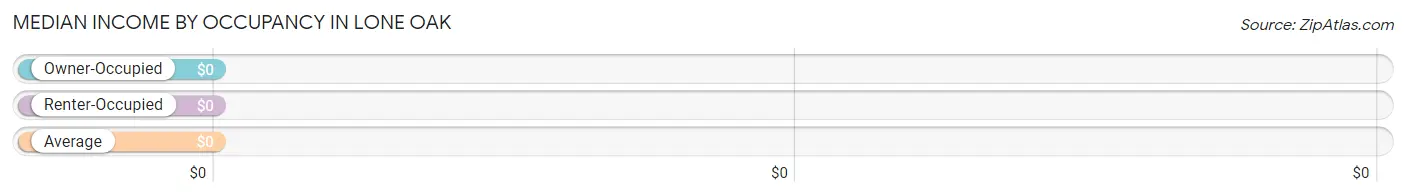
| Occupancy Type | # Households | Median Income |
| Owner-Occupied | 50 (98.0%) | $0 |
| Renter-Occupied | 1 (2.0%) | $0 |
| Average | 51 (100.0%) | $0 |
Occupancy by Householder Income Bracket in Lone Oak
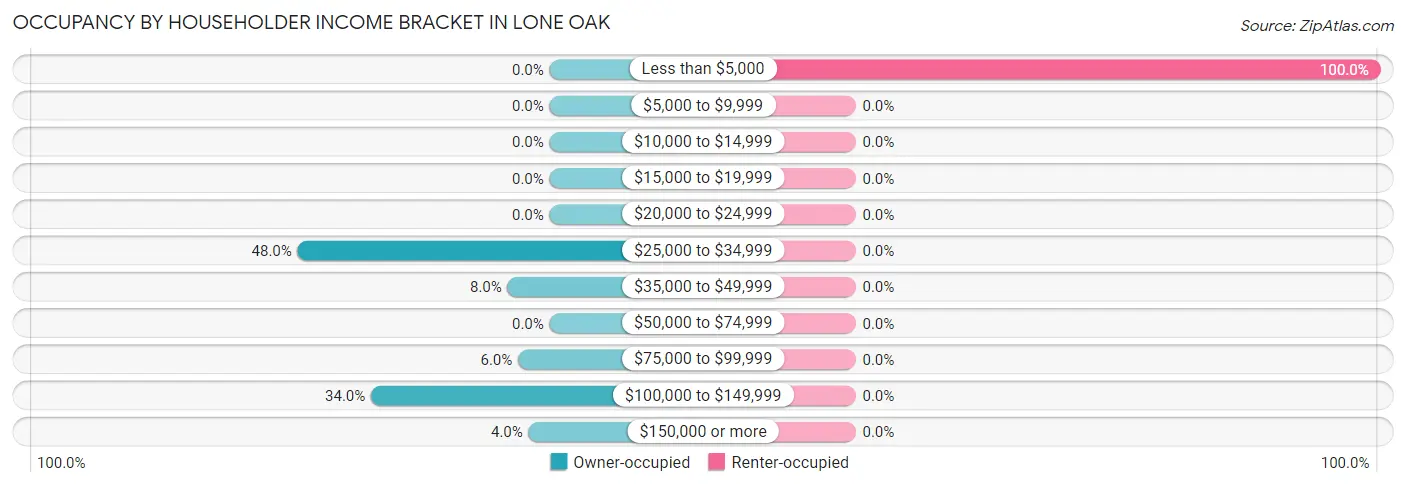
| Income Bracket | Owner-occupied | Renter-occupied |
| Less than $5,000 | 0 (0.0%) | 1 (100.0%) |
| $5,000 to $9,999 | 0 (0.0%) | 0 (0.0%) |
| $10,000 to $14,999 | 0 (0.0%) | 0 (0.0%) |
| $15,000 to $19,999 | 0 (0.0%) | 0 (0.0%) |
| $20,000 to $24,999 | 0 (0.0%) | 0 (0.0%) |
| $25,000 to $34,999 | 24 (48.0%) | 0 (0.0%) |
| $35,000 to $49,999 | 4 (8.0%) | 0 (0.0%) |
| $50,000 to $74,999 | 0 (0.0%) | 0 (0.0%) |
| $75,000 to $99,999 | 3 (6.0%) | 0 (0.0%) |
| $100,000 to $149,999 | 17 (34.0%) | 0 (0.0%) |
| $150,000 or more | 2 (4.0%) | 0 (0.0%) |
| Total | 50 (100.0%) | 1 (100.0%) |
Monthly Housing Cost Tiers in Lone Oak
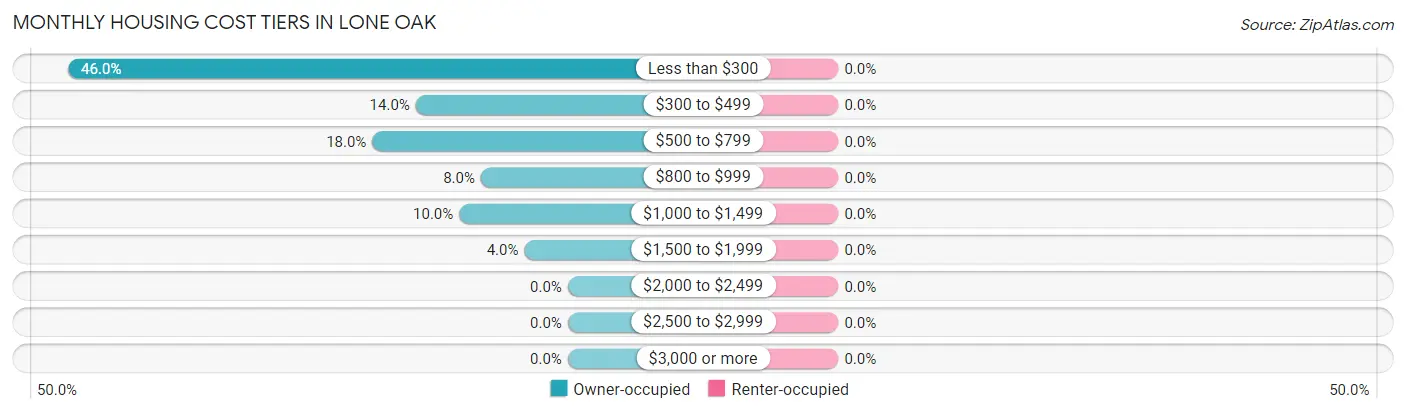
| Monthly Cost | Owner-occupied | Renter-occupied |
| Less than $300 | 23 (46.0%) | 0 (0.0%) |
| $300 to $499 | 7 (14.0%) | 0 (0.0%) |
| $500 to $799 | 9 (18.0%) | 0 (0.0%) |
| $800 to $999 | 4 (8.0%) | 0 (0.0%) |
| $1,000 to $1,499 | 5 (10.0%) | 0 (0.0%) |
| $1,500 to $1,999 | 2 (4.0%) | 0 (0.0%) |
| $2,000 to $2,499 | 0 (0.0%) | 0 (0.0%) |
| $2,500 to $2,999 | 0 (0.0%) | 0 (0.0%) |
| $3,000 or more | 0 (0.0%) | 0 (0.0%) |
| Total | 50 (100.0%) | 1 (100.0%) |
Physical Housing Characteristics in Lone Oak
Housing Structures in Lone Oak
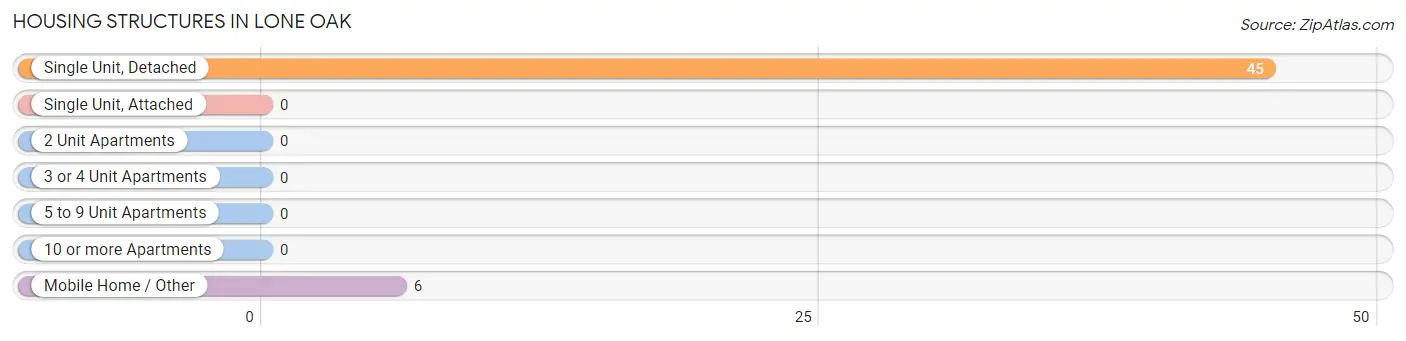
| Structure Type | # Housing Units | % Housing Units |
| Single Unit, Detached | 45 | 88.2% |
| Single Unit, Attached | 0 | 0.0% |
| 2 Unit Apartments | 0 | 0.0% |
| 3 or 4 Unit Apartments | 0 | 0.0% |
| 5 to 9 Unit Apartments | 0 | 0.0% |
| 10 or more Apartments | 0 | 0.0% |
| Mobile Home / Other | 6 | 11.8% |
| Total | 51 | 100.0% |
Housing Structures by Occupancy in Lone Oak
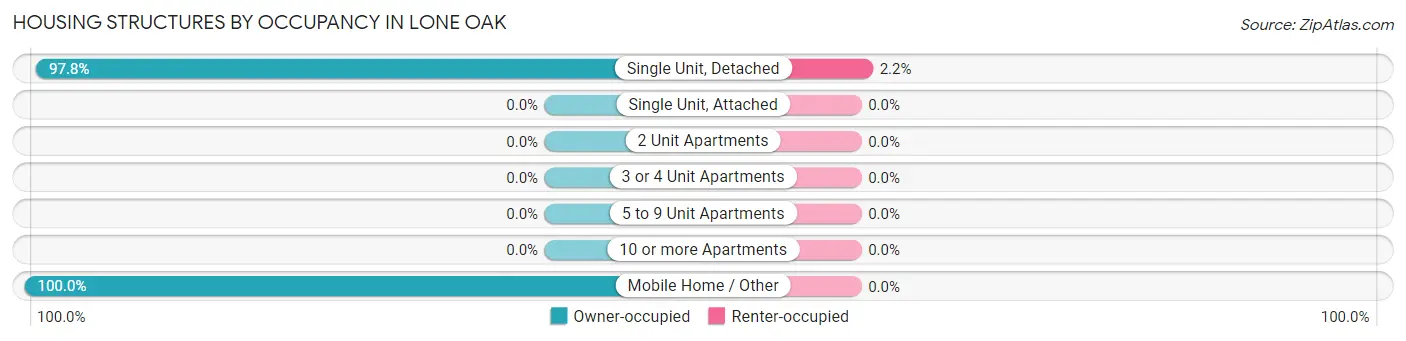
| Structure Type | Owner-occupied | Renter-occupied |
| Single Unit, Detached | 44 (97.8%) | 1 (2.2%) |
| Single Unit, Attached | 0 (0.0%) | 0 (0.0%) |
| 2 Unit Apartments | 0 (0.0%) | 0 (0.0%) |
| 3 or 4 Unit Apartments | 0 (0.0%) | 0 (0.0%) |
| 5 to 9 Unit Apartments | 0 (0.0%) | 0 (0.0%) |
| 10 or more Apartments | 0 (0.0%) | 0 (0.0%) |
| Mobile Home / Other | 6 (100.0%) | 0 (0.0%) |
| Total | 50 (98.0%) | 1 (2.0%) |
Housing Structures by Number of Rooms in Lone Oak
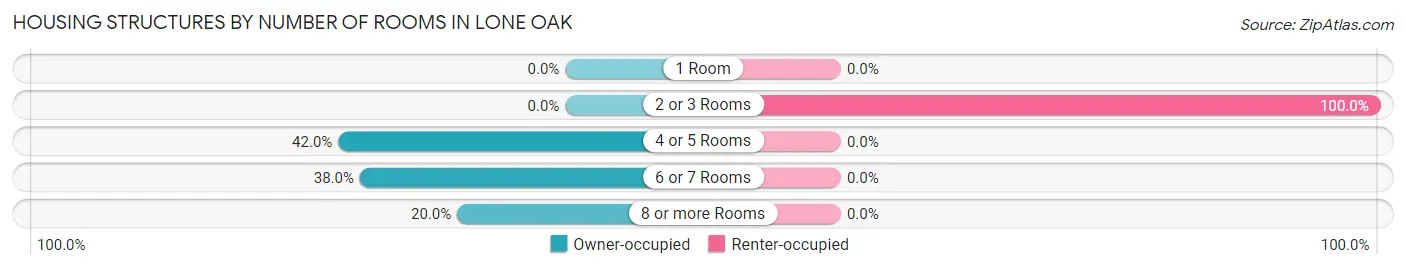
| Number of Rooms | Owner-occupied | Renter-occupied |
| 1 Room | 0 (0.0%) | 0 (0.0%) |
| 2 or 3 Rooms | 0 (0.0%) | 1 (100.0%) |
| 4 or 5 Rooms | 21 (42.0%) | 0 (0.0%) |
| 6 or 7 Rooms | 19 (38.0%) | 0 (0.0%) |
| 8 or more Rooms | 10 (20.0%) | 0 (0.0%) |
| Total | 50 (100.0%) | 1 (100.0%) |
Housing Structure by Heating Type in Lone Oak
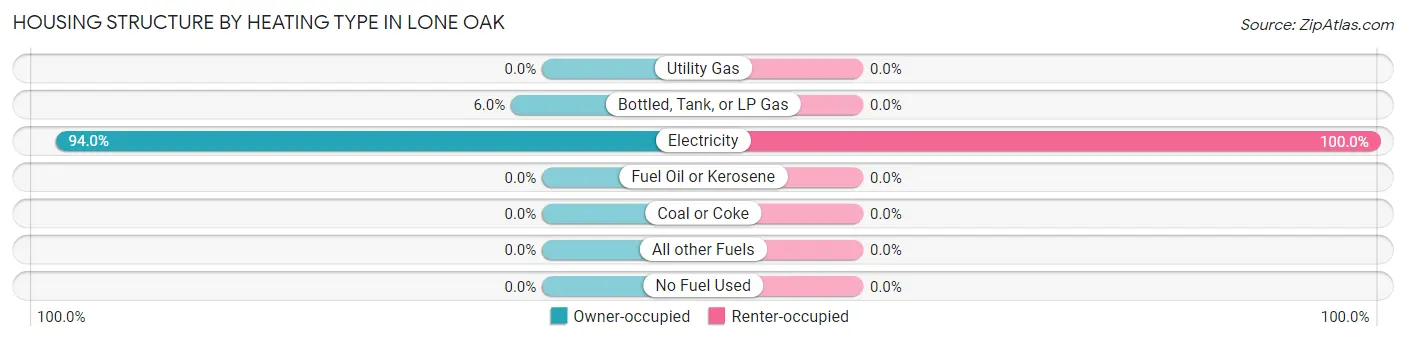
| Heating Type | Owner-occupied | Renter-occupied |
| Utility Gas | 0 (0.0%) | 0 (0.0%) |
| Bottled, Tank, or LP Gas | 3 (6.0%) | 0 (0.0%) |
| Electricity | 47 (94.0%) | 1 (100.0%) |
| Fuel Oil or Kerosene | 0 (0.0%) | 0 (0.0%) |
| Coal or Coke | 0 (0.0%) | 0 (0.0%) |
| All other Fuels | 0 (0.0%) | 0 (0.0%) |
| No Fuel Used | 0 (0.0%) | 0 (0.0%) |
| Total | 50 (100.0%) | 1 (100.0%) |
Household Vehicle Usage in Lone Oak
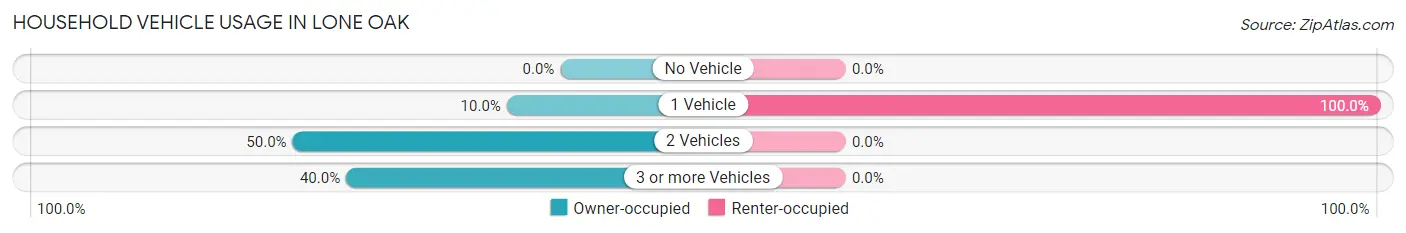
| Vehicles per Household | Owner-occupied | Renter-occupied |
| No Vehicle | 0 (0.0%) | 0 (0.0%) |
| 1 Vehicle | 5 (10.0%) | 1 (100.0%) |
| 2 Vehicles | 25 (50.0%) | 0 (0.0%) |
| 3 or more Vehicles | 20 (40.0%) | 0 (0.0%) |
| Total | 50 (100.0%) | 1 (100.0%) |
Real Estate & Mortgages in Lone Oak
Real Estate and Mortgage Overview in Lone Oak
| Characteristic | Without Mortgage | With Mortgage |
| Housing Units | 39 | 11 |
| Median Property Value | - | - |
| Median Household Income | - | - |
| Monthly Housing Costs | $292 | $0 |
| Real Estate Taxes | - | - |
Property Value by Mortgage Status in Lone Oak
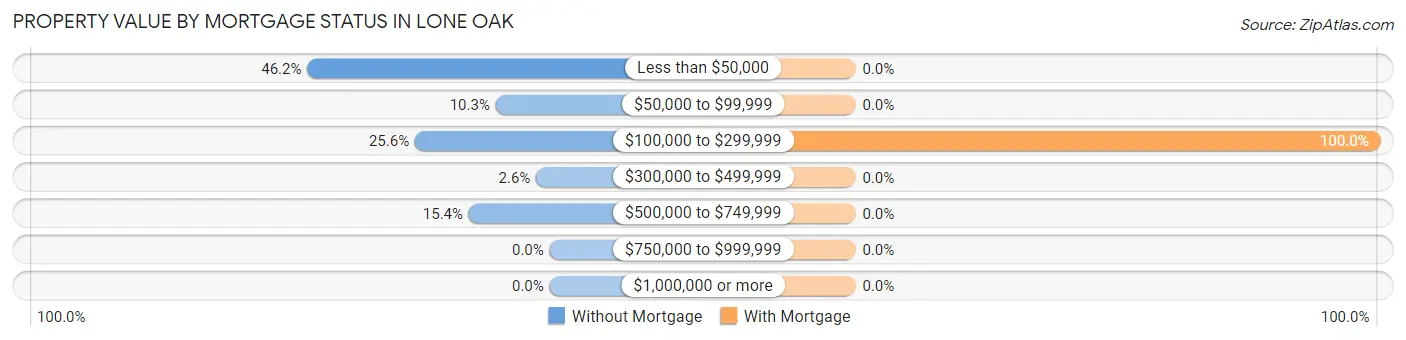
| Property Value | Without Mortgage | With Mortgage |
| Less than $50,000 | 18 (46.2%) | 0 (0.0%) |
| $50,000 to $99,999 | 4 (10.3%) | 0 (0.0%) |
| $100,000 to $299,999 | 10 (25.6%) | 11 (100.0%) |
| $300,000 to $499,999 | 1 (2.6%) | 0 (0.0%) |
| $500,000 to $749,999 | 6 (15.4%) | 0 (0.0%) |
| $750,000 to $999,999 | 0 (0.0%) | 0 (0.0%) |
| $1,000,000 or more | 0 (0.0%) | 0 (0.0%) |
| Total | 39 (100.0%) | 11 (100.0%) |
Household Income by Mortgage Status in Lone Oak
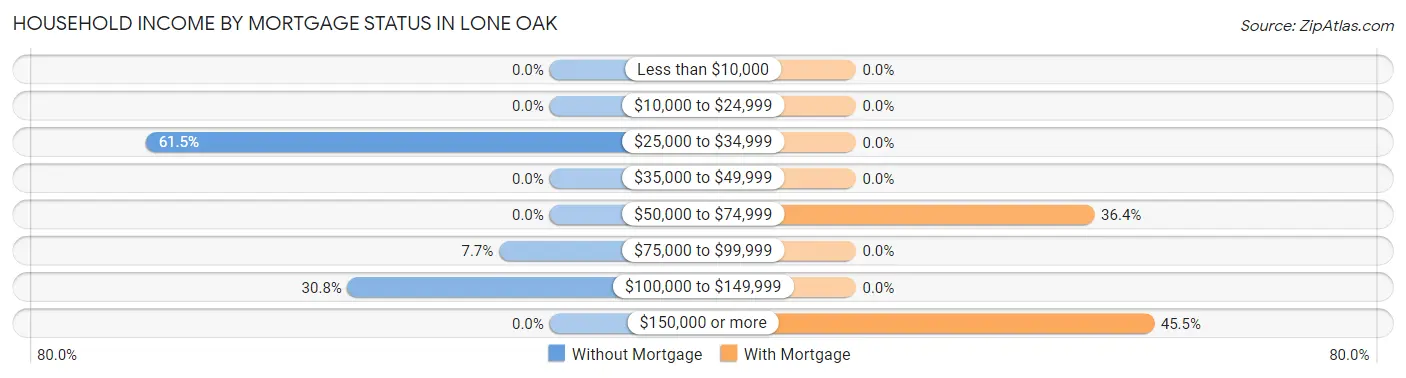
| Household Income | Without Mortgage | With Mortgage |
| Less than $10,000 | 0 (0.0%) | 0 (0.0%) |
| $10,000 to $24,999 | 0 (0.0%) | 0 (0.0%) |
| $25,000 to $34,999 | 24 (61.5%) | 0 (0.0%) |
| $35,000 to $49,999 | 0 (0.0%) | 0 (0.0%) |
| $50,000 to $74,999 | 0 (0.0%) | 4 (36.4%) |
| $75,000 to $99,999 | 3 (7.7%) | 0 (0.0%) |
| $100,000 to $149,999 | 12 (30.8%) | 0 (0.0%) |
| $150,000 or more | 0 (0.0%) | 5 (45.5%) |
| Total | 39 (100.0%) | 11 (100.0%) |
Property Value to Household Income Ratio in Lone Oak
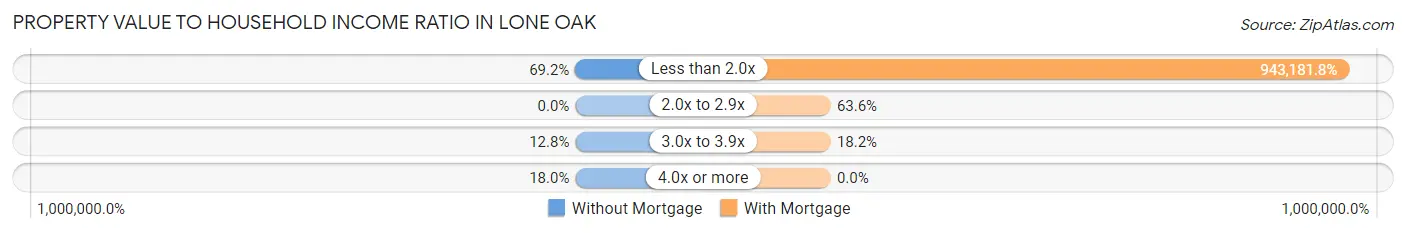
| Value-to-Income Ratio | Without Mortgage | With Mortgage |
| Less than 2.0x | 27 (69.2%) | 103,750 (943,181.8%) |
| 2.0x to 2.9x | 0 (0.0%) | 7 (63.6%) |
| 3.0x to 3.9x | 5 (12.8%) | 2 (18.2%) |
| 4.0x or more | 7 (17.9%) | 0 (0.0%) |
| Total | 39 (100.0%) | 11 (100.0%) |
Real Estate Taxes by Mortgage Status in Lone Oak
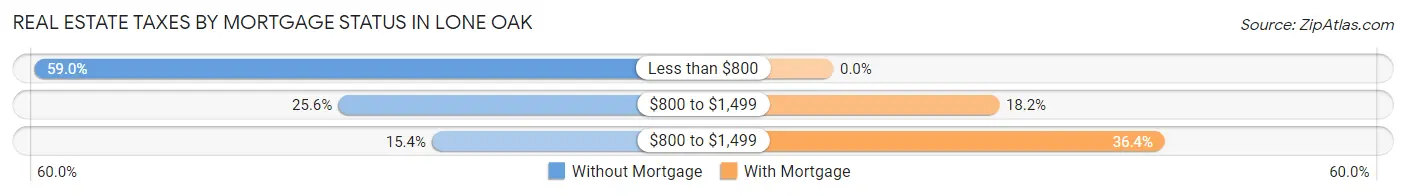
| Property Taxes | Without Mortgage | With Mortgage |
| Less than $800 | 23 (59.0%) | 0 (0.0%) |
| $800 to $1,499 | 10 (25.6%) | 2 (18.2%) |
| $800 to $1,499 | 6 (15.4%) | 4 (36.4%) |
| Total | 39 (100.0%) | 11 (100.0%) |
Health & Disability in Lone Oak
Health Insurance Coverage by Age in Lone Oak
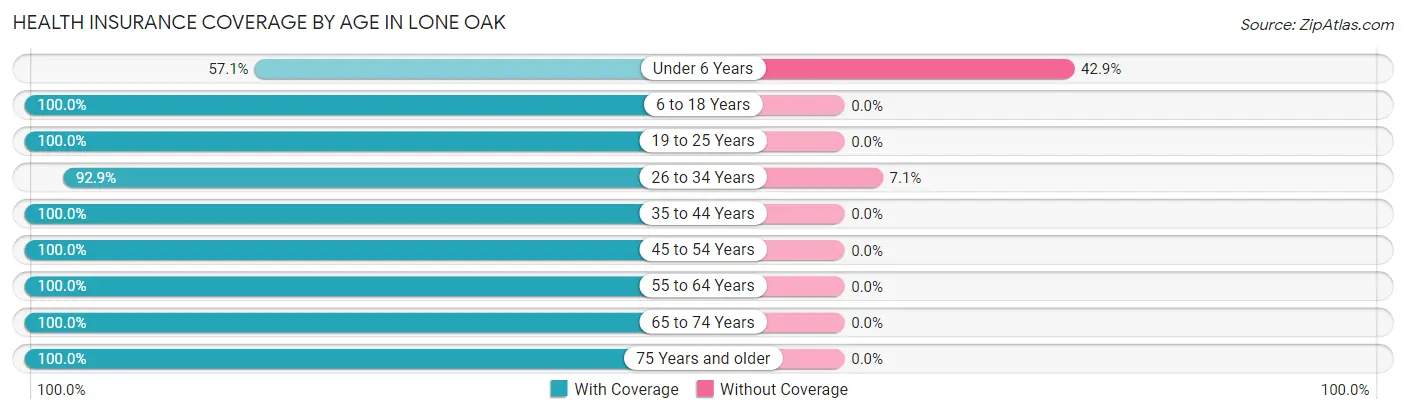
| Age Bracket | With Coverage | Without Coverage |
| Under 6 Years | 12 (57.1%) | 9 (42.9%) |
| 6 to 18 Years | 53 (100.0%) | 0 (0.0%) |
| 19 to 25 Years | 5 (100.0%) | 0 (0.0%) |
| 26 to 34 Years | 13 (92.9%) | 1 (7.1%) |
| 35 to 44 Years | 8 (100.0%) | 0 (0.0%) |
| 45 to 54 Years | 13 (100.0%) | 0 (0.0%) |
| 55 to 64 Years | 32 (100.0%) | 0 (0.0%) |
| 65 to 74 Years | 17 (100.0%) | 0 (0.0%) |
| 75 Years and older | 19 (100.0%) | 0 (0.0%) |
| Total | 172 (94.5%) | 10 (5.5%) |
Health Insurance Coverage by Citizenship Status in Lone Oak
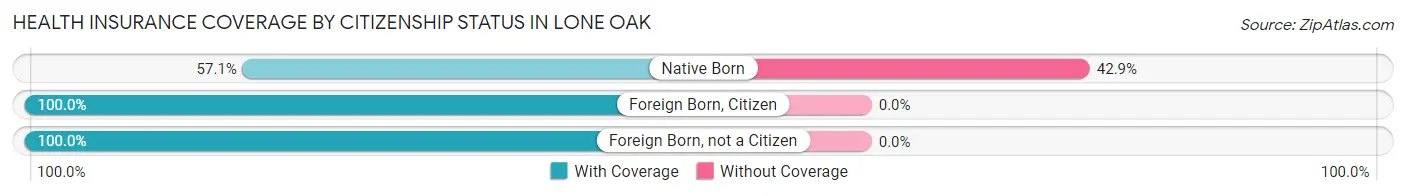
| Citizenship Status | With Coverage | Without Coverage |
| Native Born | 12 (57.1%) | 9 (42.9%) |
| Foreign Born, Citizen | 53 (100.0%) | 0 (0.0%) |
| Foreign Born, not a Citizen | 5 (100.0%) | 0 (0.0%) |
Health Insurance Coverage by Household Income in Lone Oak
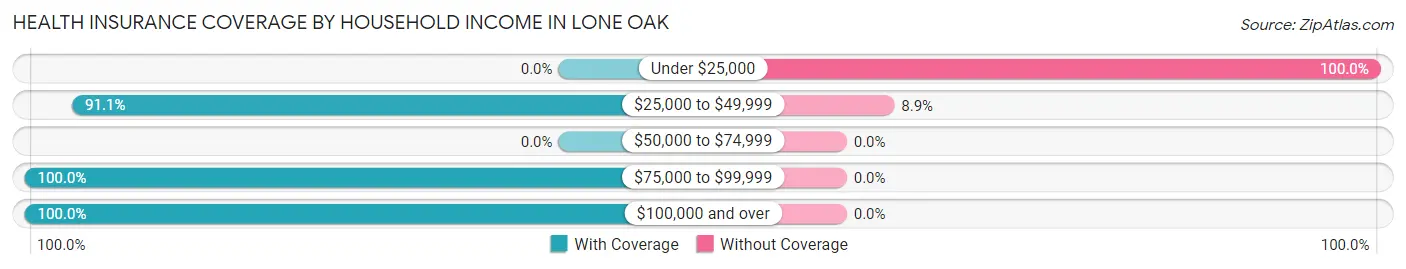
| Household Income | With Coverage | Without Coverage |
| Under $25,000 | 0 (0.0%) | 1 (100.0%) |
| $25,000 to $49,999 | 92 (91.1%) | 9 (8.9%) |
| $50,000 to $74,999 | 0 (0.0%) | 0 (0.0%) |
| $75,000 to $99,999 | 8 (100.0%) | 0 (0.0%) |
| $100,000 and over | 72 (100.0%) | 0 (0.0%) |
Public vs Private Health Insurance Coverage by Age in Lone Oak
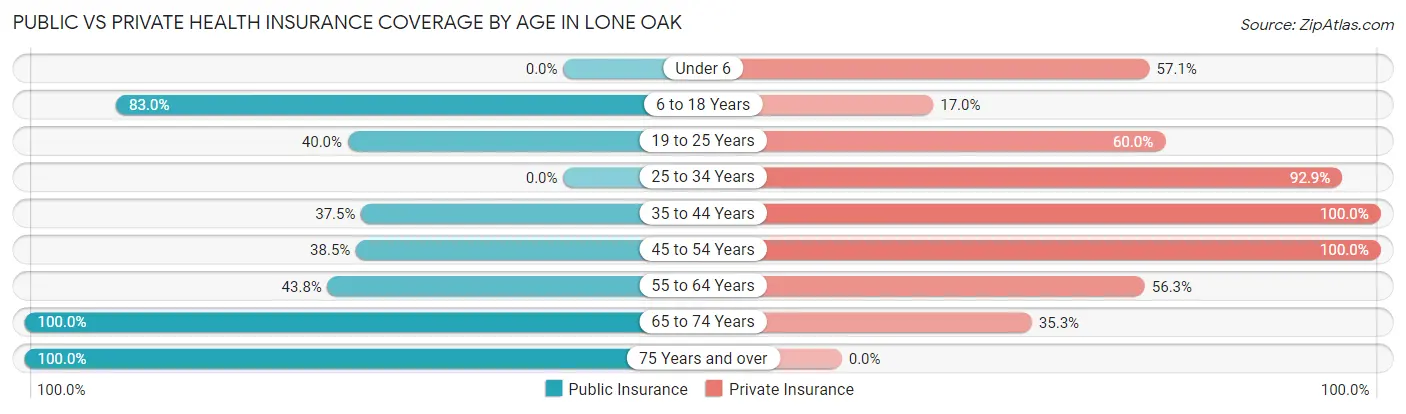
| Age Bracket | Public Insurance | Private Insurance |
| Under 6 | 0 (0.0%) | 12 (57.1%) |
| 6 to 18 Years | 44 (83.0%) | 9 (17.0%) |
| 19 to 25 Years | 2 (40.0%) | 3 (60.0%) |
| 25 to 34 Years | 0 (0.0%) | 13 (92.9%) |
| 35 to 44 Years | 3 (37.5%) | 8 (100.0%) |
| 45 to 54 Years | 5 (38.5%) | 13 (100.0%) |
| 55 to 64 Years | 14 (43.8%) | 18 (56.2%) |
| 65 to 74 Years | 17 (100.0%) | 6 (35.3%) |
| 75 Years and over | 19 (100.0%) | 0 (0.0%) |
| Total | 104 (57.1%) | 82 (45.1%) |
Disability Status by Sex by Age in Lone Oak
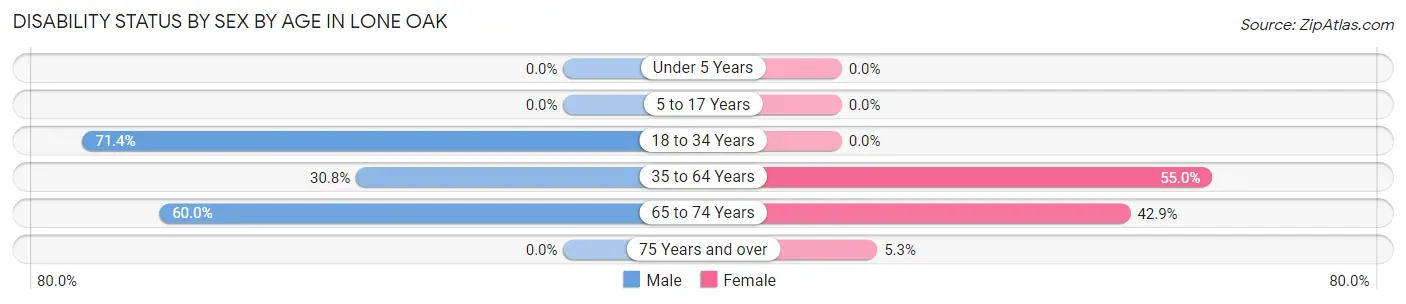
| Age Bracket | Male | Female |
| Under 5 Years | 0 (0.0%) | 0 (0.0%) |
| 5 to 17 Years | 0 (0.0%) | 0 (0.0%) |
| 18 to 34 Years | 5 (71.4%) | 0 (0.0%) |
| 35 to 64 Years | 4 (30.8%) | 22 (55.0%) |
| 65 to 74 Years | 6 (60.0%) | 3 (42.9%) |
| 75 Years and over | 0 (0.0%) | 1 (5.3%) |
Disability Class by Sex by Age in Lone Oak
Disability Class: Hearing Difficulty
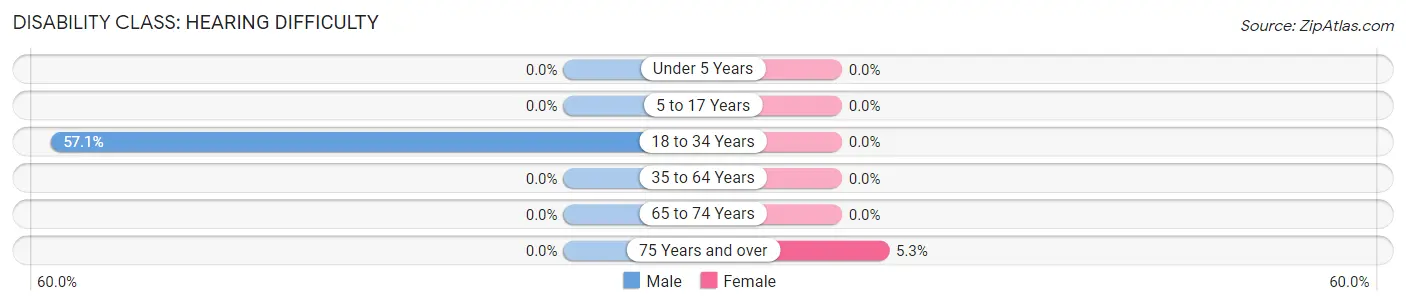
| Age Bracket | Male | Female |
| Under 5 Years | 0 (0.0%) | 0 (0.0%) |
| 5 to 17 Years | 0 (0.0%) | 0 (0.0%) |
| 18 to 34 Years | 4 (57.1%) | 0 (0.0%) |
| 35 to 64 Years | 0 (0.0%) | 0 (0.0%) |
| 65 to 74 Years | 0 (0.0%) | 0 (0.0%) |
| 75 Years and over | 0 (0.0%) | 1 (5.3%) |
Disability Class: Vision Difficulty
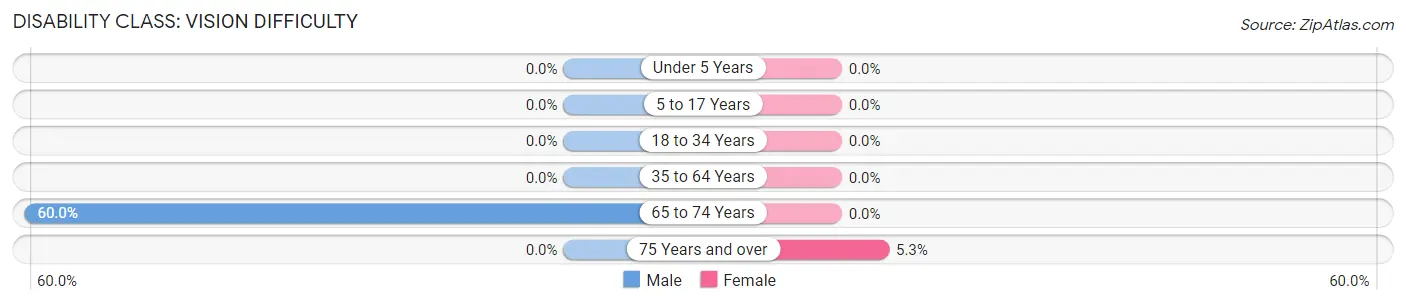
| Age Bracket | Male | Female |
| Under 5 Years | 0 (0.0%) | 0 (0.0%) |
| 5 to 17 Years | 0 (0.0%) | 0 (0.0%) |
| 18 to 34 Years | 0 (0.0%) | 0 (0.0%) |
| 35 to 64 Years | 0 (0.0%) | 0 (0.0%) |
| 65 to 74 Years | 6 (60.0%) | 0 (0.0%) |
| 75 Years and over | 0 (0.0%) | 1 (5.3%) |
Disability Class: Cognitive Difficulty
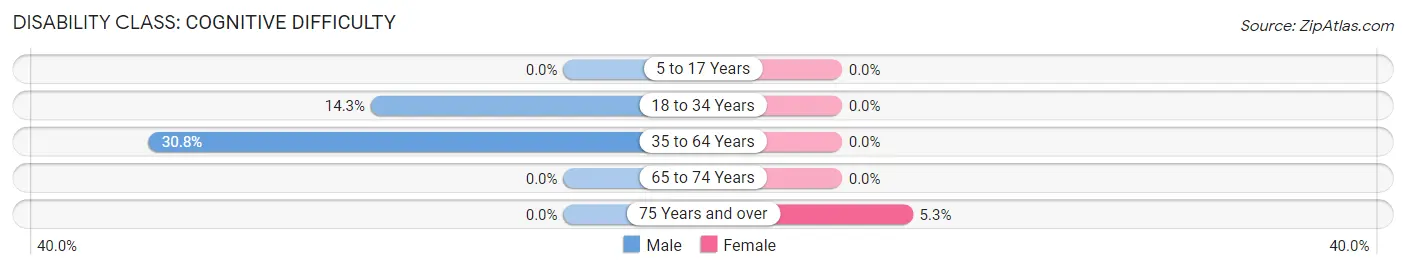
| Age Bracket | Male | Female |
| 5 to 17 Years | 0 (0.0%) | 0 (0.0%) |
| 18 to 34 Years | 1 (14.3%) | 0 (0.0%) |
| 35 to 64 Years | 4 (30.8%) | 0 (0.0%) |
| 65 to 74 Years | 0 (0.0%) | 0 (0.0%) |
| 75 Years and over | 0 (0.0%) | 1 (5.3%) |
Disability Class: Ambulatory Difficulty
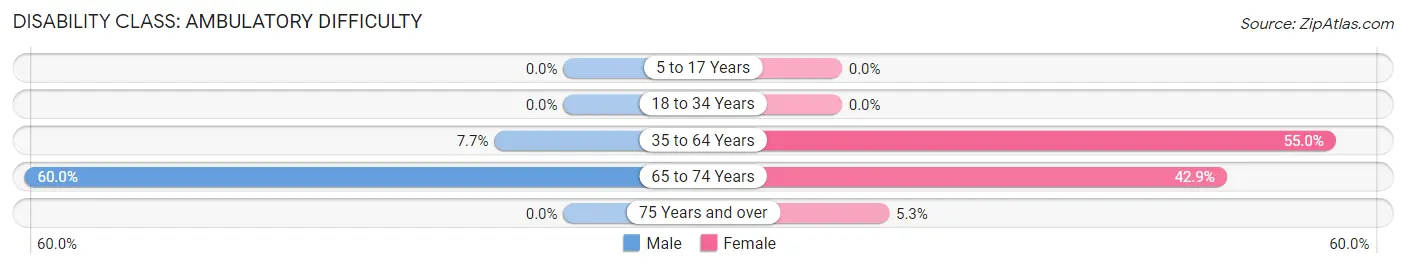
| Age Bracket | Male | Female |
| 5 to 17 Years | 0 (0.0%) | 0 (0.0%) |
| 18 to 34 Years | 0 (0.0%) | 0 (0.0%) |
| 35 to 64 Years | 1 (7.7%) | 22 (55.0%) |
| 65 to 74 Years | 6 (60.0%) | 3 (42.9%) |
| 75 Years and over | 0 (0.0%) | 1 (5.3%) |
Disability Class: Self-Care Difficulty
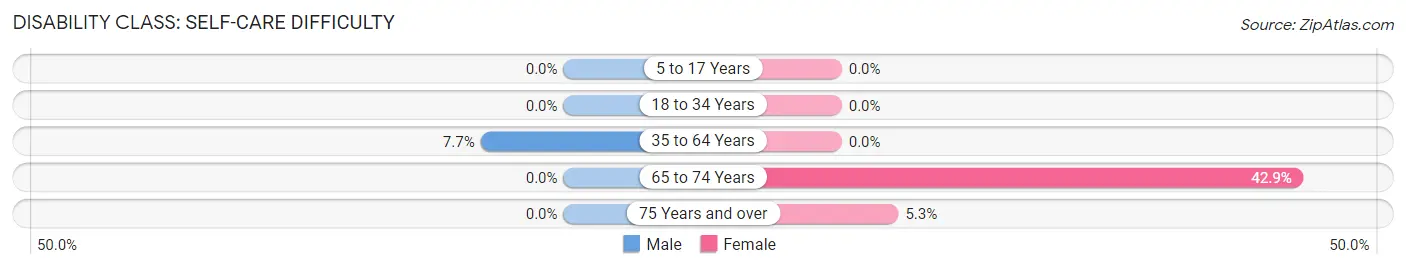
| Age Bracket | Male | Female |
| 5 to 17 Years | 0 (0.0%) | 0 (0.0%) |
| 18 to 34 Years | 0 (0.0%) | 0 (0.0%) |
| 35 to 64 Years | 1 (7.7%) | 0 (0.0%) |
| 65 to 74 Years | 0 (0.0%) | 3 (42.9%) |
| 75 Years and over | 0 (0.0%) | 1 (5.3%) |
Technology Access in Lone Oak
Computing Device Access in Lone Oak
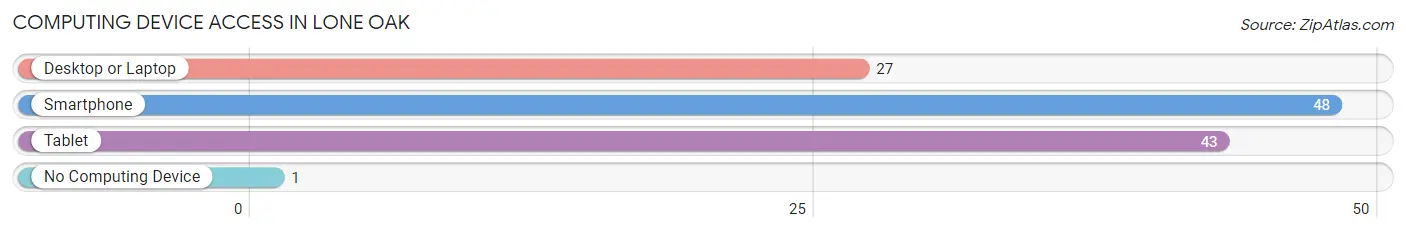
| Device Type | # Households | % Households |
| Desktop or Laptop | 27 | 52.9% |
| Smartphone | 48 | 94.1% |
| Tablet | 43 | 84.3% |
| No Computing Device | 1 | 2.0% |
| Total | 51 | 100.0% |
Internet Access in Lone Oak
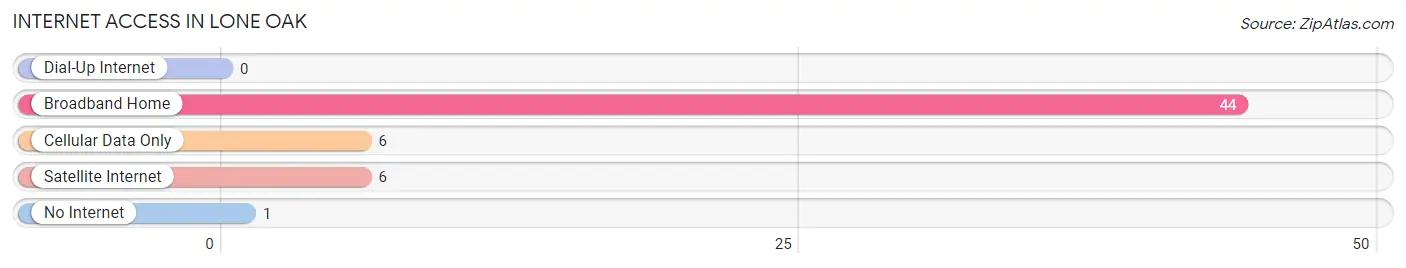
| Internet Type | # Households | % Households |
| Dial-Up Internet | 0 | 0.0% |
| Broadband Home | 44 | 86.3% |
| Cellular Data Only | 6 | 11.8% |
| Satellite Internet | 6 | 11.8% |
| No Internet | 1 | 2.0% |
| Total | 51 | 100.0% |
Lone Oak Summary
Lone Oak is a small unincorporated community located in Meriwether County, Georgia, United States. It is situated along the Flint River, approximately 10 miles south of the county seat of Greenville. The population of Lone Oak was estimated to be around 500 in 2020.
History
Lone Oak was first settled in the early 1800s by a group of settlers from North Carolina. The town was originally known as “Lone Oak Crossroads” due to the presence of a large oak tree that stood at the intersection of two roads. The town was later renamed to Lone Oak in 1845.
In the late 1800s, Lone Oak was a thriving agricultural community. Cotton was the main crop grown in the area, and the town was home to several cotton gins and a sawmill. The town also had a post office, a general store, and a blacksmith shop.
In the early 1900s, the town began to decline as the cotton industry moved away from the area. The town’s population decreased and many of the businesses closed. In the late 1900s, the town began to experience a resurgence as new businesses opened and the population began to grow again.
Geography
Lone Oak is located in Meriwether County, Georgia, approximately 10 miles south of the county seat of Greenville. The town is situated along the Flint River, which flows through the area. The town is surrounded by rolling hills and forests, and is located near several state parks and recreational areas.
The climate in Lone Oak is humid subtropical, with hot, humid summers and mild winters. The average annual temperature is around 70 degrees Fahrenheit, and the average annual precipitation is around 50 inches.
Economy
The economy of Lone Oak is largely based on agriculture and tourism. The town is home to several farms that grow cotton, corn, soybeans, and other crops. The town is also home to several small businesses, including restaurants, convenience stores, and a gas station.
Tourism is an important part of the economy in Lone Oak. The town is home to several recreational areas, including the Flint River State Park and the Lone Oak Wildlife Management Area. The town also hosts several festivals and events throughout the year, including the Lone Oak Festival and the Meriwether County Fair.
Demographics
As of the 2010 census, the population of Lone Oak was estimated to be around 500. The racial makeup of the town was 94.2% White, 3.2% African American, 0.4% Native American, 0.2% Asian, and 2.0% from other races. The median household income in Lone Oak was estimated to be around $35,000 in 2020.
Conclusion
Lone Oak is a small unincorporated community located in Meriwether County, Georgia. The town has a long history, dating back to the early 1800s, and has experienced a resurgence in recent years. The economy of Lone Oak is largely based on agriculture and tourism, and the town is home to several recreational areas. The population of Lone Oak was estimated to be around 500 in 2020, and the median household income was estimated to be around $35,000.
Common Questions
What is Per Capita Income in Lone Oak?
Per Capita income in Lone Oak is $19,069.
What is Income or Wage Gap in Lone Oak?
Income or Wage Gap in Lone Oak is 43.0%.
Women in Lone Oak earn 57.0 cents for every dollar earned by a man.
What is Inequality or Gini Index in Lone Oak?
Inequality or Gini Index in Lone Oak is 0.35.
What is the Total Population of Lone Oak?
Total Population of Lone Oak is 182.
What is the Total Male Population of Lone Oak?
Total Male Population of Lone Oak is 61.
What is the Total Female Population of Lone Oak?
Total Female Population of Lone Oak is 121.
What is the Ratio of Males per 100 Females in Lone Oak?
There are 50.41 Males per 100 Females in Lone Oak.
What is the Ratio of Females per 100 Males in Lone Oak?
There are 198.36 Females per 100 Males in Lone Oak.
What is the Median Population Age in Lone Oak?
Median Population Age in Lone Oak is 32.7 Years.
What is the Average Family Size in Lone Oak
Average Family Size in Lone Oak is 3.7 People.
What is the Average Household Size in Lone Oak
Average Household Size in Lone Oak is 3.6 People.
How Large is the Labor Force in Lone Oak?
There are 35 People in the Labor Forcein in Lone Oak.
What is the Percentage of People in the Labor Force in Lone Oak?
28.0% of People are in the Labor Force in Lone Oak.