Pavo, GA Map & Demographics
Pavo Map
Pavo Overview
$21,883
PER CAPITA INCOME
$45,179
AVG FAMILY INCOME
$37,250
AVG HOUSEHOLD INCOME
36.0%
WAGE / INCOME GAP [ % ]
64.0¢/ $1
WAGE / INCOME GAP [ $ ]
0.41
INEQUALITY / GINI INDEX
715
TOTAL POPULATION
377
MALE POPULATION
338
FEMALE POPULATION
111.54
MALES / 100 FEMALES
89.66
FEMALES / 100 MALES
47.2
MEDIAN AGE
3.1
AVG FAMILY SIZE
2.4
AVG HOUSEHOLD SIZE
317
LABOR FORCE [ PEOPLE ]
55.6%
PERCENT IN LABOR FORCE
1.9%
UNEMPLOYMENT RATE
Pavo Zip Codes
Pavo Area Codes
Income in Pavo
Income Overview in Pavo
Per Capita Income in Pavo is $21,883, while median incomes of families and households are $45,179 and $37,250 respectively.
| Characteristic | Number | Measure |
| Per Capita Income | 715 | $21,883 |
| Median Family Income | 161 | $45,179 |
| Mean Family Income | 161 | $57,392 |
| Median Household Income | 295 | $37,250 |
| Mean Household Income | 295 | $51,529 |
| Income Deficit | 161 | $0 |
| Wage / Income Gap (%) | 715 | 35.98% |
| Wage / Income Gap ($) | 715 | 64.02¢ per $1 |
| Gini / Inequality Index | 715 | 0.41 |
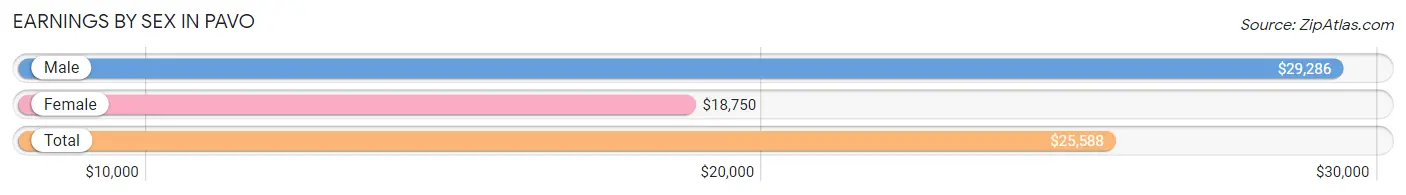
Earnings by Sex in Pavo
Average Earnings in Pavo are $25,588, $29,286 for men and $18,750 for women, a difference of 36.0%.
| Sex | Number | Average Earnings |
| Male | 208 (55.3%) | $29,286 |
| Female | 168 (44.7%) | $18,750 |
| Total | 376 (100.0%) | $25,588 |
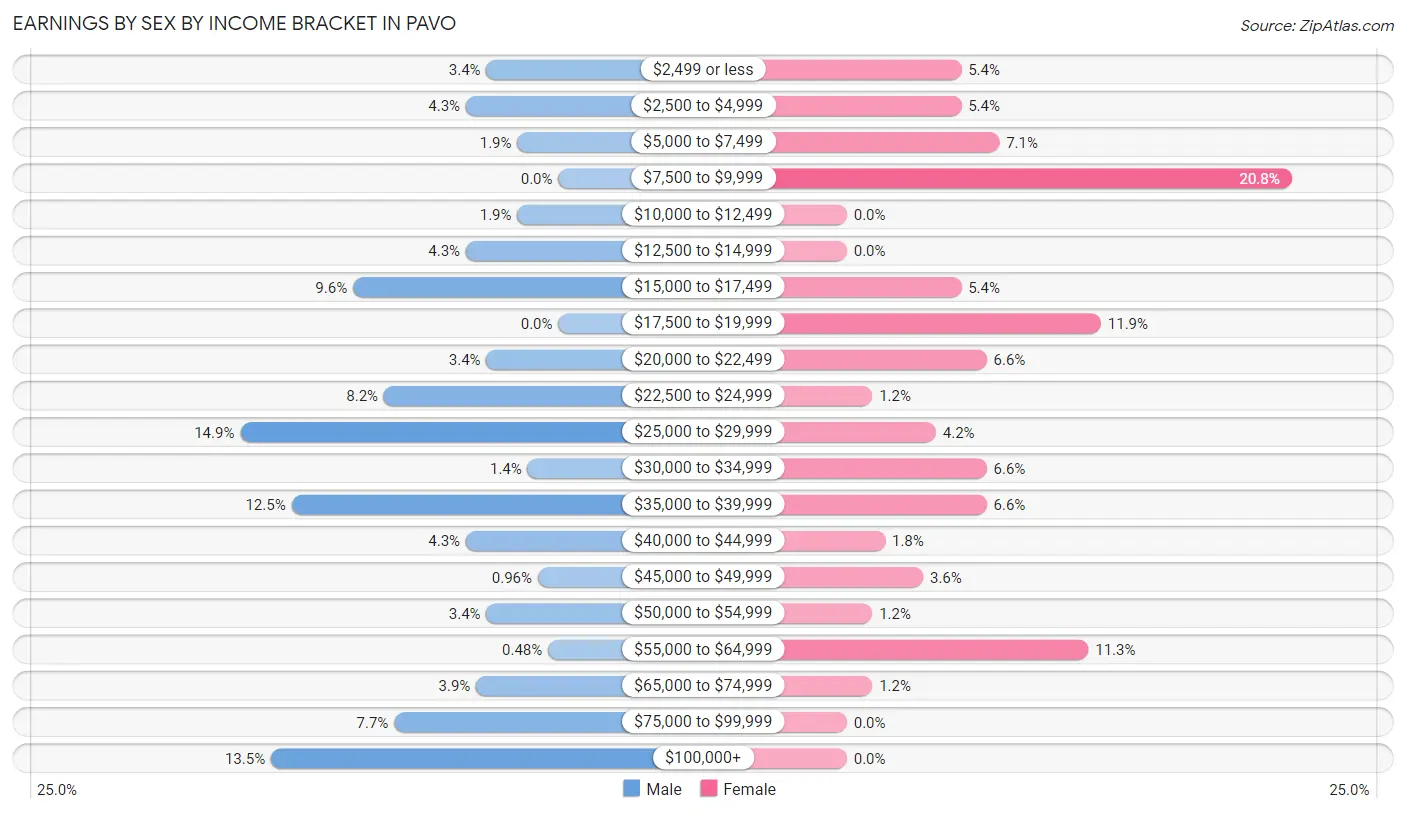
Earnings by Sex by Income Bracket in Pavo
The most common earnings brackets in Pavo are $25,000 to $29,999 for men (31 | 14.9%) and $7,500 to $9,999 for women (35 | 20.8%).
| Income | Male | Female |
| $2,499 or less | 7 (3.4%) | 9 (5.4%) |
| $2,500 to $4,999 | 9 (4.3%) | 9 (5.4%) |
| $5,000 to $7,499 | 4 (1.9%) | 12 (7.1%) |
| $7,500 to $9,999 | 0 (0.0%) | 35 (20.8%) |
| $10,000 to $12,499 | 4 (1.9%) | 0 (0.0%) |
| $12,500 to $14,999 | 9 (4.3%) | 0 (0.0%) |
| $15,000 to $17,499 | 20 (9.6%) | 9 (5.4%) |
| $17,500 to $19,999 | 0 (0.0%) | 20 (11.9%) |
| $20,000 to $22,499 | 7 (3.4%) | 11 (6.6%) |
| $22,500 to $24,999 | 17 (8.2%) | 2 (1.2%) |
| $25,000 to $29,999 | 31 (14.9%) | 7 (4.2%) |
| $30,000 to $34,999 | 3 (1.4%) | 11 (6.6%) |
| $35,000 to $39,999 | 26 (12.5%) | 11 (6.6%) |
| $40,000 to $44,999 | 9 (4.3%) | 3 (1.8%) |
| $45,000 to $49,999 | 2 (1.0%) | 6 (3.6%) |
| $50,000 to $54,999 | 7 (3.4%) | 2 (1.2%) |
| $55,000 to $64,999 | 1 (0.5%) | 19 (11.3%) |
| $65,000 to $74,999 | 8 (3.8%) | 2 (1.2%) |
| $75,000 to $99,999 | 16 (7.7%) | 0 (0.0%) |
| $100,000+ | 28 (13.5%) | 0 (0.0%) |
| Total | 208 (100.0%) | 168 (100.0%) |
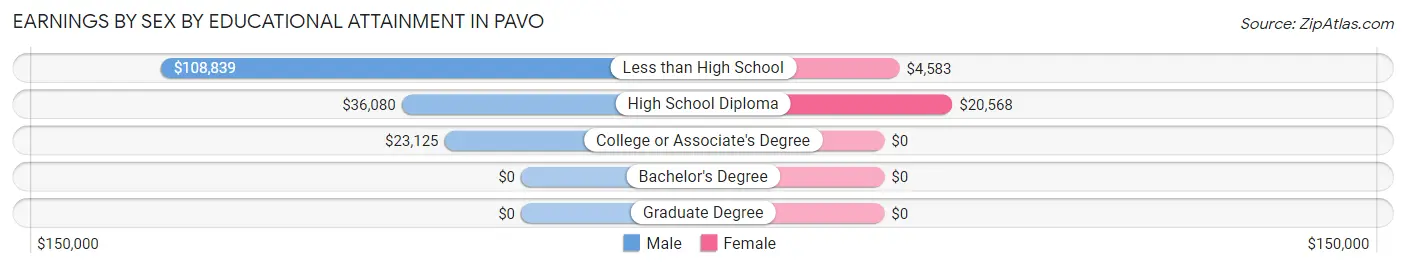
Earnings by Sex by Educational Attainment in Pavo
Average earnings in Pavo are $35,227 for men and $19,188 for women, a difference of 45.5%. Men with an educational attainment of less than high school enjoy the highest average annual earnings of $108,839, while those with college or associate's degree education earn the least with $23,125. Women with an educational attainment of high school diploma earn the most with the average annual earnings of $20,568, while those with less than high school education have the smallest earnings of $4,583.
| Educational Attainment | Male Income | Female Income |
| Less than High School | $108,839 | $4,583 |
| High School Diploma | $36,080 | $20,568 |
| College or Associate's Degree | $23,125 | $0 |
| Bachelor's Degree | - | - |
| Graduate Degree | - | - |
| Total | $35,227 | $19,188 |
Family Income in Pavo
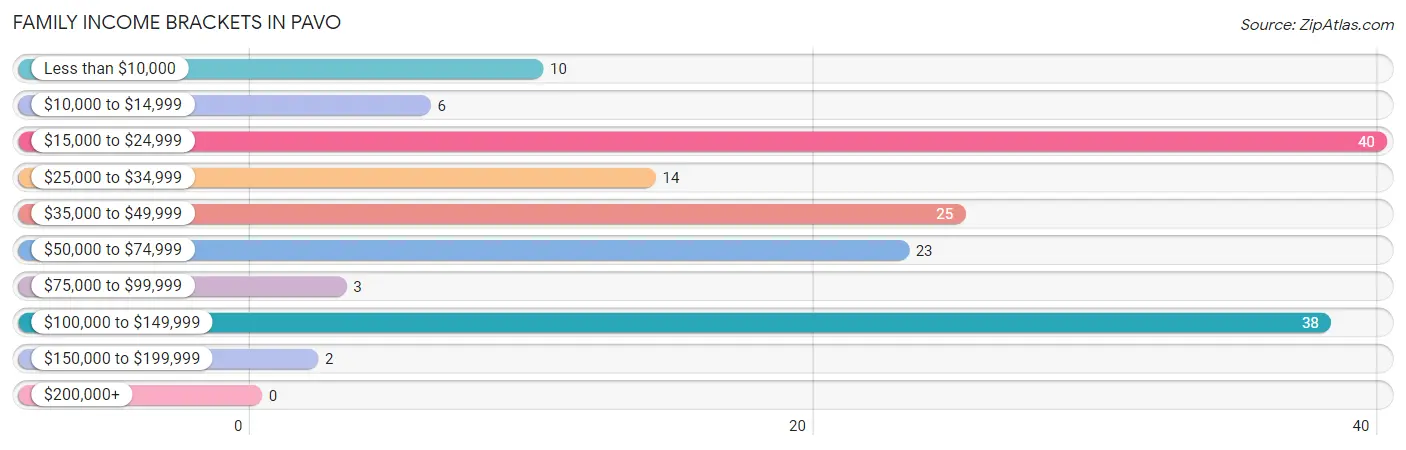
Family Income Brackets in Pavo
According to the Pavo family income data, there are 40 families falling into the $15,000 to $24,999 income range, which is the most common income bracket and makes up 24.8% of all families.
| Income Bracket | # Families | % Families |
| Less than $10,000 | 10 | 6.2% |
| $10,000 to $14,999 | 6 | 3.7% |
| $15,000 to $24,999 | 40 | 24.8% |
| $25,000 to $34,999 | 14 | 8.7% |
| $35,000 to $49,999 | 25 | 15.5% |
| $50,000 to $74,999 | 23 | 14.3% |
| $75,000 to $99,999 | 3 | 1.9% |
| $100,000 to $149,999 | 38 | 23.6% |
| $150,000 to $199,999 | 2 | 1.2% |
| $200,000+ | 0 | 0.0% |
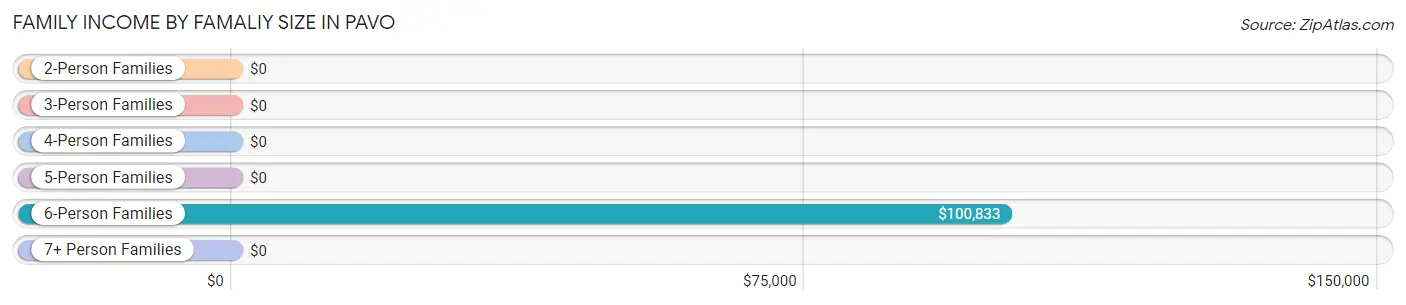
Family Income by Famaliy Size in Pavo
6-person families (6 | 3.7%) account for the highest median family income in Pavo with $100,833 per family, while 6-person families (6 | 3.7%) have the highest median income of $16,806 per family member.
| Income Bracket | # Families | Median Income |
| 2-Person Families | 84 (52.2%) | $0 |
| 3-Person Families | 32 (19.9%) | $0 |
| 4-Person Families | 32 (19.9%) | $0 |
| 5-Person Families | 7 (4.3%) | $0 |
| 6-Person Families | 6 (3.7%) | $100,833 |
| 7+ Person Families | 0 (0.0%) | $0 |
| Total | 161 (100.0%) | $45,179 |
Family Income by Number of Earners in Pavo
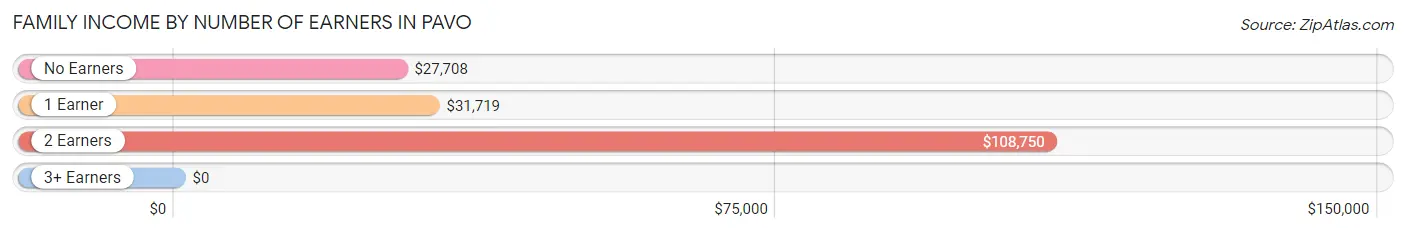
| Number of Earners | # Families | Median Income |
| No Earners | 31 (19.3%) | $27,708 |
| 1 Earner | 67 (41.6%) | $31,719 |
| 2 Earners | 47 (29.2%) | $108,750 |
| 3+ Earners | 16 (9.9%) | $0 |
| Total | 161 (100.0%) | $45,179 |
Household Income in Pavo
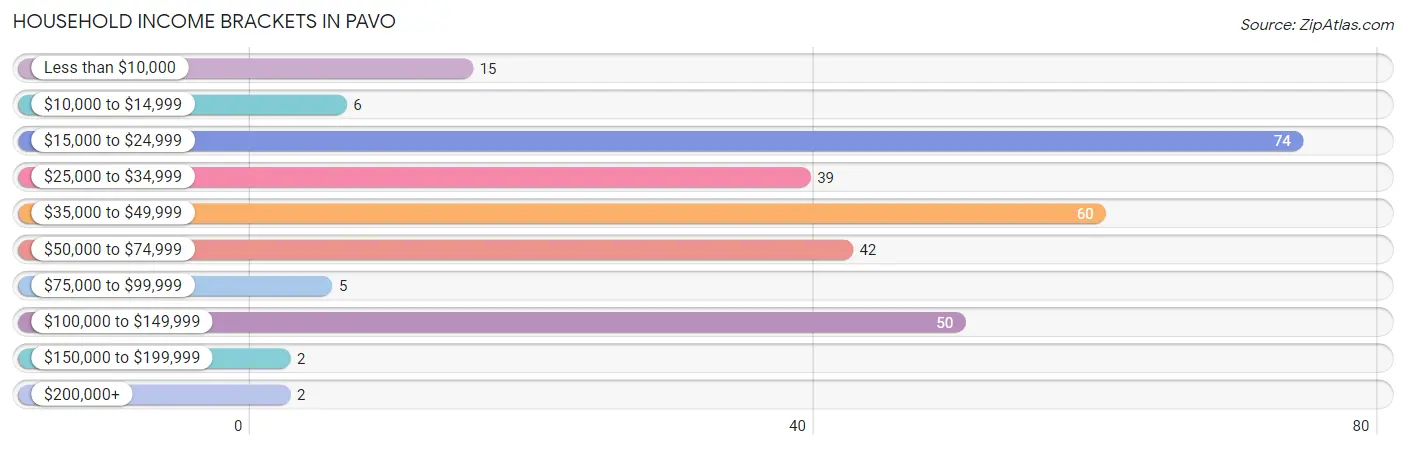
Household Income Brackets in Pavo
With 74 households falling in the category, the $15,000 to $24,999 income range is the most frequent in Pavo, accounting for 25.1% of all households. In contrast, only 2 households (0.7%) fall into the $150,000 to $199,999 income bracket, making it the least populous group.
| Income Bracket | # Households | % Households |
| Less than $10,000 | 15 | 5.1% |
| $10,000 to $14,999 | 6 | 2.0% |
| $15,000 to $24,999 | 74 | 25.1% |
| $25,000 to $34,999 | 39 | 13.2% |
| $35,000 to $49,999 | 60 | 20.3% |
| $50,000 to $74,999 | 42 | 14.2% |
| $75,000 to $99,999 | 5 | 1.7% |
| $100,000 to $149,999 | 50 | 16.9% |
| $150,000 to $199,999 | 2 | 0.7% |
| $200,000+ | 2 | 0.7% |
Household Income by Householder Age in Pavo
The median household income in Pavo is $37,250, with the highest median household income of $44,150 found in the 45 to 64 years age bracket for the primary householder. A total of 143 households (48.5%) fall into this category. Meanwhile, the 15 to 24 years age bracket for the primary householder has the lowest median household income of $0, with 10 households (3.4%) in this group.
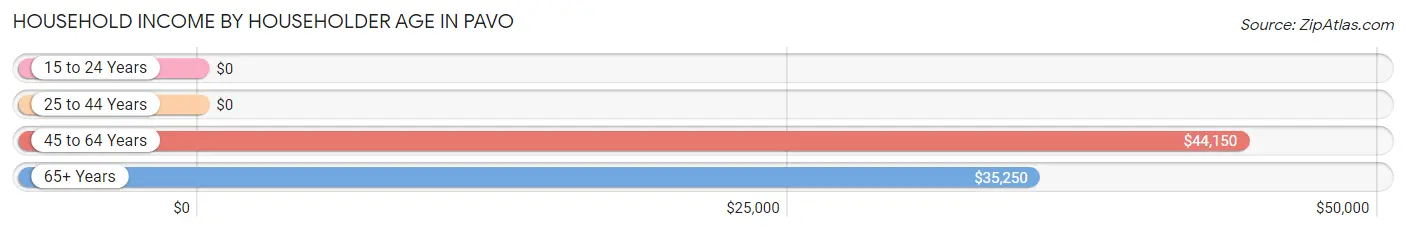
| Income Bracket | # Households | Median Income |
| 15 to 24 Years | 10 (3.4%) | $0 |
| 25 to 44 Years | 77 (26.1%) | $0 |
| 45 to 64 Years | 143 (48.5%) | $44,150 |
| 65+ Years | 65 (22.0%) | $35,250 |
| Total | 295 (100.0%) | $37,250 |
Poverty in Pavo
Income Below Poverty by Sex and Age in Pavo
With 25.5% poverty level for males and 34.3% for females among the residents of Pavo, 5 year old males and under 5 year old females are the most vulnerable to poverty, with 8 males (100.0%) and 12 females (100.0%) in their respective age groups living below the poverty level.
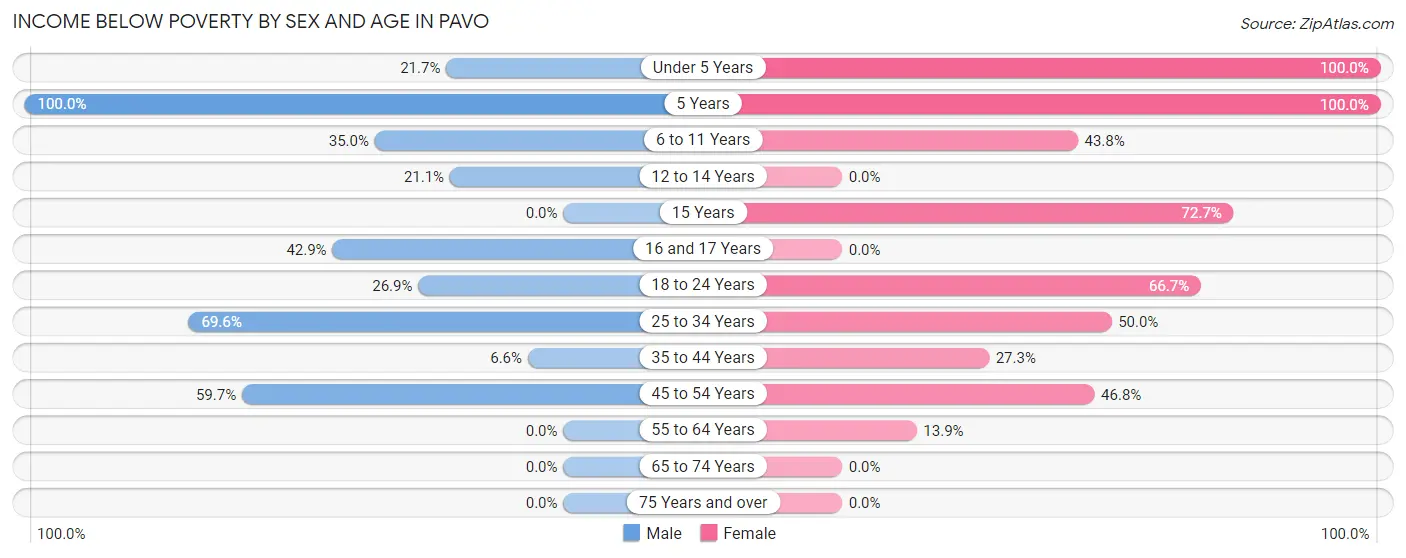
| Age Bracket | Male | Female |
| Under 5 Years | 5 (21.7%) | 12 (100.0%) |
| 5 Years | 8 (100.0%) | 9 (100.0%) |
| 6 to 11 Years | 14 (35.0%) | 7 (43.8%) |
| 12 to 14 Years | 4 (21.0%) | 0 (0.0%) |
| 15 Years | 0 (0.0%) | 8 (72.7%) |
| 16 and 17 Years | 3 (42.9%) | 0 (0.0%) |
| 18 to 24 Years | 7 (26.9%) | 10 (66.7%) |
| 25 to 34 Years | 16 (69.6%) | 18 (50.0%) |
| 35 to 44 Years | 5 (6.6%) | 6 (27.3%) |
| 45 to 54 Years | 34 (59.7%) | 37 (46.8%) |
| 55 to 64 Years | 0 (0.0%) | 9 (13.9%) |
| 65 to 74 Years | 0 (0.0%) | 0 (0.0%) |
| 75 Years and over | 0 (0.0%) | 0 (0.0%) |
| Total | 96 (25.5%) | 116 (34.3%) |
Income Above Poverty by Sex and Age in Pavo
According to the poverty statistics in Pavo, males aged 55 to 64 years and females aged 12 to 14 years are the age groups that are most secure financially, with 100.0% of males and 100.0% of females in these age groups living above the poverty line.
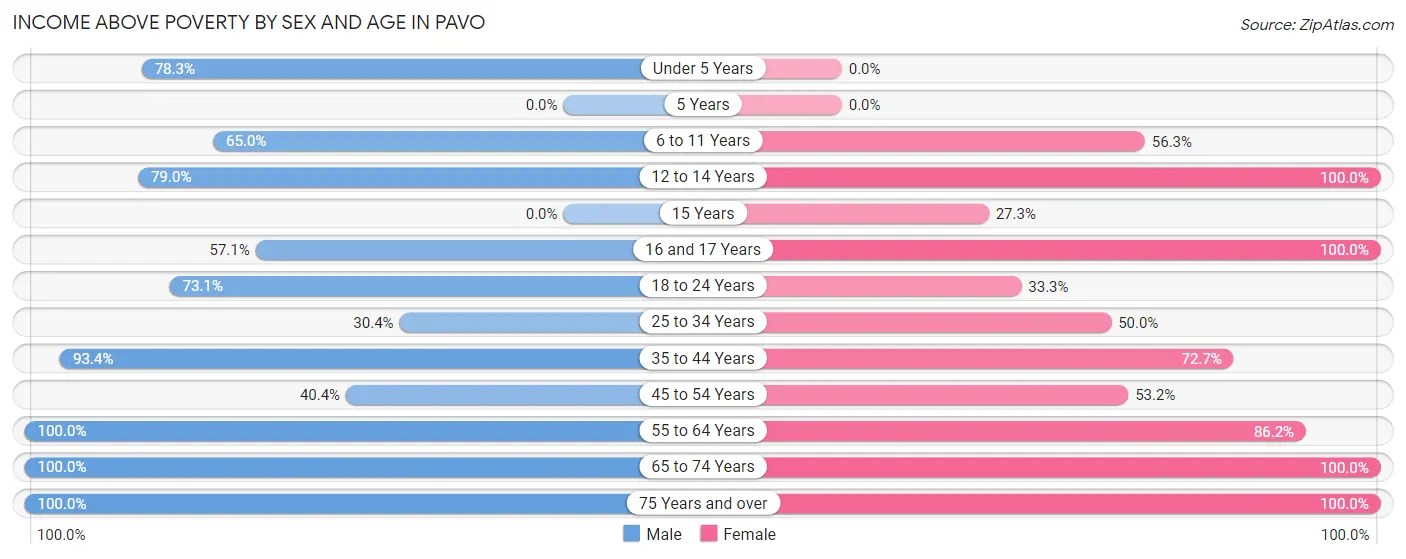
| Age Bracket | Male | Female |
| Under 5 Years | 18 (78.3%) | 0 (0.0%) |
| 5 Years | 0 (0.0%) | 0 (0.0%) |
| 6 to 11 Years | 26 (65.0%) | 9 (56.2%) |
| 12 to 14 Years | 15 (78.9%) | 7 (100.0%) |
| 15 Years | 0 (0.0%) | 3 (27.3%) |
| 16 and 17 Years | 4 (57.1%) | 1 (100.0%) |
| 18 to 24 Years | 19 (73.1%) | 5 (33.3%) |
| 25 to 34 Years | 7 (30.4%) | 18 (50.0%) |
| 35 to 44 Years | 71 (93.4%) | 16 (72.7%) |
| 45 to 54 Years | 23 (40.4%) | 42 (53.2%) |
| 55 to 64 Years | 49 (100.0%) | 56 (86.2%) |
| 65 to 74 Years | 43 (100.0%) | 46 (100.0%) |
| 75 Years and over | 6 (100.0%) | 19 (100.0%) |
| Total | 281 (74.5%) | 222 (65.7%) |
Income Below Poverty Among Married-Couple Families in Pavo
The poverty statistics for married-couple families in Pavo show that 18.3% or 21 of the total 115 families live below the poverty line. Families with 1 or 2 children have the highest poverty rate of 68.4%, comprising of 13 families. On the other hand, families with 3 or 4 children have the lowest poverty rate of 0.0%, which includes 0 families.
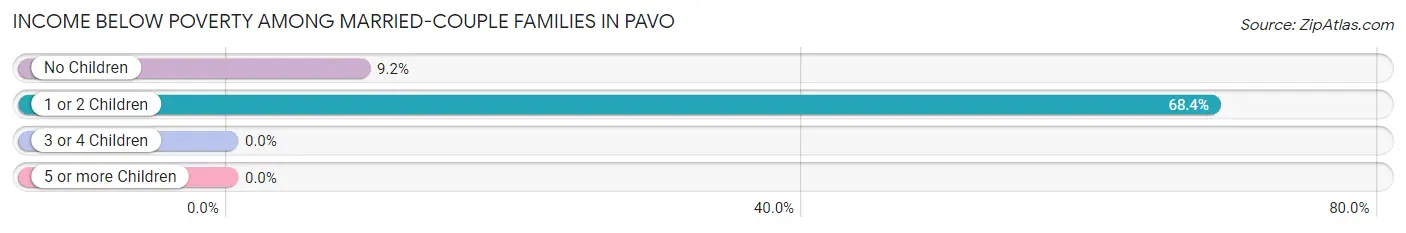
| Children | Above Poverty | Below Poverty |
| No Children | 79 (90.8%) | 8 (9.2%) |
| 1 or 2 Children | 6 (31.6%) | 13 (68.4%) |
| 3 or 4 Children | 9 (100.0%) | 0 (0.0%) |
| 5 or more Children | 0 (0.0%) | 0 (0.0%) |
| Total | 94 (81.7%) | 21 (18.3%) |
Income Below Poverty Among Single-Parent Households in Pavo
According to the poverty data in Pavo, 66.7% or 4 single-father households and 40.0% or 16 single-mother households are living below the poverty line. Among single-father households, those with 1 or 2 children have the highest poverty rate, with 4 households (100.0%) experiencing poverty. Likewise, among single-mother households, those with 3 or 4 children have the highest poverty rate, with 10 households (62.5%) falling below the poverty line.
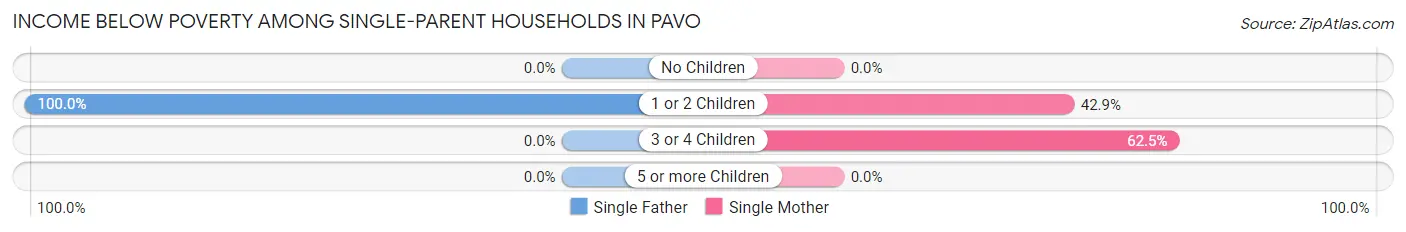
| Children | Single Father | Single Mother |
| No Children | 0 (0.0%) | 0 (0.0%) |
| 1 or 2 Children | 4 (100.0%) | 6 (42.9%) |
| 3 or 4 Children | 0 (0.0%) | 10 (62.5%) |
| 5 or more Children | 0 (0.0%) | 0 (0.0%) |
| Total | 4 (66.7%) | 16 (40.0%) |
Income Below Poverty Among Married-Couple vs Single-Parent Households in Pavo
The poverty data for Pavo shows that 21 of the married-couple family households (18.3%) and 20 of the single-parent households (43.5%) are living below the poverty level. Within the married-couple family households, those with 1 or 2 children have the highest poverty rate, with 13 households (68.4%) falling below the poverty line. Among the single-parent households, those with 3 or 4 children have the highest poverty rate, with 10 household (62.5%) living below poverty.
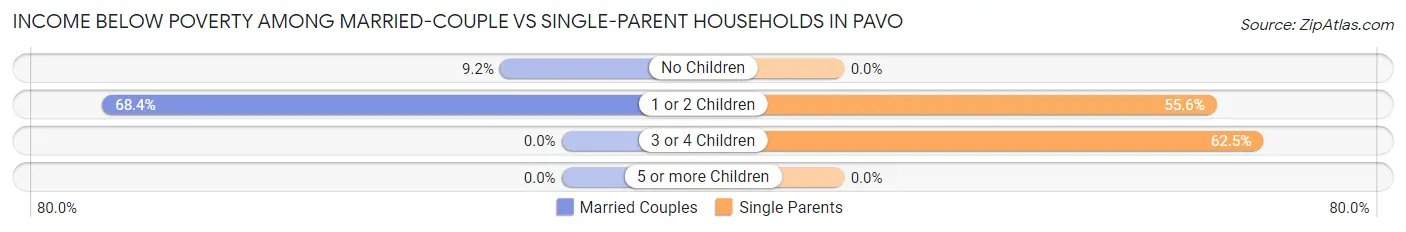
| Children | Married-Couple Families | Single-Parent Households |
| No Children | 8 (9.2%) | 0 (0.0%) |
| 1 or 2 Children | 13 (68.4%) | 10 (55.6%) |
| 3 or 4 Children | 0 (0.0%) | 10 (62.5%) |
| 5 or more Children | 0 (0.0%) | 0 (0.0%) |
| Total | 21 (18.3%) | 20 (43.5%) |
Race in Pavo
The most populous races in Pavo are White / Caucasian (501 | 70.1%), Black / African American (165 | 23.1%), and Two or more Races (49 | 6.9%).
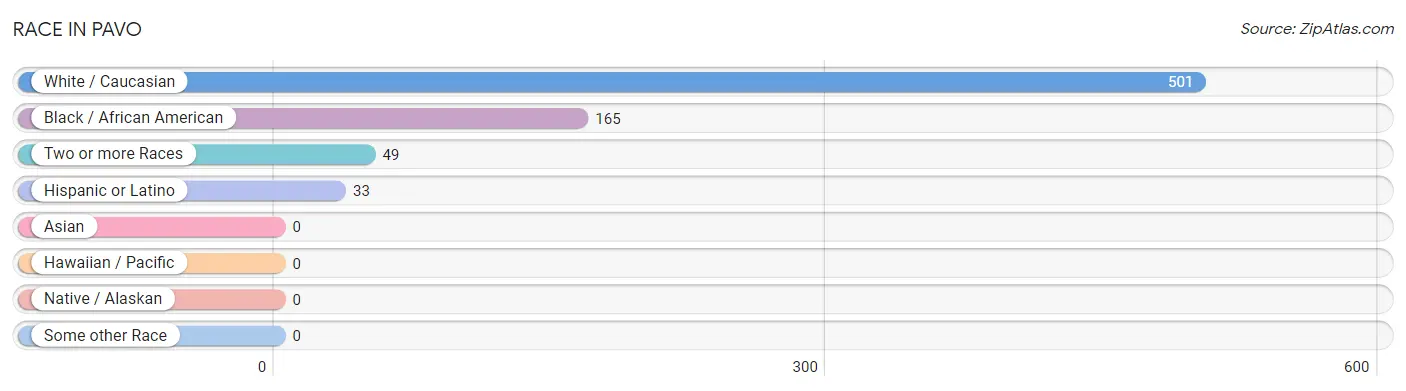
| Race | # Population | % Population |
| Asian | 0 | 0.0% |
| Black / African American | 165 | 23.1% |
| Hawaiian / Pacific | 0 | 0.0% |
| Hispanic or Latino | 33 | 4.6% |
| Native / Alaskan | 0 | 0.0% |
| White / Caucasian | 501 | 70.1% |
| Two or more Races | 49 | 6.9% |
| Some other Race | 0 | 0.0% |
| Total | 715 | 100.0% |
Ancestry in Pavo
The most populous ancestries reported in Pavo are German (66 | 9.2%), Irish (55 | 7.7%), American (46 | 6.4%), English (41 | 5.7%), and Italian (38 | 5.3%), together accounting for 34.4% of all Pavo residents.
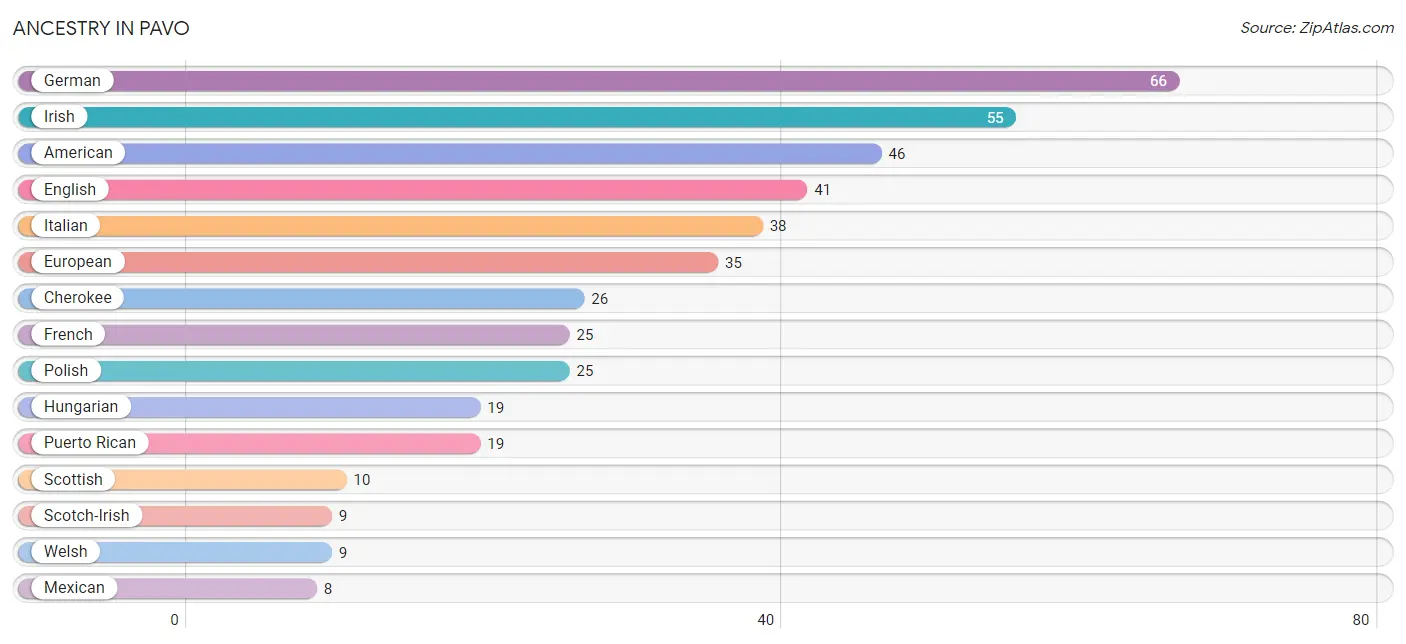
| Ancestry | # Population | % Population |
| American | 46 | 6.4% |
| Cherokee | 26 | 3.6% |
| Cuban | 6 | 0.8% |
| Danish | 4 | 0.6% |
| English | 41 | 5.7% |
| European | 35 | 4.9% |
| French | 25 | 3.5% |
| French Canadian | 2 | 0.3% |
| German | 66 | 9.2% |
| Haitian | 7 | 1.0% |
| Hungarian | 19 | 2.7% |
| Irish | 55 | 7.7% |
| Italian | 38 | 5.3% |
| Mexican | 8 | 1.1% |
| Norwegian | 8 | 1.1% |
| Polish | 25 | 3.5% |
| Puerto Rican | 19 | 2.7% |
| Scotch-Irish | 9 | 1.3% |
| Scottish | 10 | 1.4% |
| Welsh | 9 | 1.3% | View All 20 Rows |
Immigrants in Pavo
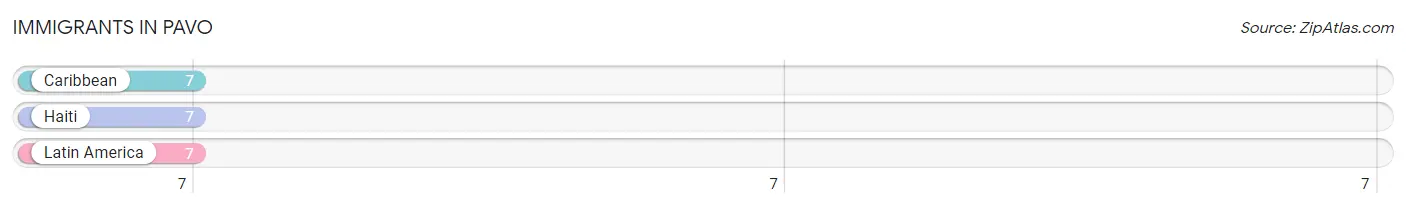
The most numerous immigrant groups reported in Pavo came from Caribbean (7 | 1.0%), Haiti (7 | 1.0%), and Latin America (7 | 1.0%), together accounting for 2.9% of all Pavo residents.
| Immigration Origin | # Population | % Population |
| Caribbean | 7 | 1.0% |
| Haiti | 7 | 1.0% |
| Latin America | 7 | 1.0% | View All 3 Rows |
Sex and Age in Pavo
Sex and Age in Pavo
The most populous age groups in Pavo are 35 to 39 Years (49 | 13.0%) for men and 55 to 59 Years (54 | 16.0%) for women.
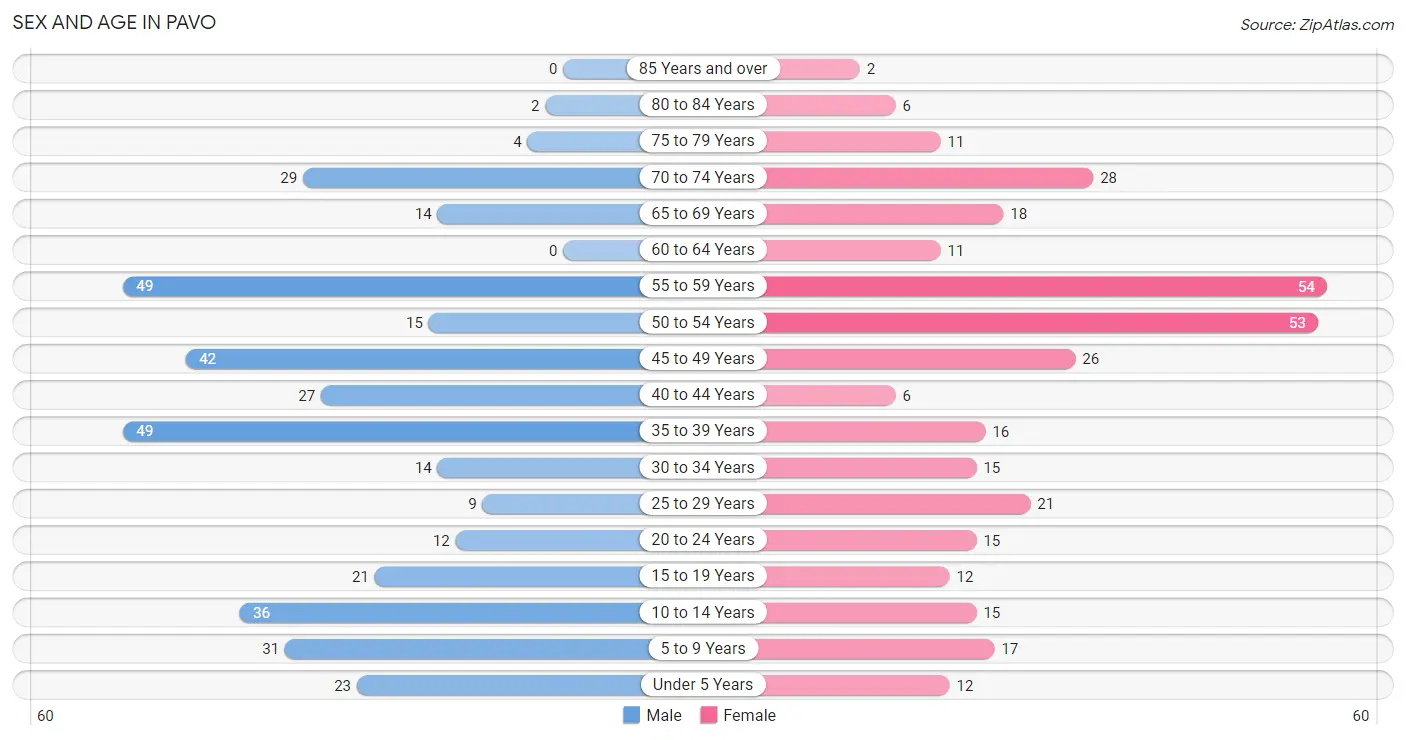
| Age Bracket | Male | Female |
| Under 5 Years | 23 (6.1%) | 12 (3.5%) |
| 5 to 9 Years | 31 (8.2%) | 17 (5.0%) |
| 10 to 14 Years | 36 (9.6%) | 15 (4.4%) |
| 15 to 19 Years | 21 (5.6%) | 12 (3.5%) |
| 20 to 24 Years | 12 (3.2%) | 15 (4.4%) |
| 25 to 29 Years | 9 (2.4%) | 21 (6.2%) |
| 30 to 34 Years | 14 (3.7%) | 15 (4.4%) |
| 35 to 39 Years | 49 (13.0%) | 16 (4.7%) |
| 40 to 44 Years | 27 (7.2%) | 6 (1.8%) |
| 45 to 49 Years | 42 (11.1%) | 26 (7.7%) |
| 50 to 54 Years | 15 (4.0%) | 53 (15.7%) |
| 55 to 59 Years | 49 (13.0%) | 54 (16.0%) |
| 60 to 64 Years | 0 (0.0%) | 11 (3.3%) |
| 65 to 69 Years | 14 (3.7%) | 18 (5.3%) |
| 70 to 74 Years | 29 (7.7%) | 28 (8.3%) |
| 75 to 79 Years | 4 (1.1%) | 11 (3.3%) |
| 80 to 84 Years | 2 (0.5%) | 6 (1.8%) |
| 85 Years and over | 0 (0.0%) | 2 (0.6%) |
| Total | 377 (100.0%) | 338 (100.0%) |
Families and Households in Pavo
Median Family Size in Pavo
The median family size in Pavo is 3.15 persons per family, with single female/mother families (40 | 24.8%) accounting for the largest median family size of 3.4 persons per family. On the other hand, single male/father families (6 | 3.7%) represent the smallest median family size with 2.50 persons per family.
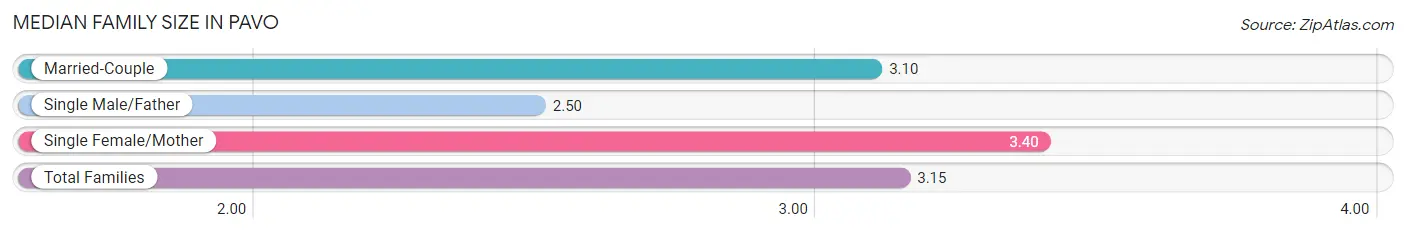
| Family Type | # Families | Family Size |
| Married-Couple | 115 (71.4%) | 3.10 |
| Single Male/Father | 6 (3.7%) | 2.50 |
| Single Female/Mother | 40 (24.8%) | 3.40 |
| Total Families | 161 (100.0%) | 3.15 |
Median Household Size in Pavo
The median household size in Pavo is 2.42 persons per household, with single female/mother households (40 | 13.6%) accounting for the largest median household size of 3.55 persons per household. non-family households (134 | 45.4%) represent the smallest median household size with 1.47 persons per household.
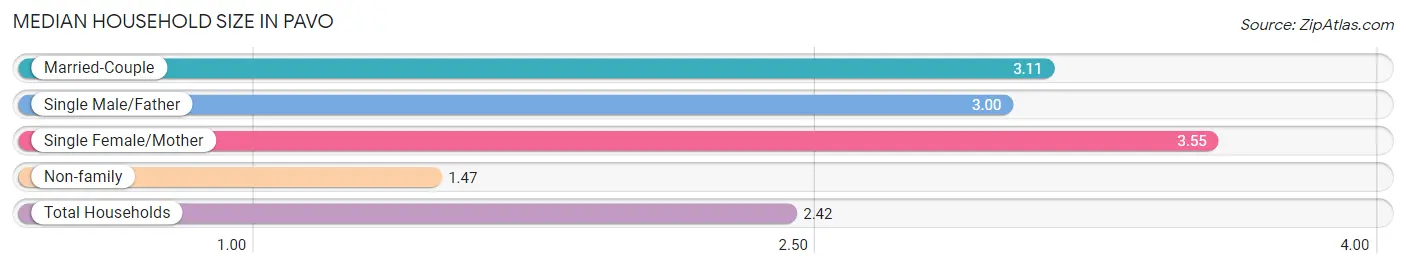
| Household Type | # Households | Household Size |
| Married-Couple | 115 (39.0%) | 3.11 |
| Single Male/Father | 6 (2.0%) | 3.00 |
| Single Female/Mother | 40 (13.6%) | 3.55 |
| Non-family | 134 (45.4%) | 1.47 |
| Total Households | 295 (100.0%) | 2.42 |
Household Size by Marriage Status in Pavo
Out of a total of 295 households in Pavo, 161 (54.6%) are family households, while 134 (45.4%) are nonfamily households. The most numerous type of family households are 2-person households, comprising 84, and the most common type of nonfamily households are 1-person households, comprising 88.
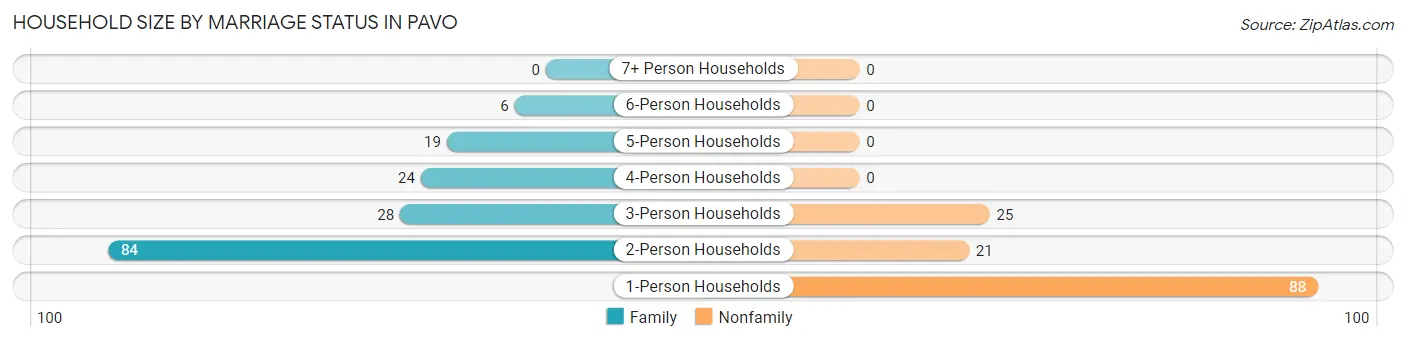
| Household Size | Family Households | Nonfamily Households |
| 1-Person Households | - | 88 (29.8%) |
| 2-Person Households | 84 (28.5%) | 21 (7.1%) |
| 3-Person Households | 28 (9.5%) | 25 (8.5%) |
| 4-Person Households | 24 (8.1%) | 0 (0.0%) |
| 5-Person Households | 19 (6.4%) | 0 (0.0%) |
| 6-Person Households | 6 (2.0%) | 0 (0.0%) |
| 7+ Person Households | 0 (0.0%) | 0 (0.0%) |
| Total | 161 (54.6%) | 134 (45.4%) |
Female Fertility in Pavo
Fertility by Age in Pavo
Average fertility rate in Pavo is 18.0 births per 1,000 women. Women in the age bracket of 35 to 50 years have the highest fertility rate with 42.0 births per 1,000 women. Women in the age bracket of 35 to 50 years acount for 100.0% of all women with births.
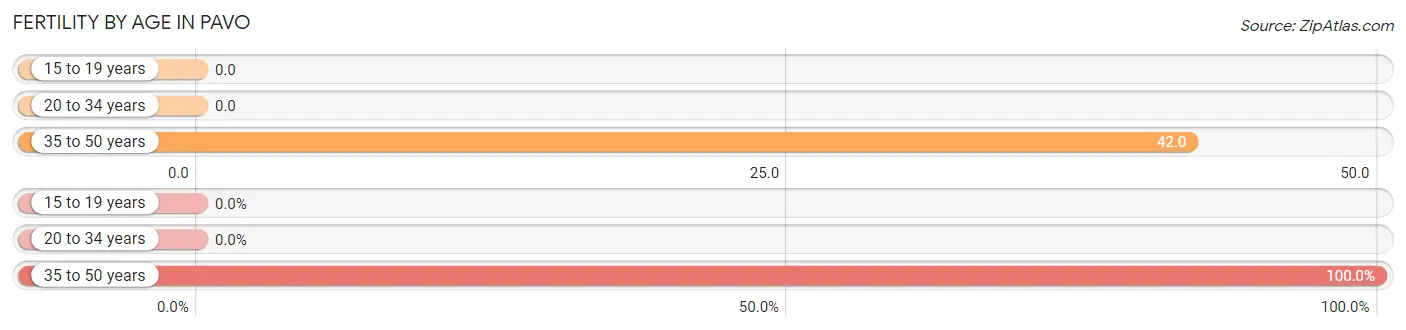
| Age Bracket | Women with Births | Births / 1,000 Women |
| 15 to 19 years | 0 (0.0%) | 0.0 |
| 20 to 34 years | 0 (0.0%) | 0.0 |
| 35 to 50 years | 2 (100.0%) | 42.0 |
| Total | 2 (100.0%) | 18.0 |
Fertility by Age by Marriage Status in Pavo
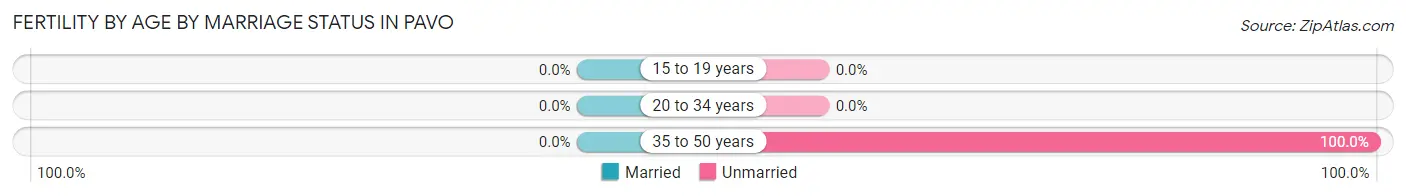
| Age Bracket | Married | Unmarried |
| 15 to 19 years | 0 (0.0%) | 0 (0.0%) |
| 20 to 34 years | 0 (0.0%) | 0 (0.0%) |
| 35 to 50 years | 0 (0.0%) | 2 (100.0%) |
| Total | 0 (0.0%) | 2 (100.0%) |
Fertility by Education in Pavo
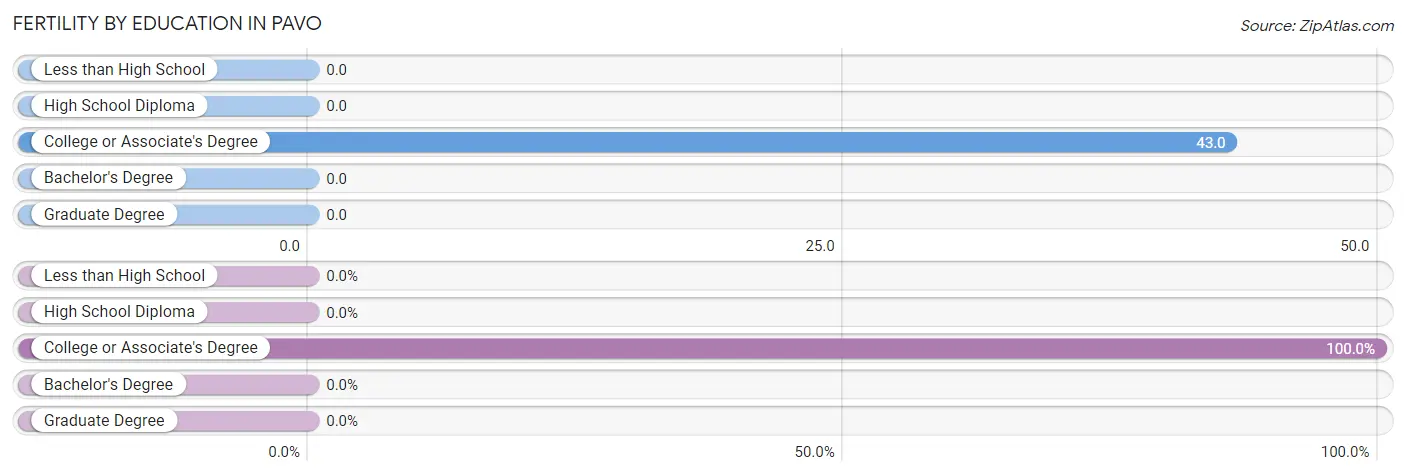
| Educational Attainment | Women with Births | Births / 1,000 Women |
| Less than High School | 0 (0.0%) | 0.0 |
| High School Diploma | 0 (0.0%) | 0.0 |
| College or Associate's Degree | 2 (100.0%) | 43.0 |
| Bachelor's Degree | 0 (0.0%) | 0.0 |
| Graduate Degree | 0 (0.0%) | 0.0 |
| Total | 2 (100.0%) | 18.0 |
Fertility by Education by Marriage Status in Pavo
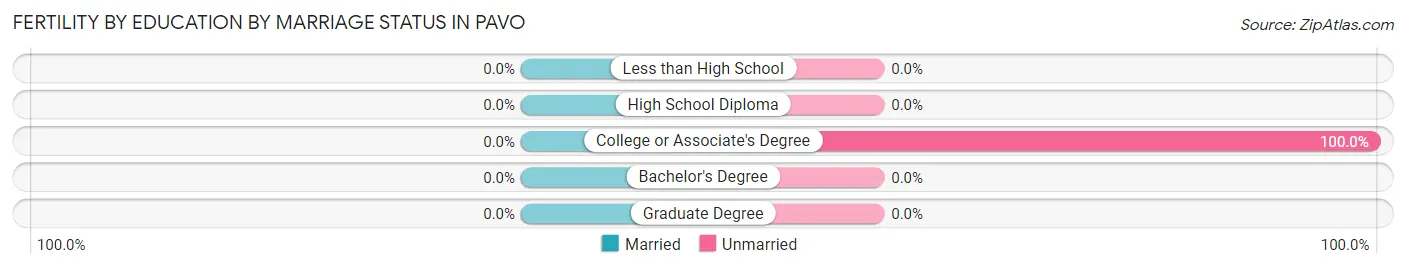
| Educational Attainment | Married | Unmarried |
| Less than High School | 0 (0.0%) | 0 (0.0%) |
| High School Diploma | 0 (0.0%) | 0 (0.0%) |
| College or Associate's Degree | 0 (0.0%) | 2 (100.0%) |
| Bachelor's Degree | 0 (0.0%) | 0 (0.0%) |
| Graduate Degree | 0 (0.0%) | 0 (0.0%) |
| Total | 0 (0.0%) | 2 (100.0%) |
Employment Characteristics in Pavo
Employment by Class of Employer in Pavo
Among the 300 employed individuals in Pavo, private company employees (217 | 72.3%), self-employed (not incorporated) (43 | 14.3%), and local government employees (18 | 6.0%) make up the most common classes of employment.
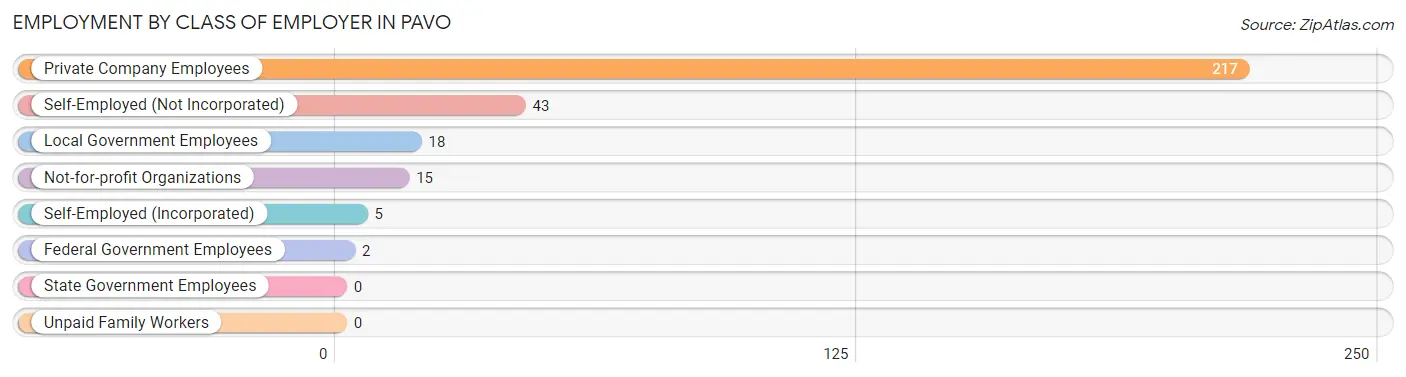
| Employer Class | # Employees | % Employees |
| Private Company Employees | 217 | 72.3% |
| Self-Employed (Incorporated) | 5 | 1.7% |
| Self-Employed (Not Incorporated) | 43 | 14.3% |
| Not-for-profit Organizations | 15 | 5.0% |
| Local Government Employees | 18 | 6.0% |
| State Government Employees | 0 | 0.0% |
| Federal Government Employees | 2 | 0.7% |
| Unpaid Family Workers | 0 | 0.0% |
| Total | 300 | 100.0% |
Employment Status by Age in Pavo
According to the labor force statistics for Pavo, out of the total population over 16 years of age (570), 55.6% or 317 individuals are in the labor force, with 1.9% or 6 of them unemployed. The age group with the highest labor force participation rate is 35 to 44 years, with 92.9% or 91 individuals in the labor force. Within the labor force, the 35 to 44 years age range has the highest percentage of unemployed individuals, with 6.6% or 6 of them being unemployed.
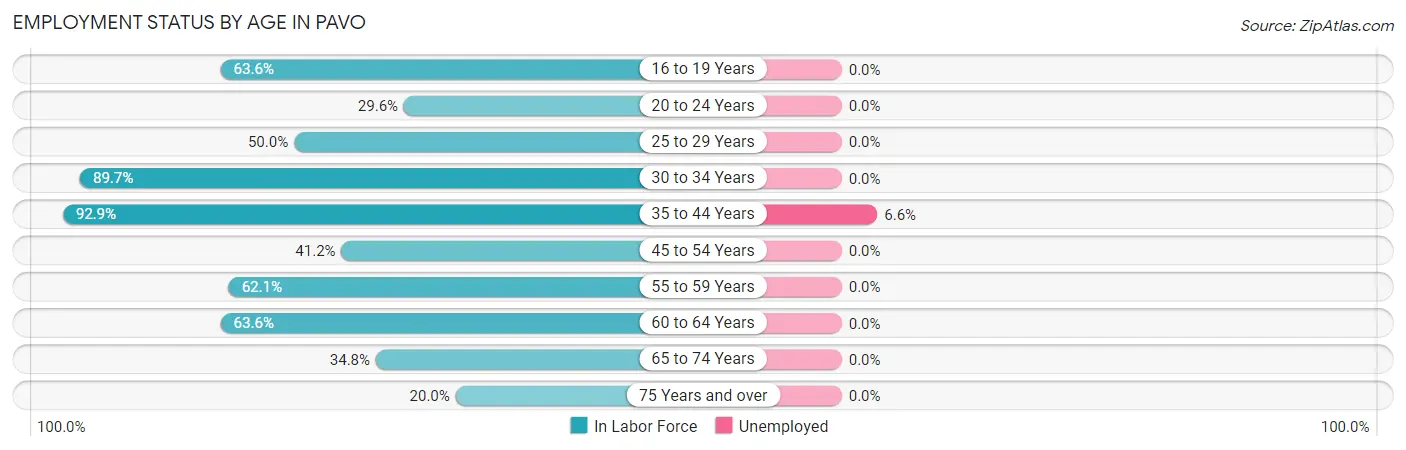
| Age Bracket | In Labor Force | Unemployed |
| 16 to 19 Years | 14 (63.6%) | 0 (0.0%) |
| 20 to 24 Years | 8 (29.6%) | 0 (0.0%) |
| 25 to 29 Years | 15 (50.0%) | 0 (0.0%) |
| 30 to 34 Years | 26 (89.7%) | 0 (0.0%) |
| 35 to 44 Years | 91 (92.9%) | 6 (6.6%) |
| 45 to 54 Years | 56 (41.2%) | 0 (0.0%) |
| 55 to 59 Years | 64 (62.1%) | 0 (0.0%) |
| 60 to 64 Years | 7 (63.6%) | 0 (0.0%) |
| 65 to 74 Years | 31 (34.8%) | 0 (0.0%) |
| 75 Years and over | 5 (20.0%) | 0 (0.0%) |
| Total | 317 (55.6%) | 6 (1.9%) |
Employment Status by Educational Attainment in Pavo
According to labor force statistics for Pavo, 63.6% of individuals (259) out of the total population between 25 and 64 years of age (407) are in the labor force, with 2.3% or 6 of them being unemployed. The group with the highest labor force participation rate are those with the educational attainment of high school diploma, with 75.0% or 102 individuals in the labor force. Within the labor force, individuals with high school diploma education have the highest percentage of unemployment, with 5.9% or 6 of them being unemployed.
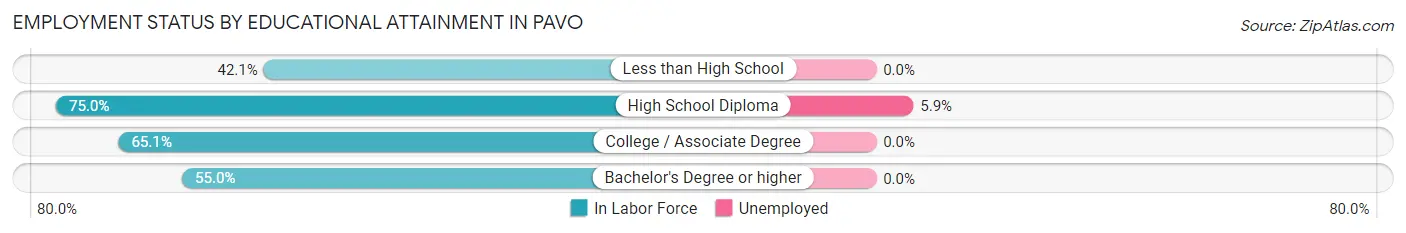
| Educational Attainment | In Labor Force | Unemployed |
| Less than High School | 32 (42.1%) | 0 (0.0%) |
| High School Diploma | 102 (75.0%) | 8 (5.9%) |
| College / Associate Degree | 114 (65.1%) | 0 (0.0%) |
| Bachelor's Degree or higher | 11 (55.0%) | 0 (0.0%) |
| Total | 259 (63.6%) | 9 (2.3%) |
Employment Occupations by Sex in Pavo
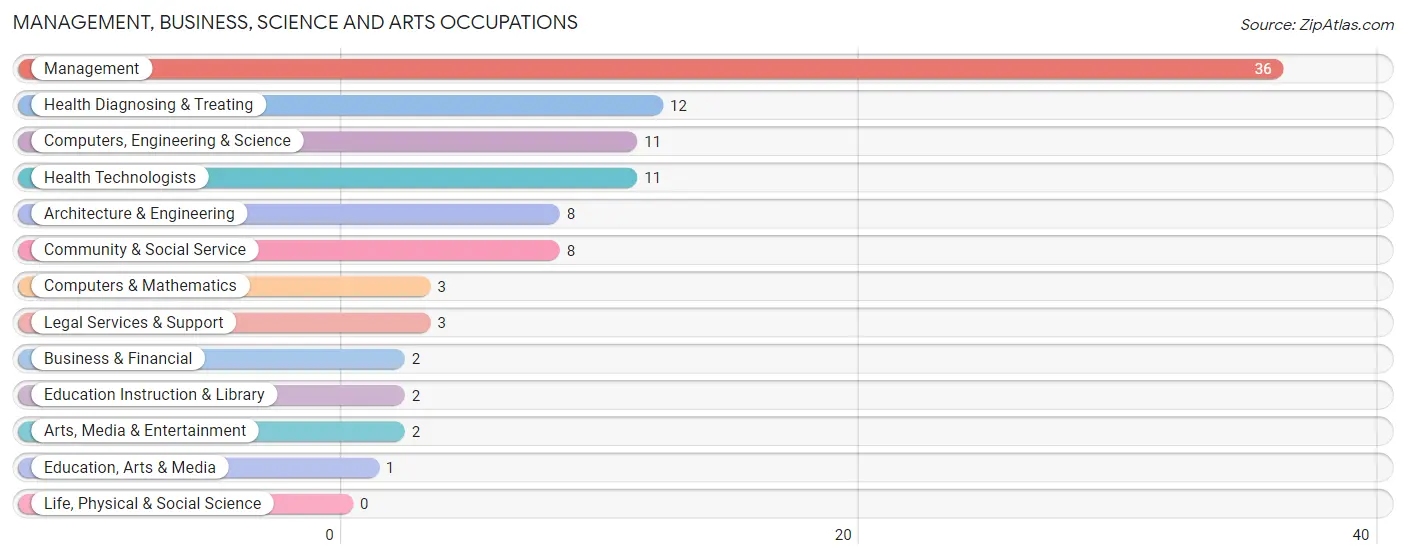
Management, Business, Science and Arts Occupations
The most common Management, Business, Science and Arts occupations in Pavo are Management (36 | 11.6%), Health Diagnosing & Treating (12 | 3.9%), Computers, Engineering & Science (11 | 3.5%), Health Technologists (11 | 3.5%), and Architecture & Engineering (8 | 2.6%).
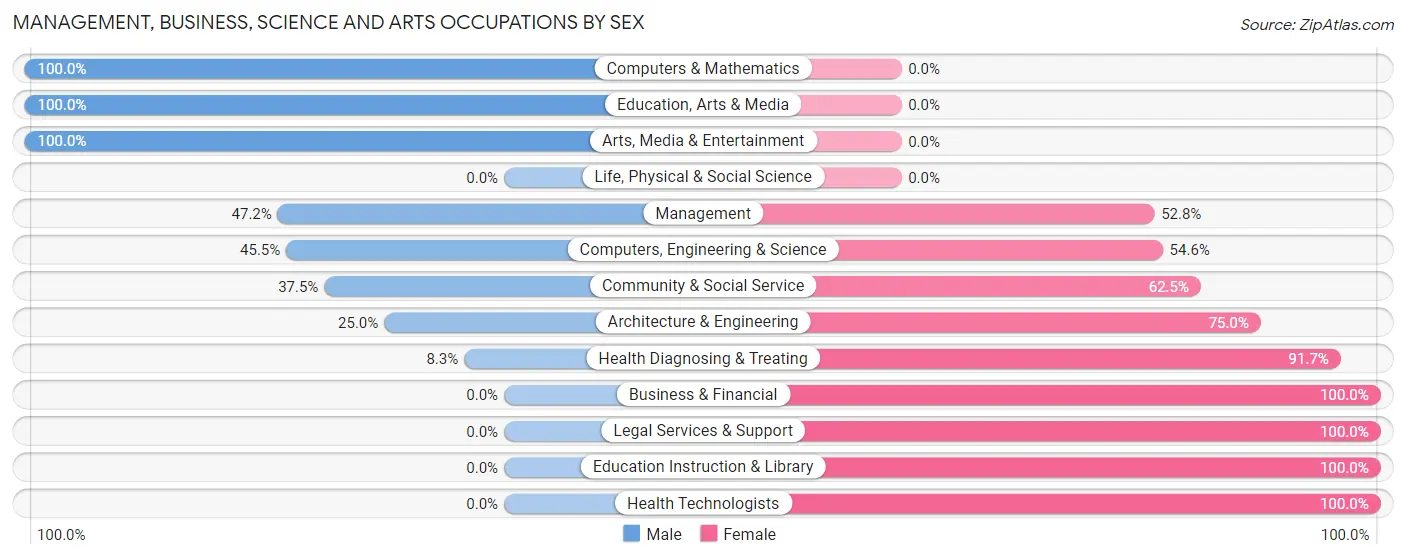
Management, Business, Science and Arts Occupations by Sex
Within the Management, Business, Science and Arts occupations in Pavo, the most male-oriented occupations are Computers & Mathematics (100.0%), Education, Arts & Media (100.0%), and Arts, Media & Entertainment (100.0%), while the most female-oriented occupations are Business & Financial (100.0%), Legal Services & Support (100.0%), and Education Instruction & Library (100.0%).
| Occupation | Male | Female |
| Management | 17 (47.2%) | 19 (52.8%) |
| Business & Financial | 0 (0.0%) | 2 (100.0%) |
| Computers, Engineering & Science | 5 (45.5%) | 6 (54.5%) |
| Computers & Mathematics | 3 (100.0%) | 0 (0.0%) |
| Architecture & Engineering | 2 (25.0%) | 6 (75.0%) |
| Life, Physical & Social Science | 0 (0.0%) | 0 (0.0%) |
| Community & Social Service | 3 (37.5%) | 5 (62.5%) |
| Education, Arts & Media | 1 (100.0%) | 0 (0.0%) |
| Legal Services & Support | 0 (0.0%) | 3 (100.0%) |
| Education Instruction & Library | 0 (0.0%) | 2 (100.0%) |
| Arts, Media & Entertainment | 2 (100.0%) | 0 (0.0%) |
| Health Diagnosing & Treating | 1 (8.3%) | 11 (91.7%) |
| Health Technologists | 0 (0.0%) | 11 (100.0%) |
| Total (Category) | 26 (37.7%) | 43 (62.3%) |
| Total (Overall) | 196 (63.0%) | 115 (37.0%) |
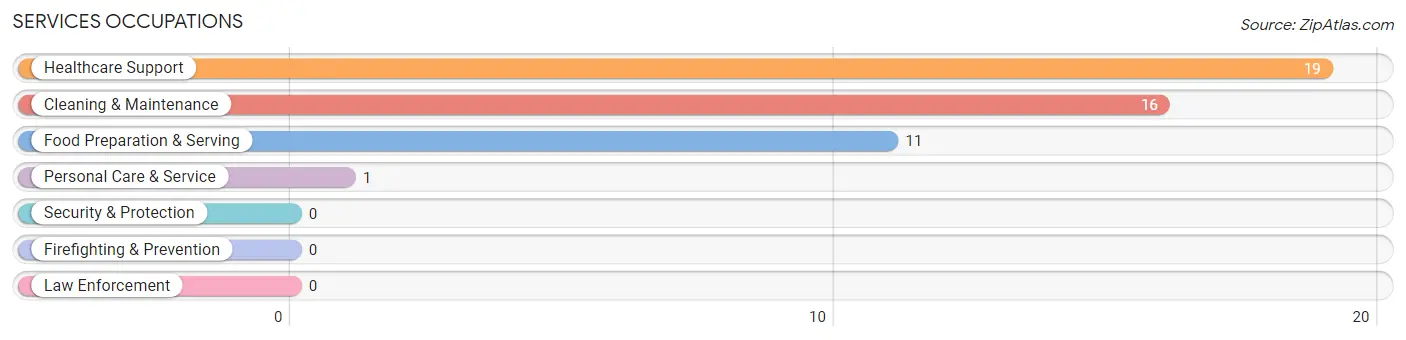
Services Occupations
The most common Services occupations in Pavo are Healthcare Support (19 | 6.1%), Cleaning & Maintenance (16 | 5.1%), Food Preparation & Serving (11 | 3.5%), and Personal Care & Service (1 | 0.3%).
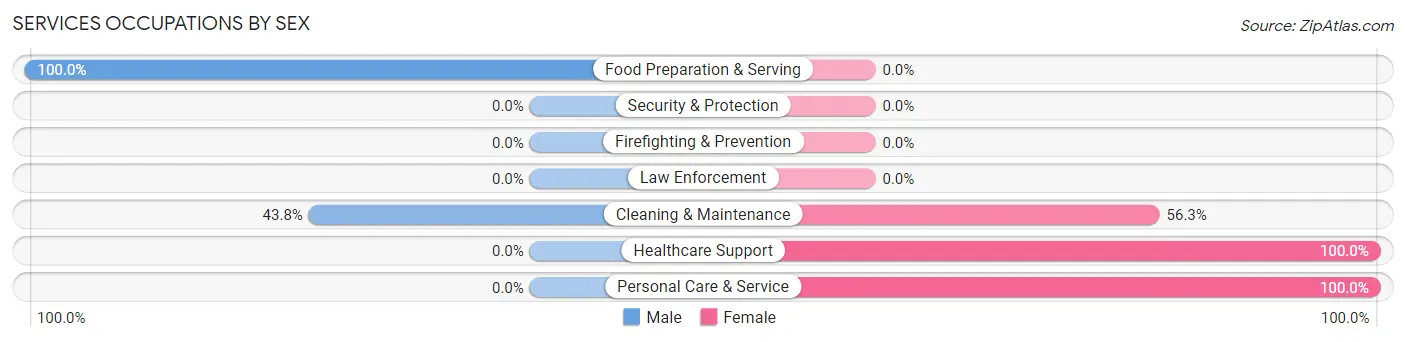
Services Occupations by Sex
Within the Services occupations in Pavo, the most male-oriented occupations are Food Preparation & Serving (100.0%), and Cleaning & Maintenance (43.8%), while the most female-oriented occupations are Healthcare Support (100.0%), Personal Care & Service (100.0%), and Cleaning & Maintenance (56.2%).
| Occupation | Male | Female |
| Healthcare Support | 0 (0.0%) | 19 (100.0%) |
| Security & Protection | 0 (0.0%) | 0 (0.0%) |
| Firefighting & Prevention | 0 (0.0%) | 0 (0.0%) |
| Law Enforcement | 0 (0.0%) | 0 (0.0%) |
| Food Preparation & Serving | 11 (100.0%) | 0 (0.0%) |
| Cleaning & Maintenance | 7 (43.8%) | 9 (56.2%) |
| Personal Care & Service | 0 (0.0%) | 1 (100.0%) |
| Total (Category) | 18 (38.3%) | 29 (61.7%) |
| Total (Overall) | 196 (63.0%) | 115 (37.0%) |
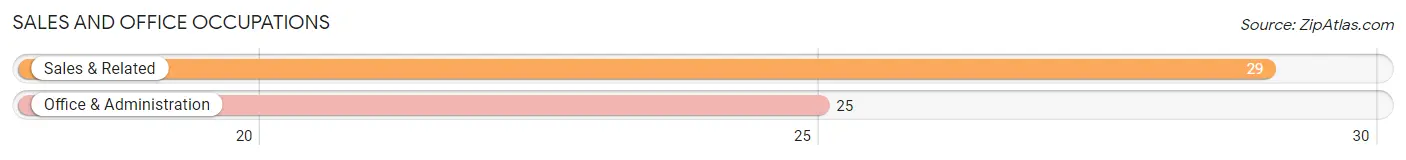
Sales and Office Occupations
The most common Sales and Office occupations in Pavo are Sales & Related (29 | 9.3%), and Office & Administration (25 | 8.0%).
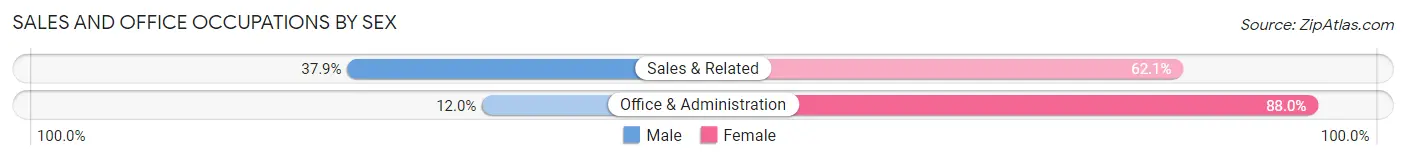
Sales and Office Occupations by Sex
| Occupation | Male | Female |
| Sales & Related | 11 (37.9%) | 18 (62.1%) |
| Office & Administration | 3 (12.0%) | 22 (88.0%) |
| Total (Category) | 14 (25.9%) | 40 (74.1%) |
| Total (Overall) | 196 (63.0%) | 115 (37.0%) |
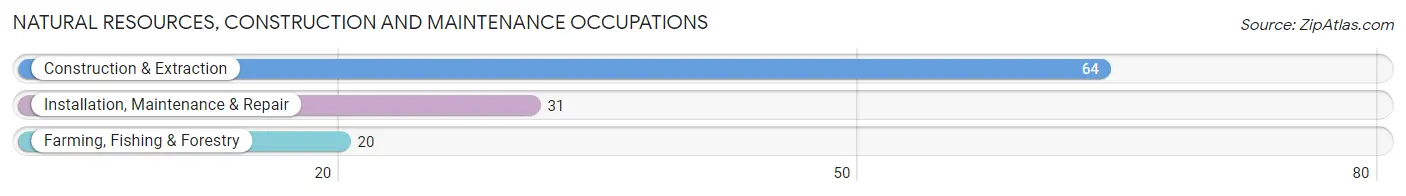
Natural Resources, Construction and Maintenance Occupations
The most common Natural Resources, Construction and Maintenance occupations in Pavo are Construction & Extraction (64 | 20.6%), Installation, Maintenance & Repair (31 | 10.0%), and Farming, Fishing & Forestry (20 | 6.4%).
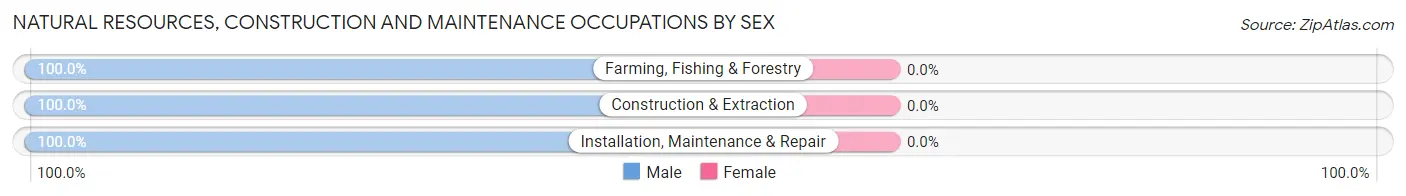
Natural Resources, Construction and Maintenance Occupations by Sex
| Occupation | Male | Female |
| Farming, Fishing & Forestry | 20 (100.0%) | 0 (0.0%) |
| Construction & Extraction | 64 (100.0%) | 0 (0.0%) |
| Installation, Maintenance & Repair | 31 (100.0%) | 0 (0.0%) |
| Total (Category) | 115 (100.0%) | 0 (0.0%) |
| Total (Overall) | 196 (63.0%) | 115 (37.0%) |
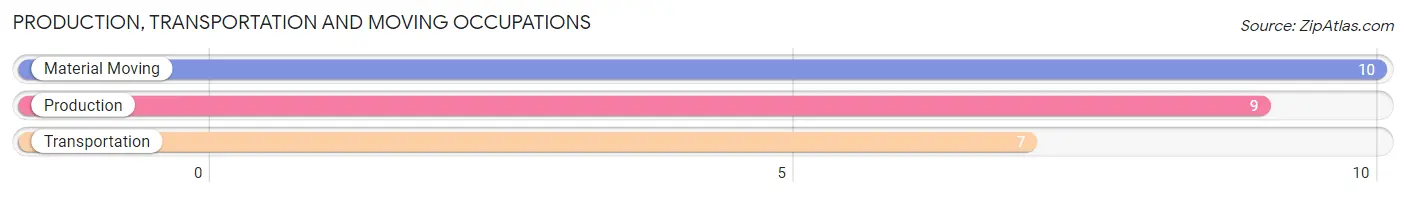
Production, Transportation and Moving Occupations
The most common Production, Transportation and Moving occupations in Pavo are Material Moving (10 | 3.2%), Production (9 | 2.9%), and Transportation (7 | 2.2%).
Production, Transportation and Moving Occupations by Sex
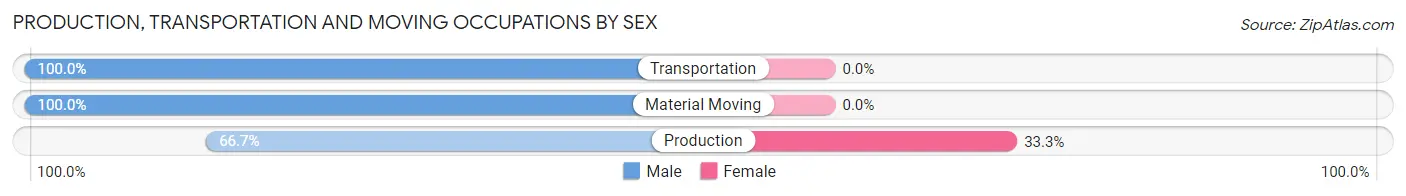
| Occupation | Male | Female |
| Production | 6 (66.7%) | 3 (33.3%) |
| Transportation | 7 (100.0%) | 0 (0.0%) |
| Material Moving | 10 (100.0%) | 0 (0.0%) |
| Total (Category) | 23 (88.5%) | 3 (11.5%) |
| Total (Overall) | 196 (63.0%) | 115 (37.0%) |
Employment Industries by Sex in Pavo
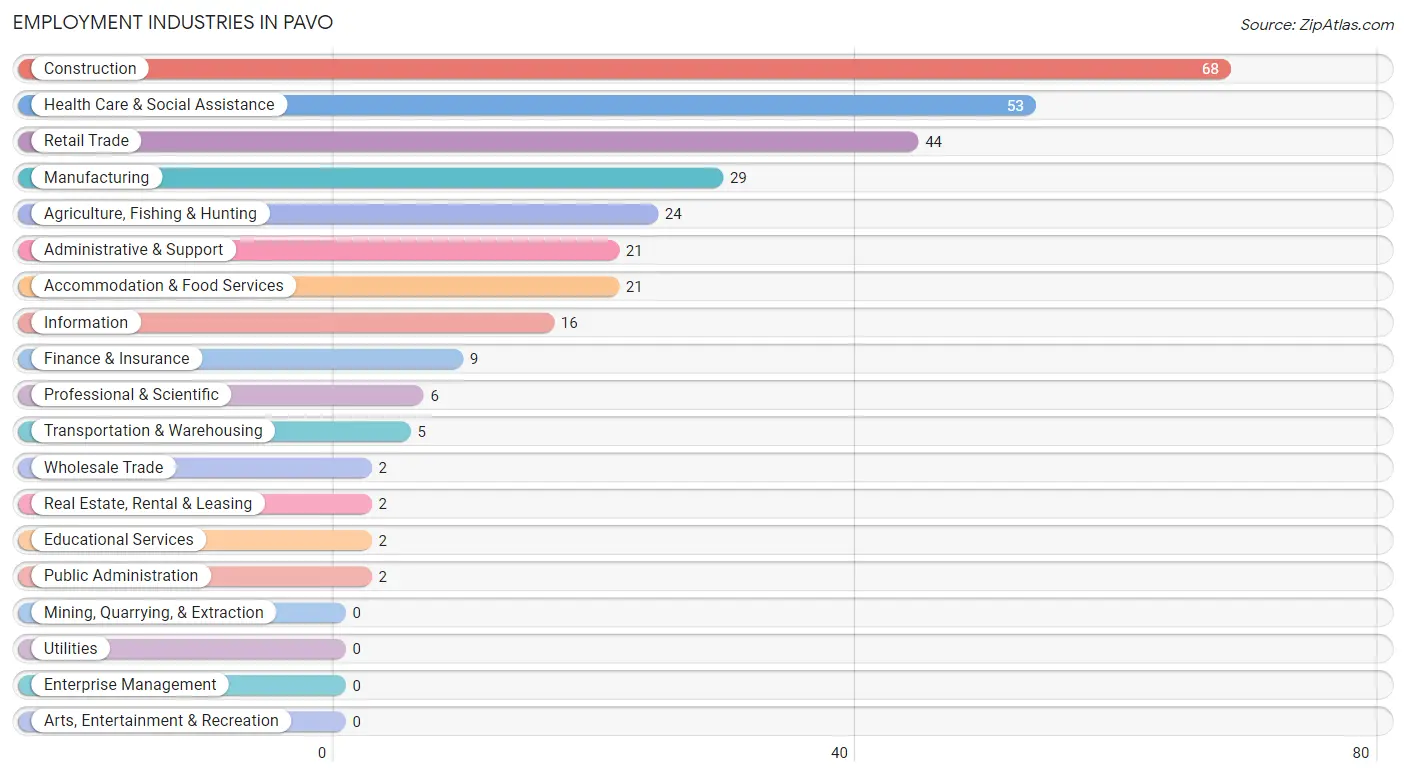
Employment Industries in Pavo
The major employment industries in Pavo include Construction (68 | 21.9%), Health Care & Social Assistance (53 | 17.0%), Retail Trade (44 | 14.1%), Manufacturing (29 | 9.3%), and Agriculture, Fishing & Hunting (24 | 7.7%).
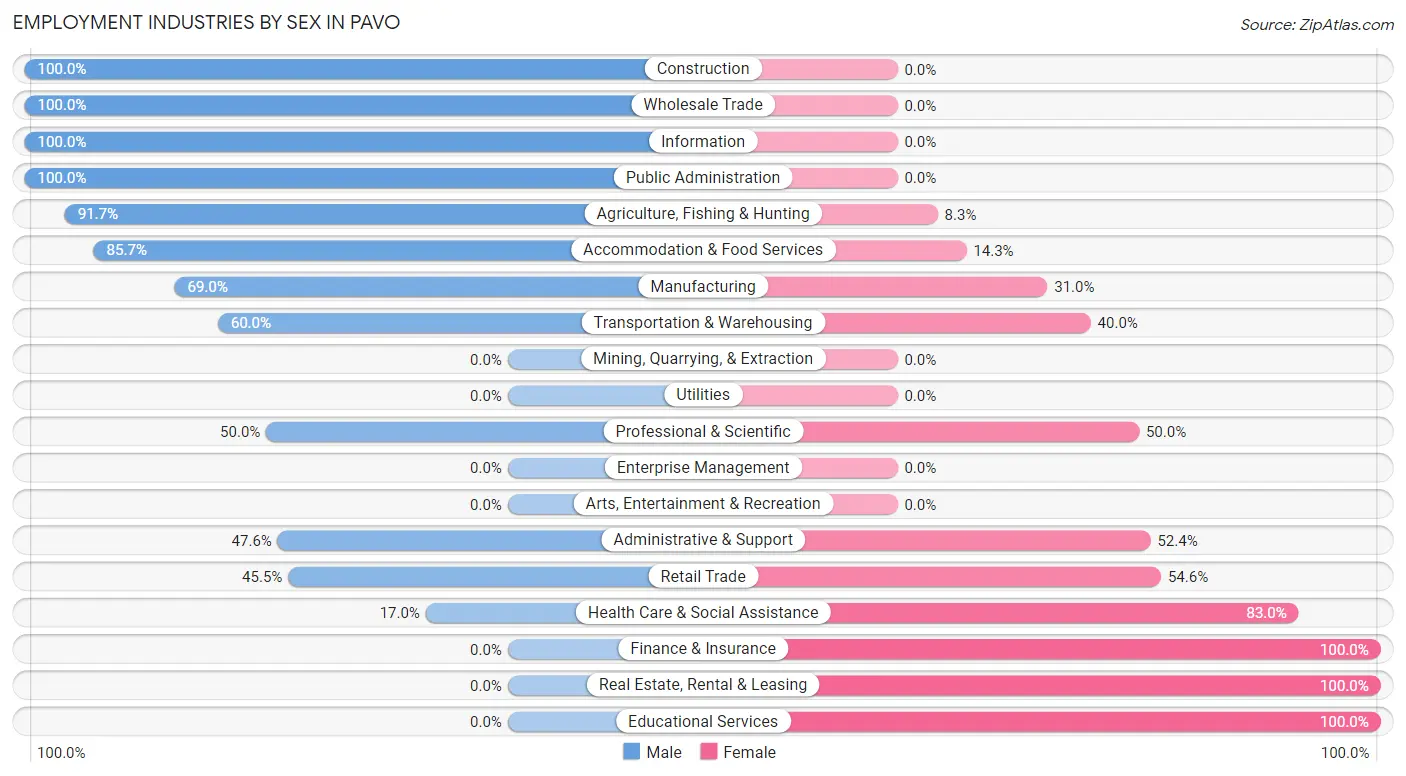
Employment Industries by Sex in Pavo
The Pavo industries that see more men than women are Construction (100.0%), Wholesale Trade (100.0%), and Information (100.0%), whereas the industries that tend to have a higher number of women are Finance & Insurance (100.0%), Real Estate, Rental & Leasing (100.0%), and Educational Services (100.0%).
| Industry | Male | Female |
| Agriculture, Fishing & Hunting | 22 (91.7%) | 2 (8.3%) |
| Mining, Quarrying, & Extraction | 0 (0.0%) | 0 (0.0%) |
| Construction | 68 (100.0%) | 0 (0.0%) |
| Manufacturing | 20 (69.0%) | 9 (31.0%) |
| Wholesale Trade | 2 (100.0%) | 0 (0.0%) |
| Retail Trade | 20 (45.5%) | 24 (54.5%) |
| Transportation & Warehousing | 3 (60.0%) | 2 (40.0%) |
| Utilities | 0 (0.0%) | 0 (0.0%) |
| Information | 16 (100.0%) | 0 (0.0%) |
| Finance & Insurance | 0 (0.0%) | 9 (100.0%) |
| Real Estate, Rental & Leasing | 0 (0.0%) | 2 (100.0%) |
| Professional & Scientific | 3 (50.0%) | 3 (50.0%) |
| Enterprise Management | 0 (0.0%) | 0 (0.0%) |
| Administrative & Support | 10 (47.6%) | 11 (52.4%) |
| Educational Services | 0 (0.0%) | 2 (100.0%) |
| Health Care & Social Assistance | 9 (17.0%) | 44 (83.0%) |
| Arts, Entertainment & Recreation | 0 (0.0%) | 0 (0.0%) |
| Accommodation & Food Services | 18 (85.7%) | 3 (14.3%) |
| Public Administration | 2 (100.0%) | 0 (0.0%) |
| Total | 196 (63.0%) | 115 (37.0%) |
Education in Pavo
School Enrollment in Pavo
The most common levels of schooling among the 146 students in Pavo are middle school (41 | 28.1%), high school (24 | 16.4%), and elementary school (22 | 15.1%).
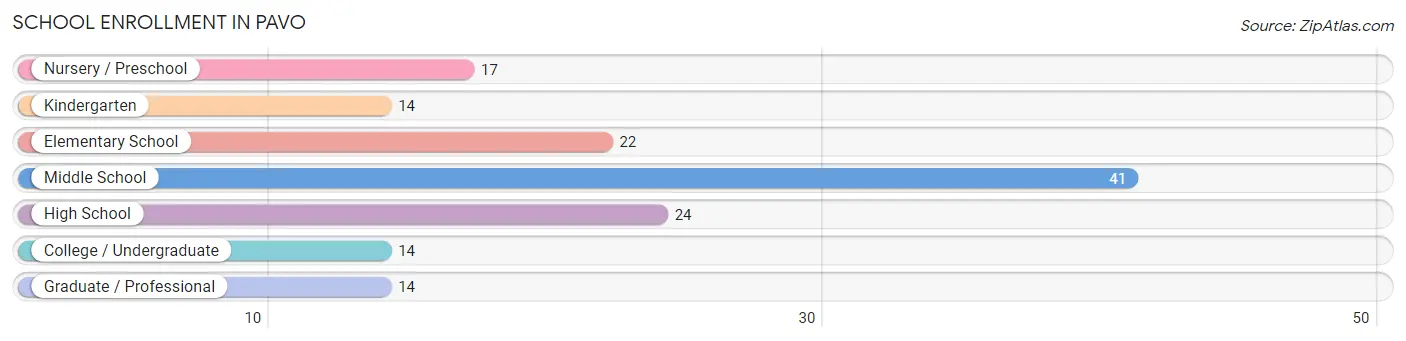
| School Level | # Students | % Students |
| Nursery / Preschool | 17 | 11.6% |
| Kindergarten | 14 | 9.6% |
| Elementary School | 22 | 15.1% |
| Middle School | 41 | 28.1% |
| High School | 24 | 16.4% |
| College / Undergraduate | 14 | 9.6% |
| Graduate / Professional | 14 | 9.6% |
| Total | 146 | 100.0% |
School Enrollment by Age by Funding Source in Pavo
Out of a total of 146 students who are enrolled in schools in Pavo, 19 (13.0%) attend a private institution, while the remaining 127 (87.0%) are enrolled in public schools. The age group of 5 to 9 year old has the highest likelihood of being enrolled in private schools, with 17 (35.4% in the age bracket) enrolled. Conversely, the age group of 10 to 14 year olds has the lowest likelihood of being enrolled in a private school, with 51 (100.0% in the age bracket) attending a public institution.
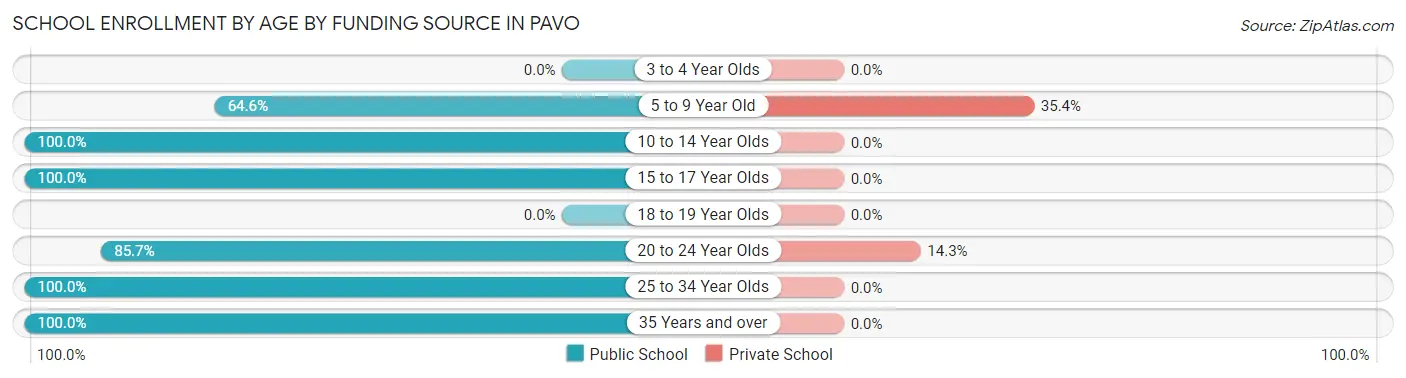
| Age Bracket | Public School | Private School |
| 3 to 4 Year Olds | 0 (0.0%) | 0 (0.0%) |
| 5 to 9 Year Old | 31 (64.6%) | 17 (35.4%) |
| 10 to 14 Year Olds | 51 (100.0%) | 0 (0.0%) |
| 15 to 17 Year Olds | 19 (100.0%) | 0 (0.0%) |
| 18 to 19 Year Olds | 0 (0.0%) | 0 (0.0%) |
| 20 to 24 Year Olds | 12 (85.7%) | 2 (14.3%) |
| 25 to 34 Year Olds | 3 (100.0%) | 0 (0.0%) |
| 35 Years and over | 11 (100.0%) | 0 (0.0%) |
| Total | 127 (87.0%) | 19 (13.0%) |
Educational Attainment by Field of Study in Pavo
Engineering (11 | 26.8%), psychology (9 | 22.0%), education (8 | 19.5%), physical & health sciences (6 | 14.6%), and visual & performing arts (3 | 7.3%) are the most common fields of study among 41 individuals in Pavo who have obtained a bachelor's degree or higher.
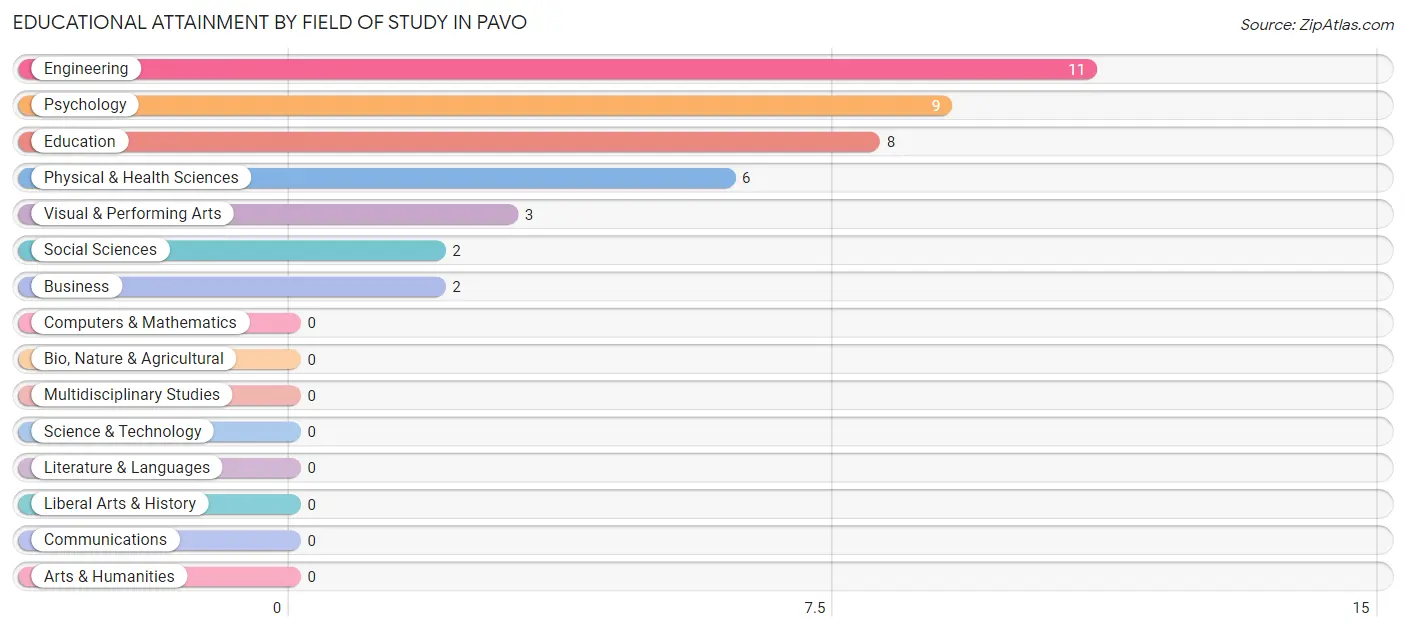
| Field of Study | # Graduates | % Graduates |
| Computers & Mathematics | 0 | 0.0% |
| Bio, Nature & Agricultural | 0 | 0.0% |
| Physical & Health Sciences | 6 | 14.6% |
| Psychology | 9 | 22.0% |
| Social Sciences | 2 | 4.9% |
| Engineering | 11 | 26.8% |
| Multidisciplinary Studies | 0 | 0.0% |
| Science & Technology | 0 | 0.0% |
| Business | 2 | 4.9% |
| Education | 8 | 19.5% |
| Literature & Languages | 0 | 0.0% |
| Liberal Arts & History | 0 | 0.0% |
| Visual & Performing Arts | 3 | 7.3% |
| Communications | 0 | 0.0% |
| Arts & Humanities | 0 | 0.0% |
| Total | 41 | 100.0% |
Transportation & Commute in Pavo
Vehicle Availability by Sex in Pavo
The most prevalent vehicle ownership categories in Pavo are males with 2 vehicles (127, accounting for 65.8%) and females with 2 vehicles (34, making up 118.7%).
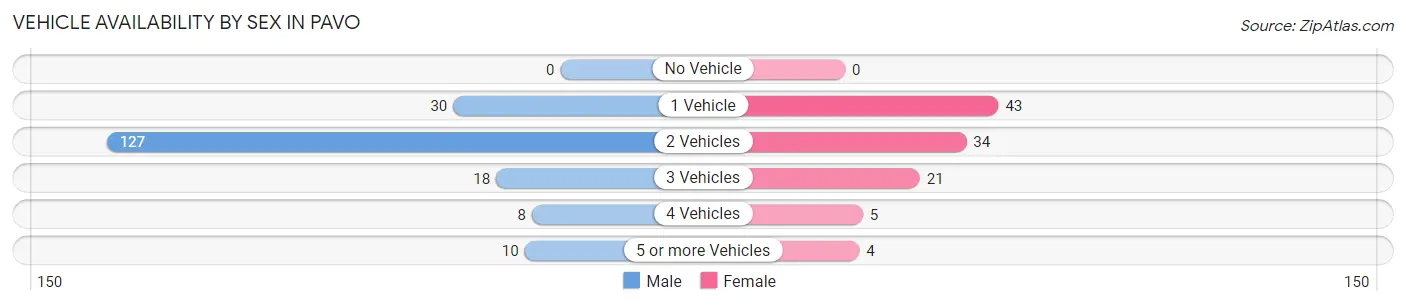
| Vehicles Available | Male | Female |
| No Vehicle | 0 (0.0%) | 0 (0.0%) |
| 1 Vehicle | 30 (15.5%) | 43 (40.2%) |
| 2 Vehicles | 127 (65.8%) | 34 (31.8%) |
| 3 Vehicles | 18 (9.3%) | 21 (19.6%) |
| 4 Vehicles | 8 (4.2%) | 5 (4.7%) |
| 5 or more Vehicles | 10 (5.2%) | 4 (3.7%) |
| Total | 193 (100.0%) | 107 (100.0%) |
Commute Time in Pavo
The most frequently occuring commute durations in Pavo are 20 to 24 minutes (91 commuters, 30.6%), 30 to 34 minutes (53 commuters, 17.8%), and 15 to 19 minutes (40 commuters, 13.5%).
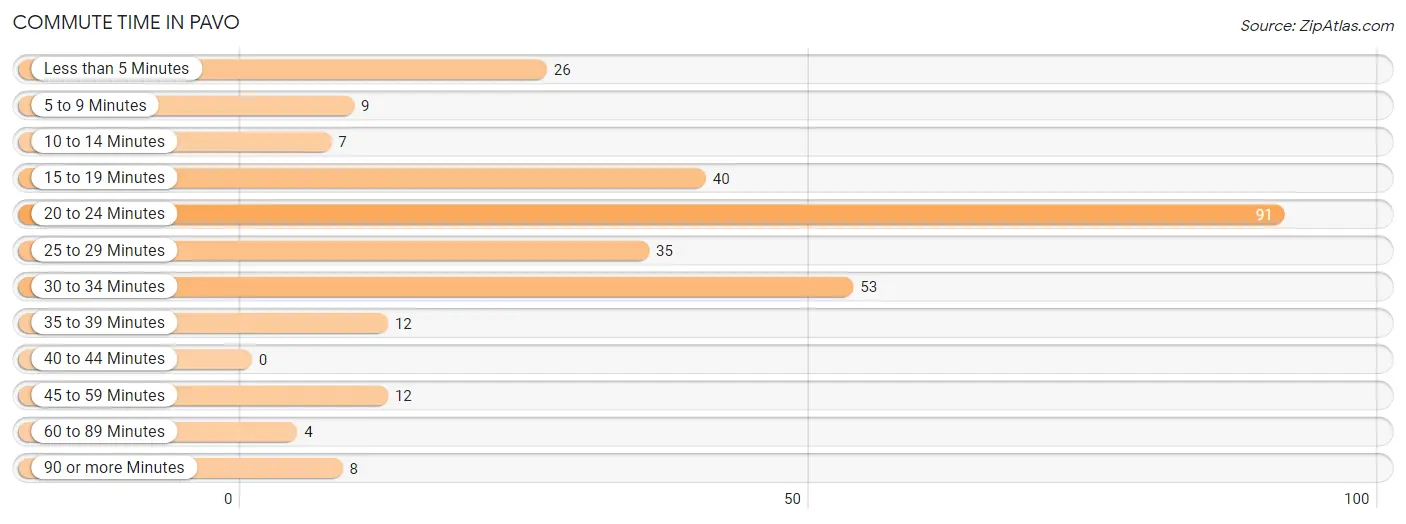
| Commute Time | # Commuters | % Commuters |
| Less than 5 Minutes | 26 | 8.7% |
| 5 to 9 Minutes | 9 | 3.0% |
| 10 to 14 Minutes | 7 | 2.4% |
| 15 to 19 Minutes | 40 | 13.5% |
| 20 to 24 Minutes | 91 | 30.6% |
| 25 to 29 Minutes | 35 | 11.8% |
| 30 to 34 Minutes | 53 | 17.8% |
| 35 to 39 Minutes | 12 | 4.0% |
| 40 to 44 Minutes | 0 | 0.0% |
| 45 to 59 Minutes | 12 | 4.0% |
| 60 to 89 Minutes | 4 | 1.3% |
| 90 or more Minutes | 8 | 2.7% |
Commute Time by Sex in Pavo
The most common commute times in Pavo are 20 to 24 minutes (70 commuters, 36.5%) for males and 30 to 34 minutes (22 commuters, 20.9%) for females.
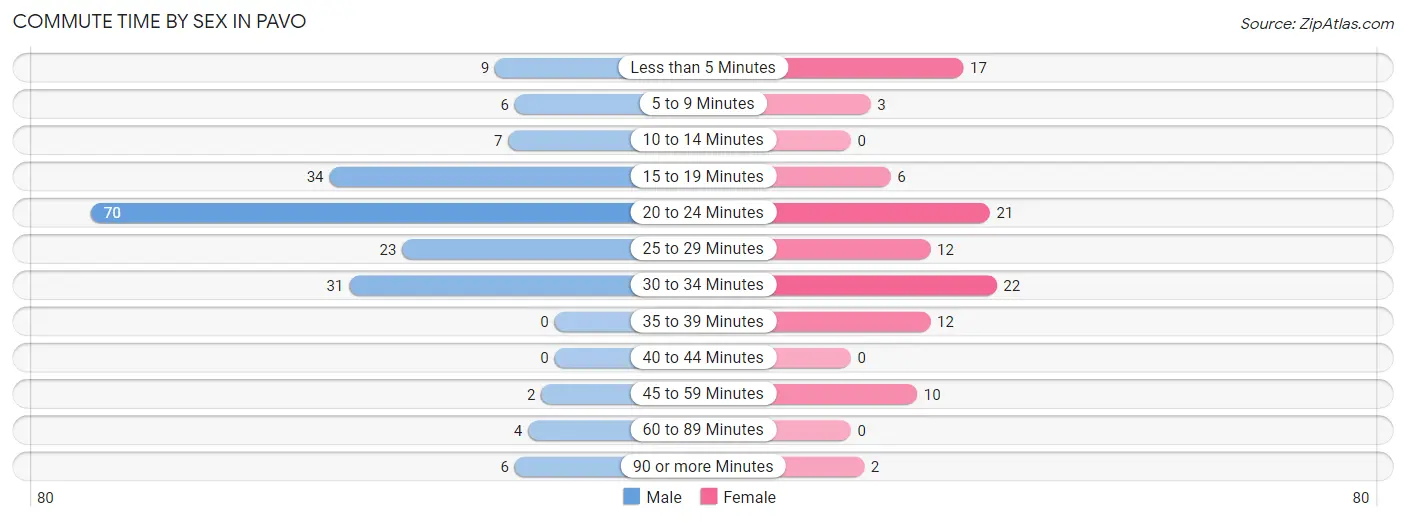
| Commute Time | Male | Female |
| Less than 5 Minutes | 9 (4.7%) | 17 (16.2%) |
| 5 to 9 Minutes | 6 (3.1%) | 3 (2.9%) |
| 10 to 14 Minutes | 7 (3.6%) | 0 (0.0%) |
| 15 to 19 Minutes | 34 (17.7%) | 6 (5.7%) |
| 20 to 24 Minutes | 70 (36.5%) | 21 (20.0%) |
| 25 to 29 Minutes | 23 (12.0%) | 12 (11.4%) |
| 30 to 34 Minutes | 31 (16.2%) | 22 (20.9%) |
| 35 to 39 Minutes | 0 (0.0%) | 12 (11.4%) |
| 40 to 44 Minutes | 0 (0.0%) | 0 (0.0%) |
| 45 to 59 Minutes | 2 (1.0%) | 10 (9.5%) |
| 60 to 89 Minutes | 4 (2.1%) | 0 (0.0%) |
| 90 or more Minutes | 6 (3.1%) | 2 (1.9%) |
Time of Departure to Work by Sex in Pavo
The most frequent times of departure to work in Pavo are 6:30 AM to 6:59 AM (38, 19.8%) for males and 12:00 PM to 3:59 PM (17, 16.2%) for females.
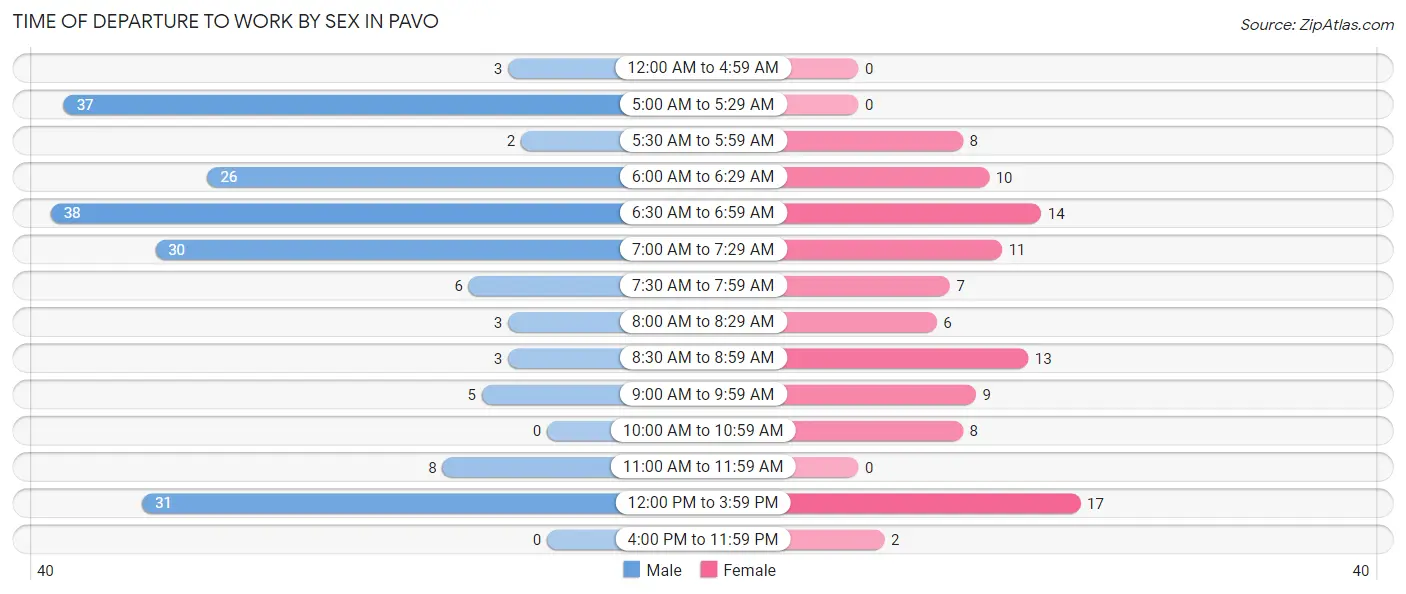
| Time of Departure | Male | Female |
| 12:00 AM to 4:59 AM | 3 (1.6%) | 0 (0.0%) |
| 5:00 AM to 5:29 AM | 37 (19.3%) | 0 (0.0%) |
| 5:30 AM to 5:59 AM | 2 (1.0%) | 8 (7.6%) |
| 6:00 AM to 6:29 AM | 26 (13.5%) | 10 (9.5%) |
| 6:30 AM to 6:59 AM | 38 (19.8%) | 14 (13.3%) |
| 7:00 AM to 7:29 AM | 30 (15.6%) | 11 (10.5%) |
| 7:30 AM to 7:59 AM | 6 (3.1%) | 7 (6.7%) |
| 8:00 AM to 8:29 AM | 3 (1.6%) | 6 (5.7%) |
| 8:30 AM to 8:59 AM | 3 (1.6%) | 13 (12.4%) |
| 9:00 AM to 9:59 AM | 5 (2.6%) | 9 (8.6%) |
| 10:00 AM to 10:59 AM | 0 (0.0%) | 8 (7.6%) |
| 11:00 AM to 11:59 AM | 8 (4.2%) | 0 (0.0%) |
| 12:00 PM to 3:59 PM | 31 (16.2%) | 17 (16.2%) |
| 4:00 PM to 11:59 PM | 0 (0.0%) | 2 (1.9%) |
| Total | 192 (100.0%) | 105 (100.0%) |
Housing Occupancy in Pavo
Occupancy by Ownership in Pavo
Of the total 295 dwellings in Pavo, owner-occupied units account for 173 (58.6%), while renter-occupied units make up 122 (41.4%).
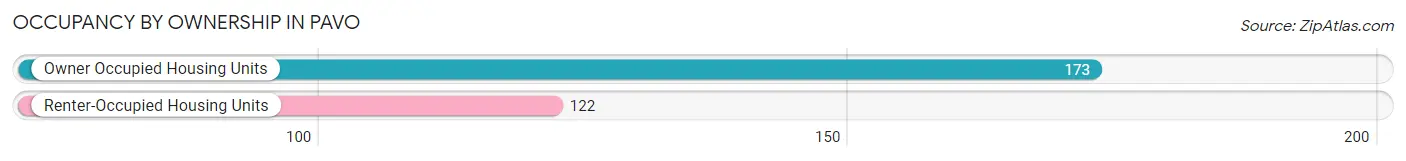
| Occupancy | # Housing Units | % Housing Units |
| Owner Occupied Housing Units | 173 | 58.6% |
| Renter-Occupied Housing Units | 122 | 41.4% |
| Total Occupied Housing Units | 295 | 100.0% |
Occupancy by Household Size in Pavo
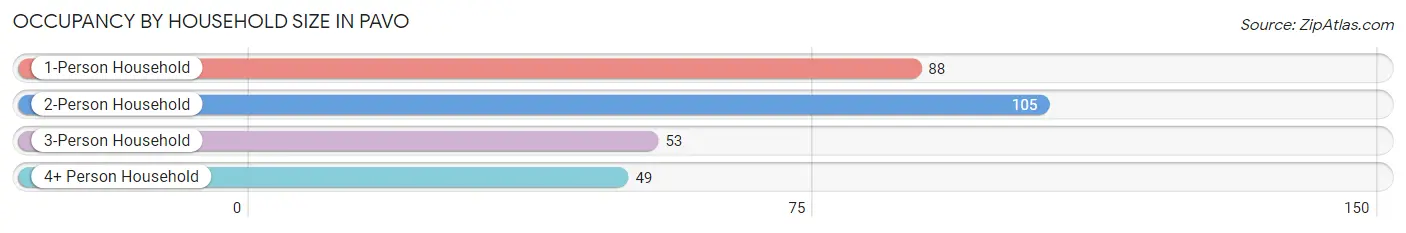
| Household Size | # Housing Units | % Housing Units |
| 1-Person Household | 88 | 29.8% |
| 2-Person Household | 105 | 35.6% |
| 3-Person Household | 53 | 18.0% |
| 4+ Person Household | 49 | 16.6% |
| Total Housing Units | 295 | 100.0% |
Occupancy by Ownership by Household Size in Pavo
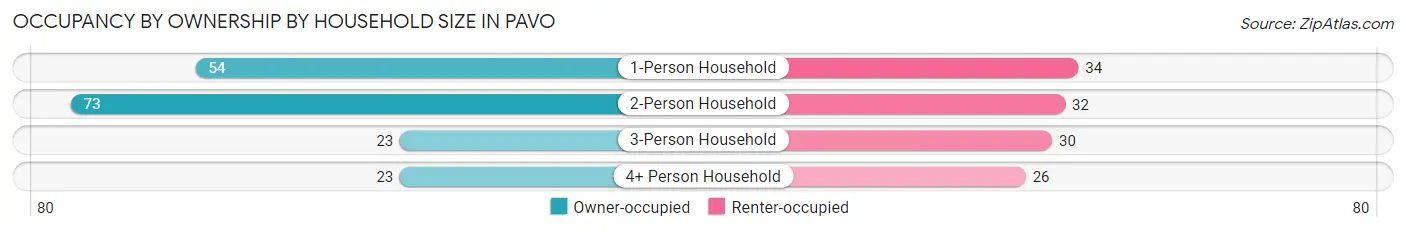
| Household Size | Owner-occupied | Renter-occupied |
| 1-Person Household | 54 (61.4%) | 34 (38.6%) |
| 2-Person Household | 73 (69.5%) | 32 (30.5%) |
| 3-Person Household | 23 (43.4%) | 30 (56.6%) |
| 4+ Person Household | 23 (46.9%) | 26 (53.1%) |
| Total Housing Units | 173 (58.6%) | 122 (41.4%) |
Occupancy by Educational Attainment in Pavo
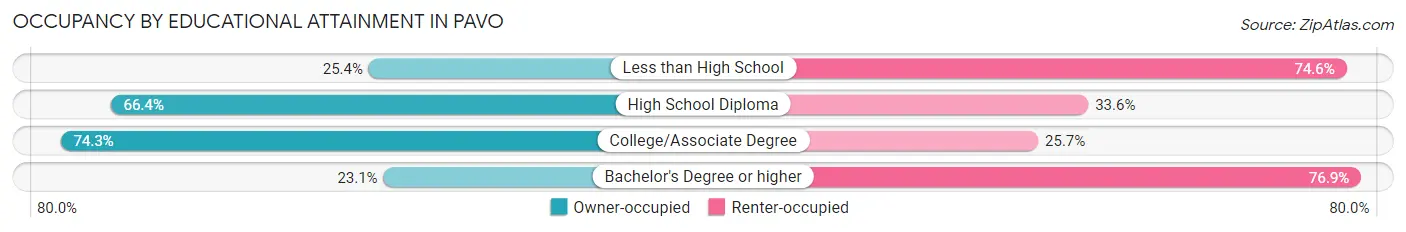
| Household Size | Owner-occupied | Renter-occupied |
| Less than High School | 16 (25.4%) | 47 (74.6%) |
| High School Diploma | 73 (66.4%) | 37 (33.6%) |
| College/Associate Degree | 81 (74.3%) | 28 (25.7%) |
| Bachelor's Degree or higher | 3 (23.1%) | 10 (76.9%) |
Occupancy by Age of Householder in Pavo
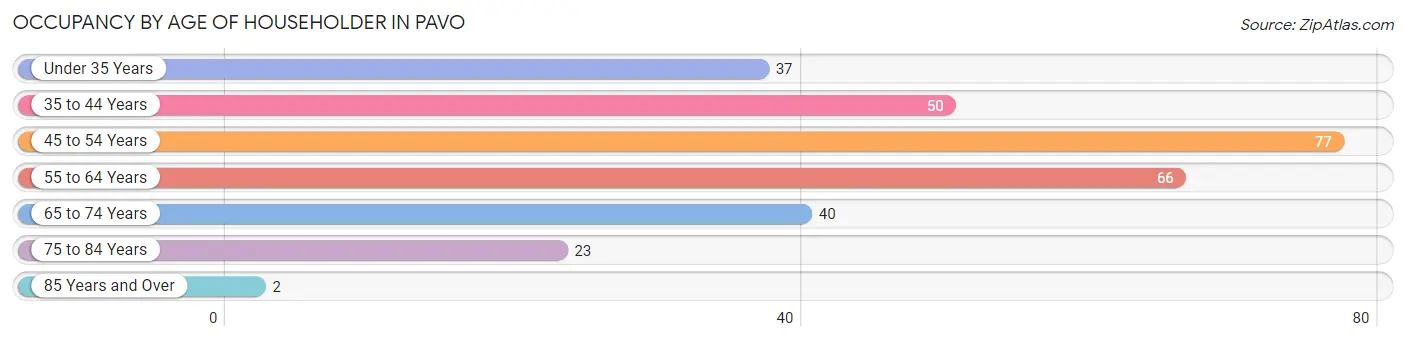
| Age Bracket | # Households | % Households |
| Under 35 Years | 37 | 12.5% |
| 35 to 44 Years | 50 | 17.0% |
| 45 to 54 Years | 77 | 26.1% |
| 55 to 64 Years | 66 | 22.4% |
| 65 to 74 Years | 40 | 13.6% |
| 75 to 84 Years | 23 | 7.8% |
| 85 Years and Over | 2 | 0.7% |
| Total | 295 | 100.0% |
Housing Finances in Pavo
Median Income by Occupancy in Pavo
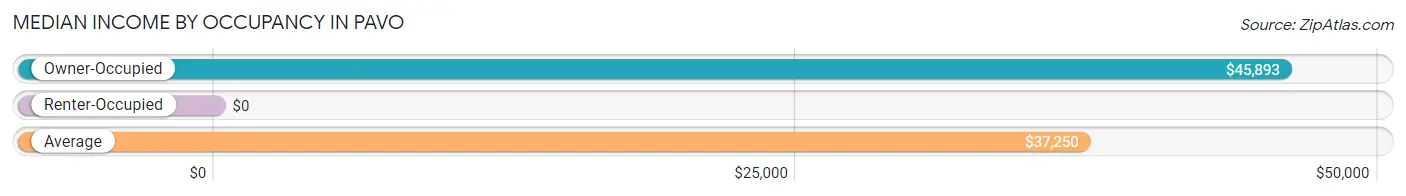
| Occupancy Type | # Households | Median Income |
| Owner-Occupied | 173 (58.6%) | $45,893 |
| Renter-Occupied | 122 (41.4%) | $0 |
| Average | 295 (100.0%) | $37,250 |
Occupancy by Householder Income Bracket in Pavo
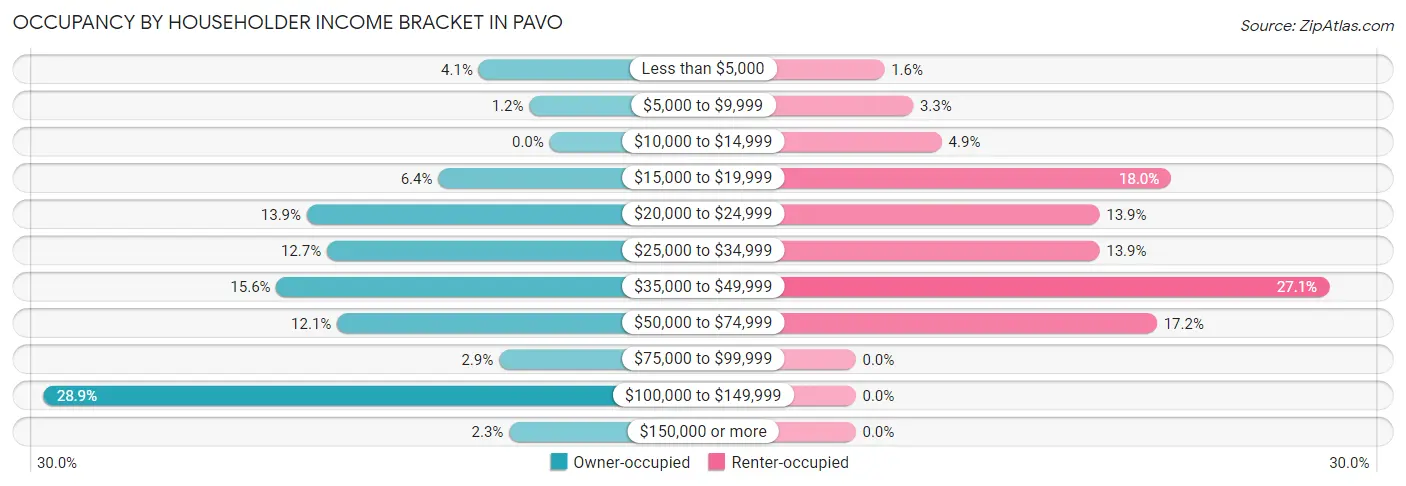
| Income Bracket | Owner-occupied | Renter-occupied |
| Less than $5,000 | 7 (4.1%) | 2 (1.6%) |
| $5,000 to $9,999 | 2 (1.2%) | 4 (3.3%) |
| $10,000 to $14,999 | 0 (0.0%) | 6 (4.9%) |
| $15,000 to $19,999 | 11 (6.4%) | 22 (18.0%) |
| $20,000 to $24,999 | 24 (13.9%) | 17 (13.9%) |
| $25,000 to $34,999 | 22 (12.7%) | 17 (13.9%) |
| $35,000 to $49,999 | 27 (15.6%) | 33 (27.1%) |
| $50,000 to $74,999 | 21 (12.1%) | 21 (17.2%) |
| $75,000 to $99,999 | 5 (2.9%) | 0 (0.0%) |
| $100,000 to $149,999 | 50 (28.9%) | 0 (0.0%) |
| $150,000 or more | 4 (2.3%) | 0 (0.0%) |
| Total | 173 (100.0%) | 122 (100.0%) |
Monthly Housing Cost Tiers in Pavo
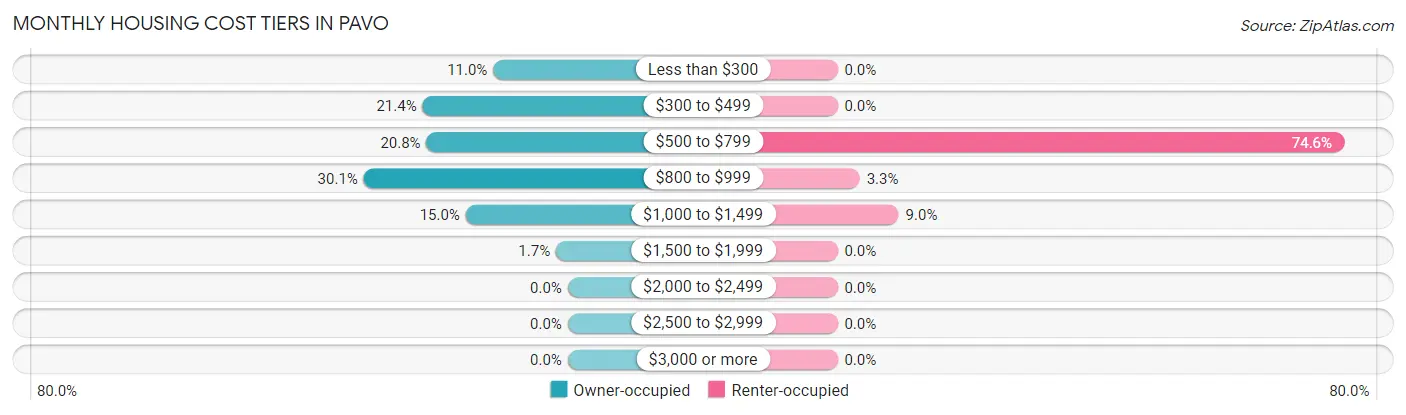
| Monthly Cost | Owner-occupied | Renter-occupied |
| Less than $300 | 19 (11.0%) | 0 (0.0%) |
| $300 to $499 | 37 (21.4%) | 0 (0.0%) |
| $500 to $799 | 36 (20.8%) | 91 (74.6%) |
| $800 to $999 | 52 (30.1%) | 4 (3.3%) |
| $1,000 to $1,499 | 26 (15.0%) | 11 (9.0%) |
| $1,500 to $1,999 | 3 (1.7%) | 0 (0.0%) |
| $2,000 to $2,499 | 0 (0.0%) | 0 (0.0%) |
| $2,500 to $2,999 | 0 (0.0%) | 0 (0.0%) |
| $3,000 or more | 0 (0.0%) | 0 (0.0%) |
| Total | 173 (100.0%) | 122 (100.0%) |
Physical Housing Characteristics in Pavo
Housing Structures in Pavo
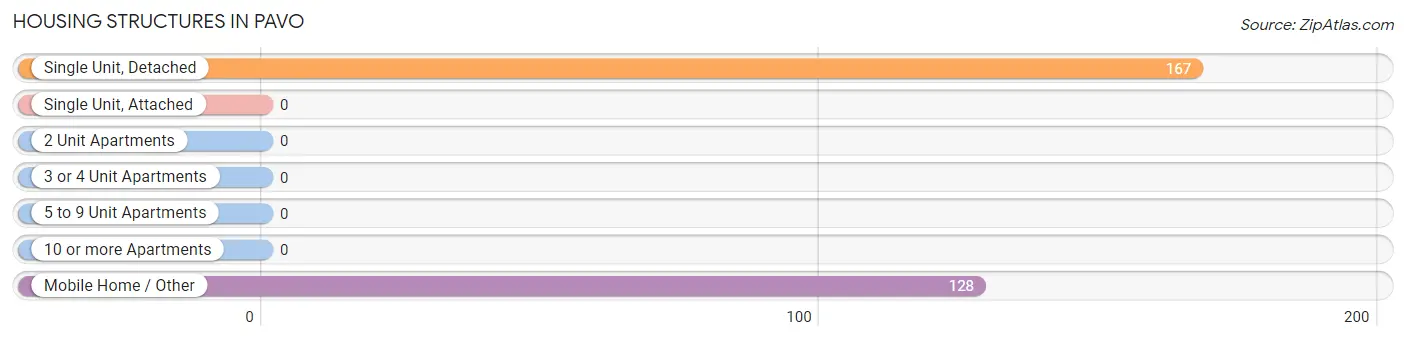
| Structure Type | # Housing Units | % Housing Units |
| Single Unit, Detached | 167 | 56.6% |
| Single Unit, Attached | 0 | 0.0% |
| 2 Unit Apartments | 0 | 0.0% |
| 3 or 4 Unit Apartments | 0 | 0.0% |
| 5 to 9 Unit Apartments | 0 | 0.0% |
| 10 or more Apartments | 0 | 0.0% |
| Mobile Home / Other | 128 | 43.4% |
| Total | 295 | 100.0% |
Housing Structures by Occupancy in Pavo
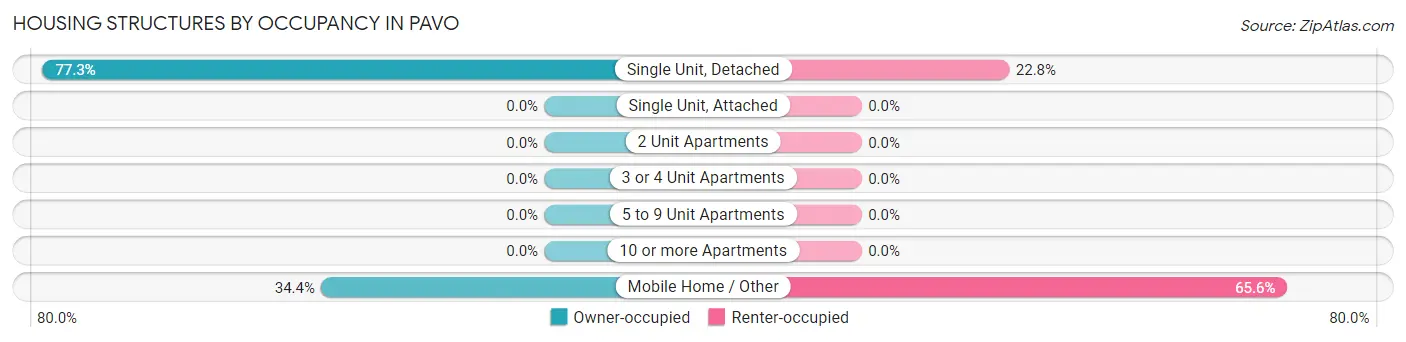
| Structure Type | Owner-occupied | Renter-occupied |
| Single Unit, Detached | 129 (77.2%) | 38 (22.8%) |
| Single Unit, Attached | 0 (0.0%) | 0 (0.0%) |
| 2 Unit Apartments | 0 (0.0%) | 0 (0.0%) |
| 3 or 4 Unit Apartments | 0 (0.0%) | 0 (0.0%) |
| 5 to 9 Unit Apartments | 0 (0.0%) | 0 (0.0%) |
| 10 or more Apartments | 0 (0.0%) | 0 (0.0%) |
| Mobile Home / Other | 44 (34.4%) | 84 (65.6%) |
| Total | 173 (58.6%) | 122 (41.4%) |
Housing Structures by Number of Rooms in Pavo
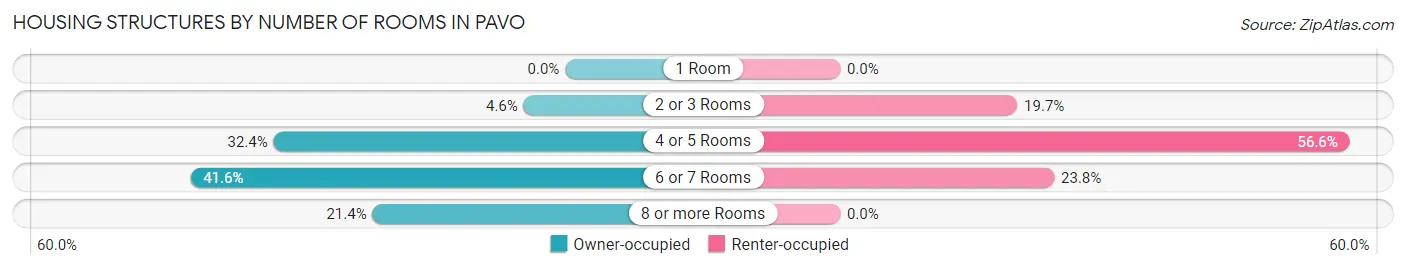
| Number of Rooms | Owner-occupied | Renter-occupied |
| 1 Room | 0 (0.0%) | 0 (0.0%) |
| 2 or 3 Rooms | 8 (4.6%) | 24 (19.7%) |
| 4 or 5 Rooms | 56 (32.4%) | 69 (56.6%) |
| 6 or 7 Rooms | 72 (41.6%) | 29 (23.8%) |
| 8 or more Rooms | 37 (21.4%) | 0 (0.0%) |
| Total | 173 (100.0%) | 122 (100.0%) |
Housing Structure by Heating Type in Pavo
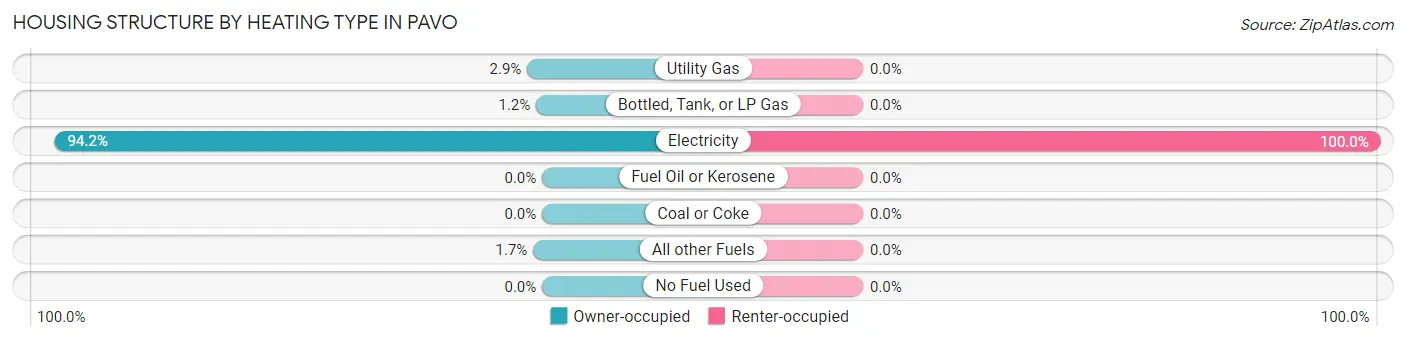
| Heating Type | Owner-occupied | Renter-occupied |
| Utility Gas | 5 (2.9%) | 0 (0.0%) |
| Bottled, Tank, or LP Gas | 2 (1.2%) | 0 (0.0%) |
| Electricity | 163 (94.2%) | 122 (100.0%) |
| Fuel Oil or Kerosene | 0 (0.0%) | 0 (0.0%) |
| Coal or Coke | 0 (0.0%) | 0 (0.0%) |
| All other Fuels | 3 (1.7%) | 0 (0.0%) |
| No Fuel Used | 0 (0.0%) | 0 (0.0%) |
| Total | 173 (100.0%) | 122 (100.0%) |
Household Vehicle Usage in Pavo
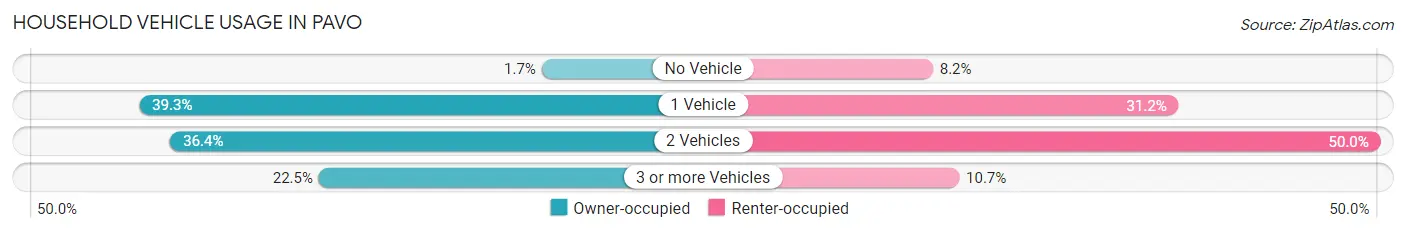
| Vehicles per Household | Owner-occupied | Renter-occupied |
| No Vehicle | 3 (1.7%) | 10 (8.2%) |
| 1 Vehicle | 68 (39.3%) | 38 (31.1%) |
| 2 Vehicles | 63 (36.4%) | 61 (50.0%) |
| 3 or more Vehicles | 39 (22.5%) | 13 (10.7%) |
| Total | 173 (100.0%) | 122 (100.0%) |
Real Estate & Mortgages in Pavo
Real Estate and Mortgage Overview in Pavo
| Characteristic | Without Mortgage | With Mortgage |
| Housing Units | 74 | 99 |
| Median Property Value | $50,700 | $98,900 |
| Median Household Income | $36,500 | $2 |
| Monthly Housing Costs | $417 | $0 |
| Real Estate Taxes | $733 | $0 |
Property Value by Mortgage Status in Pavo
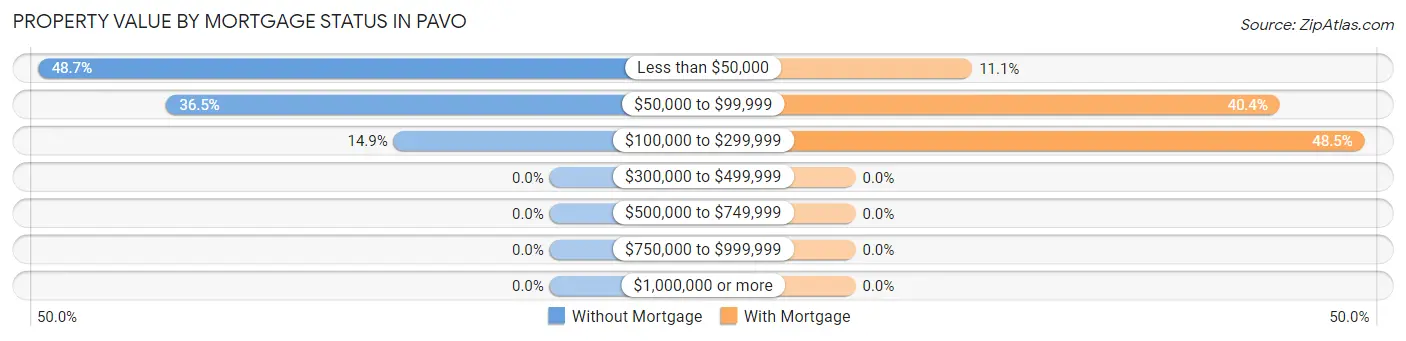
| Property Value | Without Mortgage | With Mortgage |
| Less than $50,000 | 36 (48.6%) | 11 (11.1%) |
| $50,000 to $99,999 | 27 (36.5%) | 40 (40.4%) |
| $100,000 to $299,999 | 11 (14.9%) | 48 (48.5%) |
| $300,000 to $499,999 | 0 (0.0%) | 0 (0.0%) |
| $500,000 to $749,999 | 0 (0.0%) | 0 (0.0%) |
| $750,000 to $999,999 | 0 (0.0%) | 0 (0.0%) |
| $1,000,000 or more | 0 (0.0%) | 0 (0.0%) |
| Total | 74 (100.0%) | 99 (100.0%) |
Household Income by Mortgage Status in Pavo
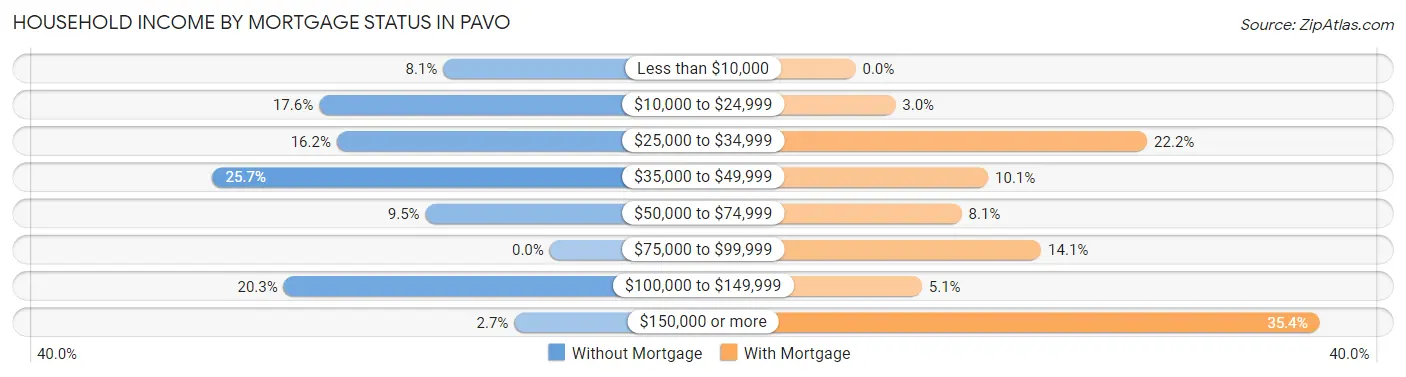
| Household Income | Without Mortgage | With Mortgage |
| Less than $10,000 | 6 (8.1%) | 0 (0.0%) |
| $10,000 to $24,999 | 13 (17.6%) | 3 (3.0%) |
| $25,000 to $34,999 | 12 (16.2%) | 22 (22.2%) |
| $35,000 to $49,999 | 19 (25.7%) | 10 (10.1%) |
| $50,000 to $74,999 | 7 (9.5%) | 8 (8.1%) |
| $75,000 to $99,999 | 0 (0.0%) | 14 (14.1%) |
| $100,000 to $149,999 | 15 (20.3%) | 5 (5.1%) |
| $150,000 or more | 2 (2.7%) | 35 (35.3%) |
| Total | 74 (100.0%) | 99 (100.0%) |
Property Value to Household Income Ratio in Pavo
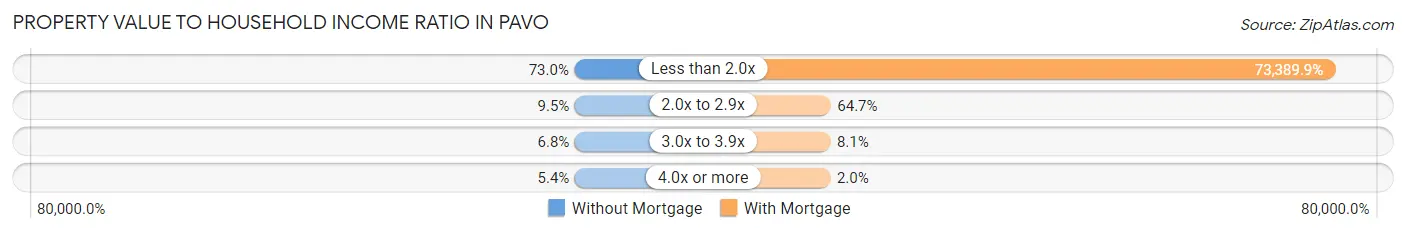
| Value-to-Income Ratio | Without Mortgage | With Mortgage |
| Less than 2.0x | 54 (73.0%) | 72,656 (73,389.9%) |
| 2.0x to 2.9x | 7 (9.5%) | 64 (64.6%) |
| 3.0x to 3.9x | 5 (6.8%) | 8 (8.1%) |
| 4.0x or more | 4 (5.4%) | 2 (2.0%) |
| Total | 74 (100.0%) | 99 (100.0%) |
Real Estate Taxes by Mortgage Status in Pavo
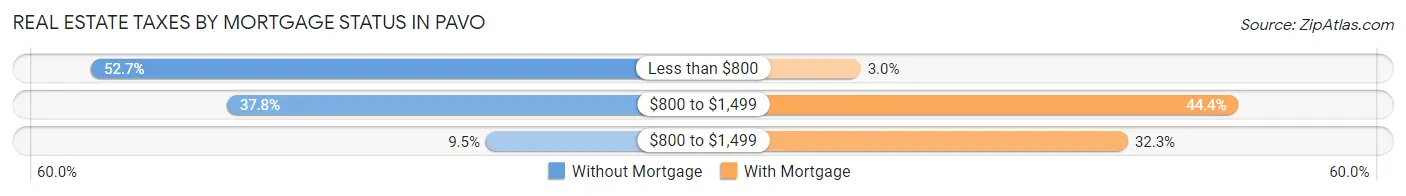
| Property Taxes | Without Mortgage | With Mortgage |
| Less than $800 | 39 (52.7%) | 3 (3.0%) |
| $800 to $1,499 | 28 (37.8%) | 44 (44.4%) |
| $800 to $1,499 | 7 (9.5%) | 32 (32.3%) |
| Total | 74 (100.0%) | 99 (100.0%) |
Health & Disability in Pavo
Health Insurance Coverage by Age in Pavo
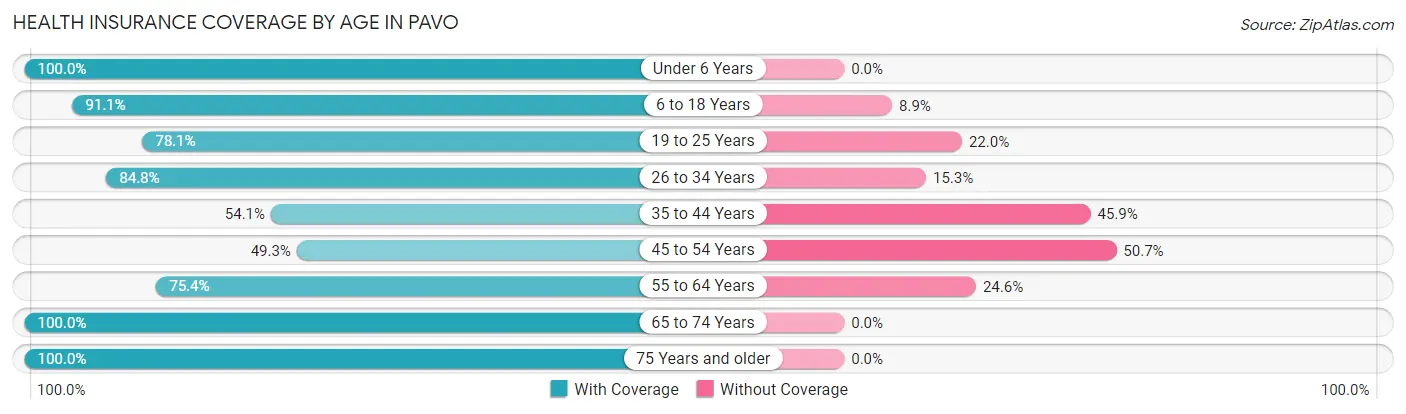
| Age Bracket | With Coverage | Without Coverage |
| Under 6 Years | 52 (100.0%) | 0 (0.0%) |
| 6 to 18 Years | 92 (91.1%) | 9 (8.9%) |
| 19 to 25 Years | 32 (78.0%) | 9 (22.0%) |
| 26 to 34 Years | 50 (84.8%) | 9 (15.2%) |
| 35 to 44 Years | 53 (54.1%) | 45 (45.9%) |
| 45 to 54 Years | 67 (49.3%) | 69 (50.7%) |
| 55 to 64 Years | 86 (75.4%) | 28 (24.6%) |
| 65 to 74 Years | 89 (100.0%) | 0 (0.0%) |
| 75 Years and older | 25 (100.0%) | 0 (0.0%) |
| Total | 546 (76.4%) | 169 (23.6%) |
Health Insurance Coverage by Citizenship Status in Pavo
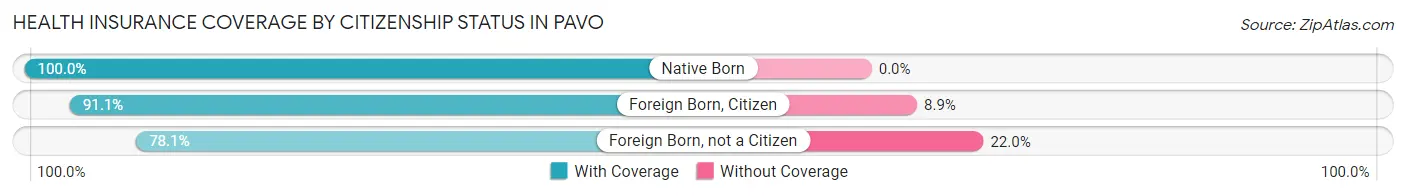
| Citizenship Status | With Coverage | Without Coverage |
| Native Born | 52 (100.0%) | 0 (0.0%) |
| Foreign Born, Citizen | 92 (91.1%) | 9 (8.9%) |
| Foreign Born, not a Citizen | 32 (78.0%) | 9 (22.0%) |
Health Insurance Coverage by Household Income in Pavo
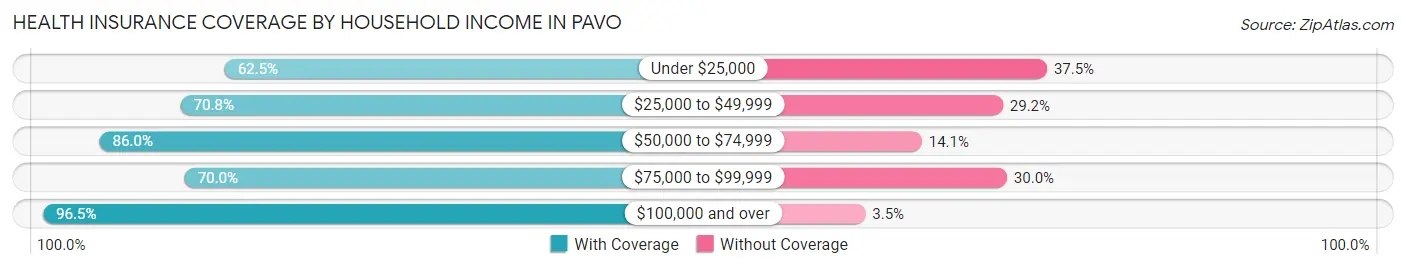
| Household Income | With Coverage | Without Coverage |
| Under $25,000 | 115 (62.5%) | 69 (37.5%) |
| $25,000 to $49,999 | 167 (70.8%) | 69 (29.2%) |
| $50,000 to $74,999 | 104 (86.0%) | 17 (14.1%) |
| $75,000 to $99,999 | 21 (70.0%) | 9 (30.0%) |
| $100,000 and over | 139 (96.5%) | 5 (3.5%) |
Public vs Private Health Insurance Coverage by Age in Pavo
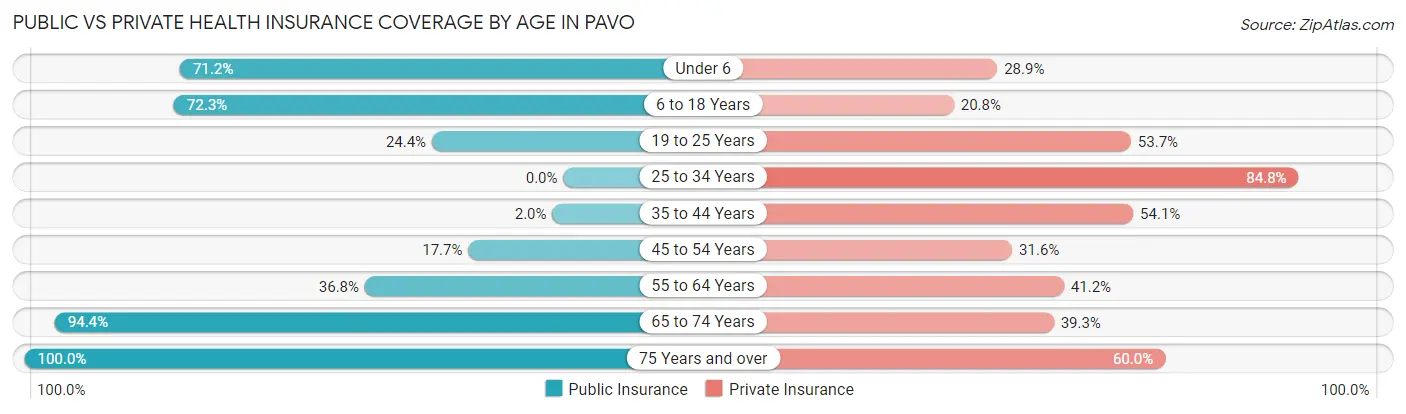
| Age Bracket | Public Insurance | Private Insurance |
| Under 6 | 37 (71.2%) | 15 (28.8%) |
| 6 to 18 Years | 73 (72.3%) | 21 (20.8%) |
| 19 to 25 Years | 10 (24.4%) | 22 (53.7%) |
| 25 to 34 Years | 0 (0.0%) | 50 (84.8%) |
| 35 to 44 Years | 2 (2.0%) | 53 (54.1%) |
| 45 to 54 Years | 24 (17.6%) | 43 (31.6%) |
| 55 to 64 Years | 42 (36.8%) | 47 (41.2%) |
| 65 to 74 Years | 84 (94.4%) | 35 (39.3%) |
| 75 Years and over | 25 (100.0%) | 15 (60.0%) |
| Total | 297 (41.5%) | 301 (42.1%) |
Disability Status by Sex by Age in Pavo
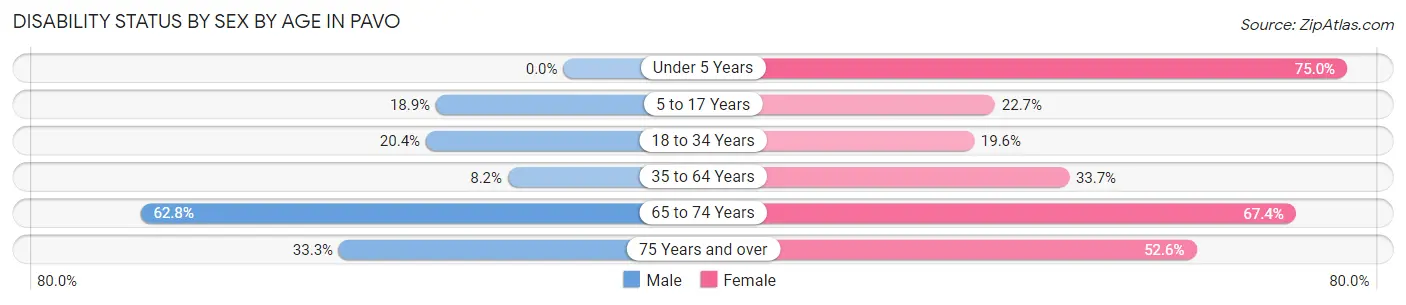
| Age Bracket | Male | Female |
| Under 5 Years | 0 (0.0%) | 9 (75.0%) |
| 5 to 17 Years | 14 (18.9%) | 10 (22.7%) |
| 18 to 34 Years | 10 (20.4%) | 10 (19.6%) |
| 35 to 64 Years | 15 (8.2%) | 56 (33.7%) |
| 65 to 74 Years | 27 (62.8%) | 31 (67.4%) |
| 75 Years and over | 2 (33.3%) | 10 (52.6%) |
Disability Class by Sex by Age in Pavo
Disability Class: Hearing Difficulty
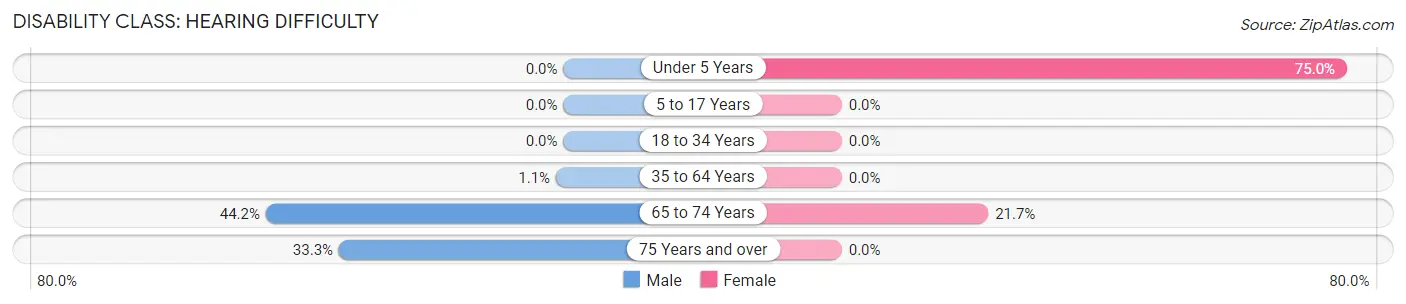
| Age Bracket | Male | Female |
| Under 5 Years | 0 (0.0%) | 9 (75.0%) |
| 5 to 17 Years | 0 (0.0%) | 0 (0.0%) |
| 18 to 34 Years | 0 (0.0%) | 0 (0.0%) |
| 35 to 64 Years | 2 (1.1%) | 0 (0.0%) |
| 65 to 74 Years | 19 (44.2%) | 10 (21.7%) |
| 75 Years and over | 2 (33.3%) | 0 (0.0%) |
Disability Class: Vision Difficulty
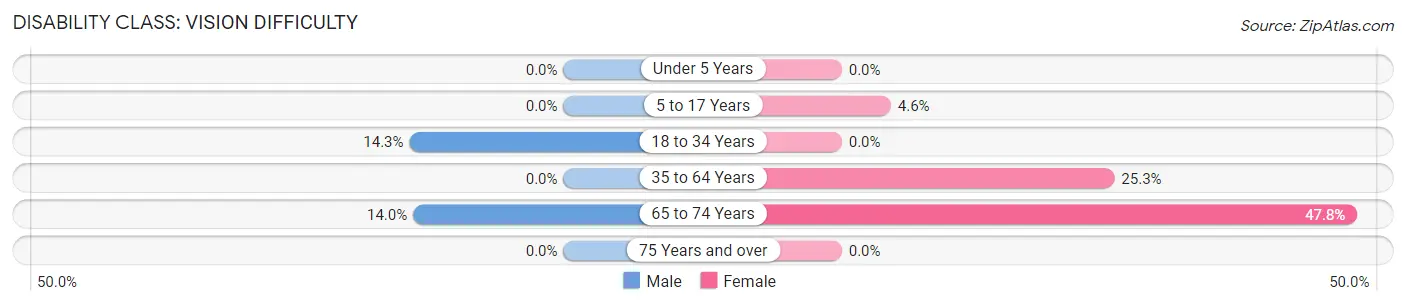
| Age Bracket | Male | Female |
| Under 5 Years | 0 (0.0%) | 0 (0.0%) |
| 5 to 17 Years | 0 (0.0%) | 2 (4.5%) |
| 18 to 34 Years | 7 (14.3%) | 0 (0.0%) |
| 35 to 64 Years | 0 (0.0%) | 42 (25.3%) |
| 65 to 74 Years | 6 (14.0%) | 22 (47.8%) |
| 75 Years and over | 0 (0.0%) | 0 (0.0%) |
Disability Class: Cognitive Difficulty
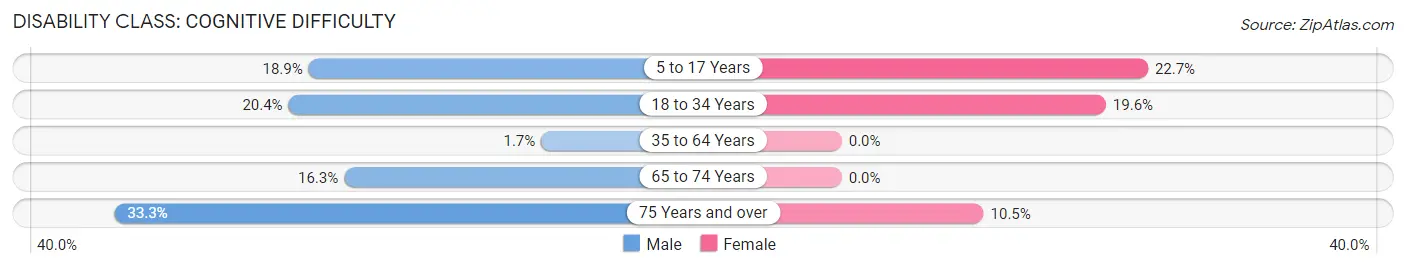
| Age Bracket | Male | Female |
| 5 to 17 Years | 14 (18.9%) | 10 (22.7%) |
| 18 to 34 Years | 10 (20.4%) | 10 (19.6%) |
| 35 to 64 Years | 3 (1.7%) | 0 (0.0%) |
| 65 to 74 Years | 7 (16.3%) | 0 (0.0%) |
| 75 Years and over | 2 (33.3%) | 2 (10.5%) |
Disability Class: Ambulatory Difficulty
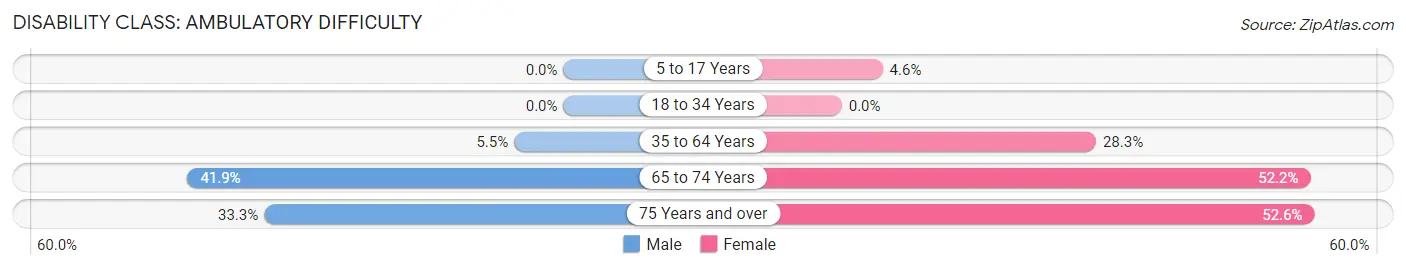
| Age Bracket | Male | Female |
| 5 to 17 Years | 0 (0.0%) | 2 (4.5%) |
| 18 to 34 Years | 0 (0.0%) | 0 (0.0%) |
| 35 to 64 Years | 10 (5.5%) | 47 (28.3%) |
| 65 to 74 Years | 18 (41.9%) | 24 (52.2%) |
| 75 Years and over | 2 (33.3%) | 10 (52.6%) |
Disability Class: Self-Care Difficulty
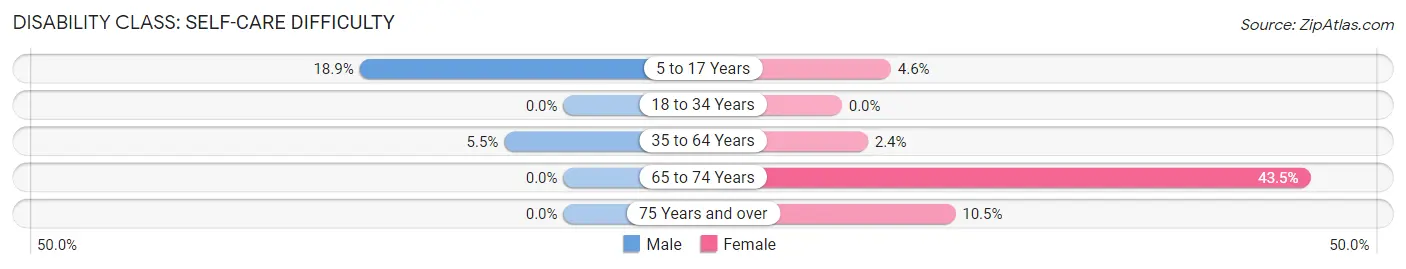
| Age Bracket | Male | Female |
| 5 to 17 Years | 14 (18.9%) | 2 (4.5%) |
| 18 to 34 Years | 0 (0.0%) | 0 (0.0%) |
| 35 to 64 Years | 10 (5.5%) | 4 (2.4%) |
| 65 to 74 Years | 0 (0.0%) | 20 (43.5%) |
| 75 Years and over | 0 (0.0%) | 2 (10.5%) |
Technology Access in Pavo
Computing Device Access in Pavo
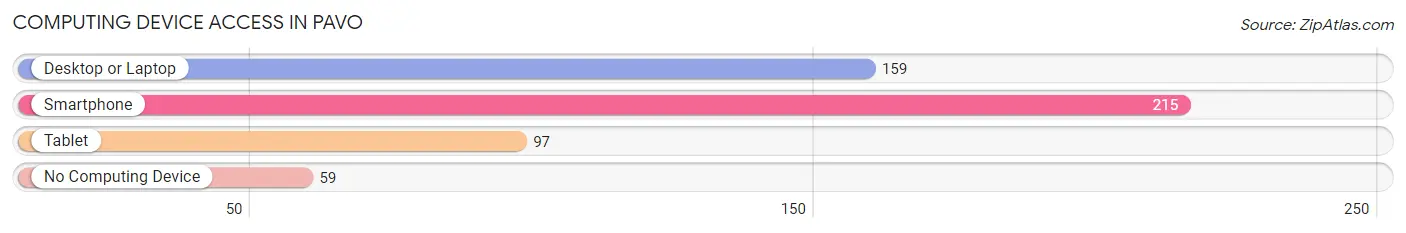
| Device Type | # Households | % Households |
| Desktop or Laptop | 159 | 53.9% |
| Smartphone | 215 | 72.9% |
| Tablet | 97 | 32.9% |
| No Computing Device | 59 | 20.0% |
| Total | 295 | 100.0% |
Internet Access in Pavo
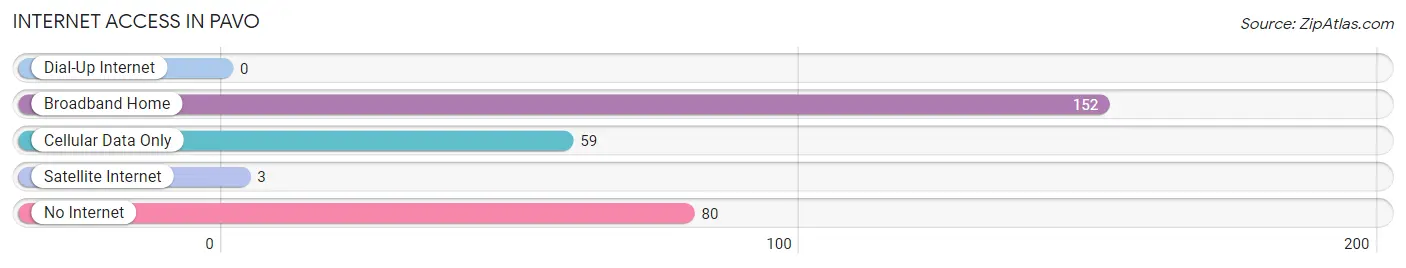
| Internet Type | # Households | % Households |
| Dial-Up Internet | 0 | 0.0% |
| Broadband Home | 152 | 51.5% |
| Cellular Data Only | 59 | 20.0% |
| Satellite Internet | 3 | 1.0% |
| No Internet | 80 | 27.1% |
| Total | 295 | 100.0% |
Pavo Summary
Pavo, Georgia is a small town located in the southwestern part of the state, in the county of Thomas. It is situated about 20 miles from the state capital of Atlanta and is part of the Valdosta Metropolitan Statistical Area. The town has a population of approximately 1,500 people and is known for its rural charm and friendly atmosphere.
History
Pavo was founded in 1883 by a group of settlers from the nearby town of Quitman. The town was named after the Spanish word for “peacock”, which was the symbol of the local post office. The town was originally a farming community, but in the early 1900s, the railroad came through and the town began to grow. The railroad brought new businesses and industries to the area, and the town began to thrive.
In the 1950s, the town experienced a period of growth and development, with the construction of a new school, a library, and a hospital. The town also saw the opening of several new businesses, including a grocery store, a hardware store, and a movie theater.
Geography
Pavo is located in the southwestern part of the state, in the county of Thomas. It is situated about 20 miles from the state capital of Atlanta and is part of the Valdosta Metropolitan Statistical Area. The town is located in a rural area, surrounded by rolling hills and farmland. The town is situated on the banks of the Ochlockonee River, which provides a scenic backdrop for the town.
Economy
Pavo’s economy is largely based on agriculture and forestry. The town is home to several farms, which produce a variety of crops, including corn, cotton, peanuts, and soybeans. The town also has several timber companies, which harvest and process timber for use in construction and other industries.
In addition to agriculture and forestry, Pavo also has a number of small businesses, including restaurants, retail stores, and service providers. The town also has a few manufacturing companies, which produce a variety of products, including furniture, clothing, and electronics.
Demographics
As of the 2010 census, Pavo had a population of 1,500 people. The racial makeup of the town was 79.2% White, 17.3% African American, 0.7% Native American, 0.7% Asian, 0.3% from other races, and 2.1% from two or more races. Hispanic or Latino of any race were 1.3% of the population.
The median income for a household in Pavo was $30,000, and the median income for a family was $35,000. The per capita income for the town was $14,000. About 17.3% of families and 20.7% of the population were below the poverty line, including 28.6% of those under age 18 and 11.1% of those age 65 or over.
Pavo is a small town with a rich history and a friendly atmosphere. The town is home to a variety of businesses and industries, and its economy is largely based on agriculture and forestry. The town has a diverse population, with a mix of races and ethnicities. Pavo is a great place to live and work, and it is a great place to visit.
Common Questions
What is Per Capita Income in Pavo?
Per Capita income in Pavo is $21,883.
What is the Median Family Income in Pavo?
Median Family Income in Pavo is $45,179.
What is the Median Household income in Pavo?
Median Household Income in Pavo is $37,250.
What is Income or Wage Gap in Pavo?
Income or Wage Gap in Pavo is 36.0%.
Women in Pavo earn 64.0 cents for every dollar earned by a man.
What is Inequality or Gini Index in Pavo?
Inequality or Gini Index in Pavo is 0.41.
What is the Total Population of Pavo?
Total Population of Pavo is 715.
What is the Total Male Population of Pavo?
Total Male Population of Pavo is 377.
What is the Total Female Population of Pavo?
Total Female Population of Pavo is 338.
What is the Ratio of Males per 100 Females in Pavo?
There are 111.54 Males per 100 Females in Pavo.
What is the Ratio of Females per 100 Males in Pavo?
There are 89.66 Females per 100 Males in Pavo.
What is the Median Population Age in Pavo?
Median Population Age in Pavo is 47.2 Years.
What is the Average Family Size in Pavo
Average Family Size in Pavo is 3.1 People.
What is the Average Household Size in Pavo
Average Household Size in Pavo is 2.4 People.
How Large is the Labor Force in Pavo?
There are 317 People in the Labor Forcein in Pavo.
What is the Percentage of People in the Labor Force in Pavo?
55.6% of People are in the Labor Force in Pavo.
What is the Unemployment Rate in Pavo?
Unemployment Rate in Pavo is 1.9%.