Metter, GA Map & Demographics
Metter Map
Metter Overview
$20,939
PER CAPITA INCOME
$48,000
AVG FAMILY INCOME
$31,786
AVG HOUSEHOLD INCOME
49.5%
WAGE / INCOME GAP [ % ]
50.5¢/ $1
WAGE / INCOME GAP [ $ ]
0.45
INEQUALITY / GINI INDEX
3,976
TOTAL POPULATION
1,817
MALE POPULATION
2,159
FEMALE POPULATION
84.16
MALES / 100 FEMALES
118.82
FEMALES / 100 MALES
46.2
MEDIAN AGE
3.2
AVG FAMILY SIZE
2.3
AVG HOUSEHOLD SIZE
1,571
LABOR FORCE [ PEOPLE ]
47.6%
PERCENT IN LABOR FORCE
5.9%
UNEMPLOYMENT RATE
Metter Zip Codes
Metter Area Codes
Income in Metter
Income Overview in Metter
Per Capita Income in Metter is $20,939, while median incomes of families and households are $48,000 and $31,786 respectively.
| Characteristic | Number | Measure |
| Per Capita Income | 3,976 | $20,939 |
| Median Family Income | 952 | $48,000 |
| Mean Family Income | 952 | $60,199 |
| Median Household Income | 1,628 | $31,786 |
| Mean Household Income | 1,628 | $48,142 |
| Income Deficit | 952 | $0 |
| Wage / Income Gap (%) | 3,976 | 49.50% |
| Wage / Income Gap ($) | 3,976 | 50.50¢ per $1 |
| Gini / Inequality Index | 3,976 | 0.45 |
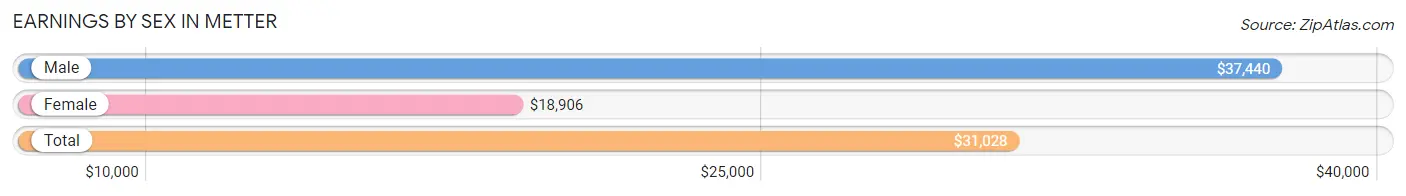
Earnings by Sex in Metter
Average Earnings in Metter are $31,028, $37,440 for men and $18,906 for women, a difference of 49.5%.
| Sex | Number | Average Earnings |
| Male | 871 (51.6%) | $37,440 |
| Female | 818 (48.4%) | $18,906 |
| Total | 1,689 (100.0%) | $31,028 |
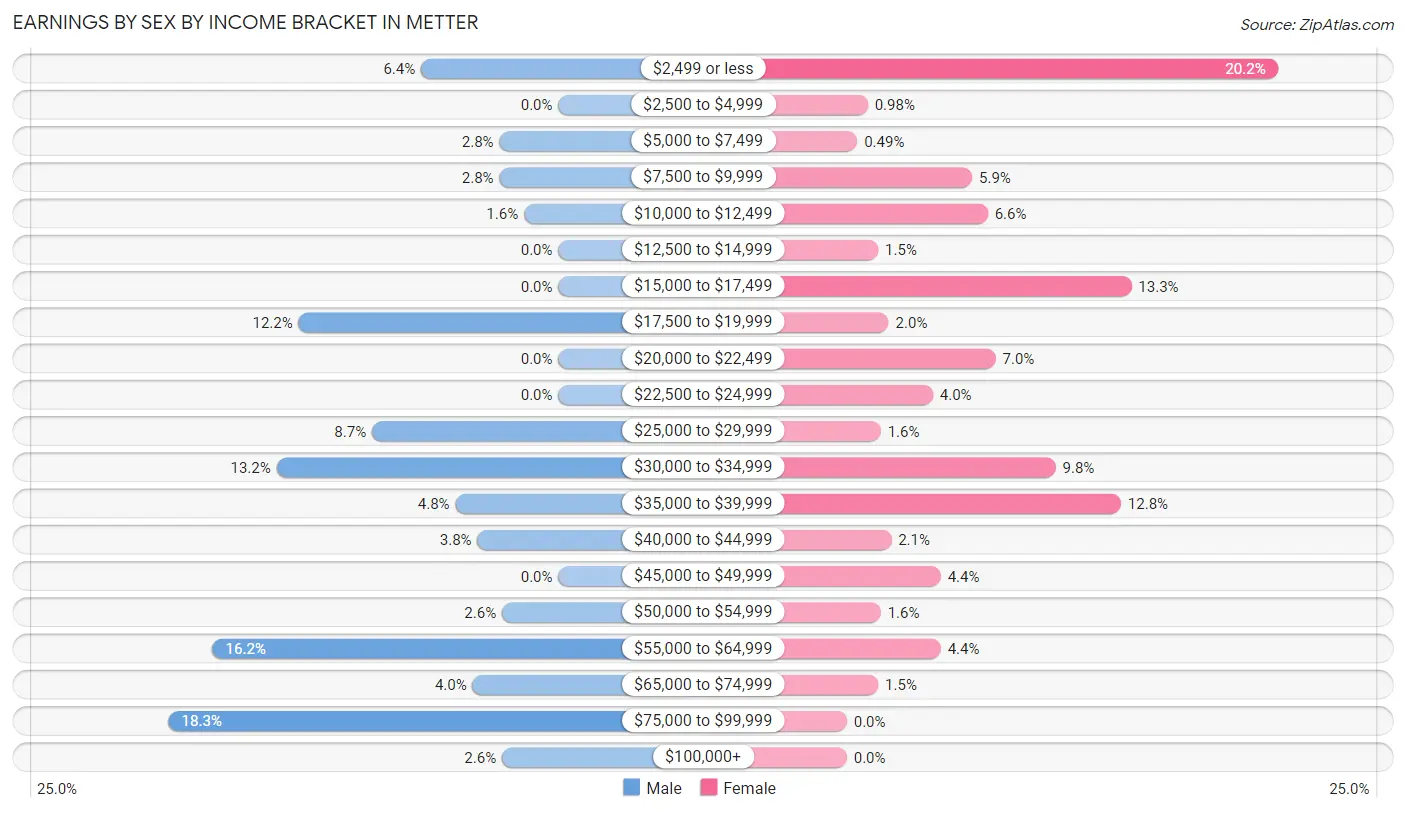
Earnings by Sex by Income Bracket in Metter
The most common earnings brackets in Metter are $75,000 to $99,999 for men (159 | 18.2%) and $2,499 or less for women (165 | 20.2%).
| Income | Male | Female |
| $2,499 or less | 56 (6.4%) | 165 (20.2%) |
| $2,500 to $4,999 | 0 (0.0%) | 8 (1.0%) |
| $5,000 to $7,499 | 24 (2.8%) | 4 (0.5%) |
| $7,500 to $9,999 | 24 (2.8%) | 48 (5.9%) |
| $10,000 to $12,499 | 14 (1.6%) | 54 (6.6%) |
| $12,500 to $14,999 | 0 (0.0%) | 12 (1.5%) |
| $15,000 to $17,499 | 0 (0.0%) | 109 (13.3%) |
| $17,500 to $19,999 | 106 (12.2%) | 16 (2.0%) |
| $20,000 to $22,499 | 0 (0.0%) | 57 (7.0%) |
| $22,500 to $24,999 | 0 (0.0%) | 33 (4.0%) |
| $25,000 to $29,999 | 76 (8.7%) | 13 (1.6%) |
| $30,000 to $34,999 | 115 (13.2%) | 80 (9.8%) |
| $35,000 to $39,999 | 42 (4.8%) | 105 (12.8%) |
| $40,000 to $44,999 | 33 (3.8%) | 17 (2.1%) |
| $45,000 to $49,999 | 0 (0.0%) | 36 (4.4%) |
| $50,000 to $54,999 | 23 (2.6%) | 13 (1.6%) |
| $55,000 to $64,999 | 141 (16.2%) | 36 (4.4%) |
| $65,000 to $74,999 | 35 (4.0%) | 12 (1.5%) |
| $75,000 to $99,999 | 159 (18.2%) | 0 (0.0%) |
| $100,000+ | 23 (2.6%) | 0 (0.0%) |
| Total | 871 (100.0%) | 818 (100.0%) |
Earnings by Sex by Educational Attainment in Metter
Average earnings in Metter are $40,500 for men and $21,689 for women, a difference of 46.5%. Men with an educational attainment of graduate degree enjoy the highest average annual earnings of $68,698, while those with high school diploma education earn the least with $34,850. Women with an educational attainment of bachelor's degree earn the most with the average annual earnings of $35,872, while those with high school diploma education have the smallest earnings of $15,951.
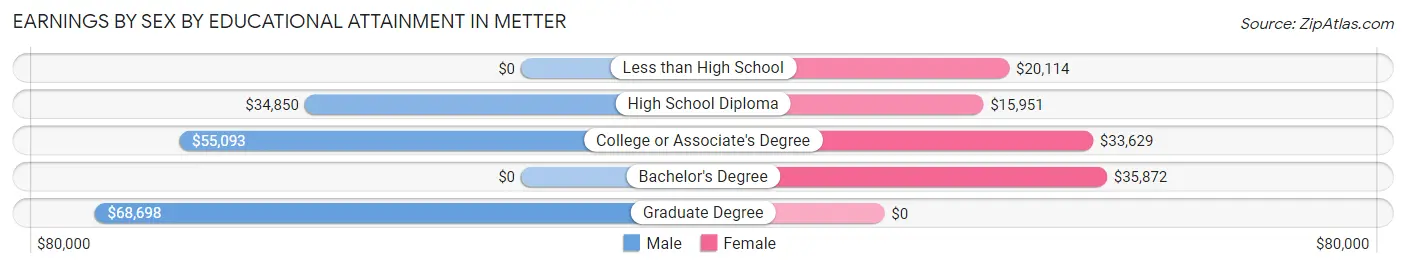
| Educational Attainment | Male Income | Female Income |
| Less than High School | - | - |
| High School Diploma | $34,850 | $15,951 |
| College or Associate's Degree | $55,093 | $33,629 |
| Bachelor's Degree | - | - |
| Graduate Degree | $68,698 | $0 |
| Total | $40,500 | $21,689 |
Family Income in Metter
Family Income Brackets in Metter
According to the Metter family income data, there are 223 families falling into the $50,000 to $74,999 income range, which is the most common income bracket and makes up 23.4% of all families. Conversely, the $200,000+ income bracket is the least frequent group with only 13 families (1.4%) belonging to this category.
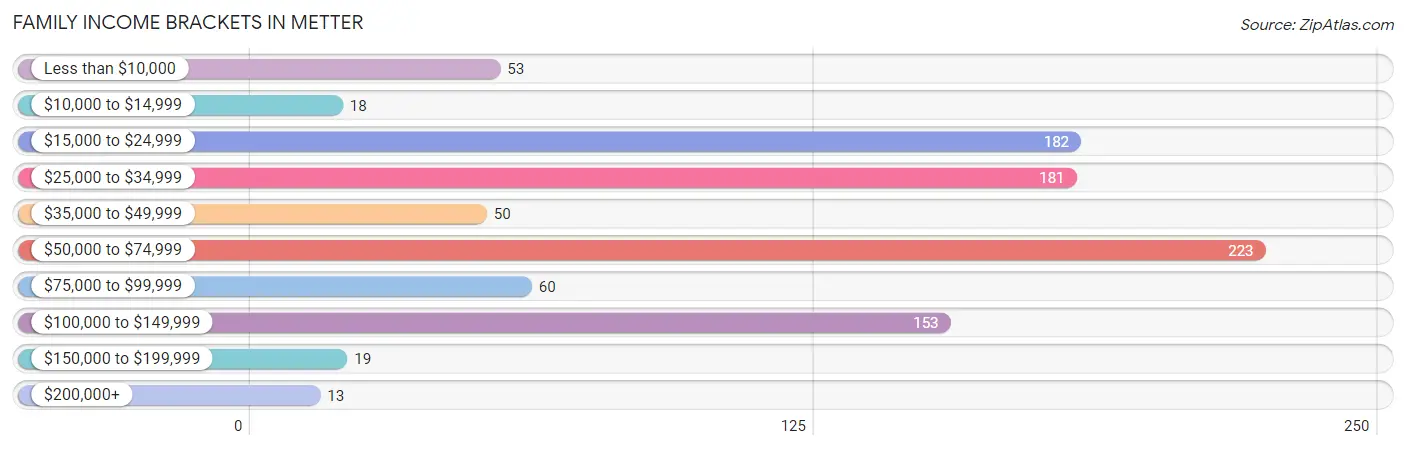
| Income Bracket | # Families | % Families |
| Less than $10,000 | 53 | 5.6% |
| $10,000 to $14,999 | 18 | 1.9% |
| $15,000 to $24,999 | 182 | 19.1% |
| $25,000 to $34,999 | 181 | 19.0% |
| $35,000 to $49,999 | 50 | 5.3% |
| $50,000 to $74,999 | 223 | 23.4% |
| $75,000 to $99,999 | 60 | 6.3% |
| $100,000 to $149,999 | 153 | 16.1% |
| $150,000 to $199,999 | 19 | 2.0% |
| $200,000+ | 13 | 1.4% |
Family Income by Famaliy Size in Metter
3-person families (318 | 33.4%) account for the highest median family income in Metter with $60,259 per family, while 3-person families (318 | 33.4%) have the highest median income of $20,086 per family member.
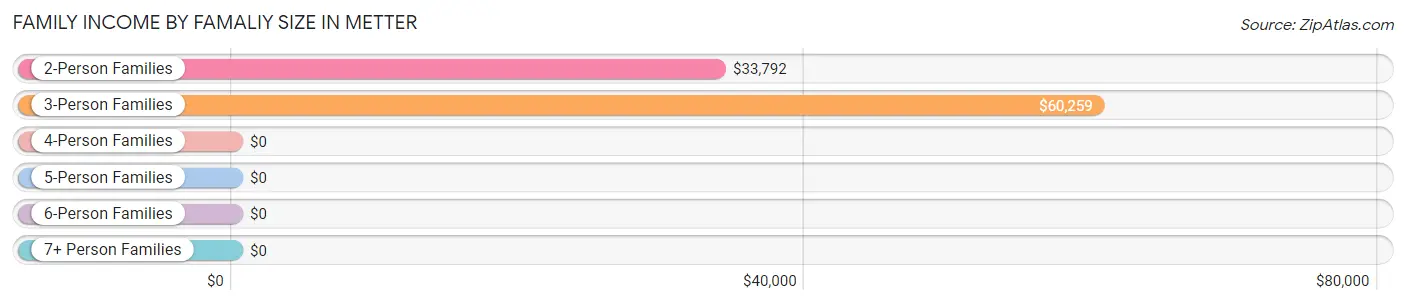
| Income Bracket | # Families | Median Income |
| 2-Person Families | 430 (45.2%) | $33,792 |
| 3-Person Families | 318 (33.4%) | $60,259 |
| 4-Person Families | 120 (12.6%) | $0 |
| 5-Person Families | 60 (6.3%) | $0 |
| 6-Person Families | 24 (2.5%) | $0 |
| 7+ Person Families | 0 (0.0%) | $0 |
| Total | 952 (100.0%) | $48,000 |
Family Income by Number of Earners in Metter
The median family income in Metter is $48,000, with families comprising 3+ earners (24) having the highest median family income of $100,357, while families with no earners (174) have the lowest median family income of $29,333, accounting for 2.5% and 18.3% of families, respectively.
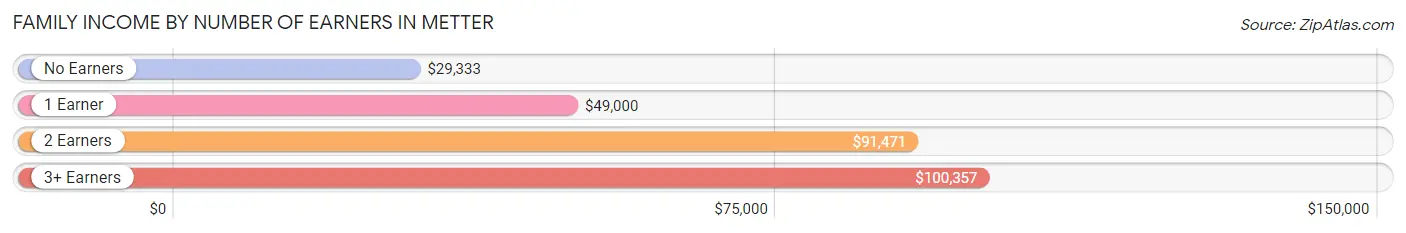
| Number of Earners | # Families | Median Income |
| No Earners | 174 (18.3%) | $29,333 |
| 1 Earner | 416 (43.7%) | $49,000 |
| 2 Earners | 338 (35.5%) | $91,471 |
| 3+ Earners | 24 (2.5%) | $100,357 |
| Total | 952 (100.0%) | $48,000 |
Household Income in Metter
Household Income Brackets in Metter
With 431 households falling in the category, the $15,000 to $24,999 income range is the most frequent in Metter, accounting for 26.5% of all households. In contrast, only 13 households (0.8%) fall into the $200,000+ income bracket, making it the least populous group.
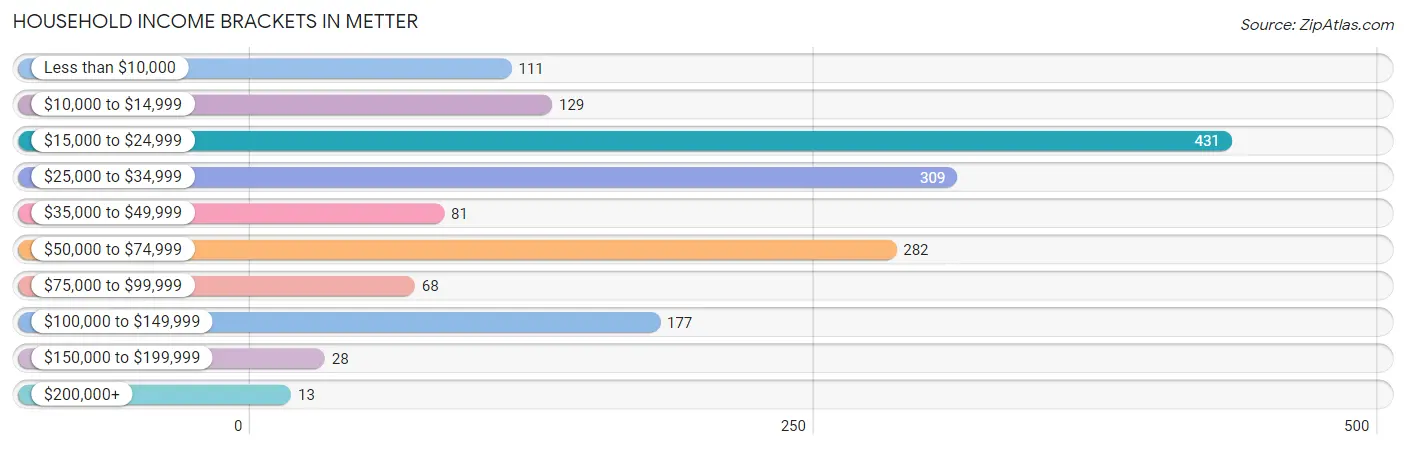
| Income Bracket | # Households | % Households |
| Less than $10,000 | 111 | 6.8% |
| $10,000 to $14,999 | 129 | 7.9% |
| $15,000 to $24,999 | 431 | 26.5% |
| $25,000 to $34,999 | 309 | 19.0% |
| $35,000 to $49,999 | 81 | 5.0% |
| $50,000 to $74,999 | 282 | 17.3% |
| $75,000 to $99,999 | 68 | 4.2% |
| $100,000 to $149,999 | 177 | 10.9% |
| $150,000 to $199,999 | 28 | 1.7% |
| $200,000+ | 13 | 0.8% |
Household Income by Householder Age in Metter
The median household income in Metter is $31,786, with the highest median household income of $40,000 found in the 25 to 44 years age bracket for the primary householder. A total of 436 households (26.8%) fall into this category. Meanwhile, the 15 to 24 years age bracket for the primary householder has the lowest median household income of $0, with 24 households (1.5%) in this group.
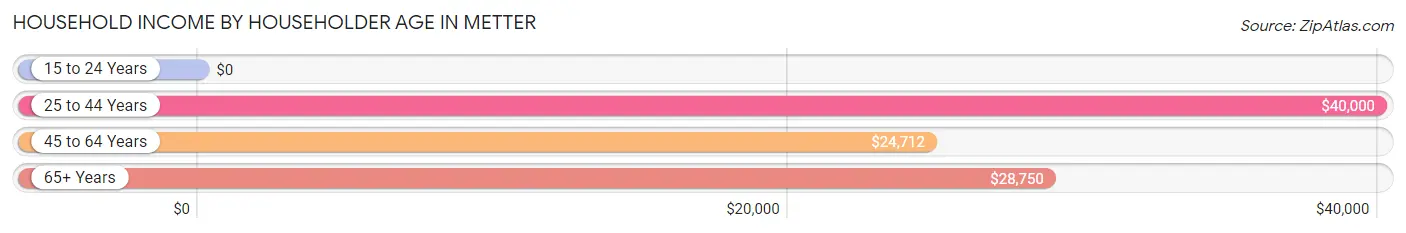
| Income Bracket | # Households | Median Income |
| 15 to 24 Years | 24 (1.5%) | $0 |
| 25 to 44 Years | 436 (26.8%) | $40,000 |
| 45 to 64 Years | 530 (32.6%) | $24,712 |
| 65+ Years | 638 (39.2%) | $28,750 |
| Total | 1,628 (100.0%) | $31,786 |
Poverty in Metter
Income Below Poverty by Sex and Age in Metter
With 15.3% poverty level for males and 24.8% for females among the residents of Metter, 16 and 17 year old males and 12 to 14 year old females are the most vulnerable to poverty, with 18 males (41.9%) and 16 females (100.0%) in their respective age groups living below the poverty level.
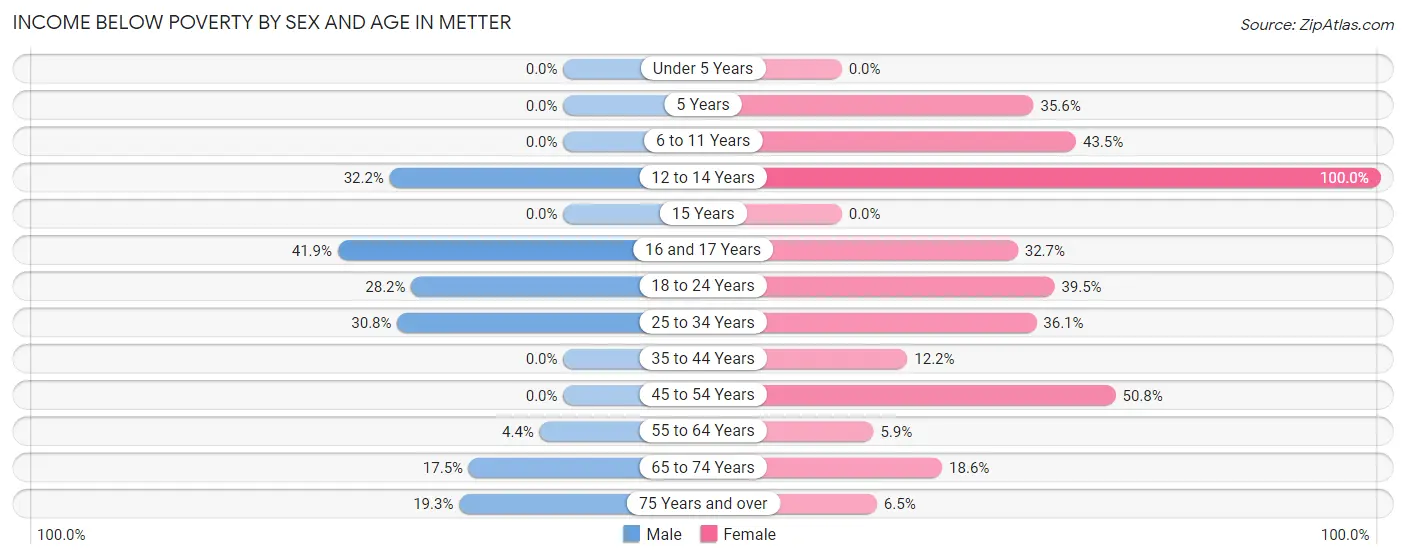
| Age Bracket | Male | Female |
| Under 5 Years | 0 (0.0%) | 0 (0.0%) |
| 5 Years | 0 (0.0%) | 21 (35.6%) |
| 6 to 11 Years | 0 (0.0%) | 50 (43.5%) |
| 12 to 14 Years | 88 (32.2%) | 16 (100.0%) |
| 15 Years | 0 (0.0%) | 0 (0.0%) |
| 16 and 17 Years | 18 (41.9%) | 33 (32.7%) |
| 18 to 24 Years | 33 (28.2%) | 45 (39.5%) |
| 25 to 34 Years | 53 (30.8%) | 65 (36.1%) |
| 35 to 44 Years | 0 (0.0%) | 32 (12.2%) |
| 45 to 54 Years | 0 (0.0%) | 156 (50.8%) |
| 55 to 64 Years | 10 (4.4%) | 13 (5.9%) |
| 65 to 74 Years | 34 (17.5%) | 60 (18.6%) |
| 75 Years and over | 29 (19.3%) | 12 (6.5%) |
| Total | 265 (15.3%) | 503 (24.8%) |
Income Above Poverty by Sex and Age in Metter
According to the poverty statistics in Metter, males aged 6 to 11 years and females aged under 5 years are the age groups that are most secure financially, with 100.0% of males and 100.0% of females in these age groups living above the poverty line.
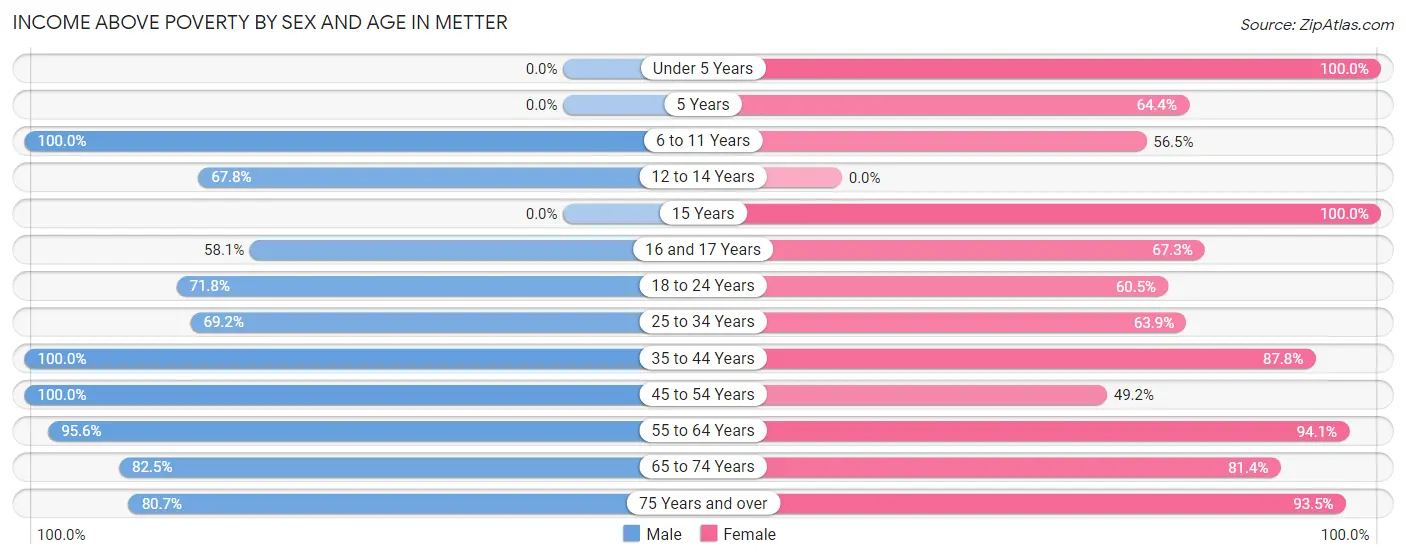
| Age Bracket | Male | Female |
| Under 5 Years | 0 (0.0%) | 97 (100.0%) |
| 5 Years | 0 (0.0%) | 38 (64.4%) |
| 6 to 11 Years | 66 (100.0%) | 65 (56.5%) |
| 12 to 14 Years | 185 (67.8%) | 0 (0.0%) |
| 15 Years | 0 (0.0%) | 50 (100.0%) |
| 16 and 17 Years | 25 (58.1%) | 68 (67.3%) |
| 18 to 24 Years | 84 (71.8%) | 69 (60.5%) |
| 25 to 34 Years | 119 (69.2%) | 115 (63.9%) |
| 35 to 44 Years | 242 (100.0%) | 231 (87.8%) |
| 45 to 54 Years | 251 (100.0%) | 151 (49.2%) |
| 55 to 64 Years | 218 (95.6%) | 208 (94.1%) |
| 65 to 74 Years | 160 (82.5%) | 262 (81.4%) |
| 75 Years and over | 121 (80.7%) | 172 (93.5%) |
| Total | 1,471 (84.7%) | 1,526 (75.2%) |
Income Below Poverty Among Married-Couple Families in Metter
The poverty statistics for married-couple families in Metter show that 8.7% or 57 of the total 658 families live below the poverty line. Families with no children have the highest poverty rate of 12.6%, comprising of 51 families. On the other hand, families with 3 or 4 children have the lowest poverty rate of 0.0%, which includes 0 families.
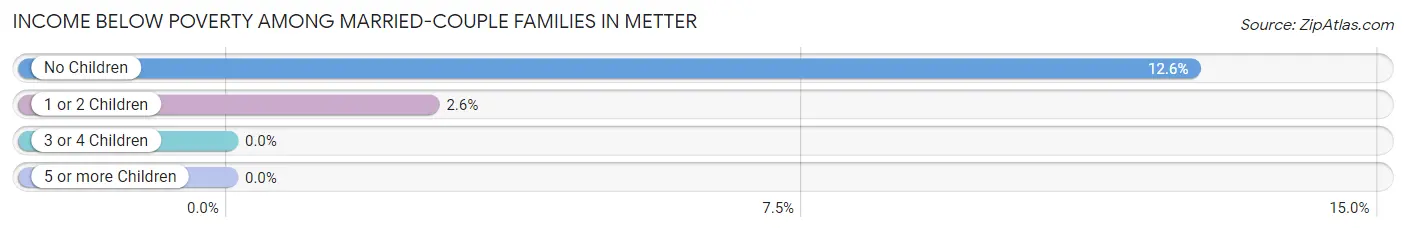
| Children | Above Poverty | Below Poverty |
| No Children | 355 (87.4%) | 51 (12.6%) |
| 1 or 2 Children | 222 (97.4%) | 6 (2.6%) |
| 3 or 4 Children | 24 (100.0%) | 0 (0.0%) |
| 5 or more Children | 0 (0.0%) | 0 (0.0%) |
| Total | 601 (91.3%) | 57 (8.7%) |
Income Below Poverty Among Single-Parent Households in Metter
According to the poverty data in Metter, 41.8% or 23 single-father households and 42.3% or 101 single-mother households are living below the poverty line. Among single-father households, those with no children have the highest poverty rate, with 23 households (48.9%) experiencing poverty. Likewise, among single-mother households, those with 3 or 4 children have the highest poverty rate, with 32 households (100.0%) falling below the poverty line.
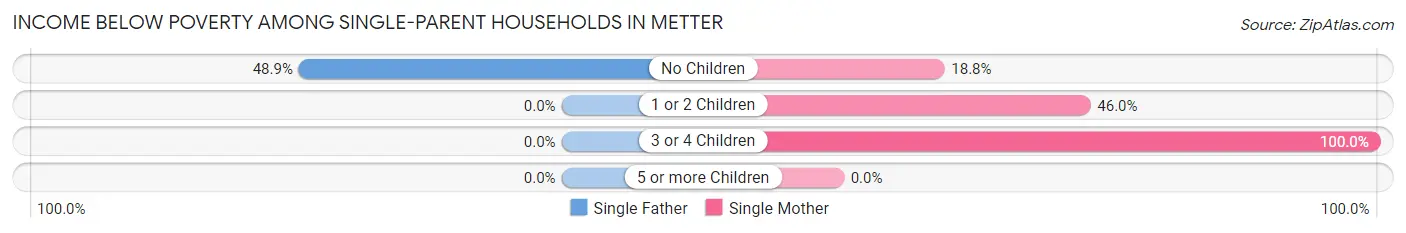
| Children | Single Father | Single Mother |
| No Children | 23 (48.9%) | 18 (18.8%) |
| 1 or 2 Children | 0 (0.0%) | 51 (46.0%) |
| 3 or 4 Children | 0 (0.0%) | 32 (100.0%) |
| 5 or more Children | 0 (0.0%) | 0 (0.0%) |
| Total | 23 (41.8%) | 101 (42.3%) |
Income Below Poverty Among Married-Couple vs Single-Parent Households in Metter
The poverty data for Metter shows that 57 of the married-couple family households (8.7%) and 124 of the single-parent households (42.2%) are living below the poverty level. Within the married-couple family households, those with no children have the highest poverty rate, with 51 households (12.6%) falling below the poverty line. Among the single-parent households, those with 3 or 4 children have the highest poverty rate, with 32 household (100.0%) living below poverty.
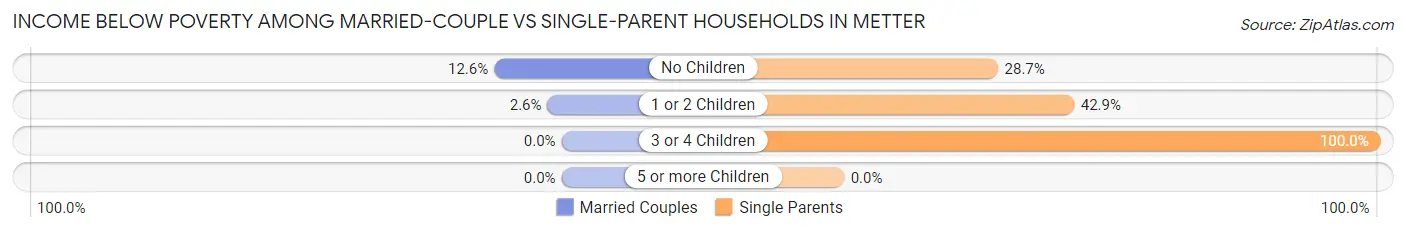
| Children | Married-Couple Families | Single-Parent Households |
| No Children | 51 (12.6%) | 41 (28.7%) |
| 1 or 2 Children | 6 (2.6%) | 51 (42.9%) |
| 3 or 4 Children | 0 (0.0%) | 32 (100.0%) |
| 5 or more Children | 0 (0.0%) | 0 (0.0%) |
| Total | 57 (8.7%) | 124 (42.2%) |
Race in Metter
The most populous races in Metter are White / Caucasian (2,114 | 53.2%), Black / African American (1,243 | 31.3%), and Hispanic or Latino (554 | 13.9%).
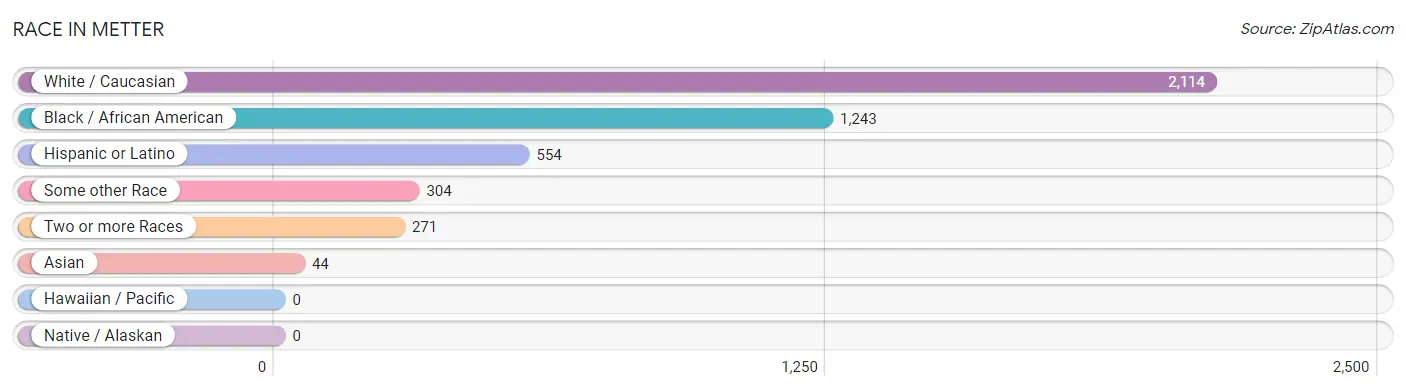
| Race | # Population | % Population |
| Asian | 44 | 1.1% |
| Black / African American | 1,243 | 31.3% |
| Hawaiian / Pacific | 0 | 0.0% |
| Hispanic or Latino | 554 | 13.9% |
| Native / Alaskan | 0 | 0.0% |
| White / Caucasian | 2,114 | 53.2% |
| Two or more Races | 271 | 6.8% |
| Some other Race | 304 | 7.6% |
| Total | 3,976 | 100.0% |
Ancestry in Metter
The most populous ancestries reported in Metter are American (682 | 17.2%), Irish (221 | 5.6%), Central American (218 | 5.5%), European (199 | 5.0%), and Salvadoran (173 | 4.3%), together accounting for 37.6% of all Metter residents.
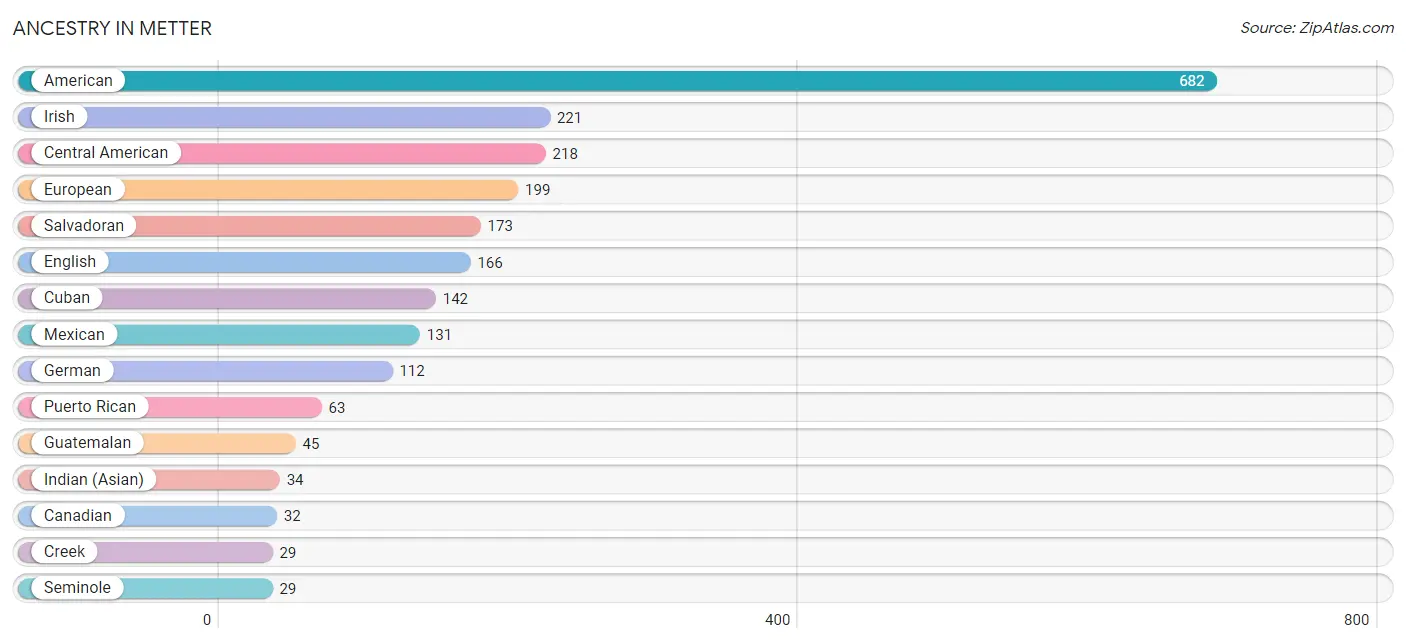
| Ancestry | # Population | % Population |
| American | 682 | 17.2% |
| British | 20 | 0.5% |
| Canadian | 32 | 0.8% |
| Central American | 218 | 5.5% |
| Creek | 29 | 0.7% |
| Cuban | 142 | 3.6% |
| English | 166 | 4.2% |
| European | 199 | 5.0% |
| German | 112 | 2.8% |
| Greek | 22 | 0.5% |
| Guatemalan | 45 | 1.1% |
| Indian (Asian) | 34 | 0.9% |
| Irish | 221 | 5.6% |
| Korean | 23 | 0.6% |
| Lithuanian | 22 | 0.5% |
| Mexican | 131 | 3.3% |
| Portuguese | 6 | 0.2% |
| Puerto Rican | 63 | 1.6% |
| Salvadoran | 173 | 4.3% |
| Scotch-Irish | 24 | 0.6% |
| Scottish | 10 | 0.3% |
| Seminole | 29 | 0.7% |
| Subsaharan African | 2 | 0.1% |
| Swiss | 8 | 0.2% |
| Welsh | 8 | 0.2% | View All 25 Rows |
Immigrants in Metter
The most numerous immigrant groups reported in Metter came from Latin America (375 | 9.4%), Central America (233 | 5.9%), Caribbean (142 | 3.6%), Cuba (142 | 3.6%), and Mexico (131 | 3.3%), together accounting for 25.7% of all Metter residents.
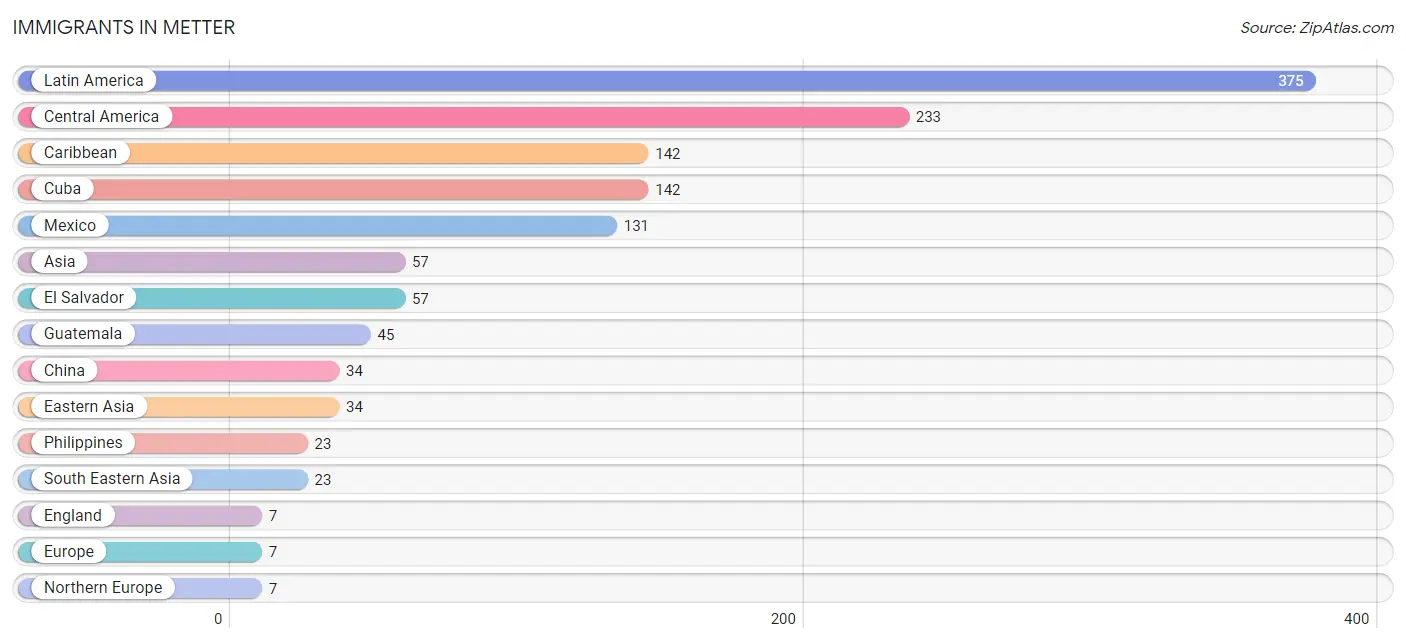
| Immigration Origin | # Population | % Population |
| Asia | 57 | 1.4% |
| Caribbean | 142 | 3.6% |
| Central America | 233 | 5.9% |
| China | 34 | 0.9% |
| Cuba | 142 | 3.6% |
| Eastern Asia | 34 | 0.9% |
| El Salvador | 57 | 1.4% |
| England | 7 | 0.2% |
| Europe | 7 | 0.2% |
| Guatemala | 45 | 1.1% |
| Latin America | 375 | 9.4% |
| Mexico | 131 | 3.3% |
| Northern Europe | 7 | 0.2% |
| Philippines | 23 | 0.6% |
| South Eastern Asia | 23 | 0.6% | View All 15 Rows |
Sex and Age in Metter
Sex and Age in Metter
The most populous age groups in Metter are 10 to 14 Years (329 | 18.1%) for men and 70 to 74 Years (224 | 10.4%) for women.
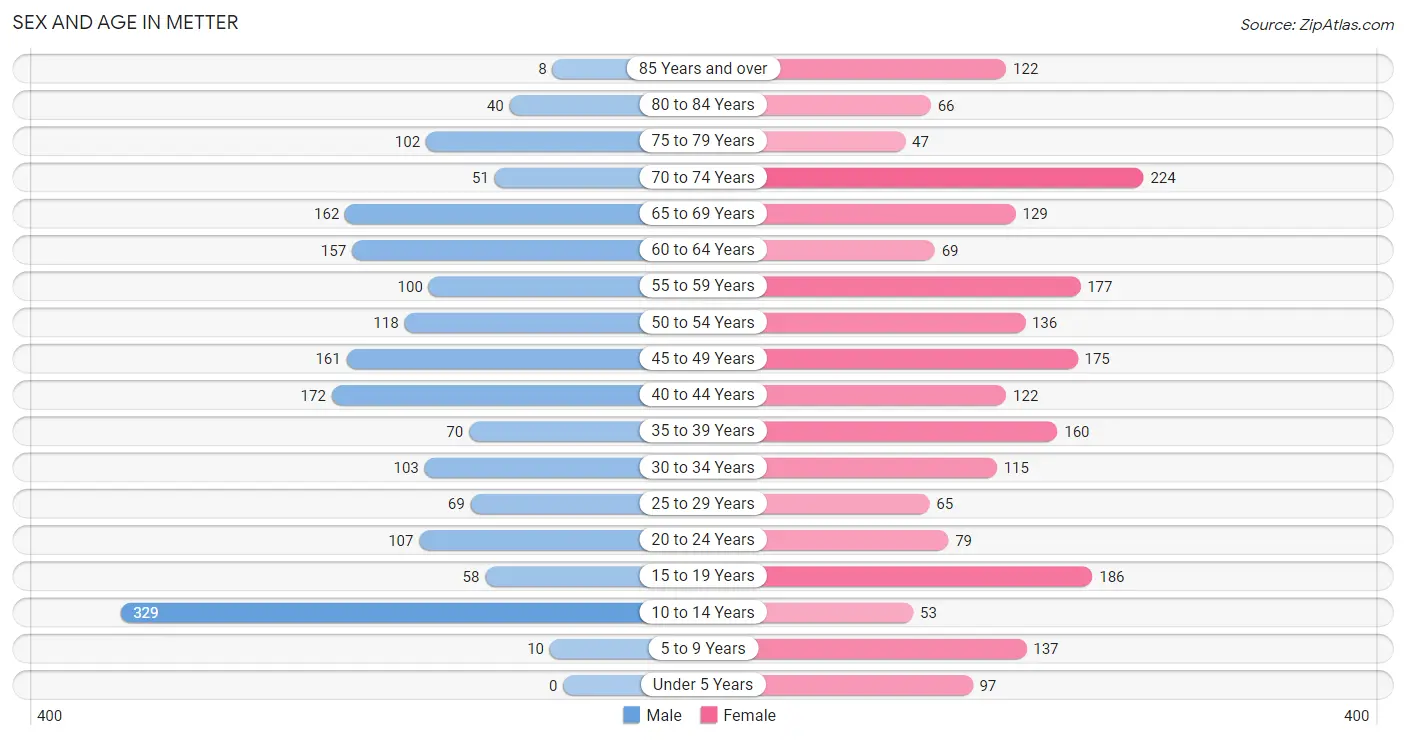
| Age Bracket | Male | Female |
| Under 5 Years | 0 (0.0%) | 97 (4.5%) |
| 5 to 9 Years | 10 (0.5%) | 137 (6.4%) |
| 10 to 14 Years | 329 (18.1%) | 53 (2.5%) |
| 15 to 19 Years | 58 (3.2%) | 186 (8.6%) |
| 20 to 24 Years | 107 (5.9%) | 79 (3.7%) |
| 25 to 29 Years | 69 (3.8%) | 65 (3.0%) |
| 30 to 34 Years | 103 (5.7%) | 115 (5.3%) |
| 35 to 39 Years | 70 (3.8%) | 160 (7.4%) |
| 40 to 44 Years | 172 (9.5%) | 122 (5.7%) |
| 45 to 49 Years | 161 (8.9%) | 175 (8.1%) |
| 50 to 54 Years | 118 (6.5%) | 136 (6.3%) |
| 55 to 59 Years | 100 (5.5%) | 177 (8.2%) |
| 60 to 64 Years | 157 (8.6%) | 69 (3.2%) |
| 65 to 69 Years | 162 (8.9%) | 129 (6.0%) |
| 70 to 74 Years | 51 (2.8%) | 224 (10.4%) |
| 75 to 79 Years | 102 (5.6%) | 47 (2.2%) |
| 80 to 84 Years | 40 (2.2%) | 66 (3.1%) |
| 85 Years and over | 8 (0.4%) | 122 (5.7%) |
| Total | 1,817 (100.0%) | 2,159 (100.0%) |
Families and Households in Metter
Median Family Size in Metter
The median family size in Metter is 3.18 persons per family, with single female/mother families (239 | 25.1%) accounting for the largest median family size of 3.6 persons per family. On the other hand, single male/father families (55 | 5.8%) represent the smallest median family size with 2.80 persons per family.
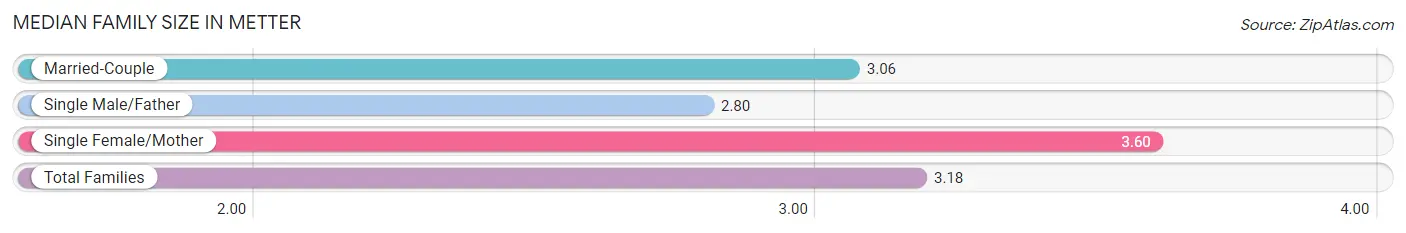
| Family Type | # Families | Family Size |
| Married-Couple | 658 (69.1%) | 3.06 |
| Single Male/Father | 55 (5.8%) | 2.80 |
| Single Female/Mother | 239 (25.1%) | 3.60 |
| Total Families | 952 (100.0%) | 3.18 |
Median Household Size in Metter
The median household size in Metter is 2.31 persons per household, with single male/father households (55 | 3.4%) accounting for the largest median household size of 3.62 persons per household. non-family households (676 | 41.5%) represent the smallest median household size with 1.02 persons per household.
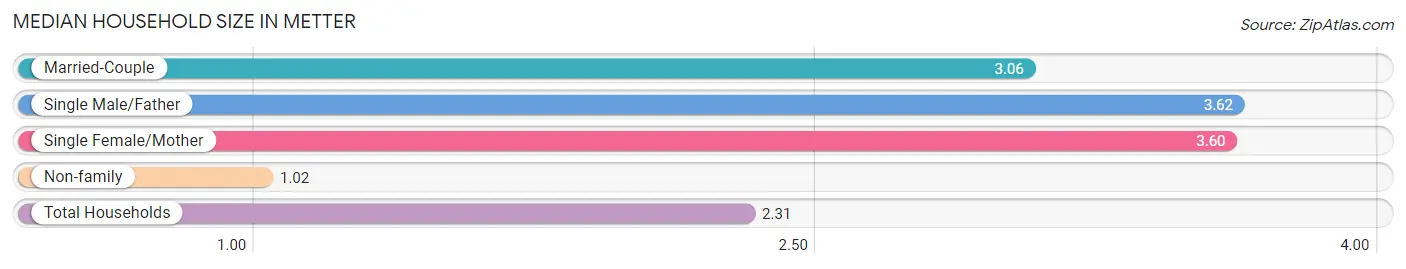
| Household Type | # Households | Household Size |
| Married-Couple | 658 (40.4%) | 3.06 |
| Single Male/Father | 55 (3.4%) | 3.62 |
| Single Female/Mother | 239 (14.7%) | 3.60 |
| Non-family | 676 (41.5%) | 1.02 |
| Total Households | 1,628 (100.0%) | 2.31 |
Household Size by Marriage Status in Metter
Out of a total of 1,628 households in Metter, 952 (58.5%) are family households, while 676 (41.5%) are nonfamily households. The most numerous type of family households are 2-person households, comprising 406, and the most common type of nonfamily households are 1-person households, comprising 657.
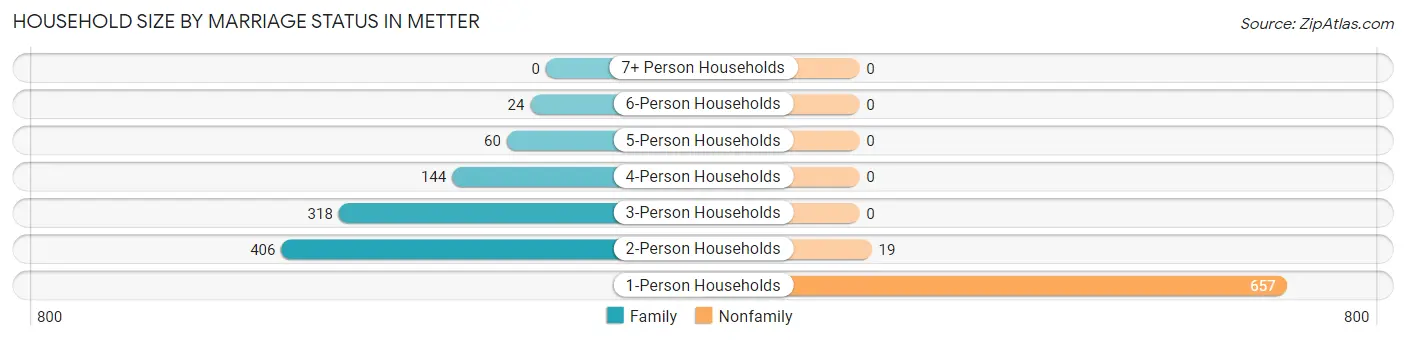
| Household Size | Family Households | Nonfamily Households |
| 1-Person Households | - | 657 (40.4%) |
| 2-Person Households | 406 (24.9%) | 19 (1.2%) |
| 3-Person Households | 318 (19.5%) | 0 (0.0%) |
| 4-Person Households | 144 (8.8%) | 0 (0.0%) |
| 5-Person Households | 60 (3.7%) | 0 (0.0%) |
| 6-Person Households | 24 (1.5%) | 0 (0.0%) |
| 7+ Person Households | 0 (0.0%) | 0 (0.0%) |
| Total | 952 (58.5%) | 676 (41.5%) |
Female Fertility in Metter
Fertility by Age in Metter
| Age Bracket | Women with Births | Births / 1,000 Women |
| 15 to 19 years | 0 (0.0%) | 0.0 |
| 20 to 34 years | 0 (0.0%) | 0.0 |
| 35 to 50 years | 0 (0.0%) | 0.0 |
| Total | 0 (0.0%) | 0.0 |
Fertility by Age by Marriage Status in Metter
| Age Bracket | Married | Unmarried |
| 15 to 19 years | 0 (0.0%) | 0 (0.0%) |
| 20 to 34 years | 0 (0.0%) | 0 (0.0%) |
| 35 to 50 years | 0 (0.0%) | 0 (0.0%) |
| Total | 0 (0.0%) | 0 (0.0%) |
Fertility by Education in Metter
| Educational Attainment | Women with Births | Births / 1,000 Women |
| Less than High School | 0 (0.0%) | 0.0 |
| High School Diploma | 0 (0.0%) | 0.0 |
| College or Associate's Degree | 0 (0.0%) | 0.0 |
| Bachelor's Degree | 0 (0.0%) | 0.0 |
| Graduate Degree | 0 (0.0%) | 0.0 |
| Total | 0 (0.0%) | 0.0 |
Fertility by Education by Marriage Status in Metter
| Educational Attainment | Married | Unmarried |
| Less than High School | 0 (0.0%) | 0 (0.0%) |
| High School Diploma | 0 (0.0%) | 0 (0.0%) |
| College or Associate's Degree | 0 (0.0%) | 0 (0.0%) |
| Bachelor's Degree | 0 (0.0%) | 0 (0.0%) |
| Graduate Degree | 0 (0.0%) | 0 (0.0%) |
| Total | 0 (0.0%) | 0 (0.0%) |
Employment Characteristics in Metter
Employment by Class of Employer in Metter
Among the 1,479 employed individuals in Metter, private company employees (1,025 | 69.3%), self-employed (not incorporated) (142 | 9.6%), and state government employees (124 | 8.4%) make up the most common classes of employment.
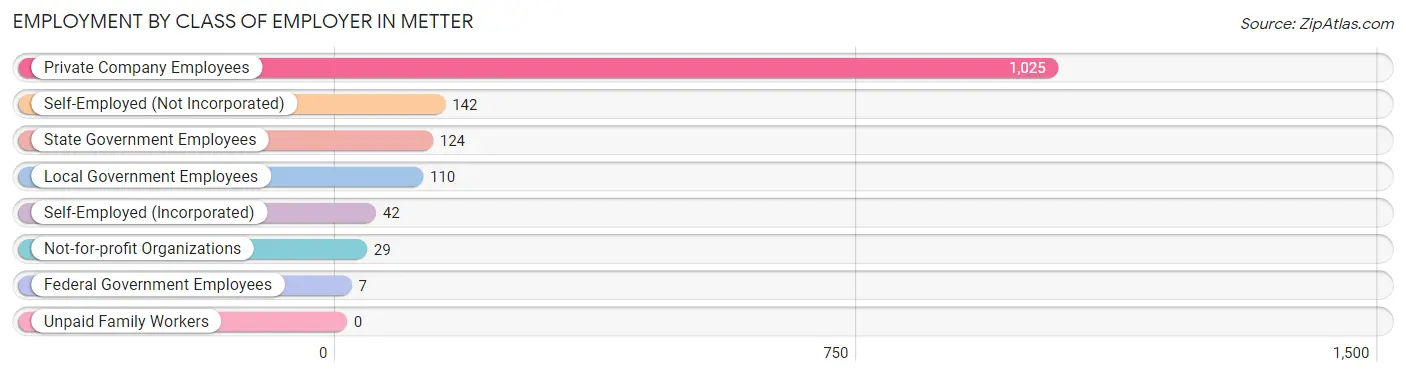
| Employer Class | # Employees | % Employees |
| Private Company Employees | 1,025 | 69.3% |
| Self-Employed (Incorporated) | 42 | 2.8% |
| Self-Employed (Not Incorporated) | 142 | 9.6% |
| Not-for-profit Organizations | 29 | 2.0% |
| Local Government Employees | 110 | 7.4% |
| State Government Employees | 124 | 8.4% |
| Federal Government Employees | 7 | 0.5% |
| Unpaid Family Workers | 0 | 0.0% |
| Total | 1,479 | 100.0% |
Employment Status by Age in Metter
According to the labor force statistics for Metter, out of the total population over 16 years of age (3,300), 47.6% or 1,571 individuals are in the labor force, with 5.9% or 93 of them unemployed. The age group with the highest labor force participation rate is 20 to 24 years, with 84.4% or 157 individuals in the labor force. Within the labor force, the 20 to 24 years age range has the highest percentage of unemployed individuals, with 39.5% or 62 of them being unemployed.
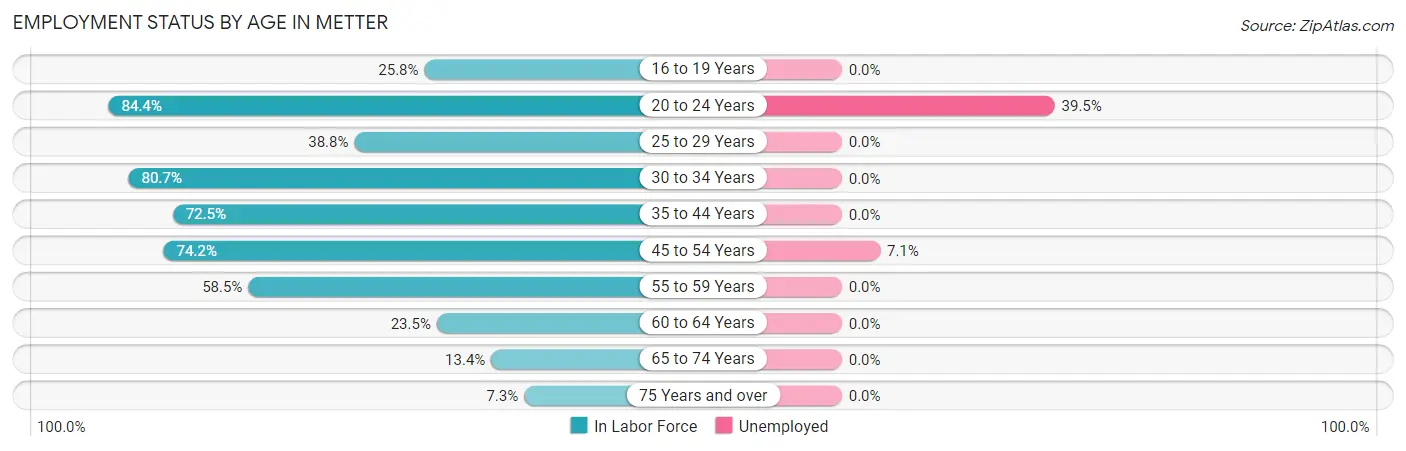
| Age Bracket | In Labor Force | Unemployed |
| 16 to 19 Years | 50 (25.8%) | 0 (0.0%) |
| 20 to 24 Years | 157 (84.4%) | 62 (39.5%) |
| 25 to 29 Years | 52 (38.8%) | 0 (0.0%) |
| 30 to 34 Years | 176 (80.7%) | 0 (0.0%) |
| 35 to 44 Years | 380 (72.5%) | 0 (0.0%) |
| 45 to 54 Years | 438 (74.2%) | 31 (7.1%) |
| 55 to 59 Years | 162 (58.5%) | 0 (0.0%) |
| 60 to 64 Years | 53 (23.5%) | 0 (0.0%) |
| 65 to 74 Years | 76 (13.4%) | 0 (0.0%) |
| 75 Years and over | 28 (7.3%) | 0 (0.0%) |
| Total | 1,571 (47.6%) | 93 (5.9%) |
Employment Status by Educational Attainment in Metter
According to labor force statistics for Metter, 64.0% of individuals (1,260) out of the total population between 25 and 64 years of age (1,969) are in the labor force, with 2.5% or 32 of them being unemployed. The group with the highest labor force participation rate are those with the educational attainment of bachelor's degree or higher, with 100.0% or 187 individuals in the labor force. Within the labor force, individuals with college / associate degree education have the highest percentage of unemployment, with 8.0% or 31 of them being unemployed.
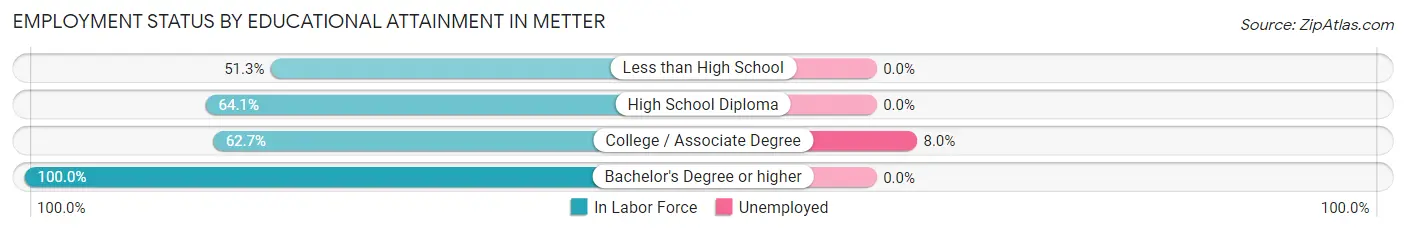
| Educational Attainment | In Labor Force | Unemployed |
| Less than High School | 237 (51.3%) | 0 (0.0%) |
| High School Diploma | 451 (64.1%) | 0 (0.0%) |
| College / Associate Degree | 386 (62.7%) | 49 (8.0%) |
| Bachelor's Degree or higher | 187 (100.0%) | 0 (0.0%) |
| Total | 1,260 (64.0%) | 49 (2.5%) |
Employment Occupations by Sex in Metter
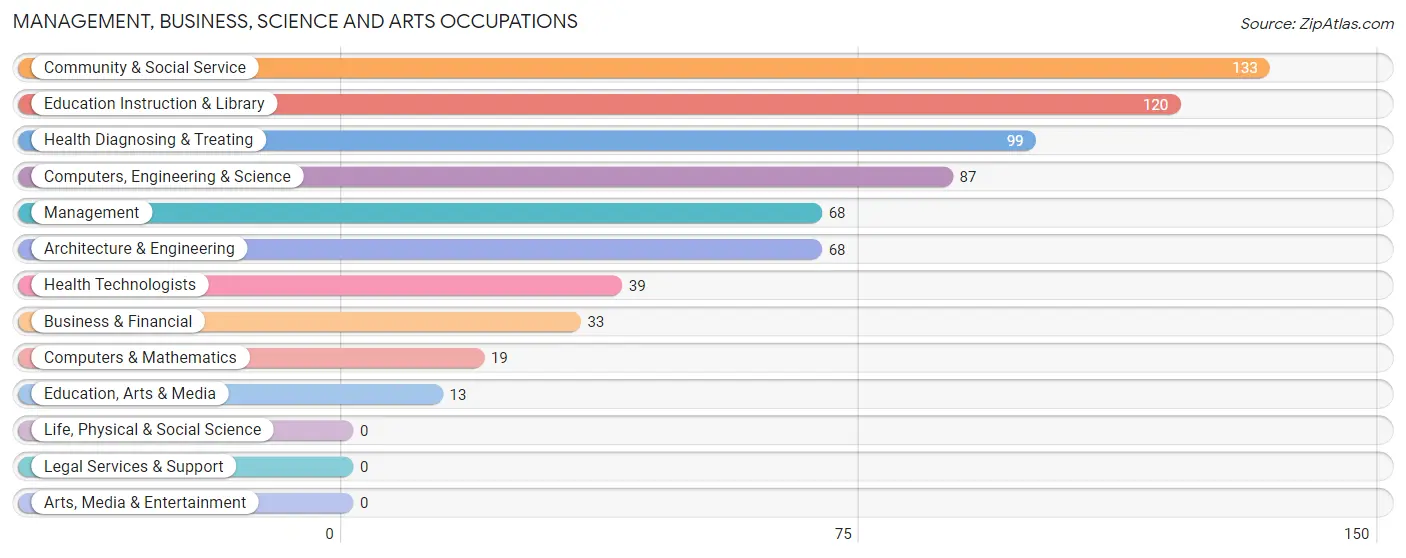
Management, Business, Science and Arts Occupations
The most common Management, Business, Science and Arts occupations in Metter are Community & Social Service (133 | 9.0%), Education Instruction & Library (120 | 8.1%), Health Diagnosing & Treating (99 | 6.7%), Computers, Engineering & Science (87 | 5.9%), and Management (68 | 4.6%).
Management, Business, Science and Arts Occupations by Sex
Within the Management, Business, Science and Arts occupations in Metter, the most male-oriented occupations are Architecture & Engineering (100.0%), Education, Arts & Media (100.0%), and Computers, Engineering & Science (82.8%), while the most female-oriented occupations are Education Instruction & Library (80.0%), Computers & Mathematics (78.9%), and Community & Social Service (72.2%).
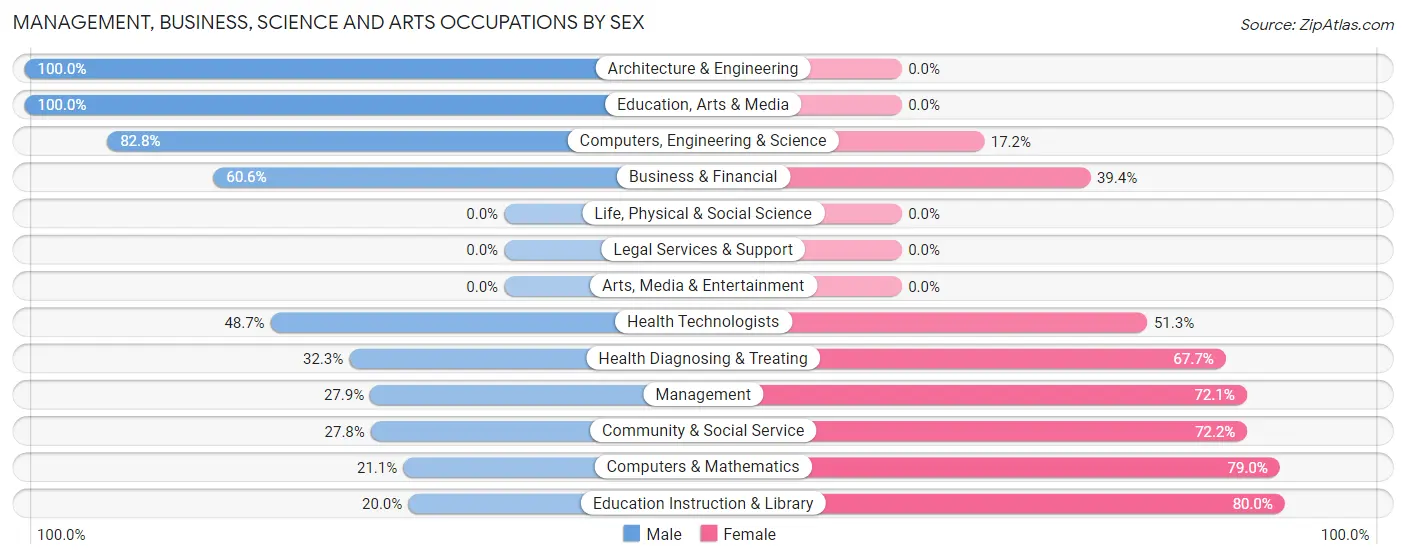
| Occupation | Male | Female |
| Management | 19 (27.9%) | 49 (72.1%) |
| Business & Financial | 20 (60.6%) | 13 (39.4%) |
| Computers, Engineering & Science | 72 (82.8%) | 15 (17.2%) |
| Computers & Mathematics | 4 (21.0%) | 15 (78.9%) |
| Architecture & Engineering | 68 (100.0%) | 0 (0.0%) |
| Life, Physical & Social Science | 0 (0.0%) | 0 (0.0%) |
| Community & Social Service | 37 (27.8%) | 96 (72.2%) |
| Education, Arts & Media | 13 (100.0%) | 0 (0.0%) |
| Legal Services & Support | 0 (0.0%) | 0 (0.0%) |
| Education Instruction & Library | 24 (20.0%) | 96 (80.0%) |
| Arts, Media & Entertainment | 0 (0.0%) | 0 (0.0%) |
| Health Diagnosing & Treating | 32 (32.3%) | 67 (67.7%) |
| Health Technologists | 19 (48.7%) | 20 (51.3%) |
| Total (Category) | 180 (42.9%) | 240 (57.1%) |
| Total (Overall) | 790 (53.4%) | 689 (46.6%) |
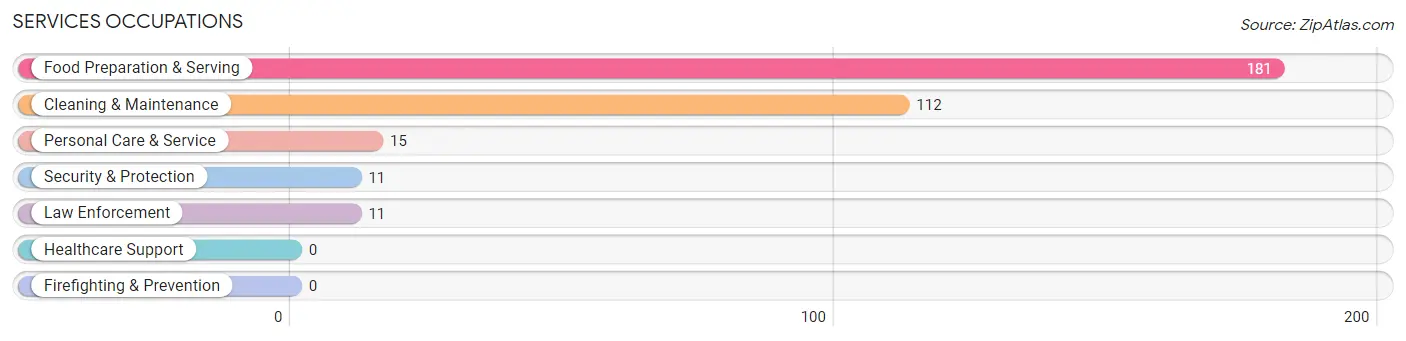
Services Occupations
The most common Services occupations in Metter are Food Preparation & Serving (181 | 12.2%), Cleaning & Maintenance (112 | 7.6%), Personal Care & Service (15 | 1.0%), Security & Protection (11 | 0.7%), and Law Enforcement (11 | 0.7%).
Services Occupations by Sex
Within the Services occupations in Metter, the most male-oriented occupations are Security & Protection (100.0%), Law Enforcement (100.0%), and Food Preparation & Serving (32.0%), while the most female-oriented occupations are Personal Care & Service (100.0%), Cleaning & Maintenance (69.6%), and Food Preparation & Serving (68.0%).
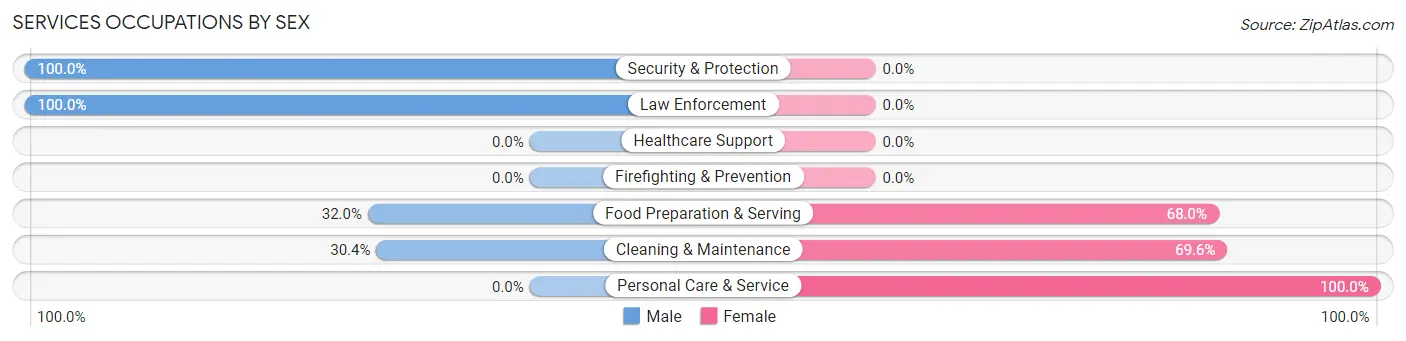
| Occupation | Male | Female |
| Healthcare Support | 0 (0.0%) | 0 (0.0%) |
| Security & Protection | 11 (100.0%) | 0 (0.0%) |
| Firefighting & Prevention | 0 (0.0%) | 0 (0.0%) |
| Law Enforcement | 11 (100.0%) | 0 (0.0%) |
| Food Preparation & Serving | 58 (32.0%) | 123 (68.0%) |
| Cleaning & Maintenance | 34 (30.4%) | 78 (69.6%) |
| Personal Care & Service | 0 (0.0%) | 15 (100.0%) |
| Total (Category) | 103 (32.3%) | 216 (67.7%) |
| Total (Overall) | 790 (53.4%) | 689 (46.6%) |
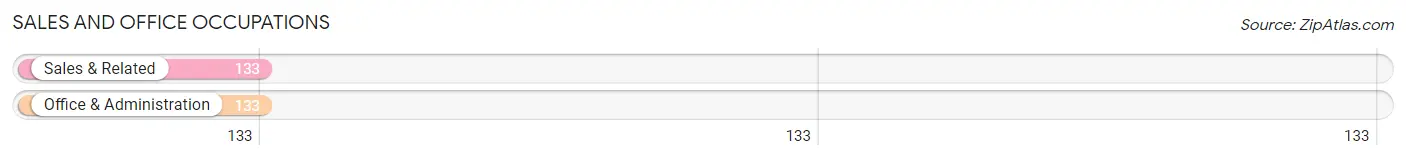
Sales and Office Occupations
The most common Sales and Office occupations in Metter are Sales & Related (133 | 9.0%), and Office & Administration (133 | 9.0%).
Sales and Office Occupations by Sex
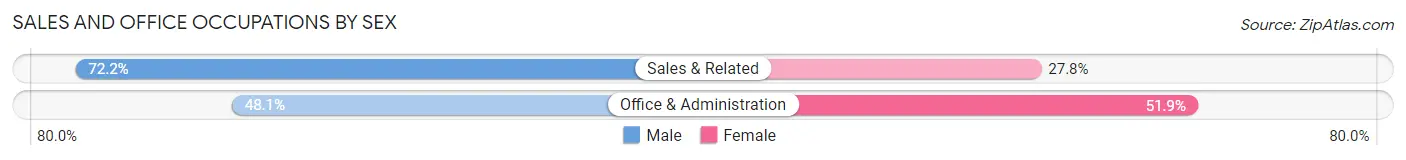
| Occupation | Male | Female |
| Sales & Related | 96 (72.2%) | 37 (27.8%) |
| Office & Administration | 64 (48.1%) | 69 (51.9%) |
| Total (Category) | 160 (60.2%) | 106 (39.9%) |
| Total (Overall) | 790 (53.4%) | 689 (46.6%) |
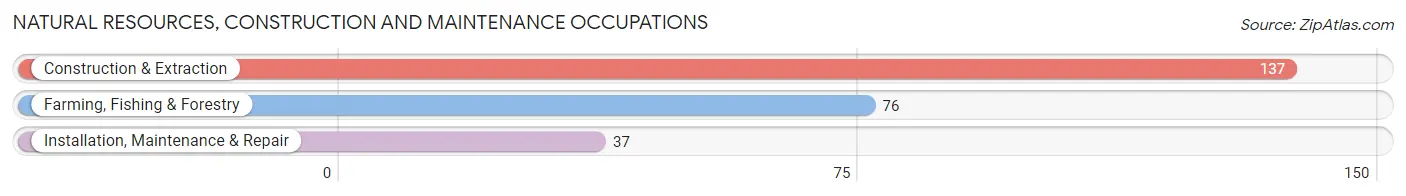
Natural Resources, Construction and Maintenance Occupations
The most common Natural Resources, Construction and Maintenance occupations in Metter are Construction & Extraction (137 | 9.3%), Farming, Fishing & Forestry (76 | 5.1%), and Installation, Maintenance & Repair (37 | 2.5%).
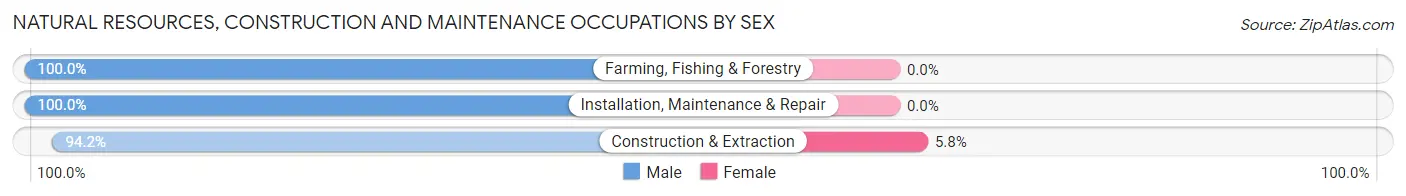
Natural Resources, Construction and Maintenance Occupations by Sex
| Occupation | Male | Female |
| Farming, Fishing & Forestry | 76 (100.0%) | 0 (0.0%) |
| Construction & Extraction | 129 (94.2%) | 8 (5.8%) |
| Installation, Maintenance & Repair | 37 (100.0%) | 0 (0.0%) |
| Total (Category) | 242 (96.8%) | 8 (3.2%) |
| Total (Overall) | 790 (53.4%) | 689 (46.6%) |
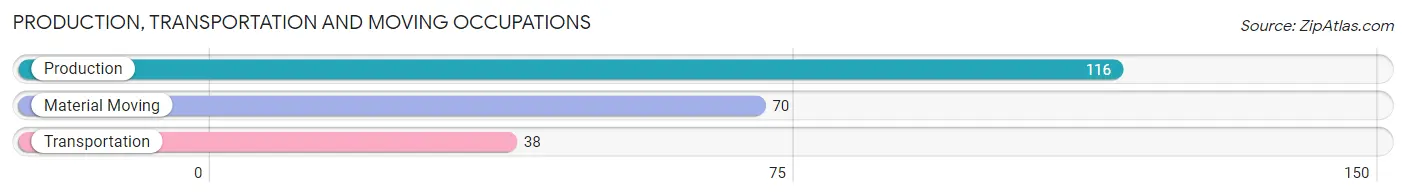
Production, Transportation and Moving Occupations
The most common Production, Transportation and Moving occupations in Metter are Production (116 | 7.8%), Material Moving (70 | 4.7%), and Transportation (38 | 2.6%).
Production, Transportation and Moving Occupations by Sex
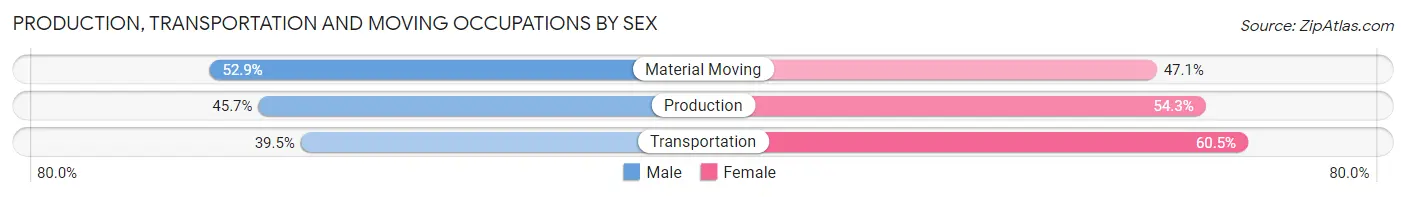
| Occupation | Male | Female |
| Production | 53 (45.7%) | 63 (54.3%) |
| Transportation | 15 (39.5%) | 23 (60.5%) |
| Material Moving | 37 (52.9%) | 33 (47.1%) |
| Total (Category) | 105 (46.9%) | 119 (53.1%) |
| Total (Overall) | 790 (53.4%) | 689 (46.6%) |
Employment Industries by Sex in Metter
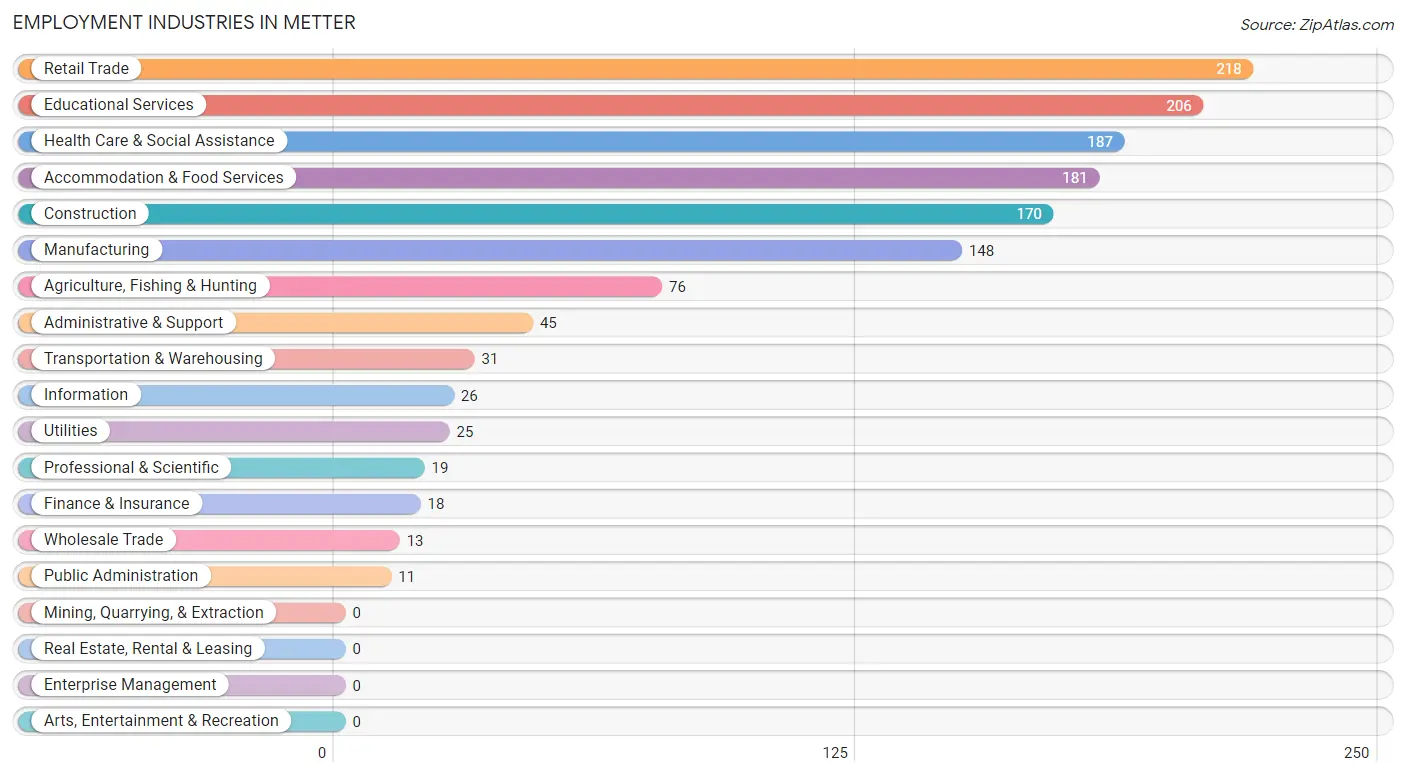
Employment Industries in Metter
The major employment industries in Metter include Retail Trade (218 | 14.7%), Educational Services (206 | 13.9%), Health Care & Social Assistance (187 | 12.6%), Accommodation & Food Services (181 | 12.2%), and Construction (170 | 11.5%).
Employment Industries by Sex in Metter
The Metter industries that see more men than women are Agriculture, Fishing & Hunting (100.0%), Wholesale Trade (100.0%), and Utilities (100.0%), whereas the industries that tend to have a higher number of women are Finance & Insurance (100.0%), Professional & Scientific (78.9%), and Health Care & Social Assistance (75.9%).
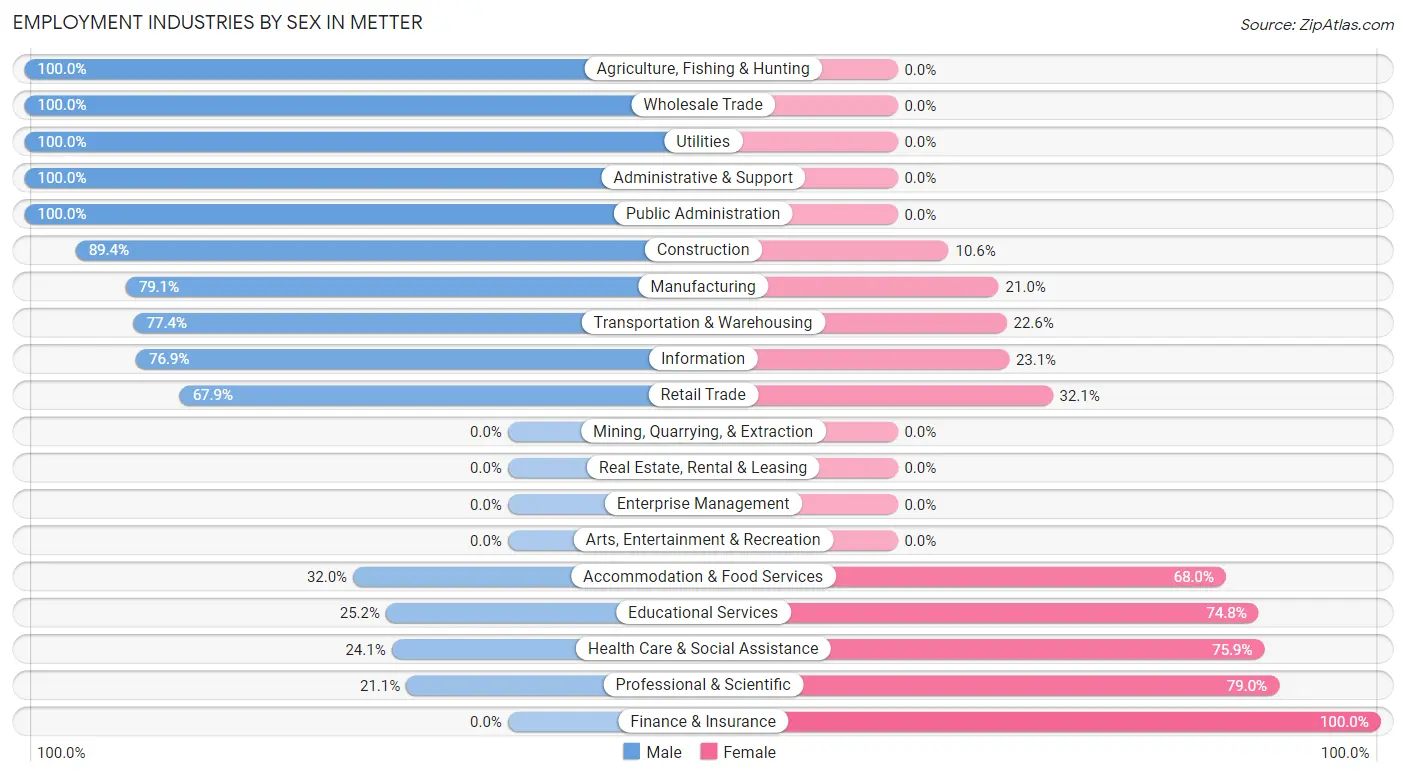
| Industry | Male | Female |
| Agriculture, Fishing & Hunting | 76 (100.0%) | 0 (0.0%) |
| Mining, Quarrying, & Extraction | 0 (0.0%) | 0 (0.0%) |
| Construction | 152 (89.4%) | 18 (10.6%) |
| Manufacturing | 117 (79.0%) | 31 (20.9%) |
| Wholesale Trade | 13 (100.0%) | 0 (0.0%) |
| Retail Trade | 148 (67.9%) | 70 (32.1%) |
| Transportation & Warehousing | 24 (77.4%) | 7 (22.6%) |
| Utilities | 25 (100.0%) | 0 (0.0%) |
| Information | 20 (76.9%) | 6 (23.1%) |
| Finance & Insurance | 0 (0.0%) | 18 (100.0%) |
| Real Estate, Rental & Leasing | 0 (0.0%) | 0 (0.0%) |
| Professional & Scientific | 4 (21.0%) | 15 (78.9%) |
| Enterprise Management | 0 (0.0%) | 0 (0.0%) |
| Administrative & Support | 45 (100.0%) | 0 (0.0%) |
| Educational Services | 52 (25.2%) | 154 (74.8%) |
| Health Care & Social Assistance | 45 (24.1%) | 142 (75.9%) |
| Arts, Entertainment & Recreation | 0 (0.0%) | 0 (0.0%) |
| Accommodation & Food Services | 58 (32.0%) | 123 (68.0%) |
| Public Administration | 11 (100.0%) | 0 (0.0%) |
| Total | 790 (53.4%) | 689 (46.6%) |
Education in Metter
School Enrollment in Metter
The most common levels of schooling among the 847 students in Metter are middle school (359 | 42.4%), high school (218 | 25.7%), and elementary school (109 | 12.9%).
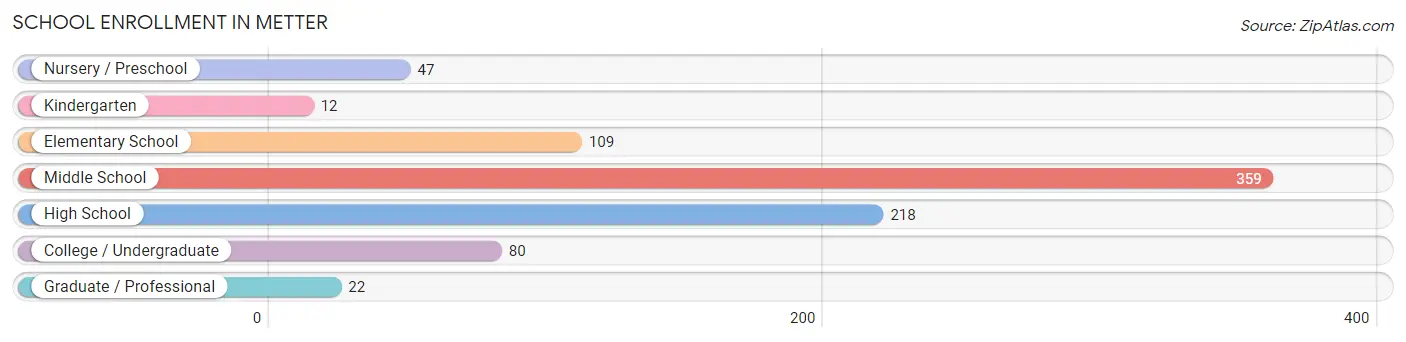
| School Level | # Students | % Students |
| Nursery / Preschool | 47 | 5.6% |
| Kindergarten | 12 | 1.4% |
| Elementary School | 109 | 12.9% |
| Middle School | 359 | 42.4% |
| High School | 218 | 25.7% |
| College / Undergraduate | 80 | 9.5% |
| Graduate / Professional | 22 | 2.6% |
| Total | 847 | 100.0% |
School Enrollment by Age by Funding Source in Metter
Out of a total of 847 students who are enrolled in schools in Metter, 146 (17.2%) attend a private institution, while the remaining 701 (82.8%) are enrolled in public schools. The age group of 5 to 9 year old has the highest likelihood of being enrolled in private schools, with 78 (53.1% in the age bracket) enrolled. Conversely, the age group of 10 to 14 year olds has the lowest likelihood of being enrolled in a private school, with 382 (100.0% in the age bracket) attending a public institution.
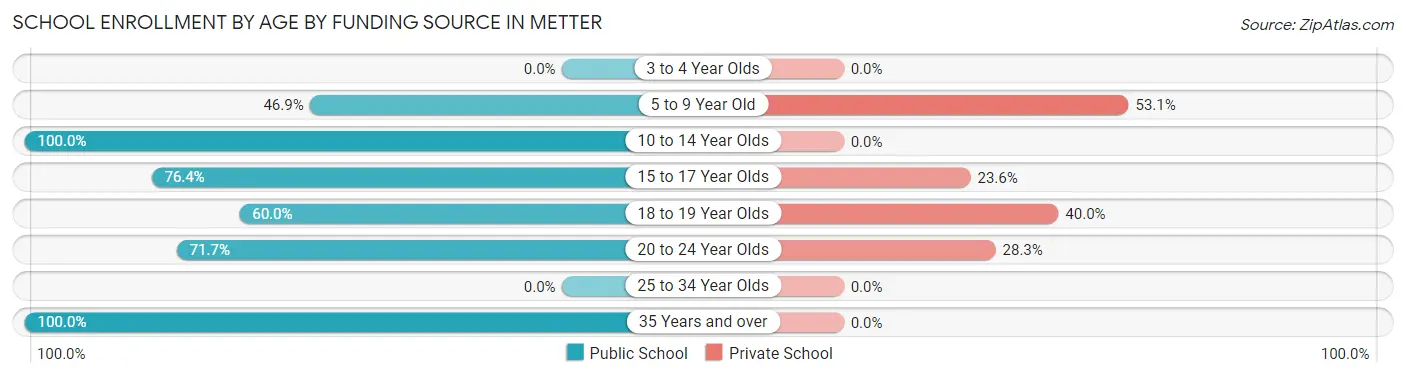
| Age Bracket | Public School | Private School |
| 3 to 4 Year Olds | 0 (0.0%) | 0 (0.0%) |
| 5 to 9 Year Old | 69 (46.9%) | 78 (53.1%) |
| 10 to 14 Year Olds | 382 (100.0%) | 0 (0.0%) |
| 15 to 17 Year Olds | 139 (76.4%) | 43 (23.6%) |
| 18 to 19 Year Olds | 15 (60.0%) | 10 (40.0%) |
| 20 to 24 Year Olds | 38 (71.7%) | 15 (28.3%) |
| 25 to 34 Year Olds | 0 (0.0%) | 0 (0.0%) |
| 35 Years and over | 58 (100.0%) | 0 (0.0%) |
| Total | 701 (82.8%) | 146 (17.2%) |
Educational Attainment by Field of Study in Metter
Education (148 | 57.8%), science & technology (29 | 11.3%), social sciences (17 | 6.6%), business (16 | 6.2%), and communications (12 | 4.7%) are the most common fields of study among 256 individuals in Metter who have obtained a bachelor's degree or higher.
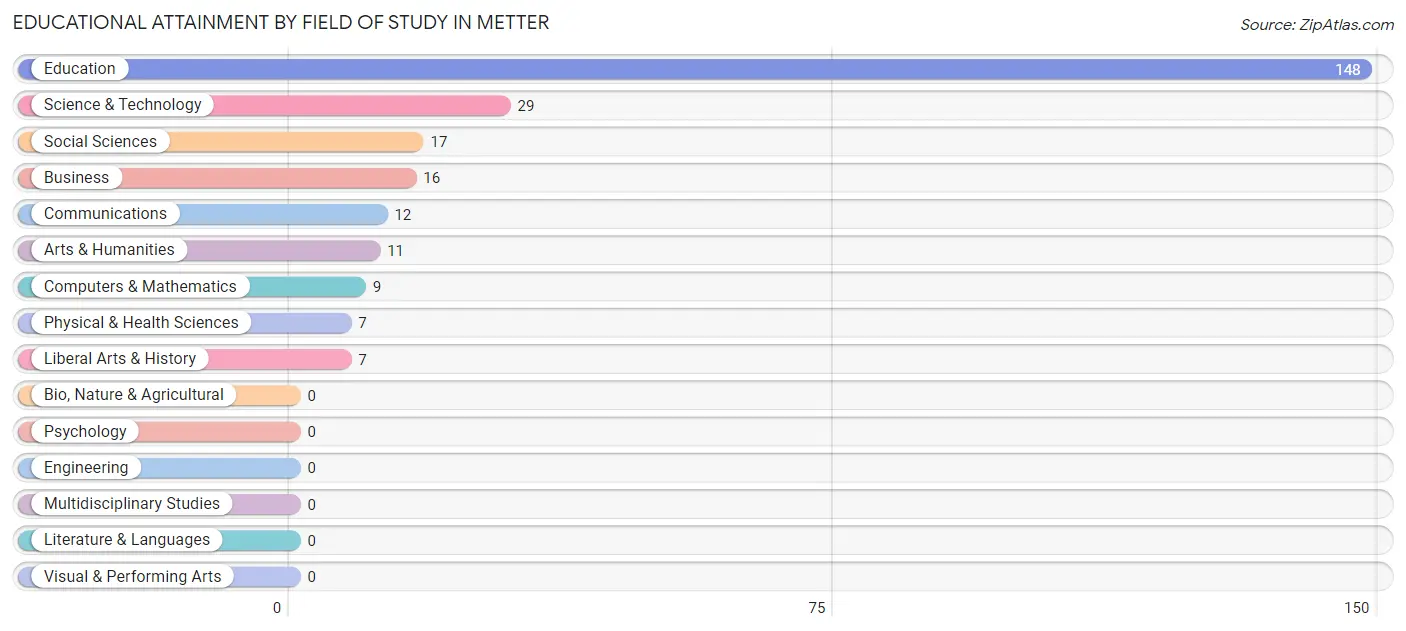
| Field of Study | # Graduates | % Graduates |
| Computers & Mathematics | 9 | 3.5% |
| Bio, Nature & Agricultural | 0 | 0.0% |
| Physical & Health Sciences | 7 | 2.7% |
| Psychology | 0 | 0.0% |
| Social Sciences | 17 | 6.6% |
| Engineering | 0 | 0.0% |
| Multidisciplinary Studies | 0 | 0.0% |
| Science & Technology | 29 | 11.3% |
| Business | 16 | 6.2% |
| Education | 148 | 57.8% |
| Literature & Languages | 0 | 0.0% |
| Liberal Arts & History | 7 | 2.7% |
| Visual & Performing Arts | 0 | 0.0% |
| Communications | 12 | 4.7% |
| Arts & Humanities | 11 | 4.3% |
| Total | 256 | 100.0% |
Transportation & Commute in Metter
Vehicle Availability by Sex in Metter
The most prevalent vehicle ownership categories in Metter are males with 2 vehicles (356, accounting for 45.1%) and females with 2 vehicles (260, making up 51.7%).
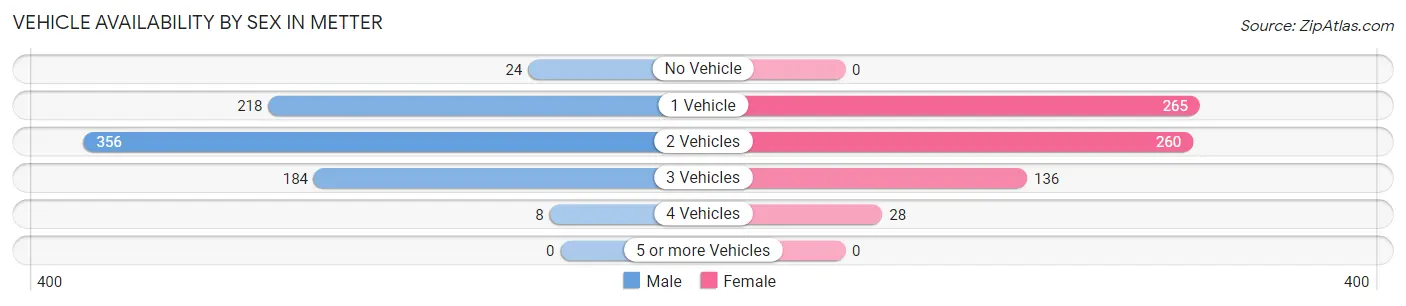
| Vehicles Available | Male | Female |
| No Vehicle | 24 (3.0%) | 0 (0.0%) |
| 1 Vehicle | 218 (27.6%) | 265 (38.5%) |
| 2 Vehicles | 356 (45.1%) | 260 (37.7%) |
| 3 Vehicles | 184 (23.3%) | 136 (19.7%) |
| 4 Vehicles | 8 (1.0%) | 28 (4.1%) |
| 5 or more Vehicles | 0 (0.0%) | 0 (0.0%) |
| Total | 790 (100.0%) | 689 (100.0%) |
Commute Time in Metter
The most frequently occuring commute durations in Metter are 5 to 9 minutes (357 commuters, 24.3%), 30 to 34 minutes (226 commuters, 15.4%), and less than 5 minutes (210 commuters, 14.3%).
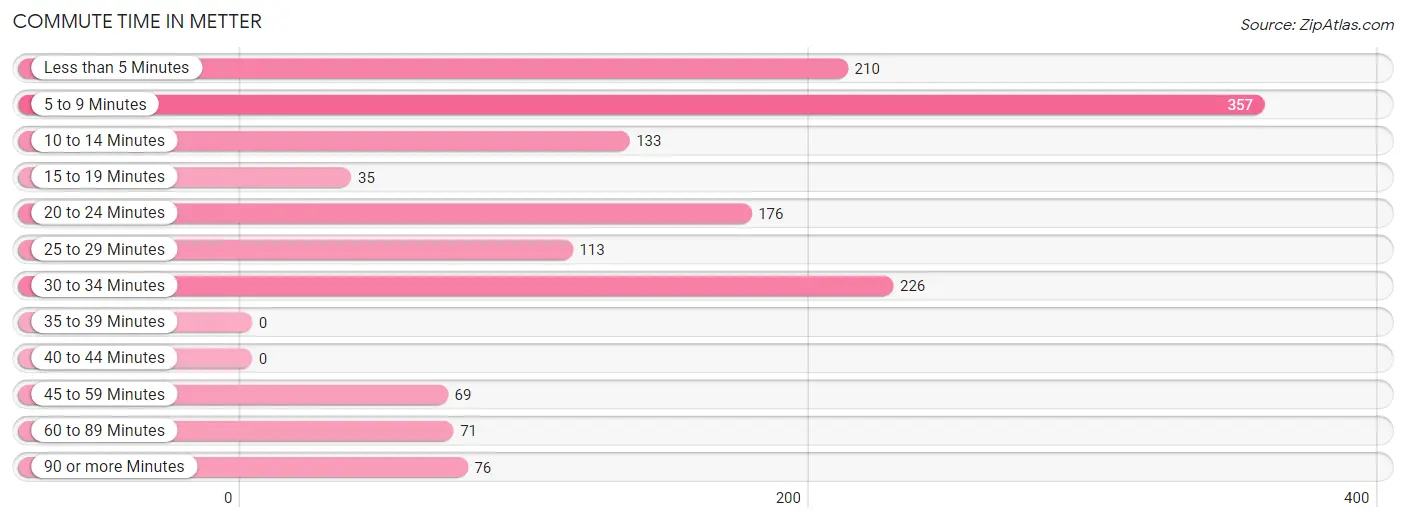
| Commute Time | # Commuters | % Commuters |
| Less than 5 Minutes | 210 | 14.3% |
| 5 to 9 Minutes | 357 | 24.3% |
| 10 to 14 Minutes | 133 | 9.1% |
| 15 to 19 Minutes | 35 | 2.4% |
| 20 to 24 Minutes | 176 | 12.0% |
| 25 to 29 Minutes | 113 | 7.7% |
| 30 to 34 Minutes | 226 | 15.4% |
| 35 to 39 Minutes | 0 | 0.0% |
| 40 to 44 Minutes | 0 | 0.0% |
| 45 to 59 Minutes | 69 | 4.7% |
| 60 to 89 Minutes | 71 | 4.8% |
| 90 or more Minutes | 76 | 5.2% |
Commute Time by Sex in Metter
The most common commute times in Metter are 5 to 9 minutes (146 commuters, 18.6%) for males and 5 to 9 minutes (211 commuters, 31.0%) for females.
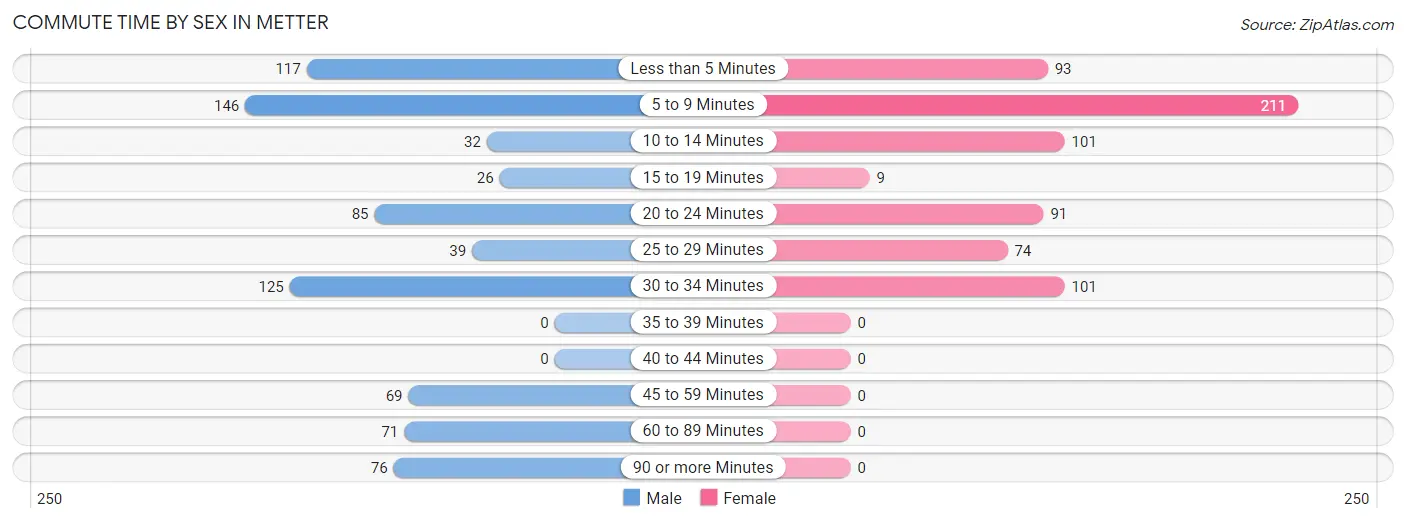
| Commute Time | Male | Female |
| Less than 5 Minutes | 117 (14.9%) | 93 (13.7%) |
| 5 to 9 Minutes | 146 (18.6%) | 211 (31.0%) |
| 10 to 14 Minutes | 32 (4.1%) | 101 (14.8%) |
| 15 to 19 Minutes | 26 (3.3%) | 9 (1.3%) |
| 20 to 24 Minutes | 85 (10.8%) | 91 (13.4%) |
| 25 to 29 Minutes | 39 (5.0%) | 74 (10.9%) |
| 30 to 34 Minutes | 125 (15.9%) | 101 (14.8%) |
| 35 to 39 Minutes | 0 (0.0%) | 0 (0.0%) |
| 40 to 44 Minutes | 0 (0.0%) | 0 (0.0%) |
| 45 to 59 Minutes | 69 (8.8%) | 0 (0.0%) |
| 60 to 89 Minutes | 71 (9.0%) | 0 (0.0%) |
| 90 or more Minutes | 76 (9.7%) | 0 (0.0%) |
Time of Departure to Work by Sex in Metter
The most frequent times of departure to work in Metter are 4:00 PM to 11:59 PM (168, 21.4%) for males and 12:00 PM to 3:59 PM (106, 15.6%) for females.
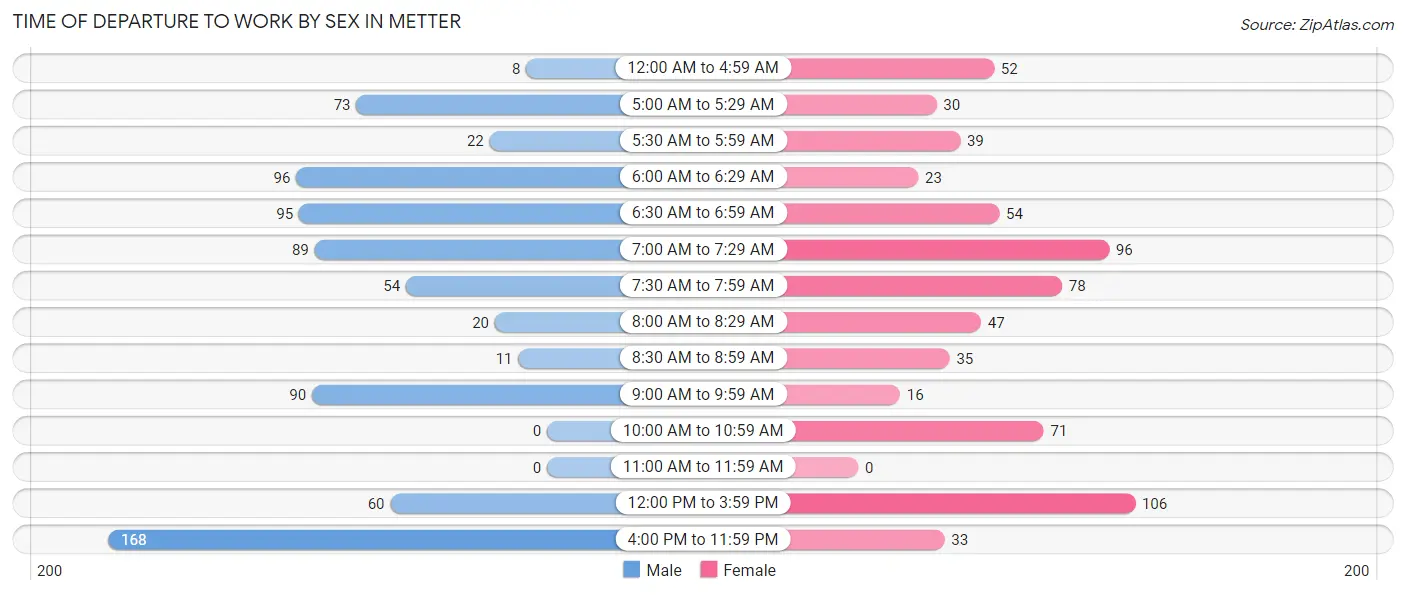
| Time of Departure | Male | Female |
| 12:00 AM to 4:59 AM | 8 (1.0%) | 52 (7.6%) |
| 5:00 AM to 5:29 AM | 73 (9.3%) | 30 (4.4%) |
| 5:30 AM to 5:59 AM | 22 (2.8%) | 39 (5.7%) |
| 6:00 AM to 6:29 AM | 96 (12.2%) | 23 (3.4%) |
| 6:30 AM to 6:59 AM | 95 (12.1%) | 54 (7.9%) |
| 7:00 AM to 7:29 AM | 89 (11.3%) | 96 (14.1%) |
| 7:30 AM to 7:59 AM | 54 (6.9%) | 78 (11.5%) |
| 8:00 AM to 8:29 AM | 20 (2.5%) | 47 (6.9%) |
| 8:30 AM to 8:59 AM | 11 (1.4%) | 35 (5.1%) |
| 9:00 AM to 9:59 AM | 90 (11.5%) | 16 (2.4%) |
| 10:00 AM to 10:59 AM | 0 (0.0%) | 71 (10.4%) |
| 11:00 AM to 11:59 AM | 0 (0.0%) | 0 (0.0%) |
| 12:00 PM to 3:59 PM | 60 (7.6%) | 106 (15.6%) |
| 4:00 PM to 11:59 PM | 168 (21.4%) | 33 (4.9%) |
| Total | 786 (100.0%) | 680 (100.0%) |
Housing Occupancy in Metter
Occupancy by Ownership in Metter
Of the total 1,628 dwellings in Metter, owner-occupied units account for 760 (46.7%), while renter-occupied units make up 868 (53.3%).
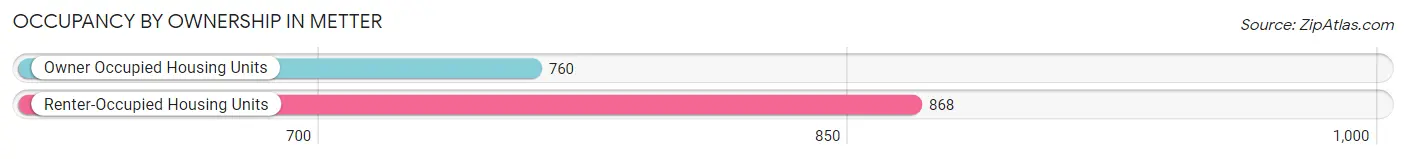
| Occupancy | # Housing Units | % Housing Units |
| Owner Occupied Housing Units | 760 | 46.7% |
| Renter-Occupied Housing Units | 868 | 53.3% |
| Total Occupied Housing Units | 1,628 | 100.0% |
Occupancy by Household Size in Metter
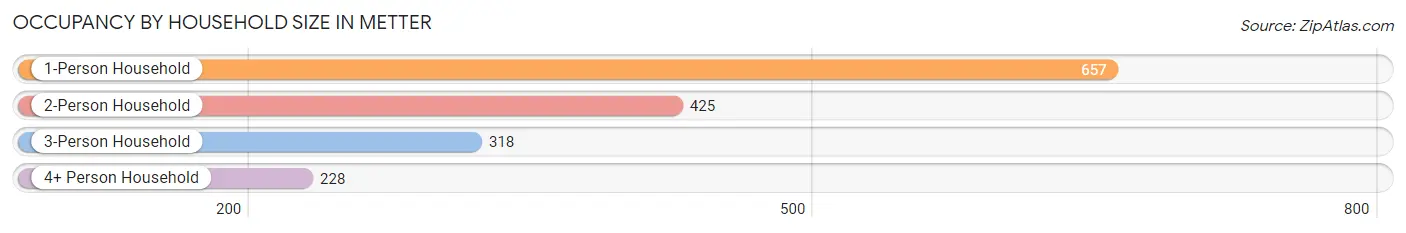
| Household Size | # Housing Units | % Housing Units |
| 1-Person Household | 657 | 40.4% |
| 2-Person Household | 425 | 26.1% |
| 3-Person Household | 318 | 19.5% |
| 4+ Person Household | 228 | 14.0% |
| Total Housing Units | 1,628 | 100.0% |
Occupancy by Ownership by Household Size in Metter
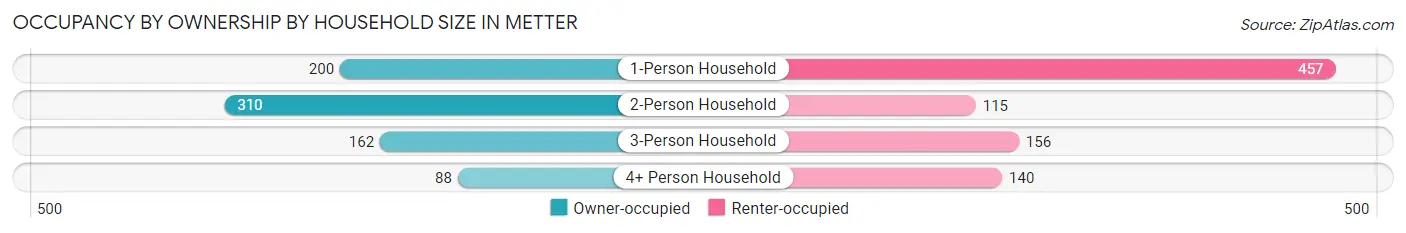
| Household Size | Owner-occupied | Renter-occupied |
| 1-Person Household | 200 (30.4%) | 457 (69.6%) |
| 2-Person Household | 310 (72.9%) | 115 (27.1%) |
| 3-Person Household | 162 (50.9%) | 156 (49.1%) |
| 4+ Person Household | 88 (38.6%) | 140 (61.4%) |
| Total Housing Units | 760 (46.7%) | 868 (53.3%) |
Occupancy by Educational Attainment in Metter
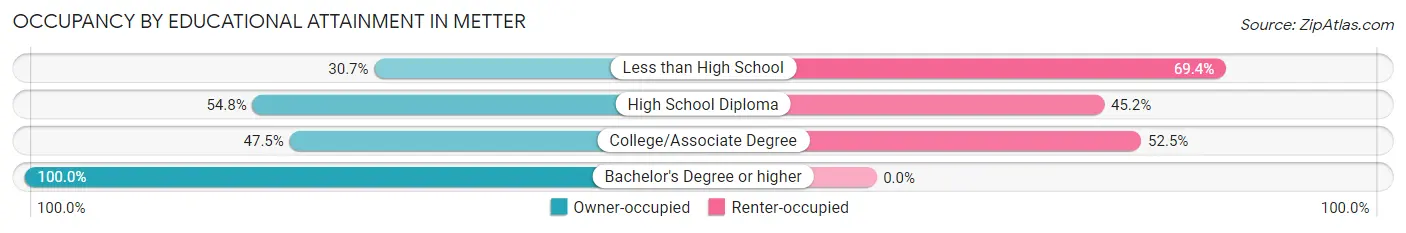
| Household Size | Owner-occupied | Renter-occupied |
| Less than High School | 156 (30.6%) | 353 (69.4%) |
| High School Diploma | 273 (54.8%) | 225 (45.2%) |
| College/Associate Degree | 262 (47.5%) | 290 (52.5%) |
| Bachelor's Degree or higher | 69 (100.0%) | 0 (0.0%) |
Occupancy by Age of Householder in Metter
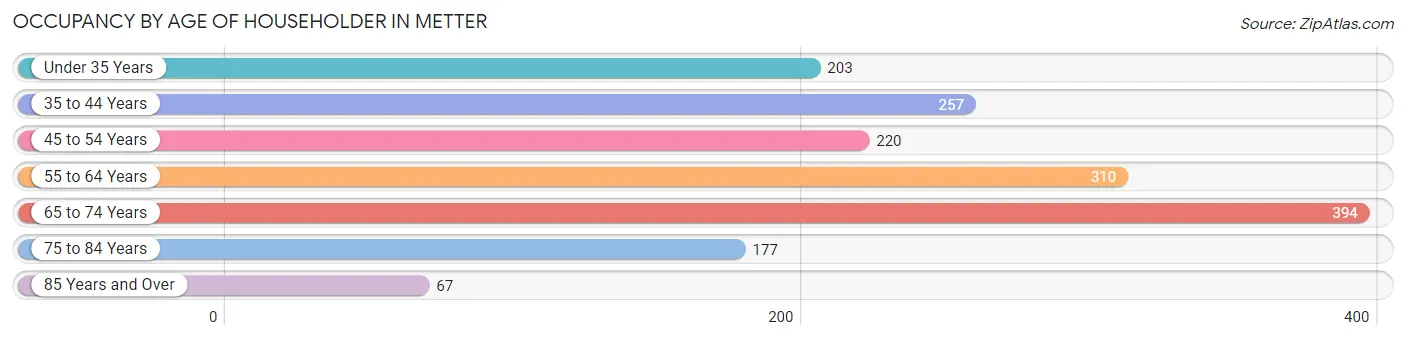
| Age Bracket | # Households | % Households |
| Under 35 Years | 203 | 12.5% |
| 35 to 44 Years | 257 | 15.8% |
| 45 to 54 Years | 220 | 13.5% |
| 55 to 64 Years | 310 | 19.0% |
| 65 to 74 Years | 394 | 24.2% |
| 75 to 84 Years | 177 | 10.9% |
| 85 Years and Over | 67 | 4.1% |
| Total | 1,628 | 100.0% |
Housing Finances in Metter
Median Income by Occupancy in Metter
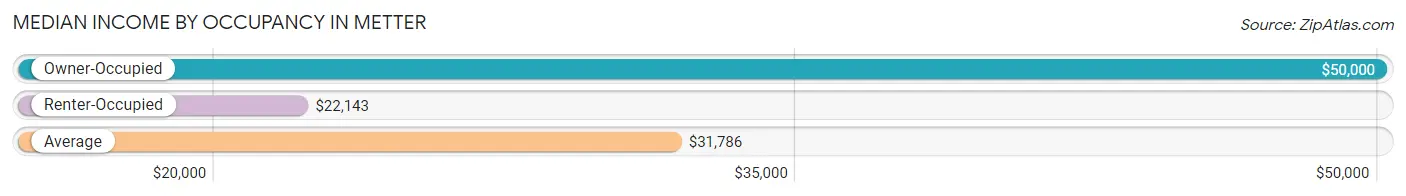
| Occupancy Type | # Households | Median Income |
| Owner-Occupied | 760 (46.7%) | $50,000 |
| Renter-Occupied | 868 (53.3%) | $22,143 |
| Average | 1,628 (100.0%) | $31,786 |
Occupancy by Householder Income Bracket in Metter
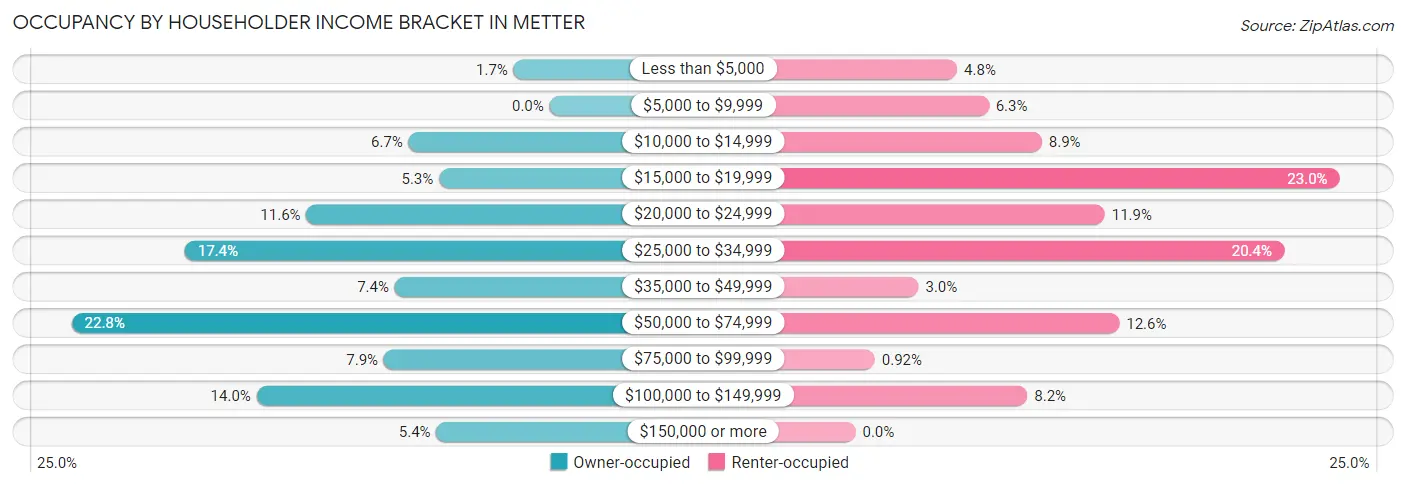
| Income Bracket | Owner-occupied | Renter-occupied |
| Less than $5,000 | 13 (1.7%) | 42 (4.8%) |
| $5,000 to $9,999 | 0 (0.0%) | 55 (6.3%) |
| $10,000 to $14,999 | 51 (6.7%) | 77 (8.9%) |
| $15,000 to $19,999 | 40 (5.3%) | 200 (23.0%) |
| $20,000 to $24,999 | 88 (11.6%) | 103 (11.9%) |
| $25,000 to $34,999 | 132 (17.4%) | 177 (20.4%) |
| $35,000 to $49,999 | 56 (7.4%) | 26 (3.0%) |
| $50,000 to $74,999 | 173 (22.8%) | 109 (12.6%) |
| $75,000 to $99,999 | 60 (7.9%) | 8 (0.9%) |
| $100,000 to $149,999 | 106 (14.0%) | 71 (8.2%) |
| $150,000 or more | 41 (5.4%) | 0 (0.0%) |
| Total | 760 (100.0%) | 868 (100.0%) |
Monthly Housing Cost Tiers in Metter
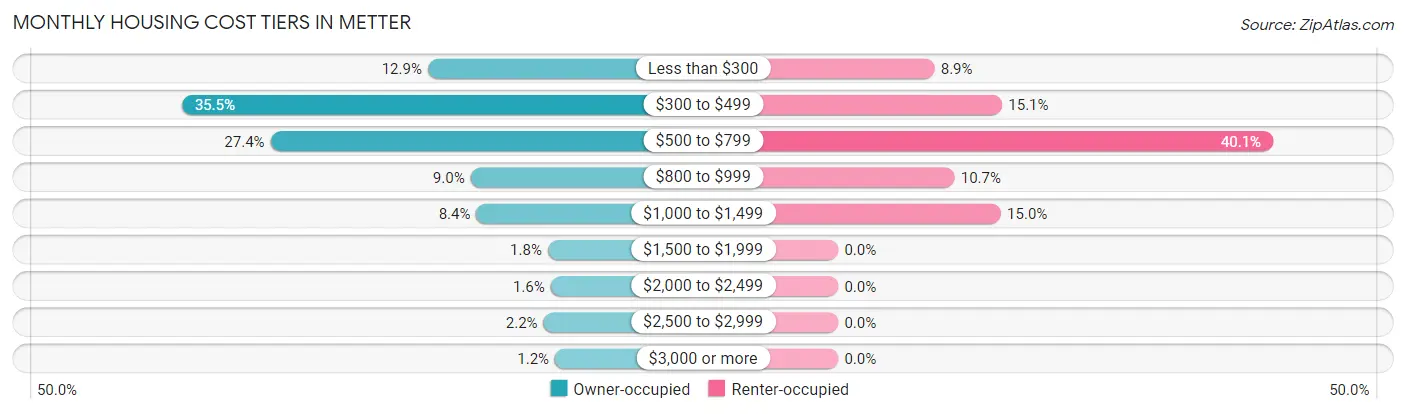
| Monthly Cost | Owner-occupied | Renter-occupied |
| Less than $300 | 98 (12.9%) | 77 (8.9%) |
| $300 to $499 | 270 (35.5%) | 131 (15.1%) |
| $500 to $799 | 208 (27.4%) | 348 (40.1%) |
| $800 to $999 | 68 (8.9%) | 93 (10.7%) |
| $1,000 to $1,499 | 64 (8.4%) | 130 (15.0%) |
| $1,500 to $1,999 | 14 (1.8%) | 0 (0.0%) |
| $2,000 to $2,499 | 12 (1.6%) | 0 (0.0%) |
| $2,500 to $2,999 | 17 (2.2%) | 0 (0.0%) |
| $3,000 or more | 9 (1.2%) | 0 (0.0%) |
| Total | 760 (100.0%) | 868 (100.0%) |
Physical Housing Characteristics in Metter
Housing Structures in Metter
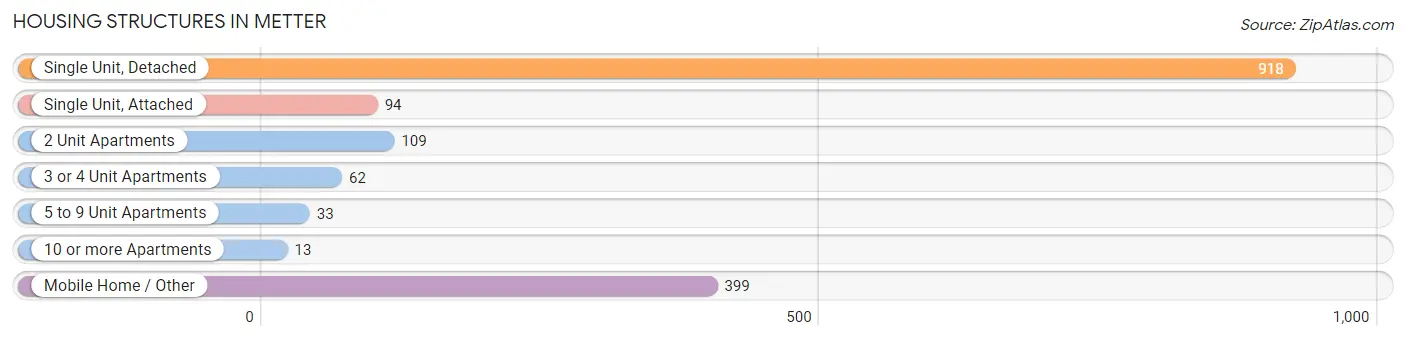
| Structure Type | # Housing Units | % Housing Units |
| Single Unit, Detached | 918 | 56.4% |
| Single Unit, Attached | 94 | 5.8% |
| 2 Unit Apartments | 109 | 6.7% |
| 3 or 4 Unit Apartments | 62 | 3.8% |
| 5 to 9 Unit Apartments | 33 | 2.0% |
| 10 or more Apartments | 13 | 0.8% |
| Mobile Home / Other | 399 | 24.5% |
| Total | 1,628 | 100.0% |
Housing Structures by Occupancy in Metter
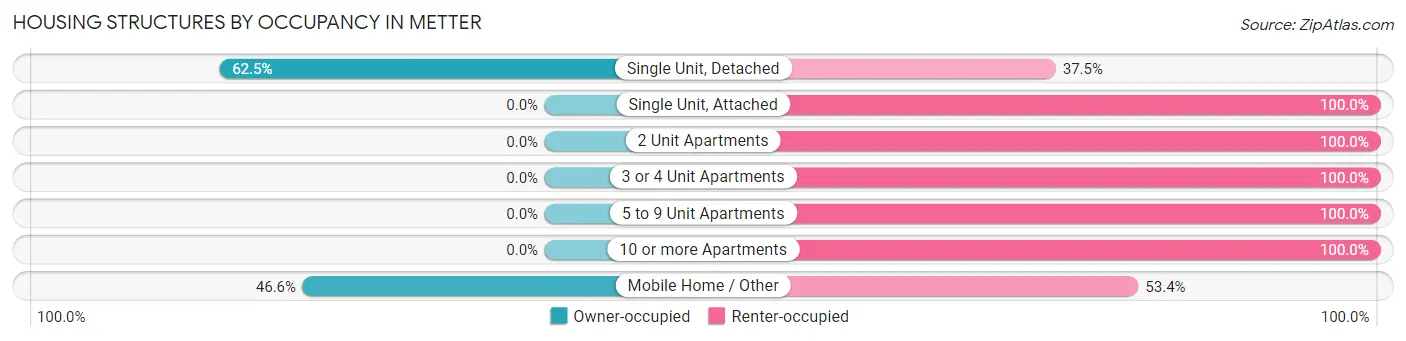
| Structure Type | Owner-occupied | Renter-occupied |
| Single Unit, Detached | 574 (62.5%) | 344 (37.5%) |
| Single Unit, Attached | 0 (0.0%) | 94 (100.0%) |
| 2 Unit Apartments | 0 (0.0%) | 109 (100.0%) |
| 3 or 4 Unit Apartments | 0 (0.0%) | 62 (100.0%) |
| 5 to 9 Unit Apartments | 0 (0.0%) | 33 (100.0%) |
| 10 or more Apartments | 0 (0.0%) | 13 (100.0%) |
| Mobile Home / Other | 186 (46.6%) | 213 (53.4%) |
| Total | 760 (46.7%) | 868 (53.3%) |
Housing Structures by Number of Rooms in Metter
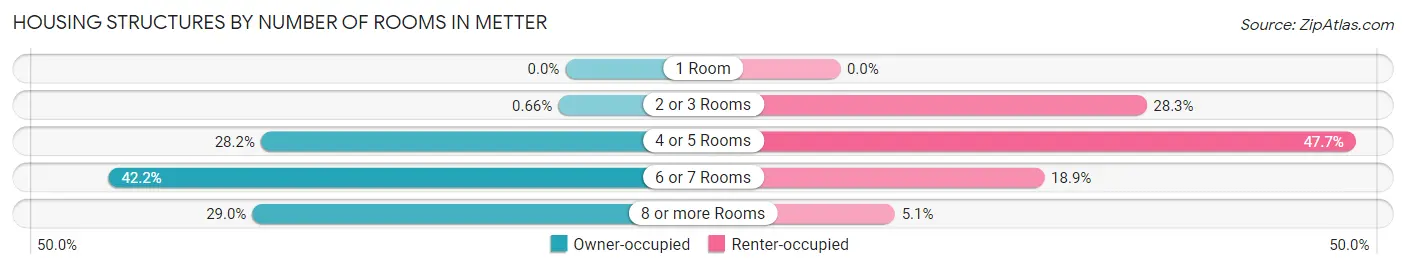
| Number of Rooms | Owner-occupied | Renter-occupied |
| 1 Room | 0 (0.0%) | 0 (0.0%) |
| 2 or 3 Rooms | 5 (0.7%) | 246 (28.3%) |
| 4 or 5 Rooms | 214 (28.2%) | 414 (47.7%) |
| 6 or 7 Rooms | 321 (42.2%) | 164 (18.9%) |
| 8 or more Rooms | 220 (28.9%) | 44 (5.1%) |
| Total | 760 (100.0%) | 868 (100.0%) |
Housing Structure by Heating Type in Metter
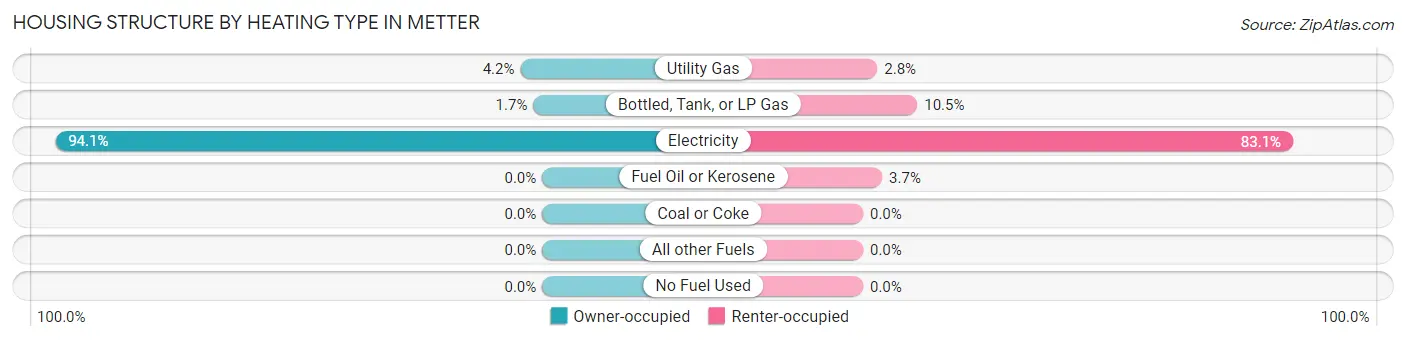
| Heating Type | Owner-occupied | Renter-occupied |
| Utility Gas | 32 (4.2%) | 24 (2.8%) |
| Bottled, Tank, or LP Gas | 13 (1.7%) | 91 (10.5%) |
| Electricity | 715 (94.1%) | 721 (83.1%) |
| Fuel Oil or Kerosene | 0 (0.0%) | 32 (3.7%) |
| Coal or Coke | 0 (0.0%) | 0 (0.0%) |
| All other Fuels | 0 (0.0%) | 0 (0.0%) |
| No Fuel Used | 0 (0.0%) | 0 (0.0%) |
| Total | 760 (100.0%) | 868 (100.0%) |
Household Vehicle Usage in Metter
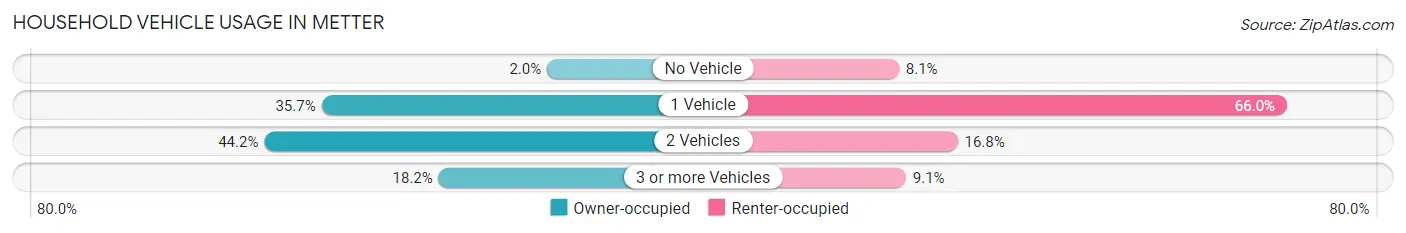
| Vehicles per Household | Owner-occupied | Renter-occupied |
| No Vehicle | 15 (2.0%) | 70 (8.1%) |
| 1 Vehicle | 271 (35.7%) | 573 (66.0%) |
| 2 Vehicles | 336 (44.2%) | 146 (16.8%) |
| 3 or more Vehicles | 138 (18.2%) | 79 (9.1%) |
| Total | 760 (100.0%) | 868 (100.0%) |
Real Estate & Mortgages in Metter
Real Estate and Mortgage Overview in Metter
| Characteristic | Without Mortgage | With Mortgage |
| Housing Units | 550 | 210 |
| Median Property Value | $148,800 | $167,900 |
| Median Household Income | $46,917 | $21 |
| Monthly Housing Costs | $439 | $9 |
| Real Estate Taxes | $1,318 | $6 |
Property Value by Mortgage Status in Metter
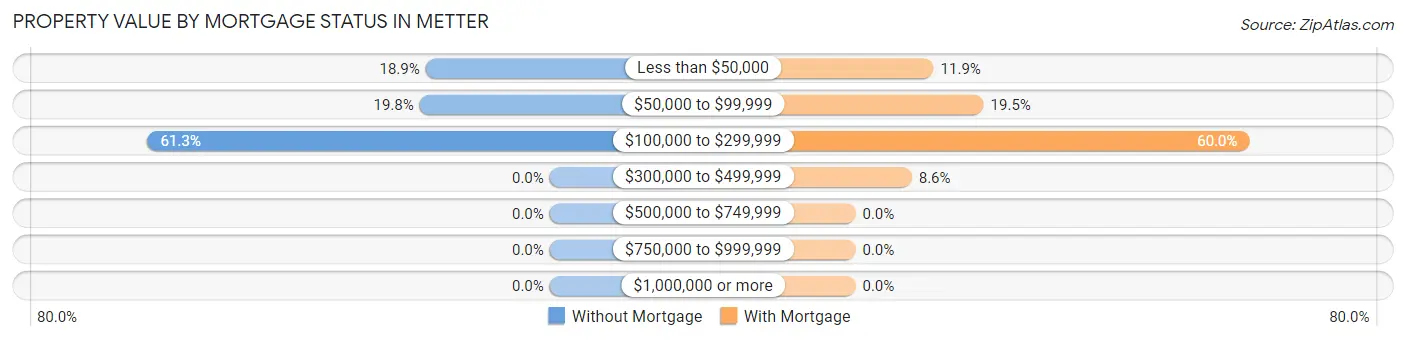
| Property Value | Without Mortgage | With Mortgage |
| Less than $50,000 | 104 (18.9%) | 25 (11.9%) |
| $50,000 to $99,999 | 109 (19.8%) | 41 (19.5%) |
| $100,000 to $299,999 | 337 (61.3%) | 126 (60.0%) |
| $300,000 to $499,999 | 0 (0.0%) | 18 (8.6%) |
| $500,000 to $749,999 | 0 (0.0%) | 0 (0.0%) |
| $750,000 to $999,999 | 0 (0.0%) | 0 (0.0%) |
| $1,000,000 or more | 0 (0.0%) | 0 (0.0%) |
| Total | 550 (100.0%) | 210 (100.0%) |
Household Income by Mortgage Status in Metter
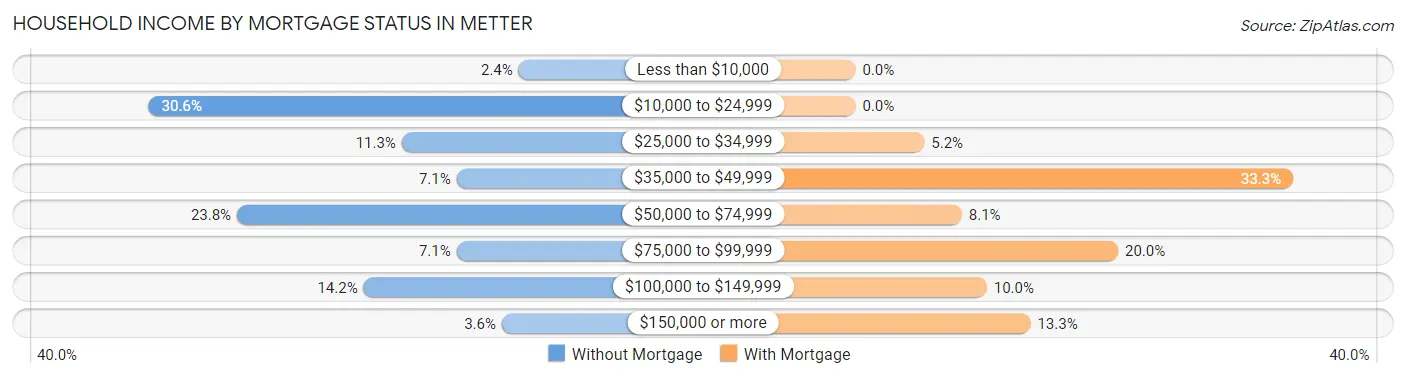
| Household Income | Without Mortgage | With Mortgage |
| Less than $10,000 | 13 (2.4%) | 0 (0.0%) |
| $10,000 to $24,999 | 168 (30.5%) | 0 (0.0%) |
| $25,000 to $34,999 | 62 (11.3%) | 11 (5.2%) |
| $35,000 to $49,999 | 39 (7.1%) | 70 (33.3%) |
| $50,000 to $74,999 | 131 (23.8%) | 17 (8.1%) |
| $75,000 to $99,999 | 39 (7.1%) | 42 (20.0%) |
| $100,000 to $149,999 | 78 (14.2%) | 21 (10.0%) |
| $150,000 or more | 20 (3.6%) | 28 (13.3%) |
| Total | 550 (100.0%) | 210 (100.0%) |
Property Value to Household Income Ratio in Metter
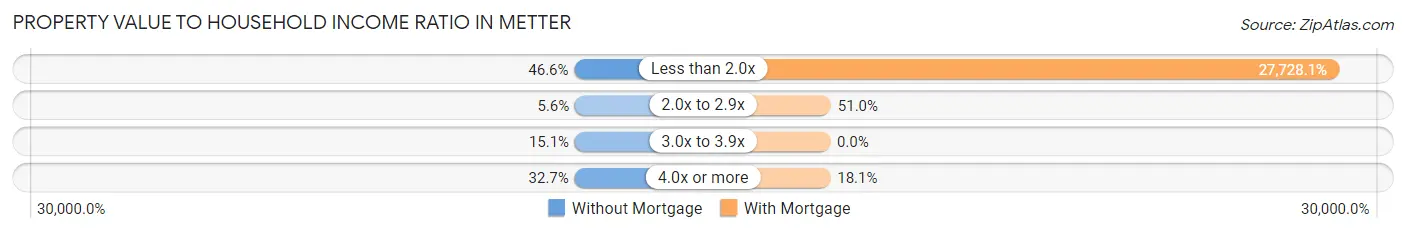
| Value-to-Income Ratio | Without Mortgage | With Mortgage |
| Less than 2.0x | 256 (46.6%) | 58,229 (27,728.1%) |
| 2.0x to 2.9x | 31 (5.6%) | 107 (50.9%) |
| 3.0x to 3.9x | 83 (15.1%) | 0 (0.0%) |
| 4.0x or more | 180 (32.7%) | 38 (18.1%) |
| Total | 550 (100.0%) | 210 (100.0%) |
Real Estate Taxes by Mortgage Status in Metter
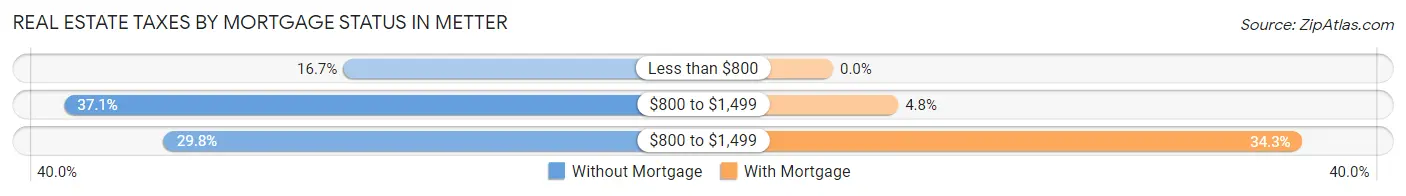
| Property Taxes | Without Mortgage | With Mortgage |
| Less than $800 | 92 (16.7%) | 0 (0.0%) |
| $800 to $1,499 | 204 (37.1%) | 10 (4.8%) |
| $800 to $1,499 | 164 (29.8%) | 72 (34.3%) |
| Total | 550 (100.0%) | 210 (100.0%) |
Health & Disability in Metter
Health Insurance Coverage by Age in Metter
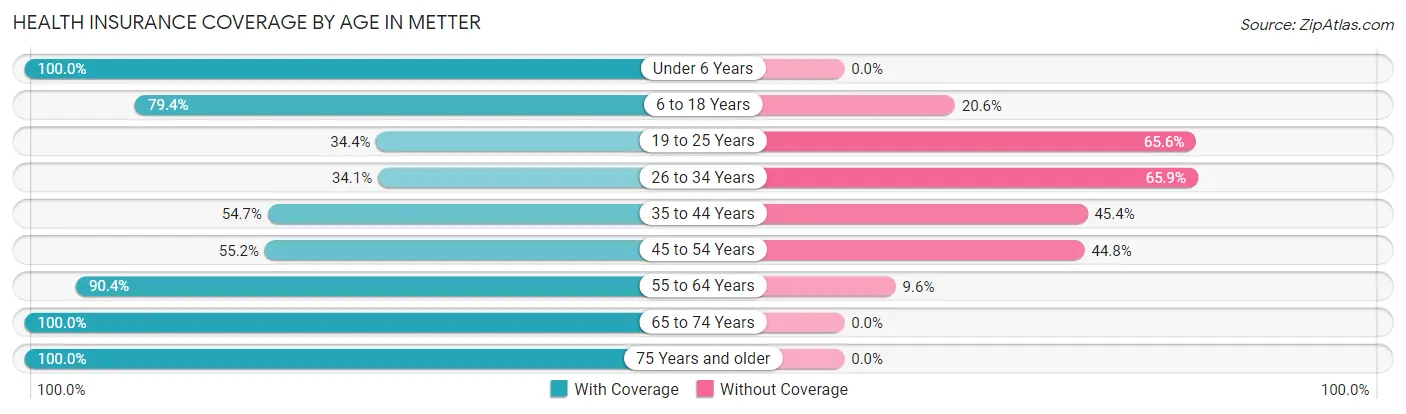
| Age Bracket | With Coverage | Without Coverage |
| Under 6 Years | 156 (100.0%) | 0 (0.0%) |
| 6 to 18 Years | 535 (79.4%) | 139 (20.6%) |
| 19 to 25 Years | 76 (34.4%) | 145 (65.6%) |
| 26 to 34 Years | 120 (34.1%) | 232 (65.9%) |
| 35 to 44 Years | 276 (54.6%) | 229 (45.4%) |
| 45 to 54 Years | 308 (55.2%) | 250 (44.8%) |
| 55 to 64 Years | 406 (90.4%) | 43 (9.6%) |
| 65 to 74 Years | 516 (100.0%) | 0 (0.0%) |
| 75 Years and older | 334 (100.0%) | 0 (0.0%) |
| Total | 2,727 (72.4%) | 1,038 (27.6%) |
Health Insurance Coverage by Citizenship Status in Metter
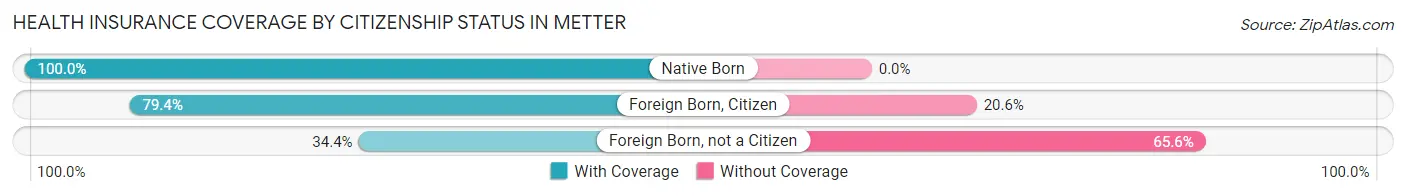
| Citizenship Status | With Coverage | Without Coverage |
| Native Born | 156 (100.0%) | 0 (0.0%) |
| Foreign Born, Citizen | 535 (79.4%) | 139 (20.6%) |
| Foreign Born, not a Citizen | 76 (34.4%) | 145 (65.6%) |
Health Insurance Coverage by Household Income in Metter
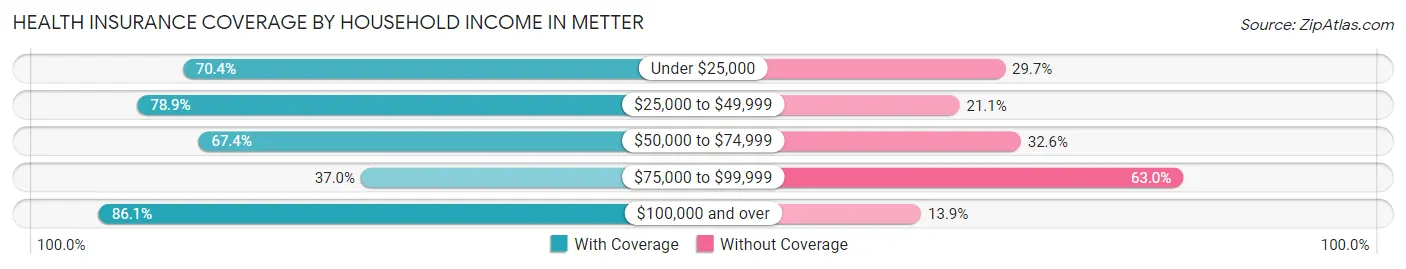
| Household Income | With Coverage | Without Coverage |
| Under $25,000 | 814 (70.4%) | 343 (29.6%) |
| $25,000 to $49,999 | 646 (78.9%) | 173 (21.1%) |
| $50,000 to $74,999 | 583 (67.4%) | 282 (32.6%) |
| $75,000 to $99,999 | 84 (37.0%) | 143 (63.0%) |
| $100,000 and over | 600 (86.1%) | 97 (13.9%) |
Public vs Private Health Insurance Coverage by Age in Metter
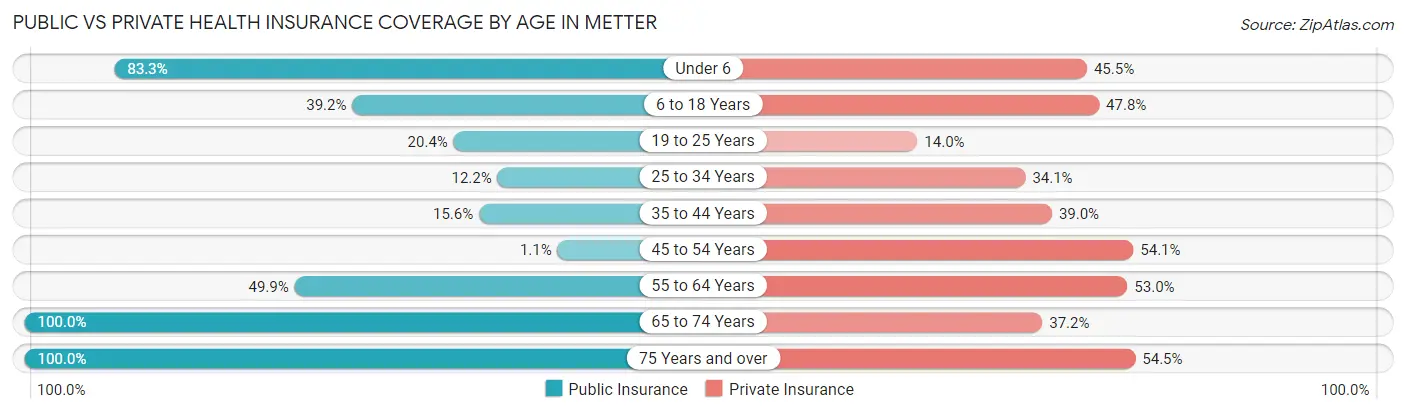
| Age Bracket | Public Insurance | Private Insurance |
| Under 6 | 130 (83.3%) | 71 (45.5%) |
| 6 to 18 Years | 264 (39.2%) | 322 (47.8%) |
| 19 to 25 Years | 45 (20.4%) | 31 (14.0%) |
| 25 to 34 Years | 43 (12.2%) | 120 (34.1%) |
| 35 to 44 Years | 79 (15.6%) | 197 (39.0%) |
| 45 to 54 Years | 6 (1.1%) | 302 (54.1%) |
| 55 to 64 Years | 224 (49.9%) | 238 (53.0%) |
| 65 to 74 Years | 516 (100.0%) | 192 (37.2%) |
| 75 Years and over | 334 (100.0%) | 182 (54.5%) |
| Total | 1,641 (43.6%) | 1,655 (44.0%) |
Disability Status by Sex by Age in Metter
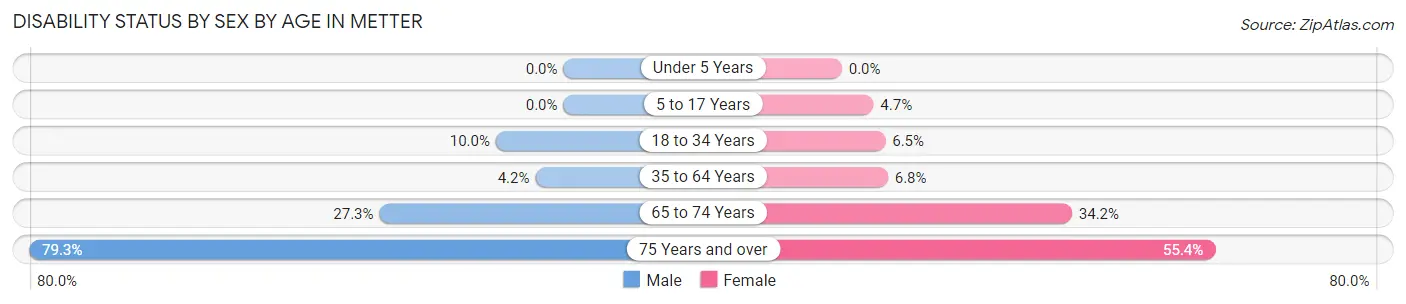
| Age Bracket | Male | Female |
| Under 5 Years | 0 (0.0%) | 0 (0.0%) |
| 5 to 17 Years | 0 (0.0%) | 16 (4.7%) |
| 18 to 34 Years | 29 (10.0%) | 19 (6.5%) |
| 35 to 64 Years | 30 (4.2%) | 54 (6.8%) |
| 65 to 74 Years | 53 (27.3%) | 110 (34.2%) |
| 75 Years and over | 119 (79.3%) | 102 (55.4%) |
Disability Class by Sex by Age in Metter
Disability Class: Hearing Difficulty
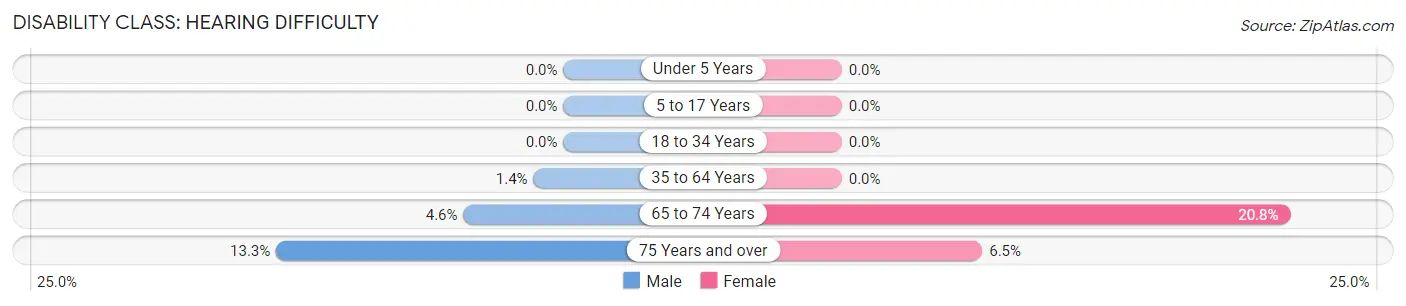
| Age Bracket | Male | Female |
| Under 5 Years | 0 (0.0%) | 0 (0.0%) |
| 5 to 17 Years | 0 (0.0%) | 0 (0.0%) |
| 18 to 34 Years | 0 (0.0%) | 0 (0.0%) |
| 35 to 64 Years | 10 (1.4%) | 0 (0.0%) |
| 65 to 74 Years | 9 (4.6%) | 67 (20.8%) |
| 75 Years and over | 20 (13.3%) | 12 (6.5%) |
Disability Class: Vision Difficulty
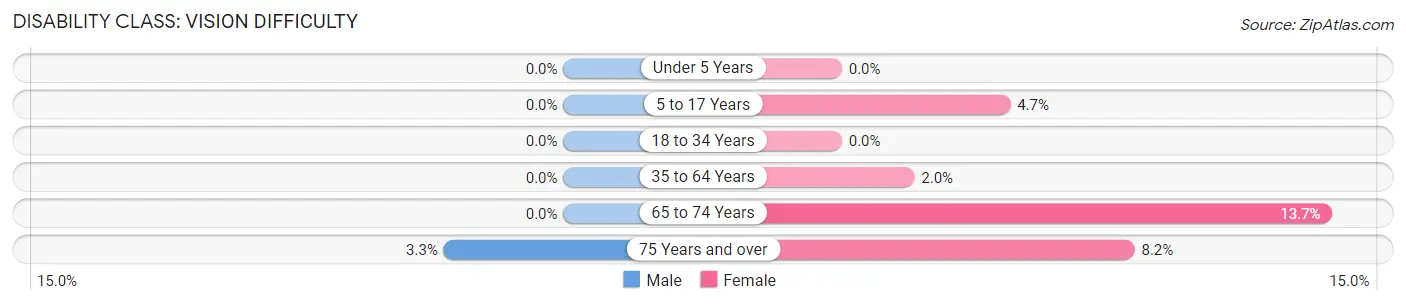
| Age Bracket | Male | Female |
| Under 5 Years | 0 (0.0%) | 0 (0.0%) |
| 5 to 17 Years | 0 (0.0%) | 16 (4.7%) |
| 18 to 34 Years | 0 (0.0%) | 0 (0.0%) |
| 35 to 64 Years | 0 (0.0%) | 16 (2.0%) |
| 65 to 74 Years | 0 (0.0%) | 44 (13.7%) |
| 75 Years and over | 5 (3.3%) | 15 (8.2%) |
Disability Class: Cognitive Difficulty
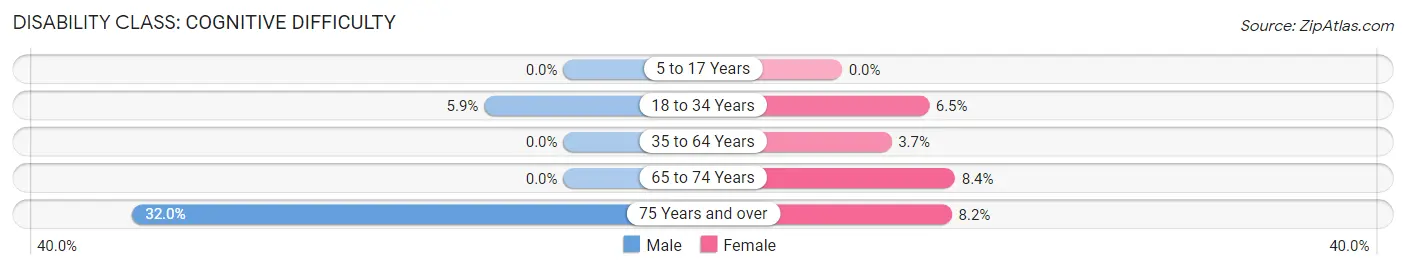
| Age Bracket | Male | Female |
| 5 to 17 Years | 0 (0.0%) | 0 (0.0%) |
| 18 to 34 Years | 17 (5.9%) | 19 (6.5%) |
| 35 to 64 Years | 0 (0.0%) | 29 (3.7%) |
| 65 to 74 Years | 0 (0.0%) | 27 (8.4%) |
| 75 Years and over | 48 (32.0%) | 15 (8.2%) |
Disability Class: Ambulatory Difficulty
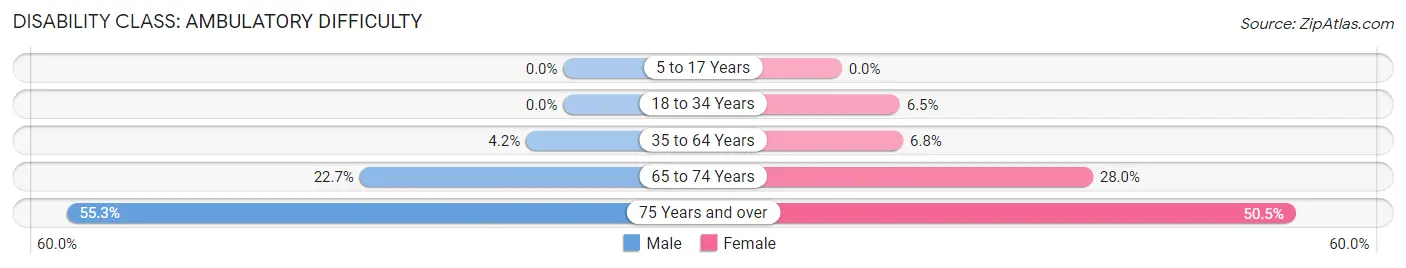
| Age Bracket | Male | Female |
| 5 to 17 Years | 0 (0.0%) | 0 (0.0%) |
| 18 to 34 Years | 0 (0.0%) | 19 (6.5%) |
| 35 to 64 Years | 30 (4.2%) | 54 (6.8%) |
| 65 to 74 Years | 44 (22.7%) | 90 (28.0%) |
| 75 Years and over | 83 (55.3%) | 93 (50.5%) |
Disability Class: Self-Care Difficulty
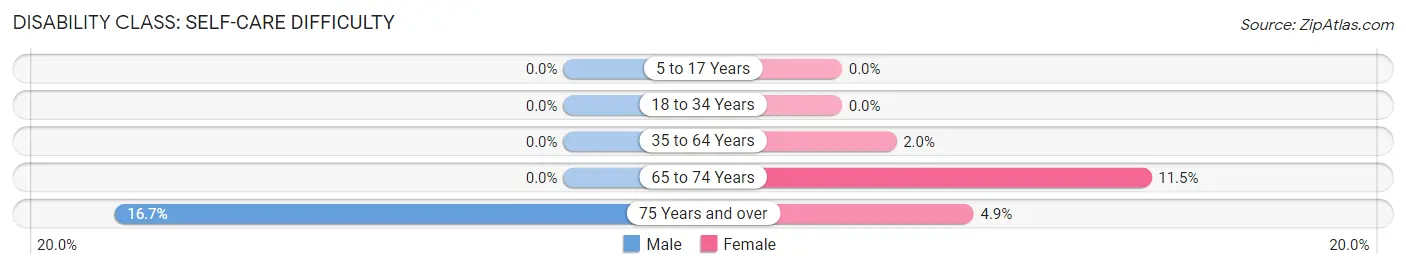
| Age Bracket | Male | Female |
| 5 to 17 Years | 0 (0.0%) | 0 (0.0%) |
| 18 to 34 Years | 0 (0.0%) | 0 (0.0%) |
| 35 to 64 Years | 0 (0.0%) | 16 (2.0%) |
| 65 to 74 Years | 0 (0.0%) | 37 (11.5%) |
| 75 Years and over | 25 (16.7%) | 9 (4.9%) |
Technology Access in Metter
Computing Device Access in Metter
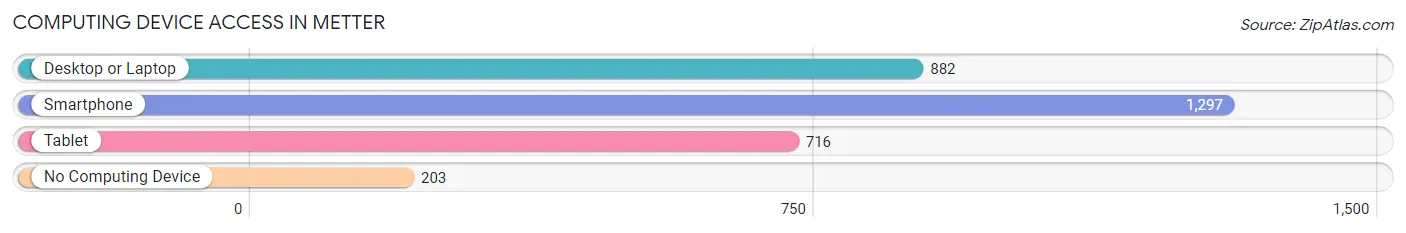
| Device Type | # Households | % Households |
| Desktop or Laptop | 882 | 54.2% |
| Smartphone | 1,297 | 79.7% |
| Tablet | 716 | 44.0% |
| No Computing Device | 203 | 12.5% |
| Total | 1,628 | 100.0% |
Internet Access in Metter
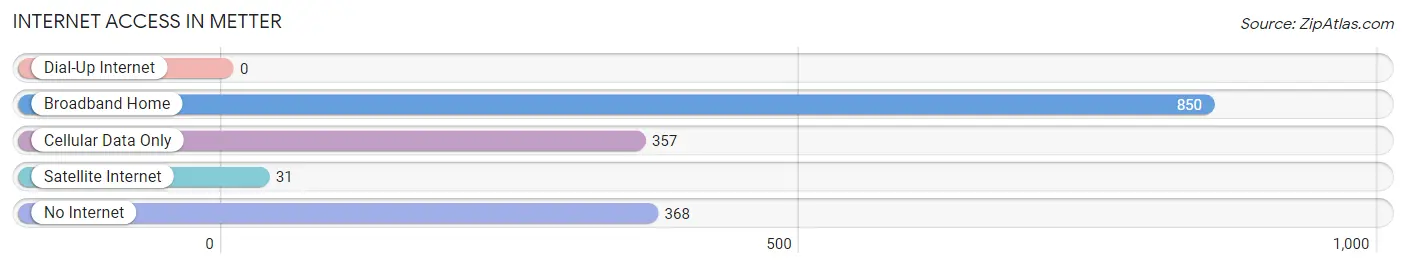
| Internet Type | # Households | % Households |
| Dial-Up Internet | 0 | 0.0% |
| Broadband Home | 850 | 52.2% |
| Cellular Data Only | 357 | 21.9% |
| Satellite Internet | 31 | 1.9% |
| No Internet | 368 | 22.6% |
| Total | 1,628 | 100.0% |
Metter Summary
Metter, Georgia is a small city located in Candler County, Georgia. It is situated in the southeastern part of the state, about halfway between Savannah and Macon. The city has a population of approximately 3,000 people and is the county seat of Candler County.
Metter was founded in 1873 by a group of settlers from South Carolina. The city was named after a local family, the Metters, who had a large plantation in the area. The city was incorporated in 1883 and has since grown to become a thriving community.
Geographically, Metter is located in the Coastal Plain region of Georgia. The city is situated on the Ogeechee River, which provides a natural border between Candler and Bulloch counties. The city is surrounded by a number of small towns and rural areas, including Pulaski, Garfield, and Twin City.
Metter has a humid subtropical climate, with hot, humid summers and mild winters. The average annual temperature is around 70 degrees Fahrenheit, with temperatures reaching as high as 95 degrees in the summer and as low as 25 degrees in the winter. The city receives an average of 48 inches of rain per year.
The economy of Metter is largely based on agriculture. The city is home to a number of farms, including poultry, beef, and dairy farms. The city also has a number of manufacturing and industrial businesses, including a paper mill, a furniture factory, and a plastics plant. The city is also home to a number of retail stores, restaurants, and other businesses.
Metter has a diverse population, with a mix of African American, Caucasian, Hispanic, and Asian residents. The city has a median household income of $30,000, and the poverty rate is around 20%. The city is served by the Candler County School System, which includes four elementary schools, one middle school, and one high school.
Metter is a small city with a rich history and a vibrant economy. The city is home to a diverse population and is a great place to live and work. With its close proximity to Savannah and Macon, Metter is an ideal location for those looking to experience the best of both worlds.
Common Questions
What is Per Capita Income in Metter?
Per Capita income in Metter is $20,939.
What is the Median Family Income in Metter?
Median Family Income in Metter is $48,000.
What is the Median Household income in Metter?
Median Household Income in Metter is $31,786.
What is Income or Wage Gap in Metter?
Income or Wage Gap in Metter is 49.5%.
Women in Metter earn 50.5 cents for every dollar earned by a man.
What is Inequality or Gini Index in Metter?
Inequality or Gini Index in Metter is 0.45.
What is the Total Population of Metter?
Total Population of Metter is 3,976.
What is the Total Male Population of Metter?
Total Male Population of Metter is 1,817.
What is the Total Female Population of Metter?
Total Female Population of Metter is 2,159.
What is the Ratio of Males per 100 Females in Metter?
There are 84.16 Males per 100 Females in Metter.
What is the Ratio of Females per 100 Males in Metter?
There are 118.82 Females per 100 Males in Metter.
What is the Median Population Age in Metter?
Median Population Age in Metter is 46.2 Years.
What is the Average Family Size in Metter
Average Family Size in Metter is 3.2 People.
What is the Average Household Size in Metter
Average Household Size in Metter is 2.3 People.
How Large is the Labor Force in Metter?
There are 1,571 People in the Labor Forcein in Metter.
What is the Percentage of People in the Labor Force in Metter?
47.6% of People are in the Labor Force in Metter.
What is the Unemployment Rate in Metter?
Unemployment Rate in Metter is 5.9%.