Skidaway Island, GA Map & Demographics
Skidaway Island Map
Skidaway Island Overview
$86,178
PER CAPITA INCOME
$165,772
AVG FAMILY INCOME
$119,210
AVG HOUSEHOLD INCOME
54.8%
WAGE / INCOME GAP [ % ]
45.2¢/ $1
WAGE / INCOME GAP [ $ ]
$1,700
FAMILY INCOME DEFICIT
0.46
INEQUALITY / GINI INDEX
9,292
TOTAL POPULATION
4,439
MALE POPULATION
4,853
FEMALE POPULATION
91.47
MALES / 100 FEMALES
109.33
FEMALES / 100 MALES
66.3
MEDIAN AGE
2.5
AVG FAMILY SIZE
2.1
AVG HOUSEHOLD SIZE
2,945
LABOR FORCE [ PEOPLE ]
35.4%
PERCENT IN LABOR FORCE
6.9%
UNEMPLOYMENT RATE
Income in Skidaway Island
Income Overview in Skidaway Island
Per Capita Income in Skidaway Island is $86,178, while median incomes of families and households are $165,772 and $119,210 respectively.
| Characteristic | Number | Measure |
| Per Capita Income | 9,292 | $86,178 |
| Median Family Income | 3,153 | $165,772 |
| Mean Family Income | 3,153 | $212,776 |
| Median Household Income | 4,481 | $119,210 |
| Mean Household Income | 4,481 | $180,870 |
| Income Deficit | 3,153 | $1,700 |
| Wage / Income Gap (%) | 9,292 | 54.76% |
| Wage / Income Gap ($) | 9,292 | 45.24¢ per $1 |
| Gini / Inequality Index | 9,292 | 0.46 |
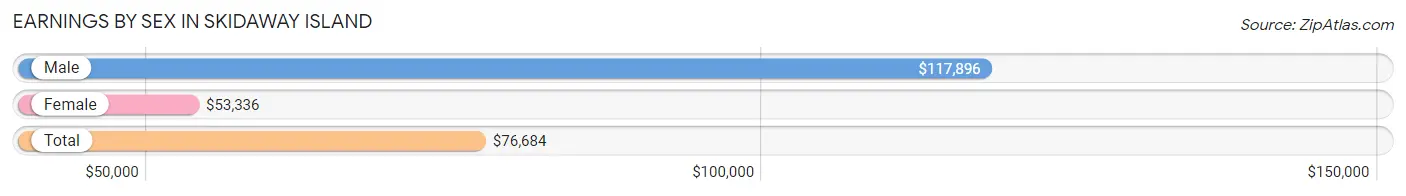
Earnings by Sex in Skidaway Island
Average Earnings in Skidaway Island are $76,684, $117,896 for men and $53,336 for women, a difference of 54.8%.
| Sex | Number | Average Earnings |
| Male | 1,637 (53.7%) | $117,896 |
| Female | 1,411 (46.3%) | $53,336 |
| Total | 3,048 (100.0%) | $76,684 |
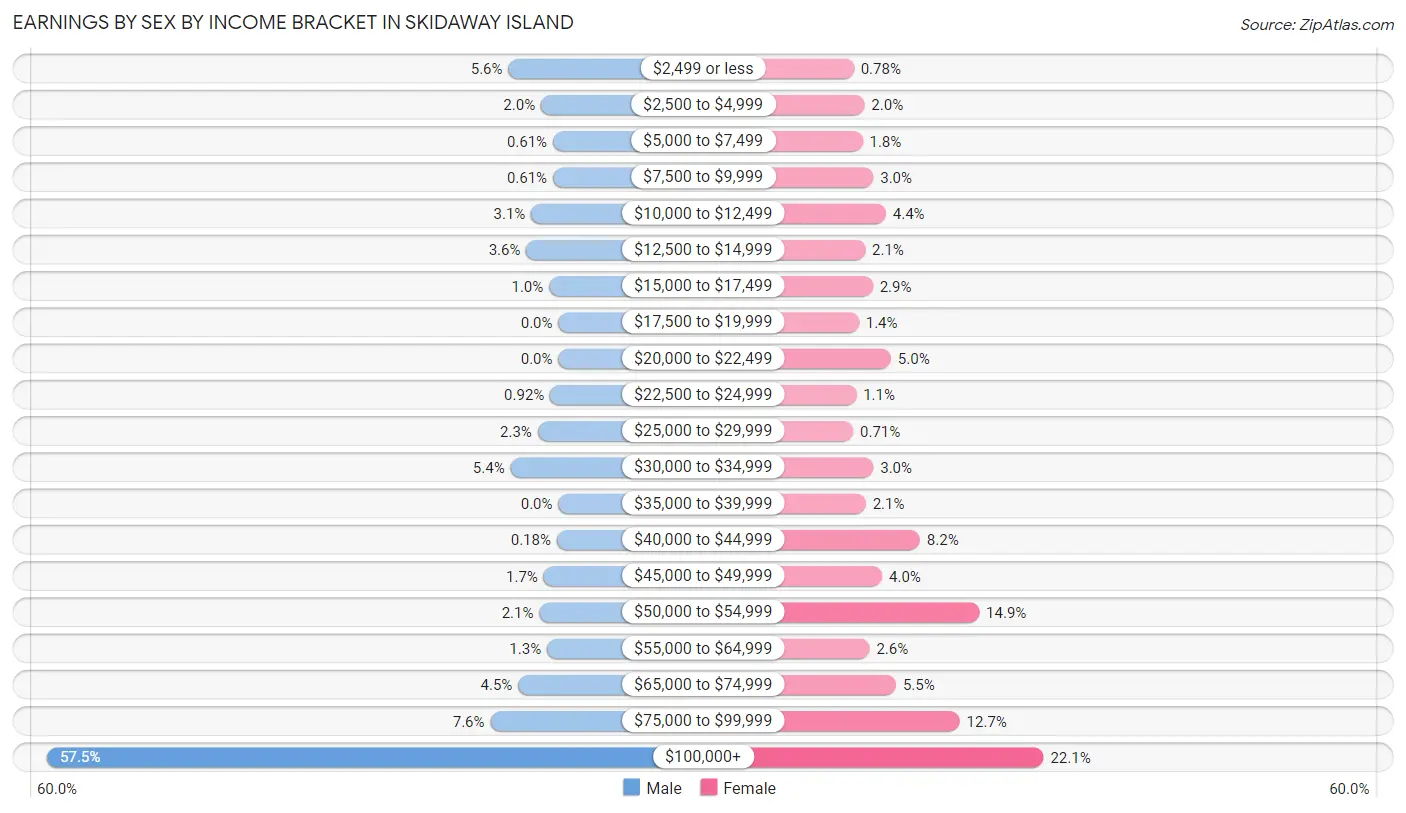
Earnings by Sex by Income Bracket in Skidaway Island
The most common earnings brackets in Skidaway Island are $100,000+ for men (941 | 57.5%) and $100,000+ for women (312 | 22.1%).
| Income | Male | Female |
| $2,499 or less | 92 (5.6%) | 11 (0.8%) |
| $2,500 to $4,999 | 32 (1.9%) | 28 (2.0%) |
| $5,000 to $7,499 | 10 (0.6%) | 25 (1.8%) |
| $7,500 to $9,999 | 10 (0.6%) | 42 (3.0%) |
| $10,000 to $12,499 | 50 (3.0%) | 62 (4.4%) |
| $12,500 to $14,999 | 59 (3.6%) | 29 (2.1%) |
| $15,000 to $17,499 | 17 (1.0%) | 41 (2.9%) |
| $17,500 to $19,999 | 0 (0.0%) | 19 (1.3%) |
| $20,000 to $22,499 | 0 (0.0%) | 70 (5.0%) |
| $22,500 to $24,999 | 15 (0.9%) | 15 (1.1%) |
| $25,000 to $29,999 | 38 (2.3%) | 10 (0.7%) |
| $30,000 to $34,999 | 88 (5.4%) | 42 (3.0%) |
| $35,000 to $39,999 | 0 (0.0%) | 30 (2.1%) |
| $40,000 to $44,999 | 3 (0.2%) | 116 (8.2%) |
| $45,000 to $49,999 | 27 (1.7%) | 56 (4.0%) |
| $50,000 to $54,999 | 35 (2.1%) | 210 (14.9%) |
| $55,000 to $64,999 | 21 (1.3%) | 36 (2.5%) |
| $65,000 to $74,999 | 74 (4.5%) | 78 (5.5%) |
| $75,000 to $99,999 | 125 (7.6%) | 179 (12.7%) |
| $100,000+ | 941 (57.5%) | 312 (22.1%) |
| Total | 1,637 (100.0%) | 1,411 (100.0%) |
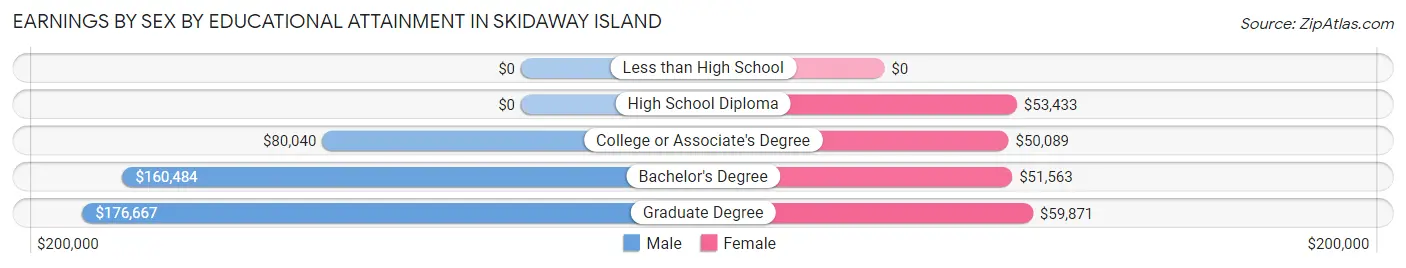
Earnings by Sex by Educational Attainment in Skidaway Island
Average earnings in Skidaway Island are $148,083 for men and $53,700 for women, a difference of 63.7%. Men with an educational attainment of graduate degree enjoy the highest average annual earnings of $176,667, while those with college or associate's degree education earn the least with $80,040. Women with an educational attainment of graduate degree earn the most with the average annual earnings of $59,871, while those with college or associate's degree education have the smallest earnings of $50,089.
| Educational Attainment | Male Income | Female Income |
| Less than High School | - | - |
| High School Diploma | - | - |
| College or Associate's Degree | $80,040 | $50,089 |
| Bachelor's Degree | $160,484 | $51,563 |
| Graduate Degree | $176,667 | $59,871 |
| Total | $148,083 | $53,700 |
Family Income in Skidaway Island
Family Income Brackets in Skidaway Island
According to the Skidaway Island family income data, there are 1,145 families falling into the $200,000+ income range, which is the most common income bracket and makes up 36.3% of all families. Conversely, the less than $10,000 income bracket is the least frequent group with only 9 families (0.3%) belonging to this category.
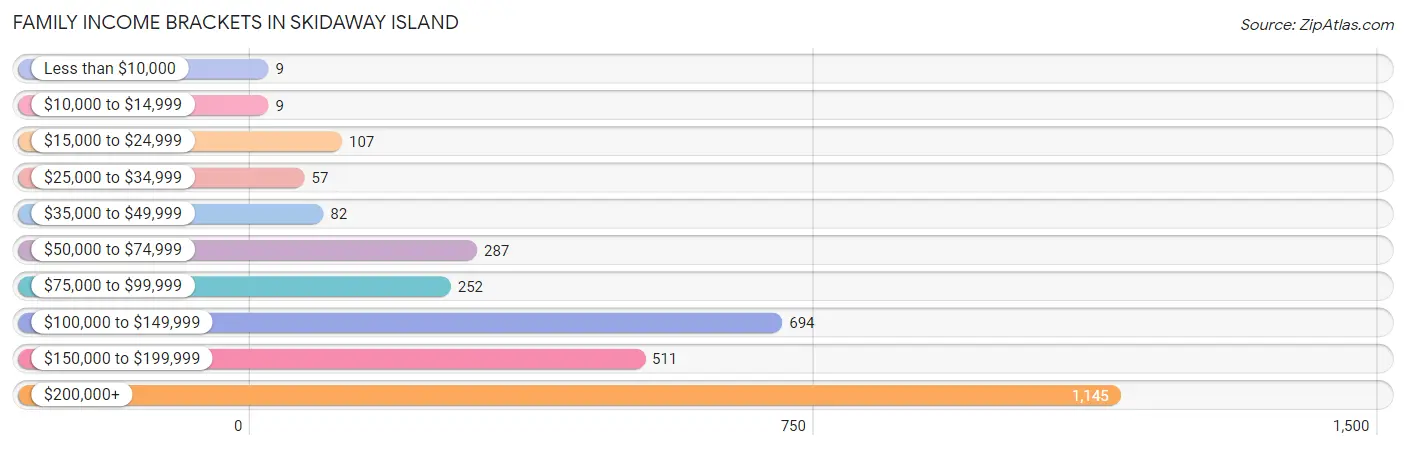
| Income Bracket | # Families | % Families |
| Less than $10,000 | 9 | 0.3% |
| $10,000 to $14,999 | 9 | 0.3% |
| $15,000 to $24,999 | 107 | 3.4% |
| $25,000 to $34,999 | 57 | 1.8% |
| $35,000 to $49,999 | 82 | 2.6% |
| $50,000 to $74,999 | 287 | 9.1% |
| $75,000 to $99,999 | 252 | 8.0% |
| $100,000 to $149,999 | 694 | 22.0% |
| $150,000 to $199,999 | 511 | 16.2% |
| $200,000+ | 1,145 | 36.3% |
Family Income by Famaliy Size in Skidaway Island
3-person families (236 | 7.5%) account for the highest median family income in Skidaway Island with $250,001 per family, while 3-person families (236 | 7.5%) have the highest median income of $83,334 per family member.
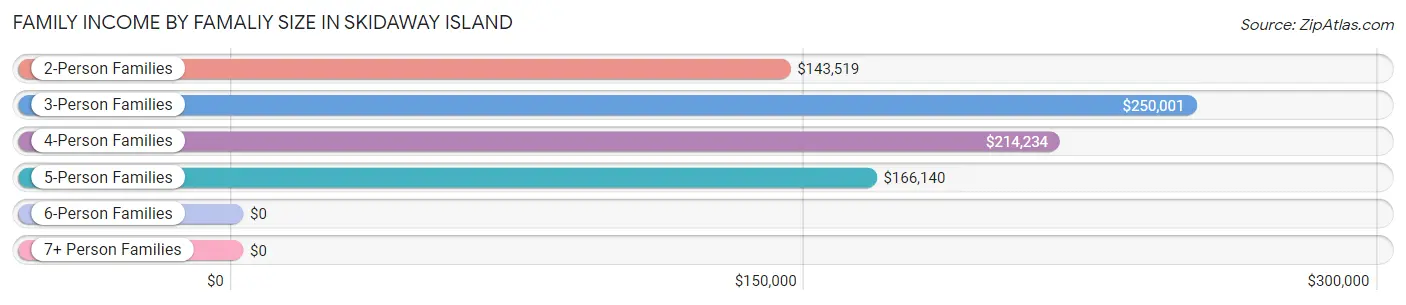
| Income Bracket | # Families | Median Income |
| 2-Person Families | 2,504 (79.4%) | $143,519 |
| 3-Person Families | 236 (7.5%) | $250,001 |
| 4-Person Families | 238 (7.5%) | $214,234 |
| 5-Person Families | 142 (4.5%) | $166,140 |
| 6-Person Families | 33 (1.1%) | $0 |
| 7+ Person Families | 0 (0.0%) | $0 |
| Total | 3,153 (100.0%) | $165,772 |
Family Income by Number of Earners in Skidaway Island
The median family income in Skidaway Island is $165,772, with families comprising 3+ earners (72) having the highest median family income of $250,001, while families with no earners (1,506) have the lowest median family income of $131,991, accounting for 2.3% and 47.8% of families, respectively.
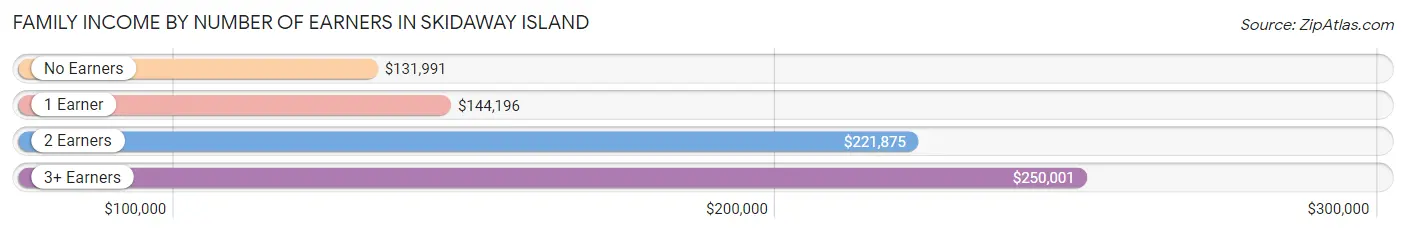
| Number of Earners | # Families | Median Income |
| No Earners | 1,506 (47.8%) | $131,991 |
| 1 Earner | 843 (26.7%) | $144,196 |
| 2 Earners | 732 (23.2%) | $221,875 |
| 3+ Earners | 72 (2.3%) | $250,001 |
| Total | 3,153 (100.0%) | $165,772 |
Household Income in Skidaway Island
Household Income Brackets in Skidaway Island
With 1,228 households falling in the category, the $200,000+ income range is the most frequent in Skidaway Island, accounting for 27.4% of all households. In contrast, only 18 households (0.4%) fall into the $10,000 to $14,999 income bracket, making it the least populous group.
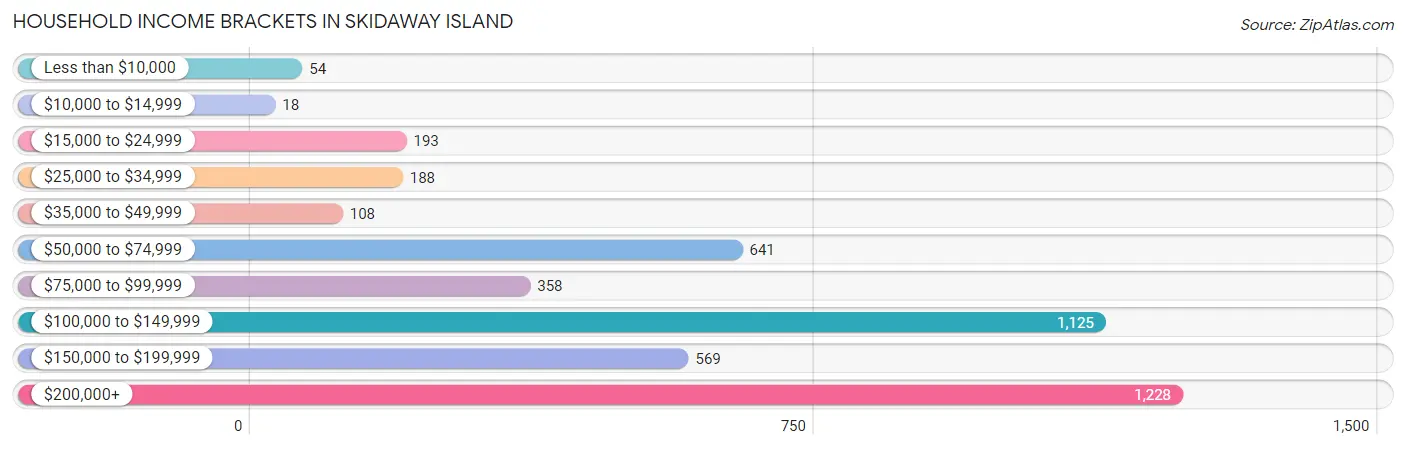
| Income Bracket | # Households | % Households |
| Less than $10,000 | 54 | 1.2% |
| $10,000 to $14,999 | 18 | 0.4% |
| $15,000 to $24,999 | 193 | 4.3% |
| $25,000 to $34,999 | 188 | 4.2% |
| $35,000 to $49,999 | 108 | 2.4% |
| $50,000 to $74,999 | 641 | 14.3% |
| $75,000 to $99,999 | 358 | 8.0% |
| $100,000 to $149,999 | 1,125 | 25.1% |
| $150,000 to $199,999 | 569 | 12.7% |
| $200,000+ | 1,228 | 27.4% |
Household Income by Householder Age in Skidaway Island
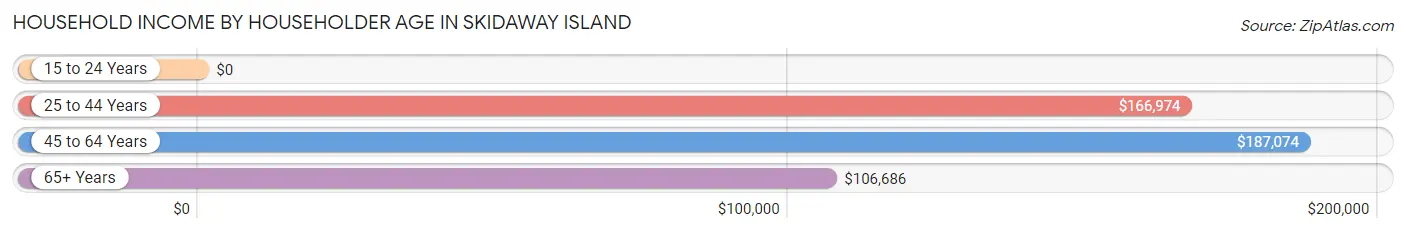
The median household income in Skidaway Island is $119,210, with the highest median household income of $187,074 found in the 45 to 64 years age bracket for the primary householder. A total of 1,080 households (24.1%) fall into this category.
| Income Bracket | # Households | Median Income |
| 15 to 24 Years | 0 (0.0%) | $0 |
| 25 to 44 Years | 426 (9.5%) | $166,974 |
| 45 to 64 Years | 1,080 (24.1%) | $187,074 |
| 65+ Years | 2,975 (66.4%) | $106,686 |
| Total | 4,481 (100.0%) | $119,210 |
Poverty in Skidaway Island
Income Below Poverty by Sex and Age in Skidaway Island
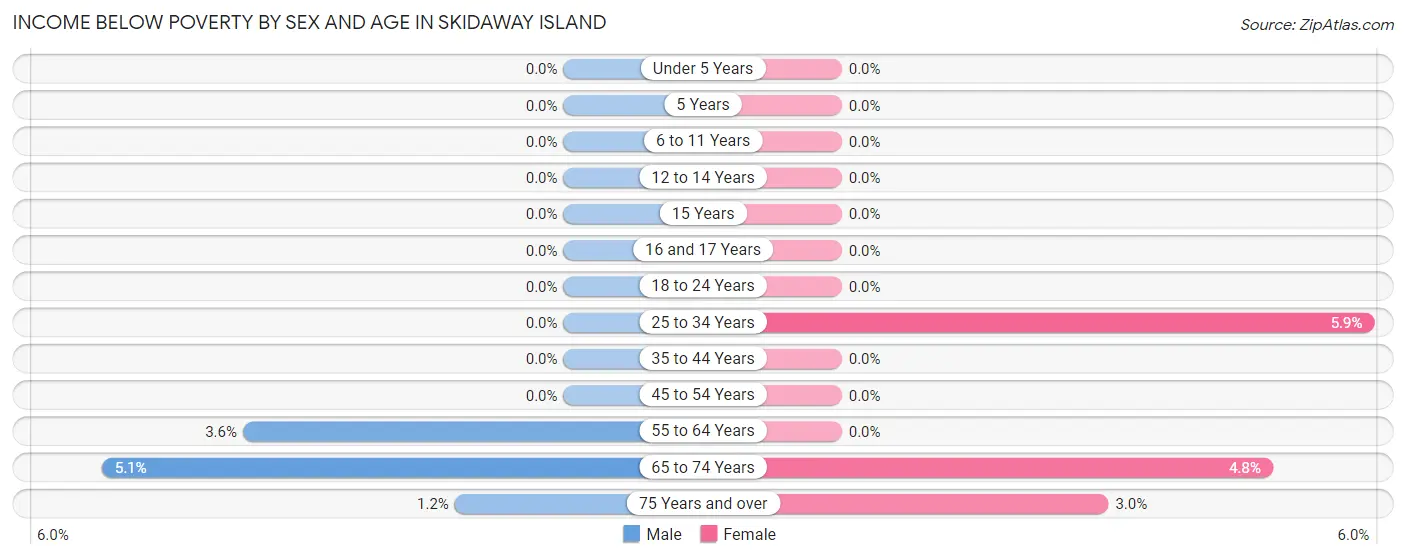
With 2.2% poverty level for males and 2.2% for females among the residents of Skidaway Island, 65 to 74 year old males and 25 to 34 year old females are the most vulnerable to poverty, with 63 males (5.1%) and 7 females (5.9%) in their respective age groups living below the poverty level.
| Age Bracket | Male | Female |
| Under 5 Years | 0 (0.0%) | 0 (0.0%) |
| 5 Years | 0 (0.0%) | 0 (0.0%) |
| 6 to 11 Years | 0 (0.0%) | 0 (0.0%) |
| 12 to 14 Years | 0 (0.0%) | 0 (0.0%) |
| 15 Years | 0 (0.0%) | 0 (0.0%) |
| 16 and 17 Years | 0 (0.0%) | 0 (0.0%) |
| 18 to 24 Years | 0 (0.0%) | 0 (0.0%) |
| 25 to 34 Years | 0 (0.0%) | 7 (5.9%) |
| 35 to 44 Years | 0 (0.0%) | 0 (0.0%) |
| 45 to 54 Years | 0 (0.0%) | 0 (0.0%) |
| 55 to 64 Years | 22 (3.6%) | 0 (0.0%) |
| 65 to 74 Years | 63 (5.1%) | 62 (4.8%) |
| 75 Years and over | 13 (1.2%) | 35 (3.0%) |
| Total | 98 (2.2%) | 104 (2.2%) |
Income Above Poverty by Sex and Age in Skidaway Island
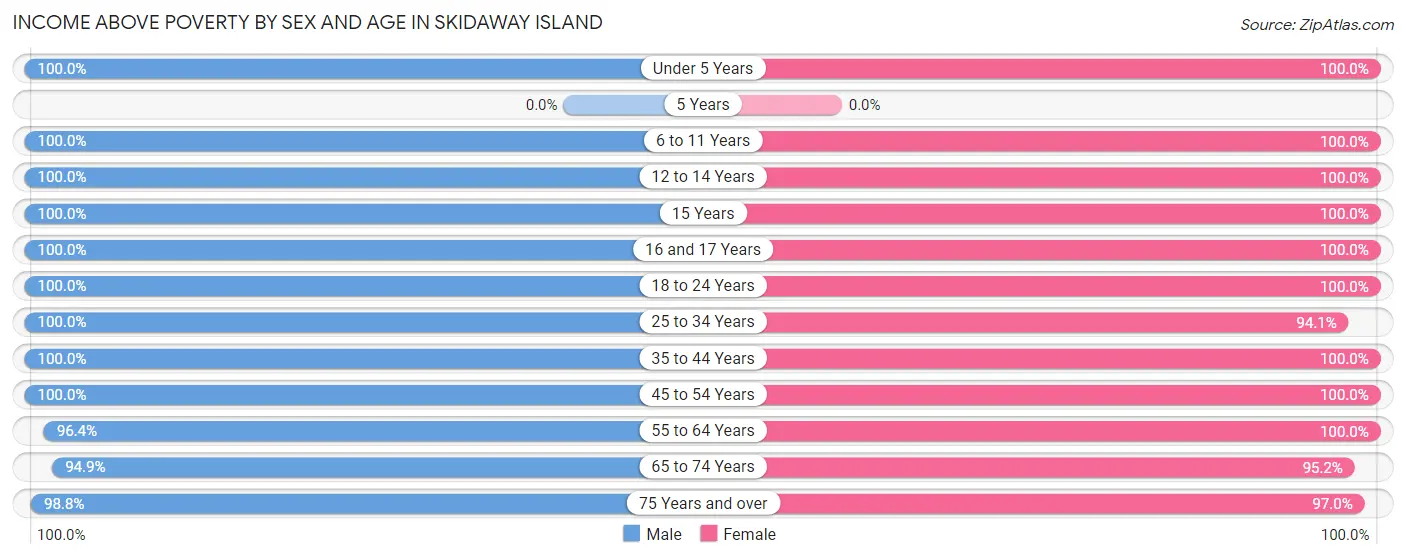
According to the poverty statistics in Skidaway Island, males aged under 5 years and females aged under 5 years are the age groups that are most secure financially, with 100.0% of males and 100.0% of females in these age groups living above the poverty line.
| Age Bracket | Male | Female |
| Under 5 Years | 141 (100.0%) | 104 (100.0%) |
| 5 Years | 0 (0.0%) | 0 (0.0%) |
| 6 to 11 Years | 114 (100.0%) | 227 (100.0%) |
| 12 to 14 Years | 169 (100.0%) | 73 (100.0%) |
| 15 Years | 66 (100.0%) | 80 (100.0%) |
| 16 and 17 Years | 104 (100.0%) | 18 (100.0%) |
| 18 to 24 Years | 107 (100.0%) | 107 (100.0%) |
| 25 to 34 Years | 199 (100.0%) | 111 (94.1%) |
| 35 to 44 Years | 237 (100.0%) | 338 (100.0%) |
| 45 to 54 Years | 380 (100.0%) | 336 (100.0%) |
| 55 to 64 Years | 595 (96.4%) | 953 (100.0%) |
| 65 to 74 Years | 1,162 (94.9%) | 1,229 (95.2%) |
| 75 Years and over | 1,064 (98.8%) | 1,143 (97.0%) |
| Total | 4,338 (97.8%) | 4,719 (97.8%) |
Income Below Poverty Among Married-Couple Families in Skidaway Island
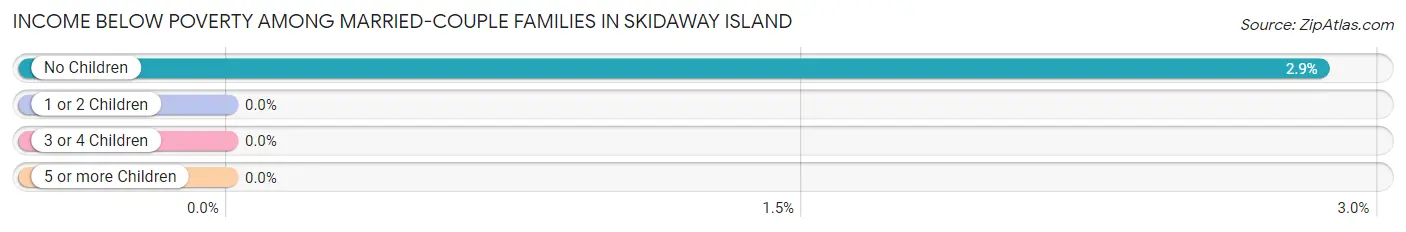
The poverty statistics for married-couple families in Skidaway Island show that 2.4% or 71 of the total 2,953 families live below the poverty line. Families with no children have the highest poverty rate of 2.9%, comprising of 71 families. On the other hand, families with 1 or 2 children have the lowest poverty rate of 0.0%, which includes 0 families.
| Children | Above Poverty | Below Poverty |
| No Children | 2,417 (97.2%) | 71 (2.9%) |
| 1 or 2 Children | 358 (100.0%) | 0 (0.0%) |
| 3 or 4 Children | 107 (100.0%) | 0 (0.0%) |
| 5 or more Children | 0 (0.0%) | 0 (0.0%) |
| Total | 2,882 (97.6%) | 71 (2.4%) |
Income Below Poverty Among Single-Parent Households in Skidaway Island
| Children | Single Father | Single Mother |
| No Children | 0 (0.0%) | 0 (0.0%) |
| 1 or 2 Children | 0 (0.0%) | 0 (0.0%) |
| 3 or 4 Children | 0 (0.0%) | 0 (0.0%) |
| 5 or more Children | 0 (0.0%) | 0 (0.0%) |
| Total | 0 (0.0%) | 0 (0.0%) |
Income Below Poverty Among Married-Couple vs Single-Parent Households in Skidaway Island
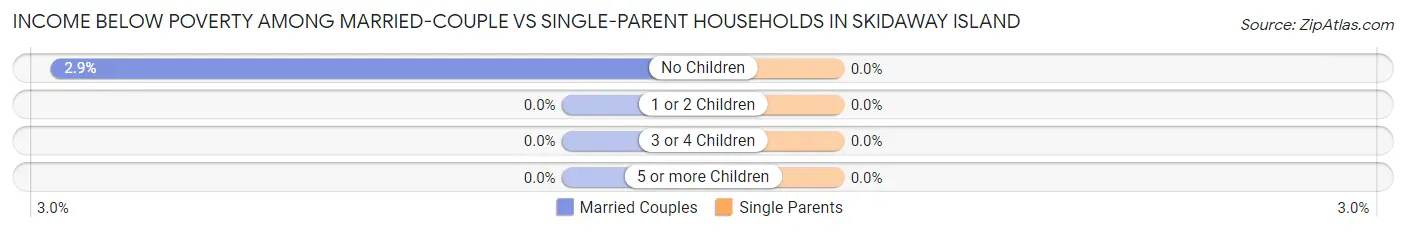
| Children | Married-Couple Families | Single-Parent Households |
| No Children | 71 (2.9%) | 0 (0.0%) |
| 1 or 2 Children | 0 (0.0%) | 0 (0.0%) |
| 3 or 4 Children | 0 (0.0%) | 0 (0.0%) |
| 5 or more Children | 0 (0.0%) | 0 (0.0%) |
| Total | 71 (2.4%) | 0 (0.0%) |
Race in Skidaway Island
The most populous races in Skidaway Island are White / Caucasian (8,083 | 87.0%), Two or more Races (483 | 5.2%), and Some other Race (344 | 3.7%).
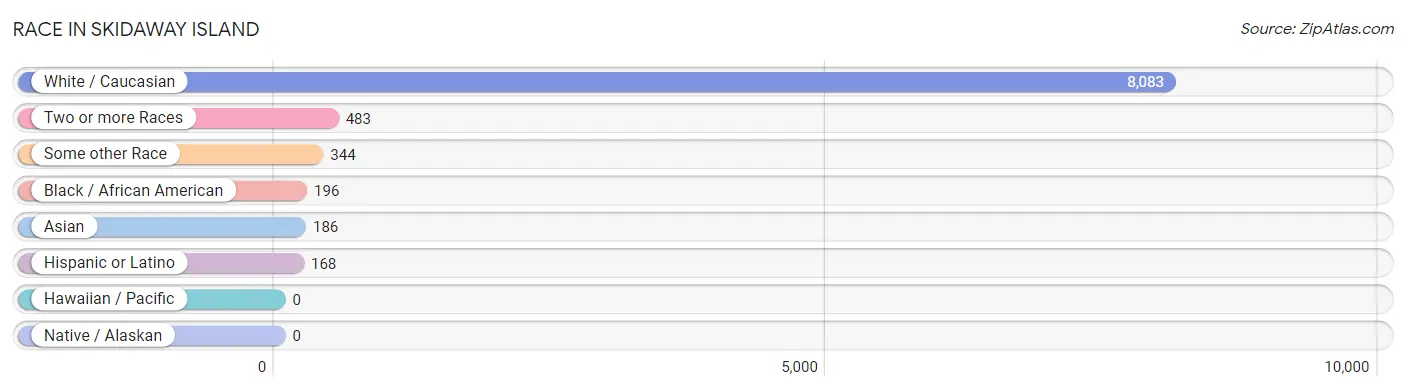
| Race | # Population | % Population |
| Asian | 186 | 2.0% |
| Black / African American | 196 | 2.1% |
| Hawaiian / Pacific | 0 | 0.0% |
| Hispanic or Latino | 168 | 1.8% |
| Native / Alaskan | 0 | 0.0% |
| White / Caucasian | 8,083 | 87.0% |
| Two or more Races | 483 | 5.2% |
| Some other Race | 344 | 3.7% |
| Total | 9,292 | 100.0% |
Ancestry in Skidaway Island
The most populous ancestries reported in Skidaway Island are English (1,914 | 20.6%), German (1,819 | 19.6%), Irish (1,490 | 16.0%), American (608 | 6.5%), and Italian (461 | 5.0%), together accounting for 67.7% of all Skidaway Island residents.
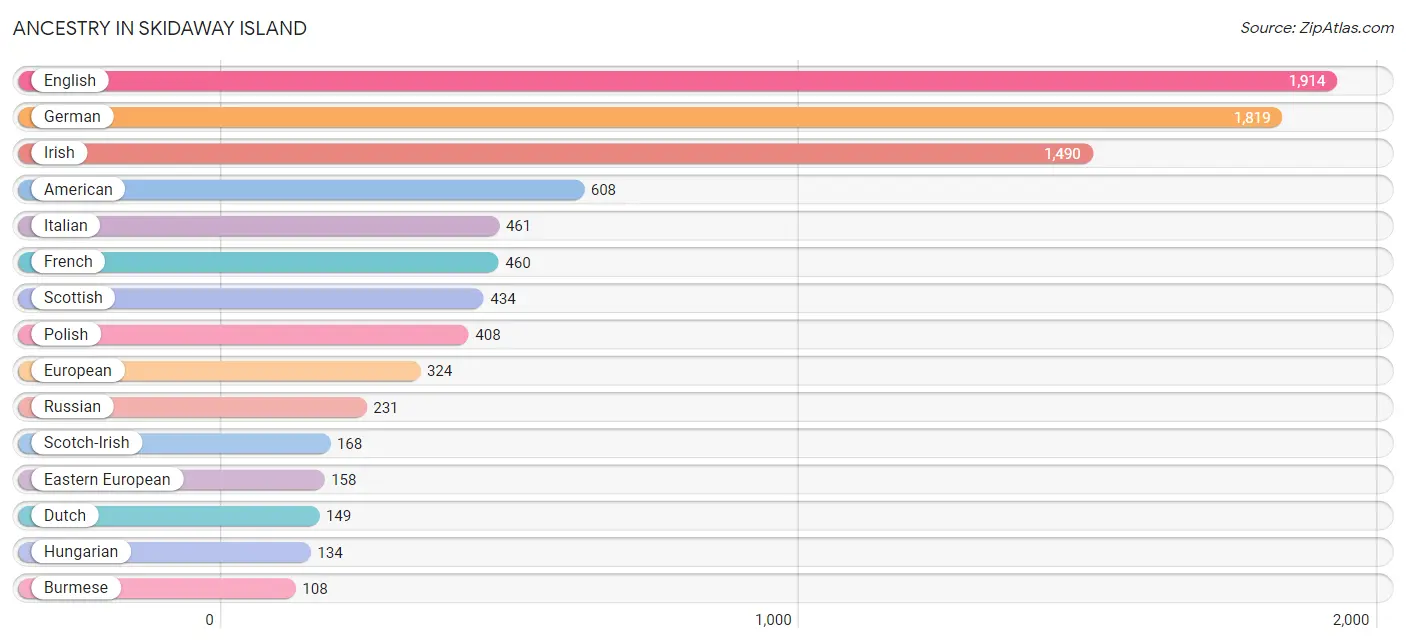
| Ancestry | # Population | % Population |
| American | 608 | 6.5% |
| Arab | 21 | 0.2% |
| Australian | 16 | 0.2% |
| Austrian | 40 | 0.4% |
| Belgian | 40 | 0.4% |
| Bhutanese | 12 | 0.1% |
| British | 45 | 0.5% |
| Burmese | 108 | 1.2% |
| Canadian | 22 | 0.2% |
| Cherokee | 54 | 0.6% |
| Cheyenne | 22 | 0.2% |
| Chilean | 10 | 0.1% |
| Croatian | 86 | 0.9% |
| Cuban | 12 | 0.1% |
| Czech | 27 | 0.3% |
| Czechoslovakian | 4 | 0.0% |
| Dutch | 149 | 1.6% |
| Eastern European | 158 | 1.7% |
| English | 1,914 | 20.6% |
| European | 324 | 3.5% |
| French | 460 | 5.0% |
| French Canadian | 58 | 0.6% |
| German | 1,819 | 19.6% |
| Greek | 9 | 0.1% |
| Haitian | 1 | 0.0% |
| Hungarian | 134 | 1.4% |
| Indian (Asian) | 7 | 0.1% |
| Iranian | 79 | 0.9% |
| Irish | 1,490 | 16.0% |
| Israeli | 16 | 0.2% |
| Italian | 461 | 5.0% |
| Lebanese | 21 | 0.2% |
| Lithuanian | 17 | 0.2% |
| Mexican | 50 | 0.5% |
| Native Hawaiian | 20 | 0.2% |
| Northern European | 53 | 0.6% |
| Norwegian | 64 | 0.7% |
| Pakistani | 47 | 0.5% |
| Polish | 408 | 4.4% |
| Portuguese | 12 | 0.1% |
| Puerto Rican | 48 | 0.5% |
| Russian | 231 | 2.5% |
| Scandinavian | 40 | 0.4% |
| Scotch-Irish | 168 | 1.8% |
| Scottish | 434 | 4.7% |
| South American | 10 | 0.1% |
| Spaniard | 48 | 0.5% |
| Swedish | 72 | 0.8% |
| Swiss | 17 | 0.2% |
| Thai | 59 | 0.6% |
| Ukrainian | 15 | 0.2% |
| Welsh | 65 | 0.7% | View All 52 Rows |
Immigrants in Skidaway Island
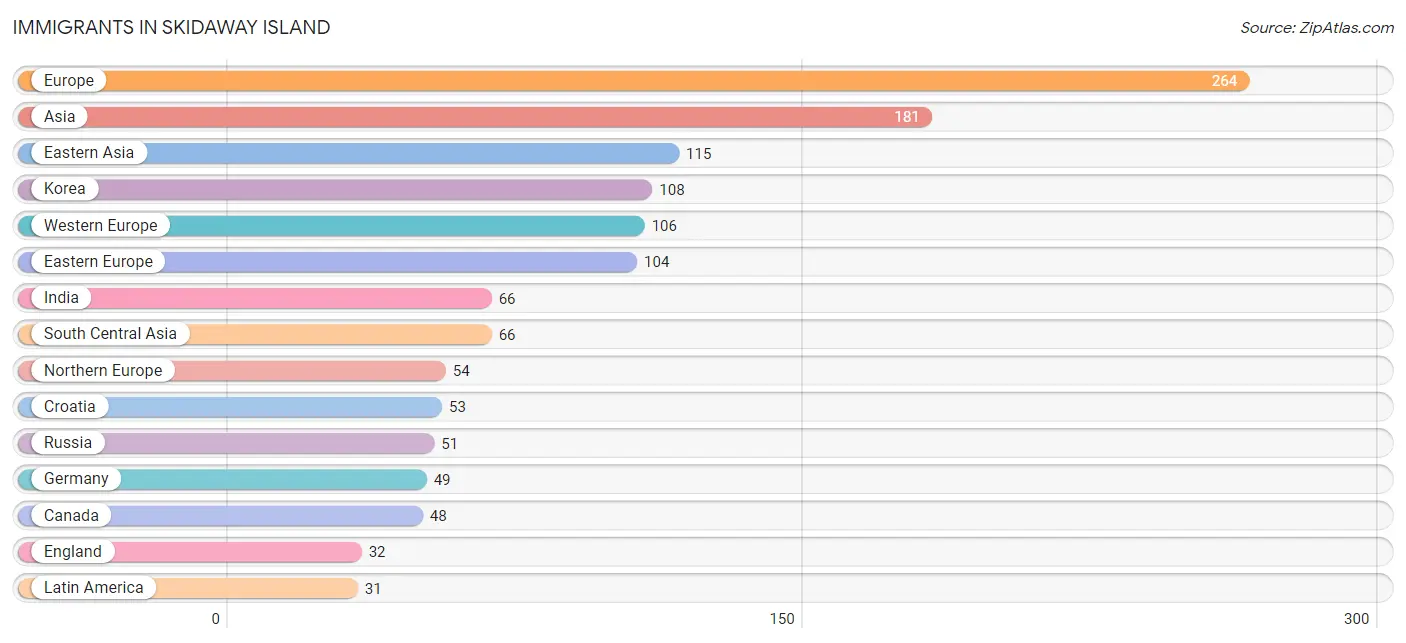
The most numerous immigrant groups reported in Skidaway Island came from Europe (264 | 2.8%), Asia (181 | 1.9%), Eastern Asia (115 | 1.2%), Korea (108 | 1.2%), and Western Europe (106 | 1.1%), together accounting for 8.3% of all Skidaway Island residents.
| Immigration Origin | # Population | % Population |
| Asia | 181 | 1.9% |
| Austria | 17 | 0.2% |
| Belgium | 19 | 0.2% |
| Brazil | 21 | 0.2% |
| Canada | 48 | 0.5% |
| Chile | 10 | 0.1% |
| China | 7 | 0.1% |
| Croatia | 53 | 0.6% |
| Eastern Asia | 115 | 1.2% |
| Eastern Europe | 104 | 1.1% |
| England | 32 | 0.3% |
| Europe | 264 | 2.8% |
| Germany | 49 | 0.5% |
| India | 66 | 0.7% |
| Korea | 108 | 1.2% |
| Latin America | 31 | 0.3% |
| Netherlands | 21 | 0.2% |
| Northern Europe | 54 | 0.6% |
| Russia | 51 | 0.5% |
| South America | 31 | 0.3% |
| South Central Asia | 66 | 0.7% |
| Western Europe | 106 | 1.1% | View All 22 Rows |
Sex and Age in Skidaway Island
Sex and Age in Skidaway Island
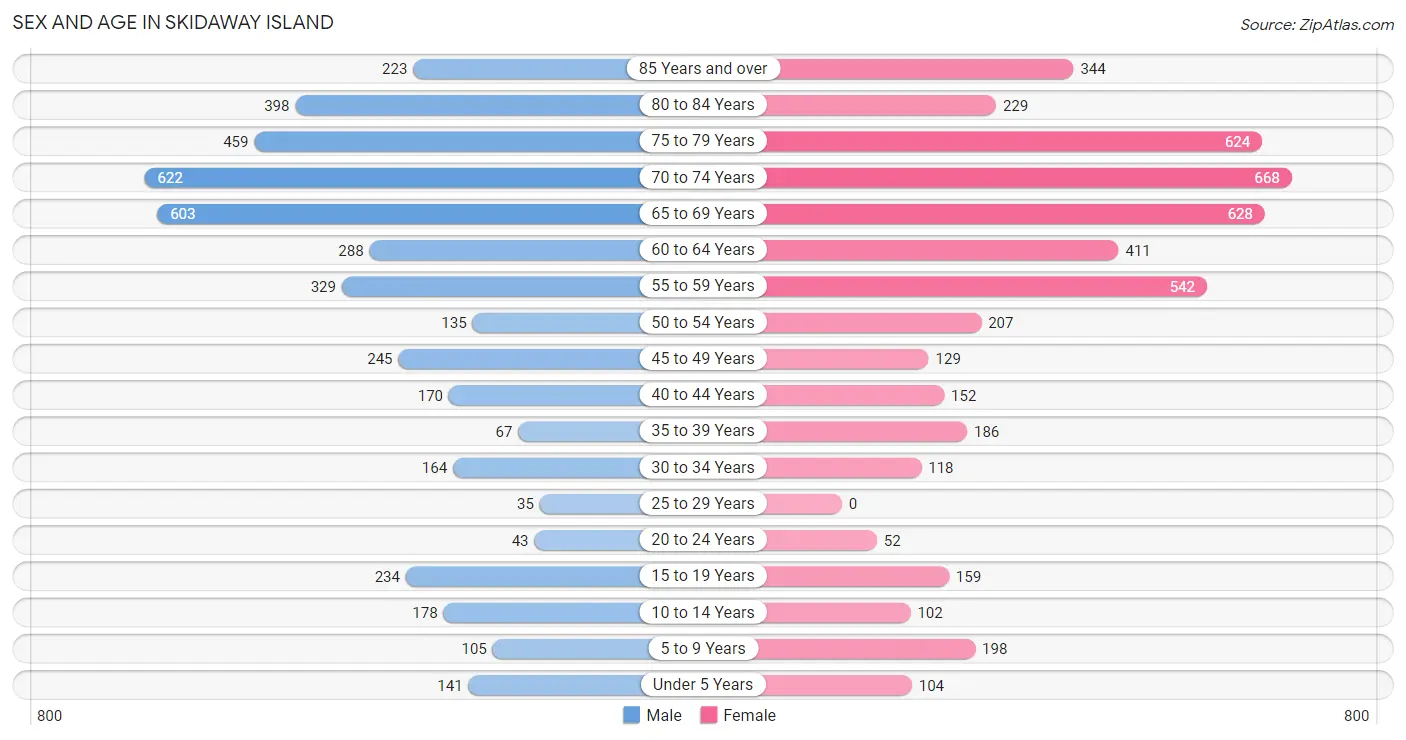
The most populous age groups in Skidaway Island are 70 to 74 Years (622 | 14.0%) for men and 70 to 74 Years (668 | 13.8%) for women.
| Age Bracket | Male | Female |
| Under 5 Years | 141 (3.2%) | 104 (2.1%) |
| 5 to 9 Years | 105 (2.4%) | 198 (4.1%) |
| 10 to 14 Years | 178 (4.0%) | 102 (2.1%) |
| 15 to 19 Years | 234 (5.3%) | 159 (3.3%) |
| 20 to 24 Years | 43 (1.0%) | 52 (1.1%) |
| 25 to 29 Years | 35 (0.8%) | 0 (0.0%) |
| 30 to 34 Years | 164 (3.7%) | 118 (2.4%) |
| 35 to 39 Years | 67 (1.5%) | 186 (3.8%) |
| 40 to 44 Years | 170 (3.8%) | 152 (3.1%) |
| 45 to 49 Years | 245 (5.5%) | 129 (2.7%) |
| 50 to 54 Years | 135 (3.0%) | 207 (4.3%) |
| 55 to 59 Years | 329 (7.4%) | 542 (11.2%) |
| 60 to 64 Years | 288 (6.5%) | 411 (8.5%) |
| 65 to 69 Years | 603 (13.6%) | 628 (12.9%) |
| 70 to 74 Years | 622 (14.0%) | 668 (13.8%) |
| 75 to 79 Years | 459 (10.3%) | 624 (12.9%) |
| 80 to 84 Years | 398 (9.0%) | 229 (4.7%) |
| 85 Years and over | 223 (5.0%) | 344 (7.1%) |
| Total | 4,439 (100.0%) | 4,853 (100.0%) |
Families and Households in Skidaway Island
Median Family Size in Skidaway Island
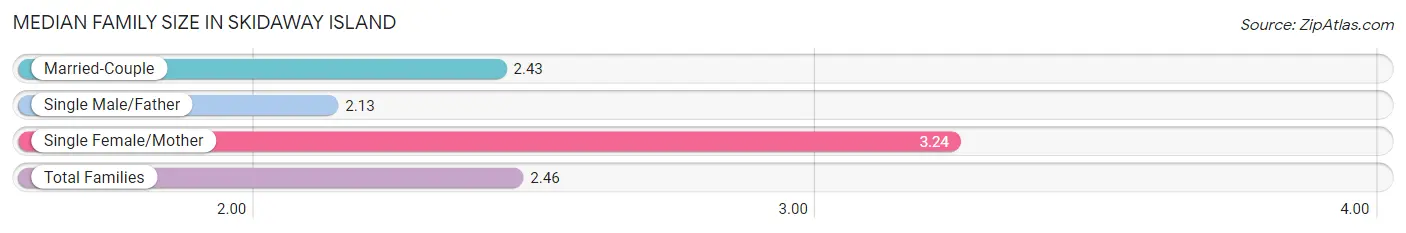
The median family size in Skidaway Island is 2.46 persons per family, with single female/mother families (146 | 4.6%) accounting for the largest median family size of 3.24 persons per family. On the other hand, single male/father families (54 | 1.7%) represent the smallest median family size with 2.13 persons per family.
| Family Type | # Families | Family Size |
| Married-Couple | 2,953 (93.7%) | 2.43 |
| Single Male/Father | 54 (1.7%) | 2.13 |
| Single Female/Mother | 146 (4.6%) | 3.24 |
| Total Families | 3,153 (100.0%) | 2.46 |
Median Household Size in Skidaway Island
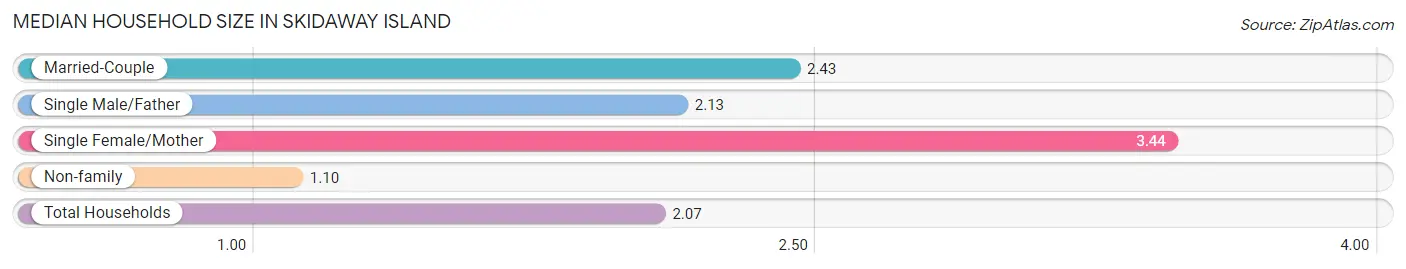
The median household size in Skidaway Island is 2.07 persons per household, with single female/mother households (146 | 3.3%) accounting for the largest median household size of 3.44 persons per household. non-family households (1,328 | 29.6%) represent the smallest median household size with 1.10 persons per household.
| Household Type | # Households | Household Size |
| Married-Couple | 2,953 (65.9%) | 2.43 |
| Single Male/Father | 54 (1.2%) | 2.13 |
| Single Female/Mother | 146 (3.3%) | 3.44 |
| Non-family | 1,328 (29.6%) | 1.10 |
| Total Households | 4,481 (100.0%) | 2.07 |
Household Size by Marriage Status in Skidaway Island
Out of a total of 4,481 households in Skidaway Island, 3,153 (70.4%) are family households, while 1,328 (29.6%) are nonfamily households. The most numerous type of family households are 2-person households, comprising 2,504, and the most common type of nonfamily households are 1-person households, comprising 974.
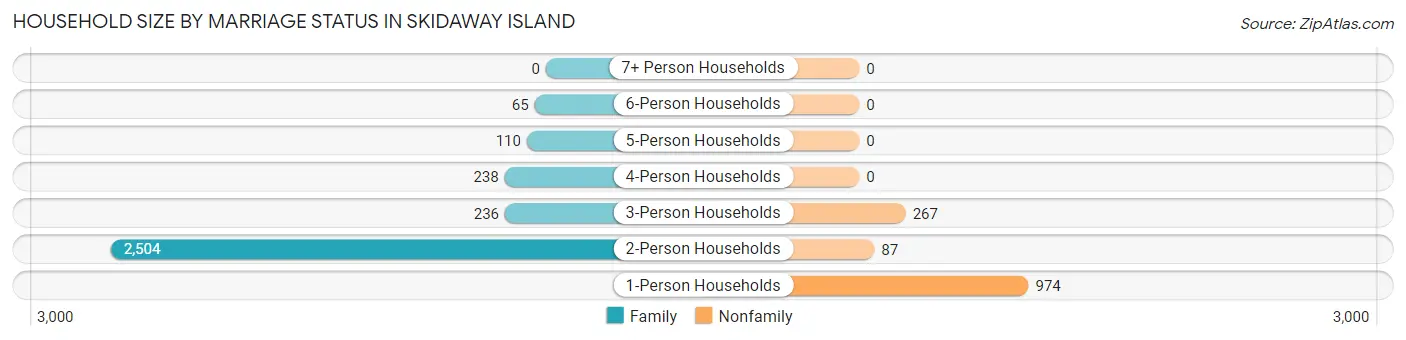
| Household Size | Family Households | Nonfamily Households |
| 1-Person Households | - | 974 (21.7%) |
| 2-Person Households | 2,504 (55.9%) | 87 (1.9%) |
| 3-Person Households | 236 (5.3%) | 267 (6.0%) |
| 4-Person Households | 238 (5.3%) | 0 (0.0%) |
| 5-Person Households | 110 (2.5%) | 0 (0.0%) |
| 6-Person Households | 65 (1.5%) | 0 (0.0%) |
| 7+ Person Households | 0 (0.0%) | 0 (0.0%) |
| Total | 3,153 (70.4%) | 1,328 (29.6%) |
Female Fertility in Skidaway Island
Fertility by Age in Skidaway Island
Average fertility rate in Skidaway Island is 23.0 births per 1,000 women. Women in the age bracket of 20 to 34 years have the highest fertility rate with 65.0 births per 1,000 women. Women in the age bracket of 20 to 34 years acount for 55.0% of all women with births.
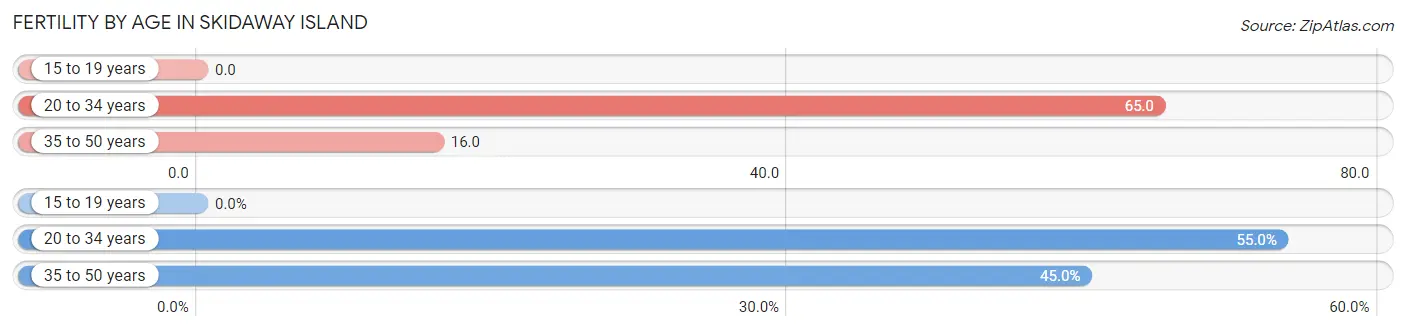
| Age Bracket | Women with Births | Births / 1,000 Women |
| 15 to 19 years | 0 (0.0%) | 0.0 |
| 20 to 34 years | 11 (55.0%) | 65.0 |
| 35 to 50 years | 9 (45.0%) | 16.0 |
| Total | 20 (100.0%) | 23.0 |
Fertility by Age by Marriage Status in Skidaway Island
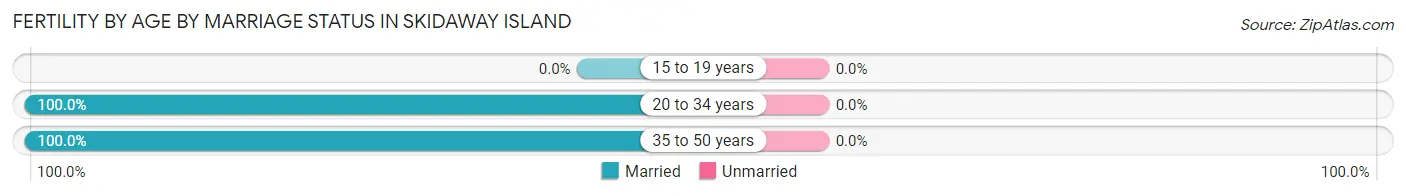
| Age Bracket | Married | Unmarried |
| 15 to 19 years | 0 (0.0%) | 0 (0.0%) |
| 20 to 34 years | 11 (100.0%) | 0 (0.0%) |
| 35 to 50 years | 9 (100.0%) | 0 (0.0%) |
| Total | 20 (100.0%) | 0 (0.0%) |
Fertility by Education in Skidaway Island
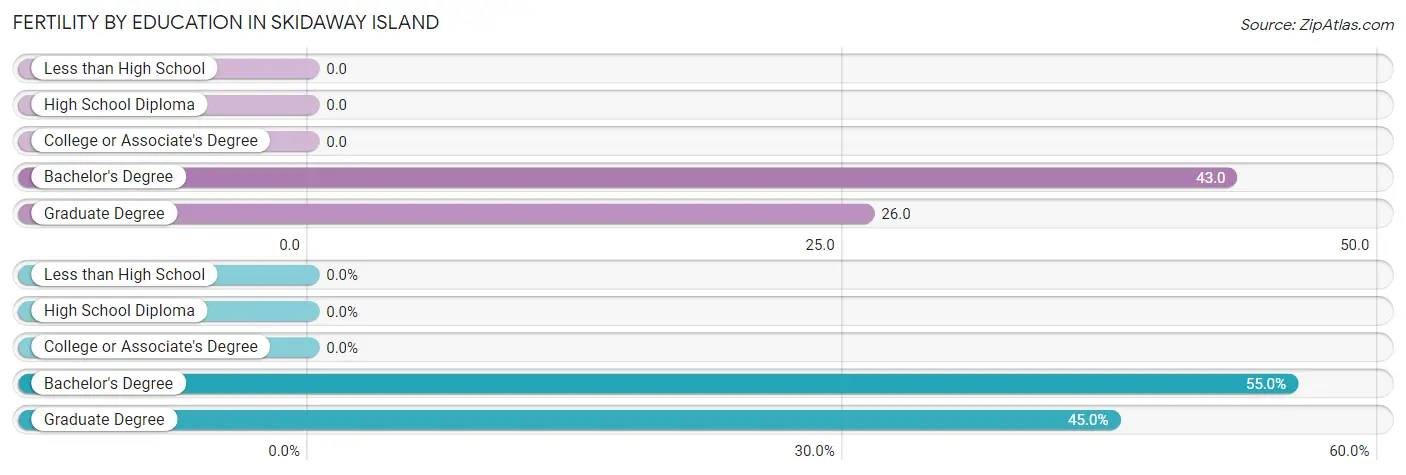
| Educational Attainment | Women with Births | Births / 1,000 Women |
| Less than High School | 0 (0.0%) | 0.0 |
| High School Diploma | 0 (0.0%) | 0.0 |
| College or Associate's Degree | 0 (0.0%) | 0.0 |
| Bachelor's Degree | 11 (55.0%) | 43.0 |
| Graduate Degree | 9 (45.0%) | 26.0 |
| Total | 20 (100.0%) | 23.0 |
Fertility by Education by Marriage Status in Skidaway Island
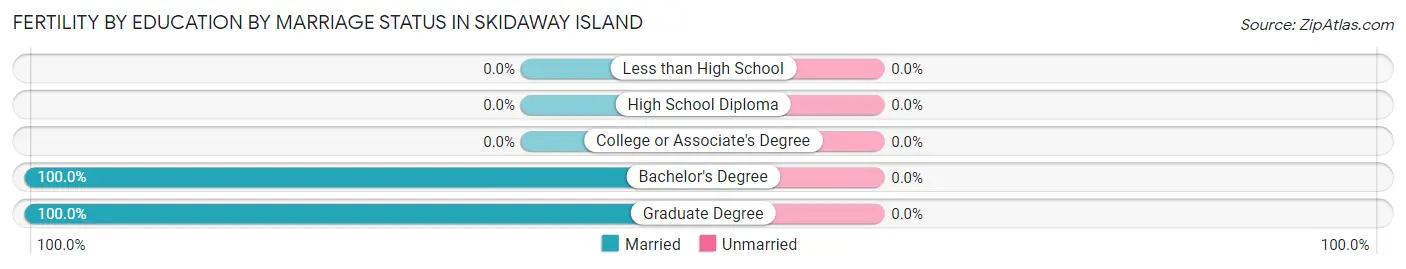
| Educational Attainment | Married | Unmarried |
| Less than High School | 0 (0.0%) | 0 (0.0%) |
| High School Diploma | 0 (0.0%) | 0 (0.0%) |
| College or Associate's Degree | 0 (0.0%) | 0 (0.0%) |
| Bachelor's Degree | 11 (100.0%) | 0 (0.0%) |
| Graduate Degree | 9 (100.0%) | 0 (0.0%) |
| Total | 20 (100.0%) | 0 (0.0%) |
Employment Characteristics in Skidaway Island
Employment by Class of Employer in Skidaway Island
Among the 2,741 employed individuals in Skidaway Island, private company employees (1,545 | 56.4%), self-employed (incorporated) (594 | 21.7%), and not-for-profit organizations (206 | 7.5%) make up the most common classes of employment.
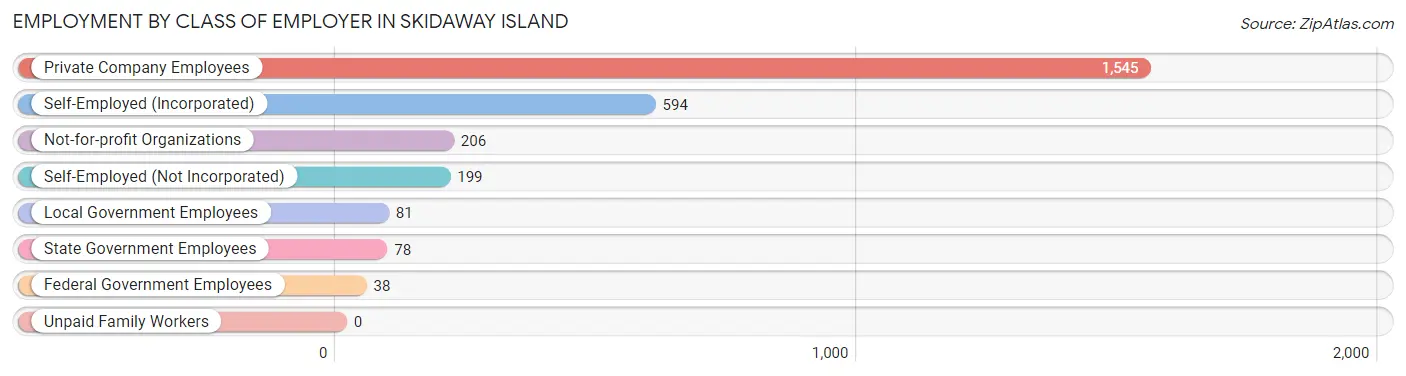
| Employer Class | # Employees | % Employees |
| Private Company Employees | 1,545 | 56.4% |
| Self-Employed (Incorporated) | 594 | 21.7% |
| Self-Employed (Not Incorporated) | 199 | 7.3% |
| Not-for-profit Organizations | 206 | 7.5% |
| Local Government Employees | 81 | 3.0% |
| State Government Employees | 78 | 2.9% |
| Federal Government Employees | 38 | 1.4% |
| Unpaid Family Workers | 0 | 0.0% |
| Total | 2,741 | 100.0% |
Employment Status by Age in Skidaway Island
According to the labor force statistics for Skidaway Island, out of the total population over 16 years of age (8,318), 35.4% or 2,945 individuals are in the labor force, with 6.9% or 203 of them unemployed. The age group with the highest labor force participation rate is 20 to 24 years, with 98.9% or 94 individuals in the labor force. Within the labor force, the 20 to 24 years age range has the highest percentage of unemployed individuals, with 22.3% or 21 of them being unemployed.
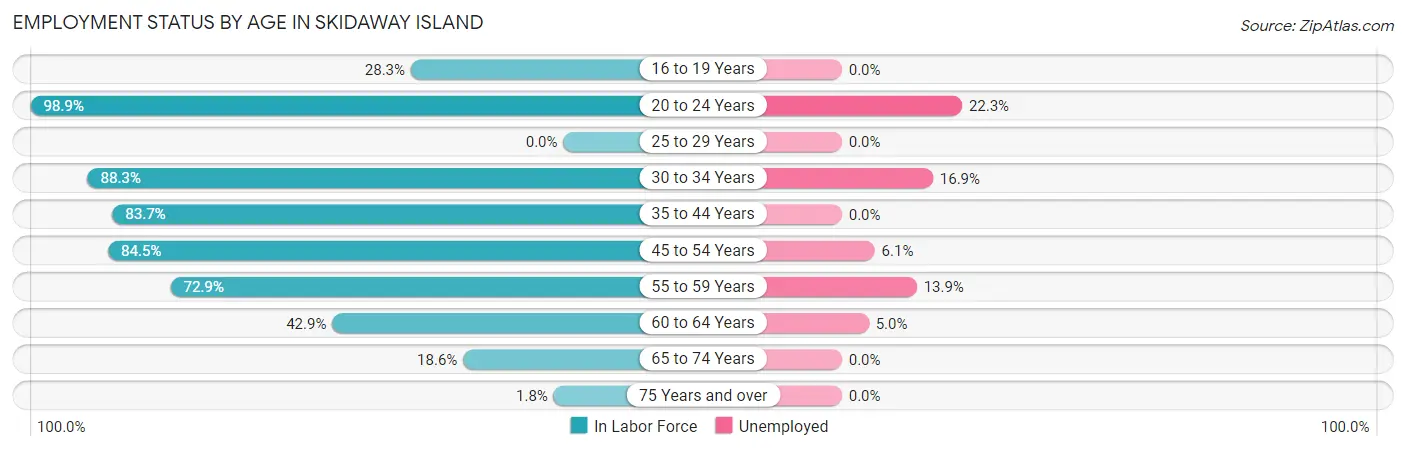
| Age Bracket | In Labor Force | Unemployed |
| 16 to 19 Years | 70 (28.3%) | 0 (0.0%) |
| 20 to 24 Years | 94 (98.9%) | 21 (22.3%) |
| 25 to 29 Years | 0 (0.0%) | 0 (0.0%) |
| 30 to 34 Years | 249 (88.3%) | 42 (16.9%) |
| 35 to 44 Years | 481 (83.7%) | 0 (0.0%) |
| 45 to 54 Years | 605 (84.5%) | 37 (6.1%) |
| 55 to 59 Years | 635 (72.9%) | 88 (13.9%) |
| 60 to 64 Years | 300 (42.9%) | 15 (5.0%) |
| 65 to 74 Years | 469 (18.6%) | 0 (0.0%) |
| 75 Years and over | 41 (1.8%) | 0 (0.0%) |
| Total | 2,945 (35.4%) | 203 (6.9%) |
Employment Status by Educational Attainment in Skidaway Island
According to labor force statistics for Skidaway Island, 71.4% of individuals (2,269) out of the total population between 25 and 64 years of age (3,178) are in the labor force, with 8.0% or 182 of them being unemployed. The group with the highest labor force participation rate are those with the educational attainment of high school diploma, with 91.1% or 298 individuals in the labor force. Within the labor force, individuals with bachelor's degree or higher education have the highest percentage of unemployment, with 10.4% or 167 of them being unemployed.
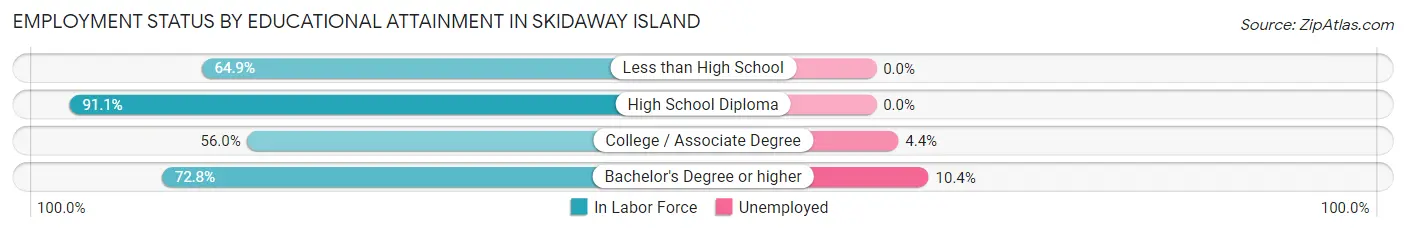
| Educational Attainment | In Labor Force | Unemployed |
| Less than High School | 24 (64.9%) | 0 (0.0%) |
| High School Diploma | 298 (91.1%) | 0 (0.0%) |
| College / Associate Degree | 339 (56.0%) | 27 (4.4%) |
| Bachelor's Degree or higher | 1,608 (72.8%) | 230 (10.4%) |
| Total | 2,269 (71.4%) | 254 (8.0%) |
Employment Occupations by Sex in Skidaway Island
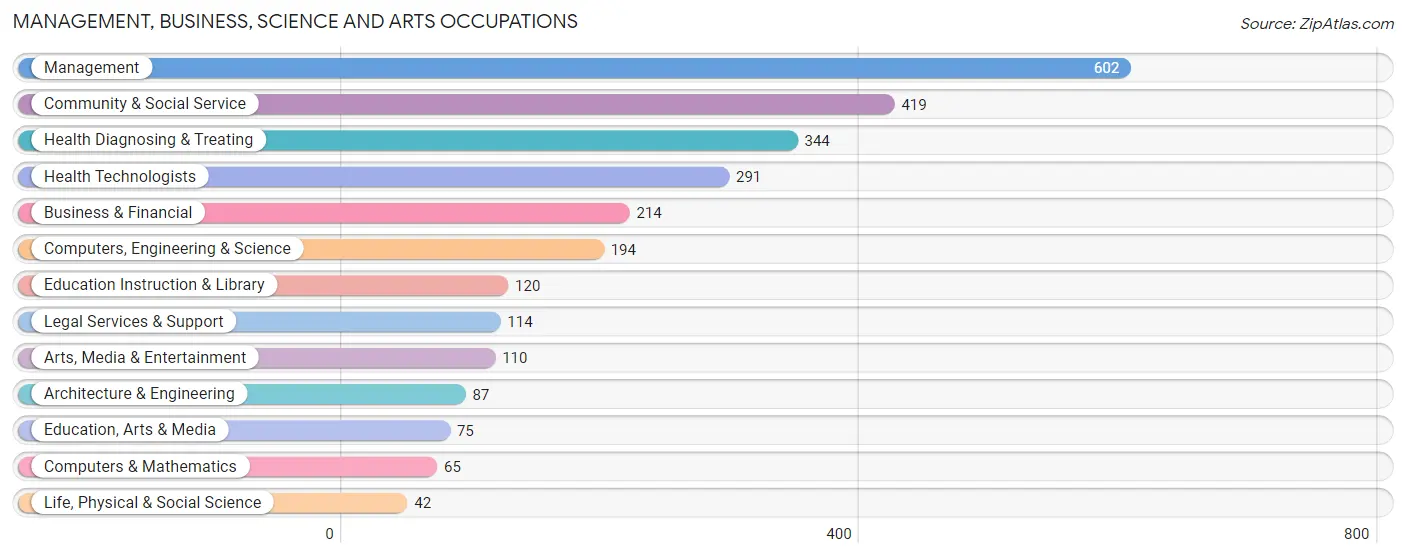
Management, Business, Science and Arts Occupations
The most common Management, Business, Science and Arts occupations in Skidaway Island are Management (602 | 22.0%), Community & Social Service (419 | 15.3%), Health Diagnosing & Treating (344 | 12.6%), Health Technologists (291 | 10.6%), and Business & Financial (214 | 7.8%).
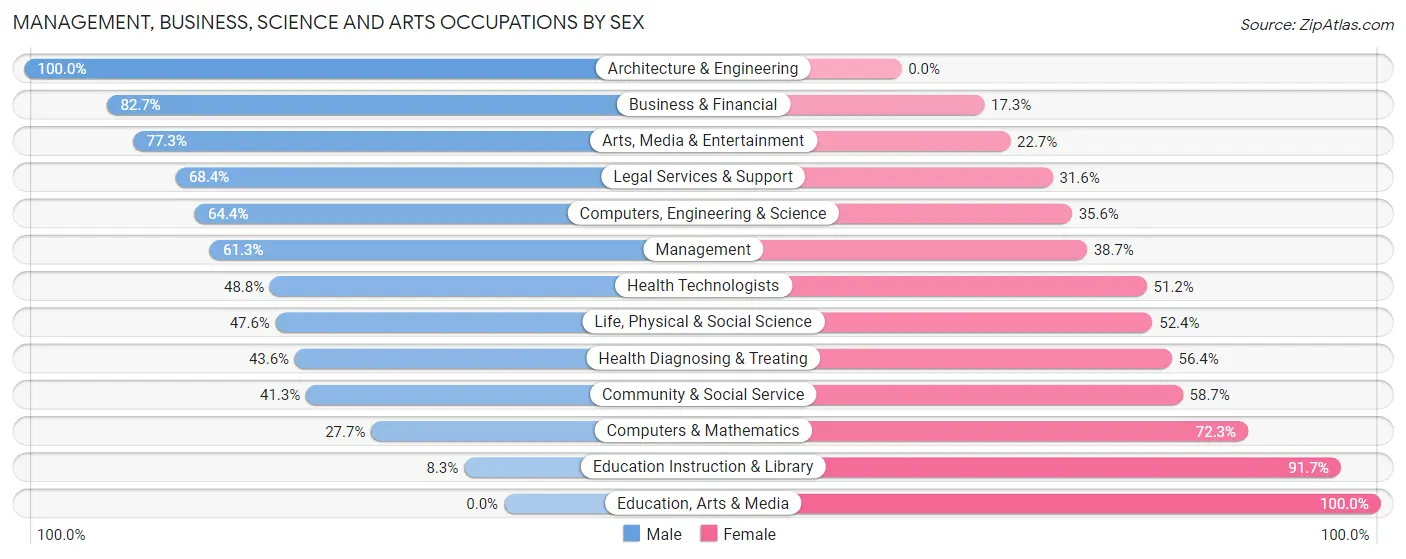
Management, Business, Science and Arts Occupations by Sex
Within the Management, Business, Science and Arts occupations in Skidaway Island, the most male-oriented occupations are Architecture & Engineering (100.0%), Business & Financial (82.7%), and Arts, Media & Entertainment (77.3%), while the most female-oriented occupations are Education, Arts & Media (100.0%), Education Instruction & Library (91.7%), and Computers & Mathematics (72.3%).
| Occupation | Male | Female |
| Management | 369 (61.3%) | 233 (38.7%) |
| Business & Financial | 177 (82.7%) | 37 (17.3%) |
| Computers, Engineering & Science | 125 (64.4%) | 69 (35.6%) |
| Computers & Mathematics | 18 (27.7%) | 47 (72.3%) |
| Architecture & Engineering | 87 (100.0%) | 0 (0.0%) |
| Life, Physical & Social Science | 20 (47.6%) | 22 (52.4%) |
| Community & Social Service | 173 (41.3%) | 246 (58.7%) |
| Education, Arts & Media | 0 (0.0%) | 75 (100.0%) |
| Legal Services & Support | 78 (68.4%) | 36 (31.6%) |
| Education Instruction & Library | 10 (8.3%) | 110 (91.7%) |
| Arts, Media & Entertainment | 85 (77.3%) | 25 (22.7%) |
| Health Diagnosing & Treating | 150 (43.6%) | 194 (56.4%) |
| Health Technologists | 142 (48.8%) | 149 (51.2%) |
| Total (Category) | 994 (56.1%) | 779 (43.9%) |
| Total (Overall) | 1,523 (55.6%) | 1,218 (44.4%) |
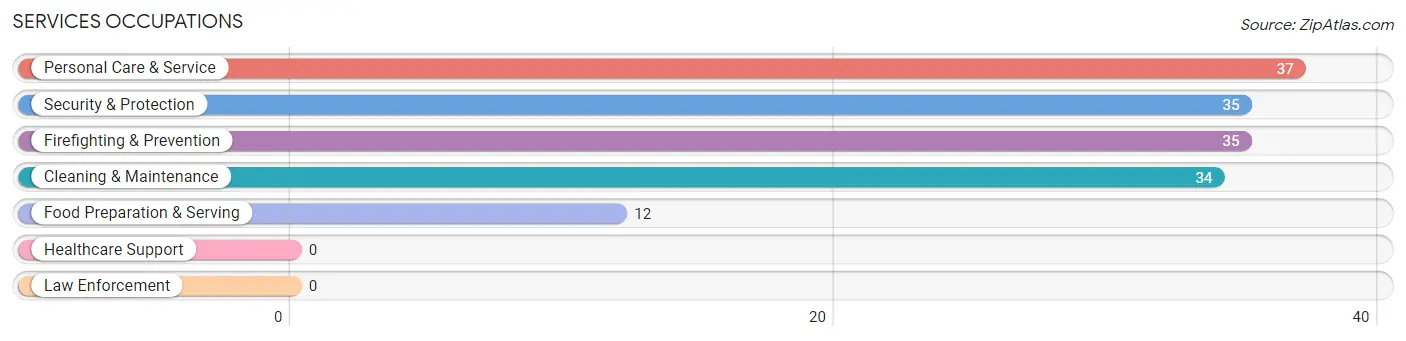
Services Occupations
The most common Services occupations in Skidaway Island are Personal Care & Service (37 | 1.3%), Security & Protection (35 | 1.3%), Firefighting & Prevention (35 | 1.3%), Cleaning & Maintenance (34 | 1.2%), and Food Preparation & Serving (12 | 0.4%).
Services Occupations by Sex
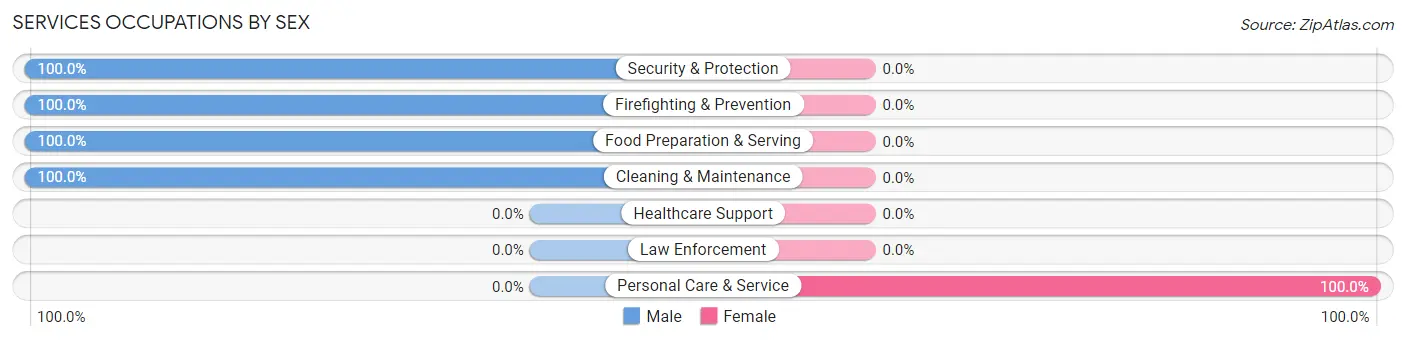
| Occupation | Male | Female |
| Healthcare Support | 0 (0.0%) | 0 (0.0%) |
| Security & Protection | 35 (100.0%) | 0 (0.0%) |
| Firefighting & Prevention | 35 (100.0%) | 0 (0.0%) |
| Law Enforcement | 0 (0.0%) | 0 (0.0%) |
| Food Preparation & Serving | 12 (100.0%) | 0 (0.0%) |
| Cleaning & Maintenance | 34 (100.0%) | 0 (0.0%) |
| Personal Care & Service | 0 (0.0%) | 37 (100.0%) |
| Total (Category) | 81 (68.6%) | 37 (31.4%) |
| Total (Overall) | 1,523 (55.6%) | 1,218 (44.4%) |
Sales and Office Occupations
The most common Sales and Office occupations in Skidaway Island are Office & Administration (318 | 11.6%), and Sales & Related (283 | 10.3%).
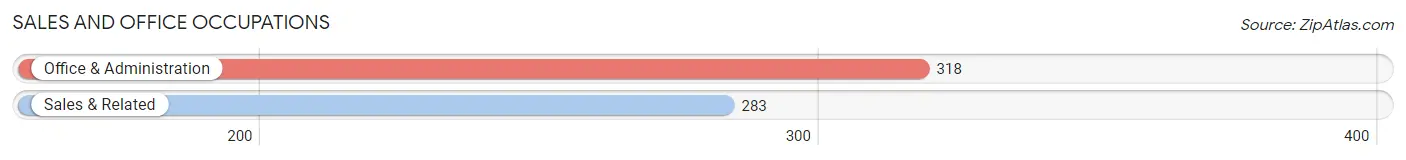
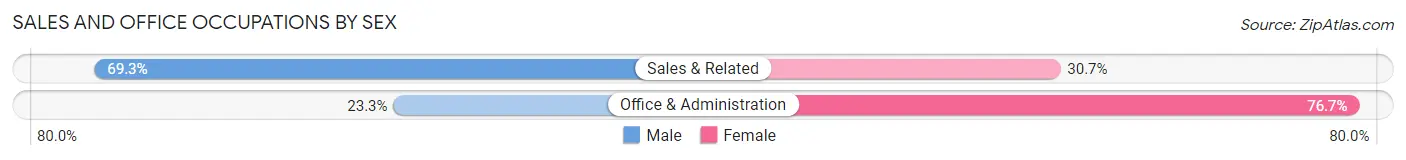
Sales and Office Occupations by Sex
| Occupation | Male | Female |
| Sales & Related | 196 (69.3%) | 87 (30.7%) |
| Office & Administration | 74 (23.3%) | 244 (76.7%) |
| Total (Category) | 270 (44.9%) | 331 (55.1%) |
| Total (Overall) | 1,523 (55.6%) | 1,218 (44.4%) |
Natural Resources, Construction and Maintenance Occupations
The most common Natural Resources, Construction and Maintenance occupations in Skidaway Island are Construction & Extraction (70 | 2.5%), and Installation, Maintenance & Repair (24 | 0.9%).
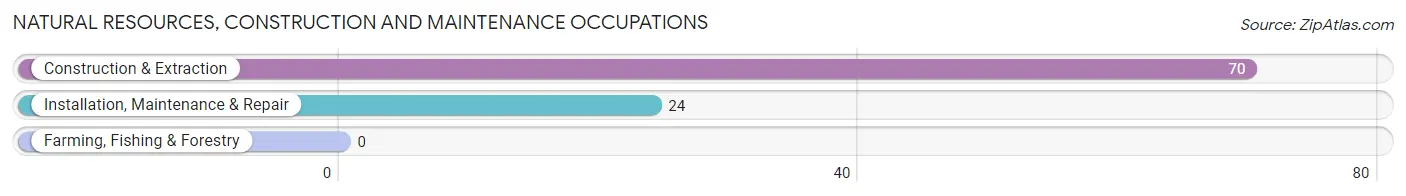
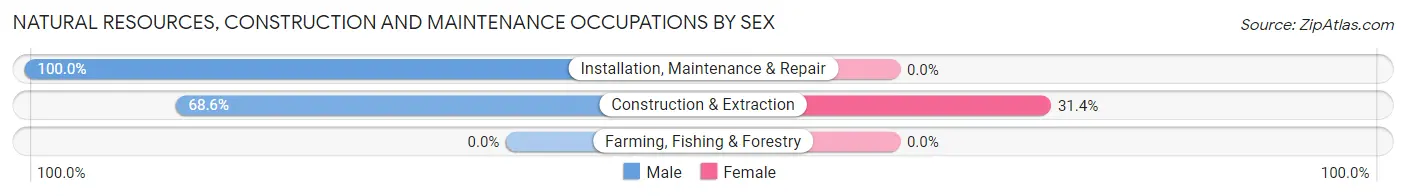
Natural Resources, Construction and Maintenance Occupations by Sex
| Occupation | Male | Female |
| Farming, Fishing & Forestry | 0 (0.0%) | 0 (0.0%) |
| Construction & Extraction | 48 (68.6%) | 22 (31.4%) |
| Installation, Maintenance & Repair | 24 (100.0%) | 0 (0.0%) |
| Total (Category) | 72 (76.6%) | 22 (23.4%) |
| Total (Overall) | 1,523 (55.6%) | 1,218 (44.4%) |
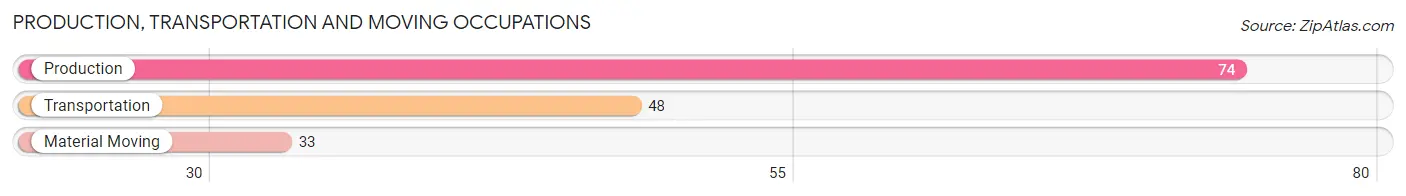
Production, Transportation and Moving Occupations
The most common Production, Transportation and Moving occupations in Skidaway Island are Production (74 | 2.7%), Transportation (48 | 1.8%), and Material Moving (33 | 1.2%).
Production, Transportation and Moving Occupations by Sex
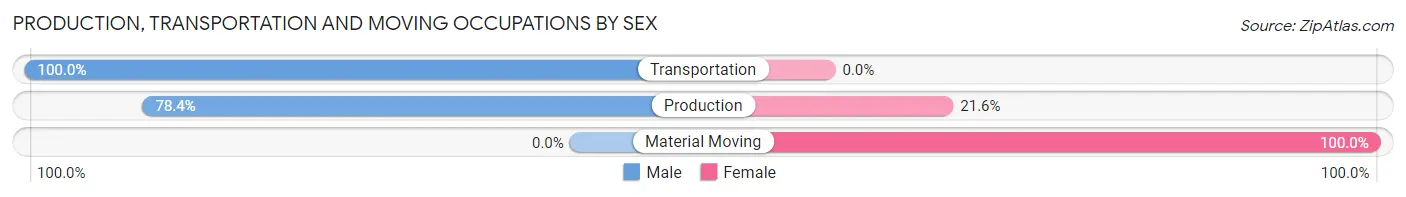
| Occupation | Male | Female |
| Production | 58 (78.4%) | 16 (21.6%) |
| Transportation | 48 (100.0%) | 0 (0.0%) |
| Material Moving | 0 (0.0%) | 33 (100.0%) |
| Total (Category) | 106 (68.4%) | 49 (31.6%) |
| Total (Overall) | 1,523 (55.6%) | 1,218 (44.4%) |
Employment Industries by Sex in Skidaway Island
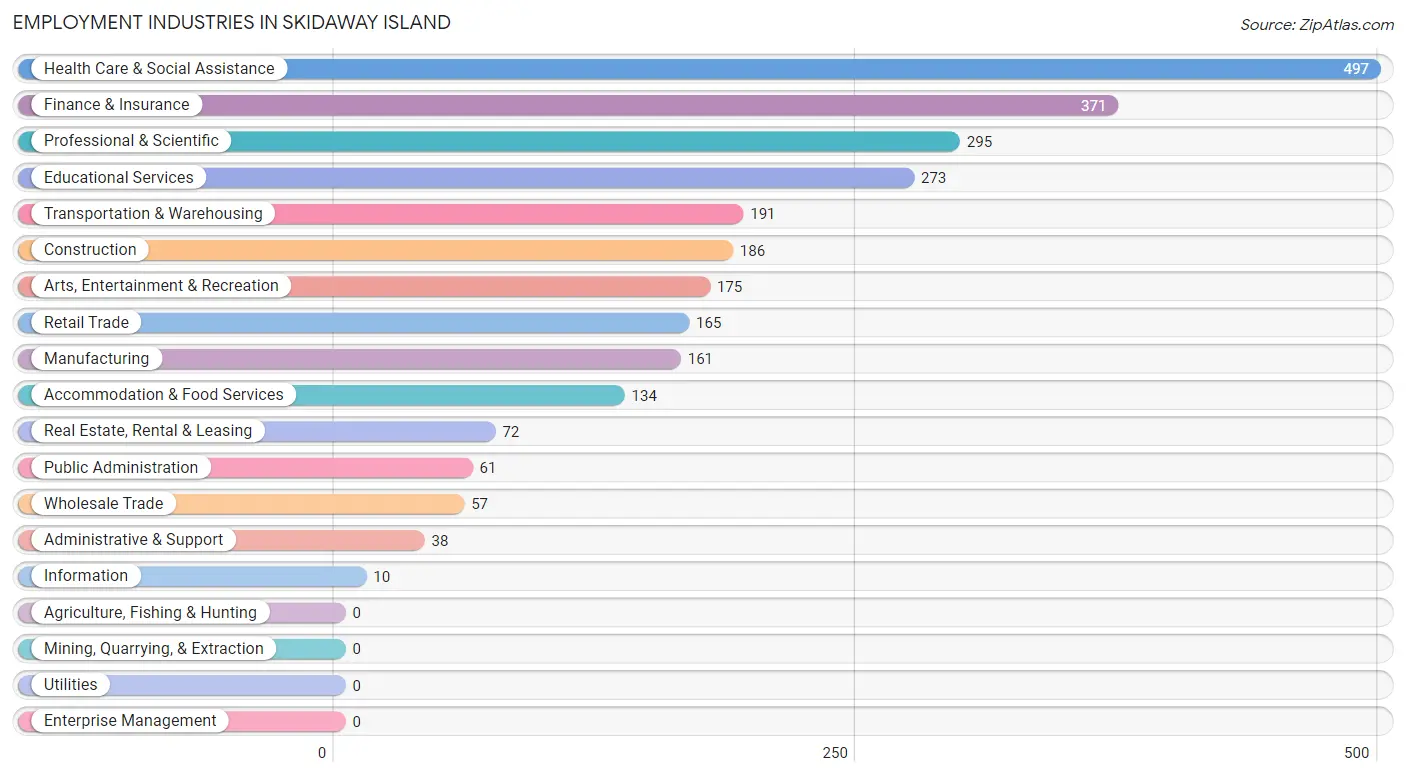
Employment Industries in Skidaway Island
The major employment industries in Skidaway Island include Health Care & Social Assistance (497 | 18.1%), Finance & Insurance (371 | 13.5%), Professional & Scientific (295 | 10.8%), Educational Services (273 | 10.0%), and Transportation & Warehousing (191 | 7.0%).
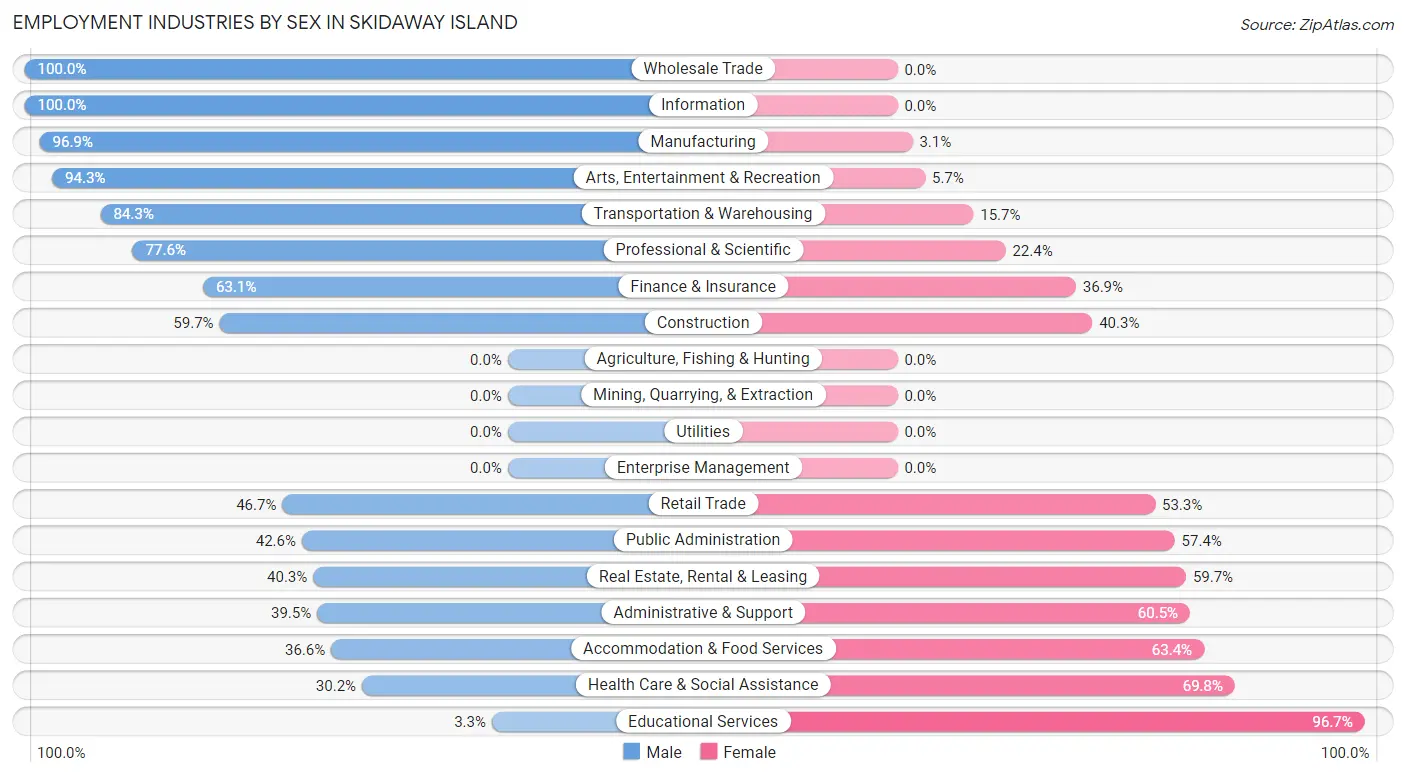
Employment Industries by Sex in Skidaway Island
The Skidaway Island industries that see more men than women are Wholesale Trade (100.0%), Information (100.0%), and Manufacturing (96.9%), whereas the industries that tend to have a higher number of women are Educational Services (96.7%), Health Care & Social Assistance (69.8%), and Accommodation & Food Services (63.4%).
| Industry | Male | Female |
| Agriculture, Fishing & Hunting | 0 (0.0%) | 0 (0.0%) |
| Mining, Quarrying, & Extraction | 0 (0.0%) | 0 (0.0%) |
| Construction | 111 (59.7%) | 75 (40.3%) |
| Manufacturing | 156 (96.9%) | 5 (3.1%) |
| Wholesale Trade | 57 (100.0%) | 0 (0.0%) |
| Retail Trade | 77 (46.7%) | 88 (53.3%) |
| Transportation & Warehousing | 161 (84.3%) | 30 (15.7%) |
| Utilities | 0 (0.0%) | 0 (0.0%) |
| Information | 10 (100.0%) | 0 (0.0%) |
| Finance & Insurance | 234 (63.1%) | 137 (36.9%) |
| Real Estate, Rental & Leasing | 29 (40.3%) | 43 (59.7%) |
| Professional & Scientific | 229 (77.6%) | 66 (22.4%) |
| Enterprise Management | 0 (0.0%) | 0 (0.0%) |
| Administrative & Support | 15 (39.5%) | 23 (60.5%) |
| Educational Services | 9 (3.3%) | 264 (96.7%) |
| Health Care & Social Assistance | 150 (30.2%) | 347 (69.8%) |
| Arts, Entertainment & Recreation | 165 (94.3%) | 10 (5.7%) |
| Accommodation & Food Services | 49 (36.6%) | 85 (63.4%) |
| Public Administration | 26 (42.6%) | 35 (57.4%) |
| Total | 1,523 (55.6%) | 1,218 (44.4%) |
Education in Skidaway Island
School Enrollment in Skidaway Island
The most common levels of schooling among the 1,173 students in Skidaway Island are high school (329 | 28.1%), elementary school (281 | 24.0%), and middle school (240 | 20.5%).
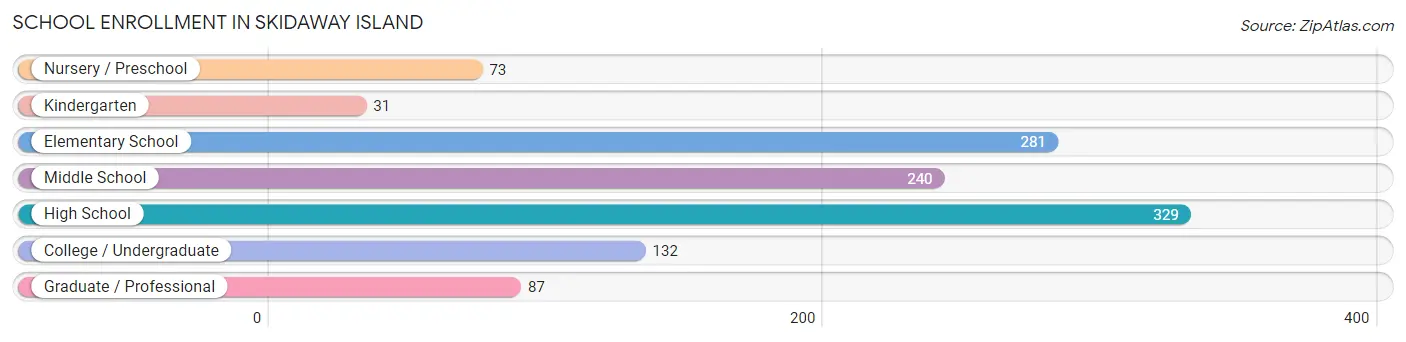
| School Level | # Students | % Students |
| Nursery / Preschool | 73 | 6.2% |
| Kindergarten | 31 | 2.6% |
| Elementary School | 281 | 24.0% |
| Middle School | 240 | 20.5% |
| High School | 329 | 28.1% |
| College / Undergraduate | 132 | 11.3% |
| Graduate / Professional | 87 | 7.4% |
| Total | 1,173 | 100.0% |
School Enrollment by Age by Funding Source in Skidaway Island
Out of a total of 1,173 students who are enrolled in schools in Skidaway Island, 860 (73.3%) attend a private institution, while the remaining 313 (26.7%) are enrolled in public schools. The age group of 3 to 4 year olds has the highest likelihood of being enrolled in private schools, with 73 (100.0% in the age bracket) enrolled. Conversely, the age group of 20 to 24 year olds has the lowest likelihood of being enrolled in a private school, with 52 (100.0% in the age bracket) attending a public institution.
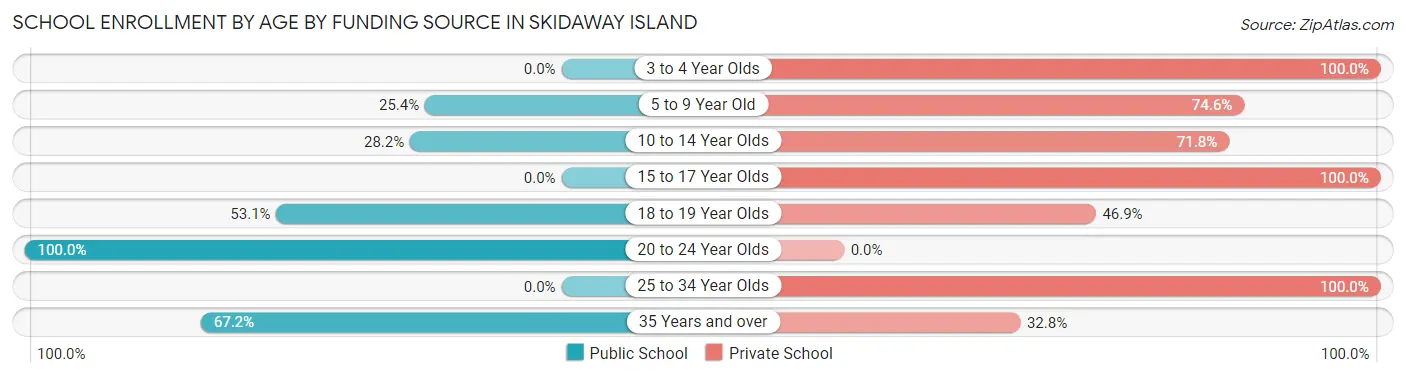
| Age Bracket | Public School | Private School |
| 3 to 4 Year Olds | 0 (0.0%) | 73 (100.0%) |
| 5 to 9 Year Old | 77 (25.4%) | 226 (74.6%) |
| 10 to 14 Year Olds | 79 (28.2%) | 201 (71.8%) |
| 15 to 17 Year Olds | 0 (0.0%) | 268 (100.0%) |
| 18 to 19 Year Olds | 60 (53.1%) | 53 (46.9%) |
| 20 to 24 Year Olds | 52 (100.0%) | 0 (0.0%) |
| 25 to 34 Year Olds | 0 (0.0%) | 17 (100.0%) |
| 35 Years and over | 45 (67.2%) | 22 (32.8%) |
| Total | 313 (26.7%) | 860 (73.3%) |
Educational Attainment by Field of Study in Skidaway Island
Business (1,221 | 21.3%), education (740 | 12.9%), social sciences (497 | 8.7%), engineering (482 | 8.4%), and science & technology (426 | 7.4%) are the most common fields of study among 5,734 individuals in Skidaway Island who have obtained a bachelor's degree or higher.
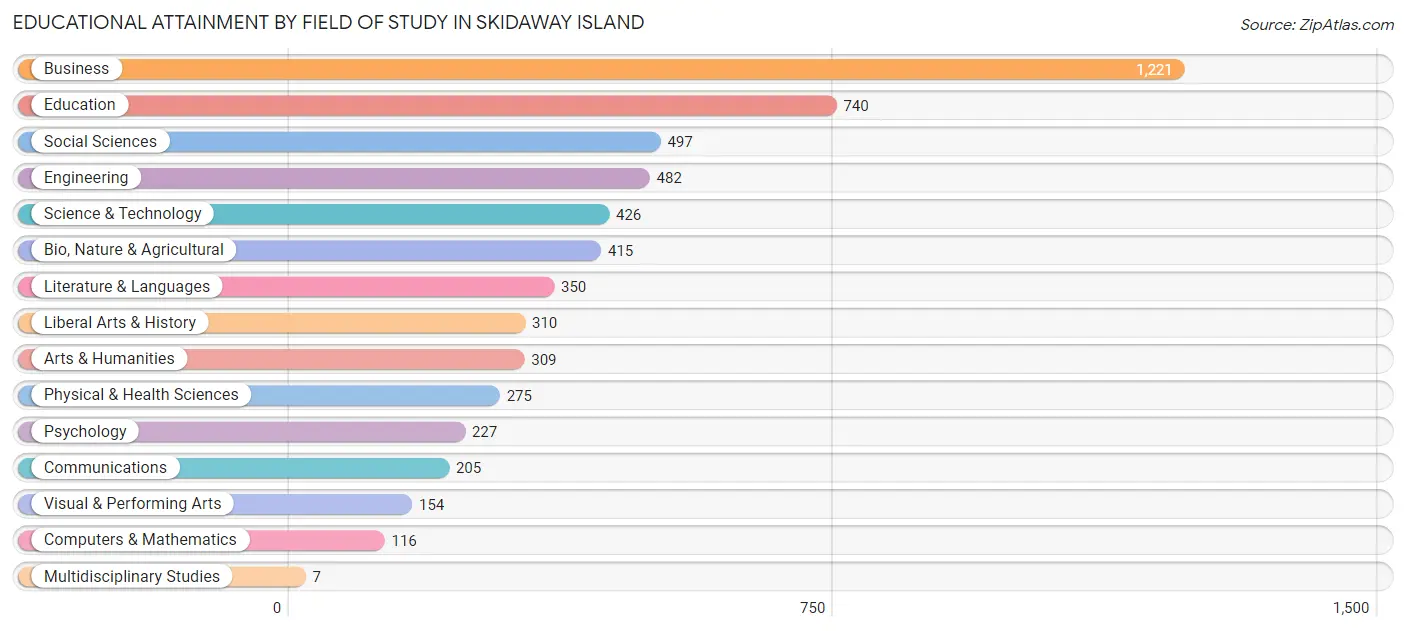
| Field of Study | # Graduates | % Graduates |
| Computers & Mathematics | 116 | 2.0% |
| Bio, Nature & Agricultural | 415 | 7.2% |
| Physical & Health Sciences | 275 | 4.8% |
| Psychology | 227 | 4.0% |
| Social Sciences | 497 | 8.7% |
| Engineering | 482 | 8.4% |
| Multidisciplinary Studies | 7 | 0.1% |
| Science & Technology | 426 | 7.4% |
| Business | 1,221 | 21.3% |
| Education | 740 | 12.9% |
| Literature & Languages | 350 | 6.1% |
| Liberal Arts & History | 310 | 5.4% |
| Visual & Performing Arts | 154 | 2.7% |
| Communications | 205 | 3.6% |
| Arts & Humanities | 309 | 5.4% |
| Total | 5,734 | 100.0% |
Transportation & Commute in Skidaway Island
Vehicle Availability by Sex in Skidaway Island
The most prevalent vehicle ownership categories in Skidaway Island are males with 2 vehicles (956, accounting for 62.8%) and females with 2 vehicles (801, making up 78.6%).
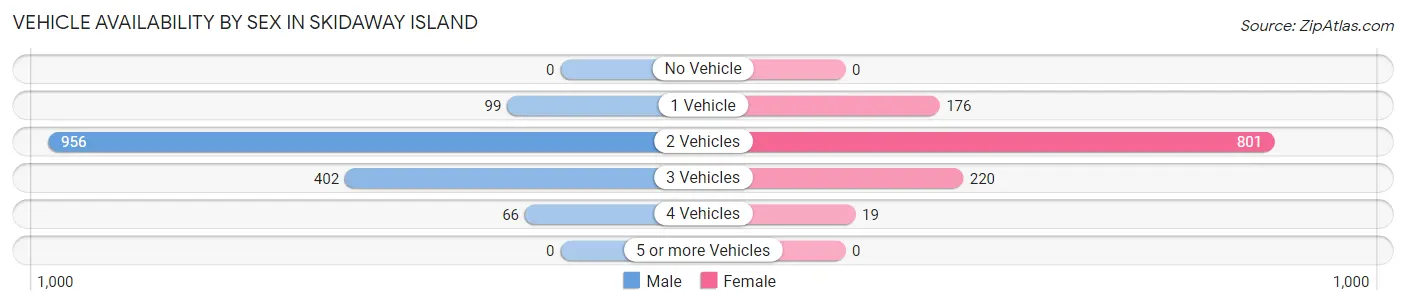
| Vehicles Available | Male | Female |
| No Vehicle | 0 (0.0%) | 0 (0.0%) |
| 1 Vehicle | 99 (6.5%) | 176 (14.5%) |
| 2 Vehicles | 956 (62.8%) | 801 (65.9%) |
| 3 Vehicles | 402 (26.4%) | 220 (18.1%) |
| 4 Vehicles | 66 (4.3%) | 19 (1.6%) |
| 5 or more Vehicles | 0 (0.0%) | 0 (0.0%) |
| Total | 1,523 (100.0%) | 1,216 (100.0%) |
Commute Time in Skidaway Island
The most frequently occuring commute durations in Skidaway Island are 20 to 24 minutes (757 commuters, 31.4%), 15 to 19 minutes (532 commuters, 22.1%), and 30 to 34 minutes (313 commuters, 13.0%).
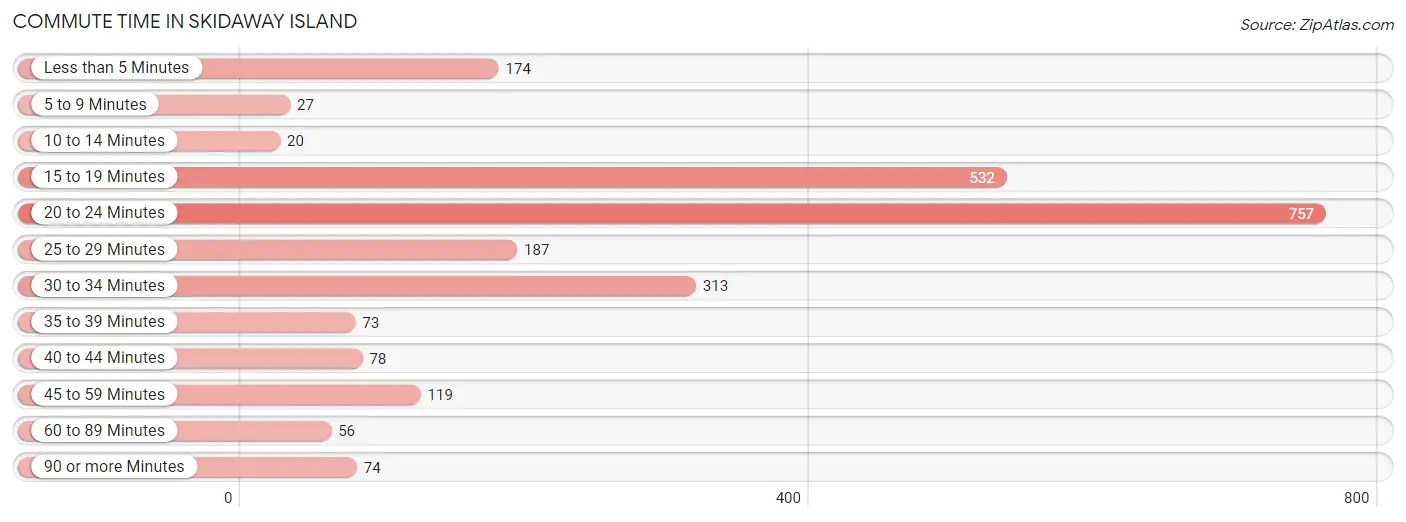
| Commute Time | # Commuters | % Commuters |
| Less than 5 Minutes | 174 | 7.2% |
| 5 to 9 Minutes | 27 | 1.1% |
| 10 to 14 Minutes | 20 | 0.8% |
| 15 to 19 Minutes | 532 | 22.1% |
| 20 to 24 Minutes | 757 | 31.4% |
| 25 to 29 Minutes | 187 | 7.8% |
| 30 to 34 Minutes | 313 | 13.0% |
| 35 to 39 Minutes | 73 | 3.0% |
| 40 to 44 Minutes | 78 | 3.2% |
| 45 to 59 Minutes | 119 | 4.9% |
| 60 to 89 Minutes | 56 | 2.3% |
| 90 or more Minutes | 74 | 3.1% |
Commute Time by Sex in Skidaway Island
The most common commute times in Skidaway Island are 20 to 24 minutes (302 commuters, 22.5%) for males and 20 to 24 minutes (455 commuters, 42.6%) for females.
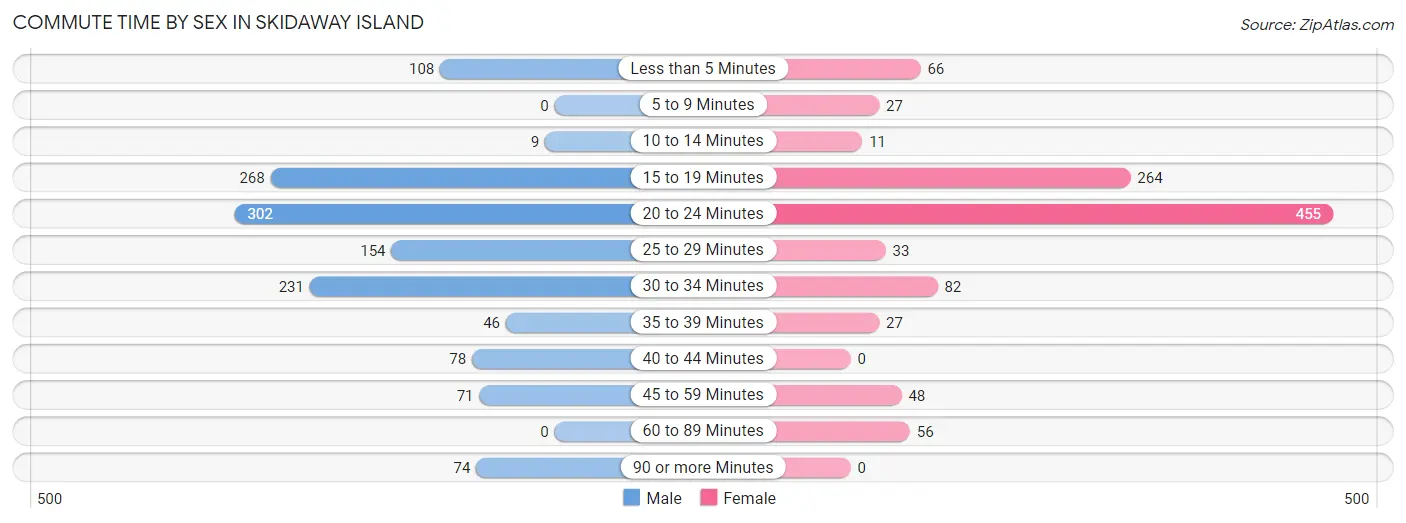
| Commute Time | Male | Female |
| Less than 5 Minutes | 108 (8.1%) | 66 (6.2%) |
| 5 to 9 Minutes | 0 (0.0%) | 27 (2.5%) |
| 10 to 14 Minutes | 9 (0.7%) | 11 (1.0%) |
| 15 to 19 Minutes | 268 (20.0%) | 264 (24.7%) |
| 20 to 24 Minutes | 302 (22.5%) | 455 (42.6%) |
| 25 to 29 Minutes | 154 (11.5%) | 33 (3.1%) |
| 30 to 34 Minutes | 231 (17.2%) | 82 (7.7%) |
| 35 to 39 Minutes | 46 (3.4%) | 27 (2.5%) |
| 40 to 44 Minutes | 78 (5.8%) | 0 (0.0%) |
| 45 to 59 Minutes | 71 (5.3%) | 48 (4.5%) |
| 60 to 89 Minutes | 0 (0.0%) | 56 (5.2%) |
| 90 or more Minutes | 74 (5.5%) | 0 (0.0%) |
Time of Departure to Work by Sex in Skidaway Island
The most frequent times of departure to work in Skidaway Island are 7:30 AM to 7:59 AM (418, 31.2%) for males and 7:30 AM to 7:59 AM (371, 34.7%) for females.
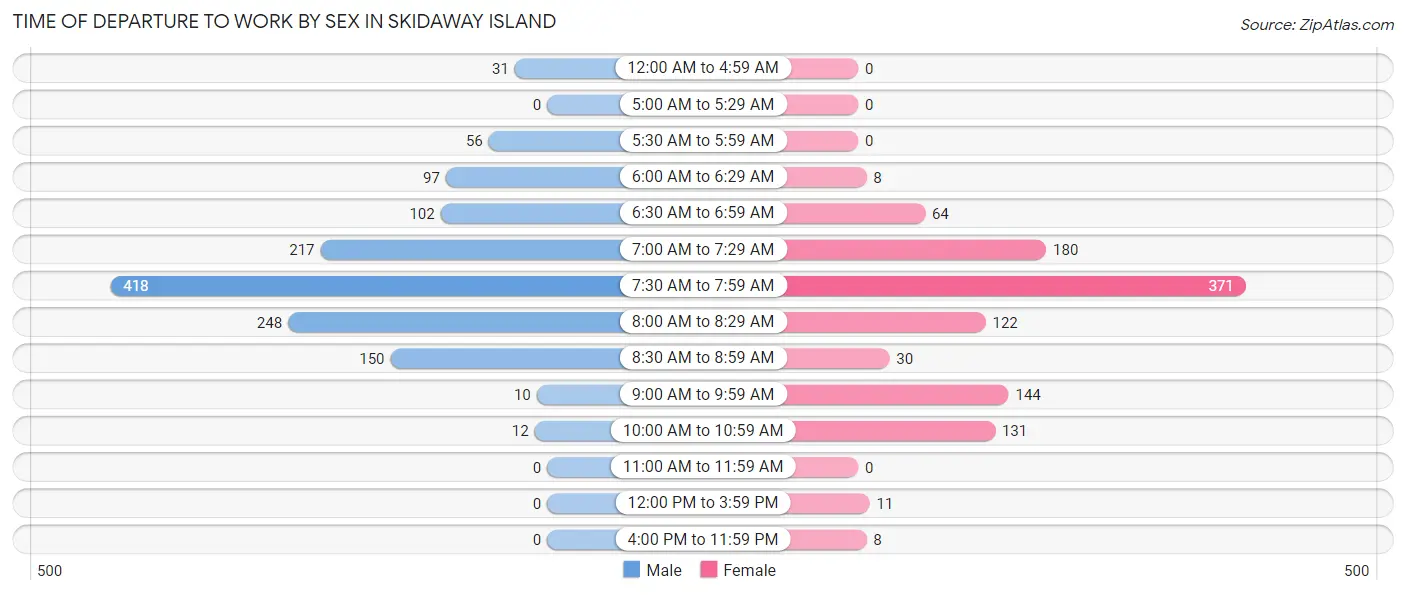
| Time of Departure | Male | Female |
| 12:00 AM to 4:59 AM | 31 (2.3%) | 0 (0.0%) |
| 5:00 AM to 5:29 AM | 0 (0.0%) | 0 (0.0%) |
| 5:30 AM to 5:59 AM | 56 (4.2%) | 0 (0.0%) |
| 6:00 AM to 6:29 AM | 97 (7.2%) | 8 (0.7%) |
| 6:30 AM to 6:59 AM | 102 (7.6%) | 64 (6.0%) |
| 7:00 AM to 7:29 AM | 217 (16.2%) | 180 (16.8%) |
| 7:30 AM to 7:59 AM | 418 (31.2%) | 371 (34.7%) |
| 8:00 AM to 8:29 AM | 248 (18.5%) | 122 (11.4%) |
| 8:30 AM to 8:59 AM | 150 (11.2%) | 30 (2.8%) |
| 9:00 AM to 9:59 AM | 10 (0.7%) | 144 (13.5%) |
| 10:00 AM to 10:59 AM | 12 (0.9%) | 131 (12.2%) |
| 11:00 AM to 11:59 AM | 0 (0.0%) | 0 (0.0%) |
| 12:00 PM to 3:59 PM | 0 (0.0%) | 11 (1.0%) |
| 4:00 PM to 11:59 PM | 0 (0.0%) | 8 (0.7%) |
| Total | 1,341 (100.0%) | 1,069 (100.0%) |
Housing Occupancy in Skidaway Island
Occupancy by Ownership in Skidaway Island
Of the total 4,481 dwellings in Skidaway Island, owner-occupied units account for 4,139 (92.4%), while renter-occupied units make up 342 (7.6%).
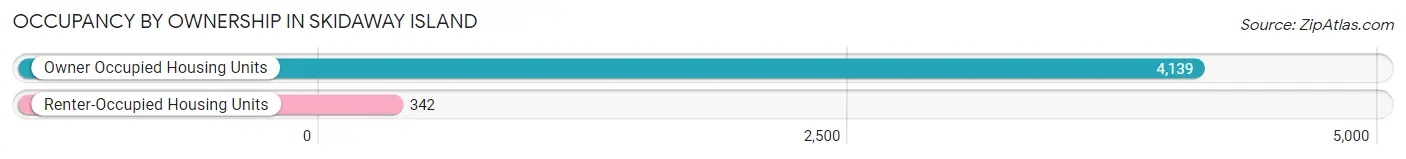
| Occupancy | # Housing Units | % Housing Units |
| Owner Occupied Housing Units | 4,139 | 92.4% |
| Renter-Occupied Housing Units | 342 | 7.6% |
| Total Occupied Housing Units | 4,481 | 100.0% |
Occupancy by Household Size in Skidaway Island
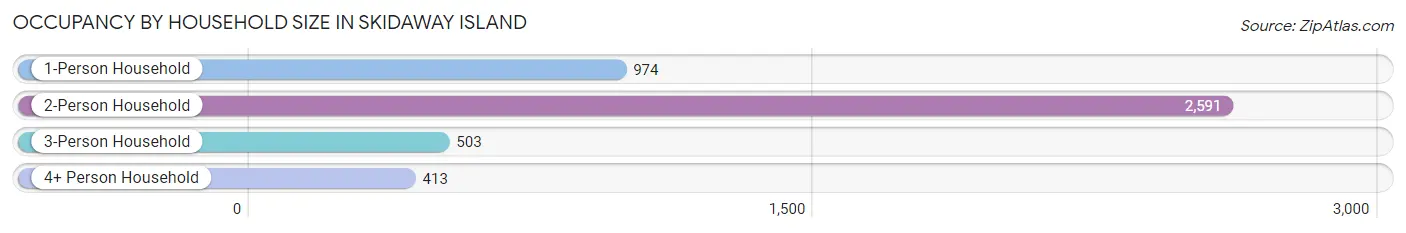
| Household Size | # Housing Units | % Housing Units |
| 1-Person Household | 974 | 21.7% |
| 2-Person Household | 2,591 | 57.8% |
| 3-Person Household | 503 | 11.2% |
| 4+ Person Household | 413 | 9.2% |
| Total Housing Units | 4,481 | 100.0% |
Occupancy by Ownership by Household Size in Skidaway Island
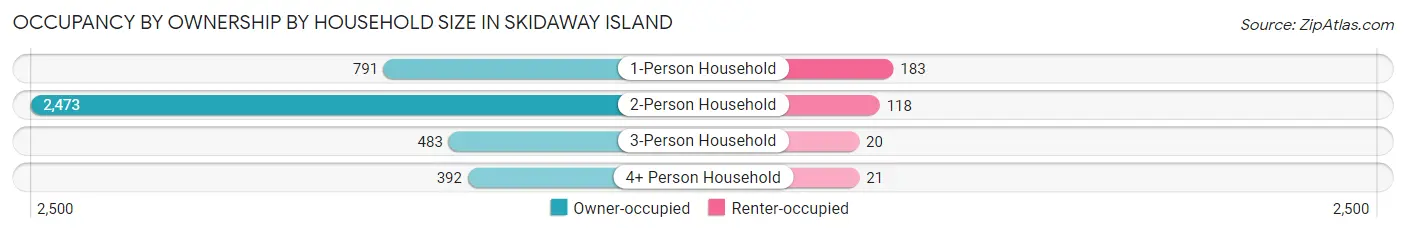
| Household Size | Owner-occupied | Renter-occupied |
| 1-Person Household | 791 (81.2%) | 183 (18.8%) |
| 2-Person Household | 2,473 (95.5%) | 118 (4.5%) |
| 3-Person Household | 483 (96.0%) | 20 (4.0%) |
| 4+ Person Household | 392 (94.9%) | 21 (5.1%) |
| Total Housing Units | 4,139 (92.4%) | 342 (7.6%) |
Occupancy by Educational Attainment in Skidaway Island
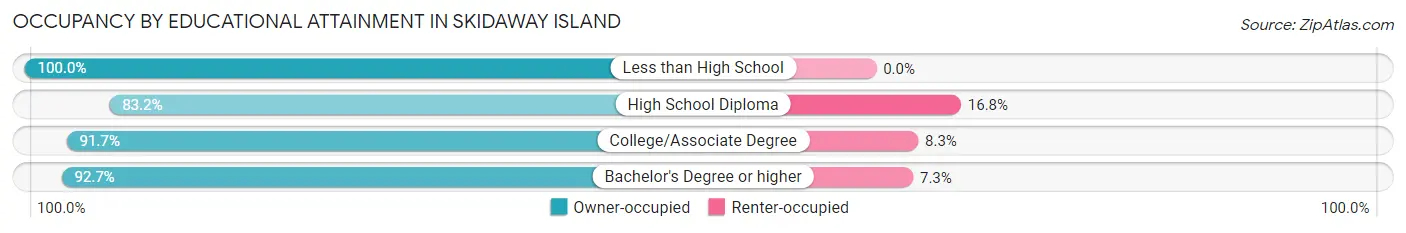
| Household Size | Owner-occupied | Renter-occupied |
| Less than High School | 267 (100.0%) | 0 (0.0%) |
| High School Diploma | 228 (83.2%) | 46 (16.8%) |
| College/Associate Degree | 727 (91.7%) | 66 (8.3%) |
| Bachelor's Degree or higher | 2,917 (92.7%) | 230 (7.3%) |
Occupancy by Age of Householder in Skidaway Island
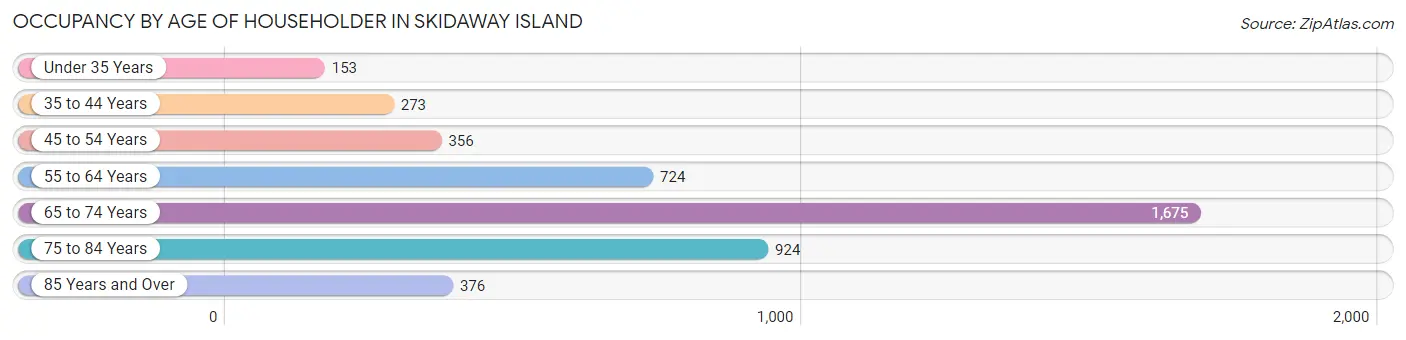
| Age Bracket | # Households | % Households |
| Under 35 Years | 153 | 3.4% |
| 35 to 44 Years | 273 | 6.1% |
| 45 to 54 Years | 356 | 7.9% |
| 55 to 64 Years | 724 | 16.2% |
| 65 to 74 Years | 1,675 | 37.4% |
| 75 to 84 Years | 924 | 20.6% |
| 85 Years and Over | 376 | 8.4% |
| Total | 4,481 | 100.0% |
Housing Finances in Skidaway Island
Median Income by Occupancy in Skidaway Island
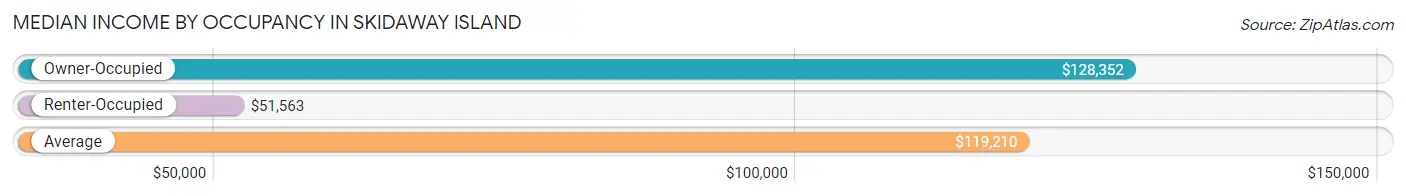
| Occupancy Type | # Households | Median Income |
| Owner-Occupied | 4,139 (92.4%) | $128,352 |
| Renter-Occupied | 342 (7.6%) | $51,563 |
| Average | 4,481 (100.0%) | $119,210 |
Occupancy by Householder Income Bracket in Skidaway Island
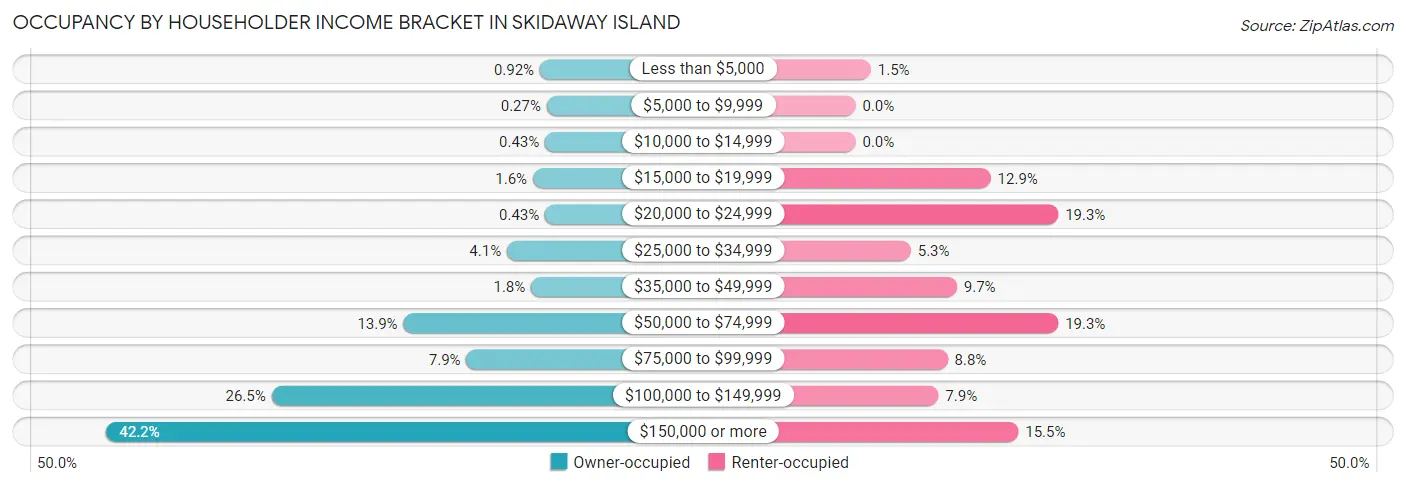
| Income Bracket | Owner-occupied | Renter-occupied |
| Less than $5,000 | 38 (0.9%) | 5 (1.5%) |
| $5,000 to $9,999 | 11 (0.3%) | 0 (0.0%) |
| $10,000 to $14,999 | 18 (0.4%) | 0 (0.0%) |
| $15,000 to $19,999 | 66 (1.6%) | 44 (12.9%) |
| $20,000 to $24,999 | 18 (0.4%) | 66 (19.3%) |
| $25,000 to $34,999 | 168 (4.1%) | 18 (5.3%) |
| $35,000 to $49,999 | 73 (1.8%) | 33 (9.7%) |
| $50,000 to $74,999 | 576 (13.9%) | 66 (19.3%) |
| $75,000 to $99,999 | 328 (7.9%) | 30 (8.8%) |
| $100,000 to $149,999 | 1,096 (26.5%) | 27 (7.9%) |
| $150,000 or more | 1,747 (42.2%) | 53 (15.5%) |
| Total | 4,139 (100.0%) | 342 (100.0%) |
Monthly Housing Cost Tiers in Skidaway Island
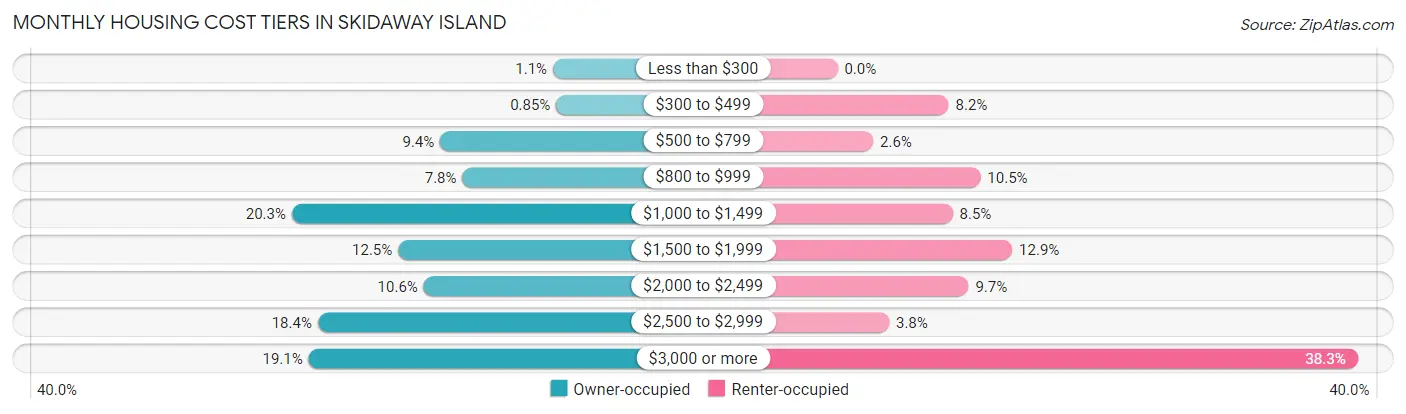
| Monthly Cost | Owner-occupied | Renter-occupied |
| Less than $300 | 45 (1.1%) | 0 (0.0%) |
| $300 to $499 | 35 (0.9%) | 28 (8.2%) |
| $500 to $799 | 389 (9.4%) | 9 (2.6%) |
| $800 to $999 | 321 (7.8%) | 36 (10.5%) |
| $1,000 to $1,499 | 841 (20.3%) | 29 (8.5%) |
| $1,500 to $1,999 | 517 (12.5%) | 44 (12.9%) |
| $2,000 to $2,499 | 439 (10.6%) | 33 (9.7%) |
| $2,500 to $2,999 | 762 (18.4%) | 13 (3.8%) |
| $3,000 or more | 790 (19.1%) | 131 (38.3%) |
| Total | 4,139 (100.0%) | 342 (100.0%) |
Physical Housing Characteristics in Skidaway Island
Housing Structures in Skidaway Island
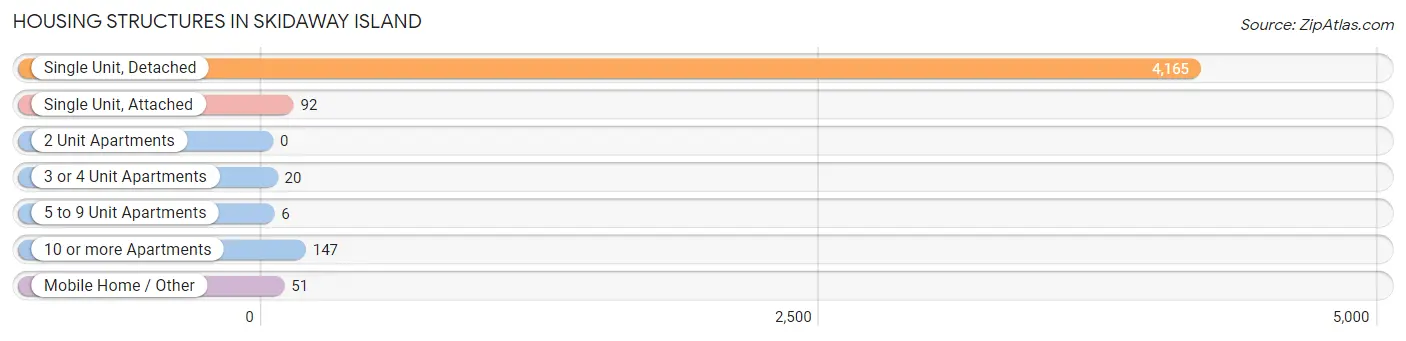
| Structure Type | # Housing Units | % Housing Units |
| Single Unit, Detached | 4,165 | 92.9% |
| Single Unit, Attached | 92 | 2.1% |
| 2 Unit Apartments | 0 | 0.0% |
| 3 or 4 Unit Apartments | 20 | 0.4% |
| 5 to 9 Unit Apartments | 6 | 0.1% |
| 10 or more Apartments | 147 | 3.3% |
| Mobile Home / Other | 51 | 1.1% |
| Total | 4,481 | 100.0% |
Housing Structures by Occupancy in Skidaway Island
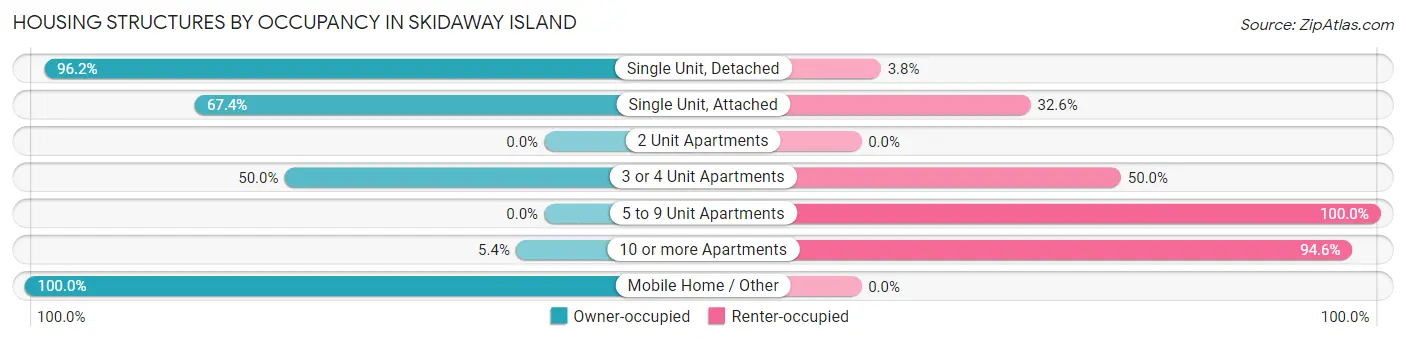
| Structure Type | Owner-occupied | Renter-occupied |
| Single Unit, Detached | 4,008 (96.2%) | 157 (3.8%) |
| Single Unit, Attached | 62 (67.4%) | 30 (32.6%) |
| 2 Unit Apartments | 0 (0.0%) | 0 (0.0%) |
| 3 or 4 Unit Apartments | 10 (50.0%) | 10 (50.0%) |
| 5 to 9 Unit Apartments | 0 (0.0%) | 6 (100.0%) |
| 10 or more Apartments | 8 (5.4%) | 139 (94.6%) |
| Mobile Home / Other | 51 (100.0%) | 0 (0.0%) |
| Total | 4,139 (92.4%) | 342 (7.6%) |
Housing Structures by Number of Rooms in Skidaway Island
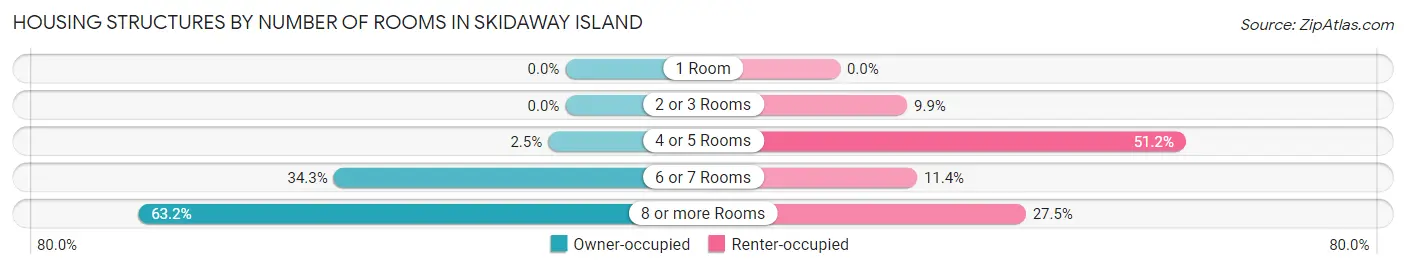
| Number of Rooms | Owner-occupied | Renter-occupied |
| 1 Room | 0 (0.0%) | 0 (0.0%) |
| 2 or 3 Rooms | 0 (0.0%) | 34 (9.9%) |
| 4 or 5 Rooms | 105 (2.5%) | 175 (51.2%) |
| 6 or 7 Rooms | 1,419 (34.3%) | 39 (11.4%) |
| 8 or more Rooms | 2,615 (63.2%) | 94 (27.5%) |
| Total | 4,139 (100.0%) | 342 (100.0%) |
Housing Structure by Heating Type in Skidaway Island
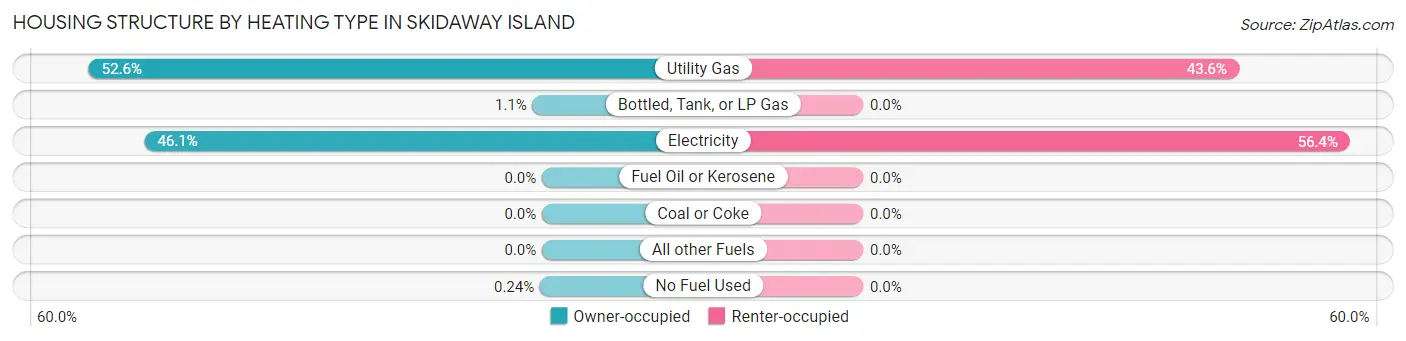
| Heating Type | Owner-occupied | Renter-occupied |
| Utility Gas | 2,176 (52.6%) | 149 (43.6%) |
| Bottled, Tank, or LP Gas | 45 (1.1%) | 0 (0.0%) |
| Electricity | 1,908 (46.1%) | 193 (56.4%) |
| Fuel Oil or Kerosene | 0 (0.0%) | 0 (0.0%) |
| Coal or Coke | 0 (0.0%) | 0 (0.0%) |
| All other Fuels | 0 (0.0%) | 0 (0.0%) |
| No Fuel Used | 10 (0.2%) | 0 (0.0%) |
| Total | 4,139 (100.0%) | 342 (100.0%) |
Household Vehicle Usage in Skidaway Island
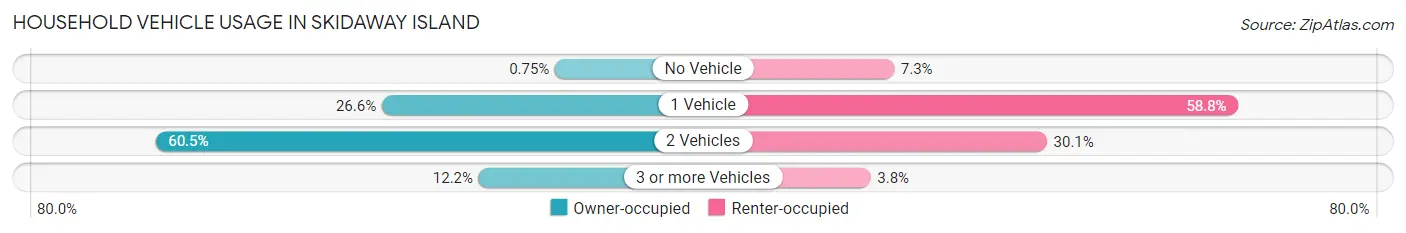
| Vehicles per Household | Owner-occupied | Renter-occupied |
| No Vehicle | 31 (0.7%) | 25 (7.3%) |
| 1 Vehicle | 1,102 (26.6%) | 201 (58.8%) |
| 2 Vehicles | 2,503 (60.5%) | 103 (30.1%) |
| 3 or more Vehicles | 503 (12.1%) | 13 (3.8%) |
| Total | 4,139 (100.0%) | 342 (100.0%) |
Real Estate & Mortgages in Skidaway Island
Real Estate and Mortgage Overview in Skidaway Island
| Characteristic | Without Mortgage | With Mortgage |
| Housing Units | 2,003 | 2,136 |
| Median Property Value | $676,300 | $689,400 |
| Median Household Income | $111,813 | $1,040 |
| Monthly Housing Costs | $1,213 | $745 |
| Real Estate Taxes | $6,529 | $0 |
Property Value by Mortgage Status in Skidaway Island
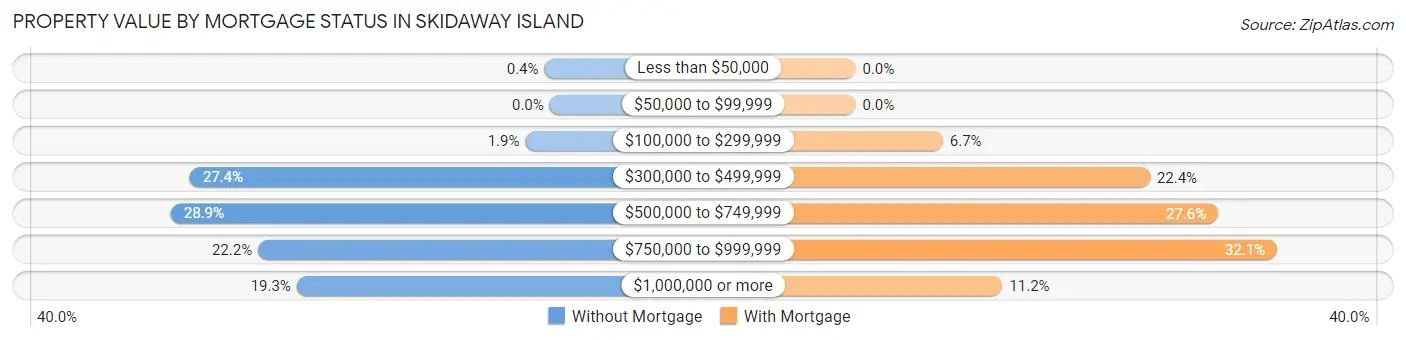
| Property Value | Without Mortgage | With Mortgage |
| Less than $50,000 | 8 (0.4%) | 0 (0.0%) |
| $50,000 to $99,999 | 0 (0.0%) | 0 (0.0%) |
| $100,000 to $299,999 | 37 (1.8%) | 142 (6.7%) |
| $300,000 to $499,999 | 549 (27.4%) | 479 (22.4%) |
| $500,000 to $749,999 | 578 (28.9%) | 590 (27.6%) |
| $750,000 to $999,999 | 445 (22.2%) | 686 (32.1%) |
| $1,000,000 or more | 386 (19.3%) | 239 (11.2%) |
| Total | 2,003 (100.0%) | 2,136 (100.0%) |
Household Income by Mortgage Status in Skidaway Island
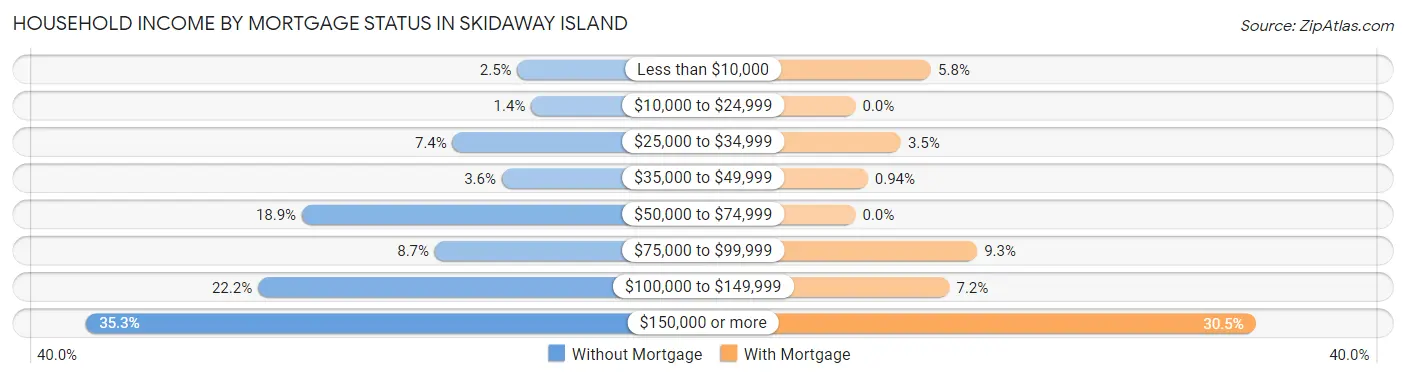
| Household Income | Without Mortgage | With Mortgage |
| Less than $10,000 | 49 (2.5%) | 123 (5.8%) |
| $10,000 to $24,999 | 28 (1.4%) | 0 (0.0%) |
| $25,000 to $34,999 | 148 (7.4%) | 74 (3.5%) |
| $35,000 to $49,999 | 73 (3.6%) | 20 (0.9%) |
| $50,000 to $74,999 | 378 (18.9%) | 0 (0.0%) |
| $75,000 to $99,999 | 175 (8.7%) | 198 (9.3%) |
| $100,000 to $149,999 | 445 (22.2%) | 153 (7.2%) |
| $150,000 or more | 707 (35.3%) | 651 (30.5%) |
| Total | 2,003 (100.0%) | 2,136 (100.0%) |
Property Value to Household Income Ratio in Skidaway Island
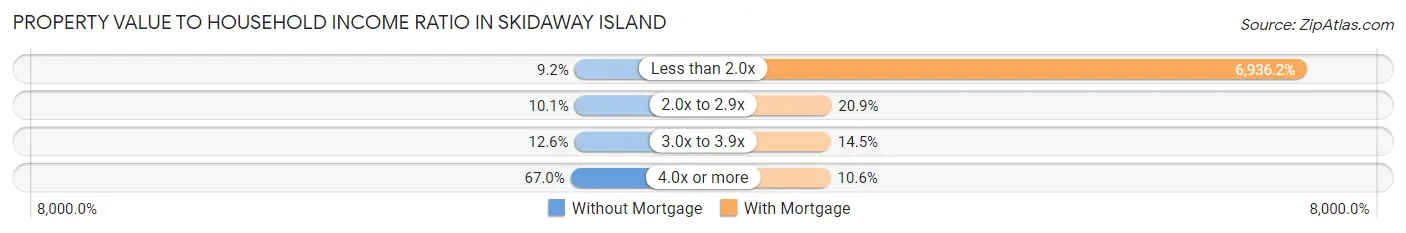
| Value-to-Income Ratio | Without Mortgage | With Mortgage |
| Less than 2.0x | 185 (9.2%) | 148,158 (6,936.2%) |
| 2.0x to 2.9x | 202 (10.1%) | 447 (20.9%) |
| 3.0x to 3.9x | 253 (12.6%) | 310 (14.5%) |
| 4.0x or more | 1,341 (66.9%) | 227 (10.6%) |
| Total | 2,003 (100.0%) | 2,136 (100.0%) |
Real Estate Taxes by Mortgage Status in Skidaway Island
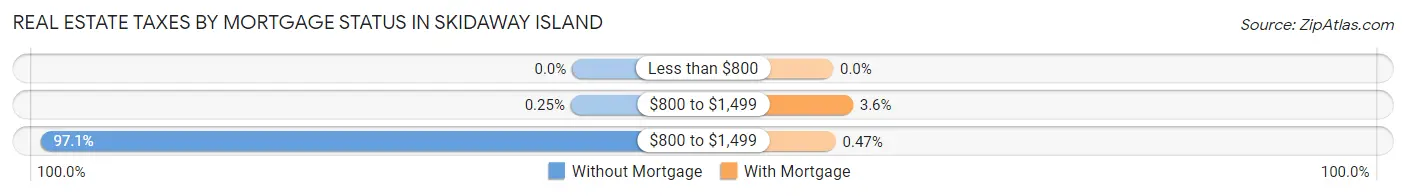
| Property Taxes | Without Mortgage | With Mortgage |
| Less than $800 | 0 (0.0%) | 0 (0.0%) |
| $800 to $1,499 | 5 (0.3%) | 77 (3.6%) |
| $800 to $1,499 | 1,945 (97.1%) | 10 (0.5%) |
| Total | 2,003 (100.0%) | 2,136 (100.0%) |
Health & Disability in Skidaway Island
Health Insurance Coverage by Age in Skidaway Island
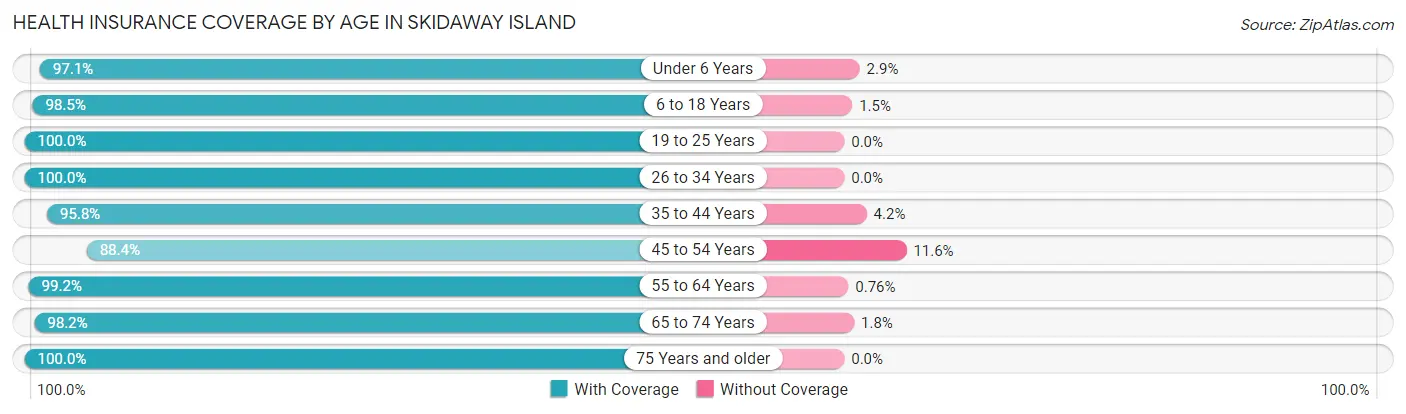
| Age Bracket | With Coverage | Without Coverage |
| Under 6 Years | 238 (97.1%) | 7 (2.9%) |
| 6 to 18 Years | 930 (98.5%) | 14 (1.5%) |
| 19 to 25 Years | 145 (100.0%) | 0 (0.0%) |
| 26 to 34 Years | 299 (100.0%) | 0 (0.0%) |
| 35 to 44 Years | 551 (95.8%) | 24 (4.2%) |
| 45 to 54 Years | 633 (88.4%) | 83 (11.6%) |
| 55 to 64 Years | 1,558 (99.2%) | 12 (0.8%) |
| 65 to 74 Years | 2,470 (98.2%) | 46 (1.8%) |
| 75 Years and older | 2,255 (100.0%) | 0 (0.0%) |
| Total | 9,079 (98.0%) | 186 (2.0%) |
Health Insurance Coverage by Citizenship Status in Skidaway Island
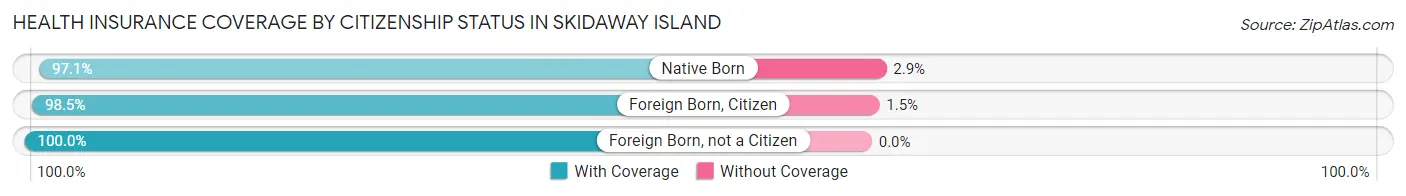
| Citizenship Status | With Coverage | Without Coverage |
| Native Born | 238 (97.1%) | 7 (2.9%) |
| Foreign Born, Citizen | 930 (98.5%) | 14 (1.5%) |
| Foreign Born, not a Citizen | 145 (100.0%) | 0 (0.0%) |
Health Insurance Coverage by Household Income in Skidaway Island
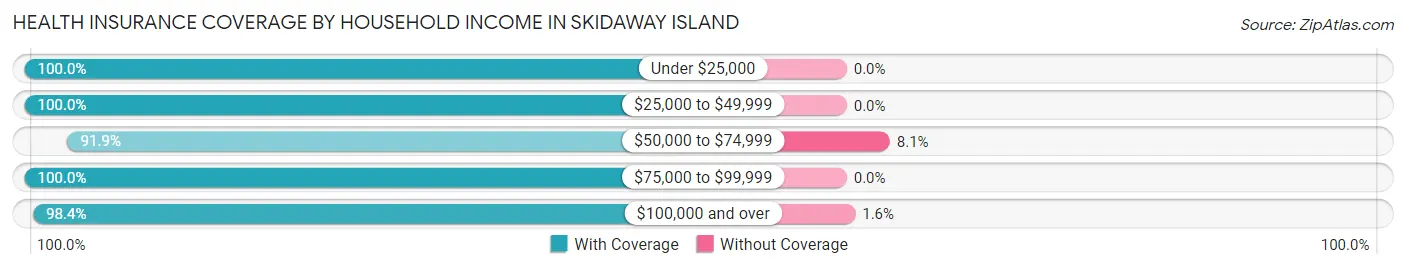
| Household Income | With Coverage | Without Coverage |
| Under $25,000 | 391 (100.0%) | 0 (0.0%) |
| $25,000 to $49,999 | 448 (100.0%) | 0 (0.0%) |
| $50,000 to $74,999 | 890 (91.9%) | 78 (8.1%) |
| $75,000 to $99,999 | 648 (100.0%) | 0 (0.0%) |
| $100,000 and over | 6,696 (98.4%) | 108 (1.6%) |
Public vs Private Health Insurance Coverage by Age in Skidaway Island
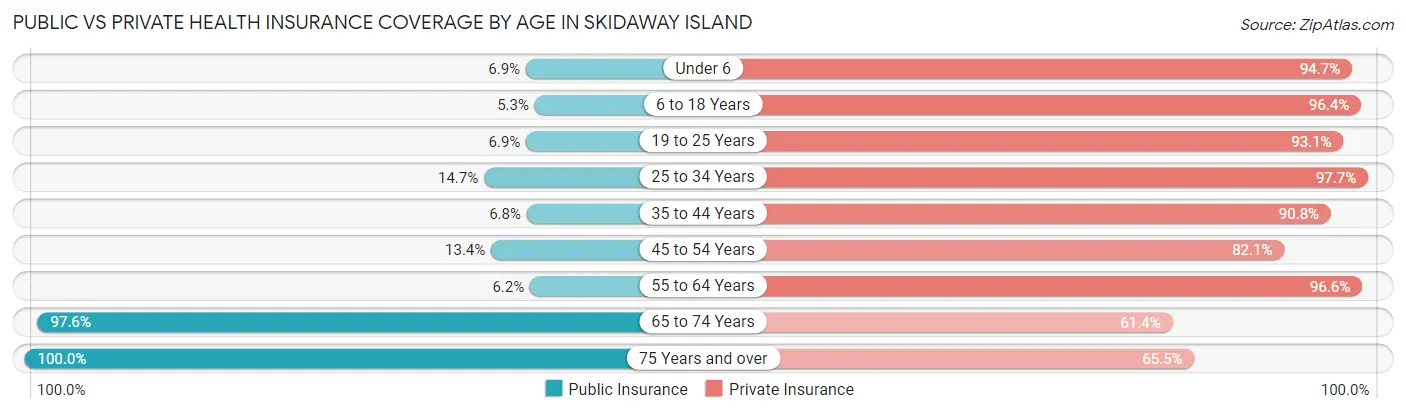
| Age Bracket | Public Insurance | Private Insurance |
| Under 6 | 17 (6.9%) | 232 (94.7%) |
| 6 to 18 Years | 50 (5.3%) | 910 (96.4%) |
| 19 to 25 Years | 10 (6.9%) | 135 (93.1%) |
| 25 to 34 Years | 44 (14.7%) | 292 (97.7%) |
| 35 to 44 Years | 39 (6.8%) | 522 (90.8%) |
| 45 to 54 Years | 96 (13.4%) | 588 (82.1%) |
| 55 to 64 Years | 97 (6.2%) | 1,516 (96.6%) |
| 65 to 74 Years | 2,455 (97.6%) | 1,544 (61.4%) |
| 75 Years and over | 2,255 (100.0%) | 1,476 (65.4%) |
| Total | 5,063 (54.6%) | 7,215 (77.9%) |
Disability Status by Sex by Age in Skidaway Island
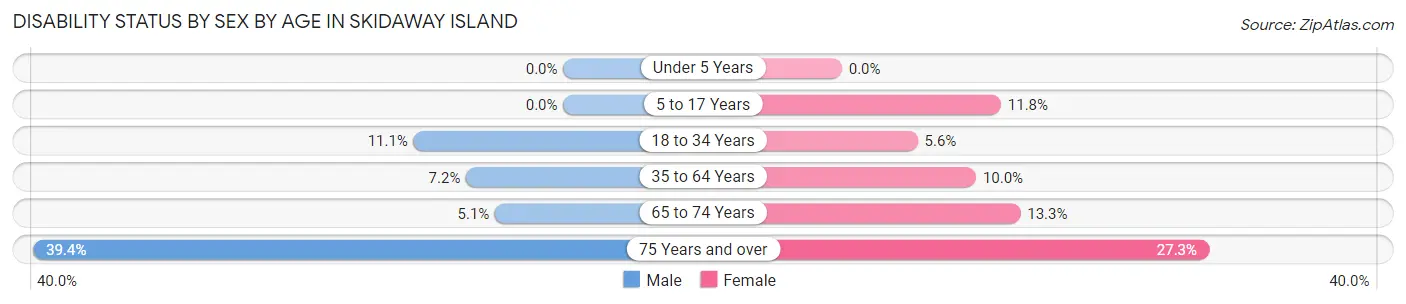
| Age Bracket | Male | Female |
| Under 5 Years | 0 (0.0%) | 0 (0.0%) |
| 5 to 17 Years | 0 (0.0%) | 47 (11.8%) |
| 18 to 34 Years | 34 (11.1%) | 13 (5.6%) |
| 35 to 64 Years | 89 (7.2%) | 162 (10.0%) |
| 65 to 74 Years | 62 (5.1%) | 171 (13.3%) |
| 75 Years and over | 424 (39.4%) | 321 (27.3%) |
Disability Class by Sex by Age in Skidaway Island
Disability Class: Hearing Difficulty
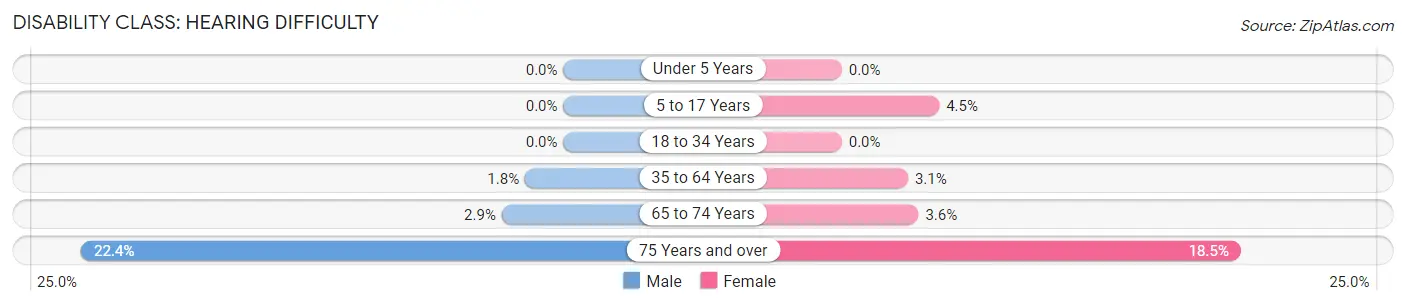
| Age Bracket | Male | Female |
| Under 5 Years | 0 (0.0%) | 0 (0.0%) |
| 5 to 17 Years | 0 (0.0%) | 18 (4.5%) |
| 18 to 34 Years | 0 (0.0%) | 0 (0.0%) |
| 35 to 64 Years | 22 (1.8%) | 50 (3.1%) |
| 65 to 74 Years | 35 (2.9%) | 46 (3.6%) |
| 75 Years and over | 241 (22.4%) | 218 (18.5%) |
Disability Class: Vision Difficulty
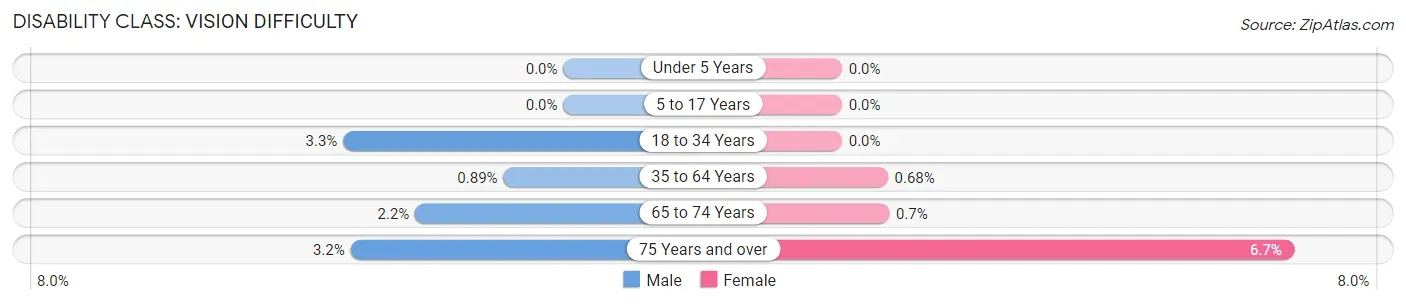
| Age Bracket | Male | Female |
| Under 5 Years | 0 (0.0%) | 0 (0.0%) |
| 5 to 17 Years | 0 (0.0%) | 0 (0.0%) |
| 18 to 34 Years | 10 (3.3%) | 0 (0.0%) |
| 35 to 64 Years | 11 (0.9%) | 11 (0.7%) |
| 65 to 74 Years | 27 (2.2%) | 9 (0.7%) |
| 75 Years and over | 34 (3.2%) | 79 (6.7%) |
Disability Class: Cognitive Difficulty
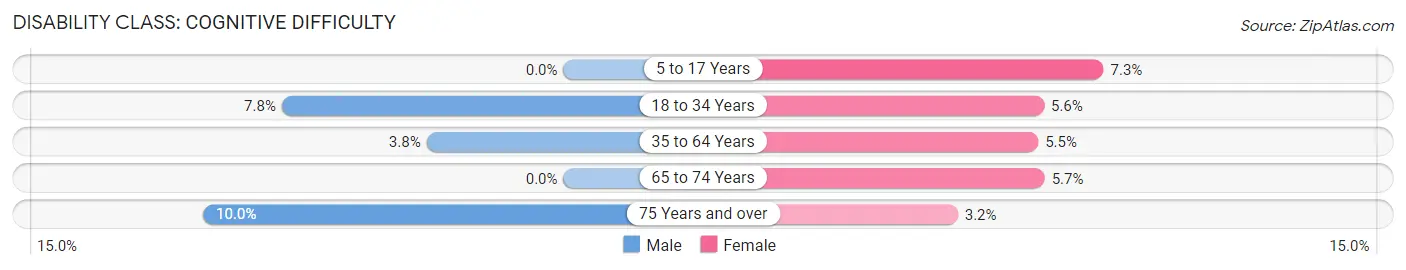
| Age Bracket | Male | Female |
| 5 to 17 Years | 0 (0.0%) | 29 (7.3%) |
| 18 to 34 Years | 24 (7.8%) | 13 (5.6%) |
| 35 to 64 Years | 47 (3.8%) | 89 (5.5%) |
| 65 to 74 Years | 0 (0.0%) | 73 (5.7%) |
| 75 Years and over | 108 (10.0%) | 38 (3.2%) |
Disability Class: Ambulatory Difficulty
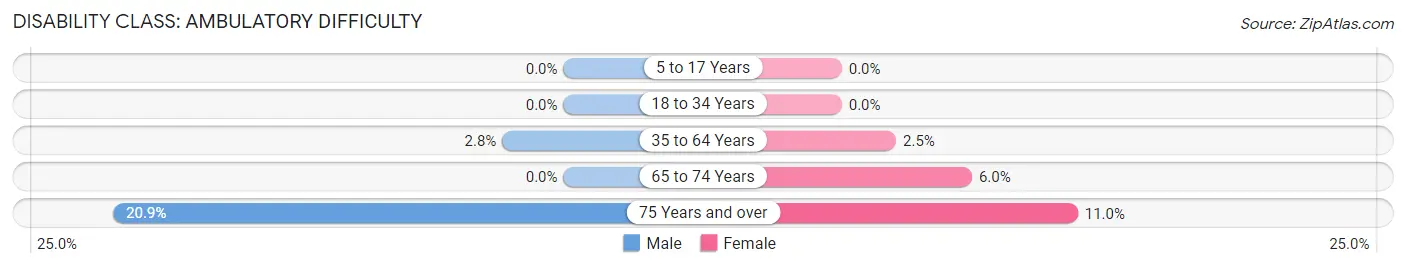
| Age Bracket | Male | Female |
| 5 to 17 Years | 0 (0.0%) | 0 (0.0%) |
| 18 to 34 Years | 0 (0.0%) | 0 (0.0%) |
| 35 to 64 Years | 35 (2.8%) | 41 (2.5%) |
| 65 to 74 Years | 0 (0.0%) | 78 (6.0%) |
| 75 Years and over | 225 (20.9%) | 129 (11.0%) |
Disability Class: Self-Care Difficulty
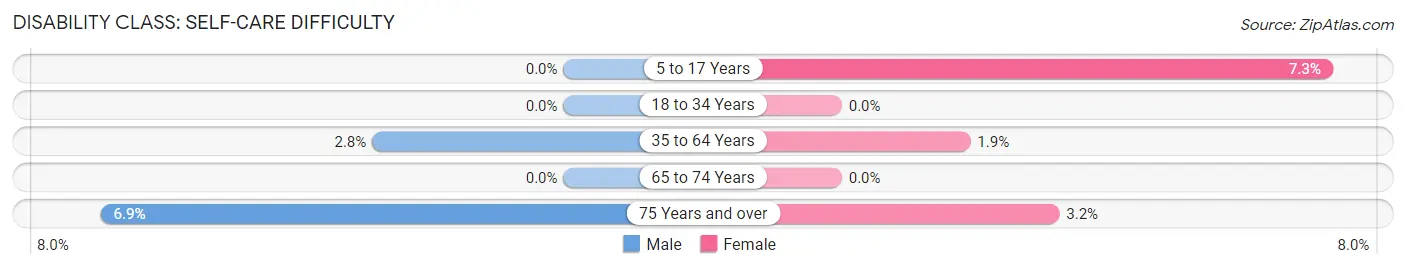
| Age Bracket | Male | Female |
| 5 to 17 Years | 0 (0.0%) | 29 (7.3%) |
| 18 to 34 Years | 0 (0.0%) | 0 (0.0%) |
| 35 to 64 Years | 35 (2.8%) | 31 (1.9%) |
| 65 to 74 Years | 0 (0.0%) | 0 (0.0%) |
| 75 Years and over | 74 (6.9%) | 38 (3.2%) |
Technology Access in Skidaway Island
Computing Device Access in Skidaway Island
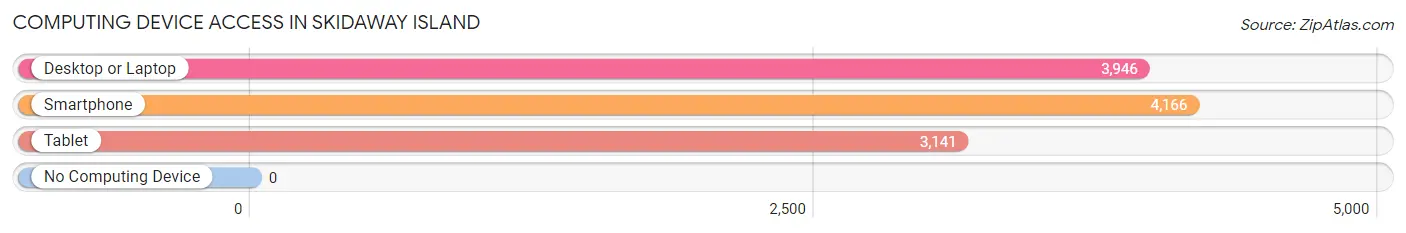
| Device Type | # Households | % Households |
| Desktop or Laptop | 3,946 | 88.1% |
| Smartphone | 4,166 | 93.0% |
| Tablet | 3,141 | 70.1% |
| No Computing Device | 0 | 0.0% |
| Total | 4,481 | 100.0% |
Internet Access in Skidaway Island
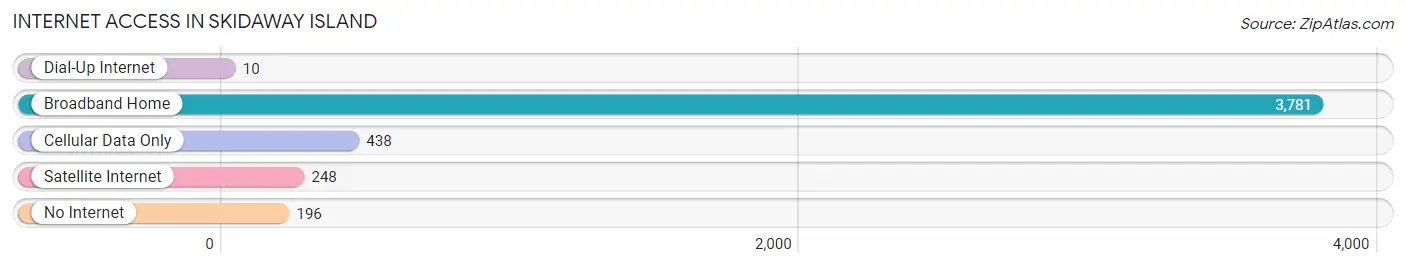
| Internet Type | # Households | % Households |
| Dial-Up Internet | 10 | 0.2% |
| Broadband Home | 3,781 | 84.4% |
| Cellular Data Only | 438 | 9.8% |
| Satellite Internet | 248 | 5.5% |
| No Internet | 196 | 4.4% |
| Total | 4,481 | 100.0% |
Skidaway Island Summary
Skidaway Island is a small island located in Chatham County, Georgia, just south of Savannah. It is part of the Georgia Coast, and is bordered by the Atlantic Ocean, the Wilmington River, and the Skidaway River. The island is approximately 7 miles long and 2 miles wide, and is home to approximately 5,000 people.
History
Skidaway Island has a long and varied history. The island was first inhabited by Native Americans, who used it as a hunting and fishing ground. In the late 1600s, the island was settled by Europeans, who established a small fishing village. The island was named after the Skidaway Indians, who lived in the area.
In the late 1700s, the island was used as a plantation, and cotton was grown there. During the Civil War, the island was used as a staging area for Confederate troops. After the war, the island was used for timber harvesting and farming.
In the early 1900s, the island was developed as a resort destination. The island was home to several hotels, a golf course, and a casino. In the 1950s, the island was developed as a residential community. Today, Skidaway Island is a popular destination for tourists and residents alike.
Geography
Skidaway Island is located in Chatham County, Georgia, just south of Savannah. The island is approximately 7 miles long and 2 miles wide. It is bordered by the Atlantic Ocean, the Wilmington River, and the Skidaway River. The island is mostly flat, with some areas of marshland.
The climate on Skidaway Island is mild and humid. The average temperature in the summer is around 80 degrees Fahrenheit, and the average temperature in the winter is around 60 degrees Fahrenheit. The island receives an average of 50 inches of rain per year.
Economy
Skidaway Island has a thriving economy. The island is home to several businesses, including restaurants, retail stores, and hotels. Tourism is a major industry on the island, and the island is home to several resorts and golf courses.
The island is also home to several marinas, which provide services to boaters. The island is also home to several research facilities, including the Skidaway Institute of Oceanography and the University of Georgia Marine Extension Service.
Demographics
As of the 2010 census, Skidaway Island had a population of 5,000 people. The population is mostly white (90%), with a small African American population (7%). The median household income is $75,000, and the median age is 44.
Skidaway Island is a popular destination for tourists and residents alike. The island is home to several resorts and golf courses, as well as a variety of restaurants and retail stores. The island is also home to several research facilities, making it a popular destination for scientists and researchers.
Common Questions
What is Per Capita Income in Skidaway Island?
Per Capita income in Skidaway Island is $86,178.
What is the Median Family Income in Skidaway Island?
Median Family Income in Skidaway Island is $165,772.
What is the Median Household income in Skidaway Island?
Median Household Income in Skidaway Island is $119,210.
What is Income or Wage Gap in Skidaway Island?
Income or Wage Gap in Skidaway Island is 54.8%.
Women in Skidaway Island earn 45.2 cents for every dollar earned by a man.
What is Family Income Deficit in Skidaway Island?
Family Income Deficit in Skidaway Island is $1,700.
Families that are below poverty line in Skidaway Island earn $1,700 less on average than the poverty threshold level.
What is Inequality or Gini Index in Skidaway Island?
Inequality or Gini Index in Skidaway Island is 0.46.
What is the Total Population of Skidaway Island?
Total Population of Skidaway Island is 9,292.
What is the Total Male Population of Skidaway Island?
Total Male Population of Skidaway Island is 4,439.
What is the Total Female Population of Skidaway Island?
Total Female Population of Skidaway Island is 4,853.
What is the Ratio of Males per 100 Females in Skidaway Island?
There are 91.47 Males per 100 Females in Skidaway Island.
What is the Ratio of Females per 100 Males in Skidaway Island?
There are 109.33 Females per 100 Males in Skidaway Island.
What is the Median Population Age in Skidaway Island?
Median Population Age in Skidaway Island is 66.3 Years.
What is the Average Family Size in Skidaway Island
Average Family Size in Skidaway Island is 2.5 People.
What is the Average Household Size in Skidaway Island
Average Household Size in Skidaway Island is 2.1 People.
How Large is the Labor Force in Skidaway Island?
There are 2,945 People in the Labor Forcein in Skidaway Island.
What is the Percentage of People in the Labor Force in Skidaway Island?
35.4% of People are in the Labor Force in Skidaway Island.
What is the Unemployment Rate in Skidaway Island?
Unemployment Rate in Skidaway Island is 6.9%.