Bonanza, GA Map & Demographics
Bonanza Map

Bonanza Overview
$43,082
PER CAPITA INCOME
$84,128
AVG FAMILY INCOME
$68,257
AVG HOUSEHOLD INCOME
16.8%
WAGE / INCOME GAP [ % ]
83.2¢/ $1
WAGE / INCOME GAP [ $ ]
0.49
INEQUALITY / GINI INDEX
3,638
TOTAL POPULATION
1,533
MALE POPULATION
2,105
FEMALE POPULATION
72.83
MALES / 100 FEMALES
137.31
FEMALES / 100 MALES
36.1
MEDIAN AGE
3.3
AVG FAMILY SIZE
2.5
AVG HOUSEHOLD SIZE
2,023
LABOR FORCE [ PEOPLE ]
70.4%
PERCENT IN LABOR FORCE
8.8%
UNEMPLOYMENT RATE
Income in Bonanza
Income Overview in Bonanza
Per Capita Income in Bonanza is $43,082, while median incomes of families and households are $84,128 and $68,257 respectively.
| Characteristic | Number | Measure |
| Per Capita Income | 3,638 | $43,082 |
| Median Family Income | 877 | $84,128 |
| Mean Family Income | 877 | $127,708 |
| Median Household Income | 1,449 | $68,257 |
| Mean Household Income | 1,449 | $98,933 |
| Income Deficit | 877 | $0 |
| Wage / Income Gap (%) | 3,638 | 16.75% |
| Wage / Income Gap ($) | 3,638 | 83.25¢ per $1 |
| Gini / Inequality Index | 3,638 | 0.49 |
Earnings by Sex in Bonanza
Average Earnings in Bonanza are $46,380, $47,832 for men and $39,818 for women, a difference of 16.8%.
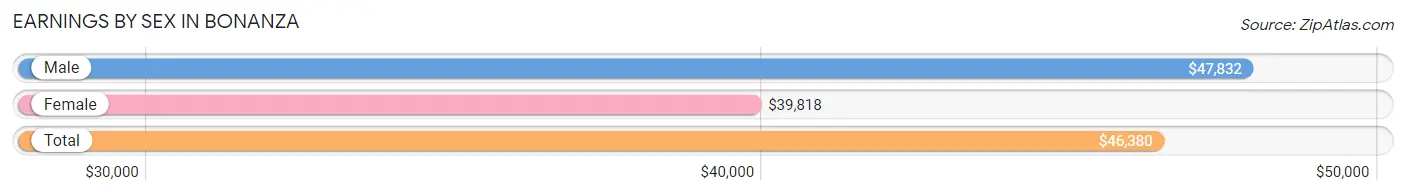
| Sex | Number | Average Earnings |
| Male | 923 (46.9%) | $47,832 |
| Female | 1,046 (53.1%) | $39,818 |
| Total | 1,969 (100.0%) | $46,380 |
Earnings by Sex by Income Bracket in Bonanza
The most common earnings brackets in Bonanza are $45,000 to $49,999 for men (156 | 16.9%) and $100,000+ for women (157 | 15.0%).
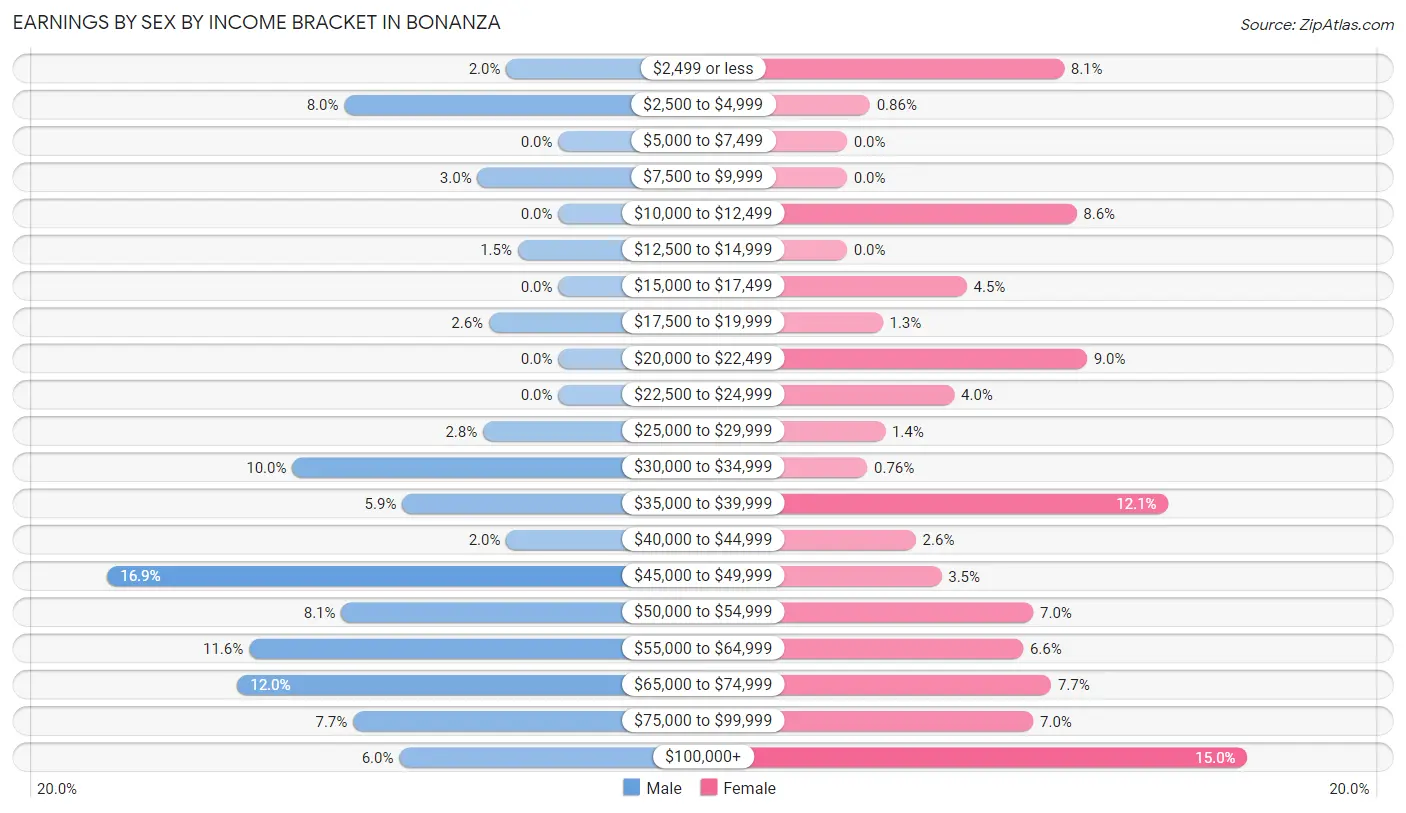
| Income | Male | Female |
| $2,499 or less | 18 (1.9%) | 85 (8.1%) |
| $2,500 to $4,999 | 74 (8.0%) | 9 (0.9%) |
| $5,000 to $7,499 | 0 (0.0%) | 0 (0.0%) |
| $7,500 to $9,999 | 28 (3.0%) | 0 (0.0%) |
| $10,000 to $12,499 | 0 (0.0%) | 90 (8.6%) |
| $12,500 to $14,999 | 14 (1.5%) | 0 (0.0%) |
| $15,000 to $17,499 | 0 (0.0%) | 47 (4.5%) |
| $17,500 to $19,999 | 24 (2.6%) | 14 (1.3%) |
| $20,000 to $22,499 | 0 (0.0%) | 94 (9.0%) |
| $22,500 to $24,999 | 0 (0.0%) | 42 (4.0%) |
| $25,000 to $29,999 | 26 (2.8%) | 15 (1.4%) |
| $30,000 to $34,999 | 92 (10.0%) | 8 (0.8%) |
| $35,000 to $39,999 | 54 (5.9%) | 126 (12.0%) |
| $40,000 to $44,999 | 18 (1.9%) | 27 (2.6%) |
| $45,000 to $49,999 | 156 (16.9%) | 37 (3.5%) |
| $50,000 to $54,999 | 75 (8.1%) | 73 (7.0%) |
| $55,000 to $64,999 | 107 (11.6%) | 69 (6.6%) |
| $65,000 to $74,999 | 111 (12.0%) | 80 (7.6%) |
| $75,000 to $99,999 | 71 (7.7%) | 73 (7.0%) |
| $100,000+ | 55 (6.0%) | 157 (15.0%) |
| Total | 923 (100.0%) | 1,046 (100.0%) |
Earnings by Sex by Educational Attainment in Bonanza
Average earnings in Bonanza are $49,515 for men and $52,928 for women, a difference of 6.5%. Men with an educational attainment of graduate degree enjoy the highest average annual earnings of $69,145, while those with high school diploma education earn the least with $46,968. Women with an educational attainment of bachelor's degree earn the most with the average annual earnings of $58,227, while those with college or associate's degree education have the smallest earnings of $39,570.
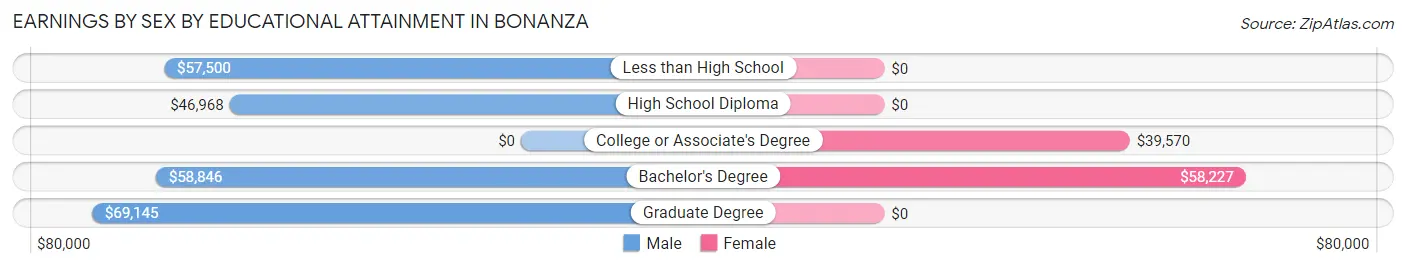
| Educational Attainment | Male Income | Female Income |
| Less than High School | $57,500 | $0 |
| High School Diploma | $46,968 | $0 |
| College or Associate's Degree | - | - |
| Bachelor's Degree | $58,846 | $58,227 |
| Graduate Degree | $69,145 | $0 |
| Total | $49,515 | $52,928 |
Family Income in Bonanza
Family Income Brackets in Bonanza
According to the Bonanza family income data, there are 277 families falling into the $75,000 to $99,999 income range, which is the most common income bracket and makes up 31.6% of all families.
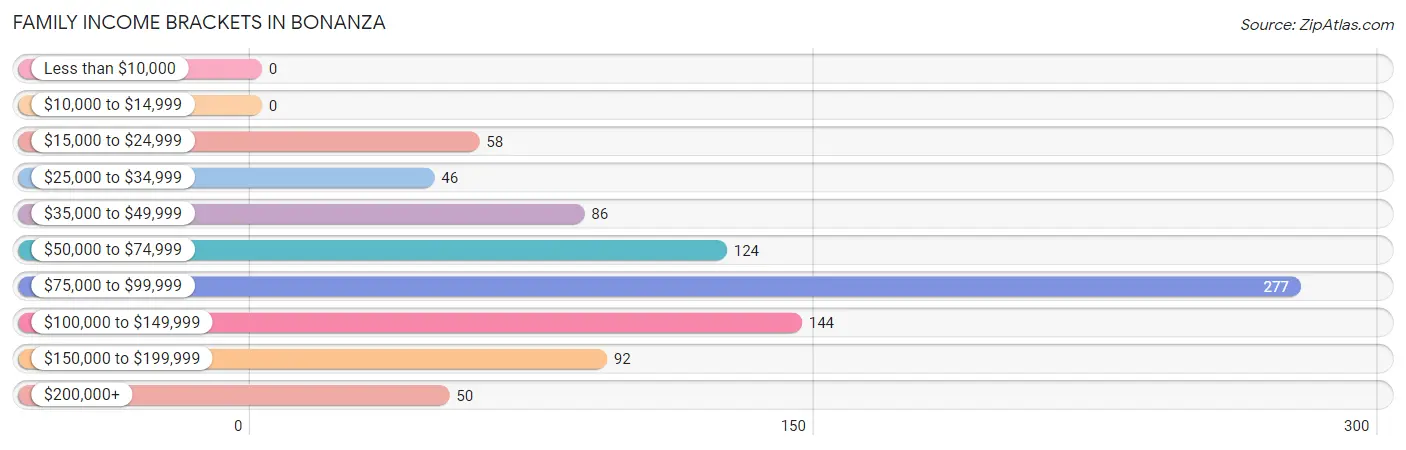
| Income Bracket | # Families | % Families |
| Less than $10,000 | 0 | 0.0% |
| $10,000 to $14,999 | 0 | 0.0% |
| $15,000 to $24,999 | 58 | 6.6% |
| $25,000 to $34,999 | 46 | 5.2% |
| $35,000 to $49,999 | 86 | 9.8% |
| $50,000 to $74,999 | 124 | 14.1% |
| $75,000 to $99,999 | 277 | 31.6% |
| $100,000 to $149,999 | 144 | 16.4% |
| $150,000 to $199,999 | 92 | 10.5% |
| $200,000+ | 50 | 5.7% |
Family Income by Famaliy Size in Bonanza
2-person families (417 | 47.5%) account for the highest median family income in Bonanza with $113,245 per family, while 2-person families (417 | 47.5%) have the highest median income of $56,622 per family member.
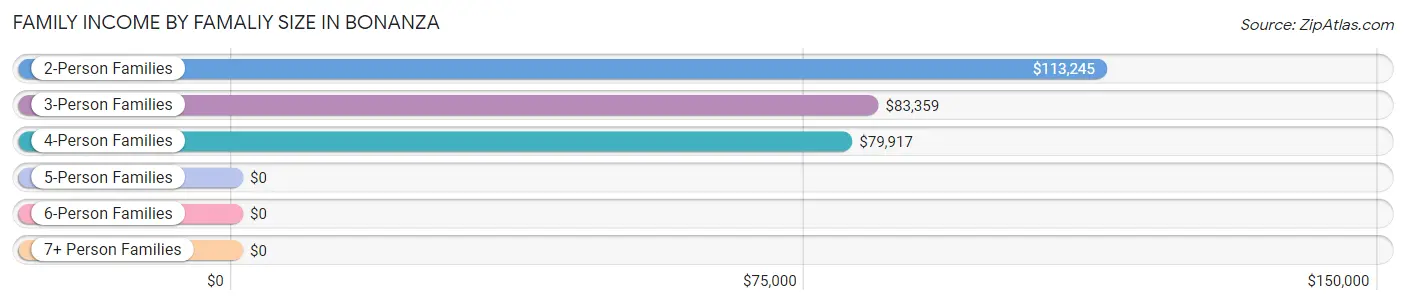
| Income Bracket | # Families | Median Income |
| 2-Person Families | 417 (47.5%) | $113,245 |
| 3-Person Families | 280 (31.9%) | $83,359 |
| 4-Person Families | 143 (16.3%) | $79,917 |
| 5-Person Families | 37 (4.2%) | $0 |
| 6-Person Families | 0 (0.0%) | $0 |
| 7+ Person Families | 0 (0.0%) | $0 |
| Total | 877 (100.0%) | $84,128 |
Family Income by Number of Earners in Bonanza
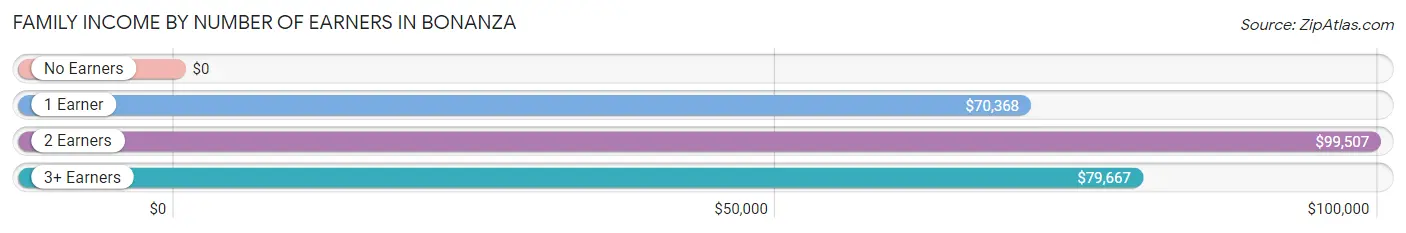
| Number of Earners | # Families | Median Income |
| No Earners | 134 (15.3%) | $0 |
| 1 Earner | 290 (33.1%) | $70,368 |
| 2 Earners | 403 (46.0%) | $99,507 |
| 3+ Earners | 50 (5.7%) | $79,667 |
| Total | 877 (100.0%) | $84,128 |
Household Income in Bonanza
Household Income Brackets in Bonanza
With 354 households falling in the category, the $50,000 to $74,999 income range is the most frequent in Bonanza, accounting for 24.4% of all households. In contrast, only 17 households (1.2%) fall into the $10,000 to $14,999 income bracket, making it the least populous group.
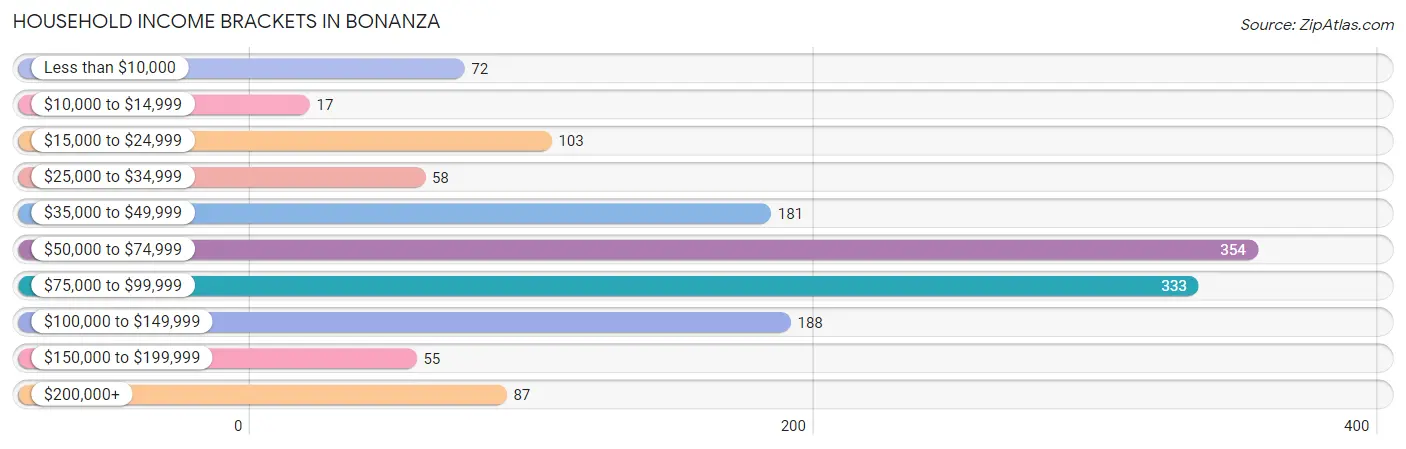
| Income Bracket | # Households | % Households |
| Less than $10,000 | 72 | 5.0% |
| $10,000 to $14,999 | 17 | 1.2% |
| $15,000 to $24,999 | 103 | 7.1% |
| $25,000 to $34,999 | 58 | 4.0% |
| $35,000 to $49,999 | 181 | 12.5% |
| $50,000 to $74,999 | 354 | 24.4% |
| $75,000 to $99,999 | 333 | 23.0% |
| $100,000 to $149,999 | 188 | 13.0% |
| $150,000 to $199,999 | 55 | 3.8% |
| $200,000+ | 87 | 6.0% |
Household Income by Householder Age in Bonanza
The median household income in Bonanza is $68,257, with the highest median household income of $75,930 found in the 25 to 44 years age bracket for the primary householder. A total of 562 households (38.8%) fall into this category.
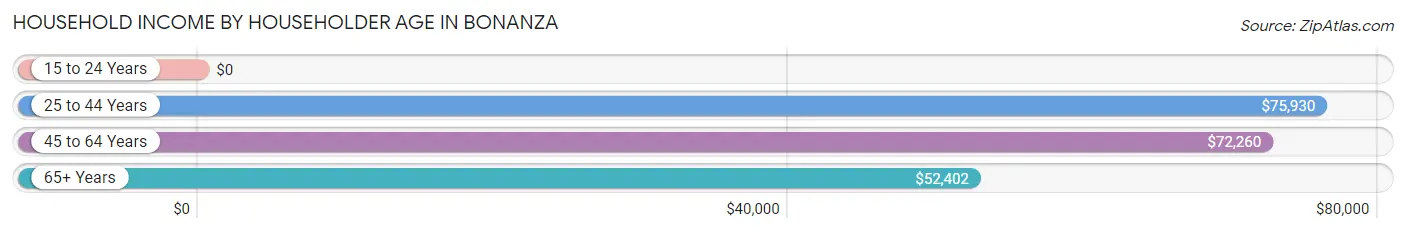
| Income Bracket | # Households | Median Income |
| 15 to 24 Years | 0 (0.0%) | $0 |
| 25 to 44 Years | 562 (38.8%) | $75,930 |
| 45 to 64 Years | 633 (43.7%) | $72,260 |
| 65+ Years | 254 (17.5%) | $52,402 |
| Total | 1,449 (100.0%) | $68,257 |
Poverty in Bonanza
Income Below Poverty by Sex and Age in Bonanza
With 2.2% poverty level for males and 7.8% for females among the residents of Bonanza, 75 year old and over males and 65 to 74 year old females are the most vulnerable to poverty, with 11 males (25.6%) and 17 females (26.6%) in their respective age groups living below the poverty level.
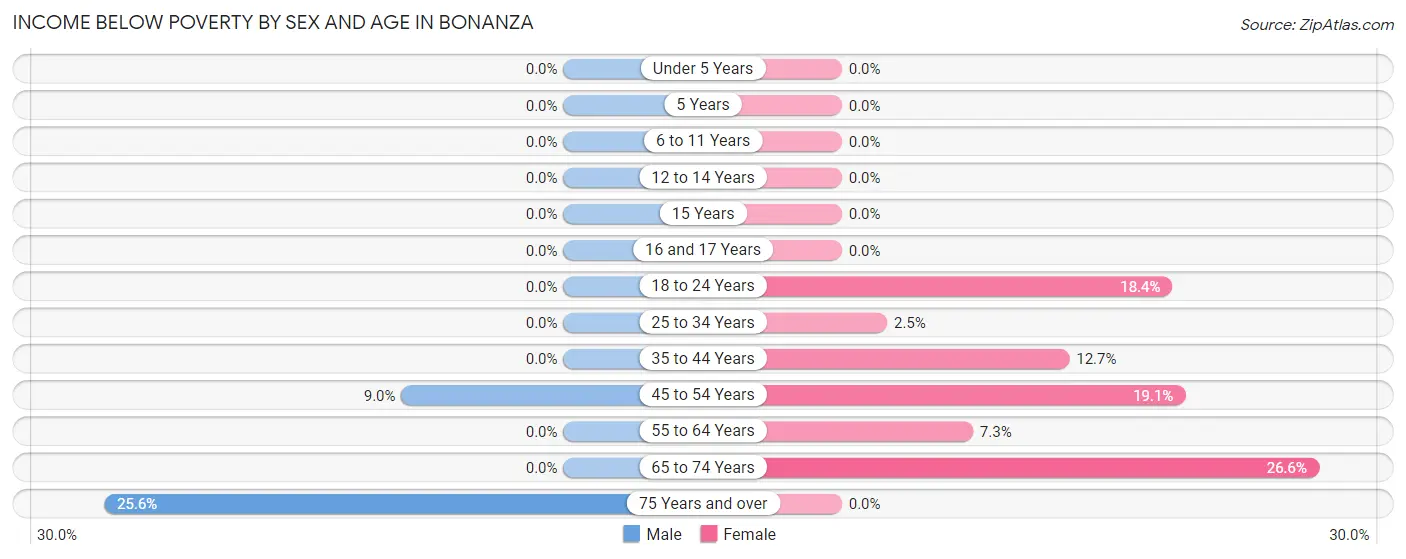
| Age Bracket | Male | Female |
| Under 5 Years | 0 (0.0%) | 0 (0.0%) |
| 5 Years | 0 (0.0%) | 0 (0.0%) |
| 6 to 11 Years | 0 (0.0%) | 0 (0.0%) |
| 12 to 14 Years | 0 (0.0%) | 0 (0.0%) |
| 15 Years | 0 (0.0%) | 0 (0.0%) |
| 16 and 17 Years | 0 (0.0%) | 0 (0.0%) |
| 18 to 24 Years | 0 (0.0%) | 23 (18.4%) |
| 25 to 34 Years | 0 (0.0%) | 9 (2.5%) |
| 35 to 44 Years | 0 (0.0%) | 28 (12.7%) |
| 45 to 54 Years | 23 (9.0%) | 65 (19.1%) |
| 55 to 64 Years | 0 (0.0%) | 23 (7.3%) |
| 65 to 74 Years | 0 (0.0%) | 17 (26.6%) |
| 75 Years and over | 11 (25.6%) | 0 (0.0%) |
| Total | 34 (2.2%) | 165 (7.8%) |
Income Above Poverty by Sex and Age in Bonanza
According to the poverty statistics in Bonanza, males aged under 5 years and females aged under 5 years are the age groups that are most secure financially, with 100.0% of males and 100.0% of females in these age groups living above the poverty line.
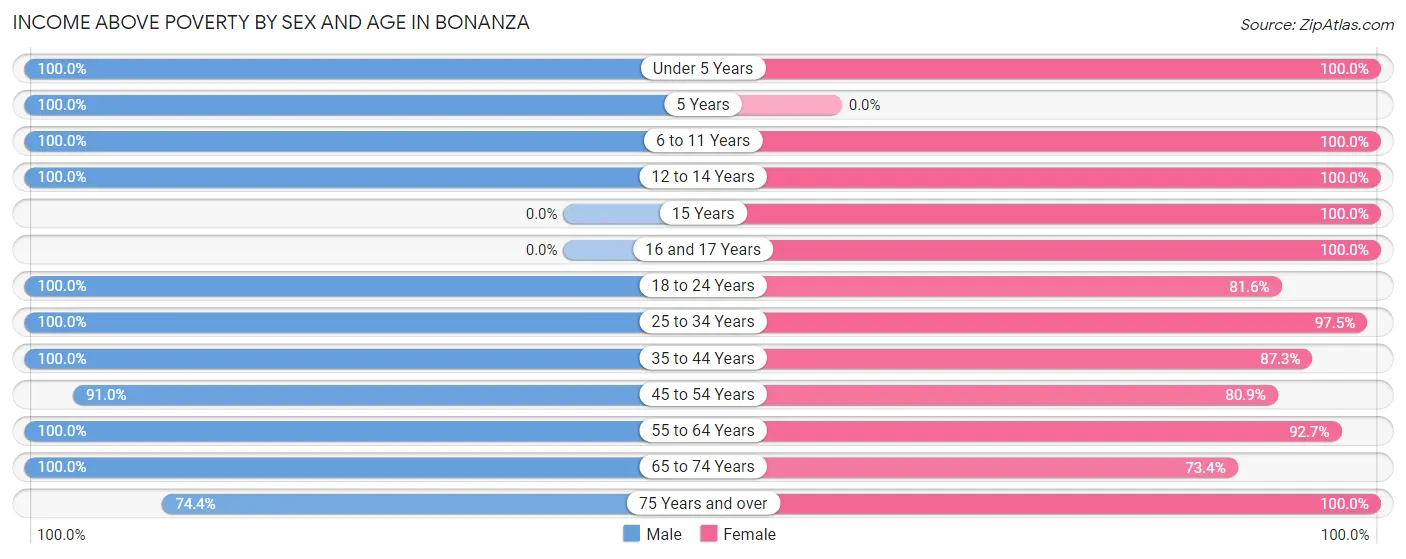
| Age Bracket | Male | Female |
| Under 5 Years | 125 (100.0%) | 83 (100.0%) |
| 5 Years | 72 (100.0%) | 0 (0.0%) |
| 6 to 11 Years | 62 (100.0%) | 235 (100.0%) |
| 12 to 14 Years | 42 (100.0%) | 91 (100.0%) |
| 15 Years | 0 (0.0%) | 46 (100.0%) |
| 16 and 17 Years | 0 (0.0%) | 135 (100.0%) |
| 18 to 24 Years | 66 (100.0%) | 102 (81.6%) |
| 25 to 34 Years | 317 (100.0%) | 348 (97.5%) |
| 35 to 44 Years | 304 (100.0%) | 193 (87.3%) |
| 45 to 54 Years | 232 (91.0%) | 275 (80.9%) |
| 55 to 64 Years | 125 (100.0%) | 292 (92.7%) |
| 65 to 74 Years | 113 (100.0%) | 47 (73.4%) |
| 75 Years and over | 32 (74.4%) | 93 (100.0%) |
| Total | 1,490 (97.8%) | 1,940 (92.2%) |
Income Below Poverty Among Married-Couple Families in Bonanza
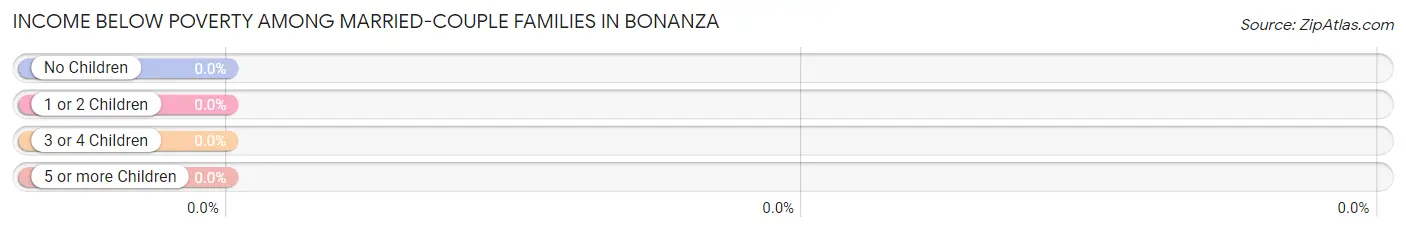
| Children | Above Poverty | Below Poverty |
| No Children | 219 (100.0%) | 0 (0.0%) |
| 1 or 2 Children | 119 (100.0%) | 0 (0.0%) |
| 3 or 4 Children | 33 (100.0%) | 0 (0.0%) |
| 5 or more Children | 0 (0.0%) | 0 (0.0%) |
| Total | 371 (100.0%) | 0 (0.0%) |
Income Below Poverty Among Single-Parent Households in Bonanza
| Children | Single Father | Single Mother |
| No Children | 0 (0.0%) | 0 (0.0%) |
| 1 or 2 Children | 0 (0.0%) | 0 (0.0%) |
| 3 or 4 Children | 0 (0.0%) | 0 (0.0%) |
| 5 or more Children | 0 (0.0%) | 0 (0.0%) |
| Total | 0 (0.0%) | 0 (0.0%) |
Income Below Poverty Among Married-Couple vs Single-Parent Households in Bonanza
| Children | Married-Couple Families | Single-Parent Households |
| No Children | 0 (0.0%) | 0 (0.0%) |
| 1 or 2 Children | 0 (0.0%) | 0 (0.0%) |
| 3 or 4 Children | 0 (0.0%) | 0 (0.0%) |
| 5 or more Children | 0 (0.0%) | 0 (0.0%) |
| Total | 0 (0.0%) | 0 (0.0%) |
Race in Bonanza
The most populous races in Bonanza are Black / African American (2,525 | 69.4%), White / Caucasian (379 | 10.4%), and Asian (358 | 9.8%).
| Race | # Population | % Population |
| Asian | 358 | 9.8% |
| Black / African American | 2,525 | 69.4% |
| Hawaiian / Pacific | 0 | 0.0% |
| Hispanic or Latino | 351 | 9.7% |
| Native / Alaskan | 28 | 0.8% |
| White / Caucasian | 379 | 10.4% |
| Two or more Races | 253 | 7.0% |
| Some other Race | 95 | 2.6% |
| Total | 3,638 | 100.0% |
Ancestry in Bonanza
The most populous ancestries reported in Bonanza are English (352 | 9.7%), Thai (333 | 9.1%), Mexican (312 | 8.6%), African (307 | 8.4%), and Subsaharan African (307 | 8.4%), together accounting for 44.3% of all Bonanza residents.
| Ancestry | # Population | % Population |
| African | 307 | 8.4% |
| American | 235 | 6.5% |
| Burmese | 23 | 0.6% |
| Cherokee | 18 | 0.5% |
| Dominican | 8 | 0.2% |
| English | 352 | 9.7% |
| European | 3 | 0.1% |
| German | 69 | 1.9% |
| Icelander | 22 | 0.6% |
| Irish | 84 | 2.3% |
| Italian | 35 | 1.0% |
| Korean | 2 | 0.1% |
| Mexican | 312 | 8.6% |
| Mexican American Indian | 28 | 0.8% |
| Puerto Rican | 14 | 0.4% |
| Scottish | 1 | 0.0% |
| Subsaharan African | 307 | 8.4% |
| Thai | 333 | 9.1% |
| Trinidadian and Tobagonian | 40 | 1.1% | View All 19 Rows |
Immigrants in Bonanza
The most numerous immigrant groups reported in Bonanza came from Latin America (169 | 4.6%), Central America (110 | 3.0%), Asia (104 | 2.9%), Mexico (93 | 2.6%), and India (79 | 2.2%), together accounting for 15.3% of all Bonanza residents.
| Immigration Origin | # Population | % Population |
| Asia | 104 | 2.9% |
| Canada | 22 | 0.6% |
| Caribbean | 48 | 1.3% |
| Central America | 110 | 3.0% |
| Dominican Republic | 8 | 0.2% |
| Eastern Asia | 23 | 0.6% |
| Guyana | 11 | 0.3% |
| India | 79 | 2.2% |
| Korea | 23 | 0.6% |
| Latin America | 169 | 4.6% |
| Mexico | 93 | 2.6% |
| Panama | 17 | 0.5% |
| Philippines | 2 | 0.1% |
| South America | 11 | 0.3% |
| South Central Asia | 79 | 2.2% |
| South Eastern Asia | 2 | 0.1% |
| Trinidad and Tobago | 40 | 1.1% | View All 17 Rows |
Sex and Age in Bonanza
Sex and Age in Bonanza
The most populous age groups in Bonanza are 30 to 34 Years (188 | 12.3%) for men and 25 to 29 Years (279 | 13.3%) for women.
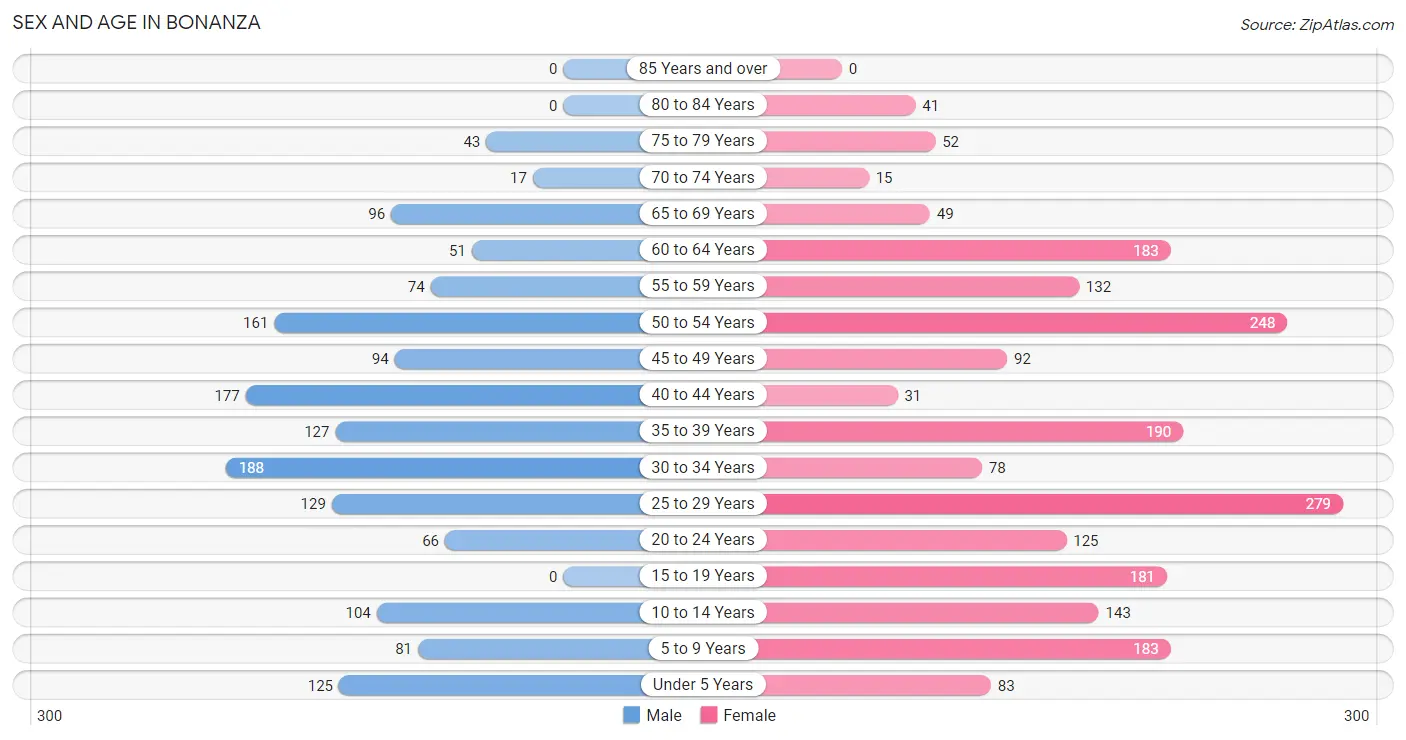
| Age Bracket | Male | Female |
| Under 5 Years | 125 (8.2%) | 83 (3.9%) |
| 5 to 9 Years | 81 (5.3%) | 183 (8.7%) |
| 10 to 14 Years | 104 (6.8%) | 143 (6.8%) |
| 15 to 19 Years | 0 (0.0%) | 181 (8.6%) |
| 20 to 24 Years | 66 (4.3%) | 125 (5.9%) |
| 25 to 29 Years | 129 (8.4%) | 279 (13.3%) |
| 30 to 34 Years | 188 (12.3%) | 78 (3.7%) |
| 35 to 39 Years | 127 (8.3%) | 190 (9.0%) |
| 40 to 44 Years | 177 (11.6%) | 31 (1.5%) |
| 45 to 49 Years | 94 (6.1%) | 92 (4.4%) |
| 50 to 54 Years | 161 (10.5%) | 248 (11.8%) |
| 55 to 59 Years | 74 (4.8%) | 132 (6.3%) |
| 60 to 64 Years | 51 (3.3%) | 183 (8.7%) |
| 65 to 69 Years | 96 (6.3%) | 49 (2.3%) |
| 70 to 74 Years | 17 (1.1%) | 15 (0.7%) |
| 75 to 79 Years | 43 (2.8%) | 52 (2.5%) |
| 80 to 84 Years | 0 (0.0%) | 41 (1.9%) |
| 85 Years and over | 0 (0.0%) | 0 (0.0%) |
| Total | 1,533 (100.0%) | 2,105 (100.0%) |
Families and Households in Bonanza
Median Family Size in Bonanza
The median family size in Bonanza is 3.26 persons per family, with single male/father families (77 | 8.8%) accounting for the largest median family size of 4.36 persons per family. On the other hand, single female/mother families (429 | 48.9%) represent the smallest median family size with 2.88 persons per family.
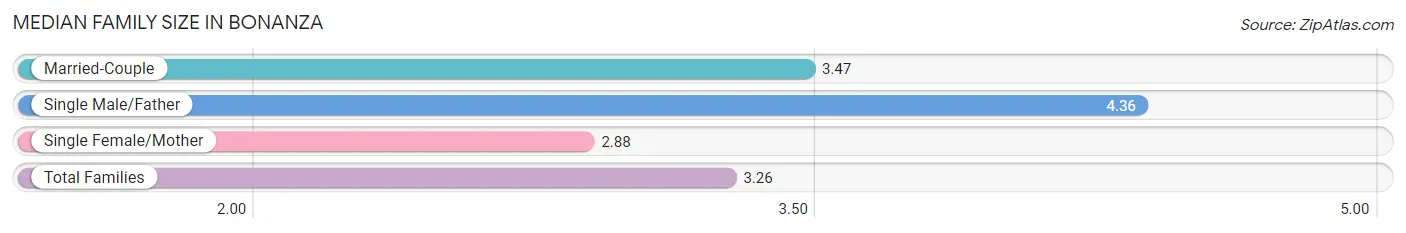
| Family Type | # Families | Family Size |
| Married-Couple | 371 (42.3%) | 3.47 |
| Single Male/Father | 77 (8.8%) | 4.36 |
| Single Female/Mother | 429 (48.9%) | 2.88 |
| Total Families | 877 (100.0%) | 3.26 |
Median Household Size in Bonanza
The median household size in Bonanza is 2.51 persons per household, with single male/father households (77 | 5.3%) accounting for the largest median household size of 4.61 persons per household. non-family households (572 | 39.5%) represent the smallest median household size with 1.18 persons per household.
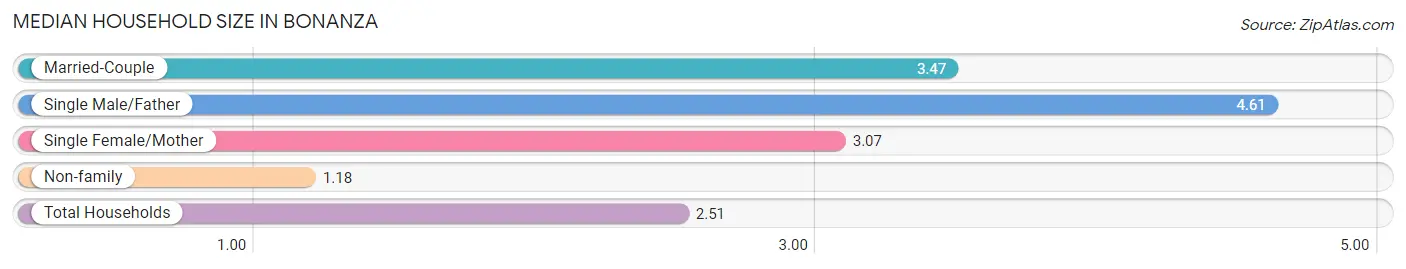
| Household Type | # Households | Household Size |
| Married-Couple | 371 (25.6%) | 3.47 |
| Single Male/Father | 77 (5.3%) | 4.61 |
| Single Female/Mother | 429 (29.6%) | 3.07 |
| Non-family | 572 (39.5%) | 1.18 |
| Total Households | 1,449 (100.0%) | 2.51 |
Household Size by Marriage Status in Bonanza
Out of a total of 1,449 households in Bonanza, 877 (60.5%) are family households, while 572 (39.5%) are nonfamily households. The most numerous type of family households are 2-person households, comprising 380, and the most common type of nonfamily households are 1-person households, comprising 446.
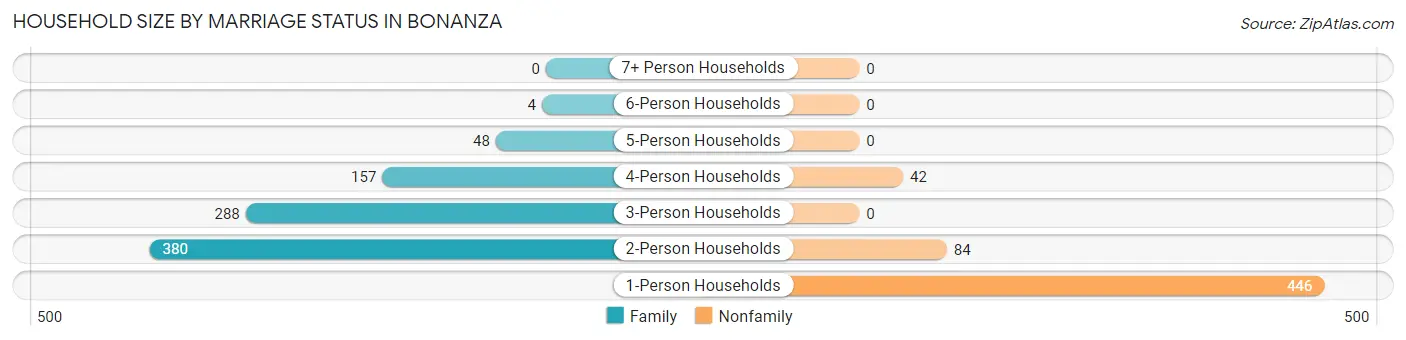
| Household Size | Family Households | Nonfamily Households |
| 1-Person Households | - | 446 (30.8%) |
| 2-Person Households | 380 (26.2%) | 84 (5.8%) |
| 3-Person Households | 288 (19.9%) | 0 (0.0%) |
| 4-Person Households | 157 (10.8%) | 42 (2.9%) |
| 5-Person Households | 48 (3.3%) | 0 (0.0%) |
| 6-Person Households | 4 (0.3%) | 0 (0.0%) |
| 7+ Person Households | 0 (0.0%) | 0 (0.0%) |
| Total | 877 (60.5%) | 572 (39.5%) |
Female Fertility in Bonanza
Fertility by Age in Bonanza
| Age Bracket | Women with Births | Births / 1,000 Women |
| 15 to 19 years | 0 (0.0%) | 0.0 |
| 20 to 34 years | 0 (0.0%) | 0.0 |
| 35 to 50 years | 0 (0.0%) | 0.0 |
| Total | 0 (0.0%) | 0.0 |
Fertility by Age by Marriage Status in Bonanza
| Age Bracket | Married | Unmarried |
| 15 to 19 years | 0 (0.0%) | 0 (0.0%) |
| 20 to 34 years | 0 (0.0%) | 0 (0.0%) |
| 35 to 50 years | 0 (0.0%) | 0 (0.0%) |
| Total | 0 (0.0%) | 0 (0.0%) |
Fertility by Education in Bonanza
| Educational Attainment | Women with Births | Births / 1,000 Women |
| Less than High School | 0 (0.0%) | 0.0 |
| High School Diploma | 0 (0.0%) | 0.0 |
| College or Associate's Degree | 0 (0.0%) | 0.0 |
| Bachelor's Degree | 0 (0.0%) | 0.0 |
| Graduate Degree | 0 (0.0%) | 0.0 |
| Total | 0 (0.0%) | 0.0 |
Fertility by Education by Marriage Status in Bonanza
| Educational Attainment | Married | Unmarried |
| Less than High School | 0 (0.0%) | 0 (0.0%) |
| High School Diploma | 0 (0.0%) | 0 (0.0%) |
| College or Associate's Degree | 0 (0.0%) | 0 (0.0%) |
| Bachelor's Degree | 0 (0.0%) | 0 (0.0%) |
| Graduate Degree | 0 (0.0%) | 0 (0.0%) |
| Total | 0 (0.0%) | 0 (0.0%) |
Employment Characteristics in Bonanza
Employment by Class of Employer in Bonanza
Among the 1,768 employed individuals in Bonanza, private company employees (1,402 | 79.3%), local government employees (164 | 9.3%), and not-for-profit organizations (98 | 5.5%) make up the most common classes of employment.
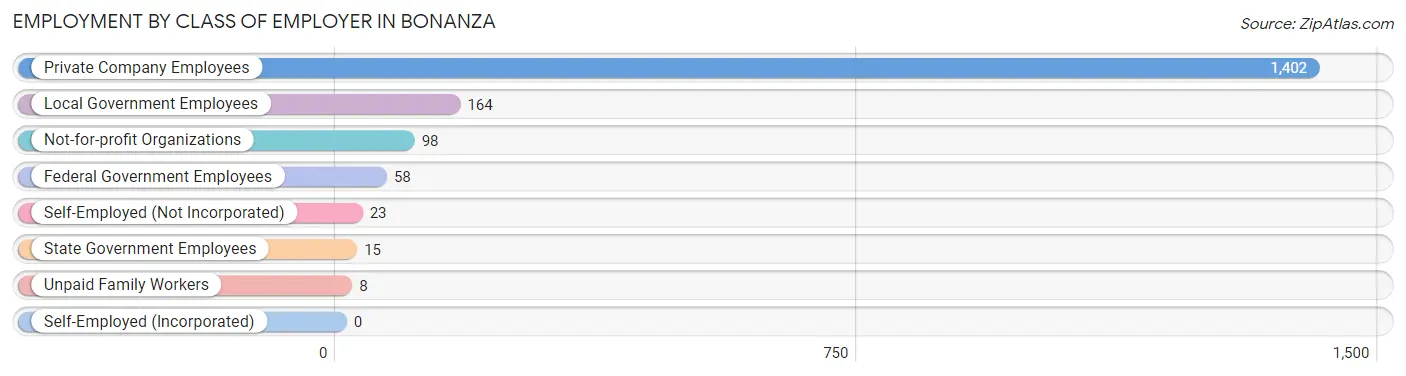
| Employer Class | # Employees | % Employees |
| Private Company Employees | 1,402 | 79.3% |
| Self-Employed (Incorporated) | 0 | 0.0% |
| Self-Employed (Not Incorporated) | 23 | 1.3% |
| Not-for-profit Organizations | 98 | 5.5% |
| Local Government Employees | 164 | 9.3% |
| State Government Employees | 15 | 0.9% |
| Federal Government Employees | 58 | 3.3% |
| Unpaid Family Workers | 8 | 0.4% |
| Total | 1,768 | 100.0% |
Employment Status by Age in Bonanza
According to the labor force statistics for Bonanza, out of the total population over 16 years of age (2,873), 70.4% or 2,023 individuals are in the labor force, with 8.8% or 178 of them unemployed. The age group with the highest labor force participation rate is 20 to 24 years, with 100.0% or 191 individuals in the labor force. Within the labor force, the 20 to 24 years age range has the highest percentage of unemployed individuals, with 51.3% or 98 of them being unemployed.
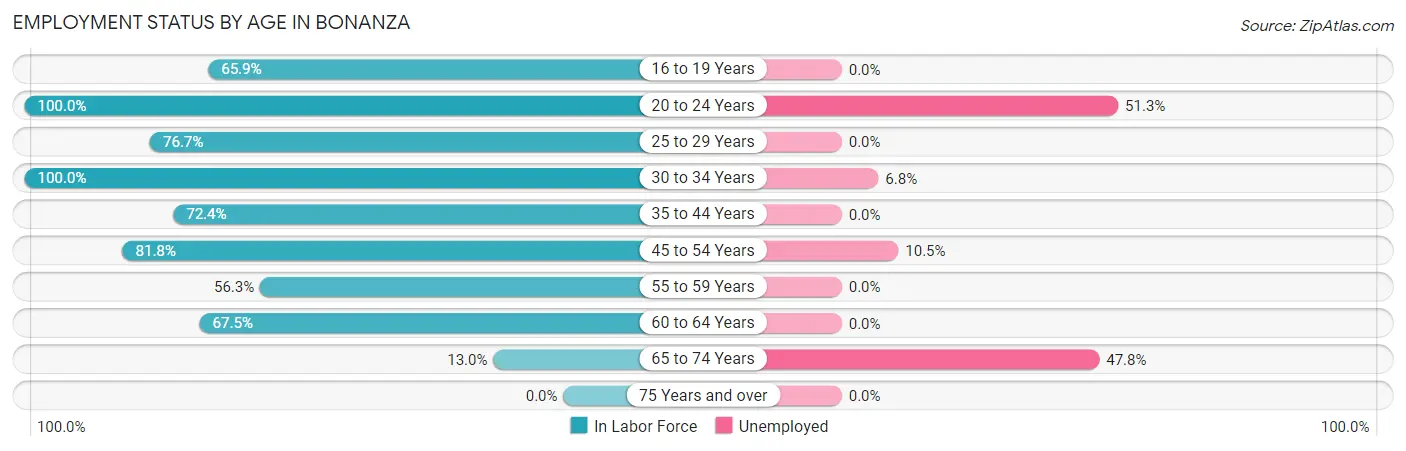
| Age Bracket | In Labor Force | Unemployed |
| 16 to 19 Years | 89 (65.9%) | 0 (0.0%) |
| 20 to 24 Years | 191 (100.0%) | 98 (51.3%) |
| 25 to 29 Years | 313 (76.7%) | 0 (0.0%) |
| 30 to 34 Years | 266 (100.0%) | 18 (6.8%) |
| 35 to 44 Years | 380 (72.4%) | 0 (0.0%) |
| 45 to 54 Years | 487 (81.8%) | 51 (10.5%) |
| 55 to 59 Years | 116 (56.3%) | 0 (0.0%) |
| 60 to 64 Years | 158 (67.5%) | 0 (0.0%) |
| 65 to 74 Years | 23 (13.0%) | 11 (47.8%) |
| 75 Years and over | 0 (0.0%) | 0 (0.0%) |
| Total | 2,023 (70.4%) | 178 (8.8%) |
Employment Status by Educational Attainment in Bonanza
According to labor force statistics for Bonanza, 77.0% of individuals (1,720) out of the total population between 25 and 64 years of age (2,234) are in the labor force, with 4.0% or 69 of them being unemployed. The group with the highest labor force participation rate are those with the educational attainment of bachelor's degree or higher, with 100.0% or 588 individuals in the labor force. Within the labor force, individuals with high school diploma education have the highest percentage of unemployment, with 13.3% or 69 of them being unemployed.
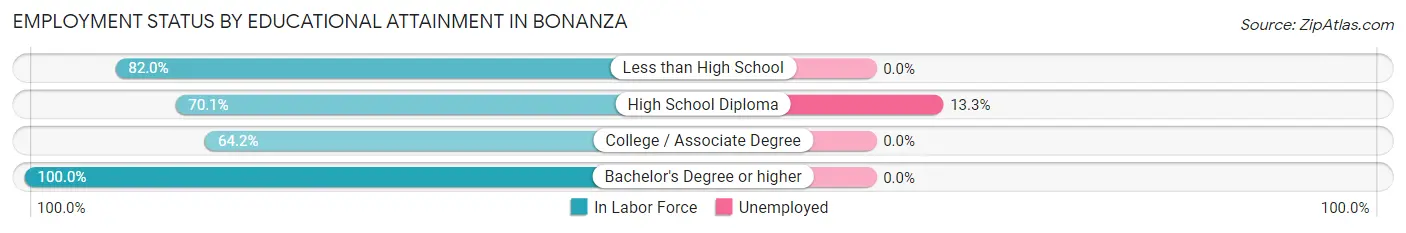
| Educational Attainment | In Labor Force | Unemployed |
| Less than High School | 146 (82.0%) | 0 (0.0%) |
| High School Diploma | 517 (70.1%) | 98 (13.3%) |
| College / Associate Degree | 469 (64.2%) | 0 (0.0%) |
| Bachelor's Degree or higher | 588 (100.0%) | 0 (0.0%) |
| Total | 1,720 (77.0%) | 89 (4.0%) |
Employment Occupations by Sex in Bonanza
Management, Business, Science and Arts Occupations
The most common Management, Business, Science and Arts occupations in Bonanza are Health Diagnosing & Treating (303 | 16.4%), Health Technologists (132 | 7.1%), Community & Social Service (124 | 6.7%), Education Instruction & Library (124 | 6.7%), and Computers, Engineering & Science (93 | 5.0%).
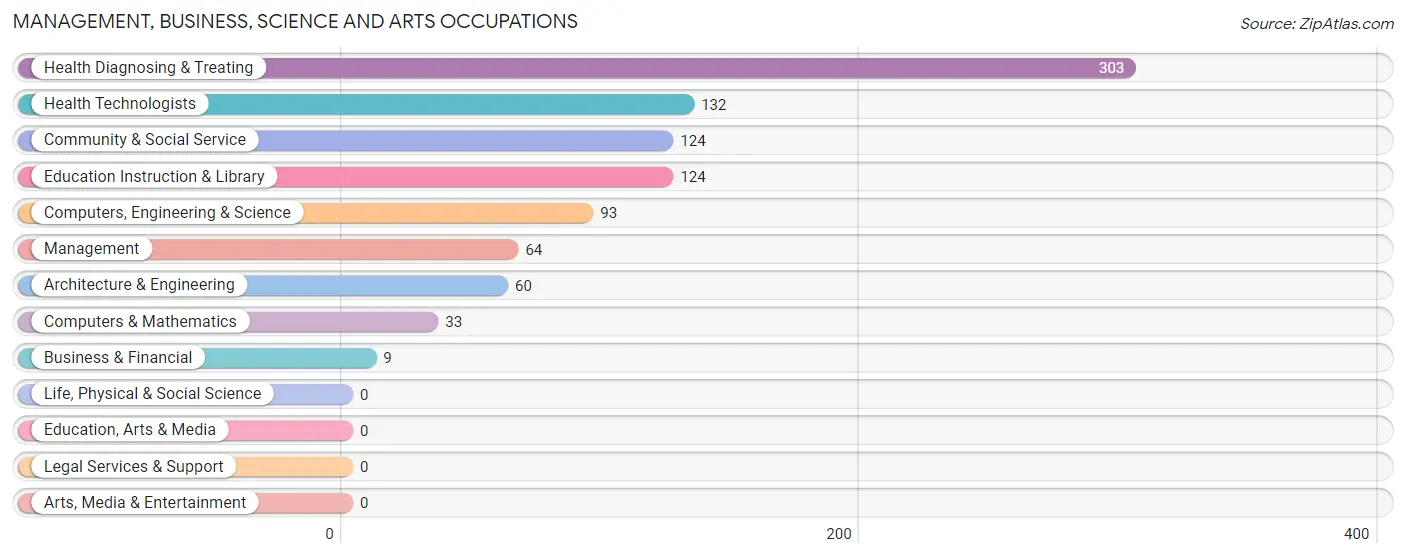
Management, Business, Science and Arts Occupations by Sex
Within the Management, Business, Science and Arts occupations in Bonanza, the most male-oriented occupations are Computers, Engineering & Science (100.0%), Computers & Mathematics (100.0%), and Architecture & Engineering (100.0%), while the most female-oriented occupations are Business & Financial (100.0%), Health Technologists (100.0%), and Community & Social Service (83.1%).
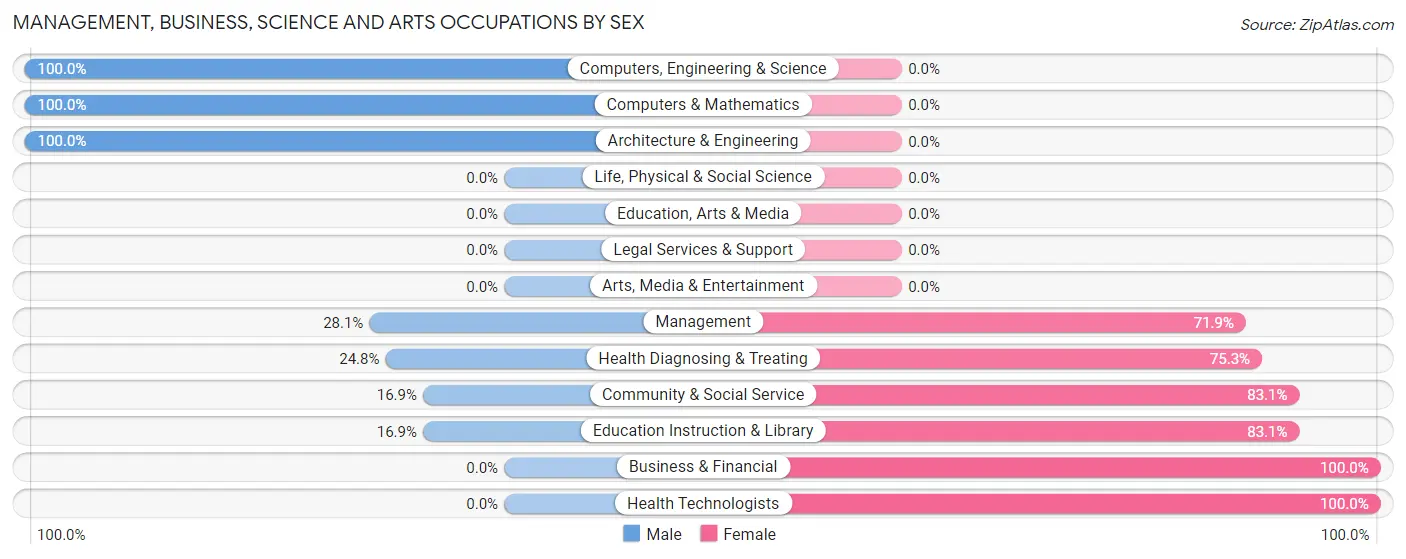
| Occupation | Male | Female |
| Management | 18 (28.1%) | 46 (71.9%) |
| Business & Financial | 0 (0.0%) | 9 (100.0%) |
| Computers, Engineering & Science | 93 (100.0%) | 0 (0.0%) |
| Computers & Mathematics | 33 (100.0%) | 0 (0.0%) |
| Architecture & Engineering | 60 (100.0%) | 0 (0.0%) |
| Life, Physical & Social Science | 0 (0.0%) | 0 (0.0%) |
| Community & Social Service | 21 (16.9%) | 103 (83.1%) |
| Education, Arts & Media | 0 (0.0%) | 0 (0.0%) |
| Legal Services & Support | 0 (0.0%) | 0 (0.0%) |
| Education Instruction & Library | 21 (16.9%) | 103 (83.1%) |
| Arts, Media & Entertainment | 0 (0.0%) | 0 (0.0%) |
| Health Diagnosing & Treating | 75 (24.7%) | 228 (75.2%) |
| Health Technologists | 0 (0.0%) | 132 (100.0%) |
| Total (Category) | 207 (34.9%) | 386 (65.1%) |
| Total (Overall) | 822 (44.6%) | 1,023 (55.4%) |
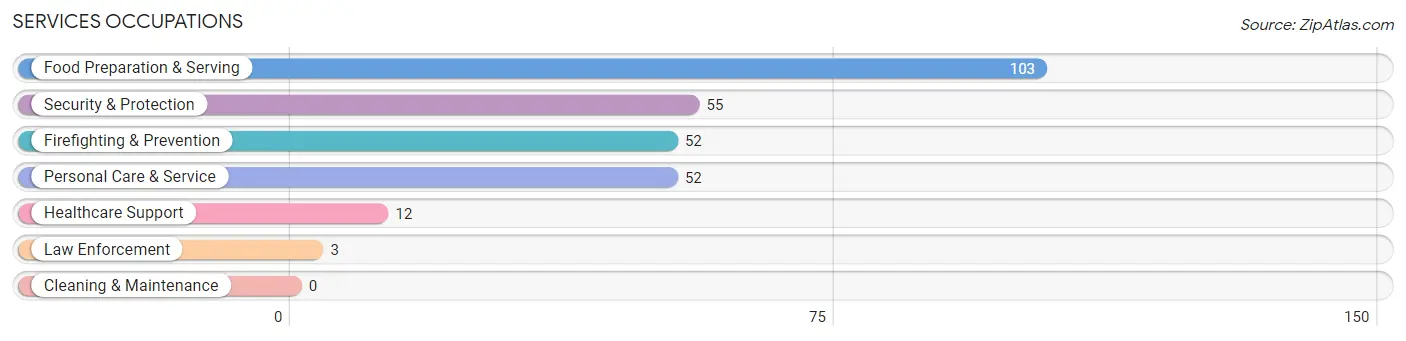
Services Occupations
The most common Services occupations in Bonanza are Food Preparation & Serving (103 | 5.6%), Security & Protection (55 | 3.0%), Firefighting & Prevention (52 | 2.8%), Personal Care & Service (52 | 2.8%), and Healthcare Support (12 | 0.6%).
Services Occupations by Sex
Within the Services occupations in Bonanza, the most male-oriented occupations are Law Enforcement (100.0%), Personal Care & Service (100.0%), and Security & Protection (89.1%), while the most female-oriented occupations are Healthcare Support (100.0%), Food Preparation & Serving (100.0%), and Firefighting & Prevention (11.5%).
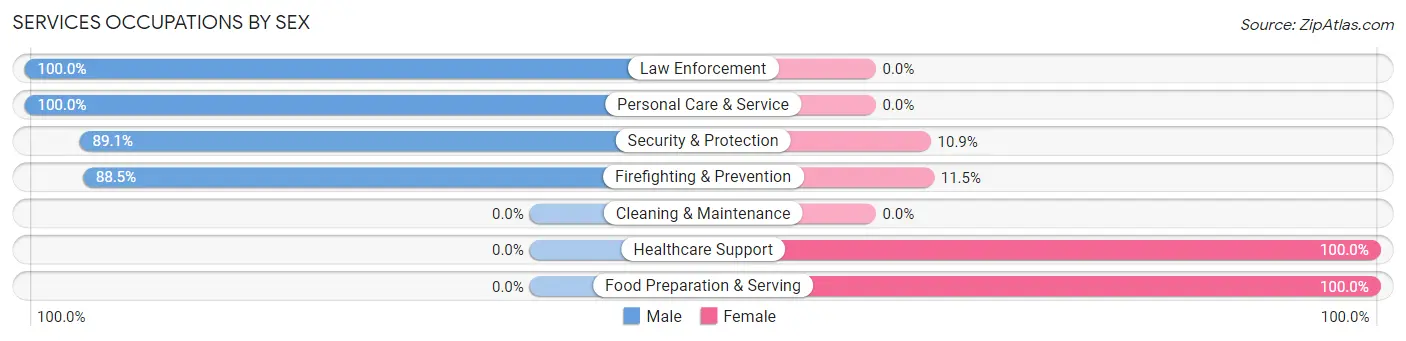
| Occupation | Male | Female |
| Healthcare Support | 0 (0.0%) | 12 (100.0%) |
| Security & Protection | 49 (89.1%) | 6 (10.9%) |
| Firefighting & Prevention | 46 (88.5%) | 6 (11.5%) |
| Law Enforcement | 3 (100.0%) | 0 (0.0%) |
| Food Preparation & Serving | 0 (0.0%) | 103 (100.0%) |
| Cleaning & Maintenance | 0 (0.0%) | 0 (0.0%) |
| Personal Care & Service | 52 (100.0%) | 0 (0.0%) |
| Total (Category) | 101 (45.5%) | 121 (54.5%) |
| Total (Overall) | 822 (44.6%) | 1,023 (55.4%) |
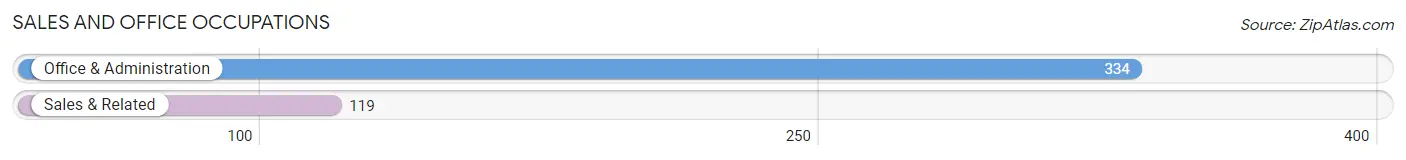
Sales and Office Occupations
The most common Sales and Office occupations in Bonanza are Office & Administration (334 | 18.1%), and Sales & Related (119 | 6.5%).
Sales and Office Occupations by Sex
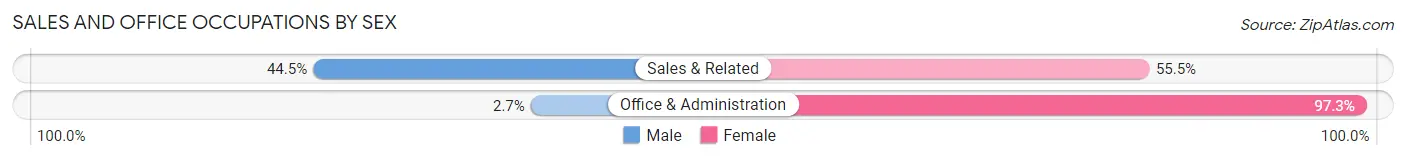
| Occupation | Male | Female |
| Sales & Related | 53 (44.5%) | 66 (55.5%) |
| Office & Administration | 9 (2.7%) | 325 (97.3%) |
| Total (Category) | 62 (13.7%) | 391 (86.3%) |
| Total (Overall) | 822 (44.6%) | 1,023 (55.4%) |
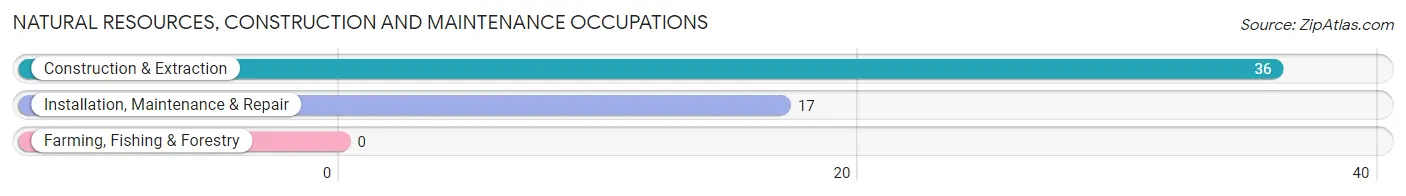
Natural Resources, Construction and Maintenance Occupations
The most common Natural Resources, Construction and Maintenance occupations in Bonanza are Construction & Extraction (36 | 1.9%), and Installation, Maintenance & Repair (17 | 0.9%).
Natural Resources, Construction and Maintenance Occupations by Sex
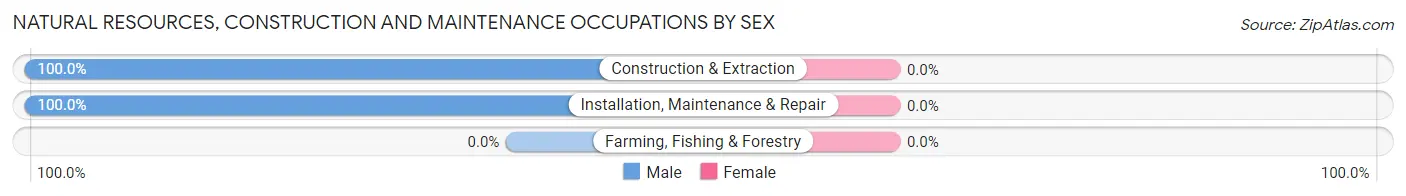
| Occupation | Male | Female |
| Farming, Fishing & Forestry | 0 (0.0%) | 0 (0.0%) |
| Construction & Extraction | 36 (100.0%) | 0 (0.0%) |
| Installation, Maintenance & Repair | 17 (100.0%) | 0 (0.0%) |
| Total (Category) | 53 (100.0%) | 0 (0.0%) |
| Total (Overall) | 822 (44.6%) | 1,023 (55.4%) |
Production, Transportation and Moving Occupations
The most common Production, Transportation and Moving occupations in Bonanza are Transportation (233 | 12.6%), Material Moving (147 | 8.0%), and Production (144 | 7.8%).
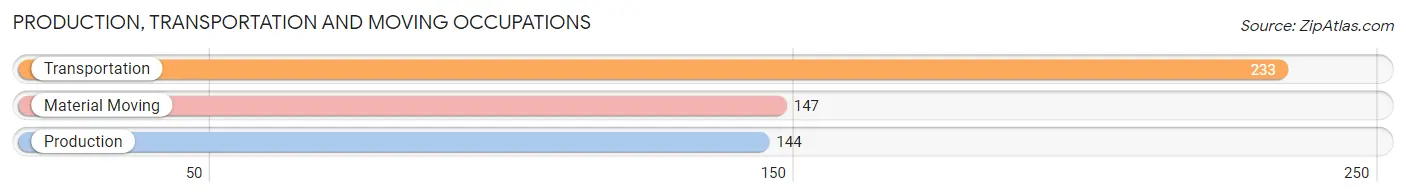
Production, Transportation and Moving Occupations by Sex
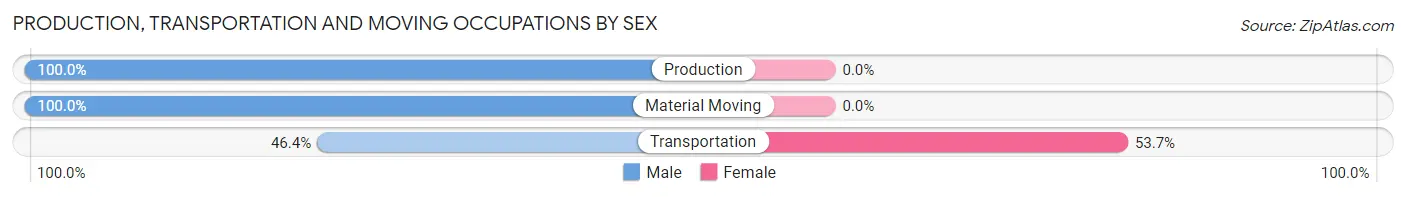
| Occupation | Male | Female |
| Production | 144 (100.0%) | 0 (0.0%) |
| Transportation | 108 (46.4%) | 125 (53.6%) |
| Material Moving | 147 (100.0%) | 0 (0.0%) |
| Total (Category) | 399 (76.1%) | 125 (23.8%) |
| Total (Overall) | 822 (44.6%) | 1,023 (55.4%) |
Employment Industries by Sex in Bonanza
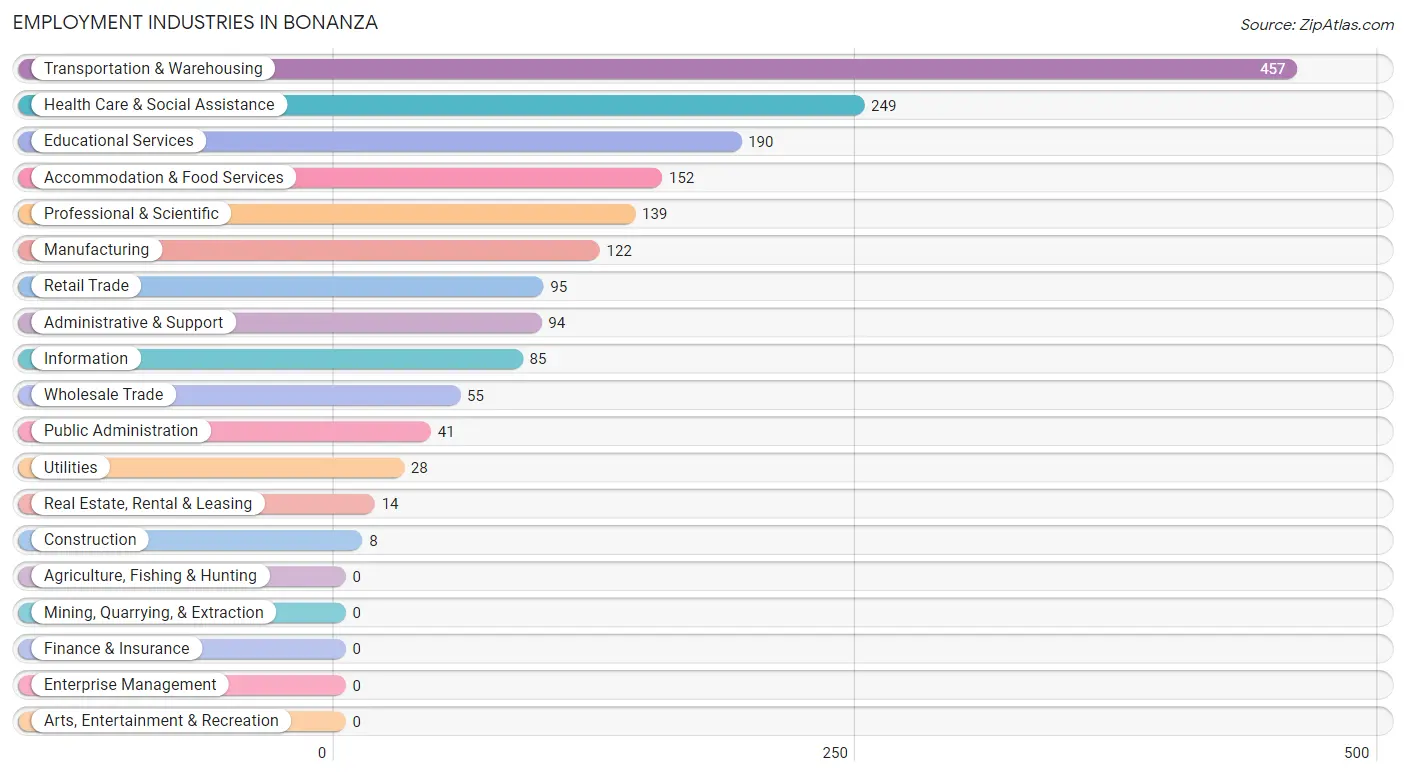
Employment Industries in Bonanza
The major employment industries in Bonanza include Transportation & Warehousing (457 | 24.8%), Health Care & Social Assistance (249 | 13.5%), Educational Services (190 | 10.3%), Accommodation & Food Services (152 | 8.2%), and Professional & Scientific (139 | 7.5%).
Employment Industries by Sex in Bonanza
The Bonanza industries that see more men than women are Construction (100.0%), Manufacturing (100.0%), and Utilities (100.0%), whereas the industries that tend to have a higher number of women are Health Care & Social Assistance (100.0%), Public Administration (92.7%), and Educational Services (88.9%).
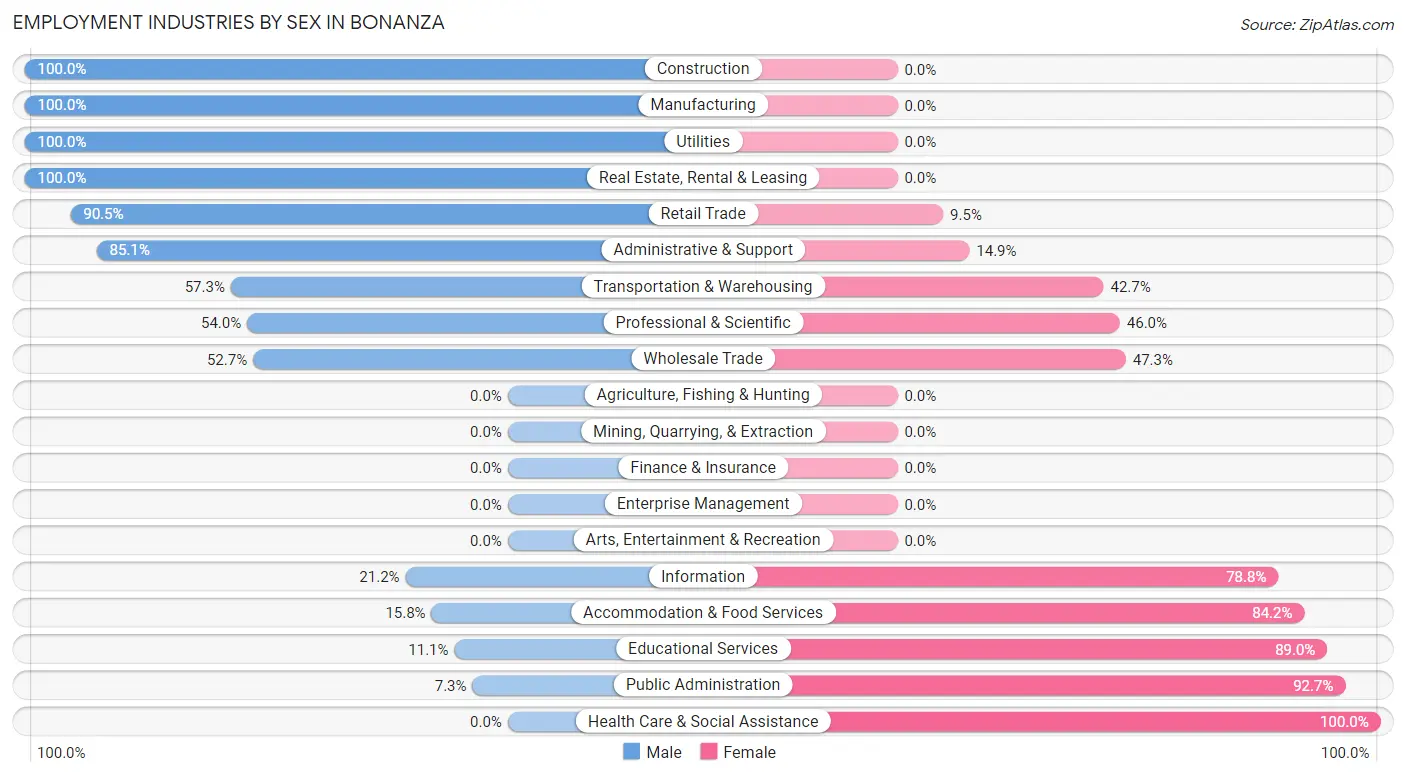
| Industry | Male | Female |
| Agriculture, Fishing & Hunting | 0 (0.0%) | 0 (0.0%) |
| Mining, Quarrying, & Extraction | 0 (0.0%) | 0 (0.0%) |
| Construction | 8 (100.0%) | 0 (0.0%) |
| Manufacturing | 122 (100.0%) | 0 (0.0%) |
| Wholesale Trade | 29 (52.7%) | 26 (47.3%) |
| Retail Trade | 86 (90.5%) | 9 (9.5%) |
| Transportation & Warehousing | 262 (57.3%) | 195 (42.7%) |
| Utilities | 28 (100.0%) | 0 (0.0%) |
| Information | 18 (21.2%) | 67 (78.8%) |
| Finance & Insurance | 0 (0.0%) | 0 (0.0%) |
| Real Estate, Rental & Leasing | 14 (100.0%) | 0 (0.0%) |
| Professional & Scientific | 75 (54.0%) | 64 (46.0%) |
| Enterprise Management | 0 (0.0%) | 0 (0.0%) |
| Administrative & Support | 80 (85.1%) | 14 (14.9%) |
| Educational Services | 21 (11.1%) | 169 (88.9%) |
| Health Care & Social Assistance | 0 (0.0%) | 249 (100.0%) |
| Arts, Entertainment & Recreation | 0 (0.0%) | 0 (0.0%) |
| Accommodation & Food Services | 24 (15.8%) | 128 (84.2%) |
| Public Administration | 3 (7.3%) | 38 (92.7%) |
| Total | 822 (44.6%) | 1,023 (55.4%) |
Education in Bonanza
School Enrollment in Bonanza
The most common levels of schooling among the 811 students in Bonanza are middle school (247 | 30.5%), elementary school (192 | 23.7%), and high school (135 | 16.7%).
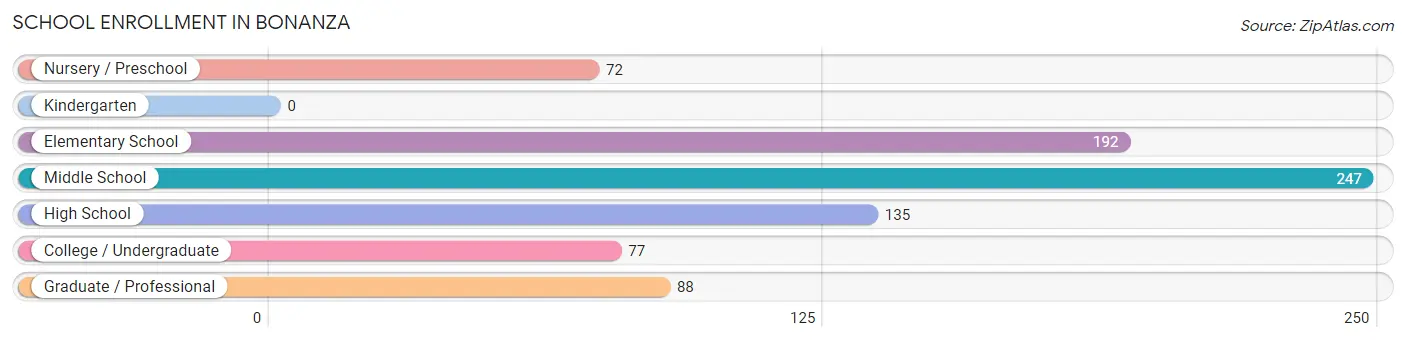
| School Level | # Students | % Students |
| Nursery / Preschool | 72 | 8.9% |
| Kindergarten | 0 | 0.0% |
| Elementary School | 192 | 23.7% |
| Middle School | 247 | 30.5% |
| High School | 135 | 16.7% |
| College / Undergraduate | 77 | 9.5% |
| Graduate / Professional | 88 | 10.8% |
| Total | 811 | 100.0% |
School Enrollment by Age by Funding Source in Bonanza
Out of a total of 811 students who are enrolled in schools in Bonanza, 225 (27.7%) attend a private institution, while the remaining 586 (72.3%) are enrolled in public schools. The age group of 15 to 17 year olds has the highest likelihood of being enrolled in private schools, with 46 (34.1% in the age bracket) enrolled. Conversely, the age group of 20 to 24 year olds has the lowest likelihood of being enrolled in a private school, with 24 (100.0% in the age bracket) attending a public institution.
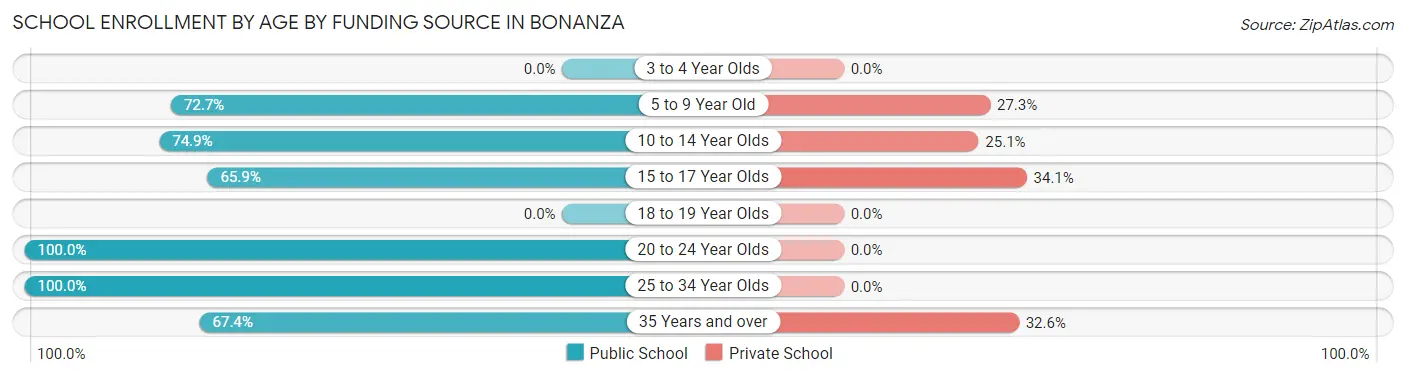
| Age Bracket | Public School | Private School |
| 3 to 4 Year Olds | 0 (0.0%) | 0 (0.0%) |
| 5 to 9 Year Old | 192 (72.7%) | 72 (27.3%) |
| 10 to 14 Year Olds | 185 (74.9%) | 62 (25.1%) |
| 15 to 17 Year Olds | 89 (65.9%) | 46 (34.1%) |
| 18 to 19 Year Olds | 0 (0.0%) | 0 (0.0%) |
| 20 to 24 Year Olds | 24 (100.0%) | 0 (0.0%) |
| 25 to 34 Year Olds | 3 (100.0%) | 0 (0.0%) |
| 35 Years and over | 93 (67.4%) | 45 (32.6%) |
| Total | 586 (72.3%) | 225 (27.7%) |
Educational Attainment by Field of Study in Bonanza
Business (194 | 28.5%), engineering (93 | 13.7%), social sciences (70 | 10.3%), visual & performing arts (63 | 9.3%), and arts & humanities (63 | 9.3%) are the most common fields of study among 680 individuals in Bonanza who have obtained a bachelor's degree or higher.
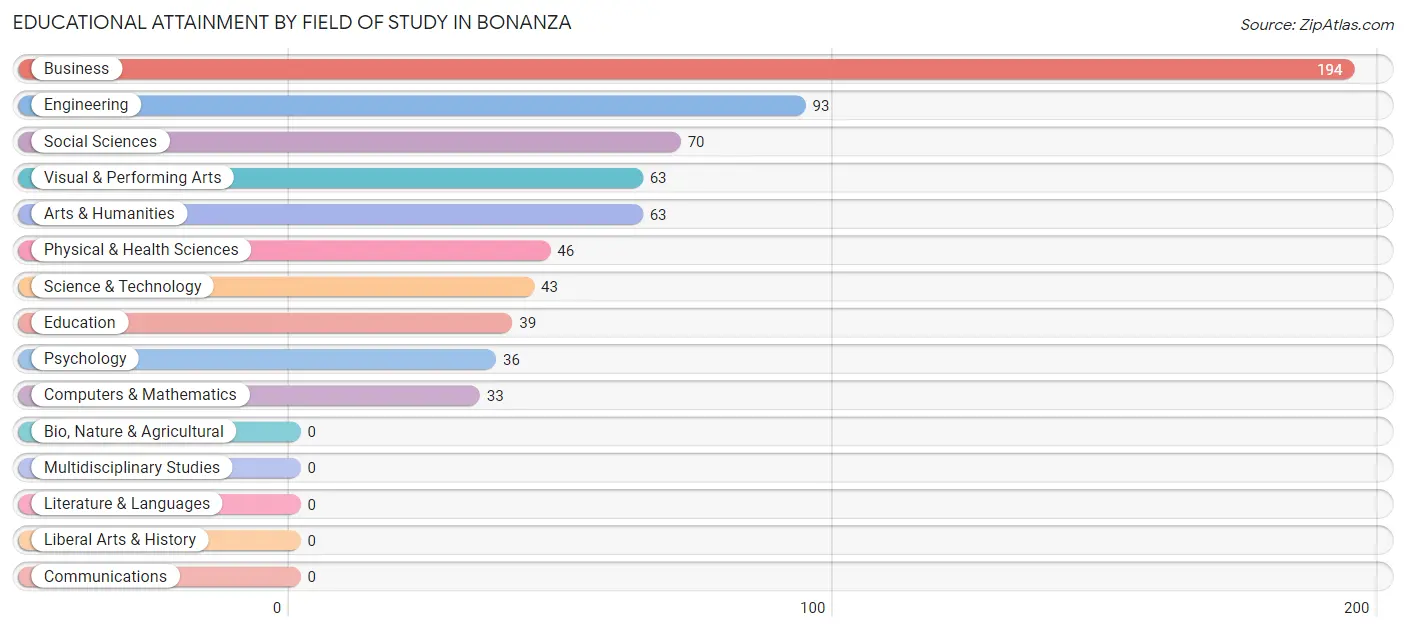
| Field of Study | # Graduates | % Graduates |
| Computers & Mathematics | 33 | 4.9% |
| Bio, Nature & Agricultural | 0 | 0.0% |
| Physical & Health Sciences | 46 | 6.8% |
| Psychology | 36 | 5.3% |
| Social Sciences | 70 | 10.3% |
| Engineering | 93 | 13.7% |
| Multidisciplinary Studies | 0 | 0.0% |
| Science & Technology | 43 | 6.3% |
| Business | 194 | 28.5% |
| Education | 39 | 5.7% |
| Literature & Languages | 0 | 0.0% |
| Liberal Arts & History | 0 | 0.0% |
| Visual & Performing Arts | 63 | 9.3% |
| Communications | 0 | 0.0% |
| Arts & Humanities | 63 | 9.3% |
| Total | 680 | 100.0% |
Transportation & Commute in Bonanza
Vehicle Availability by Sex in Bonanza
The most prevalent vehicle ownership categories in Bonanza are males with 2 vehicles (469, accounting for 57.1%) and females with 2 vehicles (490, making up 49.6%).
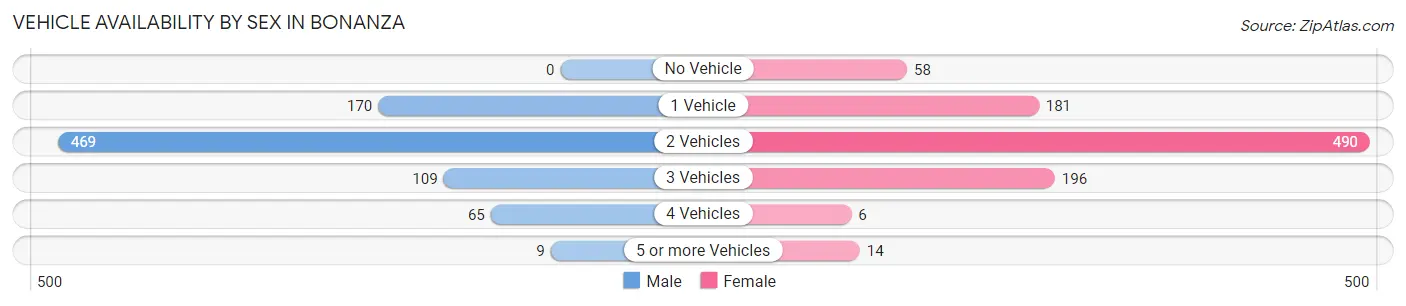
| Vehicles Available | Male | Female |
| No Vehicle | 0 (0.0%) | 58 (6.1%) |
| 1 Vehicle | 170 (20.7%) | 181 (19.2%) |
| 2 Vehicles | 469 (57.1%) | 490 (51.8%) |
| 3 Vehicles | 109 (13.3%) | 196 (20.7%) |
| 4 Vehicles | 65 (7.9%) | 6 (0.6%) |
| 5 or more Vehicles | 9 (1.1%) | 14 (1.5%) |
| Total | 822 (100.0%) | 945 (100.0%) |
Commute Time in Bonanza
The most frequently occuring commute durations in Bonanza are 45 to 59 minutes (342 commuters, 21.1%), 20 to 24 minutes (330 commuters, 20.4%), and 30 to 34 minutes (300 commuters, 18.5%).
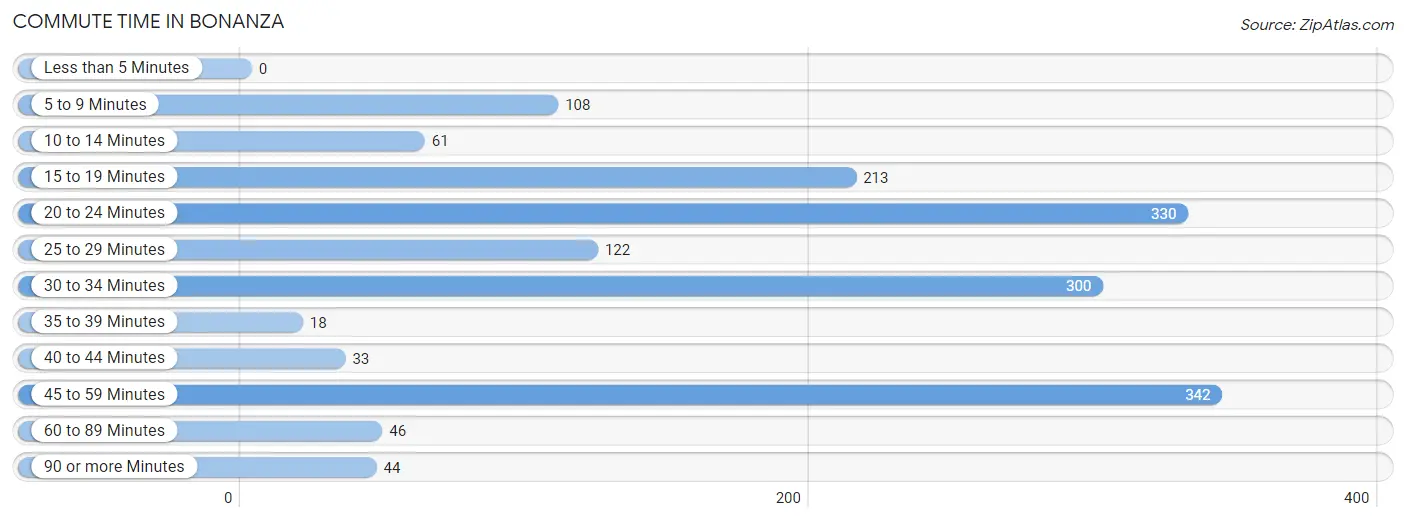
| Commute Time | # Commuters | % Commuters |
| Less than 5 Minutes | 0 | 0.0% |
| 5 to 9 Minutes | 108 | 6.7% |
| 10 to 14 Minutes | 61 | 3.8% |
| 15 to 19 Minutes | 213 | 13.2% |
| 20 to 24 Minutes | 330 | 20.4% |
| 25 to 29 Minutes | 122 | 7.5% |
| 30 to 34 Minutes | 300 | 18.5% |
| 35 to 39 Minutes | 18 | 1.1% |
| 40 to 44 Minutes | 33 | 2.0% |
| 45 to 59 Minutes | 342 | 21.1% |
| 60 to 89 Minutes | 46 | 2.8% |
| 90 or more Minutes | 44 | 2.7% |
Commute Time by Sex in Bonanza
The most common commute times in Bonanza are 30 to 34 minutes (236 commuters, 32.2%) for males and 20 to 24 minutes (238 commuters, 26.9%) for females.
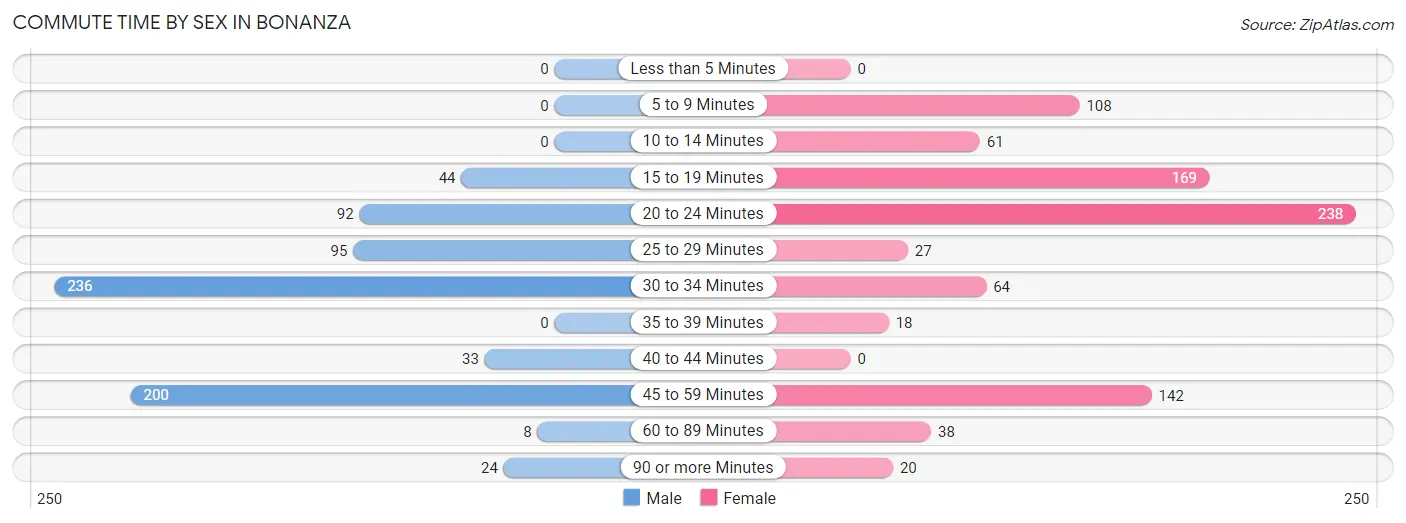
| Commute Time | Male | Female |
| Less than 5 Minutes | 0 (0.0%) | 0 (0.0%) |
| 5 to 9 Minutes | 0 (0.0%) | 108 (12.2%) |
| 10 to 14 Minutes | 0 (0.0%) | 61 (6.9%) |
| 15 to 19 Minutes | 44 (6.0%) | 169 (19.1%) |
| 20 to 24 Minutes | 92 (12.6%) | 238 (26.9%) |
| 25 to 29 Minutes | 95 (13.0%) | 27 (3.0%) |
| 30 to 34 Minutes | 236 (32.2%) | 64 (7.2%) |
| 35 to 39 Minutes | 0 (0.0%) | 18 (2.0%) |
| 40 to 44 Minutes | 33 (4.5%) | 0 (0.0%) |
| 45 to 59 Minutes | 200 (27.3%) | 142 (16.1%) |
| 60 to 89 Minutes | 8 (1.1%) | 38 (4.3%) |
| 90 or more Minutes | 24 (3.3%) | 20 (2.3%) |
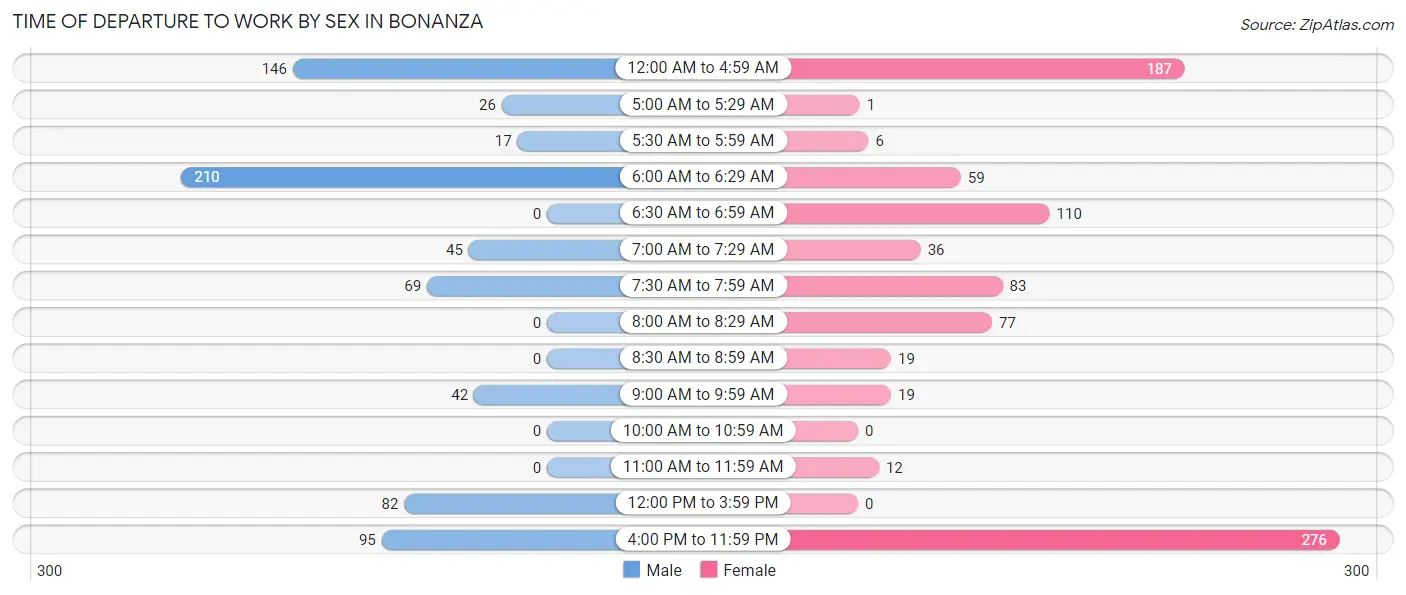
Time of Departure to Work by Sex in Bonanza
The most frequent times of departure to work in Bonanza are 6:00 AM to 6:29 AM (210, 28.7%) for males and 4:00 PM to 11:59 PM (276, 31.2%) for females.
| Time of Departure | Male | Female |
| 12:00 AM to 4:59 AM | 146 (20.0%) | 187 (21.1%) |
| 5:00 AM to 5:29 AM | 26 (3.5%) | 1 (0.1%) |
| 5:30 AM to 5:59 AM | 17 (2.3%) | 6 (0.7%) |
| 6:00 AM to 6:29 AM | 210 (28.7%) | 59 (6.7%) |
| 6:30 AM to 6:59 AM | 0 (0.0%) | 110 (12.4%) |
| 7:00 AM to 7:29 AM | 45 (6.1%) | 36 (4.1%) |
| 7:30 AM to 7:59 AM | 69 (9.4%) | 83 (9.4%) |
| 8:00 AM to 8:29 AM | 0 (0.0%) | 77 (8.7%) |
| 8:30 AM to 8:59 AM | 0 (0.0%) | 19 (2.1%) |
| 9:00 AM to 9:59 AM | 42 (5.7%) | 19 (2.1%) |
| 10:00 AM to 10:59 AM | 0 (0.0%) | 0 (0.0%) |
| 11:00 AM to 11:59 AM | 0 (0.0%) | 12 (1.4%) |
| 12:00 PM to 3:59 PM | 82 (11.2%) | 0 (0.0%) |
| 4:00 PM to 11:59 PM | 95 (13.0%) | 276 (31.2%) |
| Total | 732 (100.0%) | 885 (100.0%) |
Housing Occupancy in Bonanza
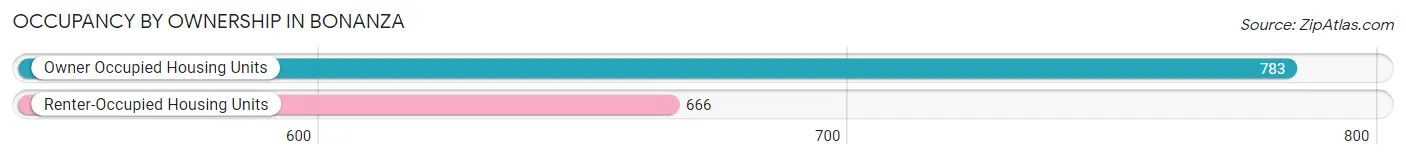
Occupancy by Ownership in Bonanza
Of the total 1,449 dwellings in Bonanza, owner-occupied units account for 783 (54.0%), while renter-occupied units make up 666 (46.0%).
| Occupancy | # Housing Units | % Housing Units |
| Owner Occupied Housing Units | 783 | 54.0% |
| Renter-Occupied Housing Units | 666 | 46.0% |
| Total Occupied Housing Units | 1,449 | 100.0% |
Occupancy by Household Size in Bonanza
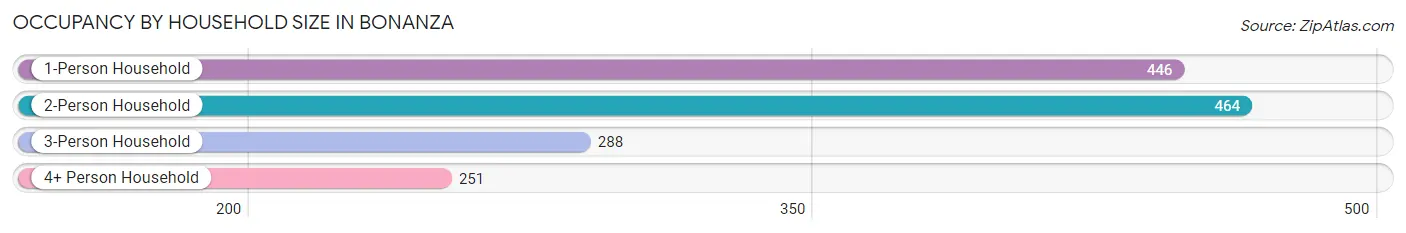
| Household Size | # Housing Units | % Housing Units |
| 1-Person Household | 446 | 30.8% |
| 2-Person Household | 464 | 32.0% |
| 3-Person Household | 288 | 19.9% |
| 4+ Person Household | 251 | 17.3% |
| Total Housing Units | 1,449 | 100.0% |
Occupancy by Ownership by Household Size in Bonanza
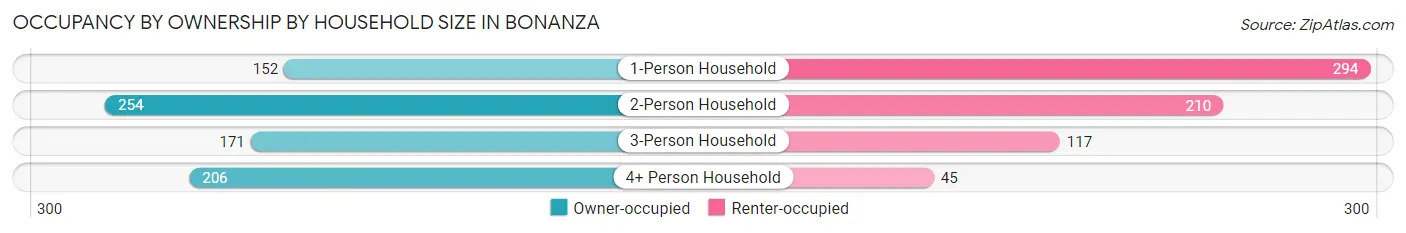
| Household Size | Owner-occupied | Renter-occupied |
| 1-Person Household | 152 (34.1%) | 294 (65.9%) |
| 2-Person Household | 254 (54.7%) | 210 (45.3%) |
| 3-Person Household | 171 (59.4%) | 117 (40.6%) |
| 4+ Person Household | 206 (82.1%) | 45 (17.9%) |
| Total Housing Units | 783 (54.0%) | 666 (46.0%) |
Occupancy by Educational Attainment in Bonanza
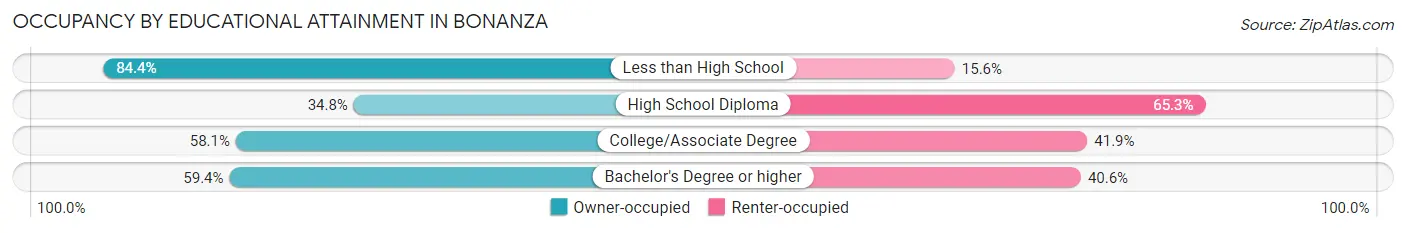
| Household Size | Owner-occupied | Renter-occupied |
| Less than High School | 92 (84.4%) | 17 (15.6%) |
| High School Diploma | 139 (34.7%) | 261 (65.2%) |
| College/Associate Degree | 293 (58.1%) | 211 (41.9%) |
| Bachelor's Degree or higher | 259 (59.4%) | 177 (40.6%) |
Occupancy by Age of Householder in Bonanza
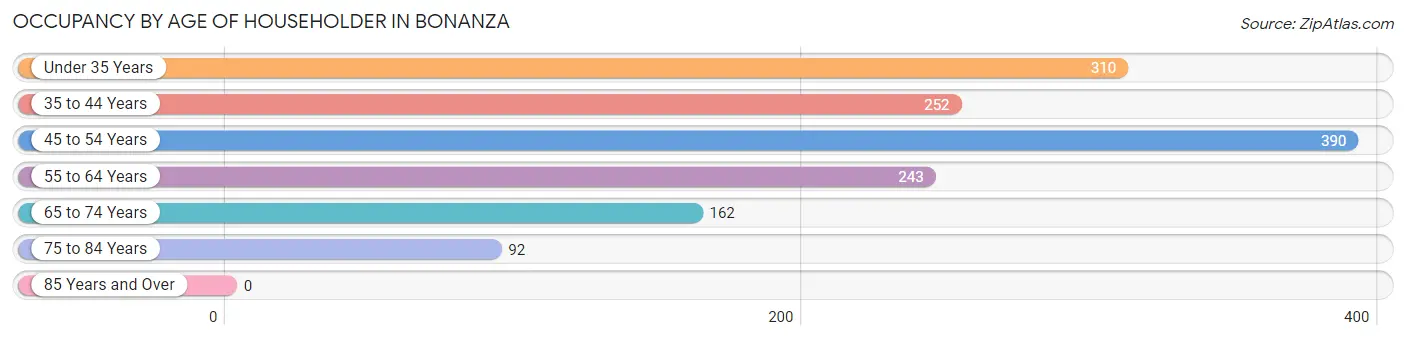
| Age Bracket | # Households | % Households |
| Under 35 Years | 310 | 21.4% |
| 35 to 44 Years | 252 | 17.4% |
| 45 to 54 Years | 390 | 26.9% |
| 55 to 64 Years | 243 | 16.8% |
| 65 to 74 Years | 162 | 11.2% |
| 75 to 84 Years | 92 | 6.4% |
| 85 Years and Over | 0 | 0.0% |
| Total | 1,449 | 100.0% |
Housing Finances in Bonanza
Median Income by Occupancy in Bonanza
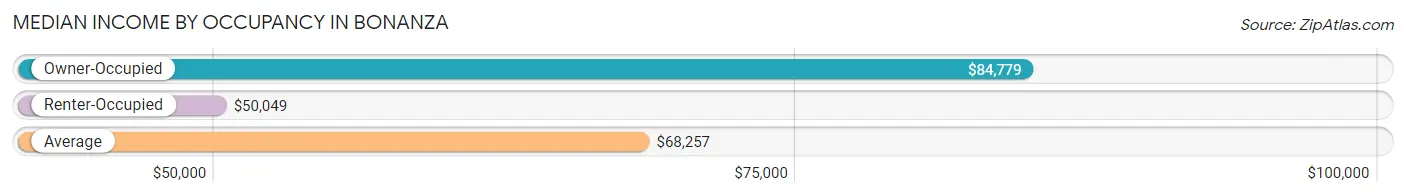
| Occupancy Type | # Households | Median Income |
| Owner-Occupied | 783 (54.0%) | $84,779 |
| Renter-Occupied | 666 (46.0%) | $50,049 |
| Average | 1,449 (100.0%) | $68,257 |
Occupancy by Householder Income Bracket in Bonanza
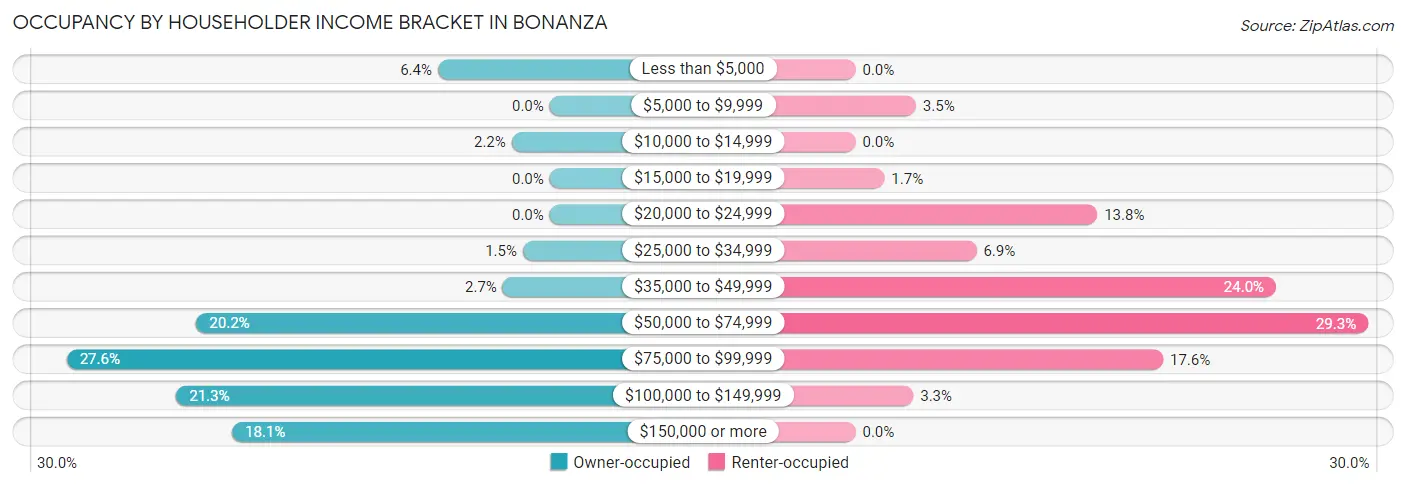
| Income Bracket | Owner-occupied | Renter-occupied |
| Less than $5,000 | 50 (6.4%) | 0 (0.0%) |
| $5,000 to $9,999 | 0 (0.0%) | 23 (3.5%) |
| $10,000 to $14,999 | 17 (2.2%) | 0 (0.0%) |
| $15,000 to $19,999 | 0 (0.0%) | 11 (1.7%) |
| $20,000 to $24,999 | 0 (0.0%) | 92 (13.8%) |
| $25,000 to $34,999 | 12 (1.5%) | 46 (6.9%) |
| $35,000 to $49,999 | 21 (2.7%) | 160 (24.0%) |
| $50,000 to $74,999 | 158 (20.2%) | 195 (29.3%) |
| $75,000 to $99,999 | 216 (27.6%) | 117 (17.6%) |
| $100,000 to $149,999 | 167 (21.3%) | 22 (3.3%) |
| $150,000 or more | 142 (18.1%) | 0 (0.0%) |
| Total | 783 (100.0%) | 666 (100.0%) |
Monthly Housing Cost Tiers in Bonanza
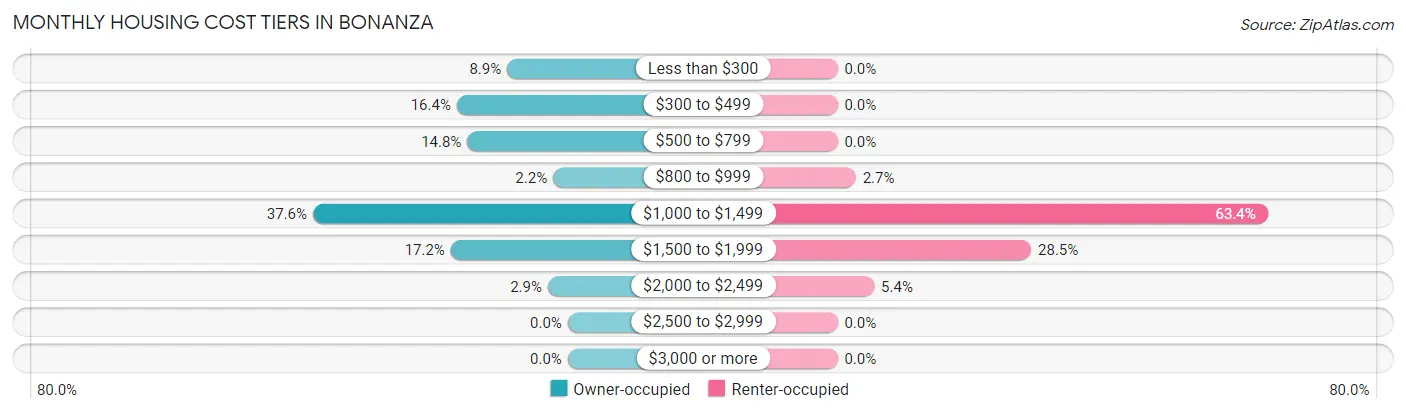
| Monthly Cost | Owner-occupied | Renter-occupied |
| Less than $300 | 70 (8.9%) | 0 (0.0%) |
| $300 to $499 | 128 (16.4%) | 0 (0.0%) |
| $500 to $799 | 116 (14.8%) | 0 (0.0%) |
| $800 to $999 | 17 (2.2%) | 18 (2.7%) |
| $1,000 to $1,499 | 294 (37.6%) | 422 (63.4%) |
| $1,500 to $1,999 | 135 (17.2%) | 190 (28.5%) |
| $2,000 to $2,499 | 23 (2.9%) | 36 (5.4%) |
| $2,500 to $2,999 | 0 (0.0%) | 0 (0.0%) |
| $3,000 or more | 0 (0.0%) | 0 (0.0%) |
| Total | 783 (100.0%) | 666 (100.0%) |
Physical Housing Characteristics in Bonanza
Housing Structures in Bonanza
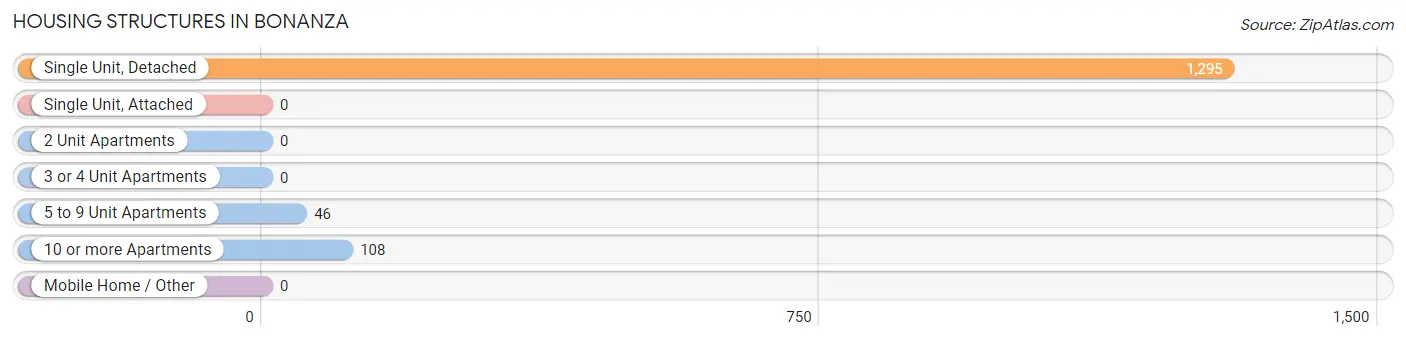
| Structure Type | # Housing Units | % Housing Units |
| Single Unit, Detached | 1,295 | 89.4% |
| Single Unit, Attached | 0 | 0.0% |
| 2 Unit Apartments | 0 | 0.0% |
| 3 or 4 Unit Apartments | 0 | 0.0% |
| 5 to 9 Unit Apartments | 46 | 3.2% |
| 10 or more Apartments | 108 | 7.4% |
| Mobile Home / Other | 0 | 0.0% |
| Total | 1,449 | 100.0% |
Housing Structures by Occupancy in Bonanza
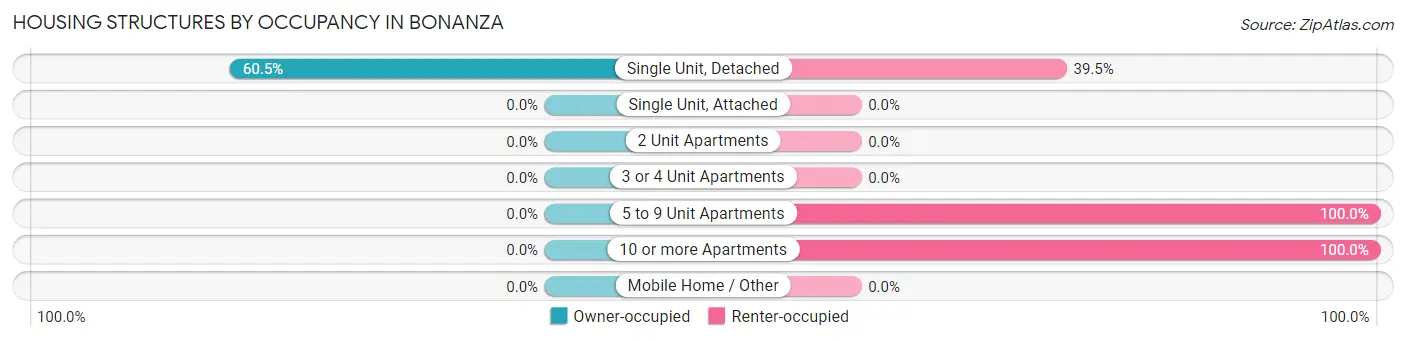
| Structure Type | Owner-occupied | Renter-occupied |
| Single Unit, Detached | 783 (60.5%) | 512 (39.5%) |
| Single Unit, Attached | 0 (0.0%) | 0 (0.0%) |
| 2 Unit Apartments | 0 (0.0%) | 0 (0.0%) |
| 3 or 4 Unit Apartments | 0 (0.0%) | 0 (0.0%) |
| 5 to 9 Unit Apartments | 0 (0.0%) | 46 (100.0%) |
| 10 or more Apartments | 0 (0.0%) | 108 (100.0%) |
| Mobile Home / Other | 0 (0.0%) | 0 (0.0%) |
| Total | 783 (54.0%) | 666 (46.0%) |
Housing Structures by Number of Rooms in Bonanza
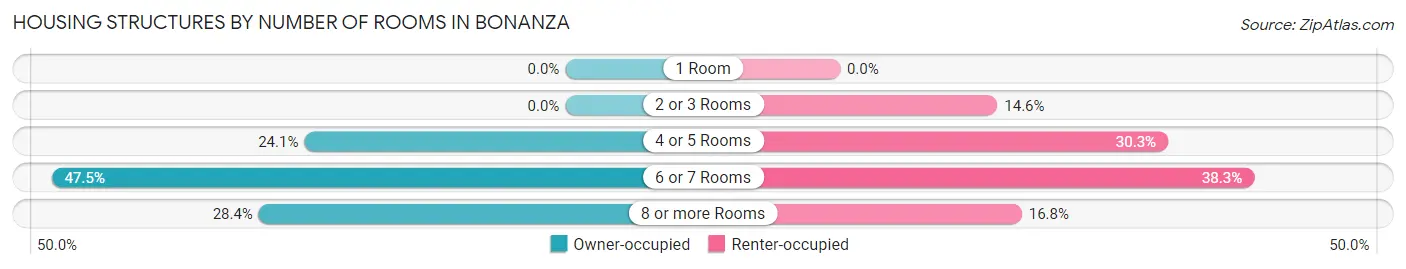
| Number of Rooms | Owner-occupied | Renter-occupied |
| 1 Room | 0 (0.0%) | 0 (0.0%) |
| 2 or 3 Rooms | 0 (0.0%) | 97 (14.6%) |
| 4 or 5 Rooms | 189 (24.1%) | 202 (30.3%) |
| 6 or 7 Rooms | 372 (47.5%) | 255 (38.3%) |
| 8 or more Rooms | 222 (28.3%) | 112 (16.8%) |
| Total | 783 (100.0%) | 666 (100.0%) |
Housing Structure by Heating Type in Bonanza
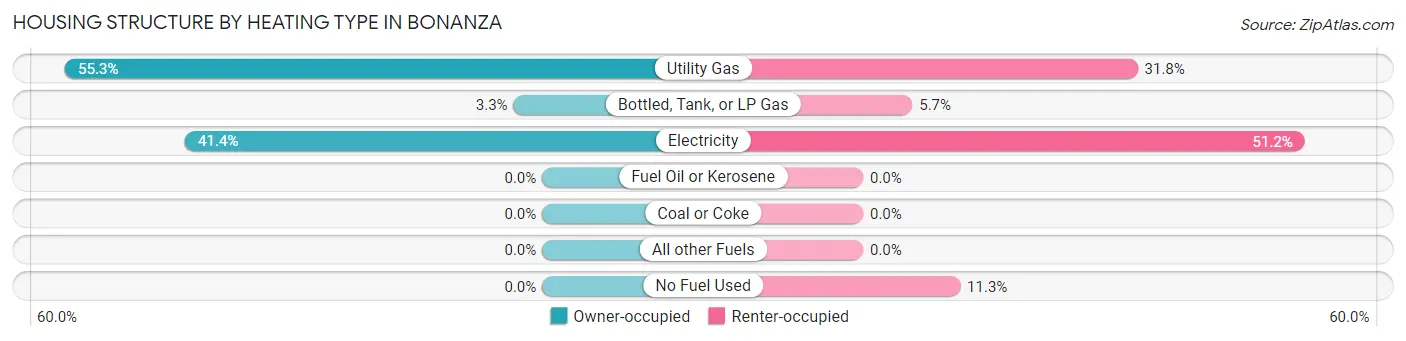
| Heating Type | Owner-occupied | Renter-occupied |
| Utility Gas | 433 (55.3%) | 212 (31.8%) |
| Bottled, Tank, or LP Gas | 26 (3.3%) | 38 (5.7%) |
| Electricity | 324 (41.4%) | 341 (51.2%) |
| Fuel Oil or Kerosene | 0 (0.0%) | 0 (0.0%) |
| Coal or Coke | 0 (0.0%) | 0 (0.0%) |
| All other Fuels | 0 (0.0%) | 0 (0.0%) |
| No Fuel Used | 0 (0.0%) | 75 (11.3%) |
| Total | 783 (100.0%) | 666 (100.0%) |
Household Vehicle Usage in Bonanza
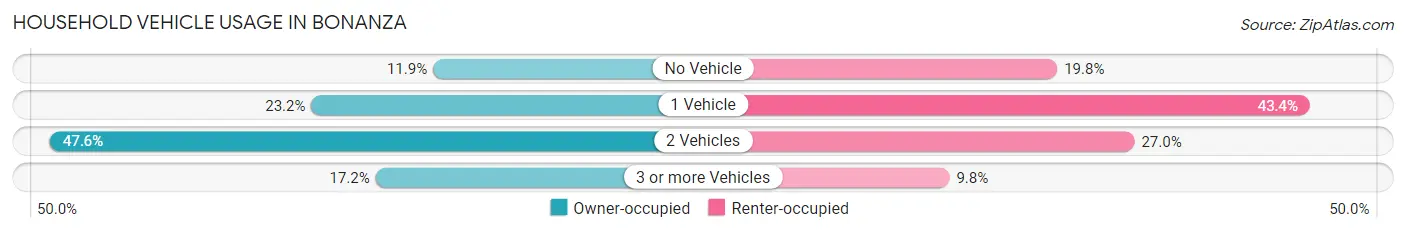
| Vehicles per Household | Owner-occupied | Renter-occupied |
| No Vehicle | 93 (11.9%) | 132 (19.8%) |
| 1 Vehicle | 182 (23.2%) | 289 (43.4%) |
| 2 Vehicles | 373 (47.6%) | 180 (27.0%) |
| 3 or more Vehicles | 135 (17.2%) | 65 (9.8%) |
| Total | 783 (100.0%) | 666 (100.0%) |
Real Estate & Mortgages in Bonanza
Real Estate and Mortgage Overview in Bonanza
| Characteristic | Without Mortgage | With Mortgage |
| Housing Units | 305 | 478 |
| Median Property Value | $152,000 | $166,700 |
| Median Household Income | $88,405 | $109 |
| Monthly Housing Costs | $454 | $0 |
| Real Estate Taxes | $1,394 | $42 |
Property Value by Mortgage Status in Bonanza
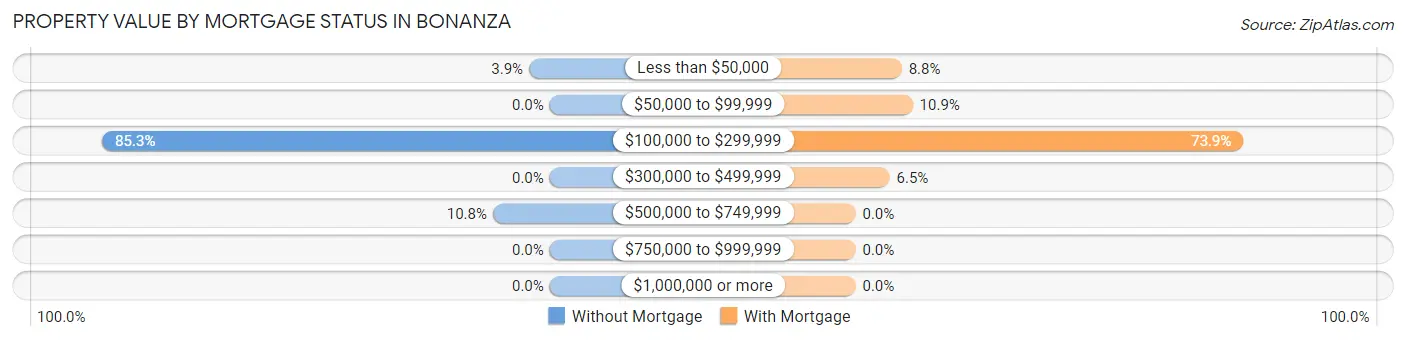
| Property Value | Without Mortgage | With Mortgage |
| Less than $50,000 | 12 (3.9%) | 42 (8.8%) |
| $50,000 to $99,999 | 0 (0.0%) | 52 (10.9%) |
| $100,000 to $299,999 | 260 (85.3%) | 353 (73.9%) |
| $300,000 to $499,999 | 0 (0.0%) | 31 (6.5%) |
| $500,000 to $749,999 | 33 (10.8%) | 0 (0.0%) |
| $750,000 to $999,999 | 0 (0.0%) | 0 (0.0%) |
| $1,000,000 or more | 0 (0.0%) | 0 (0.0%) |
| Total | 305 (100.0%) | 478 (100.0%) |
Household Income by Mortgage Status in Bonanza
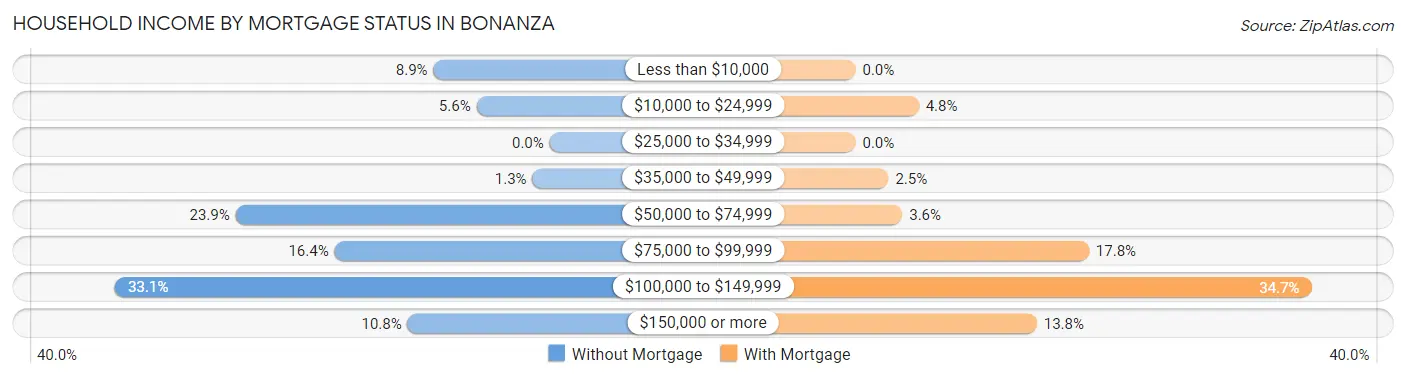
| Household Income | Without Mortgage | With Mortgage |
| Less than $10,000 | 27 (8.8%) | 0 (0.0%) |
| $10,000 to $24,999 | 17 (5.6%) | 23 (4.8%) |
| $25,000 to $34,999 | 0 (0.0%) | 0 (0.0%) |
| $35,000 to $49,999 | 4 (1.3%) | 12 (2.5%) |
| $50,000 to $74,999 | 73 (23.9%) | 17 (3.6%) |
| $75,000 to $99,999 | 50 (16.4%) | 85 (17.8%) |
| $100,000 to $149,999 | 101 (33.1%) | 166 (34.7%) |
| $150,000 or more | 33 (10.8%) | 66 (13.8%) |
| Total | 305 (100.0%) | 478 (100.0%) |
Property Value to Household Income Ratio in Bonanza
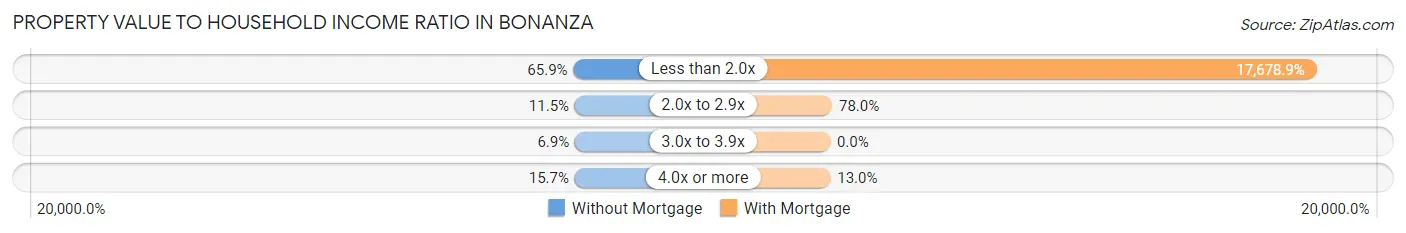
| Value-to-Income Ratio | Without Mortgage | With Mortgage |
| Less than 2.0x | 201 (65.9%) | 84,505 (17,678.9%) |
| 2.0x to 2.9x | 35 (11.5%) | 373 (78.0%) |
| 3.0x to 3.9x | 21 (6.9%) | 0 (0.0%) |
| 4.0x or more | 48 (15.7%) | 62 (13.0%) |
| Total | 305 (100.0%) | 478 (100.0%) |
Real Estate Taxes by Mortgage Status in Bonanza
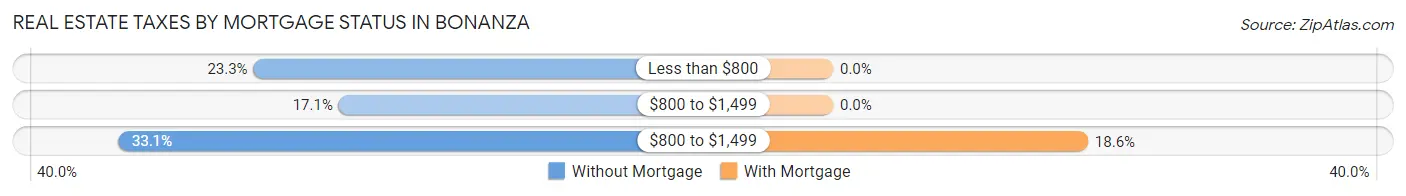
| Property Taxes | Without Mortgage | With Mortgage |
| Less than $800 | 71 (23.3%) | 0 (0.0%) |
| $800 to $1,499 | 52 (17.1%) | 0 (0.0%) |
| $800 to $1,499 | 101 (33.1%) | 89 (18.6%) |
| Total | 305 (100.0%) | 478 (100.0%) |
Health & Disability in Bonanza
Health Insurance Coverage by Age in Bonanza
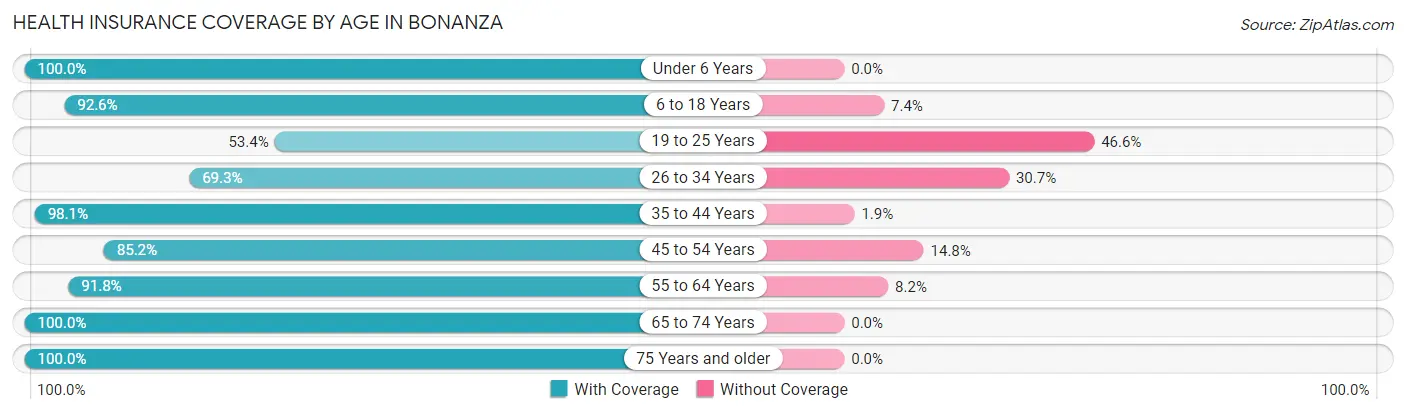
| Age Bracket | With Coverage | Without Coverage |
| Under 6 Years | 280 (100.0%) | 0 (0.0%) |
| 6 to 18 Years | 574 (92.6%) | 46 (7.4%) |
| 19 to 25 Years | 102 (53.4%) | 89 (46.6%) |
| 26 to 34 Years | 467 (69.3%) | 207 (30.7%) |
| 35 to 44 Years | 515 (98.1%) | 10 (1.9%) |
| 45 to 54 Years | 507 (85.2%) | 88 (14.8%) |
| 55 to 64 Years | 404 (91.8%) | 36 (8.2%) |
| 65 to 74 Years | 177 (100.0%) | 0 (0.0%) |
| 75 Years and older | 136 (100.0%) | 0 (0.0%) |
| Total | 3,162 (86.9%) | 476 (13.1%) |
Health Insurance Coverage by Citizenship Status in Bonanza
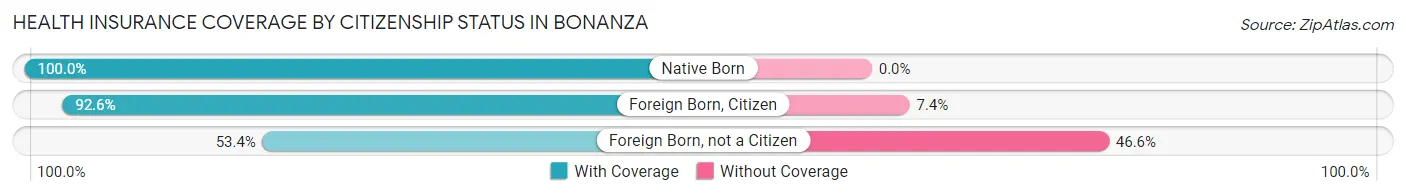
| Citizenship Status | With Coverage | Without Coverage |
| Native Born | 280 (100.0%) | 0 (0.0%) |
| Foreign Born, Citizen | 574 (92.6%) | 46 (7.4%) |
| Foreign Born, not a Citizen | 102 (53.4%) | 89 (46.6%) |
Health Insurance Coverage by Household Income in Bonanza
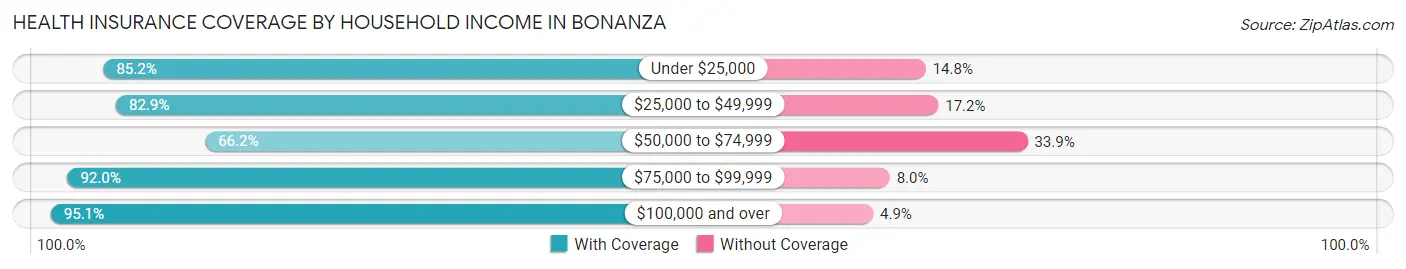
| Household Income | With Coverage | Without Coverage |
| Under $25,000 | 265 (85.2%) | 46 (14.8%) |
| $25,000 to $49,999 | 425 (82.9%) | 88 (17.2%) |
| $50,000 to $74,999 | 383 (66.1%) | 196 (33.9%) |
| $75,000 to $99,999 | 1,064 (92.0%) | 93 (8.0%) |
| $100,000 and over | 1,021 (95.1%) | 53 (4.9%) |
Public vs Private Health Insurance Coverage by Age in Bonanza
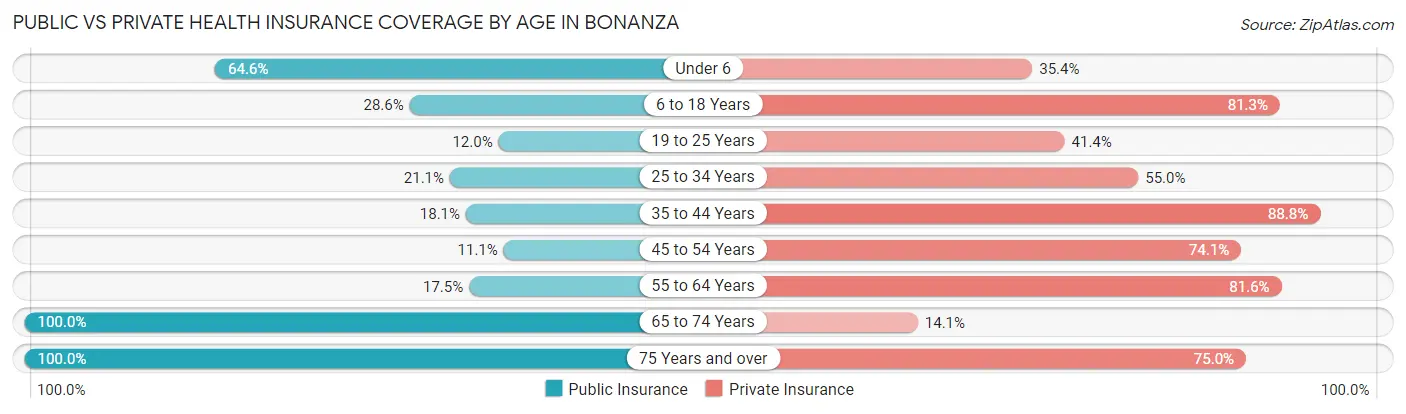
| Age Bracket | Public Insurance | Private Insurance |
| Under 6 | 181 (64.6%) | 99 (35.4%) |
| 6 to 18 Years | 177 (28.5%) | 504 (81.3%) |
| 19 to 25 Years | 23 (12.0%) | 79 (41.4%) |
| 25 to 34 Years | 142 (21.1%) | 371 (55.0%) |
| 35 to 44 Years | 95 (18.1%) | 466 (88.8%) |
| 45 to 54 Years | 66 (11.1%) | 441 (74.1%) |
| 55 to 64 Years | 77 (17.5%) | 359 (81.6%) |
| 65 to 74 Years | 177 (100.0%) | 25 (14.1%) |
| 75 Years and over | 136 (100.0%) | 102 (75.0%) |
| Total | 1,074 (29.5%) | 2,446 (67.2%) |
Disability Status by Sex by Age in Bonanza
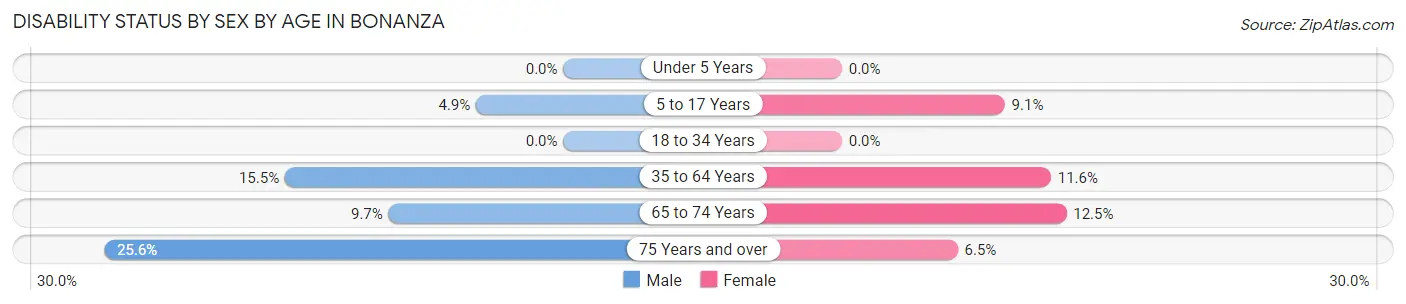
| Age Bracket | Male | Female |
| Under 5 Years | 0 (0.0%) | 0 (0.0%) |
| 5 to 17 Years | 9 (4.9%) | 46 (9.1%) |
| 18 to 34 Years | 0 (0.0%) | 0 (0.0%) |
| 35 to 64 Years | 106 (15.5%) | 102 (11.6%) |
| 65 to 74 Years | 11 (9.7%) | 8 (12.5%) |
| 75 Years and over | 11 (25.6%) | 6 (6.5%) |
Disability Class by Sex by Age in Bonanza
Disability Class: Hearing Difficulty
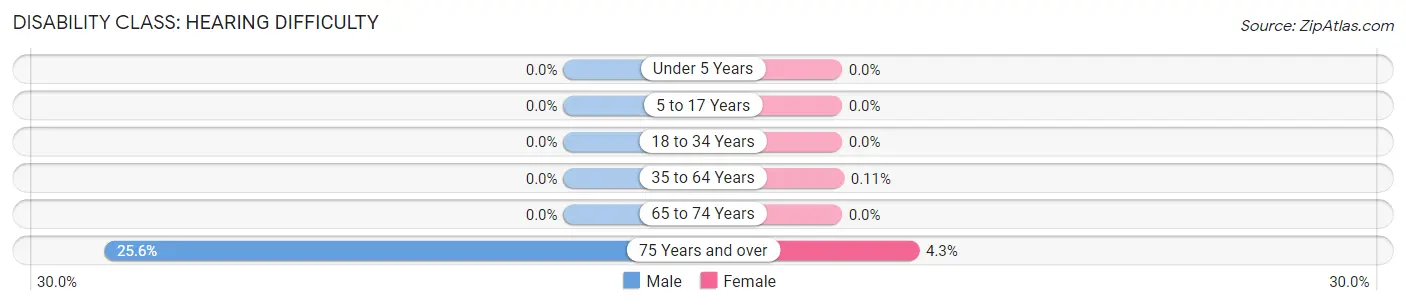
| Age Bracket | Male | Female |
| Under 5 Years | 0 (0.0%) | 0 (0.0%) |
| 5 to 17 Years | 0 (0.0%) | 0 (0.0%) |
| 18 to 34 Years | 0 (0.0%) | 0 (0.0%) |
| 35 to 64 Years | 0 (0.0%) | 1 (0.1%) |
| 65 to 74 Years | 0 (0.0%) | 0 (0.0%) |
| 75 Years and over | 11 (25.6%) | 4 (4.3%) |
Disability Class: Vision Difficulty
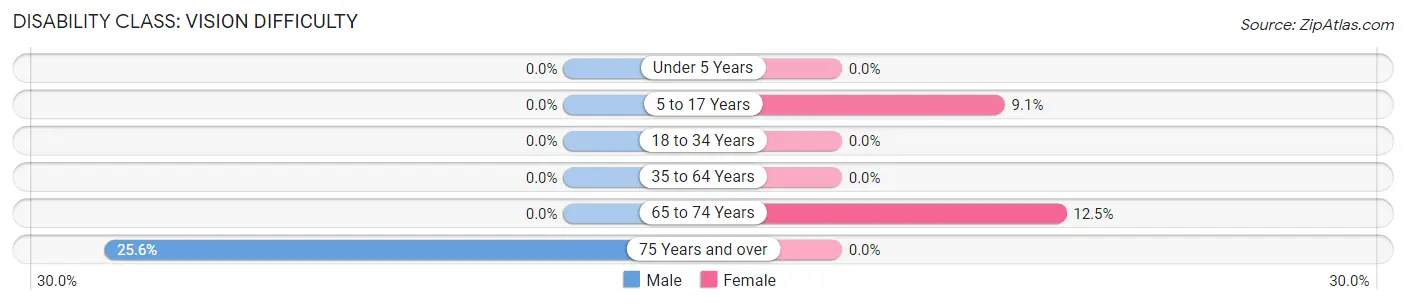
| Age Bracket | Male | Female |
| Under 5 Years | 0 (0.0%) | 0 (0.0%) |
| 5 to 17 Years | 0 (0.0%) | 46 (9.1%) |
| 18 to 34 Years | 0 (0.0%) | 0 (0.0%) |
| 35 to 64 Years | 0 (0.0%) | 0 (0.0%) |
| 65 to 74 Years | 0 (0.0%) | 8 (12.5%) |
| 75 Years and over | 11 (25.6%) | 0 (0.0%) |
Disability Class: Cognitive Difficulty
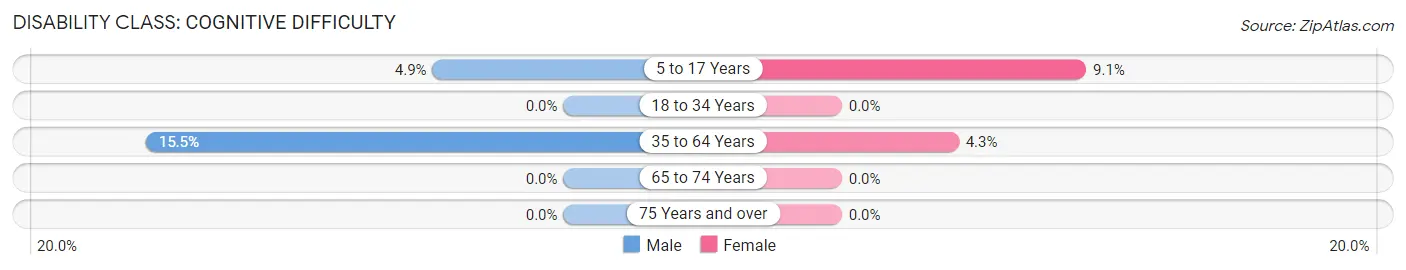
| Age Bracket | Male | Female |
| 5 to 17 Years | 9 (4.9%) | 46 (9.1%) |
| 18 to 34 Years | 0 (0.0%) | 0 (0.0%) |
| 35 to 64 Years | 106 (15.5%) | 38 (4.3%) |
| 65 to 74 Years | 0 (0.0%) | 0 (0.0%) |
| 75 Years and over | 0 (0.0%) | 0 (0.0%) |
Disability Class: Ambulatory Difficulty
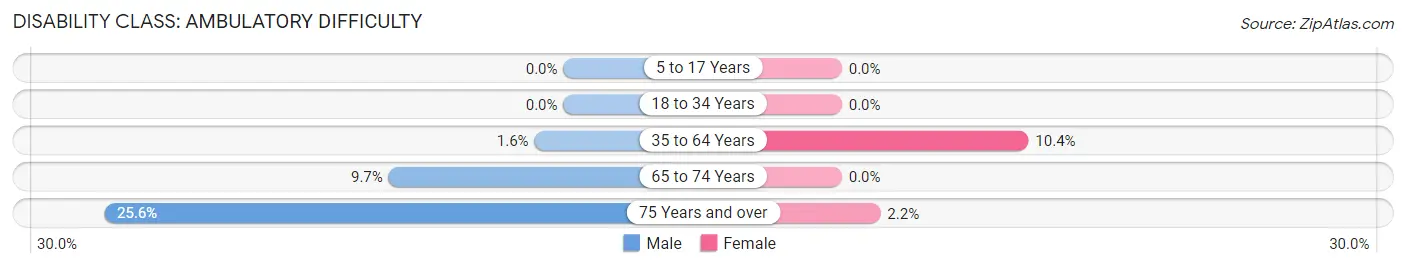
| Age Bracket | Male | Female |
| 5 to 17 Years | 0 (0.0%) | 0 (0.0%) |
| 18 to 34 Years | 0 (0.0%) | 0 (0.0%) |
| 35 to 64 Years | 11 (1.6%) | 91 (10.4%) |
| 65 to 74 Years | 11 (9.7%) | 0 (0.0%) |
| 75 Years and over | 11 (25.6%) | 2 (2.1%) |
Disability Class: Self-Care Difficulty
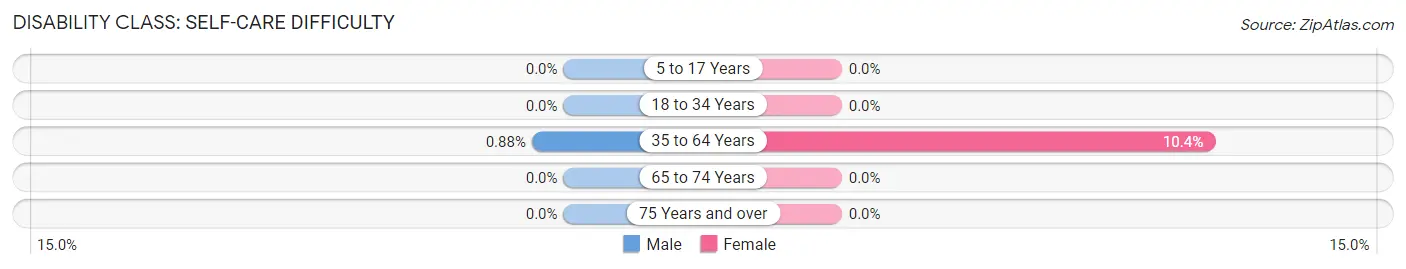
| Age Bracket | Male | Female |
| 5 to 17 Years | 0 (0.0%) | 0 (0.0%) |
| 18 to 34 Years | 0 (0.0%) | 0 (0.0%) |
| 35 to 64 Years | 6 (0.9%) | 91 (10.4%) |
| 65 to 74 Years | 0 (0.0%) | 0 (0.0%) |
| 75 Years and over | 0 (0.0%) | 0 (0.0%) |
Technology Access in Bonanza
Computing Device Access in Bonanza
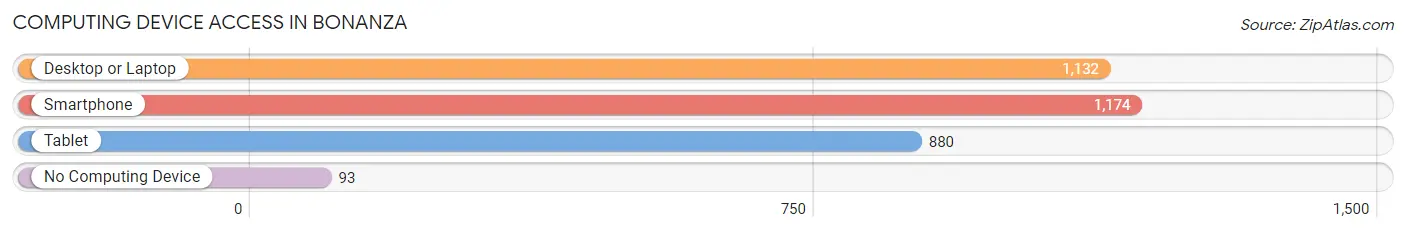
| Device Type | # Households | % Households |
| Desktop or Laptop | 1,132 | 78.1% |
| Smartphone | 1,174 | 81.0% |
| Tablet | 880 | 60.7% |
| No Computing Device | 93 | 6.4% |
| Total | 1,449 | 100.0% |
Internet Access in Bonanza
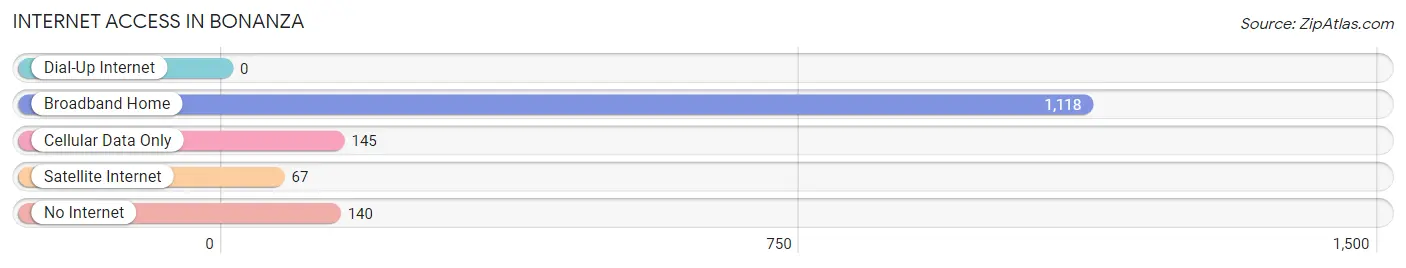
| Internet Type | # Households | % Households |
| Dial-Up Internet | 0 | 0.0% |
| Broadband Home | 1,118 | 77.2% |
| Cellular Data Only | 145 | 10.0% |
| Satellite Internet | 67 | 4.6% |
| No Internet | 140 | 9.7% |
| Total | 1,449 | 100.0% |
Bonanza Summary
History
The small town of Bonanza, Georgia is located in the northwest corner of the state, in the foothills of the Appalachian Mountains. It was first settled in the early 1800s by a group of settlers from North Carolina. The town was originally called “Bonanza” because of the abundance of natural resources in the area. The town was officially incorporated in 1837 and has remained a small, rural community ever since.
The town was an important stop on the Western and Atlantic Railroad, which connected the town to the larger cities of Atlanta and Chattanooga. This allowed the town to become a hub for trade and commerce in the region. The railroad also allowed the town to become a popular tourist destination, as it was close to the popular tourist destination of Lookout Mountain.
The town was also home to a number of important historical figures, including the first African-American mayor of a Georgia town, William H. Brown. Brown was elected mayor in 1891 and served until 1895. He was also a prominent member of the African-American community in the area and was instrumental in the founding of the first African-American church in the town.
Geography
Bonanza is located in the northwest corner of Georgia, in the foothills of the Appalachian Mountains. The town is situated on the banks of the Chattahoochee River, which provides a natural border between Georgia and Alabama. The town is surrounded by rolling hills and lush forests, making it a popular destination for outdoor activities such as hiking, camping, and fishing.
The town is located approximately 30 miles from the larger cities of Chattanooga, Tennessee and Atlanta, Georgia. It is also close to the popular tourist destination of Lookout Mountain, which is located just a few miles away.
Economy
The economy of Bonanza is largely based on agriculture and tourism. The town is home to a number of small farms, which produce a variety of crops such as corn, soybeans, and cotton. The town is also home to a number of small businesses, including restaurants, shops, and other services.
The town is also a popular tourist destination, as it is close to the popular tourist destination of Lookout Mountain. The town is home to a number of bed and breakfasts, as well as a number of outdoor activities such as hiking, camping, and fishing.
Demographics
As of the 2010 census, the population of Bonanza was 1,845. The town is predominantly white, with a small African-American population. The median household income in the town is $37,000, and the median age is 44. The town is home to a number of churches, including the First African-American Church of Bonanza, which was founded in 1891.
Common Questions
What is Per Capita Income in Bonanza?
Per Capita income in Bonanza is $43,082.
What is the Median Family Income in Bonanza?
Median Family Income in Bonanza is $84,128.
What is the Median Household income in Bonanza?
Median Household Income in Bonanza is $68,257.
What is Income or Wage Gap in Bonanza?
Income or Wage Gap in Bonanza is 16.8%.
Women in Bonanza earn 83.2 cents for every dollar earned by a man.
What is Inequality or Gini Index in Bonanza?
Inequality or Gini Index in Bonanza is 0.49.
What is the Total Population of Bonanza?
Total Population of Bonanza is 3,638.
What is the Total Male Population of Bonanza?
Total Male Population of Bonanza is 1,533.
What is the Total Female Population of Bonanza?
Total Female Population of Bonanza is 2,105.
What is the Ratio of Males per 100 Females in Bonanza?
There are 72.83 Males per 100 Females in Bonanza.
What is the Ratio of Females per 100 Males in Bonanza?
There are 137.31 Females per 100 Males in Bonanza.
What is the Median Population Age in Bonanza?
Median Population Age in Bonanza is 36.1 Years.
What is the Average Family Size in Bonanza
Average Family Size in Bonanza is 3.3 People.
What is the Average Household Size in Bonanza
Average Household Size in Bonanza is 2.5 People.
How Large is the Labor Force in Bonanza?
There are 2,023 People in the Labor Forcein in Bonanza.
What is the Percentage of People in the Labor Force in Bonanza?
70.4% of People are in the Labor Force in Bonanza.
What is the Unemployment Rate in Bonanza?
Unemployment Rate in Bonanza is 8.8%.