Jefferson, GA Map & Demographics
Jefferson Map
Jefferson Overview
$38,867
PER CAPITA INCOME
$118,795
AVG FAMILY INCOME
$95,850
AVG HOUSEHOLD INCOME
23.8%
WAGE / INCOME GAP [ % ]
76.2¢/ $1
WAGE / INCOME GAP [ $ ]
0.44
INEQUALITY / GINI INDEX
13,496
TOTAL POPULATION
7,360
MALE POPULATION
6,136
FEMALE POPULATION
119.95
MALES / 100 FEMALES
83.37
FEMALES / 100 MALES
34.1
MEDIAN AGE
3.6
AVG FAMILY SIZE
3.1
AVG HOUSEHOLD SIZE
6,876
LABOR FORCE [ PEOPLE ]
67.9%
PERCENT IN LABOR FORCE
2.1%
UNEMPLOYMENT RATE
Jefferson Zip Codes
Jefferson Area Codes
Income in Jefferson
Income Overview in Jefferson
Per Capita Income in Jefferson is $38,867, while median incomes of families and households are $118,795 and $95,850 respectively.
| Characteristic | Number | Measure |
| Per Capita Income | 13,496 | $38,867 |
| Median Family Income | 3,477 | $118,795 |
| Mean Family Income | 3,477 | $139,980 |
| Median Household Income | 4,275 | $95,850 |
| Mean Household Income | 4,275 | $121,974 |
| Income Deficit | 3,477 | $0 |
| Wage / Income Gap (%) | 13,496 | 23.80% |
| Wage / Income Gap ($) | 13,496 | 76.20¢ per $1 |
| Gini / Inequality Index | 13,496 | 0.44 |
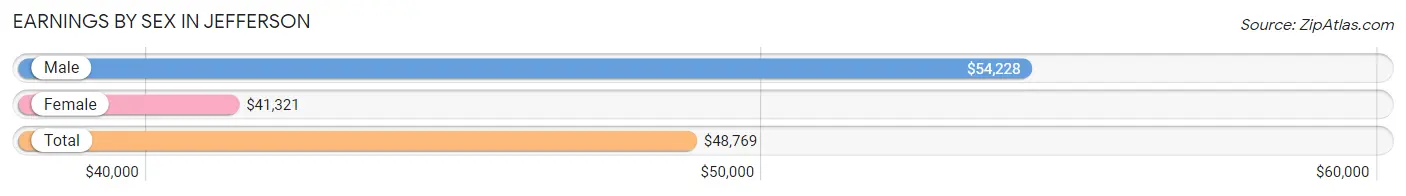
Earnings by Sex in Jefferson
Average Earnings in Jefferson are $48,769, $54,228 for men and $41,321 for women, a difference of 23.8%.
| Sex | Number | Average Earnings |
| Male | 4,447 (61.4%) | $54,228 |
| Female | 2,791 (38.6%) | $41,321 |
| Total | 7,238 (100.0%) | $48,769 |
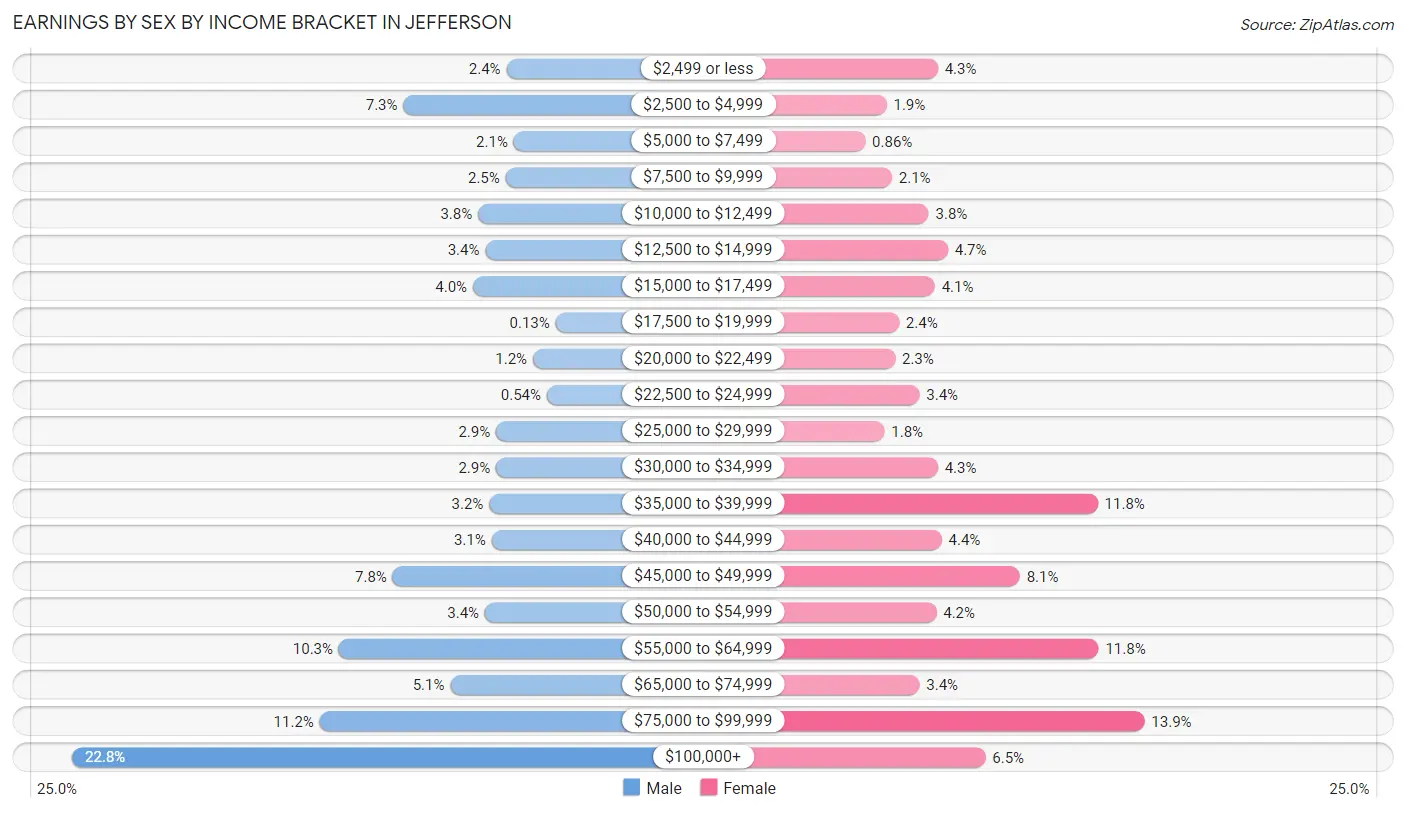
Earnings by Sex by Income Bracket in Jefferson
The most common earnings brackets in Jefferson are $100,000+ for men (1,013 | 22.8%) and $75,000 to $99,999 for women (389 | 13.9%).
| Income | Male | Female |
| $2,499 or less | 108 (2.4%) | 119 (4.3%) |
| $2,500 to $4,999 | 323 (7.3%) | 52 (1.9%) |
| $5,000 to $7,499 | 93 (2.1%) | 24 (0.9%) |
| $7,500 to $9,999 | 110 (2.5%) | 59 (2.1%) |
| $10,000 to $12,499 | 167 (3.8%) | 107 (3.8%) |
| $12,500 to $14,999 | 152 (3.4%) | 132 (4.7%) |
| $15,000 to $17,499 | 178 (4.0%) | 115 (4.1%) |
| $17,500 to $19,999 | 6 (0.1%) | 68 (2.4%) |
| $20,000 to $22,499 | 53 (1.2%) | 63 (2.3%) |
| $22,500 to $24,999 | 24 (0.5%) | 95 (3.4%) |
| $25,000 to $29,999 | 130 (2.9%) | 49 (1.8%) |
| $30,000 to $34,999 | 130 (2.9%) | 119 (4.3%) |
| $35,000 to $39,999 | 144 (3.2%) | 328 (11.7%) |
| $40,000 to $44,999 | 139 (3.1%) | 124 (4.4%) |
| $45,000 to $49,999 | 345 (7.8%) | 226 (8.1%) |
| $50,000 to $54,999 | 153 (3.4%) | 117 (4.2%) |
| $55,000 to $64,999 | 457 (10.3%) | 329 (11.8%) |
| $65,000 to $74,999 | 225 (5.1%) | 95 (3.4%) |
| $75,000 to $99,999 | 497 (11.2%) | 389 (13.9%) |
| $100,000+ | 1,013 (22.8%) | 181 (6.5%) |
| Total | 4,447 (100.0%) | 2,791 (100.0%) |
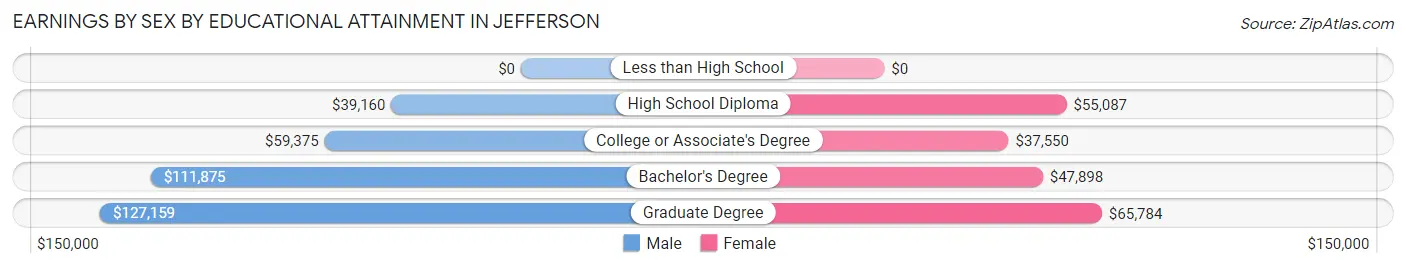
Earnings by Sex by Educational Attainment in Jefferson
Average earnings in Jefferson are $58,223 for men and $47,261 for women, a difference of 18.8%. Men with an educational attainment of graduate degree enjoy the highest average annual earnings of $127,159, while those with high school diploma education earn the least with $39,160. Women with an educational attainment of graduate degree earn the most with the average annual earnings of $65,784, while those with college or associate's degree education have the smallest earnings of $37,550.
| Educational Attainment | Male Income | Female Income |
| Less than High School | - | - |
| High School Diploma | $39,160 | $55,087 |
| College or Associate's Degree | $59,375 | $37,550 |
| Bachelor's Degree | $111,875 | $47,898 |
| Graduate Degree | $127,159 | $65,784 |
| Total | $58,223 | $47,261 |
Family Income in Jefferson
Family Income Brackets in Jefferson
According to the Jefferson family income data, there are 824 families falling into the $100,000 to $149,999 income range, which is the most common income bracket and makes up 23.7% of all families.
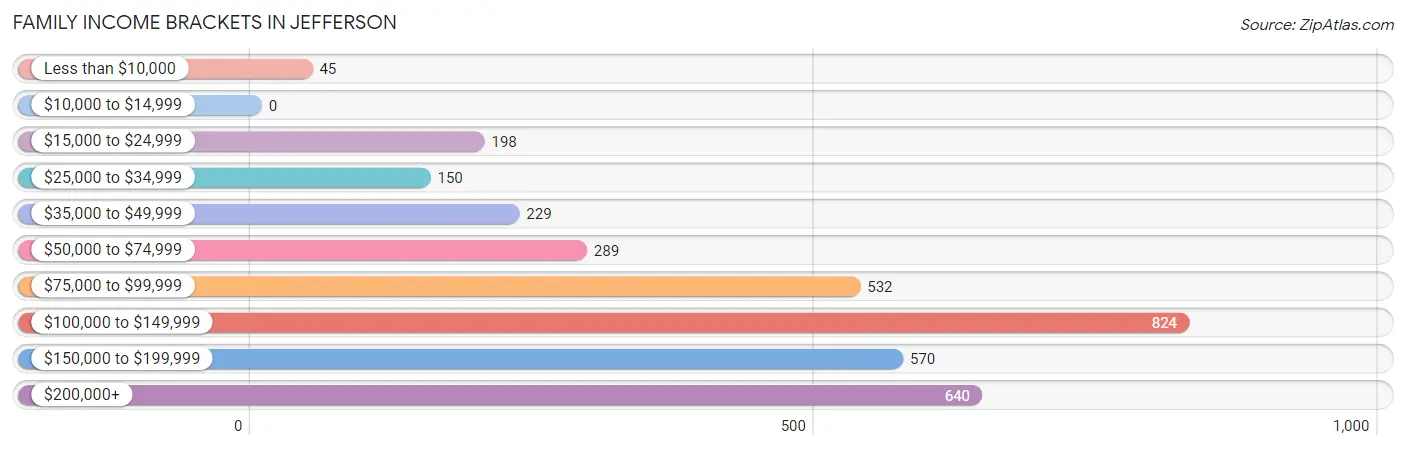
| Income Bracket | # Families | % Families |
| Less than $10,000 | 45 | 1.3% |
| $10,000 to $14,999 | 0 | 0.0% |
| $15,000 to $24,999 | 198 | 5.7% |
| $25,000 to $34,999 | 150 | 4.3% |
| $35,000 to $49,999 | 229 | 6.6% |
| $50,000 to $74,999 | 289 | 8.3% |
| $75,000 to $99,999 | 532 | 15.3% |
| $100,000 to $149,999 | 824 | 23.7% |
| $150,000 to $199,999 | 570 | 16.4% |
| $200,000+ | 640 | 18.4% |
Family Income by Famaliy Size in Jefferson
5-person families (317 | 9.1%) account for the highest median family income in Jefferson with $195,140 per family, while 2-person families (1,115 | 32.1%) have the highest median income of $45,684 per family member.
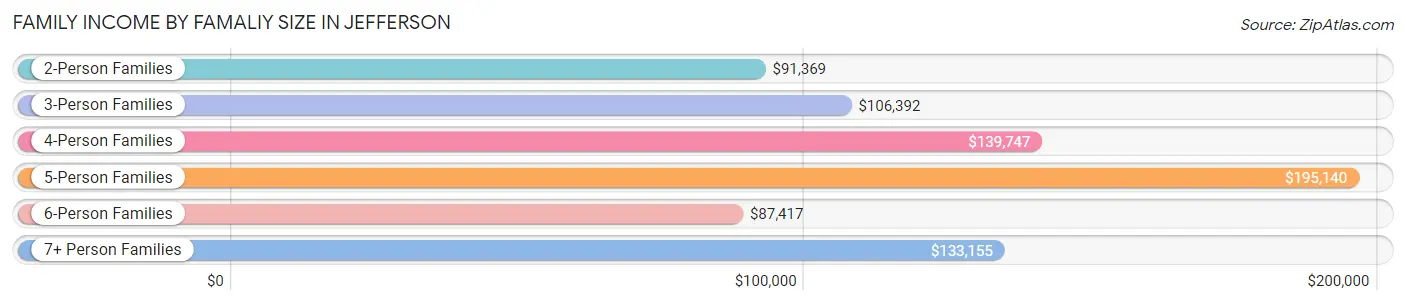
| Income Bracket | # Families | Median Income |
| 2-Person Families | 1,115 (32.1%) | $91,369 |
| 3-Person Families | 953 (27.4%) | $106,392 |
| 4-Person Families | 882 (25.4%) | $139,747 |
| 5-Person Families | 317 (9.1%) | $195,140 |
| 6-Person Families | 179 (5.1%) | $87,417 |
| 7+ Person Families | 31 (0.9%) | $133,155 |
| Total | 3,477 (100.0%) | $118,795 |
Family Income by Number of Earners in Jefferson
The median family income in Jefferson is $118,795, with families comprising 3+ earners (698) having the highest median family income of $167,933, while families with no earners (296) have the lowest median family income of $49,091, accounting for 20.1% and 8.5% of families, respectively.
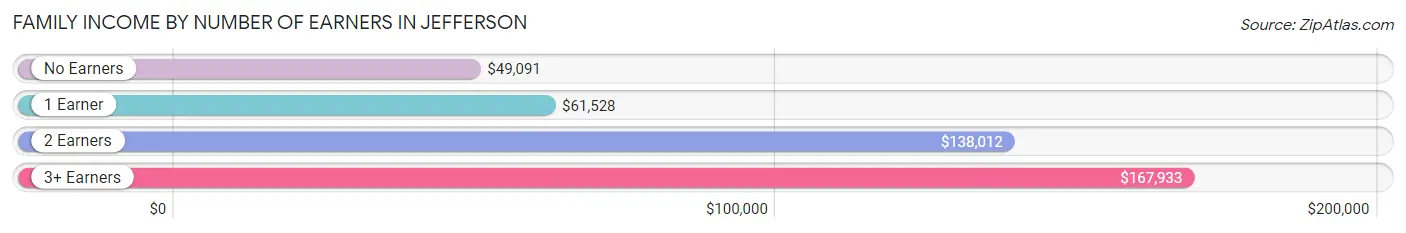
| Number of Earners | # Families | Median Income |
| No Earners | 296 (8.5%) | $49,091 |
| 1 Earner | 998 (28.7%) | $61,528 |
| 2 Earners | 1,485 (42.7%) | $138,012 |
| 3+ Earners | 698 (20.1%) | $167,933 |
| Total | 3,477 (100.0%) | $118,795 |
Household Income in Jefferson
Household Income Brackets in Jefferson
With 842 households falling in the category, the $100,000 to $149,999 income range is the most frequent in Jefferson, accounting for 19.7% of all households. In contrast, only 141 households (3.3%) fall into the $10,000 to $14,999 income bracket, making it the least populous group.
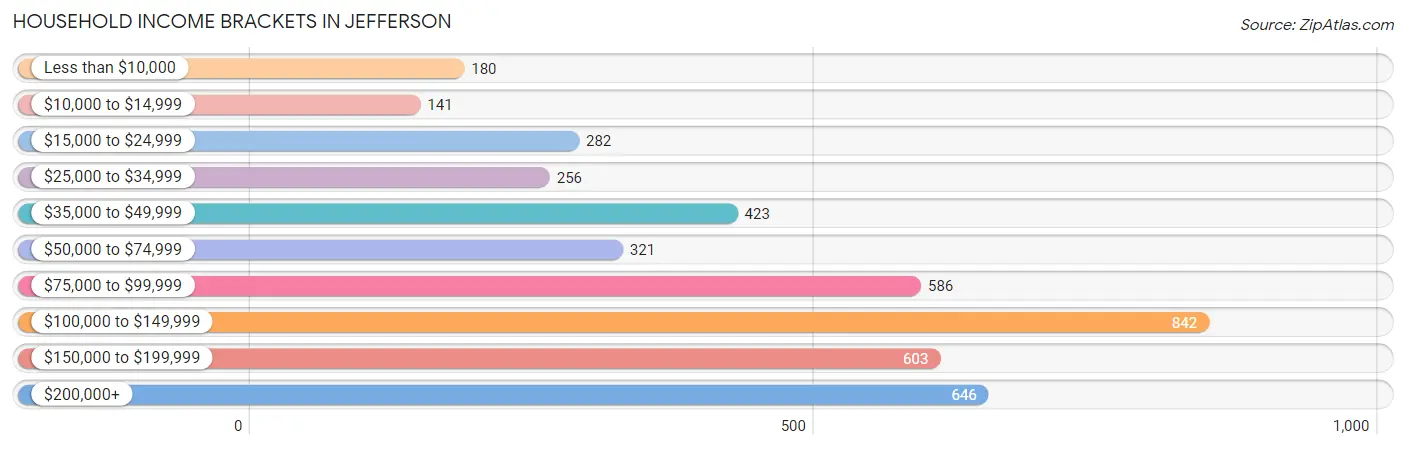
| Income Bracket | # Households | % Households |
| Less than $10,000 | 180 | 4.2% |
| $10,000 to $14,999 | 141 | 3.3% |
| $15,000 to $24,999 | 282 | 6.6% |
| $25,000 to $34,999 | 256 | 6.0% |
| $35,000 to $49,999 | 423 | 9.9% |
| $50,000 to $74,999 | 321 | 7.5% |
| $75,000 to $99,999 | 586 | 13.7% |
| $100,000 to $149,999 | 842 | 19.7% |
| $150,000 to $199,999 | 603 | 14.1% |
| $200,000+ | 646 | 15.1% |
Household Income by Householder Age in Jefferson
The median household income in Jefferson is $95,850, with the highest median household income of $140,943 found in the 45 to 64 years age bracket for the primary householder. A total of 1,433 households (33.5%) fall into this category. Meanwhile, the 15 to 24 years age bracket for the primary householder has the lowest median household income of $0, with 54 households (1.3%) in this group.
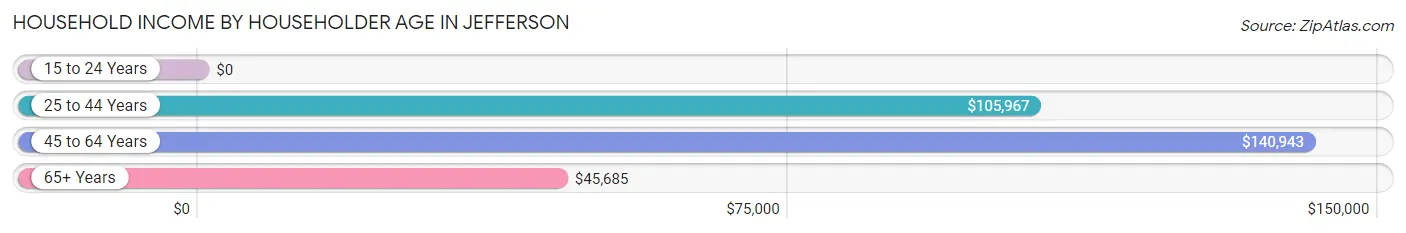
| Income Bracket | # Households | Median Income |
| 15 to 24 Years | 54 (1.3%) | $0 |
| 25 to 44 Years | 1,589 (37.2%) | $105,967 |
| 45 to 64 Years | 1,433 (33.5%) | $140,943 |
| 65+ Years | 1,199 (28.1%) | $45,685 |
| Total | 4,275 (100.0%) | $95,850 |
Poverty in Jefferson
Income Below Poverty by Sex and Age in Jefferson
With 7.2% poverty level for males and 12.0% for females among the residents of Jefferson, 5 year old males and 75 year old and over females are the most vulnerable to poverty, with 17 males (70.8%) and 119 females (27.7%) in their respective age groups living below the poverty level.
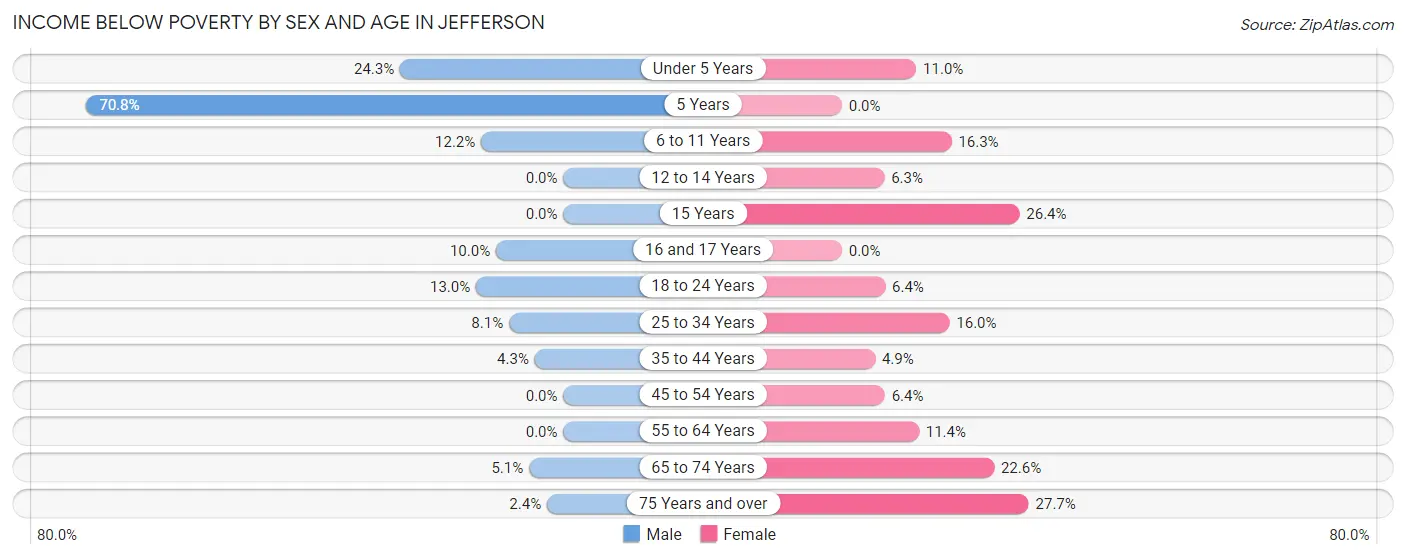
| Age Bracket | Male | Female |
| Under 5 Years | 145 (24.2%) | 34 (11.0%) |
| 5 Years | 17 (70.8%) | 0 (0.0%) |
| 6 to 11 Years | 68 (12.2%) | 111 (16.3%) |
| 12 to 14 Years | 0 (0.0%) | 23 (6.3%) |
| 15 Years | 0 (0.0%) | 24 (26.4%) |
| 16 and 17 Years | 34 (10.0%) | 0 (0.0%) |
| 18 to 24 Years | 84 (13.0%) | 22 (6.4%) |
| 25 to 34 Years | 106 (8.1%) | 145 (16.0%) |
| 35 to 44 Years | 41 (4.3%) | 51 (4.9%) |
| 45 to 54 Years | 0 (0.0%) | 44 (6.4%) |
| 55 to 64 Years | 0 (0.0%) | 60 (11.4%) |
| 65 to 74 Years | 28 (5.1%) | 106 (22.6%) |
| 75 Years and over | 6 (2.4%) | 119 (27.7%) |
| Total | 529 (7.2%) | 739 (12.0%) |
Income Above Poverty by Sex and Age in Jefferson
According to the poverty statistics in Jefferson, males aged 12 to 14 years and females aged 5 years are the age groups that are most secure financially, with 100.0% of males and 100.0% of females in these age groups living above the poverty line.
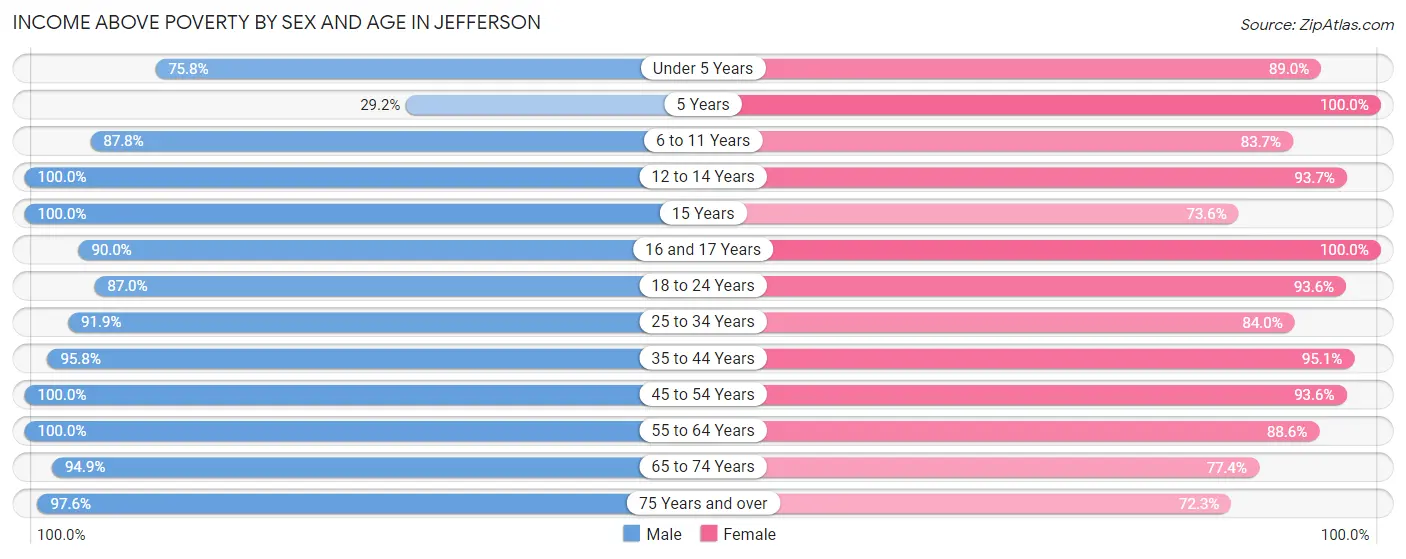
| Age Bracket | Male | Female |
| Under 5 Years | 453 (75.7%) | 274 (89.0%) |
| 5 Years | 7 (29.2%) | 133 (100.0%) |
| 6 to 11 Years | 489 (87.8%) | 571 (83.7%) |
| 12 to 14 Years | 509 (100.0%) | 342 (93.7%) |
| 15 Years | 103 (100.0%) | 67 (73.6%) |
| 16 and 17 Years | 306 (90.0%) | 159 (100.0%) |
| 18 to 24 Years | 564 (87.0%) | 320 (93.6%) |
| 25 to 34 Years | 1,208 (91.9%) | 763 (84.0%) |
| 35 to 44 Years | 923 (95.8%) | 983 (95.1%) |
| 45 to 54 Years | 963 (100.0%) | 647 (93.6%) |
| 55 to 64 Years | 533 (100.0%) | 465 (88.6%) |
| 65 to 74 Years | 522 (94.9%) | 363 (77.4%) |
| 75 Years and over | 241 (97.6%) | 310 (72.3%) |
| Total | 6,821 (92.8%) | 5,397 (88.0%) |
Income Below Poverty Among Married-Couple Families in Jefferson
The poverty statistics for married-couple families in Jefferson show that 1.6% or 45 of the total 2,845 families live below the poverty line. Families with 1 or 2 children have the highest poverty rate of 3.5%, comprising of 39 families. On the other hand, families with 3 or 4 children have the lowest poverty rate of 0.0%, which includes 0 families.
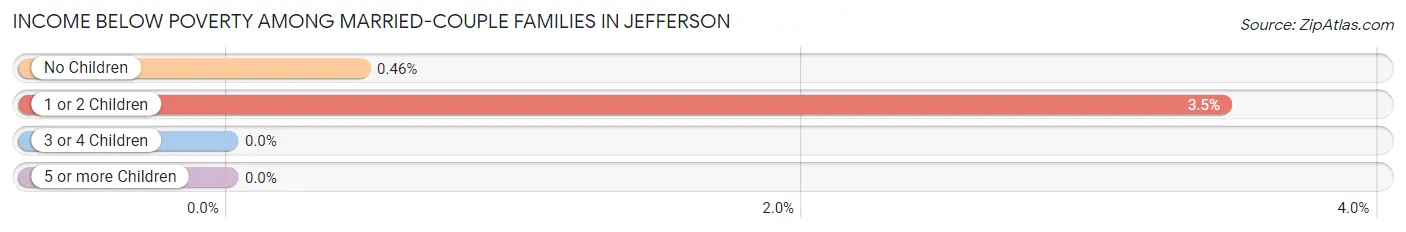
| Children | Above Poverty | Below Poverty |
| No Children | 1,289 (99.5%) | 6 (0.5%) |
| 1 or 2 Children | 1,088 (96.5%) | 39 (3.5%) |
| 3 or 4 Children | 418 (100.0%) | 0 (0.0%) |
| 5 or more Children | 5 (100.0%) | 0 (0.0%) |
| Total | 2,800 (98.4%) | 45 (1.6%) |
Income Below Poverty Among Single-Parent Households in Jefferson
According to the poverty data in Jefferson, 11.9% or 23 single-father households and 32.4% or 142 single-mother households are living below the poverty line. Among single-father households, those with 1 or 2 children have the highest poverty rate, with 23 households (14.9%) experiencing poverty. Likewise, among single-mother households, those with 3 or 4 children have the highest poverty rate, with 15 households (60.0%) falling below the poverty line.
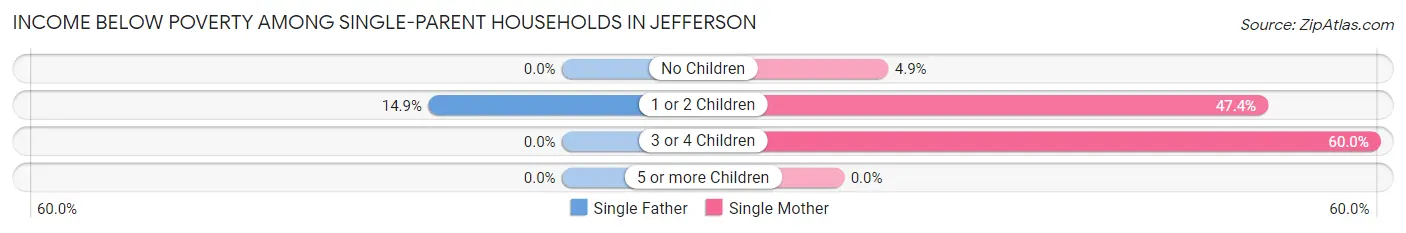
| Children | Single Father | Single Mother |
| No Children | 0 (0.0%) | 8 (4.9%) |
| 1 or 2 Children | 23 (14.9%) | 119 (47.4%) |
| 3 or 4 Children | 0 (0.0%) | 15 (60.0%) |
| 5 or more Children | 0 (0.0%) | 0 (0.0%) |
| Total | 23 (11.9%) | 142 (32.4%) |
Income Below Poverty Among Married-Couple vs Single-Parent Households in Jefferson
The poverty data for Jefferson shows that 45 of the married-couple family households (1.6%) and 165 of the single-parent households (26.1%) are living below the poverty level. Within the married-couple family households, those with 1 or 2 children have the highest poverty rate, with 39 households (3.5%) falling below the poverty line. Among the single-parent households, those with 3 or 4 children have the highest poverty rate, with 15 household (60.0%) living below poverty.
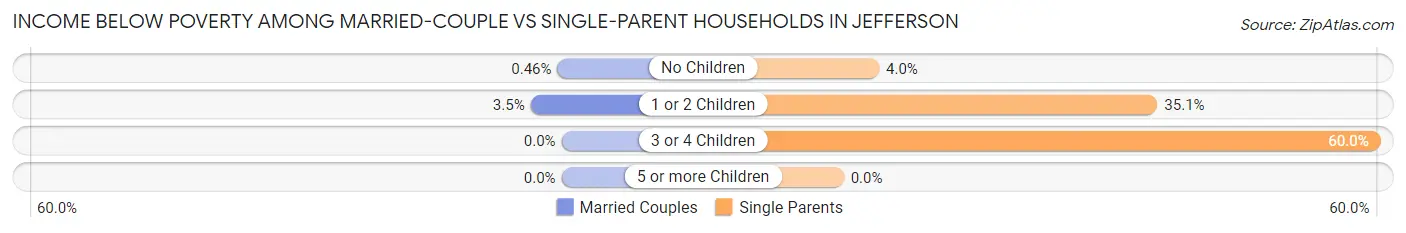
| Children | Married-Couple Families | Single-Parent Households |
| No Children | 6 (0.5%) | 8 (4.0%) |
| 1 or 2 Children | 39 (3.5%) | 142 (35.1%) |
| 3 or 4 Children | 0 (0.0%) | 15 (60.0%) |
| 5 or more Children | 0 (0.0%) | 0 (0.0%) |
| Total | 45 (1.6%) | 165 (26.1%) |
Race in Jefferson
The most populous races in Jefferson are White / Caucasian (10,546 | 78.1%), Black / African American (2,020 | 15.0%), and Hispanic or Latino (1,102 | 8.2%).
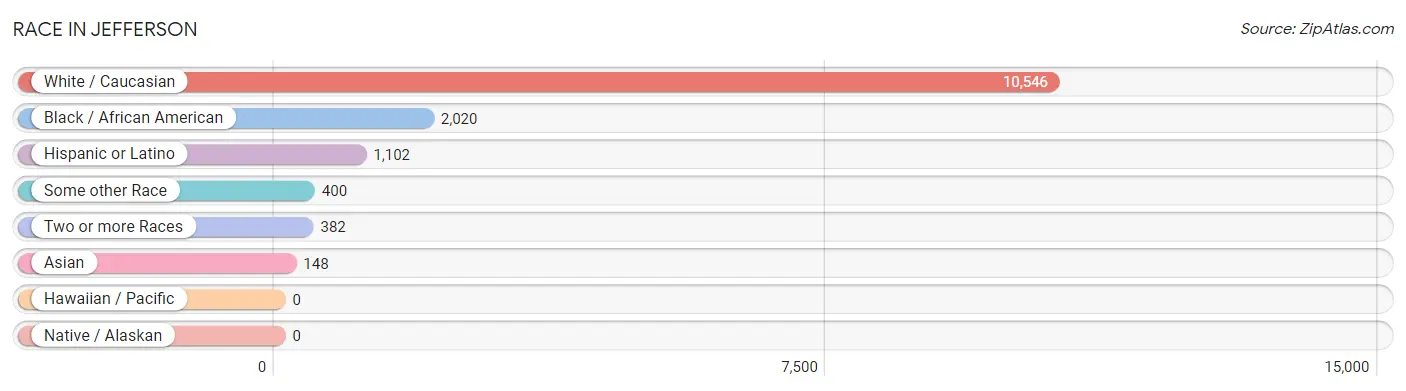
| Race | # Population | % Population |
| Asian | 148 | 1.1% |
| Black / African American | 2,020 | 15.0% |
| Hawaiian / Pacific | 0 | 0.0% |
| Hispanic or Latino | 1,102 | 8.2% |
| Native / Alaskan | 0 | 0.0% |
| White / Caucasian | 10,546 | 78.1% |
| Two or more Races | 382 | 2.8% |
| Some other Race | 400 | 3.0% |
| Total | 13,496 | 100.0% |
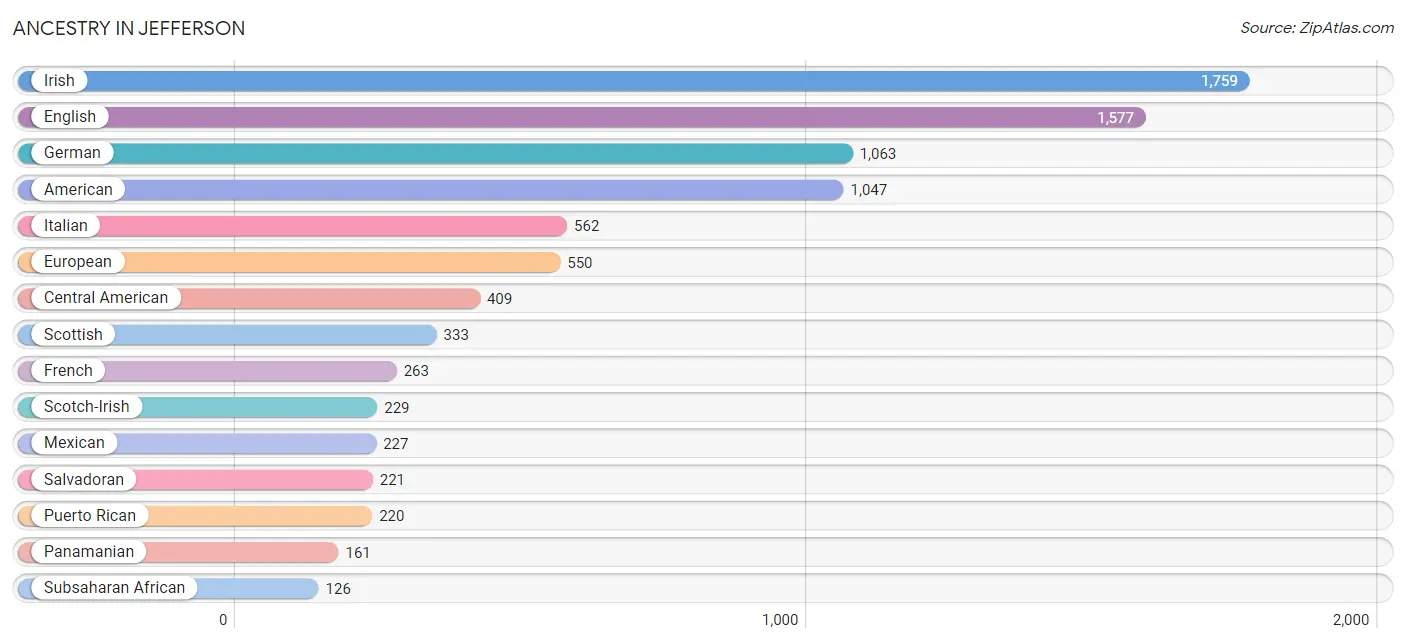
Ancestry in Jefferson
The most populous ancestries reported in Jefferson are Irish (1,759 | 13.0%), English (1,577 | 11.7%), German (1,063 | 7.9%), American (1,047 | 7.8%), and Italian (562 | 4.2%), together accounting for 44.5% of all Jefferson residents.
| Ancestry | # Population | % Population |
| African | 115 | 0.9% |
| American | 1,047 | 7.8% |
| Bangladeshi | 49 | 0.4% |
| Blackfeet | 3 | 0.0% |
| British | 6 | 0.0% |
| Burmese | 89 | 0.7% |
| Canadian | 29 | 0.2% |
| Central American | 409 | 3.0% |
| Cherokee | 7 | 0.1% |
| Colombian | 46 | 0.3% |
| Czechoslovakian | 18 | 0.1% |
| Danish | 20 | 0.2% |
| Dominican | 105 | 0.8% |
| Dutch | 80 | 0.6% |
| Eastern European | 7 | 0.1% |
| Ecuadorian | 24 | 0.2% |
| English | 1,577 | 11.7% |
| European | 550 | 4.1% |
| Finnish | 5 | 0.0% |
| French | 263 | 1.9% |
| German | 1,063 | 7.9% |
| Greek | 44 | 0.3% |
| Guatemalan | 27 | 0.2% |
| Hungarian | 10 | 0.1% |
| Indian (Asian) | 4 | 0.0% |
| Irish | 1,759 | 13.0% |
| Italian | 562 | 4.2% |
| Jamaican | 44 | 0.3% |
| Korean | 20 | 0.2% |
| Lithuanian | 11 | 0.1% |
| Mexican | 227 | 1.7% |
| Norwegian | 109 | 0.8% |
| Panamanian | 161 | 1.2% |
| Peruvian | 46 | 0.3% |
| Portuguese | 33 | 0.2% |
| Puerto Rican | 220 | 1.6% |
| Russian | 93 | 0.7% |
| Salvadoran | 221 | 1.6% |
| Scotch-Irish | 229 | 1.7% |
| Scottish | 333 | 2.5% |
| Slovak | 15 | 0.1% |
| South African | 11 | 0.1% |
| South American | 116 | 0.9% |
| Spaniard | 25 | 0.2% |
| Sri Lankan | 47 | 0.4% |
| Subsaharan African | 126 | 0.9% |
| Swedish | 81 | 0.6% |
| Welsh | 91 | 0.7% | View All 48 Rows |
Immigrants in Jefferson
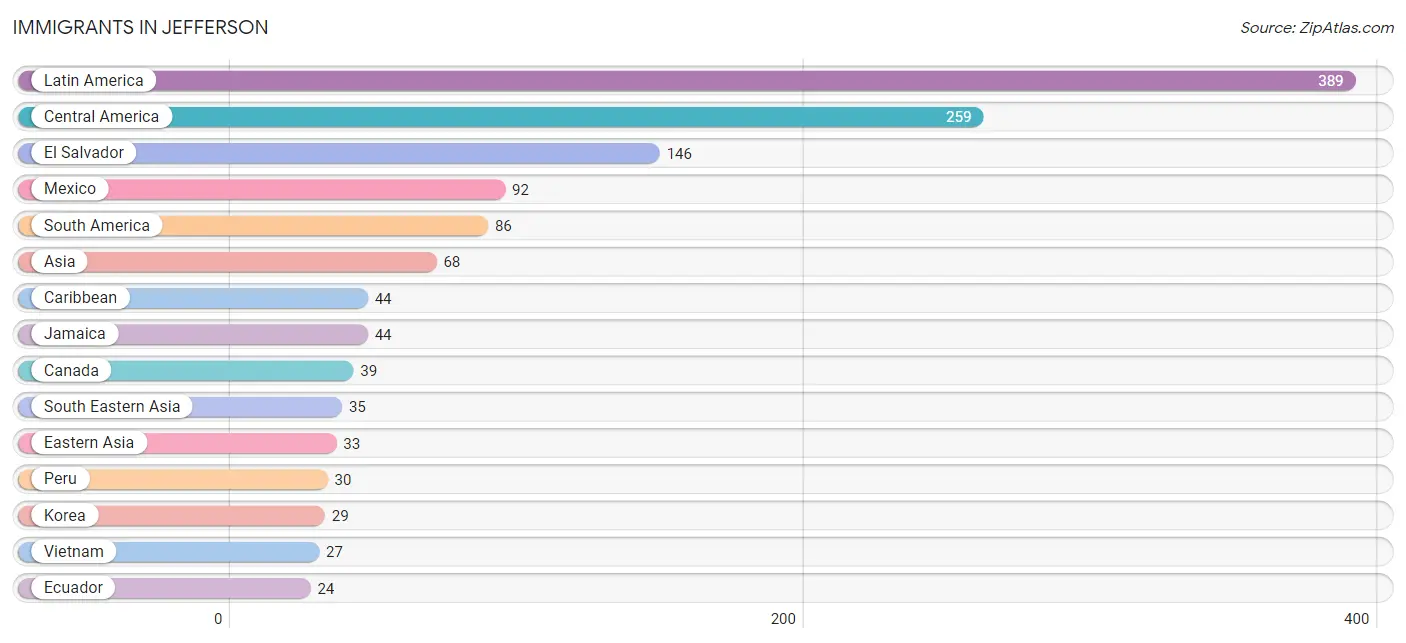
The most numerous immigrant groups reported in Jefferson came from Latin America (389 | 2.9%), Central America (259 | 1.9%), El Salvador (146 | 1.1%), Mexico (92 | 0.7%), and South America (86 | 0.6%), together accounting for 7.2% of all Jefferson residents.
| Immigration Origin | # Population | % Population |
| Asia | 68 | 0.5% |
| Brazil | 15 | 0.1% |
| Canada | 39 | 0.3% |
| Caribbean | 44 | 0.3% |
| Central America | 259 | 1.9% |
| China | 4 | 0.0% |
| Colombia | 17 | 0.1% |
| Eastern Asia | 33 | 0.2% |
| Ecuador | 24 | 0.2% |
| El Salvador | 146 | 1.1% |
| Honduras | 21 | 0.2% |
| Jamaica | 44 | 0.3% |
| Korea | 29 | 0.2% |
| Laos | 8 | 0.1% |
| Latin America | 389 | 2.9% |
| Mexico | 92 | 0.7% |
| Peru | 30 | 0.2% |
| South America | 86 | 0.6% |
| South Eastern Asia | 35 | 0.3% |
| Vietnam | 27 | 0.2% | View All 20 Rows |
Sex and Age in Jefferson
Sex and Age in Jefferson
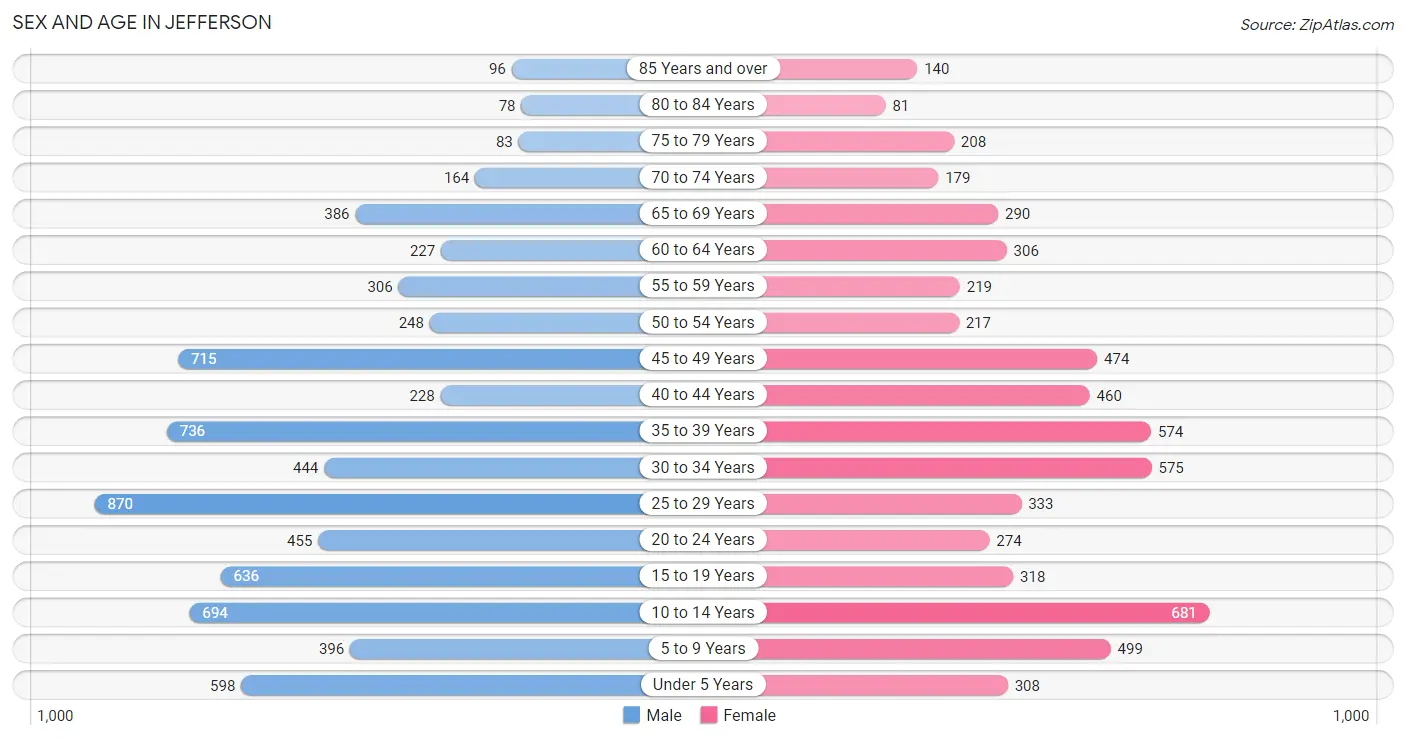
The most populous age groups in Jefferson are 25 to 29 Years (870 | 11.8%) for men and 10 to 14 Years (681 | 11.1%) for women.
| Age Bracket | Male | Female |
| Under 5 Years | 598 (8.1%) | 308 (5.0%) |
| 5 to 9 Years | 396 (5.4%) | 499 (8.1%) |
| 10 to 14 Years | 694 (9.4%) | 681 (11.1%) |
| 15 to 19 Years | 636 (8.6%) | 318 (5.2%) |
| 20 to 24 Years | 455 (6.2%) | 274 (4.5%) |
| 25 to 29 Years | 870 (11.8%) | 333 (5.4%) |
| 30 to 34 Years | 444 (6.0%) | 575 (9.4%) |
| 35 to 39 Years | 736 (10.0%) | 574 (9.3%) |
| 40 to 44 Years | 228 (3.1%) | 460 (7.5%) |
| 45 to 49 Years | 715 (9.7%) | 474 (7.7%) |
| 50 to 54 Years | 248 (3.4%) | 217 (3.5%) |
| 55 to 59 Years | 306 (4.2%) | 219 (3.6%) |
| 60 to 64 Years | 227 (3.1%) | 306 (5.0%) |
| 65 to 69 Years | 386 (5.2%) | 290 (4.7%) |
| 70 to 74 Years | 164 (2.2%) | 179 (2.9%) |
| 75 to 79 Years | 83 (1.1%) | 208 (3.4%) |
| 80 to 84 Years | 78 (1.1%) | 81 (1.3%) |
| 85 Years and over | 96 (1.3%) | 140 (2.3%) |
| Total | 7,360 (100.0%) | 6,136 (100.0%) |
Families and Households in Jefferson
Median Family Size in Jefferson
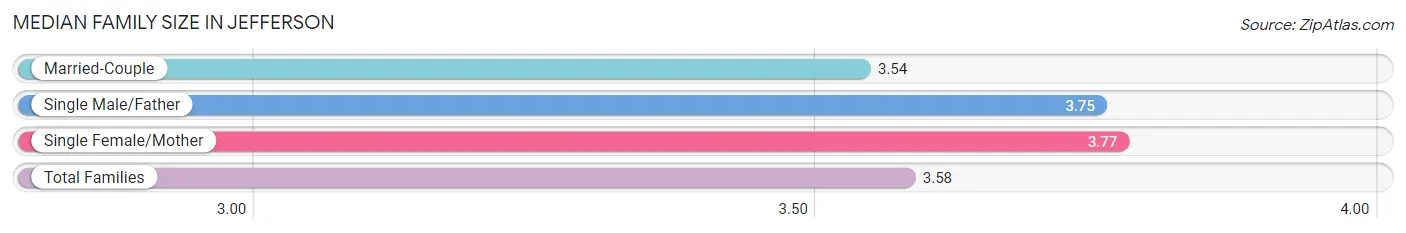
The median family size in Jefferson is 3.58 persons per family, with single female/mother families (438 | 12.6%) accounting for the largest median family size of 3.77 persons per family. On the other hand, married-couple families (2,845 | 81.8%) represent the smallest median family size with 3.54 persons per family.
| Family Type | # Families | Family Size |
| Married-Couple | 2,845 (81.8%) | 3.54 |
| Single Male/Father | 194 (5.6%) | 3.75 |
| Single Female/Mother | 438 (12.6%) | 3.77 |
| Total Families | 3,477 (100.0%) | 3.58 |
Median Household Size in Jefferson
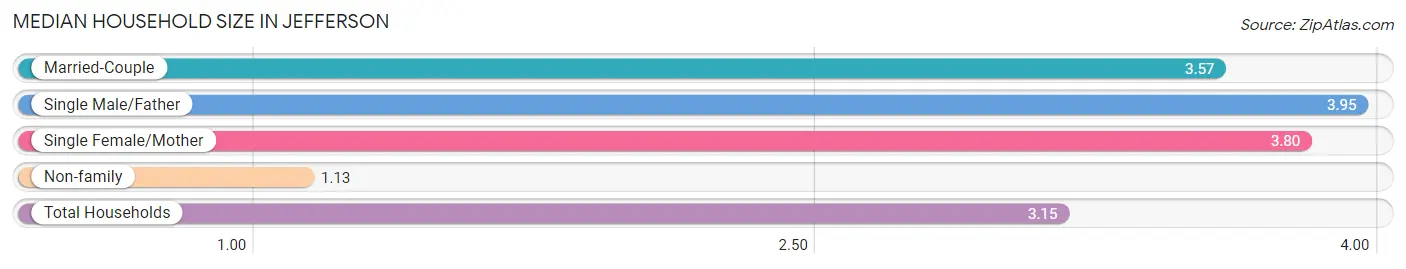
The median household size in Jefferson is 3.15 persons per household, with single male/father households (194 | 4.5%) accounting for the largest median household size of 3.95 persons per household. non-family households (798 | 18.7%) represent the smallest median household size with 1.13 persons per household.
| Household Type | # Households | Household Size |
| Married-Couple | 2,845 (66.5%) | 3.57 |
| Single Male/Father | 194 (4.5%) | 3.95 |
| Single Female/Mother | 438 (10.2%) | 3.80 |
| Non-family | 798 (18.7%) | 1.13 |
| Total Households | 4,275 (100.0%) | 3.15 |
Household Size by Marriage Status in Jefferson
Out of a total of 4,275 households in Jefferson, 3,477 (81.3%) are family households, while 798 (18.7%) are nonfamily households. The most numerous type of family households are 2-person households, comprising 1,043, and the most common type of nonfamily households are 1-person households, comprising 703.
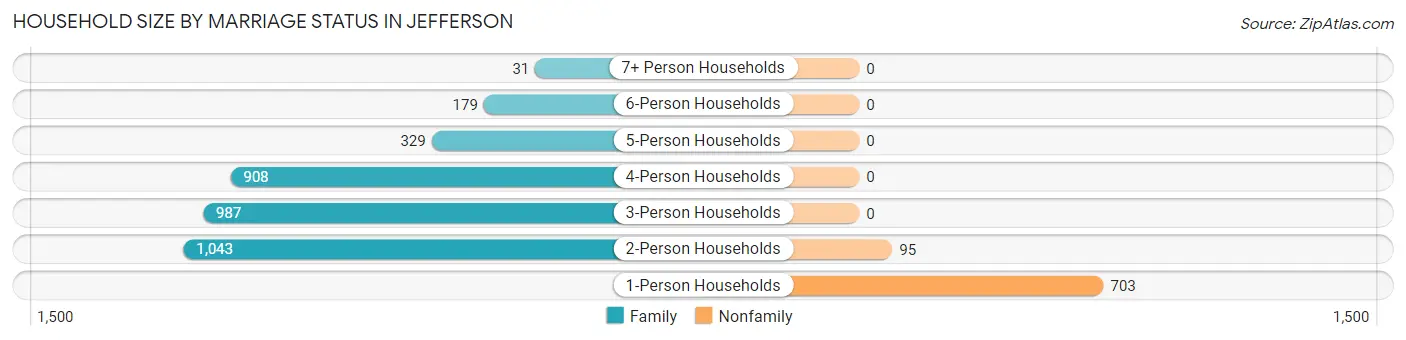
| Household Size | Family Households | Nonfamily Households |
| 1-Person Households | - | 703 (16.4%) |
| 2-Person Households | 1,043 (24.4%) | 95 (2.2%) |
| 3-Person Households | 987 (23.1%) | 0 (0.0%) |
| 4-Person Households | 908 (21.2%) | 0 (0.0%) |
| 5-Person Households | 329 (7.7%) | 0 (0.0%) |
| 6-Person Households | 179 (4.2%) | 0 (0.0%) |
| 7+ Person Households | 31 (0.7%) | 0 (0.0%) |
| Total | 3,477 (81.3%) | 798 (18.7%) |
Female Fertility in Jefferson
Fertility by Age in Jefferson
Average fertility rate in Jefferson is 45.0 births per 1,000 women. Women in the age bracket of 20 to 34 years have the highest fertility rate with 115.0 births per 1,000 women. Women in the age bracket of 20 to 34 years acount for 100.0% of all women with births.
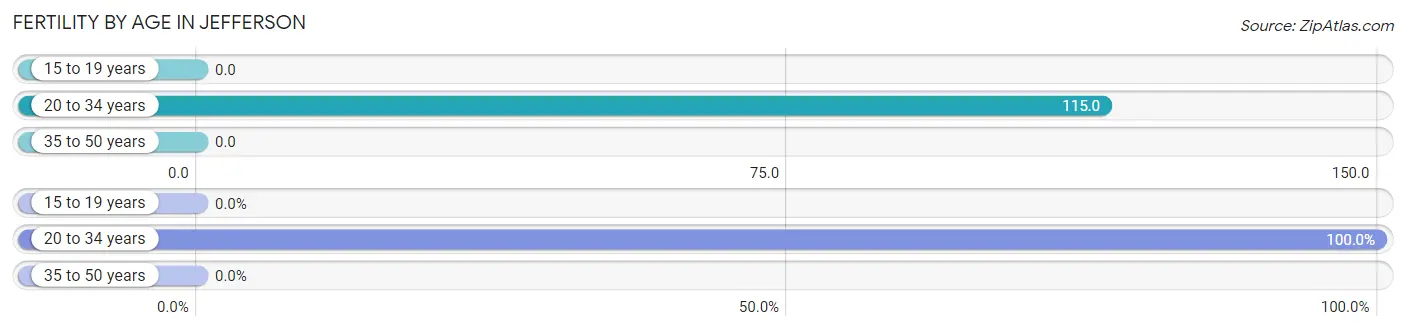
| Age Bracket | Women with Births | Births / 1,000 Women |
| 15 to 19 years | 0 (0.0%) | 0.0 |
| 20 to 34 years | 136 (100.0%) | 115.0 |
| 35 to 50 years | 0 (0.0%) | 0.0 |
| Total | 136 (100.0%) | 45.0 |
Fertility by Age by Marriage Status in Jefferson
33.1% of women with births (136) in Jefferson are married. The highest percentage of unmarried women with births falls into 20 to 34 years age bracket with 66.9% of them unmarried at the time of birth, while the lowest percentage of unmarried women with births belong to 20 to 34 years age bracket with 66.9% of them unmarried.
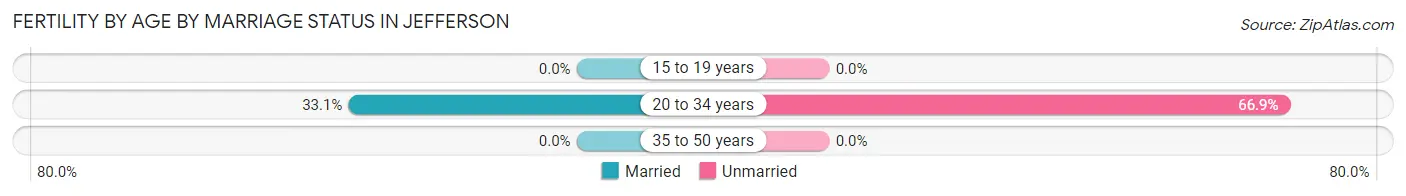
| Age Bracket | Married | Unmarried |
| 15 to 19 years | 0 (0.0%) | 0 (0.0%) |
| 20 to 34 years | 45 (33.1%) | 91 (66.9%) |
| 35 to 50 years | 0 (0.0%) | 0 (0.0%) |
| Total | 45 (33.1%) | 91 (66.9%) |
Fertility by Education in Jefferson
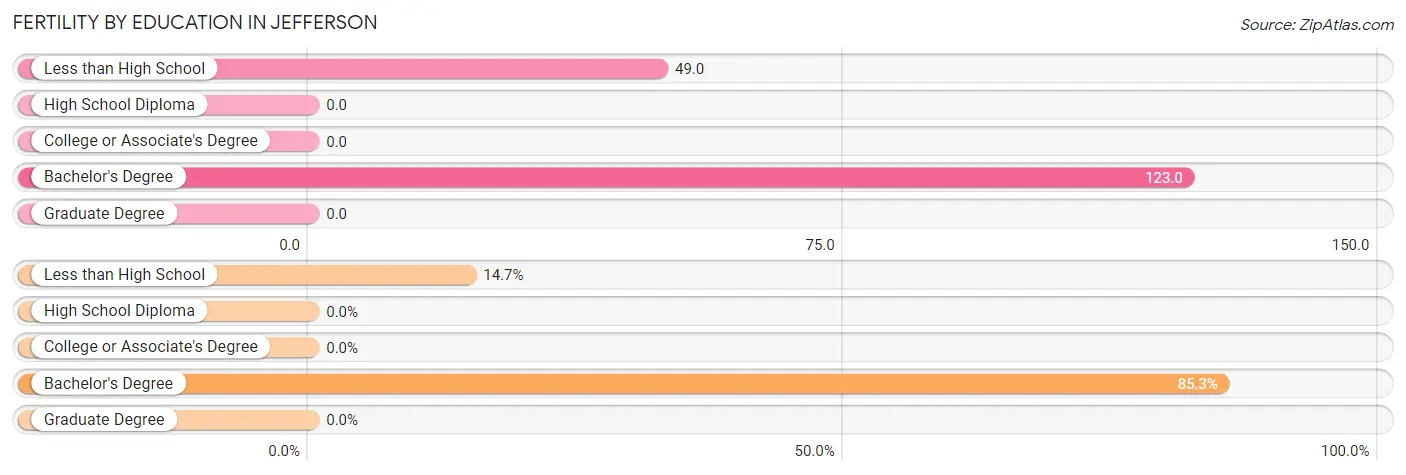
| Educational Attainment | Women with Births | Births / 1,000 Women |
| Less than High School | 20 (14.7%) | 49.0 |
| High School Diploma | 0 (0.0%) | 0.0 |
| College or Associate's Degree | 0 (0.0%) | 0.0 |
| Bachelor's Degree | 116 (85.3%) | 123.0 |
| Graduate Degree | 0 (0.0%) | 0.0 |
| Total | 136 (100.0%) | 45.0 |
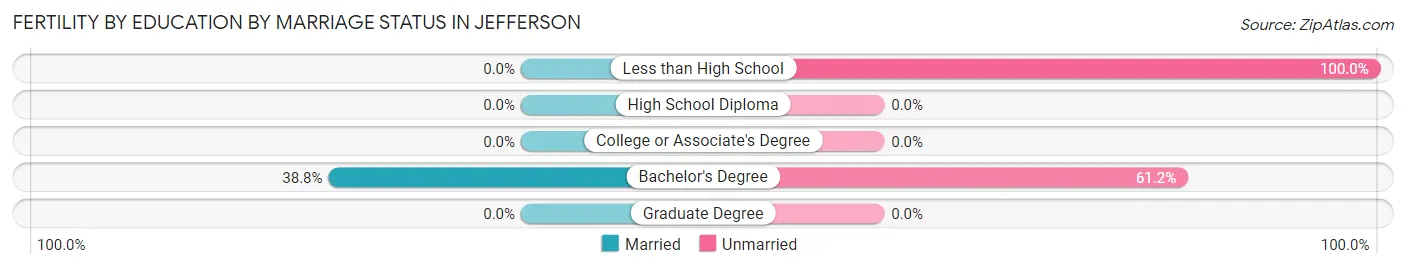
Fertility by Education by Marriage Status in Jefferson
66.9% of women with births in Jefferson are unmarried. Women with the educational attainment of bachelor's degree are most likely to be married with 38.8% of them married at childbirth, while women with the educational attainment of less than high school are least likely to be married with 100.0% of them unmarried at childbirth.
| Educational Attainment | Married | Unmarried |
| Less than High School | 0 (0.0%) | 20 (100.0%) |
| High School Diploma | 0 (0.0%) | 0 (0.0%) |
| College or Associate's Degree | 0 (0.0%) | 0 (0.0%) |
| Bachelor's Degree | 45 (38.8%) | 71 (61.2%) |
| Graduate Degree | 0 (0.0%) | 0 (0.0%) |
| Total | 45 (33.1%) | 91 (66.9%) |
Employment Characteristics in Jefferson
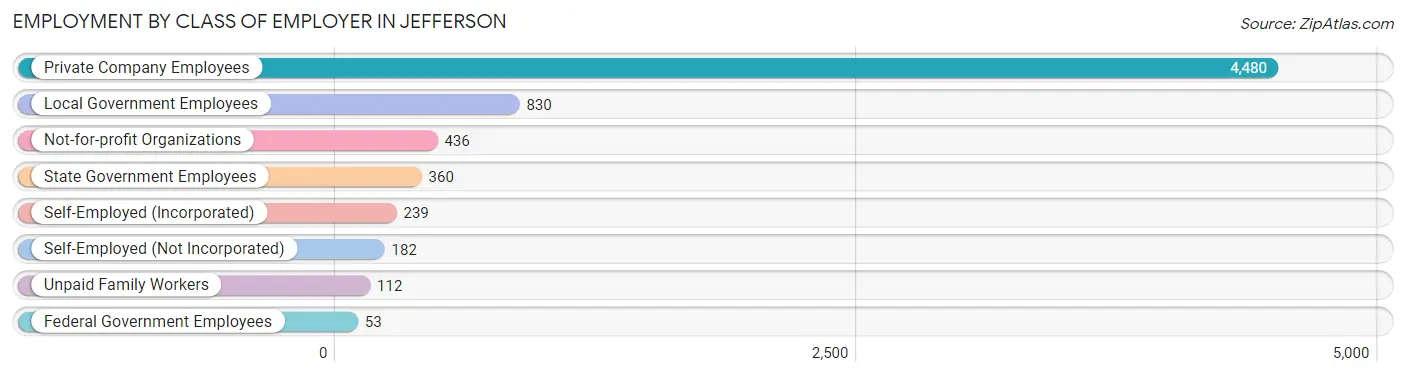
Employment by Class of Employer in Jefferson
Among the 6,692 employed individuals in Jefferson, private company employees (4,480 | 66.9%), local government employees (830 | 12.4%), and not-for-profit organizations (436 | 6.5%) make up the most common classes of employment.
| Employer Class | # Employees | % Employees |
| Private Company Employees | 4,480 | 66.9% |
| Self-Employed (Incorporated) | 239 | 3.6% |
| Self-Employed (Not Incorporated) | 182 | 2.7% |
| Not-for-profit Organizations | 436 | 6.5% |
| Local Government Employees | 830 | 12.4% |
| State Government Employees | 360 | 5.4% |
| Federal Government Employees | 53 | 0.8% |
| Unpaid Family Workers | 112 | 1.7% |
| Total | 6,692 | 100.0% |
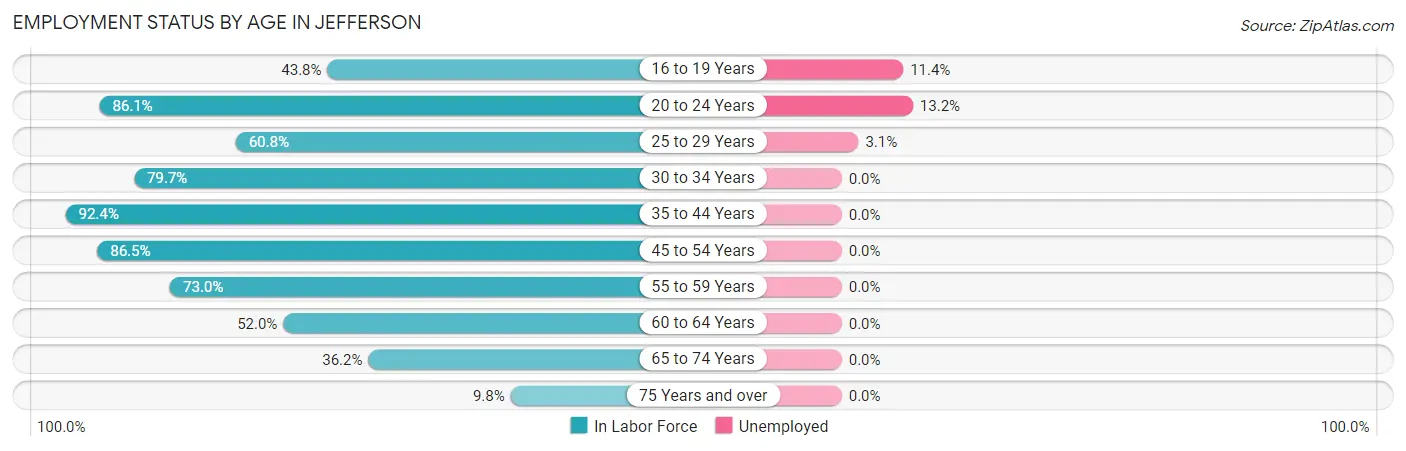
Employment Status by Age in Jefferson
According to the labor force statistics for Jefferson, out of the total population over 16 years of age (10,126), 67.9% or 6,876 individuals are in the labor force, with 2.1% or 144 of them unemployed. The age group with the highest labor force participation rate is 35 to 44 years, with 92.4% or 1,846 individuals in the labor force. Within the labor force, the 20 to 24 years age range has the highest percentage of unemployed individuals, with 13.2% or 83 of them being unemployed.
| Age Bracket | In Labor Force | Unemployed |
| 16 to 19 Years | 333 (43.8%) | 38 (11.4%) |
| 20 to 24 Years | 628 (86.1%) | 83 (13.2%) |
| 25 to 29 Years | 731 (60.8%) | 23 (3.1%) |
| 30 to 34 Years | 812 (79.7%) | 0 (0.0%) |
| 35 to 44 Years | 1,846 (92.4%) | 0 (0.0%) |
| 45 to 54 Years | 1,431 (86.5%) | 0 (0.0%) |
| 55 to 59 Years | 383 (73.0%) | 0 (0.0%) |
| 60 to 64 Years | 277 (52.0%) | 0 (0.0%) |
| 65 to 74 Years | 369 (36.2%) | 0 (0.0%) |
| 75 Years and over | 67 (9.8%) | 0 (0.0%) |
| Total | 6,876 (67.9%) | 144 (2.1%) |
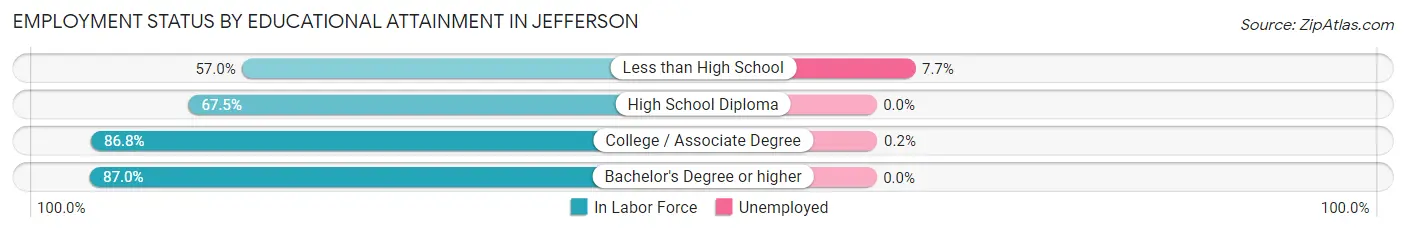
Employment Status by Educational Attainment in Jefferson
According to labor force statistics for Jefferson, 79.1% of individuals (5,483) out of the total population between 25 and 64 years of age (6,932) are in the labor force, with 0.4% or 22 of them being unemployed. The group with the highest labor force participation rate are those with the educational attainment of bachelor's degree or higher, with 87.0% or 2,210 individuals in the labor force. Within the labor force, individuals with less than high school education have the highest percentage of unemployment, with 7.7% or 20 of them being unemployed.
| Educational Attainment | In Labor Force | Unemployed |
| Less than High School | 259 (57.0%) | 35 (7.7%) |
| High School Diploma | 1,427 (67.5%) | 0 (0.0%) |
| College / Associate Degree | 1,583 (86.8%) | 4 (0.2%) |
| Bachelor's Degree or higher | 2,210 (87.0%) | 0 (0.0%) |
| Total | 5,483 (79.1%) | 28 (0.4%) |
Employment Occupations by Sex in Jefferson
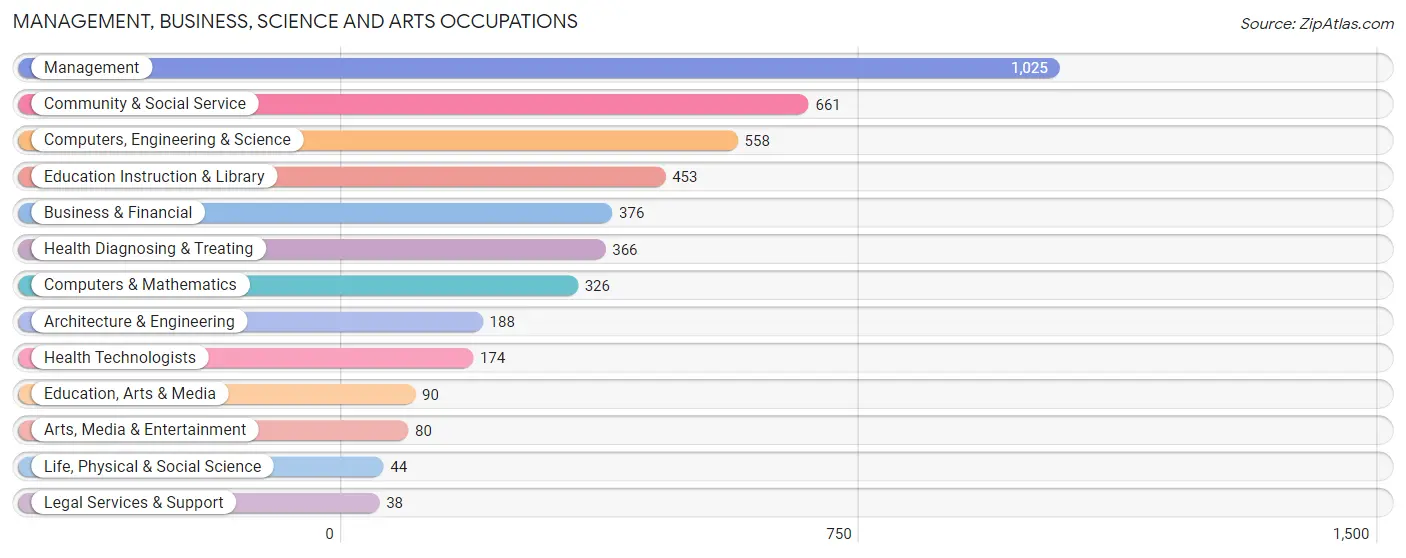
Management, Business, Science and Arts Occupations
The most common Management, Business, Science and Arts occupations in Jefferson are Management (1,025 | 15.2%), Community & Social Service (661 | 9.8%), Computers, Engineering & Science (558 | 8.3%), Education Instruction & Library (453 | 6.7%), and Business & Financial (376 | 5.6%).
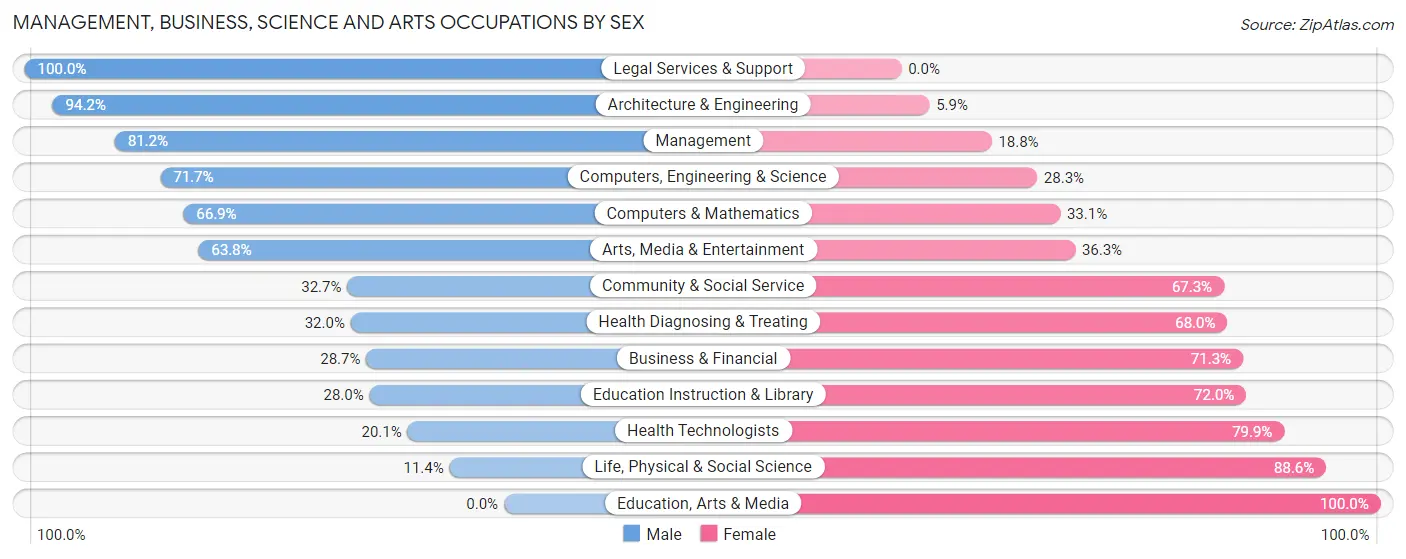
Management, Business, Science and Arts Occupations by Sex
Within the Management, Business, Science and Arts occupations in Jefferson, the most male-oriented occupations are Legal Services & Support (100.0%), Architecture & Engineering (94.2%), and Management (81.2%), while the most female-oriented occupations are Education, Arts & Media (100.0%), Life, Physical & Social Science (88.6%), and Health Technologists (79.9%).
| Occupation | Male | Female |
| Management | 832 (81.2%) | 193 (18.8%) |
| Business & Financial | 108 (28.7%) | 268 (71.3%) |
| Computers, Engineering & Science | 400 (71.7%) | 158 (28.3%) |
| Computers & Mathematics | 218 (66.9%) | 108 (33.1%) |
| Architecture & Engineering | 177 (94.2%) | 11 (5.9%) |
| Life, Physical & Social Science | 5 (11.4%) | 39 (88.6%) |
| Community & Social Service | 216 (32.7%) | 445 (67.3%) |
| Education, Arts & Media | 0 (0.0%) | 90 (100.0%) |
| Legal Services & Support | 38 (100.0%) | 0 (0.0%) |
| Education Instruction & Library | 127 (28.0%) | 326 (72.0%) |
| Arts, Media & Entertainment | 51 (63.7%) | 29 (36.2%) |
| Health Diagnosing & Treating | 117 (32.0%) | 249 (68.0%) |
| Health Technologists | 35 (20.1%) | 139 (79.9%) |
| Total (Category) | 1,673 (56.0%) | 1,313 (44.0%) |
| Total (Overall) | 4,085 (60.7%) | 2,649 (39.3%) |
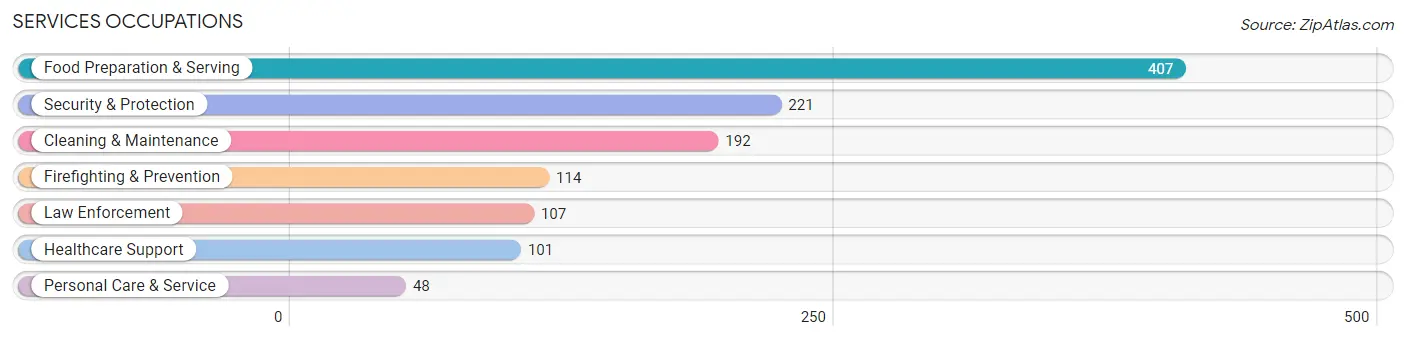
Services Occupations
The most common Services occupations in Jefferson are Food Preparation & Serving (407 | 6.0%), Security & Protection (221 | 3.3%), Cleaning & Maintenance (192 | 2.9%), Firefighting & Prevention (114 | 1.7%), and Law Enforcement (107 | 1.6%).
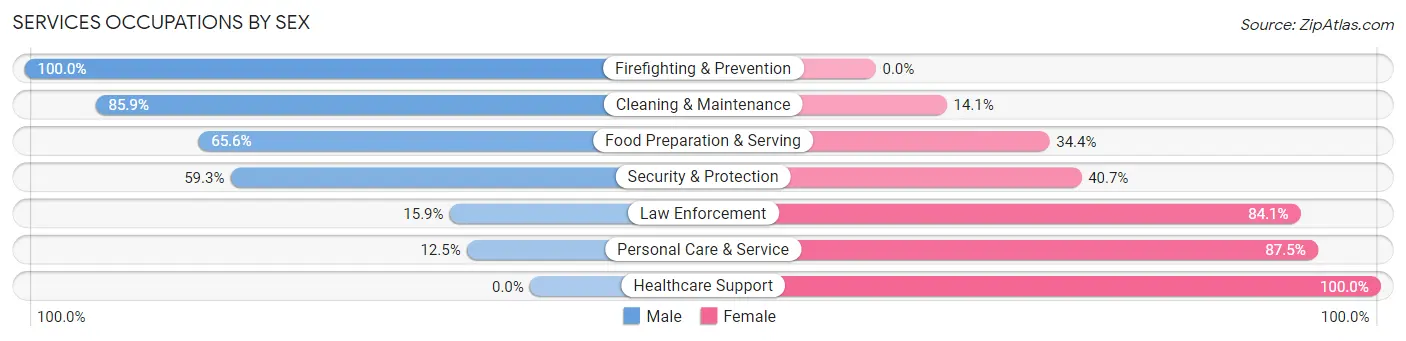
Services Occupations by Sex
Within the Services occupations in Jefferson, the most male-oriented occupations are Firefighting & Prevention (100.0%), Cleaning & Maintenance (85.9%), and Food Preparation & Serving (65.6%), while the most female-oriented occupations are Healthcare Support (100.0%), Personal Care & Service (87.5%), and Law Enforcement (84.1%).
| Occupation | Male | Female |
| Healthcare Support | 0 (0.0%) | 101 (100.0%) |
| Security & Protection | 131 (59.3%) | 90 (40.7%) |
| Firefighting & Prevention | 114 (100.0%) | 0 (0.0%) |
| Law Enforcement | 17 (15.9%) | 90 (84.1%) |
| Food Preparation & Serving | 267 (65.6%) | 140 (34.4%) |
| Cleaning & Maintenance | 165 (85.9%) | 27 (14.1%) |
| Personal Care & Service | 6 (12.5%) | 42 (87.5%) |
| Total (Category) | 569 (58.7%) | 400 (41.3%) |
| Total (Overall) | 4,085 (60.7%) | 2,649 (39.3%) |
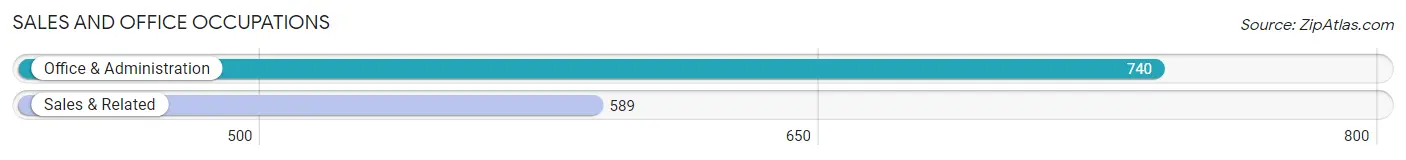
Sales and Office Occupations
The most common Sales and Office occupations in Jefferson are Office & Administration (740 | 11.0%), and Sales & Related (589 | 8.7%).
Sales and Office Occupations by Sex
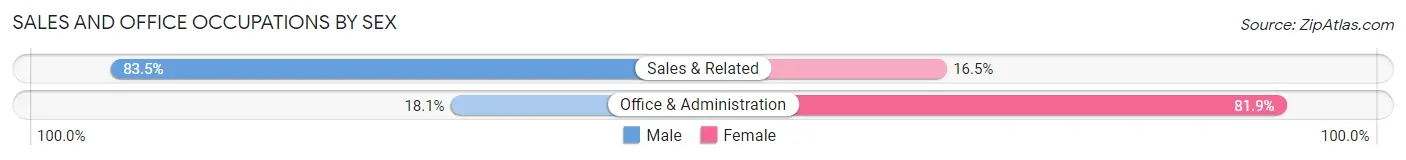
| Occupation | Male | Female |
| Sales & Related | 492 (83.5%) | 97 (16.5%) |
| Office & Administration | 134 (18.1%) | 606 (81.9%) |
| Total (Category) | 626 (47.1%) | 703 (52.9%) |
| Total (Overall) | 4,085 (60.7%) | 2,649 (39.3%) |
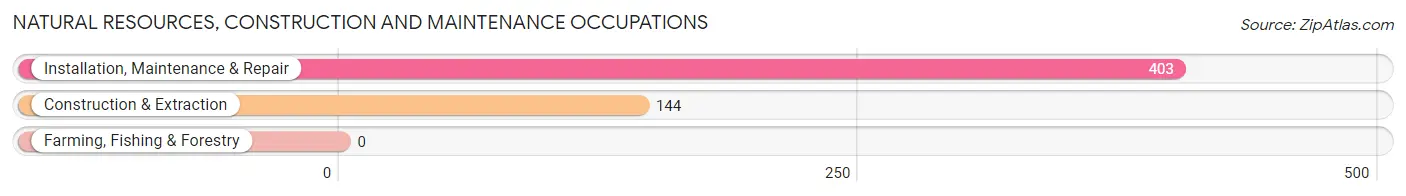
Natural Resources, Construction and Maintenance Occupations
The most common Natural Resources, Construction and Maintenance occupations in Jefferson are Installation, Maintenance & Repair (403 | 6.0%), and Construction & Extraction (144 | 2.1%).
Natural Resources, Construction and Maintenance Occupations by Sex
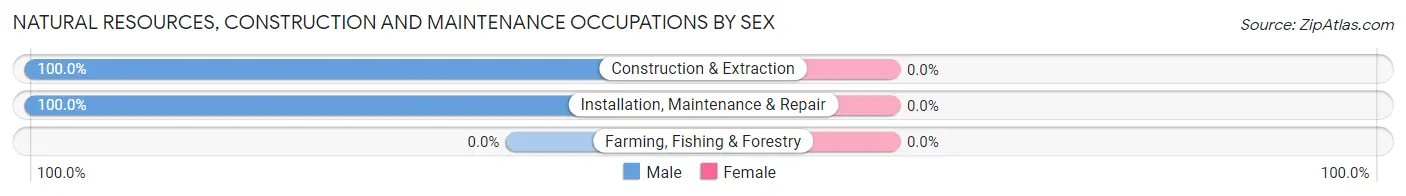
| Occupation | Male | Female |
| Farming, Fishing & Forestry | 0 (0.0%) | 0 (0.0%) |
| Construction & Extraction | 144 (100.0%) | 0 (0.0%) |
| Installation, Maintenance & Repair | 403 (100.0%) | 0 (0.0%) |
| Total (Category) | 547 (100.0%) | 0 (0.0%) |
| Total (Overall) | 4,085 (60.7%) | 2,649 (39.3%) |
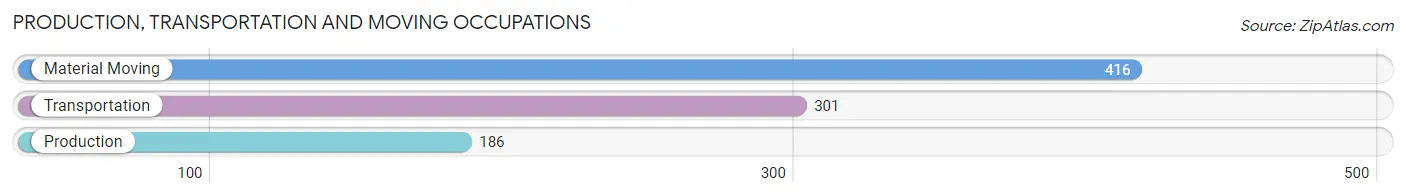
Production, Transportation and Moving Occupations
The most common Production, Transportation and Moving occupations in Jefferson are Material Moving (416 | 6.2%), Transportation (301 | 4.5%), and Production (186 | 2.8%).
Production, Transportation and Moving Occupations by Sex
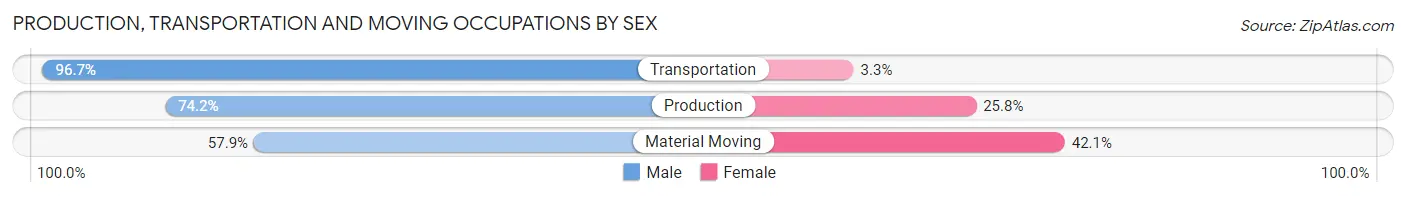
| Occupation | Male | Female |
| Production | 138 (74.2%) | 48 (25.8%) |
| Transportation | 291 (96.7%) | 10 (3.3%) |
| Material Moving | 241 (57.9%) | 175 (42.1%) |
| Total (Category) | 670 (74.2%) | 233 (25.8%) |
| Total (Overall) | 4,085 (60.7%) | 2,649 (39.3%) |
Employment Industries by Sex in Jefferson
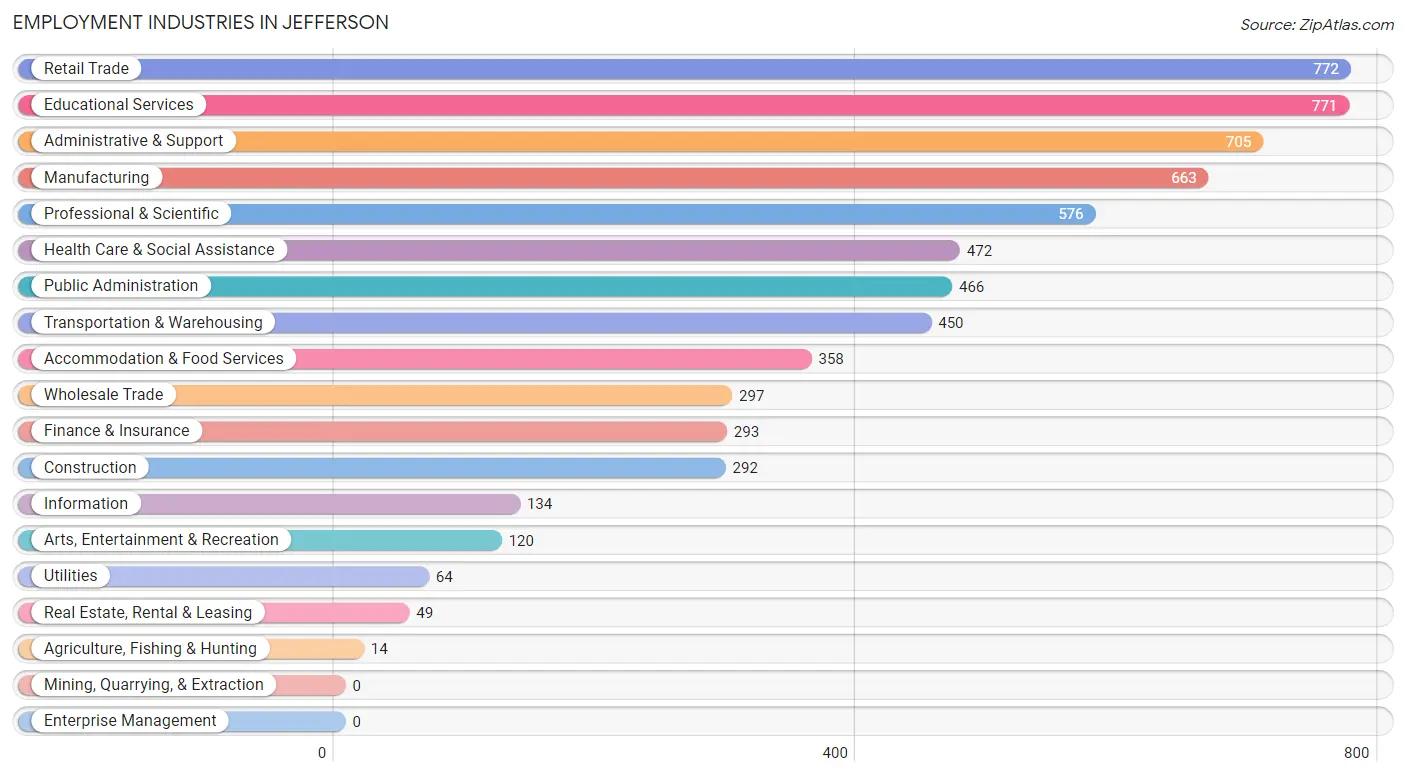
Employment Industries in Jefferson
The major employment industries in Jefferson include Retail Trade (772 | 11.5%), Educational Services (771 | 11.5%), Administrative & Support (705 | 10.5%), Manufacturing (663 | 9.9%), and Professional & Scientific (576 | 8.6%).
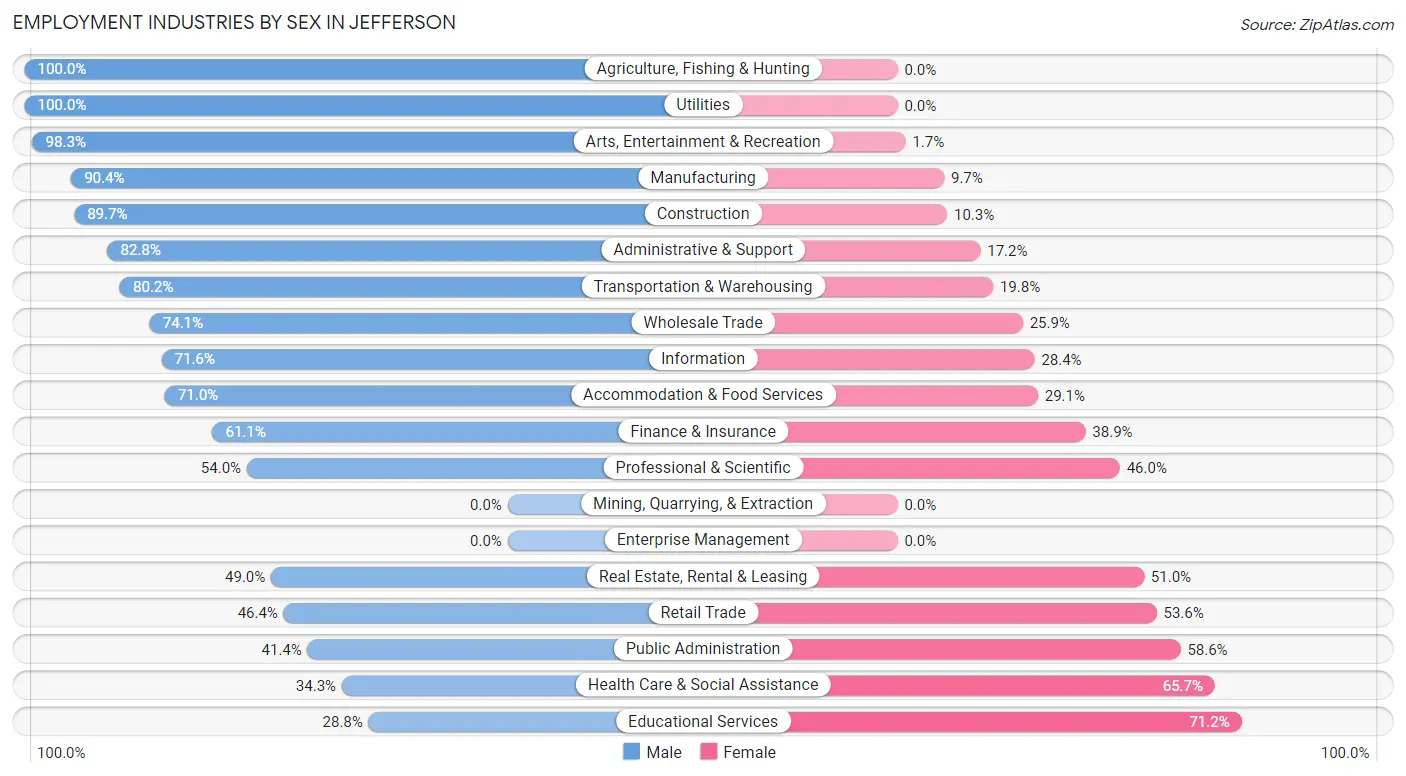
Employment Industries by Sex in Jefferson
The Jefferson industries that see more men than women are Agriculture, Fishing & Hunting (100.0%), Utilities (100.0%), and Arts, Entertainment & Recreation (98.3%), whereas the industries that tend to have a higher number of women are Educational Services (71.2%), Health Care & Social Assistance (65.7%), and Public Administration (58.6%).
| Industry | Male | Female |
| Agriculture, Fishing & Hunting | 14 (100.0%) | 0 (0.0%) |
| Mining, Quarrying, & Extraction | 0 (0.0%) | 0 (0.0%) |
| Construction | 262 (89.7%) | 30 (10.3%) |
| Manufacturing | 599 (90.3%) | 64 (9.7%) |
| Wholesale Trade | 220 (74.1%) | 77 (25.9%) |
| Retail Trade | 358 (46.4%) | 414 (53.6%) |
| Transportation & Warehousing | 361 (80.2%) | 89 (19.8%) |
| Utilities | 64 (100.0%) | 0 (0.0%) |
| Information | 96 (71.6%) | 38 (28.4%) |
| Finance & Insurance | 179 (61.1%) | 114 (38.9%) |
| Real Estate, Rental & Leasing | 24 (49.0%) | 25 (51.0%) |
| Professional & Scientific | 311 (54.0%) | 265 (46.0%) |
| Enterprise Management | 0 (0.0%) | 0 (0.0%) |
| Administrative & Support | 584 (82.8%) | 121 (17.2%) |
| Educational Services | 222 (28.8%) | 549 (71.2%) |
| Health Care & Social Assistance | 162 (34.3%) | 310 (65.7%) |
| Arts, Entertainment & Recreation | 118 (98.3%) | 2 (1.7%) |
| Accommodation & Food Services | 254 (71.0%) | 104 (29.0%) |
| Public Administration | 193 (41.4%) | 273 (58.6%) |
| Total | 4,085 (60.7%) | 2,649 (39.3%) |
Education in Jefferson
School Enrollment in Jefferson
The most common levels of schooling among the 4,264 students in Jefferson are middle school (1,112 | 26.1%), high school (872 | 20.4%), and elementary school (815 | 19.1%).
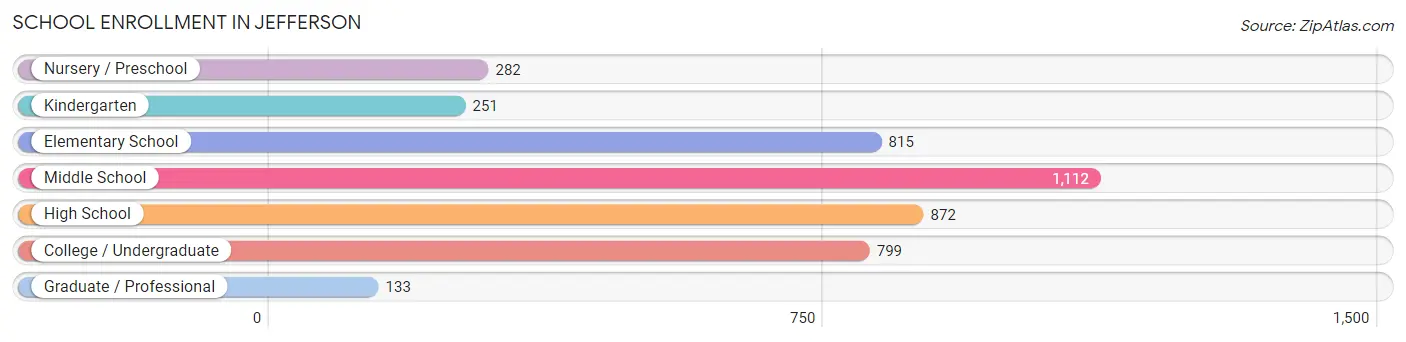
| School Level | # Students | % Students |
| Nursery / Preschool | 282 | 6.6% |
| Kindergarten | 251 | 5.9% |
| Elementary School | 815 | 19.1% |
| Middle School | 1,112 | 26.1% |
| High School | 872 | 20.4% |
| College / Undergraduate | 799 | 18.7% |
| Graduate / Professional | 133 | 3.1% |
| Total | 4,264 | 100.0% |
School Enrollment by Age by Funding Source in Jefferson
Out of a total of 4,264 students who are enrolled in schools in Jefferson, 431 (10.1%) attend a private institution, while the remaining 3,833 (89.9%) are enrolled in public schools. The age group of 25 to 34 year olds has the highest likelihood of being enrolled in private schools, with 130 (51.4% in the age bracket) enrolled. Conversely, the age group of 18 to 19 year olds has the lowest likelihood of being enrolled in a private school, with 208 (100.0% in the age bracket) attending a public institution.
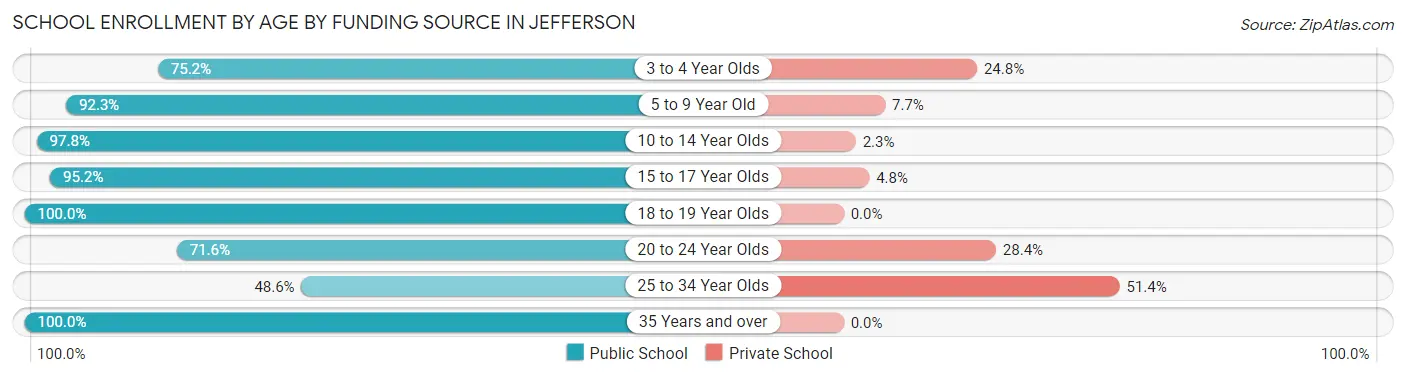
| Age Bracket | Public School | Private School |
| 3 to 4 Year Olds | 218 (75.2%) | 72 (24.8%) |
| 5 to 9 Year Old | 826 (92.3%) | 69 (7.7%) |
| 10 to 14 Year Olds | 1,344 (97.8%) | 31 (2.2%) |
| 15 to 17 Year Olds | 660 (95.2%) | 33 (4.8%) |
| 18 to 19 Year Olds | 208 (100.0%) | 0 (0.0%) |
| 20 to 24 Year Olds | 240 (71.6%) | 95 (28.4%) |
| 25 to 34 Year Olds | 123 (48.6%) | 130 (51.4%) |
| 35 Years and over | 215 (100.0%) | 0 (0.0%) |
| Total | 3,833 (89.9%) | 431 (10.1%) |
Educational Attainment by Field of Study in Jefferson
Business (731 | 22.5%), education (577 | 17.7%), arts & humanities (385 | 11.8%), science & technology (337 | 10.4%), and social sciences (269 | 8.3%) are the most common fields of study among 3,250 individuals in Jefferson who have obtained a bachelor's degree or higher.
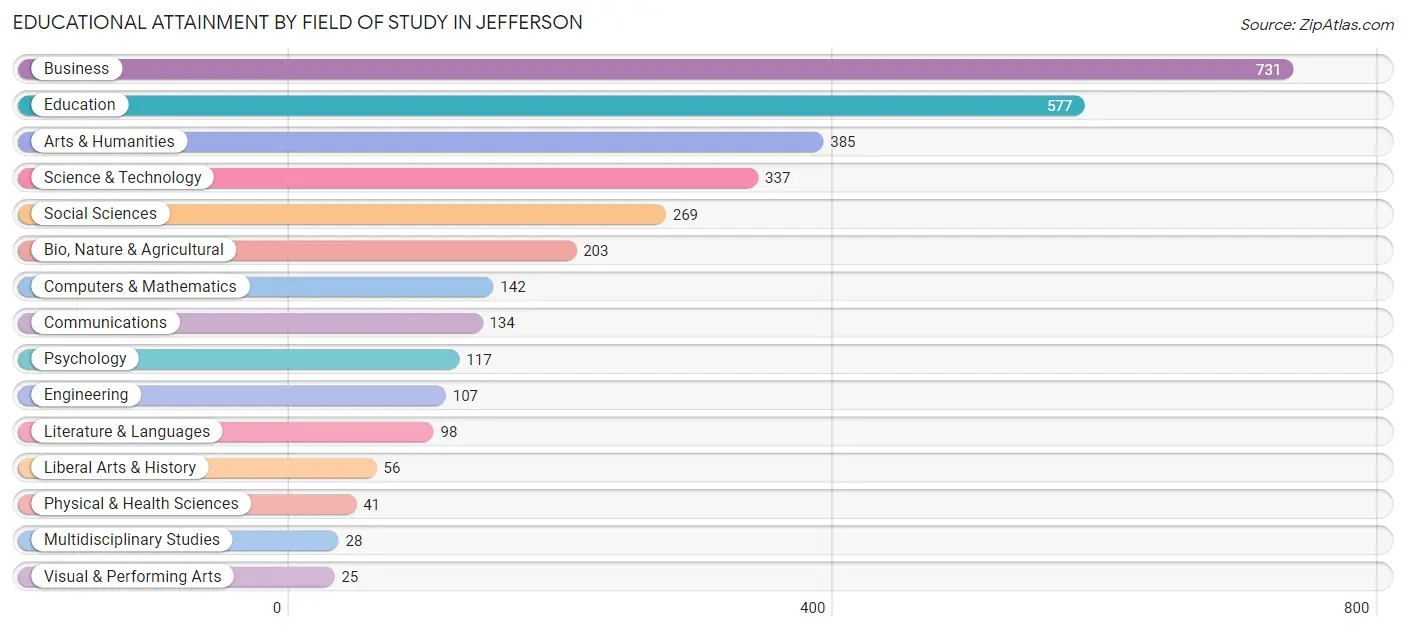
| Field of Study | # Graduates | % Graduates |
| Computers & Mathematics | 142 | 4.4% |
| Bio, Nature & Agricultural | 203 | 6.2% |
| Physical & Health Sciences | 41 | 1.3% |
| Psychology | 117 | 3.6% |
| Social Sciences | 269 | 8.3% |
| Engineering | 107 | 3.3% |
| Multidisciplinary Studies | 28 | 0.9% |
| Science & Technology | 337 | 10.4% |
| Business | 731 | 22.5% |
| Education | 577 | 17.7% |
| Literature & Languages | 98 | 3.0% |
| Liberal Arts & History | 56 | 1.7% |
| Visual & Performing Arts | 25 | 0.8% |
| Communications | 134 | 4.1% |
| Arts & Humanities | 385 | 11.8% |
| Total | 3,250 | 100.0% |
Transportation & Commute in Jefferson
Vehicle Availability by Sex in Jefferson
The most prevalent vehicle ownership categories in Jefferson are males with 2 vehicles (1,811, accounting for 44.7%) and females with 2 vehicles (977, making up 68.6%).
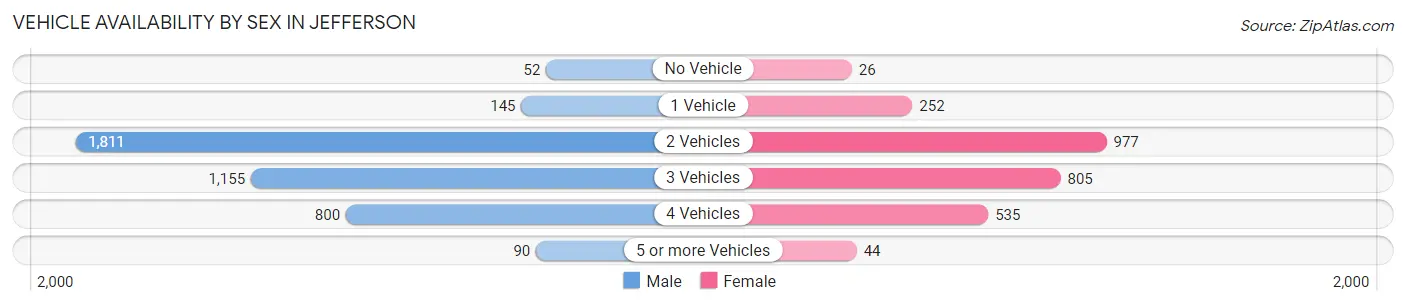
| Vehicles Available | Male | Female |
| No Vehicle | 52 (1.3%) | 26 (1.0%) |
| 1 Vehicle | 145 (3.6%) | 252 (9.6%) |
| 2 Vehicles | 1,811 (44.7%) | 977 (37.0%) |
| 3 Vehicles | 1,155 (28.5%) | 805 (30.5%) |
| 4 Vehicles | 800 (19.7%) | 535 (20.3%) |
| 5 or more Vehicles | 90 (2.2%) | 44 (1.7%) |
| Total | 4,053 (100.0%) | 2,639 (100.0%) |
Commute Time in Jefferson
The most frequently occuring commute durations in Jefferson are 30 to 34 minutes (1,456 commuters, 24.9%), 10 to 14 minutes (686 commuters, 11.7%), and 45 to 59 minutes (652 commuters, 11.2%).
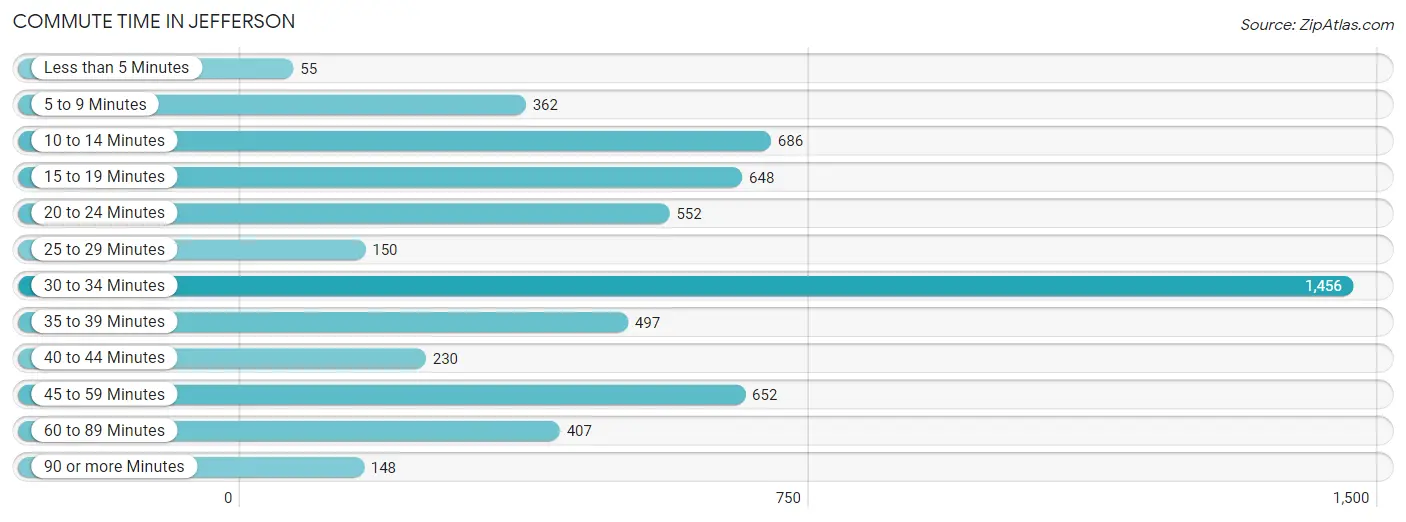
| Commute Time | # Commuters | % Commuters |
| Less than 5 Minutes | 55 | 0.9% |
| 5 to 9 Minutes | 362 | 6.2% |
| 10 to 14 Minutes | 686 | 11.7% |
| 15 to 19 Minutes | 648 | 11.1% |
| 20 to 24 Minutes | 552 | 9.5% |
| 25 to 29 Minutes | 150 | 2.6% |
| 30 to 34 Minutes | 1,456 | 24.9% |
| 35 to 39 Minutes | 497 | 8.5% |
| 40 to 44 Minutes | 230 | 3.9% |
| 45 to 59 Minutes | 652 | 11.2% |
| 60 to 89 Minutes | 407 | 7.0% |
| 90 or more Minutes | 148 | 2.5% |
Commute Time by Sex in Jefferson
The most common commute times in Jefferson are 30 to 34 minutes (999 commuters, 26.7%) for males and 30 to 34 minutes (457 commuters, 21.8%) for females.
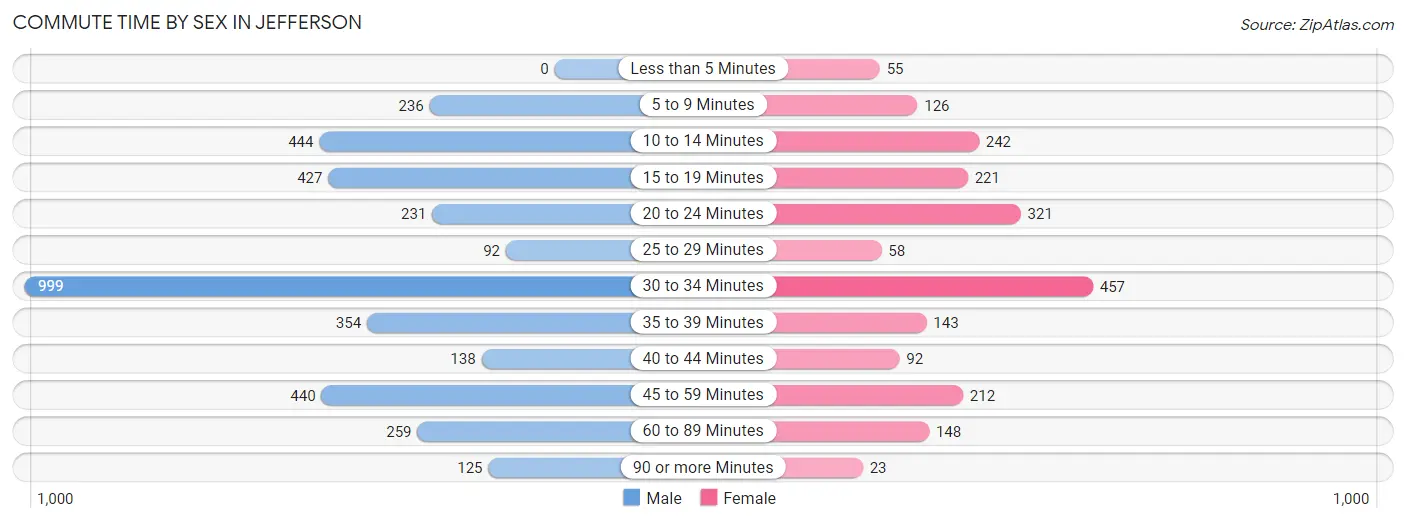
| Commute Time | Male | Female |
| Less than 5 Minutes | 0 (0.0%) | 55 (2.6%) |
| 5 to 9 Minutes | 236 (6.3%) | 126 (6.0%) |
| 10 to 14 Minutes | 444 (11.9%) | 242 (11.5%) |
| 15 to 19 Minutes | 427 (11.4%) | 221 (10.5%) |
| 20 to 24 Minutes | 231 (6.2%) | 321 (15.3%) |
| 25 to 29 Minutes | 92 (2.5%) | 58 (2.8%) |
| 30 to 34 Minutes | 999 (26.7%) | 457 (21.8%) |
| 35 to 39 Minutes | 354 (9.5%) | 143 (6.8%) |
| 40 to 44 Minutes | 138 (3.7%) | 92 (4.4%) |
| 45 to 59 Minutes | 440 (11.7%) | 212 (10.1%) |
| 60 to 89 Minutes | 259 (6.9%) | 148 (7.0%) |
| 90 or more Minutes | 125 (3.3%) | 23 (1.1%) |
Time of Departure to Work by Sex in Jefferson
The most frequent times of departure to work in Jefferson are 7:00 AM to 7:29 AM (826, 22.1%) for males and 7:00 AM to 7:29 AM (316, 15.1%) for females.
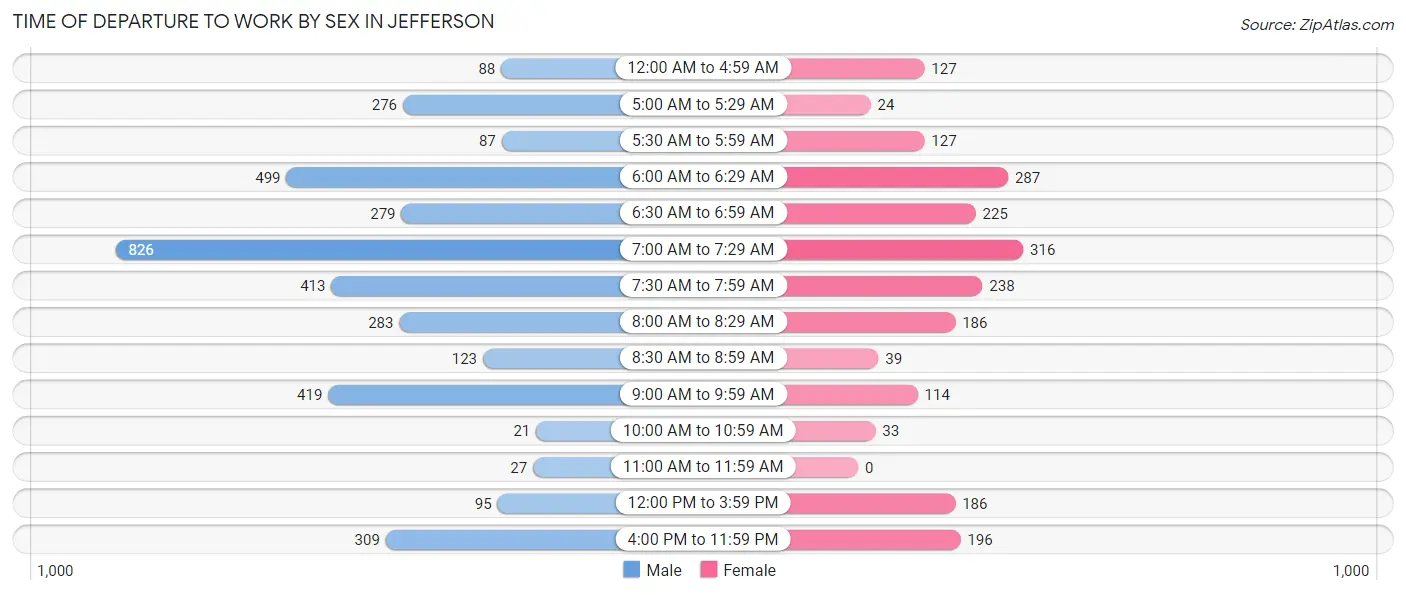
| Time of Departure | Male | Female |
| 12:00 AM to 4:59 AM | 88 (2.4%) | 127 (6.0%) |
| 5:00 AM to 5:29 AM | 276 (7.4%) | 24 (1.1%) |
| 5:30 AM to 5:59 AM | 87 (2.3%) | 127 (6.0%) |
| 6:00 AM to 6:29 AM | 499 (13.3%) | 287 (13.7%) |
| 6:30 AM to 6:59 AM | 279 (7.4%) | 225 (10.7%) |
| 7:00 AM to 7:29 AM | 826 (22.1%) | 316 (15.1%) |
| 7:30 AM to 7:59 AM | 413 (11.0%) | 238 (11.3%) |
| 8:00 AM to 8:29 AM | 283 (7.6%) | 186 (8.9%) |
| 8:30 AM to 8:59 AM | 123 (3.3%) | 39 (1.9%) |
| 9:00 AM to 9:59 AM | 419 (11.2%) | 114 (5.4%) |
| 10:00 AM to 10:59 AM | 21 (0.6%) | 33 (1.6%) |
| 11:00 AM to 11:59 AM | 27 (0.7%) | 0 (0.0%) |
| 12:00 PM to 3:59 PM | 95 (2.5%) | 186 (8.9%) |
| 4:00 PM to 11:59 PM | 309 (8.3%) | 196 (9.3%) |
| Total | 3,745 (100.0%) | 2,098 (100.0%) |
Housing Occupancy in Jefferson
Occupancy by Ownership in Jefferson
Of the total 4,275 dwellings in Jefferson, owner-occupied units account for 3,424 (80.1%), while renter-occupied units make up 851 (19.9%).
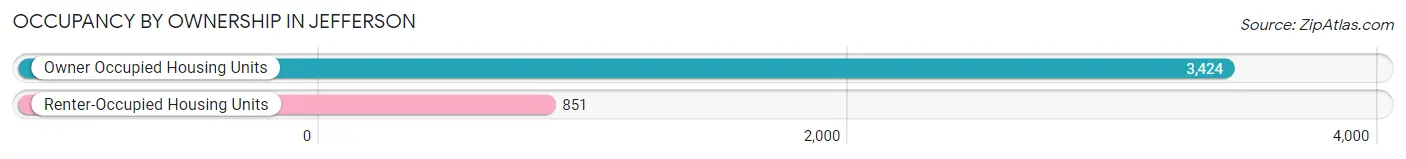
| Occupancy | # Housing Units | % Housing Units |
| Owner Occupied Housing Units | 3,424 | 80.1% |
| Renter-Occupied Housing Units | 851 | 19.9% |
| Total Occupied Housing Units | 4,275 | 100.0% |
Occupancy by Household Size in Jefferson
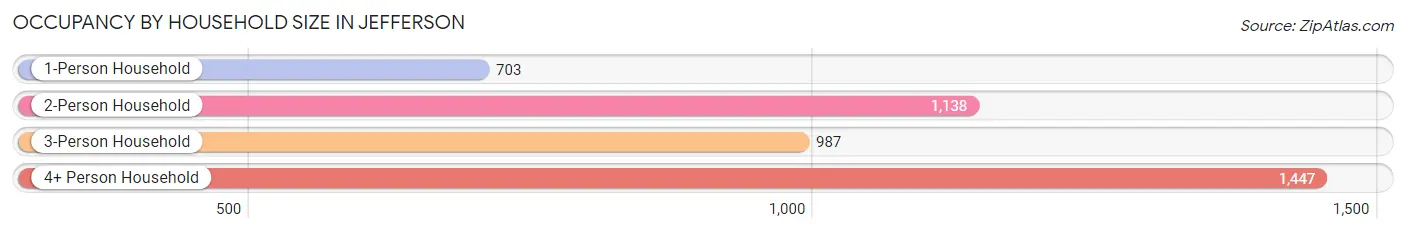
| Household Size | # Housing Units | % Housing Units |
| 1-Person Household | 703 | 16.4% |
| 2-Person Household | 1,138 | 26.6% |
| 3-Person Household | 987 | 23.1% |
| 4+ Person Household | 1,447 | 33.9% |
| Total Housing Units | 4,275 | 100.0% |
Occupancy by Ownership by Household Size in Jefferson
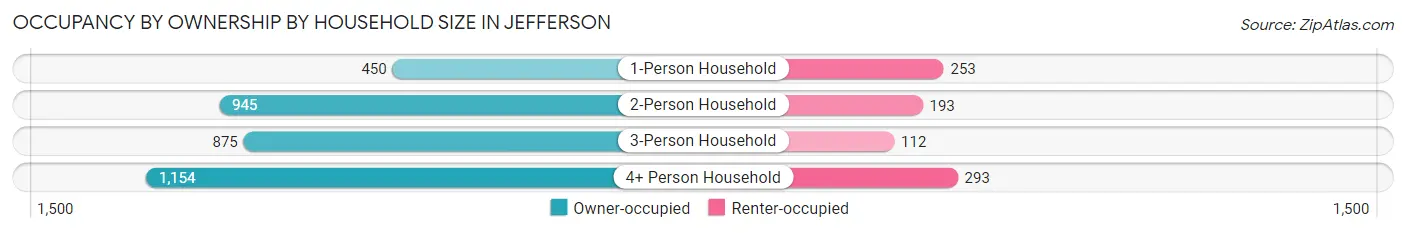
| Household Size | Owner-occupied | Renter-occupied |
| 1-Person Household | 450 (64.0%) | 253 (36.0%) |
| 2-Person Household | 945 (83.0%) | 193 (17.0%) |
| 3-Person Household | 875 (88.6%) | 112 (11.4%) |
| 4+ Person Household | 1,154 (79.7%) | 293 (20.3%) |
| Total Housing Units | 3,424 (80.1%) | 851 (19.9%) |
Occupancy by Educational Attainment in Jefferson
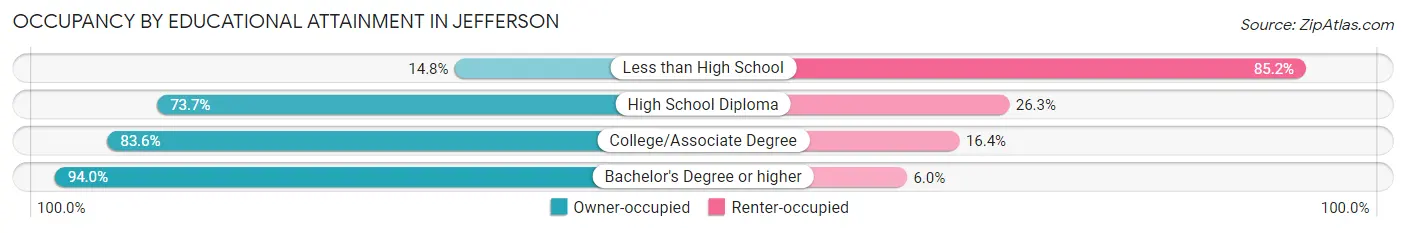
| Household Size | Owner-occupied | Renter-occupied |
| Less than High School | 49 (14.8%) | 282 (85.2%) |
| High School Diploma | 709 (73.7%) | 253 (26.3%) |
| College/Associate Degree | 1,100 (83.6%) | 216 (16.4%) |
| Bachelor's Degree or higher | 1,566 (94.0%) | 100 (6.0%) |
Occupancy by Age of Householder in Jefferson
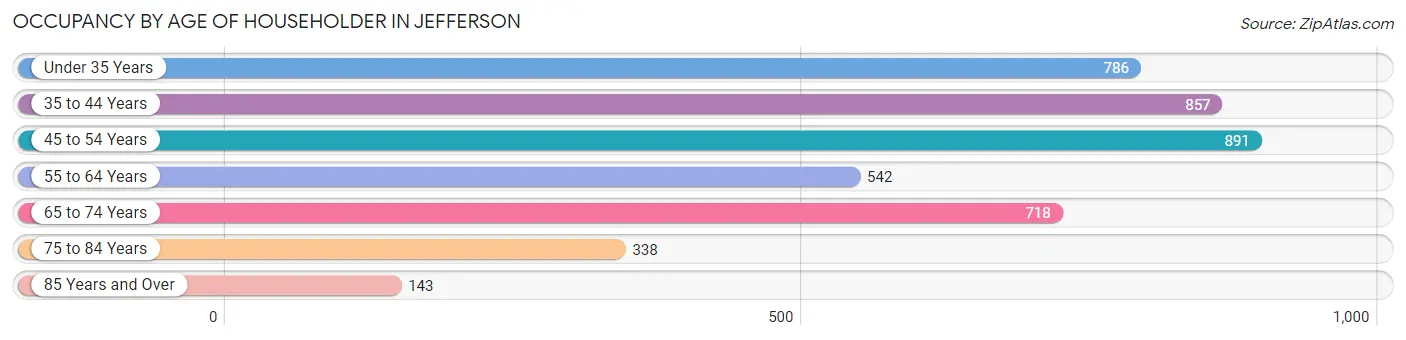
| Age Bracket | # Households | % Households |
| Under 35 Years | 786 | 18.4% |
| 35 to 44 Years | 857 | 20.1% |
| 45 to 54 Years | 891 | 20.8% |
| 55 to 64 Years | 542 | 12.7% |
| 65 to 74 Years | 718 | 16.8% |
| 75 to 84 Years | 338 | 7.9% |
| 85 Years and Over | 143 | 3.4% |
| Total | 4,275 | 100.0% |
Housing Finances in Jefferson
Median Income by Occupancy in Jefferson
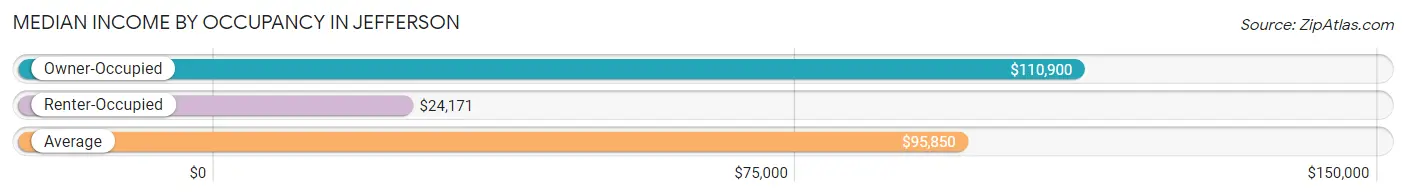
| Occupancy Type | # Households | Median Income |
| Owner-Occupied | 3,424 (80.1%) | $110,900 |
| Renter-Occupied | 851 (19.9%) | $24,171 |
| Average | 4,275 (100.0%) | $95,850 |
Occupancy by Householder Income Bracket in Jefferson
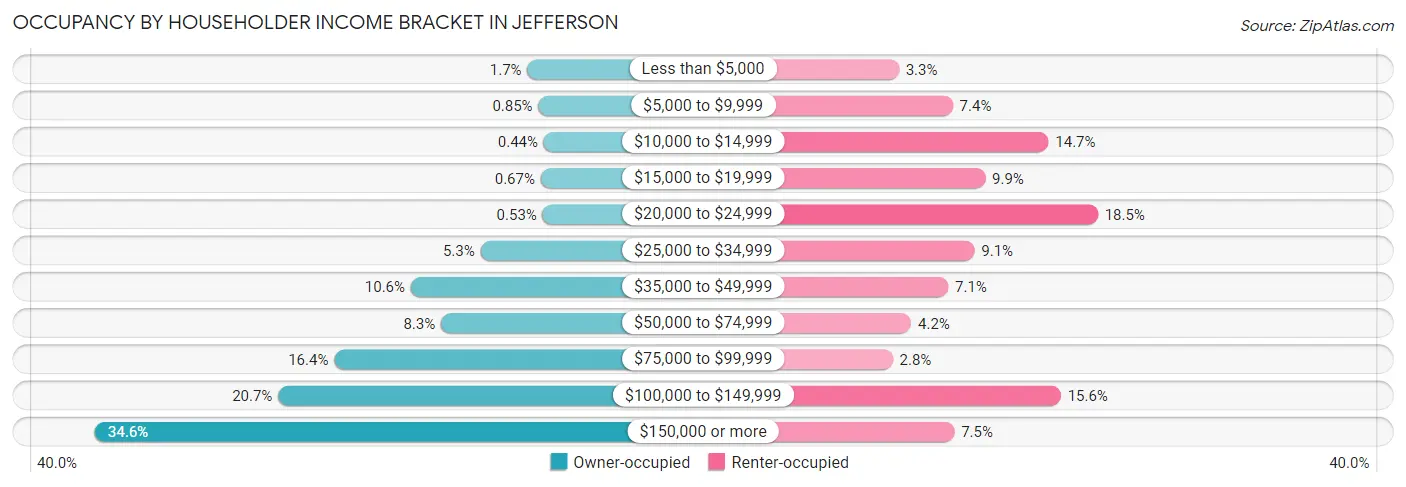
| Income Bracket | Owner-occupied | Renter-occupied |
| Less than $5,000 | 58 (1.7%) | 28 (3.3%) |
| $5,000 to $9,999 | 29 (0.9%) | 63 (7.4%) |
| $10,000 to $14,999 | 15 (0.4%) | 125 (14.7%) |
| $15,000 to $19,999 | 23 (0.7%) | 84 (9.9%) |
| $20,000 to $24,999 | 18 (0.5%) | 157 (18.4%) |
| $25,000 to $34,999 | 180 (5.3%) | 77 (9.0%) |
| $35,000 to $49,999 | 362 (10.6%) | 60 (7.0%) |
| $50,000 to $74,999 | 283 (8.3%) | 36 (4.2%) |
| $75,000 to $99,999 | 562 (16.4%) | 24 (2.8%) |
| $100,000 to $149,999 | 708 (20.7%) | 133 (15.6%) |
| $150,000 or more | 1,186 (34.6%) | 64 (7.5%) |
| Total | 3,424 (100.0%) | 851 (100.0%) |
Monthly Housing Cost Tiers in Jefferson
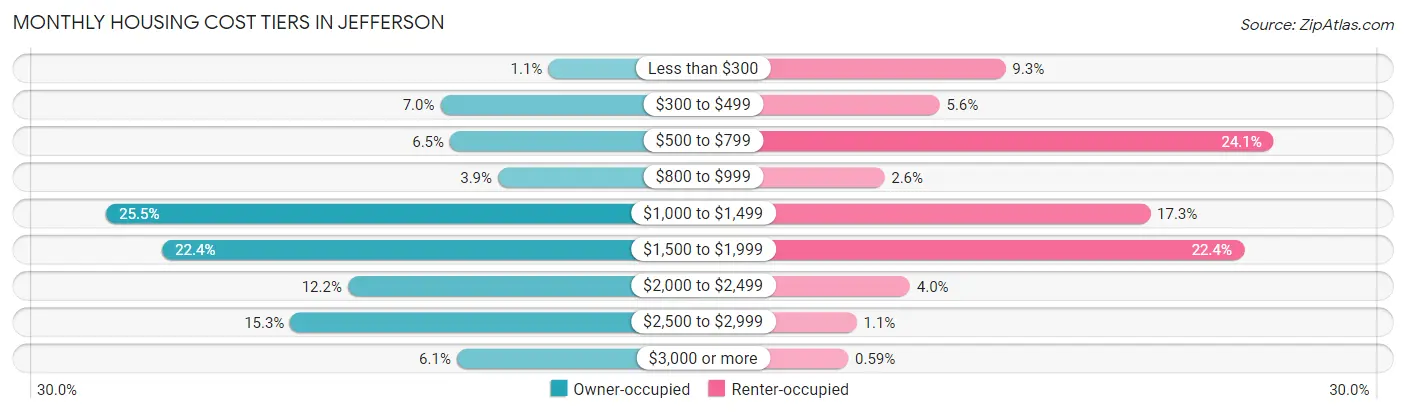
| Monthly Cost | Owner-occupied | Renter-occupied |
| Less than $300 | 37 (1.1%) | 79 (9.3%) |
| $300 to $499 | 241 (7.0%) | 48 (5.6%) |
| $500 to $799 | 223 (6.5%) | 205 (24.1%) |
| $800 to $999 | 132 (3.9%) | 22 (2.6%) |
| $1,000 to $1,499 | 873 (25.5%) | 147 (17.3%) |
| $1,500 to $1,999 | 767 (22.4%) | 191 (22.4%) |
| $2,000 to $2,499 | 416 (12.1%) | 34 (4.0%) |
| $2,500 to $2,999 | 525 (15.3%) | 9 (1.1%) |
| $3,000 or more | 210 (6.1%) | 5 (0.6%) |
| Total | 3,424 (100.0%) | 851 (100.0%) |
Physical Housing Characteristics in Jefferson
Housing Structures in Jefferson
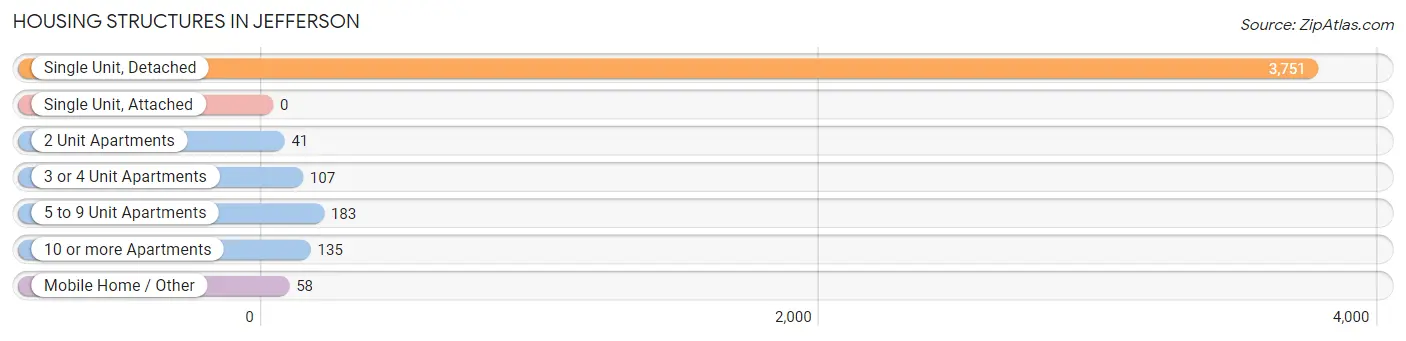
| Structure Type | # Housing Units | % Housing Units |
| Single Unit, Detached | 3,751 | 87.7% |
| Single Unit, Attached | 0 | 0.0% |
| 2 Unit Apartments | 41 | 1.0% |
| 3 or 4 Unit Apartments | 107 | 2.5% |
| 5 to 9 Unit Apartments | 183 | 4.3% |
| 10 or more Apartments | 135 | 3.2% |
| Mobile Home / Other | 58 | 1.4% |
| Total | 4,275 | 100.0% |
Housing Structures by Occupancy in Jefferson
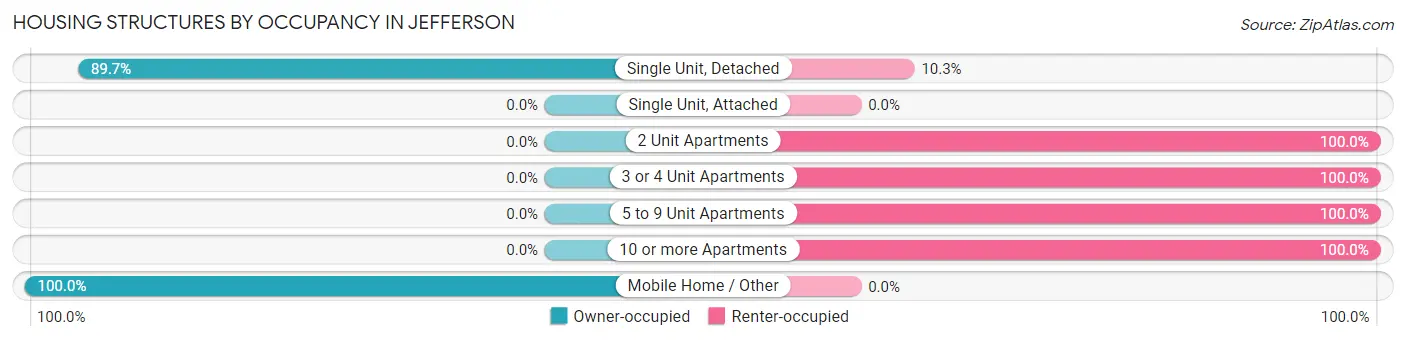
| Structure Type | Owner-occupied | Renter-occupied |
| Single Unit, Detached | 3,366 (89.7%) | 385 (10.3%) |
| Single Unit, Attached | 0 (0.0%) | 0 (0.0%) |
| 2 Unit Apartments | 0 (0.0%) | 41 (100.0%) |
| 3 or 4 Unit Apartments | 0 (0.0%) | 107 (100.0%) |
| 5 to 9 Unit Apartments | 0 (0.0%) | 183 (100.0%) |
| 10 or more Apartments | 0 (0.0%) | 135 (100.0%) |
| Mobile Home / Other | 58 (100.0%) | 0 (0.0%) |
| Total | 3,424 (80.1%) | 851 (19.9%) |
Housing Structures by Number of Rooms in Jefferson
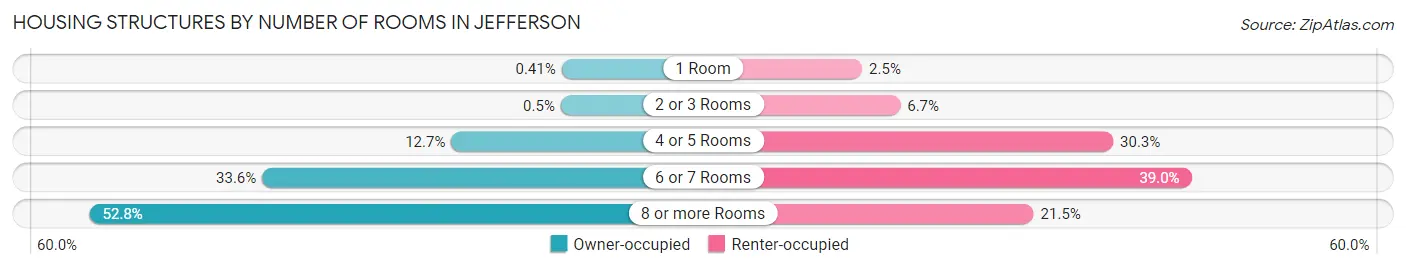
| Number of Rooms | Owner-occupied | Renter-occupied |
| 1 Room | 14 (0.4%) | 21 (2.5%) |
| 2 or 3 Rooms | 17 (0.5%) | 57 (6.7%) |
| 4 or 5 Rooms | 433 (12.7%) | 258 (30.3%) |
| 6 or 7 Rooms | 1,152 (33.6%) | 332 (39.0%) |
| 8 or more Rooms | 1,808 (52.8%) | 183 (21.5%) |
| Total | 3,424 (100.0%) | 851 (100.0%) |
Housing Structure by Heating Type in Jefferson
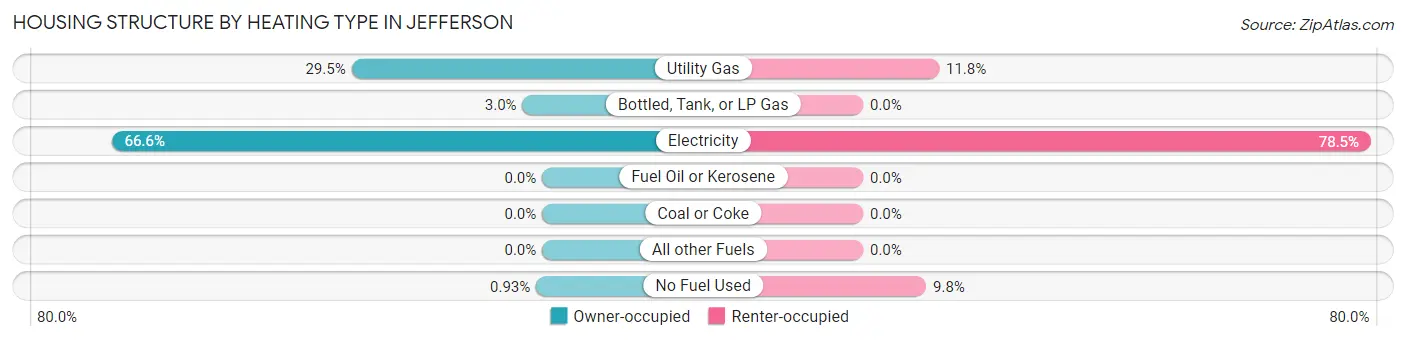
| Heating Type | Owner-occupied | Renter-occupied |
| Utility Gas | 1,009 (29.5%) | 100 (11.7%) |
| Bottled, Tank, or LP Gas | 104 (3.0%) | 0 (0.0%) |
| Electricity | 2,279 (66.6%) | 668 (78.5%) |
| Fuel Oil or Kerosene | 0 (0.0%) | 0 (0.0%) |
| Coal or Coke | 0 (0.0%) | 0 (0.0%) |
| All other Fuels | 0 (0.0%) | 0 (0.0%) |
| No Fuel Used | 32 (0.9%) | 83 (9.8%) |
| Total | 3,424 (100.0%) | 851 (100.0%) |
Household Vehicle Usage in Jefferson
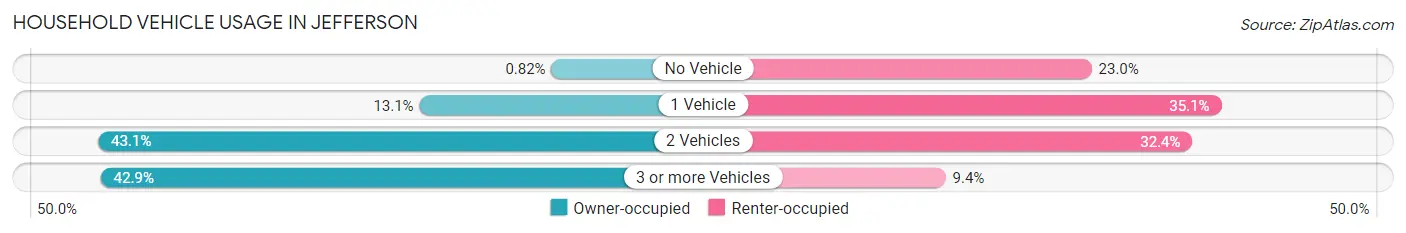
| Vehicles per Household | Owner-occupied | Renter-occupied |
| No Vehicle | 28 (0.8%) | 196 (23.0%) |
| 1 Vehicle | 450 (13.1%) | 299 (35.1%) |
| 2 Vehicles | 1,477 (43.1%) | 276 (32.4%) |
| 3 or more Vehicles | 1,469 (42.9%) | 80 (9.4%) |
| Total | 3,424 (100.0%) | 851 (100.0%) |
Real Estate & Mortgages in Jefferson
Real Estate and Mortgage Overview in Jefferson
| Characteristic | Without Mortgage | With Mortgage |
| Housing Units | 581 | 2,843 |
| Median Property Value | $266,800 | $322,100 |
| Median Household Income | $80,634 | $1,045 |
| Monthly Housing Costs | $534 | $210 |
| Real Estate Taxes | $2,403 | $15 |
Property Value by Mortgage Status in Jefferson
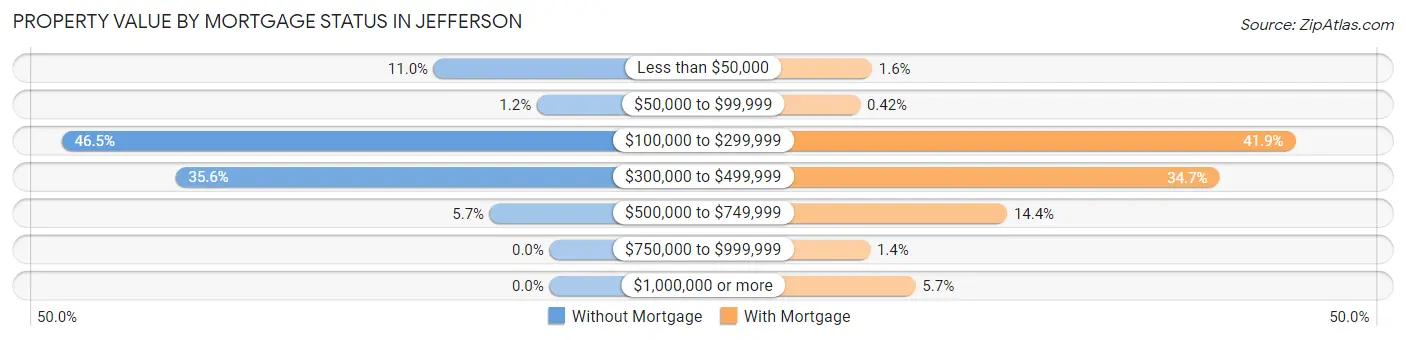
| Property Value | Without Mortgage | With Mortgage |
| Less than $50,000 | 64 (11.0%) | 44 (1.5%) |
| $50,000 to $99,999 | 7 (1.2%) | 12 (0.4%) |
| $100,000 to $299,999 | 270 (46.5%) | 1,191 (41.9%) |
| $300,000 to $499,999 | 207 (35.6%) | 985 (34.6%) |
| $500,000 to $749,999 | 33 (5.7%) | 410 (14.4%) |
| $750,000 to $999,999 | 0 (0.0%) | 39 (1.4%) |
| $1,000,000 or more | 0 (0.0%) | 162 (5.7%) |
| Total | 581 (100.0%) | 2,843 (100.0%) |
Household Income by Mortgage Status in Jefferson
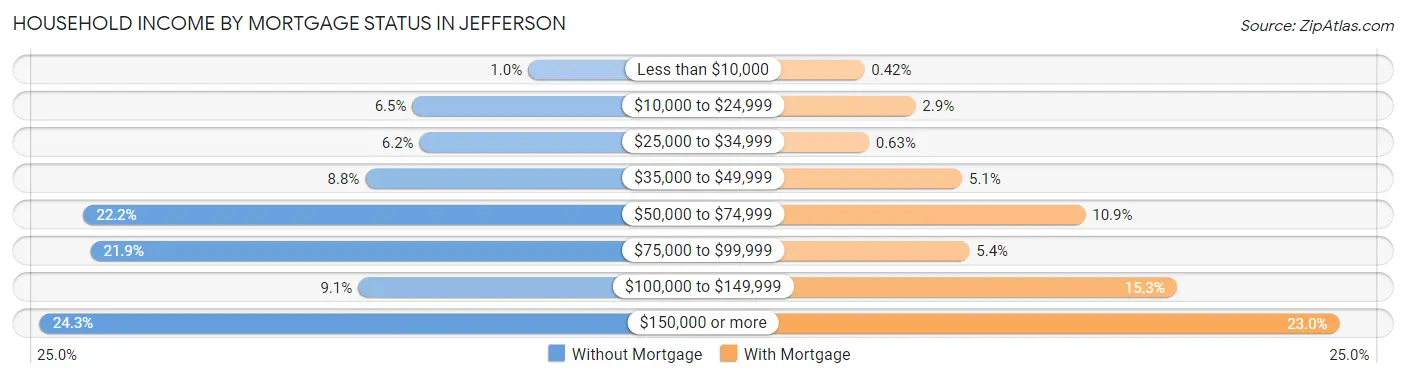
| Household Income | Without Mortgage | With Mortgage |
| Less than $10,000 | 6 (1.0%) | 12 (0.4%) |
| $10,000 to $24,999 | 38 (6.5%) | 81 (2.9%) |
| $25,000 to $34,999 | 36 (6.2%) | 18 (0.6%) |
| $35,000 to $49,999 | 51 (8.8%) | 144 (5.1%) |
| $50,000 to $74,999 | 129 (22.2%) | 311 (10.9%) |
| $75,000 to $99,999 | 127 (21.9%) | 154 (5.4%) |
| $100,000 to $149,999 | 53 (9.1%) | 435 (15.3%) |
| $150,000 or more | 141 (24.3%) | 655 (23.0%) |
| Total | 581 (100.0%) | 2,843 (100.0%) |
Property Value to Household Income Ratio in Jefferson
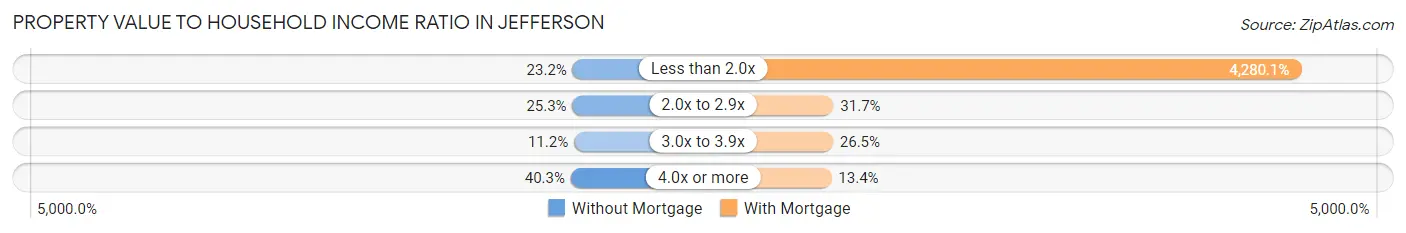
| Value-to-Income Ratio | Without Mortgage | With Mortgage |
| Less than 2.0x | 135 (23.2%) | 121,683 (4,280.1%) |
| 2.0x to 2.9x | 147 (25.3%) | 901 (31.7%) |
| 3.0x to 3.9x | 65 (11.2%) | 753 (26.5%) |
| 4.0x or more | 234 (40.3%) | 380 (13.4%) |
| Total | 581 (100.0%) | 2,843 (100.0%) |
Real Estate Taxes by Mortgage Status in Jefferson
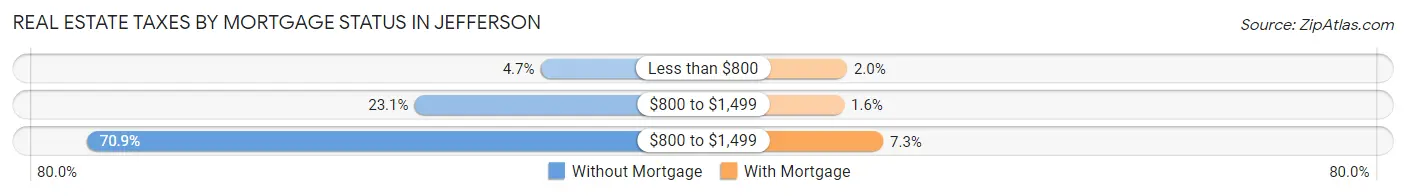
| Property Taxes | Without Mortgage | With Mortgage |
| Less than $800 | 27 (4.6%) | 58 (2.0%) |
| $800 to $1,499 | 134 (23.1%) | 46 (1.6%) |
| $800 to $1,499 | 412 (70.9%) | 208 (7.3%) |
| Total | 581 (100.0%) | 2,843 (100.0%) |
Health & Disability in Jefferson
Health Insurance Coverage by Age in Jefferson
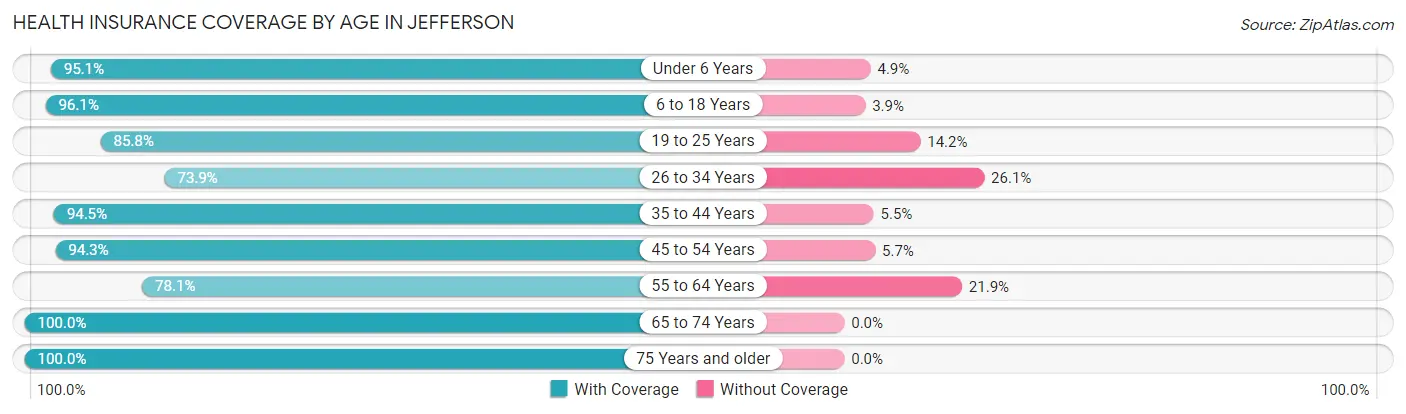
| Age Bracket | With Coverage | Without Coverage |
| Under 6 Years | 1,011 (95.1%) | 52 (4.9%) |
| 6 to 18 Years | 2,812 (96.1%) | 114 (3.9%) |
| 19 to 25 Years | 824 (85.8%) | 136 (14.2%) |
| 26 to 34 Years | 1,576 (73.9%) | 556 (26.1%) |
| 35 to 44 Years | 1,889 (94.5%) | 109 (5.5%) |
| 45 to 54 Years | 1,559 (94.3%) | 95 (5.7%) |
| 55 to 64 Years | 826 (78.1%) | 232 (21.9%) |
| 65 to 74 Years | 1,019 (100.0%) | 0 (0.0%) |
| 75 Years and older | 676 (100.0%) | 0 (0.0%) |
| Total | 12,192 (90.4%) | 1,294 (9.6%) |
Health Insurance Coverage by Citizenship Status in Jefferson
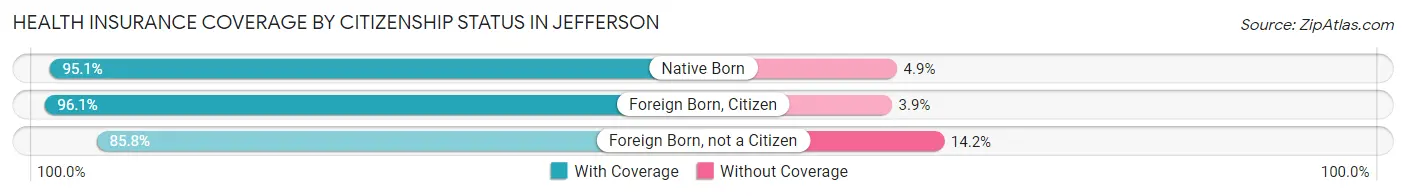
| Citizenship Status | With Coverage | Without Coverage |
| Native Born | 1,011 (95.1%) | 52 (4.9%) |
| Foreign Born, Citizen | 2,812 (96.1%) | 114 (3.9%) |
| Foreign Born, not a Citizen | 824 (85.8%) | 136 (14.2%) |
Health Insurance Coverage by Household Income in Jefferson
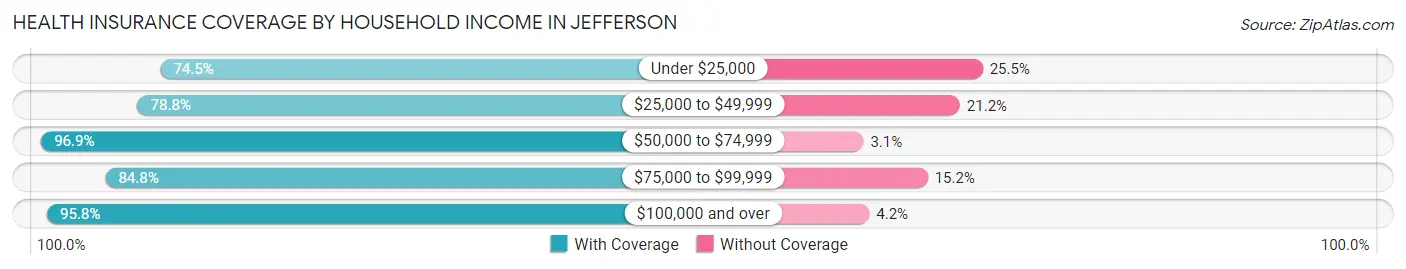
| Household Income | With Coverage | Without Coverage |
| Under $25,000 | 981 (74.5%) | 335 (25.5%) |
| $25,000 to $49,999 | 1,127 (78.8%) | 303 (21.2%) |
| $50,000 to $74,999 | 870 (96.9%) | 28 (3.1%) |
| $75,000 to $99,999 | 1,645 (84.8%) | 294 (15.2%) |
| $100,000 and over | 7,569 (95.8%) | 334 (4.2%) |
Public vs Private Health Insurance Coverage by Age in Jefferson
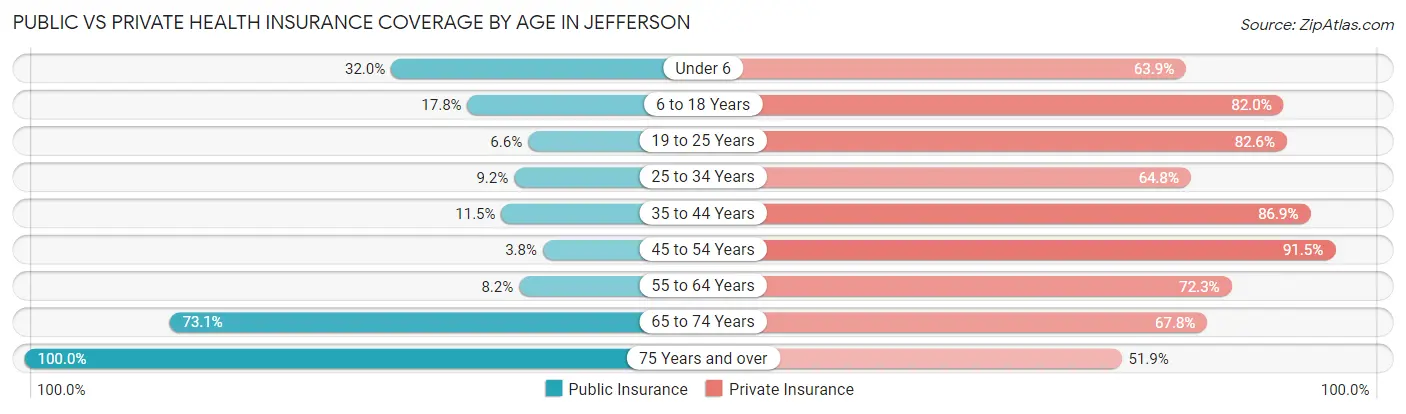
| Age Bracket | Public Insurance | Private Insurance |
| Under 6 | 340 (32.0%) | 679 (63.9%) |
| 6 to 18 Years | 521 (17.8%) | 2,399 (82.0%) |
| 19 to 25 Years | 63 (6.6%) | 793 (82.6%) |
| 25 to 34 Years | 195 (9.1%) | 1,381 (64.8%) |
| 35 to 44 Years | 230 (11.5%) | 1,737 (86.9%) |
| 45 to 54 Years | 63 (3.8%) | 1,514 (91.5%) |
| 55 to 64 Years | 87 (8.2%) | 765 (72.3%) |
| 65 to 74 Years | 745 (73.1%) | 691 (67.8%) |
| 75 Years and over | 676 (100.0%) | 351 (51.9%) |
| Total | 2,920 (21.6%) | 10,310 (76.4%) |
Disability Status by Sex by Age in Jefferson
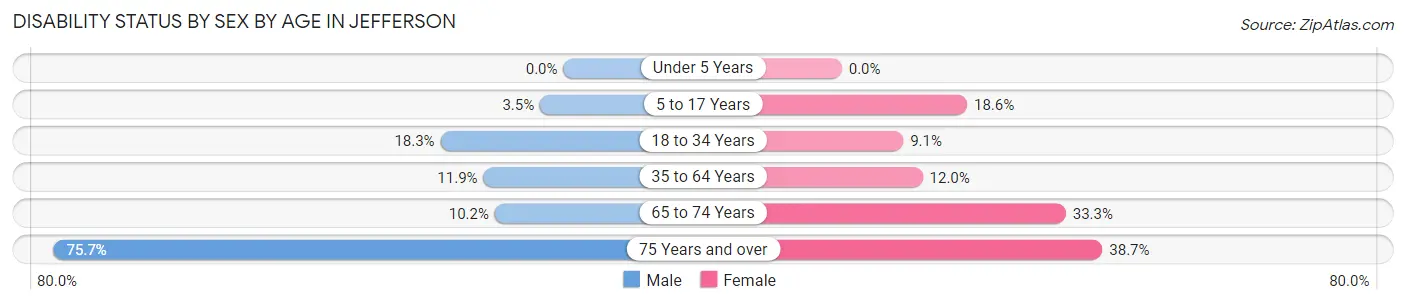
| Age Bracket | Male | Female |
| Under 5 Years | 0 (0.0%) | 0 (0.0%) |
| 5 to 17 Years | 53 (3.5%) | 266 (18.6%) |
| 18 to 34 Years | 358 (18.2%) | 114 (9.1%) |
| 35 to 64 Years | 292 (11.9%) | 270 (12.0%) |
| 65 to 74 Years | 56 (10.2%) | 156 (33.3%) |
| 75 Years and over | 187 (75.7%) | 166 (38.7%) |
Disability Class by Sex by Age in Jefferson
Disability Class: Hearing Difficulty
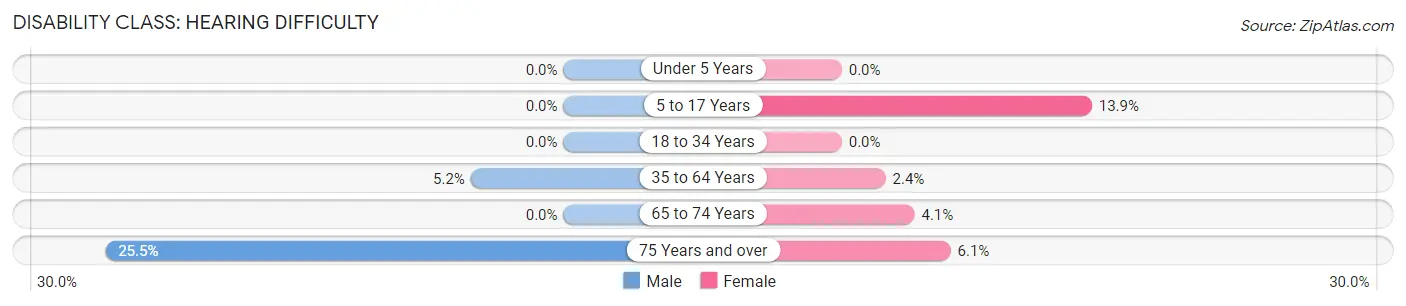
| Age Bracket | Male | Female |
| Under 5 Years | 0 (0.0%) | 0 (0.0%) |
| 5 to 17 Years | 0 (0.0%) | 199 (13.9%) |
| 18 to 34 Years | 0 (0.0%) | 0 (0.0%) |
| 35 to 64 Years | 127 (5.2%) | 55 (2.4%) |
| 65 to 74 Years | 0 (0.0%) | 19 (4.1%) |
| 75 Years and over | 63 (25.5%) | 26 (6.1%) |
Disability Class: Vision Difficulty
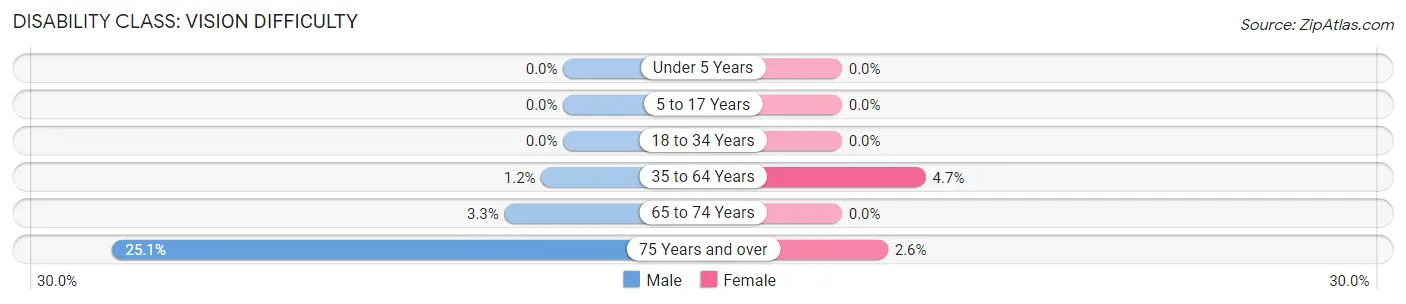
| Age Bracket | Male | Female |
| Under 5 Years | 0 (0.0%) | 0 (0.0%) |
| 5 to 17 Years | 0 (0.0%) | 0 (0.0%) |
| 18 to 34 Years | 0 (0.0%) | 0 (0.0%) |
| 35 to 64 Years | 30 (1.2%) | 105 (4.7%) |
| 65 to 74 Years | 18 (3.3%) | 0 (0.0%) |
| 75 Years and over | 62 (25.1%) | 11 (2.6%) |
Disability Class: Cognitive Difficulty
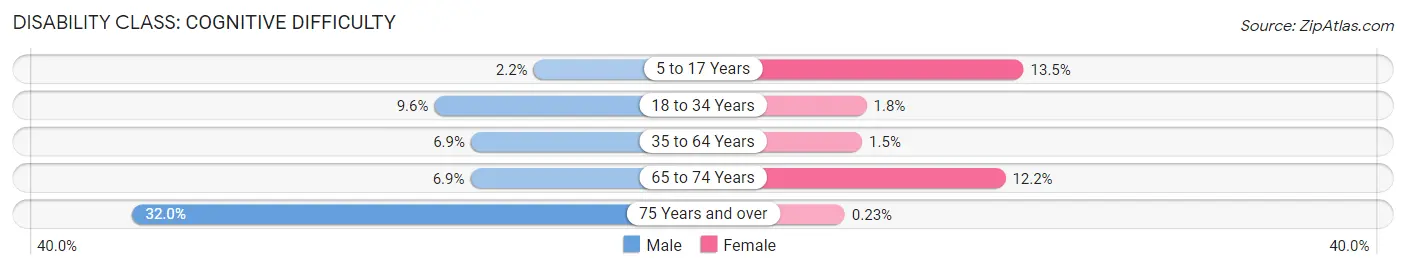
| Age Bracket | Male | Female |
| 5 to 17 Years | 34 (2.2%) | 193 (13.5%) |
| 18 to 34 Years | 188 (9.6%) | 23 (1.8%) |
| 35 to 64 Years | 169 (6.9%) | 34 (1.5%) |
| 65 to 74 Years | 38 (6.9%) | 57 (12.1%) |
| 75 Years and over | 79 (32.0%) | 1 (0.2%) |
Disability Class: Ambulatory Difficulty
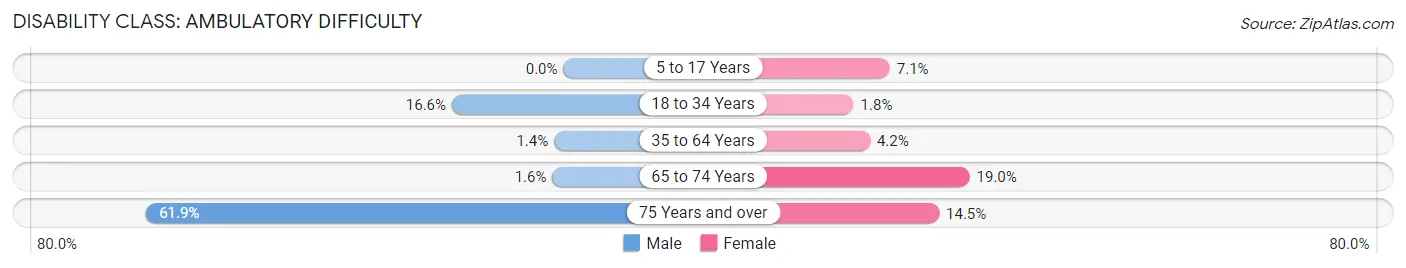
| Age Bracket | Male | Female |
| 5 to 17 Years | 0 (0.0%) | 102 (7.1%) |
| 18 to 34 Years | 325 (16.6%) | 22 (1.8%) |
| 35 to 64 Years | 34 (1.4%) | 94 (4.2%) |
| 65 to 74 Years | 9 (1.6%) | 89 (19.0%) |
| 75 Years and over | 153 (61.9%) | 62 (14.4%) |
Disability Class: Self-Care Difficulty
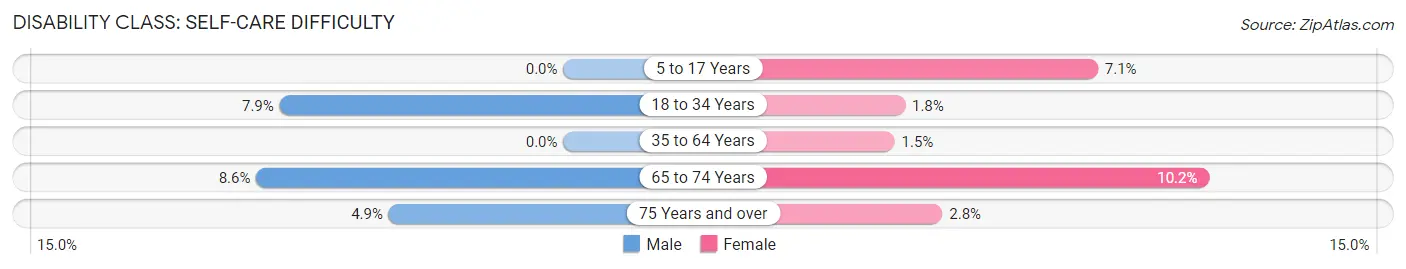
| Age Bracket | Male | Female |
| 5 to 17 Years | 0 (0.0%) | 102 (7.1%) |
| 18 to 34 Years | 155 (7.9%) | 22 (1.8%) |
| 35 to 64 Years | 0 (0.0%) | 33 (1.5%) |
| 65 to 74 Years | 47 (8.6%) | 48 (10.2%) |
| 75 Years and over | 12 (4.9%) | 12 (2.8%) |
Technology Access in Jefferson
Computing Device Access in Jefferson
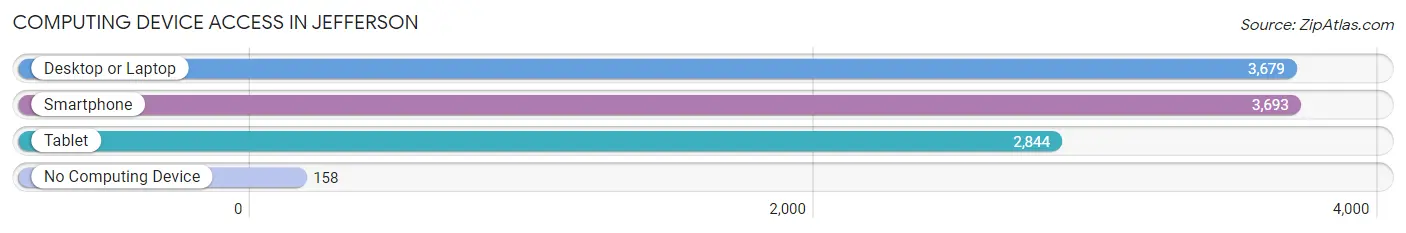
| Device Type | # Households | % Households |
| Desktop or Laptop | 3,679 | 86.1% |
| Smartphone | 3,693 | 86.4% |
| Tablet | 2,844 | 66.5% |
| No Computing Device | 158 | 3.7% |
| Total | 4,275 | 100.0% |
Internet Access in Jefferson
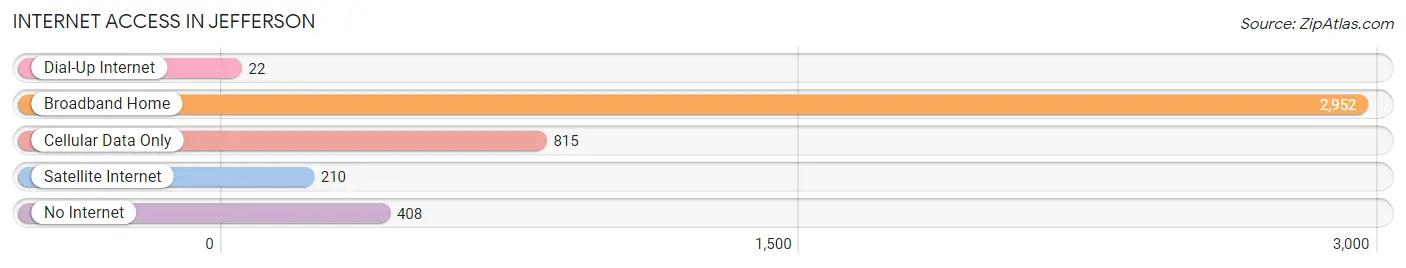
| Internet Type | # Households | % Households |
| Dial-Up Internet | 22 | 0.5% |
| Broadband Home | 2,952 | 69.1% |
| Cellular Data Only | 815 | 19.1% |
| Satellite Internet | 210 | 4.9% |
| No Internet | 408 | 9.5% |
| Total | 4,275 | 100.0% |
Jefferson Summary
Jefferson, Georgia is a city located in Jackson County, Georgia, United States. It is part of the Atlanta metropolitan area and is located about 50 miles northeast of downtown Atlanta. The population of Jefferson was 9,432 at the 2010 census, up from 6,817 at the 2000 census.
History
The area that is now Jefferson was first settled in the early 1800s by settlers from North Carolina and Virginia. The city was originally known as "Leathersville" after the Leathers family, who were among the first settlers. The city was renamed Jefferson in 1806 in honor of Thomas Jefferson, the third President of the United States.
In 1809, the city was incorporated as the Town of Jefferson. The city grew rapidly in the 19th century, becoming a center for cotton production and processing. The city was also home to several manufacturing plants, including a cotton mill, a grist mill, and a sawmill.
In the late 19th century, Jefferson was a popular destination for tourists, who came to enjoy the city's natural beauty and its many recreational activities. The city was also home to several resorts, including the Jefferson Hotel, which was built in 1891 and was one of the most popular resorts in the area.
Geography
Jefferson is located in Jackson County, Georgia, at the intersection of US Highway 129 and Georgia State Route 11. The city is located about 50 miles northeast of downtown Atlanta. The city is situated in the foothills of the Blue Ridge Mountains and is surrounded by rolling hills and forests.
The city has a total area of 8.3 square miles, of which 8.2 square miles is land and 0.1 square miles is water. The city is located in the Piedmont region of Georgia and is part of the Upper Oconee River watershed.
Economy
Jefferson's economy is largely based on agriculture and manufacturing. The city is home to several large agricultural operations, including poultry farms, cattle farms, and vegetable farms. The city is also home to several manufacturing plants, including a cotton mill, a grist mill, and a sawmill.
The city is also home to several retail stores, restaurants, and other businesses. The city is home to several large employers, including the Jackson County Board of Education, the Jackson County Hospital, and the Jackson County Sheriff's Office.
Demographics
As of the 2010 census, there were 9,432 people, 3,717 households, and 2,541 families residing in the city. The population density was 1,145.2 people per square mile. The racial makeup of the city was 79.2% White, 16.2% African American, 0.3% Native American, 0.7% Asian, 0.1% Pacific Islander, 1.7% from other races, and 1.8% from two or more races. Hispanic or Latino of any race were 4.2% of the population.
The median income for a household in the city was $37,917, and the median income for a family was $45,917. The per capita income for the city was $19,917. About 16.2% of families and 19.2% of the population were below the poverty line, including 28.2% of those under age 18 and 11.2% of those age 65 or over.
Common Questions
What is Per Capita Income in Jefferson?
Per Capita income in Jefferson is $38,867.
What is the Median Family Income in Jefferson?
Median Family Income in Jefferson is $118,795.
What is the Median Household income in Jefferson?
Median Household Income in Jefferson is $95,850.
What is Income or Wage Gap in Jefferson?
Income or Wage Gap in Jefferson is 23.8%.
Women in Jefferson earn 76.2 cents for every dollar earned by a man.
What is Inequality or Gini Index in Jefferson?
Inequality or Gini Index in Jefferson is 0.44.
What is the Total Population of Jefferson?
Total Population of Jefferson is 13,496.
What is the Total Male Population of Jefferson?
Total Male Population of Jefferson is 7,360.
What is the Total Female Population of Jefferson?
Total Female Population of Jefferson is 6,136.
What is the Ratio of Males per 100 Females in Jefferson?
There are 119.95 Males per 100 Females in Jefferson.
What is the Ratio of Females per 100 Males in Jefferson?
There are 83.37 Females per 100 Males in Jefferson.
What is the Median Population Age in Jefferson?
Median Population Age in Jefferson is 34.1 Years.
What is the Average Family Size in Jefferson
Average Family Size in Jefferson is 3.6 People.
What is the Average Household Size in Jefferson
Average Household Size in Jefferson is 3.1 People.
How Large is the Labor Force in Jefferson?
There are 6,876 People in the Labor Forcein in Jefferson.
What is the Percentage of People in the Labor Force in Jefferson?
67.9% of People are in the Labor Force in Jefferson.
What is the Unemployment Rate in Jefferson?
Unemployment Rate in Jefferson is 2.1%.