Pooler, GA Map & Demographics
Pooler Map
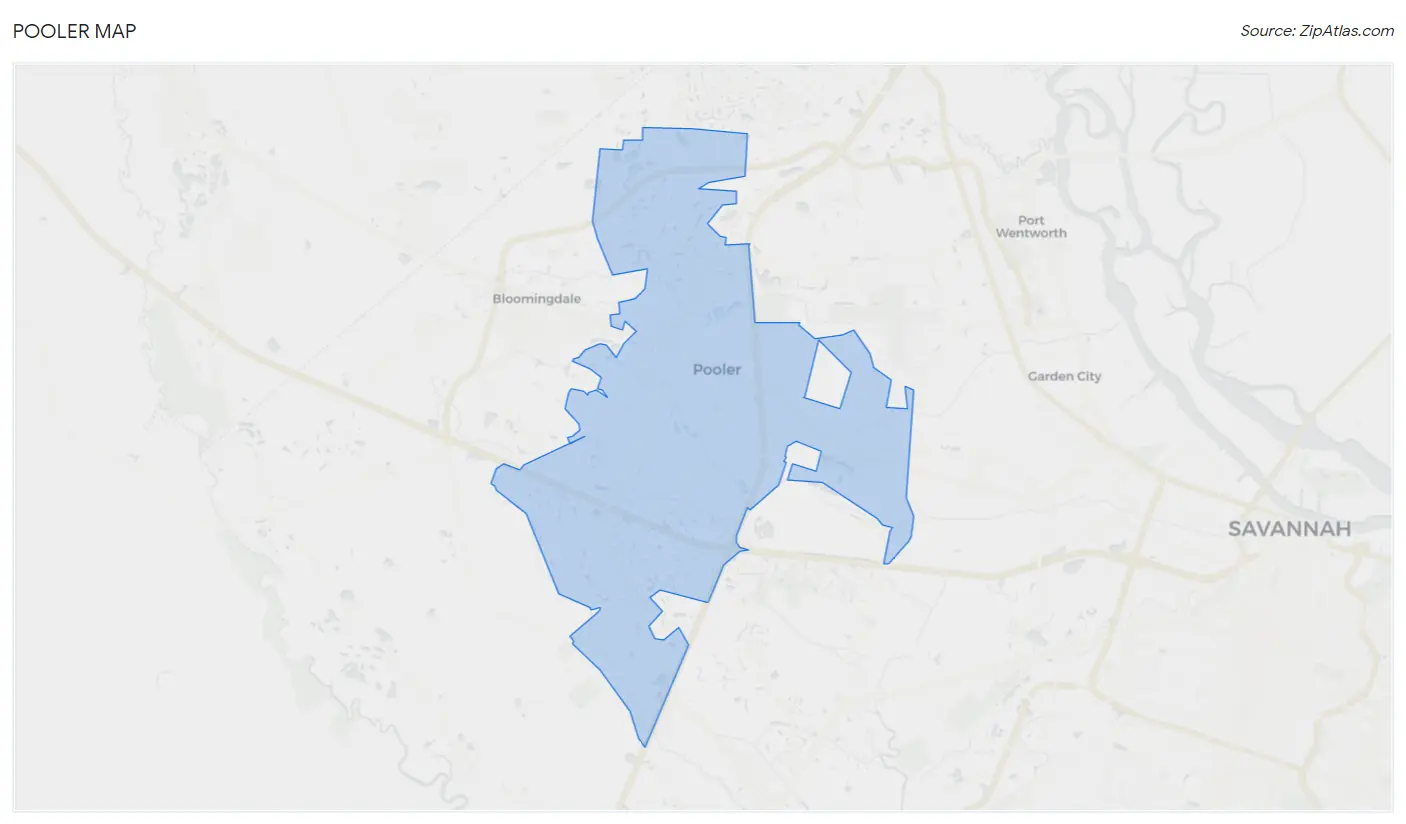
Pooler Overview
$42,438
PER CAPITA INCOME
$110,908
AVG FAMILY INCOME
$89,812
AVG HOUSEHOLD INCOME
6.2%
WAGE / INCOME GAP [ % ]
93.8¢/ $1
WAGE / INCOME GAP [ $ ]
0.35
INEQUALITY / GINI INDEX
26,264
TOTAL POPULATION
13,420
MALE POPULATION
12,844
FEMALE POPULATION
104.48
MALES / 100 FEMALES
95.71
FEMALES / 100 MALES
39.2
MEDIAN AGE
3.0
AVG FAMILY SIZE
2.4
AVG HOUSEHOLD SIZE
15,906
LABOR FORCE [ PEOPLE ]
74.7%
PERCENT IN LABOR FORCE
5.4%
UNEMPLOYMENT RATE
Pooler Zip Codes
Pooler Area Codes
Income in Pooler
Income Overview in Pooler
Per Capita Income in Pooler is $42,438, while median incomes of families and households are $110,908 and $89,812 respectively.
| Characteristic | Number | Measure |
| Per Capita Income | 26,264 | $42,438 |
| Median Family Income | 6,657 | $110,908 |
| Mean Family Income | 6,657 | $118,941 |
| Median Household Income | 10,752 | $89,812 |
| Mean Household Income | 10,752 | $104,066 |
| Income Deficit | 6,657 | $0 |
| Wage / Income Gap (%) | 26,264 | 6.17% |
| Wage / Income Gap ($) | 26,264 | 93.83¢ per $1 |
| Gini / Inequality Index | 26,264 | 0.35 |
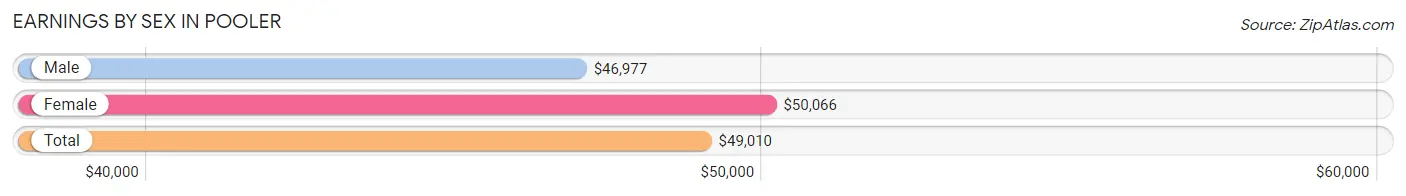
Earnings by Sex in Pooler
Average Earnings in Pooler are $49,010, $46,977 for men and $50,066 for women, a difference of 6.2%.
| Sex | Number | Average Earnings |
| Male | 8,591 (52.9%) | $46,977 |
| Female | 7,648 (47.1%) | $50,066 |
| Total | 16,239 (100.0%) | $49,010 |
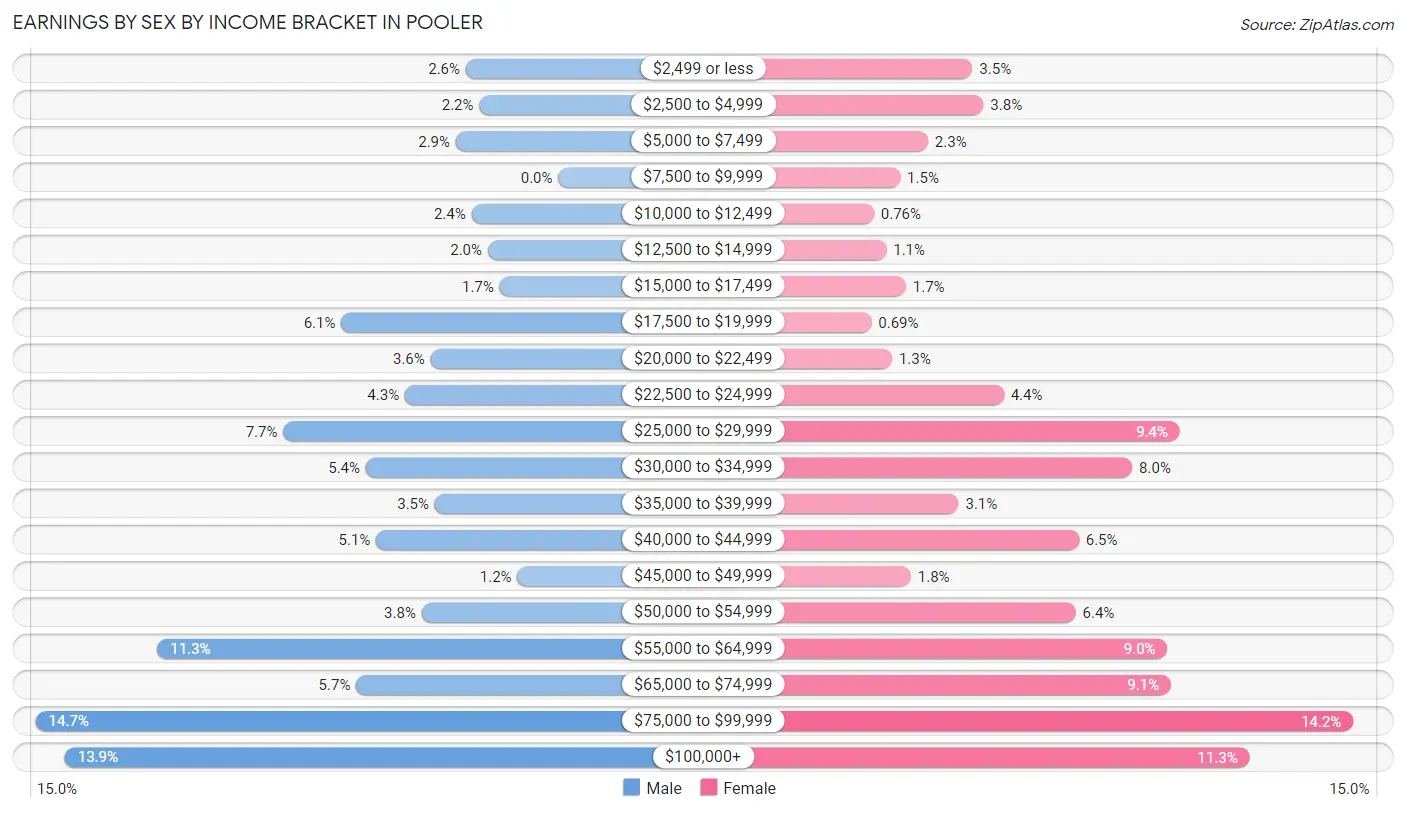
Earnings by Sex by Income Bracket in Pooler
The most common earnings brackets in Pooler are $75,000 to $99,999 for men (1,262 | 14.7%) and $75,000 to $99,999 for women (1,088 | 14.2%).
| Income | Male | Female |
| $2,499 or less | 223 (2.6%) | 270 (3.5%) |
| $2,500 to $4,999 | 191 (2.2%) | 294 (3.8%) |
| $5,000 to $7,499 | 247 (2.9%) | 174 (2.3%) |
| $7,500 to $9,999 | 0 (0.0%) | 115 (1.5%) |
| $10,000 to $12,499 | 210 (2.4%) | 58 (0.8%) |
| $12,500 to $14,999 | 170 (2.0%) | 85 (1.1%) |
| $15,000 to $17,499 | 142 (1.7%) | 127 (1.7%) |
| $17,500 to $19,999 | 524 (6.1%) | 53 (0.7%) |
| $20,000 to $22,499 | 308 (3.6%) | 97 (1.3%) |
| $22,500 to $24,999 | 370 (4.3%) | 337 (4.4%) |
| $25,000 to $29,999 | 664 (7.7%) | 716 (9.4%) |
| $30,000 to $34,999 | 465 (5.4%) | 613 (8.0%) |
| $35,000 to $39,999 | 298 (3.5%) | 240 (3.1%) |
| $40,000 to $44,999 | 440 (5.1%) | 499 (6.5%) |
| $45,000 to $49,999 | 99 (1.1%) | 138 (1.8%) |
| $50,000 to $54,999 | 330 (3.8%) | 492 (6.4%) |
| $55,000 to $64,999 | 968 (11.3%) | 689 (9.0%) |
| $65,000 to $74,999 | 488 (5.7%) | 697 (9.1%) |
| $75,000 to $99,999 | 1,262 (14.7%) | 1,088 (14.2%) |
| $100,000+ | 1,192 (13.9%) | 866 (11.3%) |
| Total | 8,591 (100.0%) | 7,648 (100.0%) |
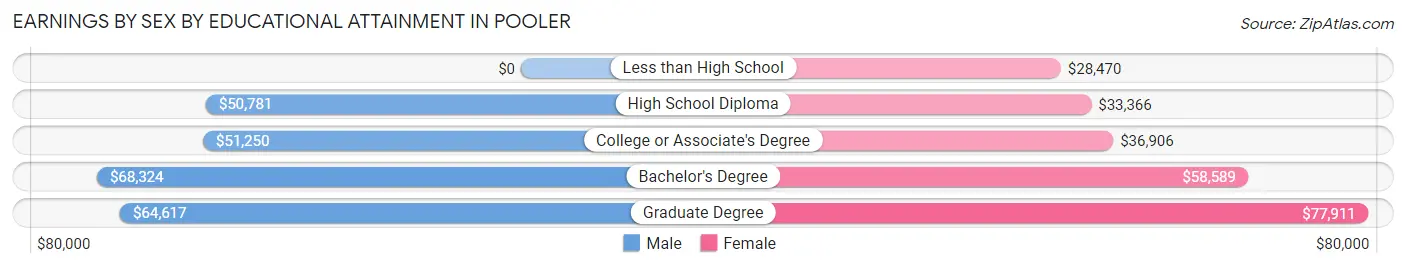
Earnings by Sex by Educational Attainment in Pooler
Average earnings in Pooler are $53,122 for men and $54,993 for women, a difference of 3.4%. Men with an educational attainment of bachelor's degree enjoy the highest average annual earnings of $68,324, while those with high school diploma education earn the least with $50,781. Women with an educational attainment of graduate degree earn the most with the average annual earnings of $77,911, while those with less than high school education have the smallest earnings of $28,470.
| Educational Attainment | Male Income | Female Income |
| Less than High School | - | - |
| High School Diploma | $50,781 | $33,366 |
| College or Associate's Degree | $51,250 | $36,906 |
| Bachelor's Degree | $68,324 | $58,589 |
| Graduate Degree | $64,617 | $77,911 |
| Total | $53,122 | $54,993 |
Family Income in Pooler
Family Income Brackets in Pooler
According to the Pooler family income data, there are 2,137 families falling into the $100,000 to $149,999 income range, which is the most common income bracket and makes up 32.1% of all families. Conversely, the $10,000 to $14,999 income bracket is the least frequent group with only 33 families (0.5%) belonging to this category.
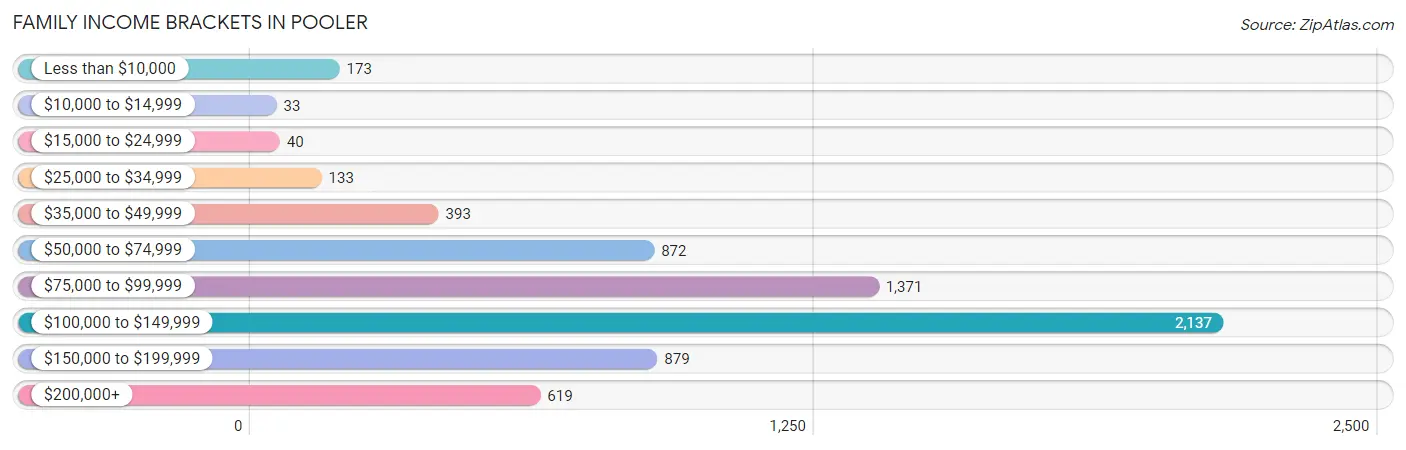
| Income Bracket | # Families | % Families |
| Less than $10,000 | 173 | 2.6% |
| $10,000 to $14,999 | 33 | 0.5% |
| $15,000 to $24,999 | 40 | 0.6% |
| $25,000 to $34,999 | 133 | 2.0% |
| $35,000 to $49,999 | 393 | 5.9% |
| $50,000 to $74,999 | 872 | 13.1% |
| $75,000 to $99,999 | 1,371 | 20.6% |
| $100,000 to $149,999 | 2,137 | 32.1% |
| $150,000 to $199,999 | 879 | 13.2% |
| $200,000+ | 619 | 9.3% |
Family Income by Famaliy Size in Pooler
4-person families (1,614 | 24.2%) account for the highest median family income in Pooler with $135,745 per family, while 2-person families (3,600 | 54.1%) have the highest median income of $49,084 per family member.
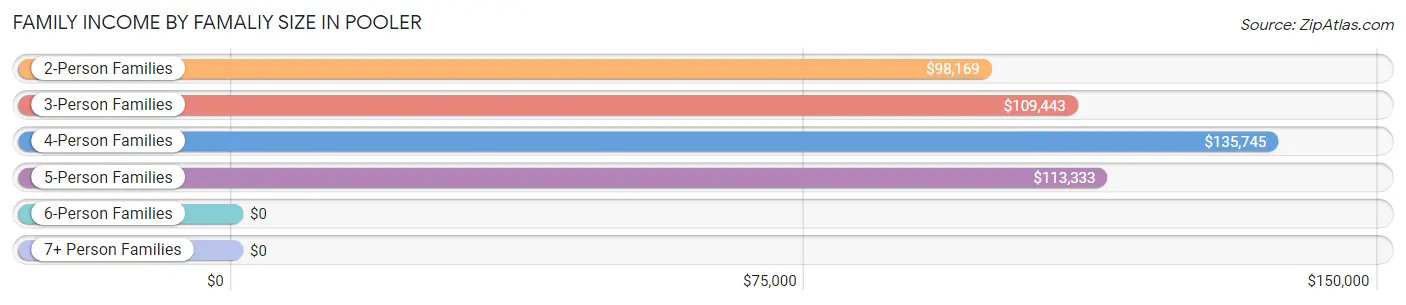
| Income Bracket | # Families | Median Income |
| 2-Person Families | 3,600 (54.1%) | $98,169 |
| 3-Person Families | 1,033 (15.5%) | $109,443 |
| 4-Person Families | 1,614 (24.2%) | $135,745 |
| 5-Person Families | 272 (4.1%) | $113,333 |
| 6-Person Families | 24 (0.4%) | $0 |
| 7+ Person Families | 114 (1.7%) | $0 |
| Total | 6,657 (100.0%) | $110,908 |
Family Income by Number of Earners in Pooler
The median family income in Pooler is $110,908, with families comprising 3+ earners (665) having the highest median family income of $151,382, while families with no earners (716) have the lowest median family income of $65,864, accounting for 10.0% and 10.8% of families, respectively.
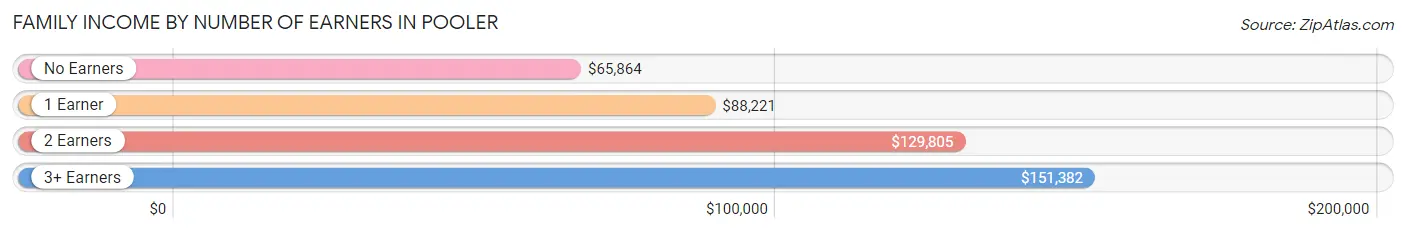
| Number of Earners | # Families | Median Income |
| No Earners | 716 (10.8%) | $65,864 |
| 1 Earner | 1,822 (27.4%) | $88,221 |
| 2 Earners | 3,454 (51.9%) | $129,805 |
| 3+ Earners | 665 (10.0%) | $151,382 |
| Total | 6,657 (100.0%) | $110,908 |
Household Income in Pooler
Household Income Brackets in Pooler
With 2,882 households falling in the category, the $100,000 to $149,999 income range is the most frequent in Pooler, accounting for 26.8% of all households. In contrast, only 108 households (1.0%) fall into the $10,000 to $14,999 income bracket, making it the least populous group.
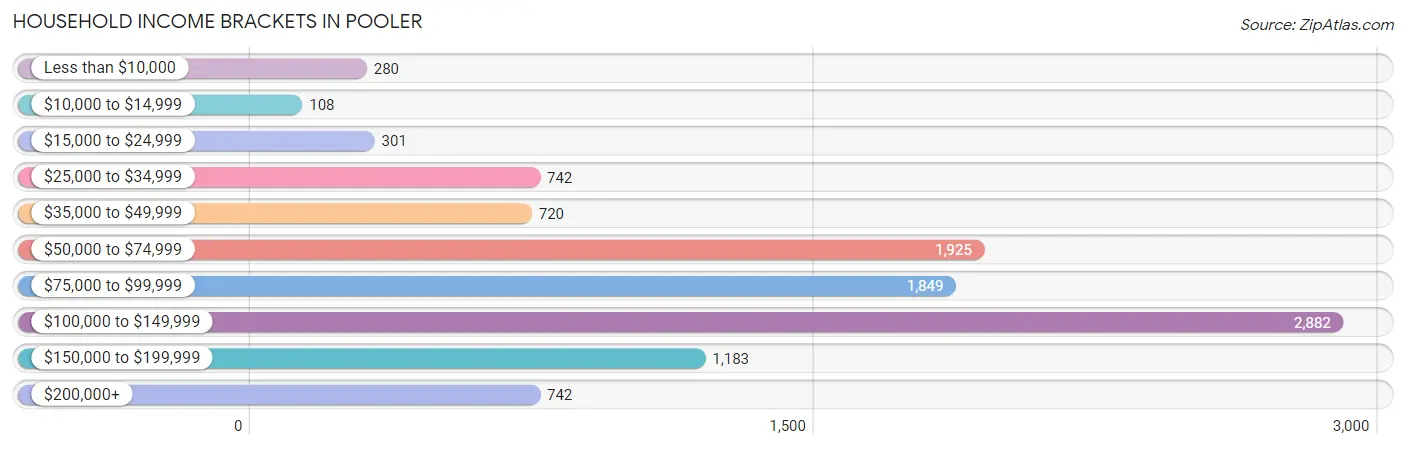
| Income Bracket | # Households | % Households |
| Less than $10,000 | 280 | 2.6% |
| $10,000 to $14,999 | 108 | 1.0% |
| $15,000 to $24,999 | 301 | 2.8% |
| $25,000 to $34,999 | 742 | 6.9% |
| $35,000 to $49,999 | 720 | 6.7% |
| $50,000 to $74,999 | 1,925 | 17.9% |
| $75,000 to $99,999 | 1,849 | 17.2% |
| $100,000 to $149,999 | 2,882 | 26.8% |
| $150,000 to $199,999 | 1,183 | 11.0% |
| $200,000+ | 742 | 6.9% |
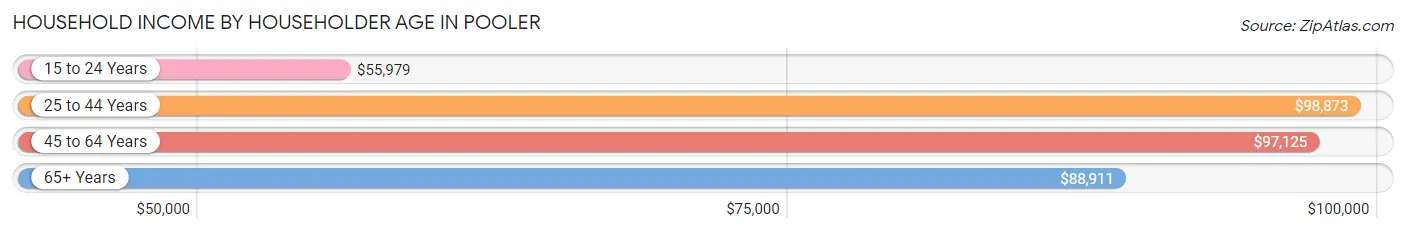
Household Income by Householder Age in Pooler
The median household income in Pooler is $89,812, with the highest median household income of $98,873 found in the 25 to 44 years age bracket for the primary householder. A total of 4,007 households (37.3%) fall into this category. Meanwhile, the 15 to 24 years age bracket for the primary householder has the lowest median household income of $55,979, with 438 households (4.1%) in this group.
| Income Bracket | # Households | Median Income |
| 15 to 24 Years | 438 (4.1%) | $55,979 |
| 25 to 44 Years | 4,007 (37.3%) | $98,873 |
| 45 to 64 Years | 4,219 (39.2%) | $97,125 |
| 65+ Years | 2,088 (19.4%) | $88,911 |
| Total | 10,752 (100.0%) | $89,812 |
Poverty in Pooler
Income Below Poverty by Sex and Age in Pooler
With 6.4% poverty level for males and 3.3% for females among the residents of Pooler, 15 year old males and 18 to 24 year old females are the most vulnerable to poverty, with 56 males (30.8%) and 85 females (10.4%) in their respective age groups living below the poverty level.
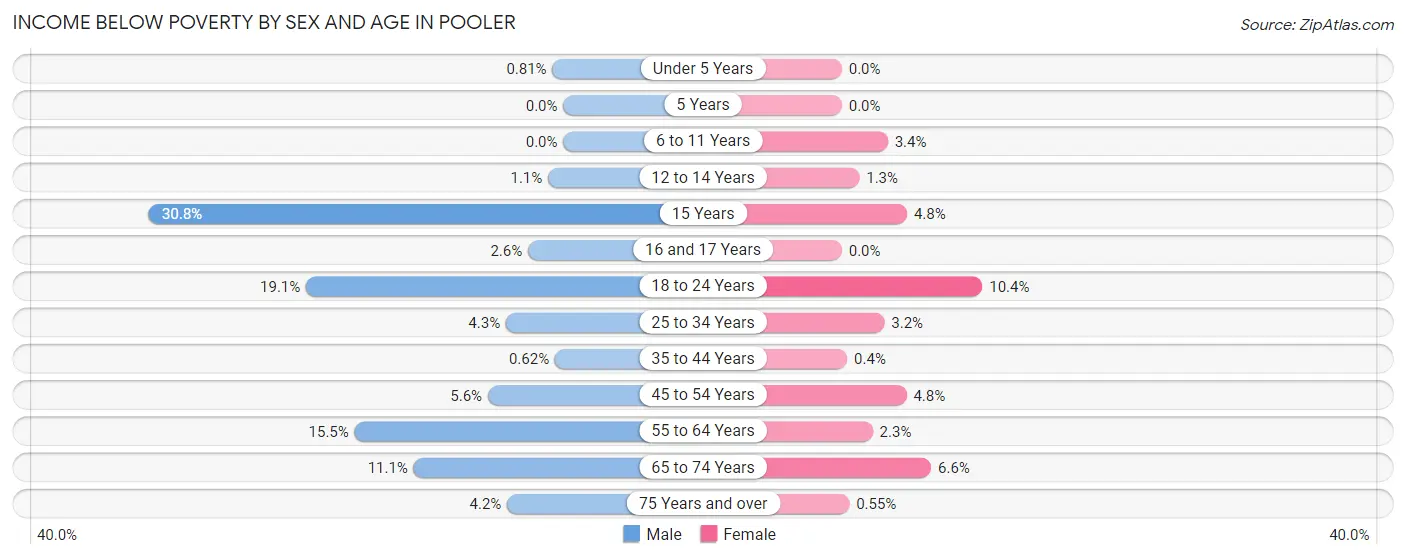
| Age Bracket | Male | Female |
| Under 5 Years | 5 (0.8%) | 0 (0.0%) |
| 5 Years | 0 (0.0%) | 0 (0.0%) |
| 6 to 11 Years | 0 (0.0%) | 17 (3.4%) |
| 12 to 14 Years | 9 (1.1%) | 10 (1.3%) |
| 15 Years | 56 (30.8%) | 3 (4.8%) |
| 16 and 17 Years | 6 (2.6%) | 0 (0.0%) |
| 18 to 24 Years | 182 (19.1%) | 85 (10.4%) |
| 25 to 34 Years | 96 (4.3%) | 62 (3.2%) |
| 35 to 44 Years | 12 (0.6%) | 8 (0.4%) |
| 45 to 54 Years | 129 (5.6%) | 108 (4.8%) |
| 55 to 64 Years | 212 (15.5%) | 29 (2.3%) |
| 65 to 74 Years | 133 (11.1%) | 94 (6.6%) |
| 75 Years and over | 17 (4.2%) | 2 (0.5%) |
| Total | 857 (6.4%) | 418 (3.3%) |
Income Above Poverty by Sex and Age in Pooler
According to the poverty statistics in Pooler, males aged 5 years and females aged under 5 years are the age groups that are most secure financially, with 100.0% of males and 100.0% of females in these age groups living above the poverty line.
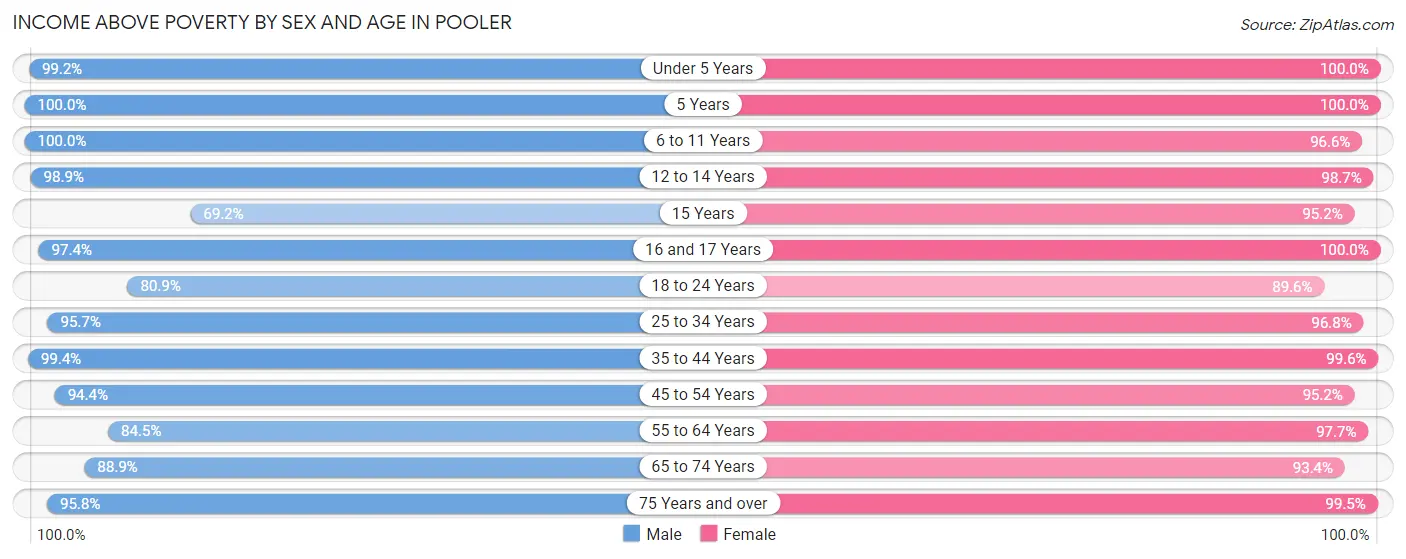
| Age Bracket | Male | Female |
| Under 5 Years | 613 (99.2%) | 632 (100.0%) |
| 5 Years | 131 (100.0%) | 207 (100.0%) |
| 6 to 11 Years | 984 (100.0%) | 481 (96.6%) |
| 12 to 14 Years | 788 (98.9%) | 760 (98.7%) |
| 15 Years | 126 (69.2%) | 59 (95.2%) |
| 16 and 17 Years | 223 (97.4%) | 447 (100.0%) |
| 18 to 24 Years | 771 (80.9%) | 730 (89.6%) |
| 25 to 34 Years | 2,157 (95.7%) | 1,899 (96.8%) |
| 35 to 44 Years | 1,933 (99.4%) | 2,012 (99.6%) |
| 45 to 54 Years | 2,176 (94.4%) | 2,140 (95.2%) |
| 55 to 64 Years | 1,156 (84.5%) | 1,239 (97.7%) |
| 65 to 74 Years | 1,064 (88.9%) | 1,323 (93.4%) |
| 75 Years and over | 391 (95.8%) | 363 (99.5%) |
| Total | 12,513 (93.6%) | 12,292 (96.7%) |
Income Below Poverty Among Married-Couple Families in Pooler
The poverty statistics for married-couple families in Pooler show that 4.1% or 219 of the total 5,405 families live below the poverty line. Families with no children have the highest poverty rate of 5.4%, comprising of 180 families. On the other hand, families with 3 or 4 children have the lowest poverty rate of 0.0%, which includes 0 families.
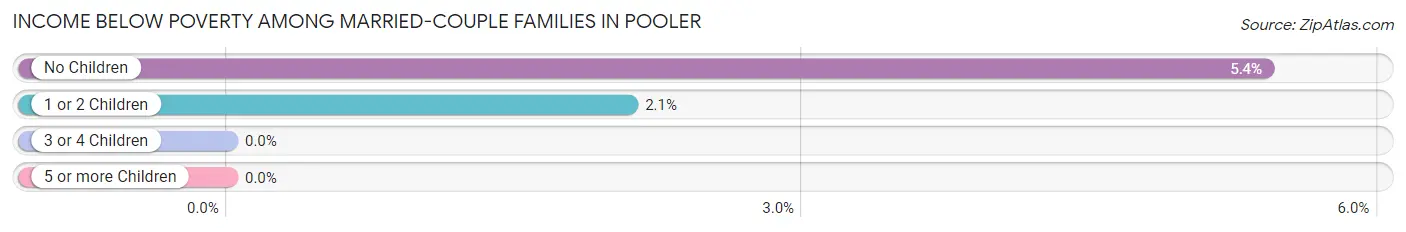
| Children | Above Poverty | Below Poverty |
| No Children | 3,149 (94.6%) | 180 (5.4%) |
| 1 or 2 Children | 1,829 (97.9%) | 39 (2.1%) |
| 3 or 4 Children | 137 (100.0%) | 0 (0.0%) |
| 5 or more Children | 71 (100.0%) | 0 (0.0%) |
| Total | 5,186 (96.0%) | 219 (4.1%) |
Income Below Poverty Among Single-Parent Households in Pooler
According to the poverty data in Pooler, 7.4% or 21 single-father households and 0.9% or 9 single-mother households are living below the poverty line. Among single-father households, those with 3 or 4 children have the highest poverty rate, with 5 households (100.0%) experiencing poverty. Likewise, among single-mother households, those with 1 or 2 children have the highest poverty rate, with 9 households (1.3%) falling below the poverty line.
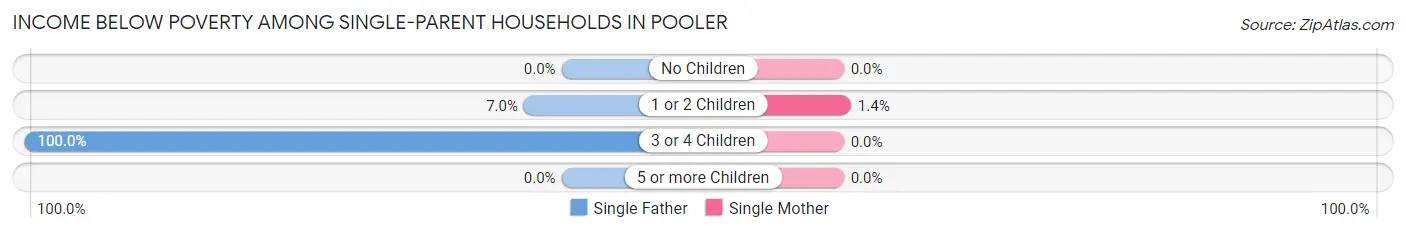
| Children | Single Father | Single Mother |
| No Children | 0 (0.0%) | 0 (0.0%) |
| 1 or 2 Children | 16 (7.0%) | 9 (1.3%) |
| 3 or 4 Children | 5 (100.0%) | 0 (0.0%) |
| 5 or more Children | 0 (0.0%) | 0 (0.0%) |
| Total | 21 (7.4%) | 9 (0.9%) |
Income Below Poverty Among Married-Couple vs Single-Parent Households in Pooler
The poverty data for Pooler shows that 219 of the married-couple family households (4.1%) and 30 of the single-parent households (2.4%) are living below the poverty level. Within the married-couple family households, those with no children have the highest poverty rate, with 180 households (5.4%) falling below the poverty line. Among the single-parent households, those with 3 or 4 children have the highest poverty rate, with 5 household (10.4%) living below poverty.
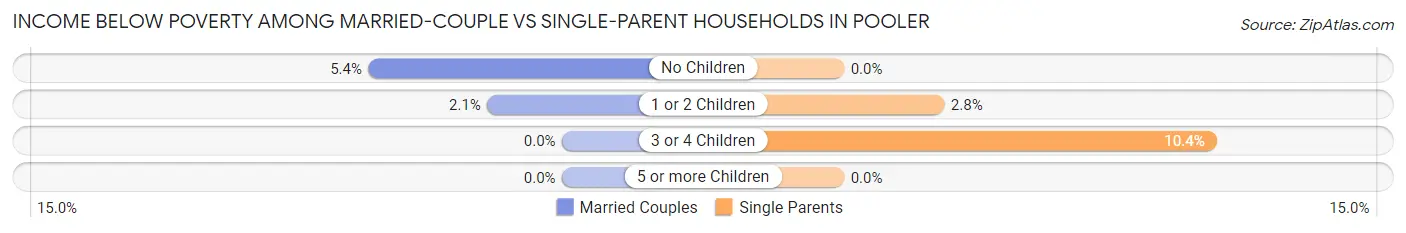
| Children | Married-Couple Families | Single-Parent Households |
| No Children | 180 (5.4%) | 0 (0.0%) |
| 1 or 2 Children | 39 (2.1%) | 25 (2.8%) |
| 3 or 4 Children | 0 (0.0%) | 5 (10.4%) |
| 5 or more Children | 0 (0.0%) | 0 (0.0%) |
| Total | 219 (4.1%) | 30 (2.4%) |
Race in Pooler
The most populous races in Pooler are White / Caucasian (15,154 | 57.7%), Black / African American (7,951 | 30.3%), and Two or more Races (1,820 | 6.9%).
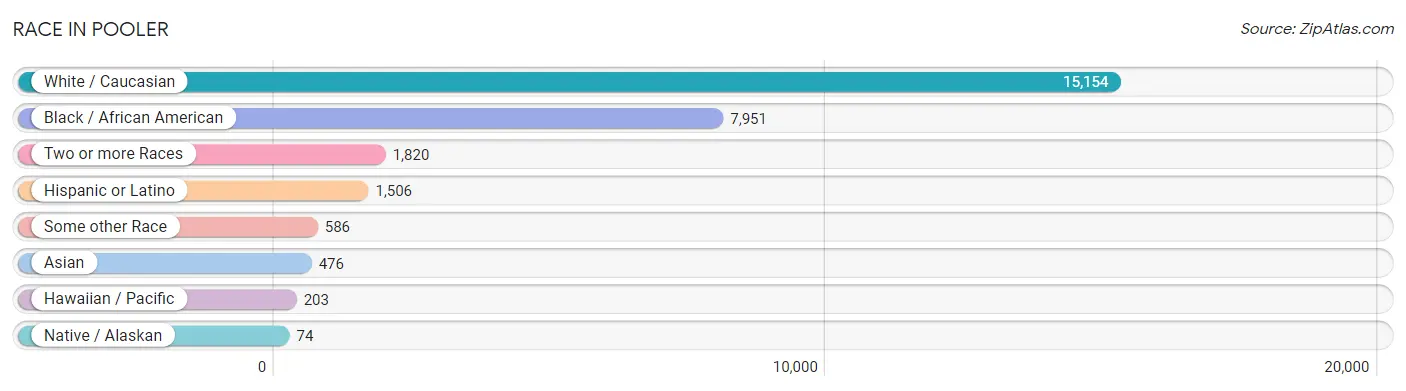
| Race | # Population | % Population |
| Asian | 476 | 1.8% |
| Black / African American | 7,951 | 30.3% |
| Hawaiian / Pacific | 203 | 0.8% |
| Hispanic or Latino | 1,506 | 5.7% |
| Native / Alaskan | 74 | 0.3% |
| White / Caucasian | 15,154 | 57.7% |
| Two or more Races | 1,820 | 6.9% |
| Some other Race | 586 | 2.2% |
| Total | 26,264 | 100.0% |
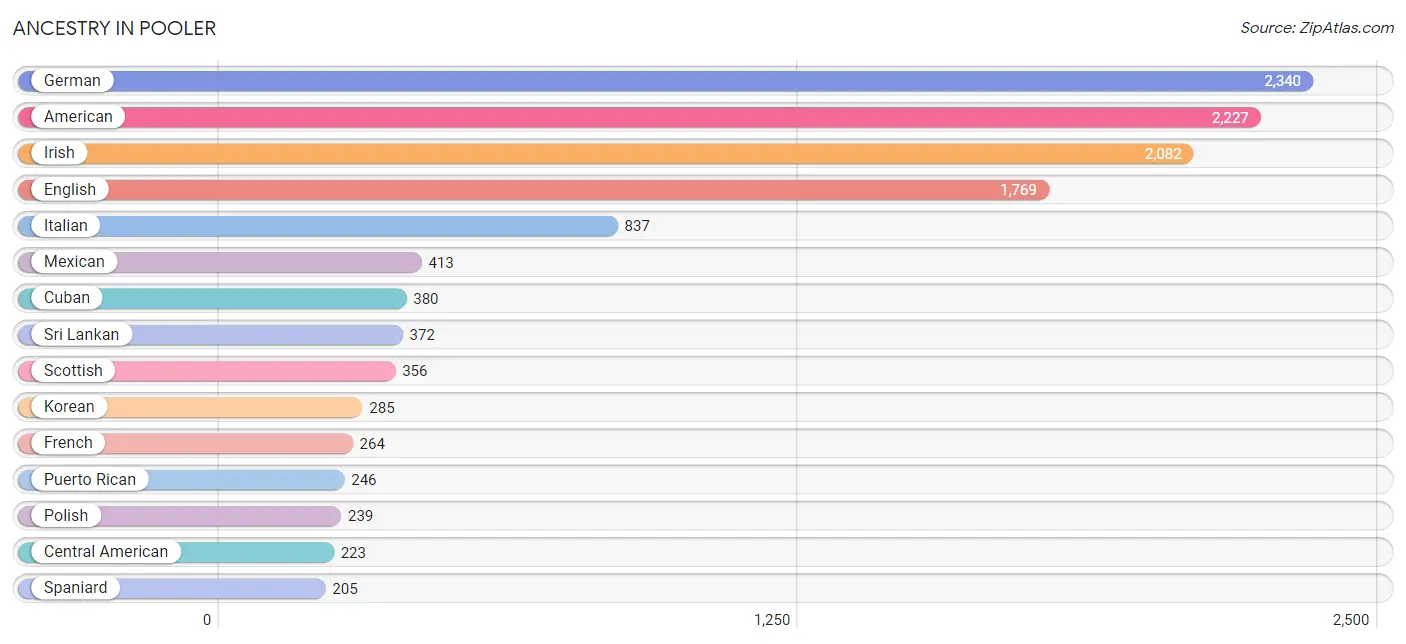
Ancestry in Pooler
The most populous ancestries reported in Pooler are German (2,340 | 8.9%), American (2,227 | 8.5%), Irish (2,082 | 7.9%), English (1,769 | 6.7%), and Italian (837 | 3.2%), together accounting for 35.2% of all Pooler residents.
| Ancestry | # Population | % Population |
| African | 112 | 0.4% |
| American | 2,227 | 8.5% |
| Apache | 10 | 0.0% |
| Arab | 41 | 0.2% |
| Austrian | 11 | 0.0% |
| Barbadian | 52 | 0.2% |
| Belizean | 160 | 0.6% |
| Bhutanese | 19 | 0.1% |
| Brazilian | 29 | 0.1% |
| British | 139 | 0.5% |
| British West Indian | 44 | 0.2% |
| Cajun | 16 | 0.1% |
| Canadian | 141 | 0.5% |
| Central American | 223 | 0.9% |
| Cherokee | 99 | 0.4% |
| Chippewa | 61 | 0.2% |
| Choctaw | 2 | 0.0% |
| Costa Rican | 5 | 0.0% |
| Cuban | 380 | 1.5% |
| Czech | 16 | 0.1% |
| Czechoslovakian | 31 | 0.1% |
| Danish | 6 | 0.0% |
| Dutch | 199 | 0.8% |
| Eastern European | 9 | 0.0% |
| English | 1,769 | 6.7% |
| European | 188 | 0.7% |
| French | 264 | 1.0% |
| French Canadian | 132 | 0.5% |
| German | 2,340 | 8.9% |
| Greek | 17 | 0.1% |
| Guatemalan | 39 | 0.2% |
| Guyanese | 118 | 0.4% |
| Haitian | 81 | 0.3% |
| Hungarian | 74 | 0.3% |
| Iranian | 61 | 0.2% |
| Irish | 2,082 | 7.9% |
| Italian | 837 | 3.2% |
| Jamaican | 162 | 0.6% |
| Korean | 285 | 1.1% |
| Latvian | 13 | 0.1% |
| Lithuanian | 188 | 0.7% |
| Malaysian | 24 | 0.1% |
| Mexican | 413 | 1.6% |
| Nicaraguan | 55 | 0.2% |
| Nigerian | 52 | 0.2% |
| Norwegian | 27 | 0.1% |
| Panamanian | 124 | 0.5% |
| Peruvian | 1 | 0.0% |
| Polish | 239 | 0.9% |
| Portuguese | 10 | 0.0% |
| Puerto Rican | 246 | 0.9% |
| Romanian | 51 | 0.2% |
| Russian | 175 | 0.7% |
| Samoan | 65 | 0.3% |
| Scandinavian | 59 | 0.2% |
| Scotch-Irish | 153 | 0.6% |
| Scottish | 356 | 1.4% |
| South American | 39 | 0.2% |
| Spaniard | 205 | 0.8% |
| Sri Lankan | 372 | 1.4% |
| Subsaharan African | 197 | 0.7% |
| Swedish | 143 | 0.5% |
| Swiss | 10 | 0.0% |
| Thai | 49 | 0.2% |
| Venezuelan | 38 | 0.1% |
| Welsh | 137 | 0.5% |
| Zimbabwean | 33 | 0.1% | View All 67 Rows |
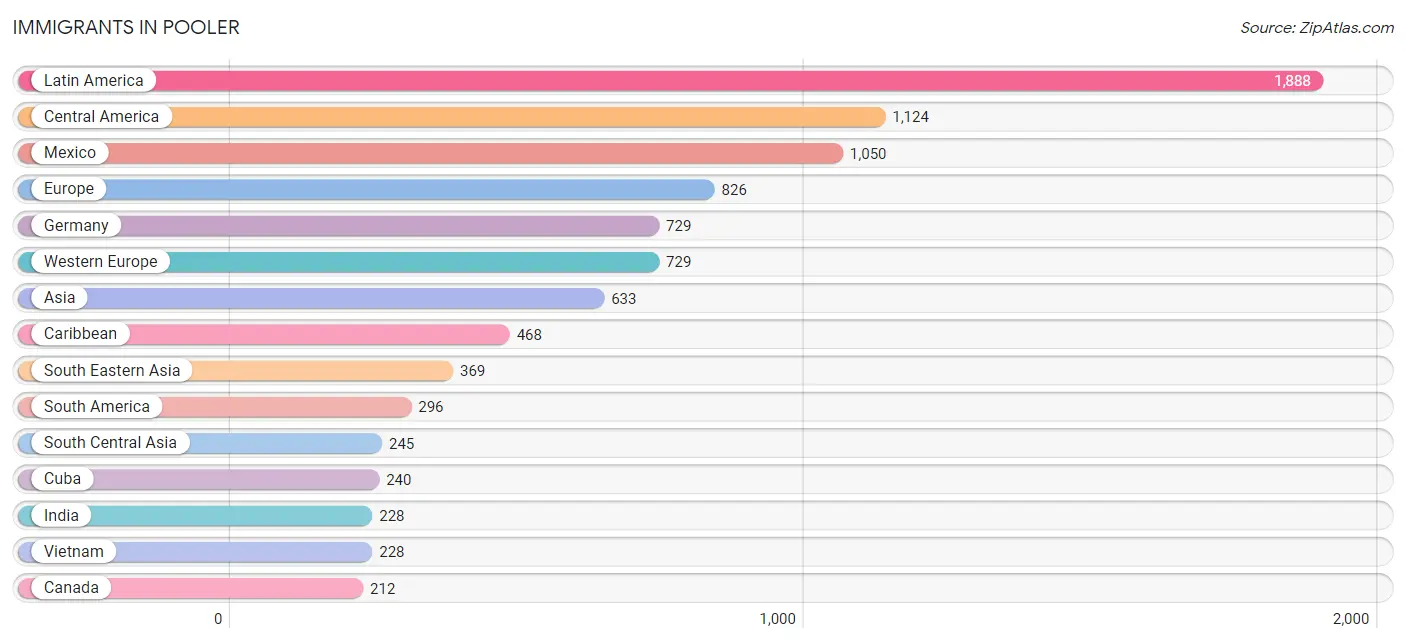
Immigrants in Pooler
The most numerous immigrant groups reported in Pooler came from Latin America (1,888 | 7.2%), Central America (1,124 | 4.3%), Mexico (1,050 | 4.0%), Europe (826 | 3.1%), and Germany (729 | 2.8%), together accounting for 21.4% of all Pooler residents.
| Immigration Origin | # Population | % Population |
| Africa | 33 | 0.1% |
| Asia | 633 | 2.4% |
| Azores | 2 | 0.0% |
| Brazil | 53 | 0.2% |
| Canada | 212 | 0.8% |
| Caribbean | 468 | 1.8% |
| Central America | 1,124 | 4.3% |
| Costa Rica | 5 | 0.0% |
| Cuba | 240 | 0.9% |
| Eastern Africa | 33 | 0.1% |
| Eastern Asia | 19 | 0.1% |
| Eastern Europe | 51 | 0.2% |
| England | 26 | 0.1% |
| Europe | 826 | 3.1% |
| Germany | 729 | 2.8% |
| Guatemala | 14 | 0.1% |
| Guyana | 204 | 0.8% |
| Haiti | 36 | 0.1% |
| India | 228 | 0.9% |
| Iran | 17 | 0.1% |
| Ireland | 18 | 0.1% |
| Jamaica | 148 | 0.6% |
| Japan | 19 | 0.1% |
| Latin America | 1,888 | 7.2% |
| Mexico | 1,050 | 4.0% |
| Micronesia | 138 | 0.5% |
| Nicaragua | 55 | 0.2% |
| Northern Europe | 44 | 0.2% |
| Oceania | 138 | 0.5% |
| Peru | 1 | 0.0% |
| Philippines | 134 | 0.5% |
| Portugal | 2 | 0.0% |
| Romania | 51 | 0.2% |
| South America | 296 | 1.1% |
| South Central Asia | 245 | 0.9% |
| South Eastern Asia | 369 | 1.4% |
| Southern Europe | 2 | 0.0% |
| Thailand | 7 | 0.0% |
| Venezuela | 38 | 0.1% |
| Vietnam | 228 | 0.9% |
| Western Europe | 729 | 2.8% |
| Zimbabwe | 33 | 0.1% | View All 42 Rows |
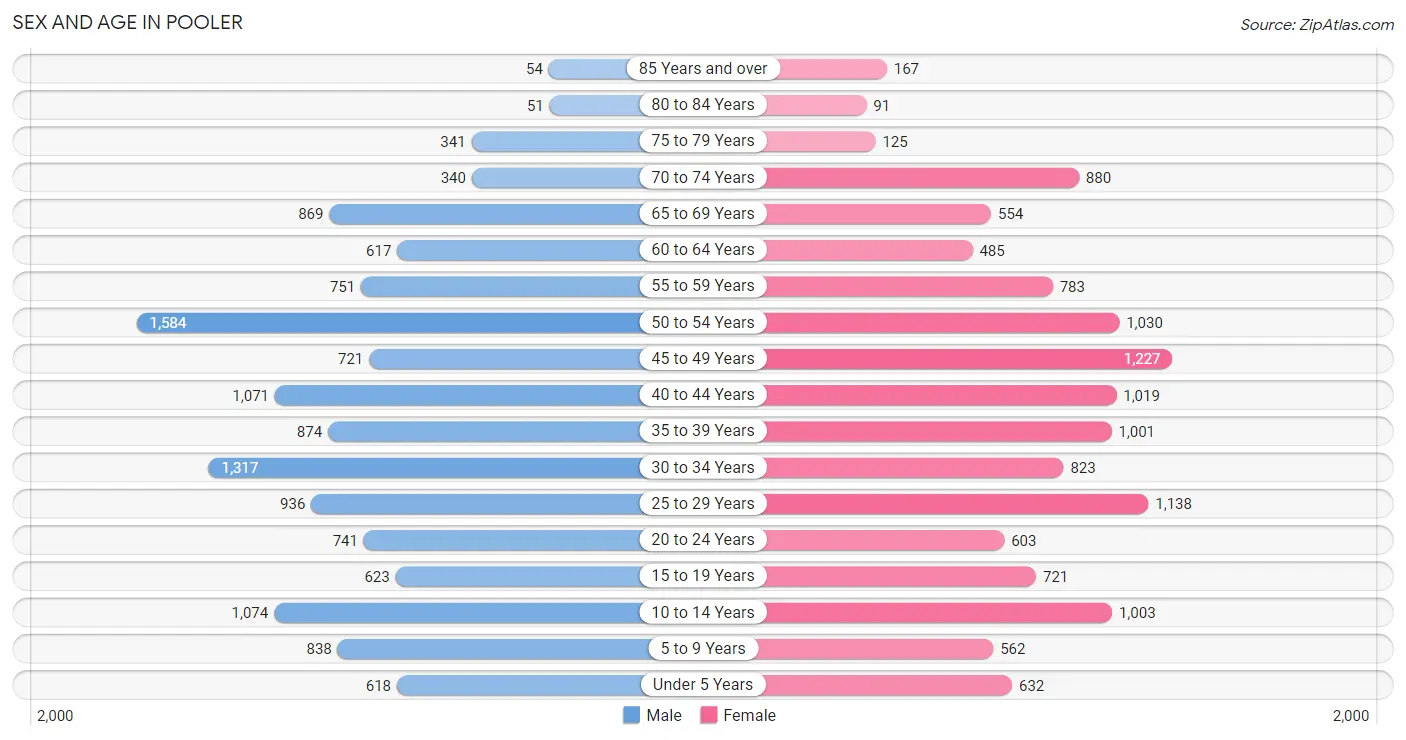
Sex and Age in Pooler
Sex and Age in Pooler
The most populous age groups in Pooler are 50 to 54 Years (1,584 | 11.8%) for men and 45 to 49 Years (1,227 | 9.6%) for women.
| Age Bracket | Male | Female |
| Under 5 Years | 618 (4.6%) | 632 (4.9%) |
| 5 to 9 Years | 838 (6.2%) | 562 (4.4%) |
| 10 to 14 Years | 1,074 (8.0%) | 1,003 (7.8%) |
| 15 to 19 Years | 623 (4.6%) | 721 (5.6%) |
| 20 to 24 Years | 741 (5.5%) | 603 (4.7%) |
| 25 to 29 Years | 936 (7.0%) | 1,138 (8.9%) |
| 30 to 34 Years | 1,317 (9.8%) | 823 (6.4%) |
| 35 to 39 Years | 874 (6.5%) | 1,001 (7.8%) |
| 40 to 44 Years | 1,071 (8.0%) | 1,019 (7.9%) |
| 45 to 49 Years | 721 (5.4%) | 1,227 (9.6%) |
| 50 to 54 Years | 1,584 (11.8%) | 1,030 (8.0%) |
| 55 to 59 Years | 751 (5.6%) | 783 (6.1%) |
| 60 to 64 Years | 617 (4.6%) | 485 (3.8%) |
| 65 to 69 Years | 869 (6.5%) | 554 (4.3%) |
| 70 to 74 Years | 340 (2.5%) | 880 (6.9%) |
| 75 to 79 Years | 341 (2.5%) | 125 (1.0%) |
| 80 to 84 Years | 51 (0.4%) | 91 (0.7%) |
| 85 Years and over | 54 (0.4%) | 167 (1.3%) |
| Total | 13,420 (100.0%) | 12,844 (100.0%) |
Families and Households in Pooler
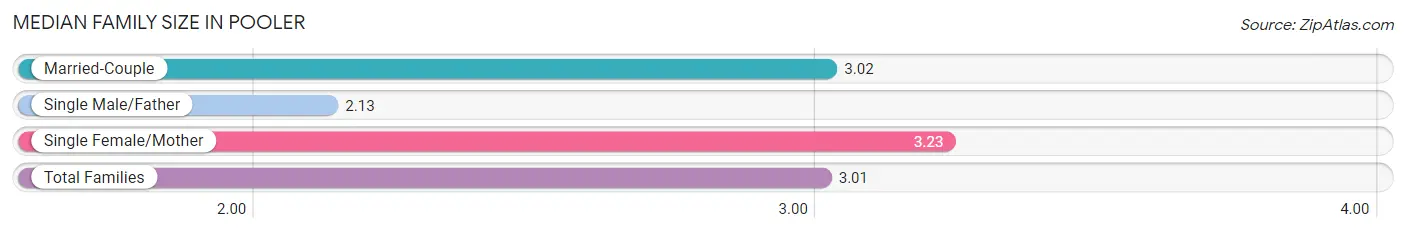
Median Family Size in Pooler
The median family size in Pooler is 3.01 persons per family, with single female/mother families (969 | 14.6%) accounting for the largest median family size of 3.23 persons per family. On the other hand, single male/father families (283 | 4.3%) represent the smallest median family size with 2.13 persons per family.
| Family Type | # Families | Family Size |
| Married-Couple | 5,405 (81.2%) | 3.02 |
| Single Male/Father | 283 (4.3%) | 2.13 |
| Single Female/Mother | 969 (14.6%) | 3.23 |
| Total Families | 6,657 (100.0%) | 3.01 |
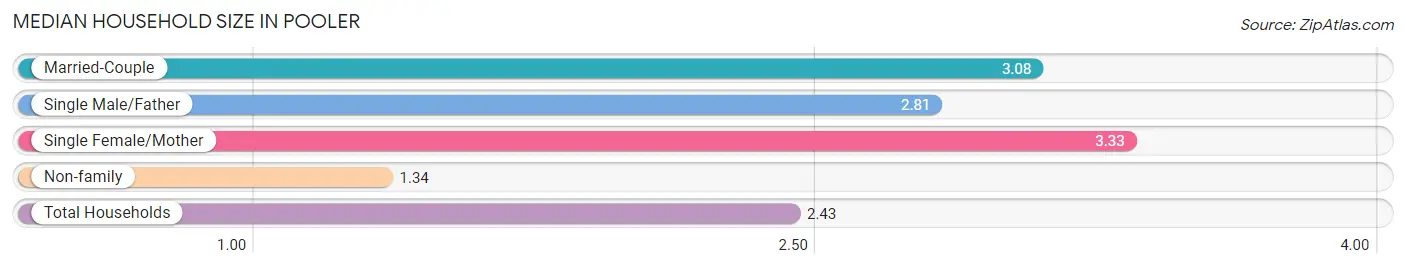
Median Household Size in Pooler
The median household size in Pooler is 2.43 persons per household, with single female/mother households (969 | 9.0%) accounting for the largest median household size of 3.33 persons per household. non-family households (4,095 | 38.1%) represent the smallest median household size with 1.34 persons per household.
| Household Type | # Households | Household Size |
| Married-Couple | 5,405 (50.3%) | 3.08 |
| Single Male/Father | 283 (2.6%) | 2.81 |
| Single Female/Mother | 969 (9.0%) | 3.33 |
| Non-family | 4,095 (38.1%) | 1.34 |
| Total Households | 10,752 (100.0%) | 2.43 |
Household Size by Marriage Status in Pooler
Out of a total of 10,752 households in Pooler, 6,657 (61.9%) are family households, while 4,095 (38.1%) are nonfamily households. The most numerous type of family households are 2-person households, comprising 3,306, and the most common type of nonfamily households are 1-person households, comprising 3,158.
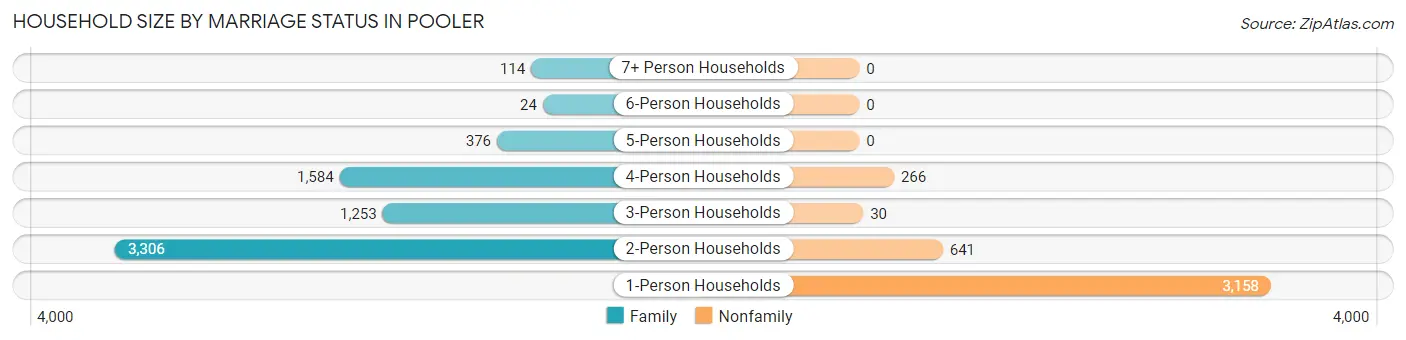
| Household Size | Family Households | Nonfamily Households |
| 1-Person Households | - | 3,158 (29.4%) |
| 2-Person Households | 3,306 (30.7%) | 641 (6.0%) |
| 3-Person Households | 1,253 (11.7%) | 30 (0.3%) |
| 4-Person Households | 1,584 (14.7%) | 266 (2.5%) |
| 5-Person Households | 376 (3.5%) | 0 (0.0%) |
| 6-Person Households | 24 (0.2%) | 0 (0.0%) |
| 7+ Person Households | 114 (1.1%) | 0 (0.0%) |
| Total | 6,657 (61.9%) | 4,095 (38.1%) |
Female Fertility in Pooler
Fertility by Age in Pooler
Average fertility rate in Pooler is 28.0 births per 1,000 women. Women in the age bracket of 20 to 34 years have the highest fertility rate with 77.0 births per 1,000 women. Women in the age bracket of 20 to 34 years acount for 100.0% of all women with births.
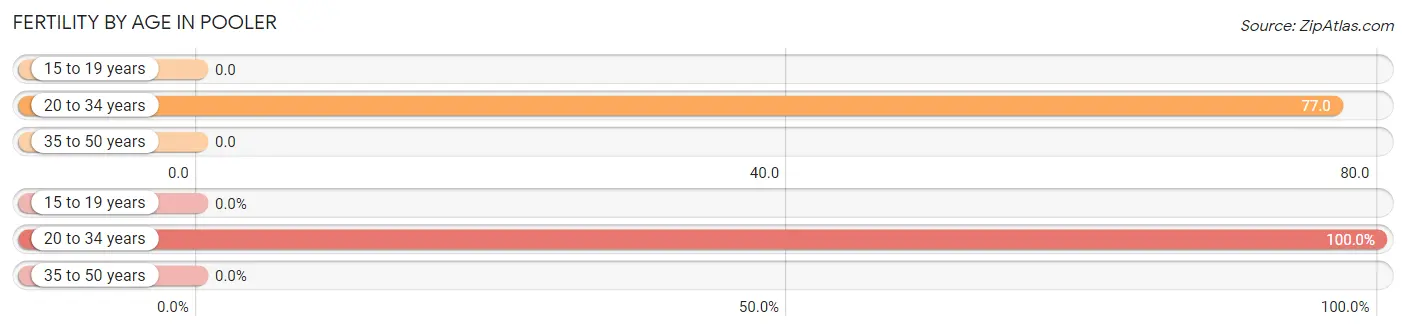
| Age Bracket | Women with Births | Births / 1,000 Women |
| 15 to 19 years | 0 (0.0%) | 0.0 |
| 20 to 34 years | 197 (100.0%) | 77.0 |
| 35 to 50 years | 0 (0.0%) | 0.0 |
| Total | 197 (100.0%) | 28.0 |
Fertility by Age by Marriage Status in Pooler
62.9% of women with births (197) in Pooler are married. The highest percentage of unmarried women with births falls into 20 to 34 years age bracket with 37.1% of them unmarried at the time of birth, while the lowest percentage of unmarried women with births belong to 20 to 34 years age bracket with 37.1% of them unmarried.
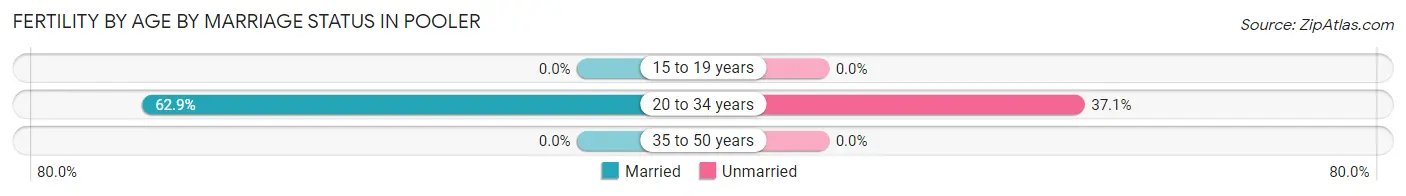
| Age Bracket | Married | Unmarried |
| 15 to 19 years | 0 (0.0%) | 0 (0.0%) |
| 20 to 34 years | 124 (62.9%) | 73 (37.1%) |
| 35 to 50 years | 0 (0.0%) | 0 (0.0%) |
| Total | 124 (62.9%) | 73 (37.1%) |
Fertility by Education in Pooler
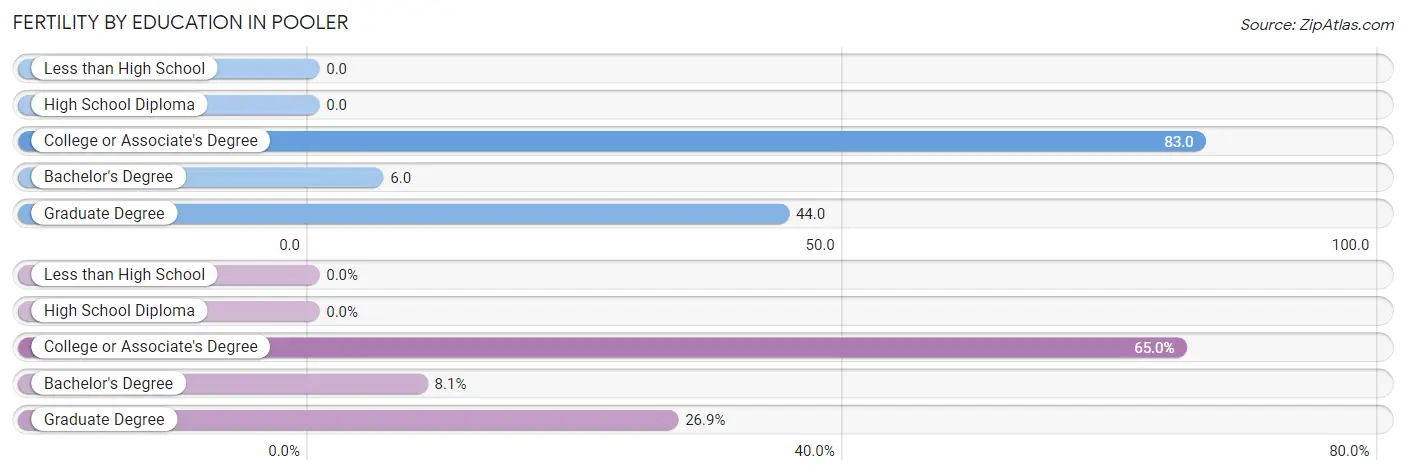
| Educational Attainment | Women with Births | Births / 1,000 Women |
| Less than High School | 0 (0.0%) | 0.0 |
| High School Diploma | 0 (0.0%) | 0.0 |
| College or Associate's Degree | 128 (65.0%) | 83.0 |
| Bachelor's Degree | 16 (8.1%) | 6.0 |
| Graduate Degree | 53 (26.9%) | 44.0 |
| Total | 197 (100.0%) | 28.0 |
Fertility by Education by Marriage Status in Pooler
37.1% of women with births in Pooler are unmarried. Women with the educational attainment of bachelor's degree are most likely to be married with 100.0% of them married at childbirth, while women with the educational attainment of college or associate's degree are least likely to be married with 57.0% of them unmarried at childbirth.
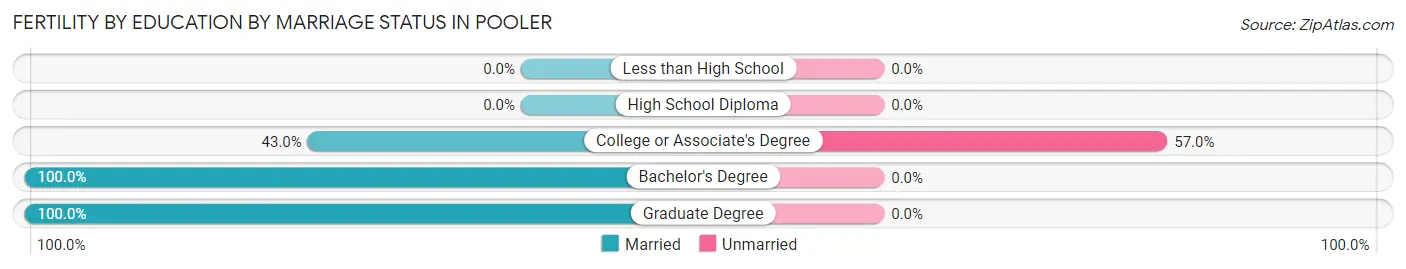
| Educational Attainment | Married | Unmarried |
| Less than High School | 0 (0.0%) | 0 (0.0%) |
| High School Diploma | 0 (0.0%) | 0 (0.0%) |
| College or Associate's Degree | 55 (43.0%) | 73 (57.0%) |
| Bachelor's Degree | 16 (100.0%) | 0 (0.0%) |
| Graduate Degree | 53 (100.0%) | 0 (0.0%) |
| Total | 124 (62.9%) | 73 (37.1%) |
Employment Characteristics in Pooler
Employment by Class of Employer in Pooler
Among the 15,054 employed individuals in Pooler, private company employees (9,316 | 61.9%), local government employees (1,846 | 12.3%), and federal government employees (1,321 | 8.8%) make up the most common classes of employment.
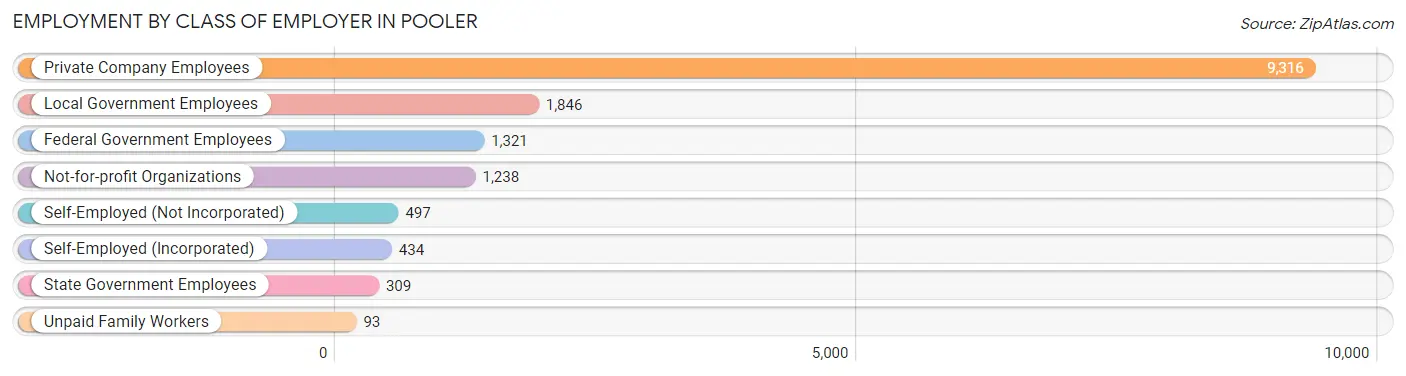
| Employer Class | # Employees | % Employees |
| Private Company Employees | 9,316 | 61.9% |
| Self-Employed (Incorporated) | 434 | 2.9% |
| Self-Employed (Not Incorporated) | 497 | 3.3% |
| Not-for-profit Organizations | 1,238 | 8.2% |
| Local Government Employees | 1,846 | 12.3% |
| State Government Employees | 309 | 2.1% |
| Federal Government Employees | 1,321 | 8.8% |
| Unpaid Family Workers | 93 | 0.6% |
| Total | 15,054 | 100.0% |
Employment Status by Age in Pooler
According to the labor force statistics for Pooler, out of the total population over 16 years of age (21,293), 74.7% or 15,906 individuals are in the labor force, with 5.4% or 859 of them unemployed. The age group with the highest labor force participation rate is 35 to 44 years, with 97.2% or 3,854 individuals in the labor force. Within the labor force, the 65 to 74 years age range has the highest percentage of unemployed individuals, with 30.2% or 267 of them being unemployed.
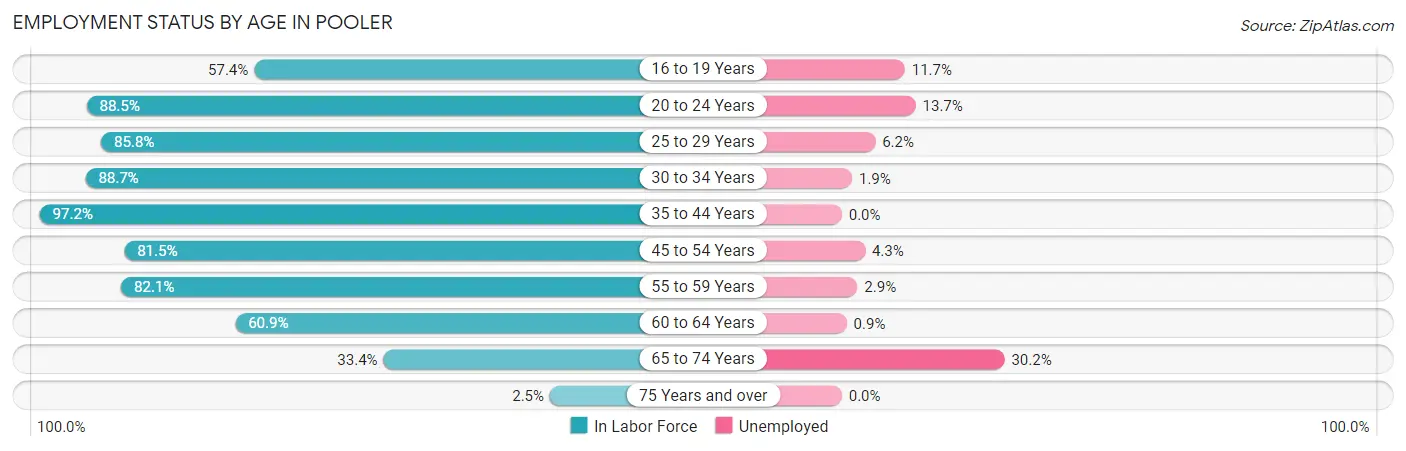
| Age Bracket | In Labor Force | Unemployed |
| 16 to 19 Years | 631 (57.4%) | 74 (11.7%) |
| 20 to 24 Years | 1,189 (88.5%) | 163 (13.7%) |
| 25 to 29 Years | 1,779 (85.8%) | 110 (6.2%) |
| 30 to 34 Years | 1,898 (88.7%) | 36 (1.9%) |
| 35 to 44 Years | 3,854 (97.2%) | 0 (0.0%) |
| 45 to 54 Years | 3,718 (81.5%) | 160 (4.3%) |
| 55 to 59 Years | 1,259 (82.1%) | 37 (2.9%) |
| 60 to 64 Years | 671 (60.9%) | 6 (0.9%) |
| 65 to 74 Years | 883 (33.4%) | 267 (30.2%) |
| 75 Years and over | 21 (2.5%) | 0 (0.0%) |
| Total | 15,906 (74.7%) | 859 (5.4%) |
Employment Status by Educational Attainment in Pooler
According to labor force statistics for Pooler, 85.7% of individuals (13,178) out of the total population between 25 and 64 years of age (15,377) are in the labor force, with 2.7% or 356 of them being unemployed. The group with the highest labor force participation rate are those with the educational attainment of less than high school, with 92.8% or 633 individuals in the labor force. Within the labor force, individuals with high school diploma education have the highest percentage of unemployment, with 4.2% or 109 of them being unemployed.
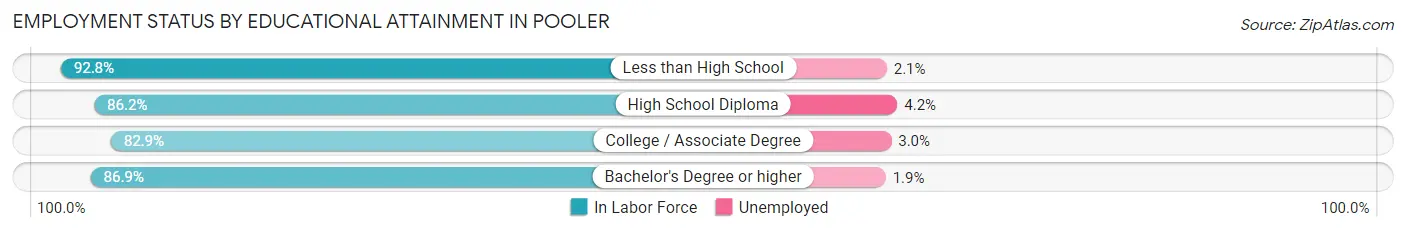
| Educational Attainment | In Labor Force | Unemployed |
| Less than High School | 633 (92.8%) | 14 (2.1%) |
| High School Diploma | 2,597 (86.2%) | 127 (4.2%) |
| College / Associate Degree | 4,022 (82.9%) | 146 (3.0%) |
| Bachelor's Degree or higher | 5,935 (86.9%) | 130 (1.9%) |
| Total | 13,178 (85.7%) | 415 (2.7%) |
Employment Occupations by Sex in Pooler
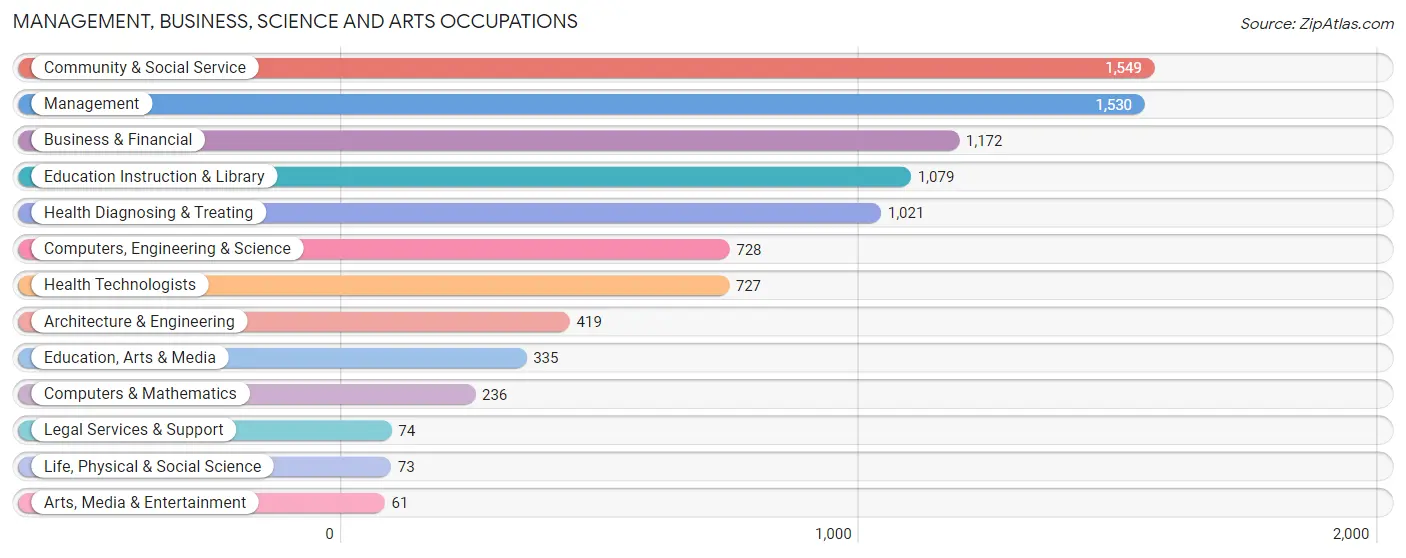
Management, Business, Science and Arts Occupations
The most common Management, Business, Science and Arts occupations in Pooler are Community & Social Service (1,549 | 10.8%), Management (1,530 | 10.7%), Business & Financial (1,172 | 8.2%), Education Instruction & Library (1,079 | 7.5%), and Health Diagnosing & Treating (1,021 | 7.1%).
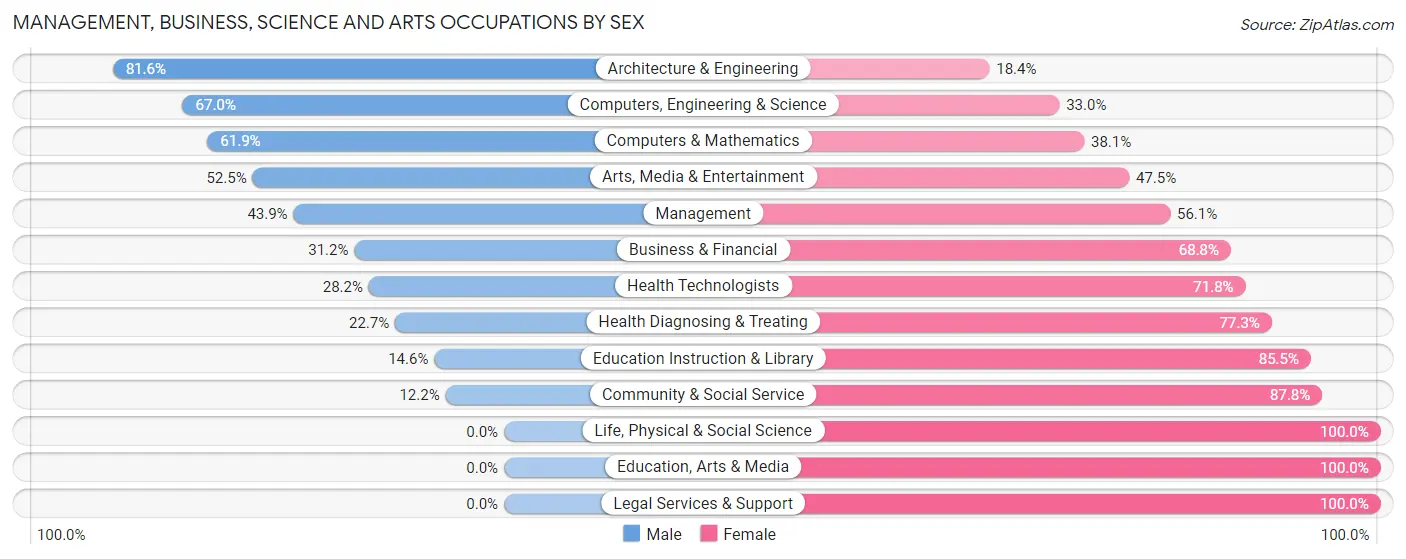
Management, Business, Science and Arts Occupations by Sex
Within the Management, Business, Science and Arts occupations in Pooler, the most male-oriented occupations are Architecture & Engineering (81.6%), Computers, Engineering & Science (67.0%), and Computers & Mathematics (61.9%), while the most female-oriented occupations are Life, Physical & Social Science (100.0%), Education, Arts & Media (100.0%), and Legal Services & Support (100.0%).
| Occupation | Male | Female |
| Management | 672 (43.9%) | 858 (56.1%) |
| Business & Financial | 366 (31.2%) | 806 (68.8%) |
| Computers, Engineering & Science | 488 (67.0%) | 240 (33.0%) |
| Computers & Mathematics | 146 (61.9%) | 90 (38.1%) |
| Architecture & Engineering | 342 (81.6%) | 77 (18.4%) |
| Life, Physical & Social Science | 0 (0.0%) | 73 (100.0%) |
| Community & Social Service | 189 (12.2%) | 1,360 (87.8%) |
| Education, Arts & Media | 0 (0.0%) | 335 (100.0%) |
| Legal Services & Support | 0 (0.0%) | 74 (100.0%) |
| Education Instruction & Library | 157 (14.5%) | 922 (85.5%) |
| Arts, Media & Entertainment | 32 (52.5%) | 29 (47.5%) |
| Health Diagnosing & Treating | 232 (22.7%) | 789 (77.3%) |
| Health Technologists | 205 (28.2%) | 522 (71.8%) |
| Total (Category) | 1,947 (32.5%) | 4,053 (67.5%) |
| Total (Overall) | 7,114 (49.8%) | 7,168 (50.2%) |
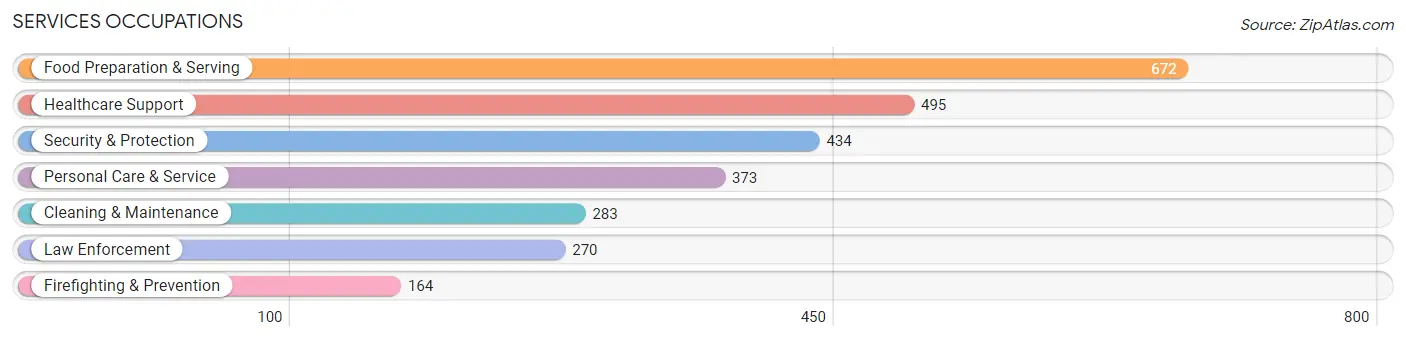
Services Occupations
The most common Services occupations in Pooler are Food Preparation & Serving (672 | 4.7%), Healthcare Support (495 | 3.5%), Security & Protection (434 | 3.0%), Personal Care & Service (373 | 2.6%), and Cleaning & Maintenance (283 | 2.0%).
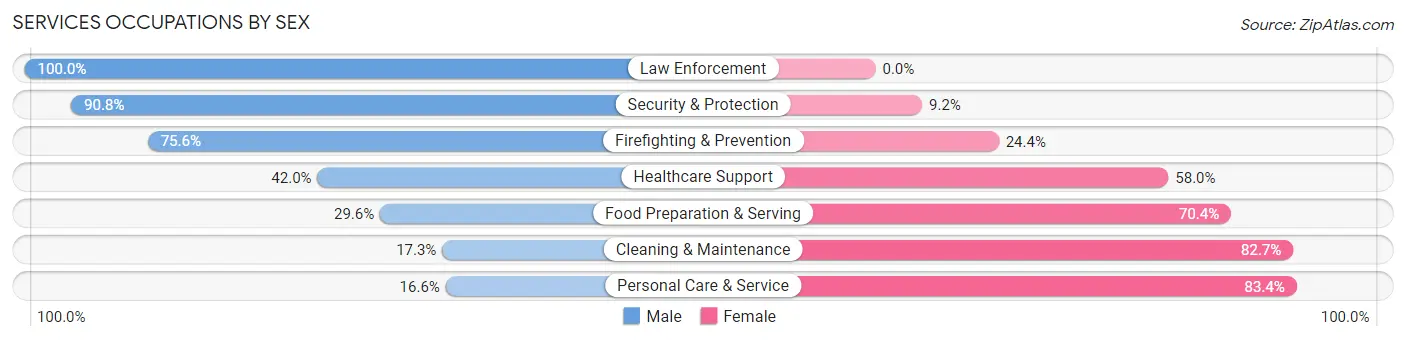
Services Occupations by Sex
Within the Services occupations in Pooler, the most male-oriented occupations are Law Enforcement (100.0%), Security & Protection (90.8%), and Firefighting & Prevention (75.6%), while the most female-oriented occupations are Personal Care & Service (83.4%), Cleaning & Maintenance (82.7%), and Food Preparation & Serving (70.4%).
| Occupation | Male | Female |
| Healthcare Support | 208 (42.0%) | 287 (58.0%) |
| Security & Protection | 394 (90.8%) | 40 (9.2%) |
| Firefighting & Prevention | 124 (75.6%) | 40 (24.4%) |
| Law Enforcement | 270 (100.0%) | 0 (0.0%) |
| Food Preparation & Serving | 199 (29.6%) | 473 (70.4%) |
| Cleaning & Maintenance | 49 (17.3%) | 234 (82.7%) |
| Personal Care & Service | 62 (16.6%) | 311 (83.4%) |
| Total (Category) | 912 (40.4%) | 1,345 (59.6%) |
| Total (Overall) | 7,114 (49.8%) | 7,168 (50.2%) |
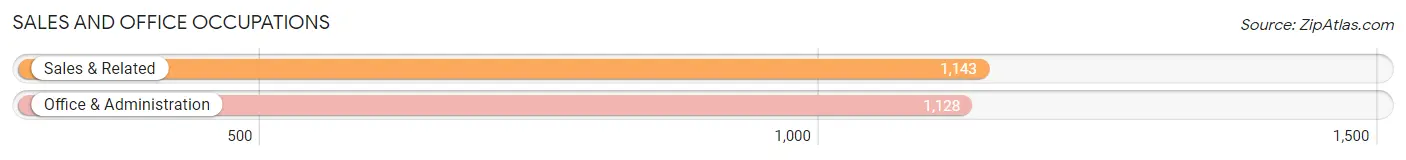
Sales and Office Occupations
The most common Sales and Office occupations in Pooler are Sales & Related (1,143 | 8.0%), and Office & Administration (1,128 | 7.9%).
Sales and Office Occupations by Sex
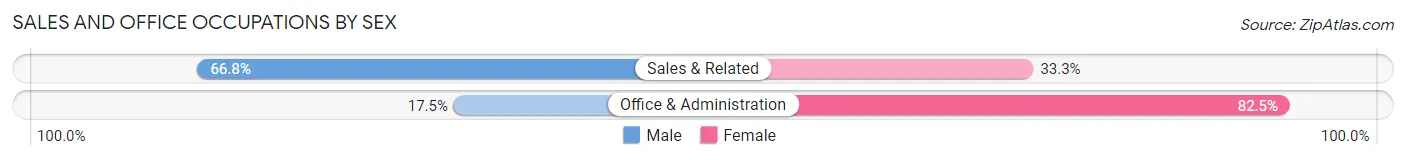
| Occupation | Male | Female |
| Sales & Related | 763 (66.7%) | 380 (33.3%) |
| Office & Administration | 197 (17.5%) | 931 (82.5%) |
| Total (Category) | 960 (42.3%) | 1,311 (57.7%) |
| Total (Overall) | 7,114 (49.8%) | 7,168 (50.2%) |
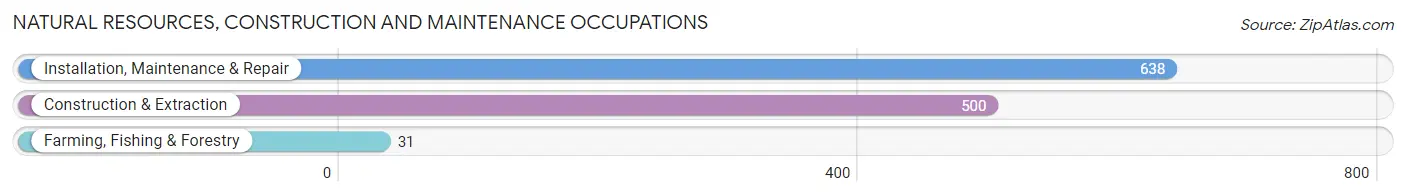
Natural Resources, Construction and Maintenance Occupations
The most common Natural Resources, Construction and Maintenance occupations in Pooler are Installation, Maintenance & Repair (638 | 4.5%), Construction & Extraction (500 | 3.5%), and Farming, Fishing & Forestry (31 | 0.2%).
Natural Resources, Construction and Maintenance Occupations by Sex
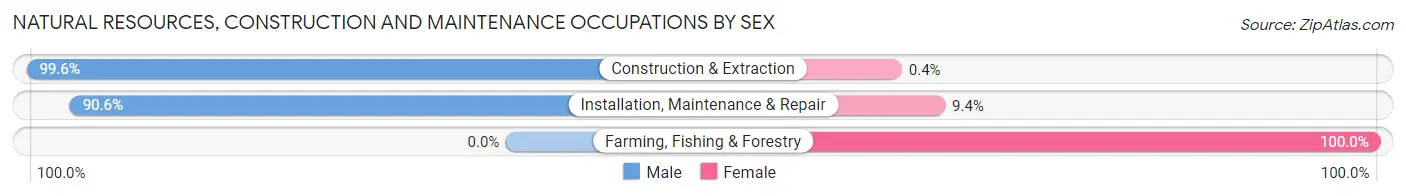
| Occupation | Male | Female |
| Farming, Fishing & Forestry | 0 (0.0%) | 31 (100.0%) |
| Construction & Extraction | 498 (99.6%) | 2 (0.4%) |
| Installation, Maintenance & Repair | 578 (90.6%) | 60 (9.4%) |
| Total (Category) | 1,076 (92.0%) | 93 (8.0%) |
| Total (Overall) | 7,114 (49.8%) | 7,168 (50.2%) |
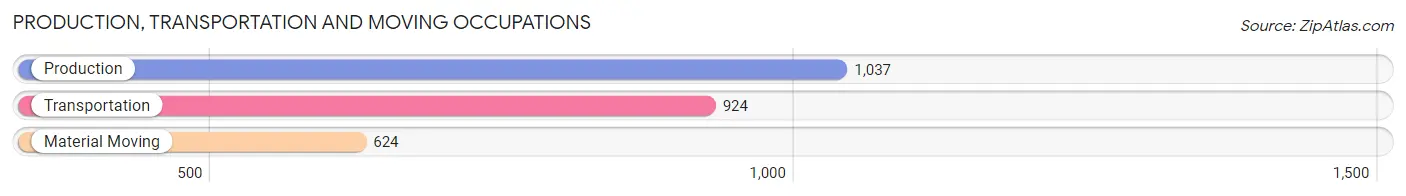
Production, Transportation and Moving Occupations
The most common Production, Transportation and Moving occupations in Pooler are Production (1,037 | 7.3%), Transportation (924 | 6.5%), and Material Moving (624 | 4.4%).
Production, Transportation and Moving Occupations by Sex
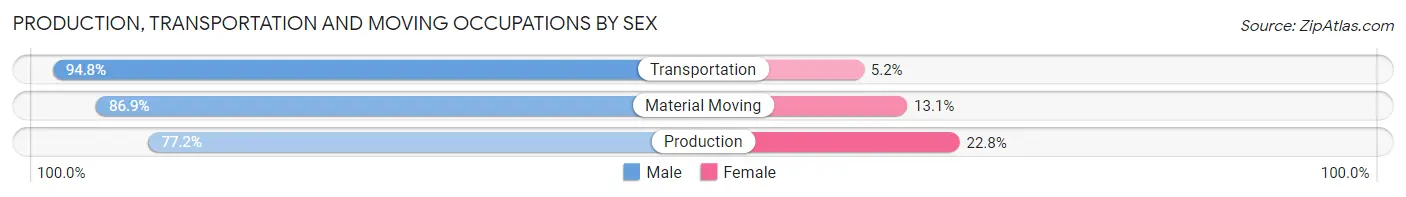
| Occupation | Male | Female |
| Production | 801 (77.2%) | 236 (22.8%) |
| Transportation | 876 (94.8%) | 48 (5.2%) |
| Material Moving | 542 (86.9%) | 82 (13.1%) |
| Total (Category) | 2,219 (85.8%) | 366 (14.2%) |
| Total (Overall) | 7,114 (49.8%) | 7,168 (50.2%) |
Employment Industries by Sex in Pooler
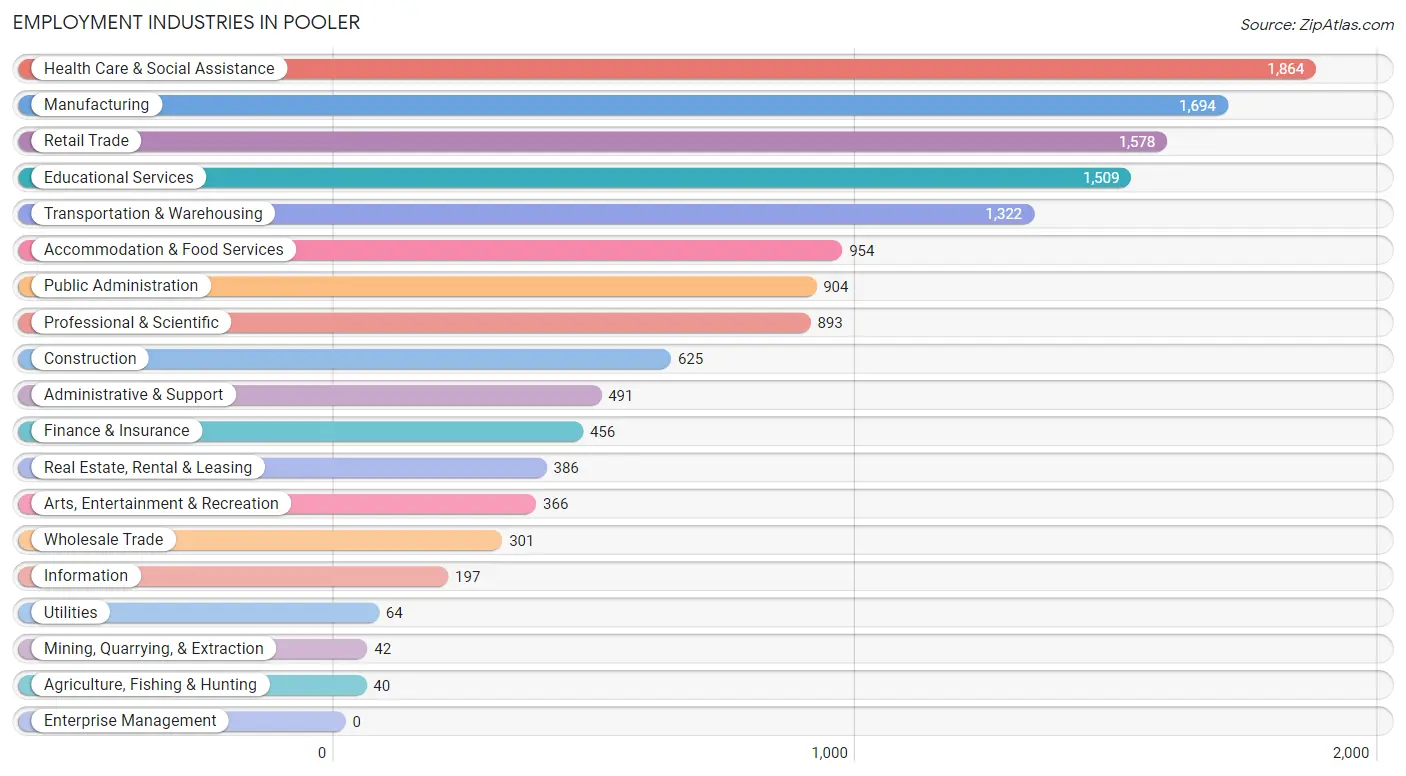
Employment Industries in Pooler
The major employment industries in Pooler include Health Care & Social Assistance (1,864 | 13.1%), Manufacturing (1,694 | 11.9%), Retail Trade (1,578 | 11.1%), Educational Services (1,509 | 10.6%), and Transportation & Warehousing (1,322 | 9.3%).
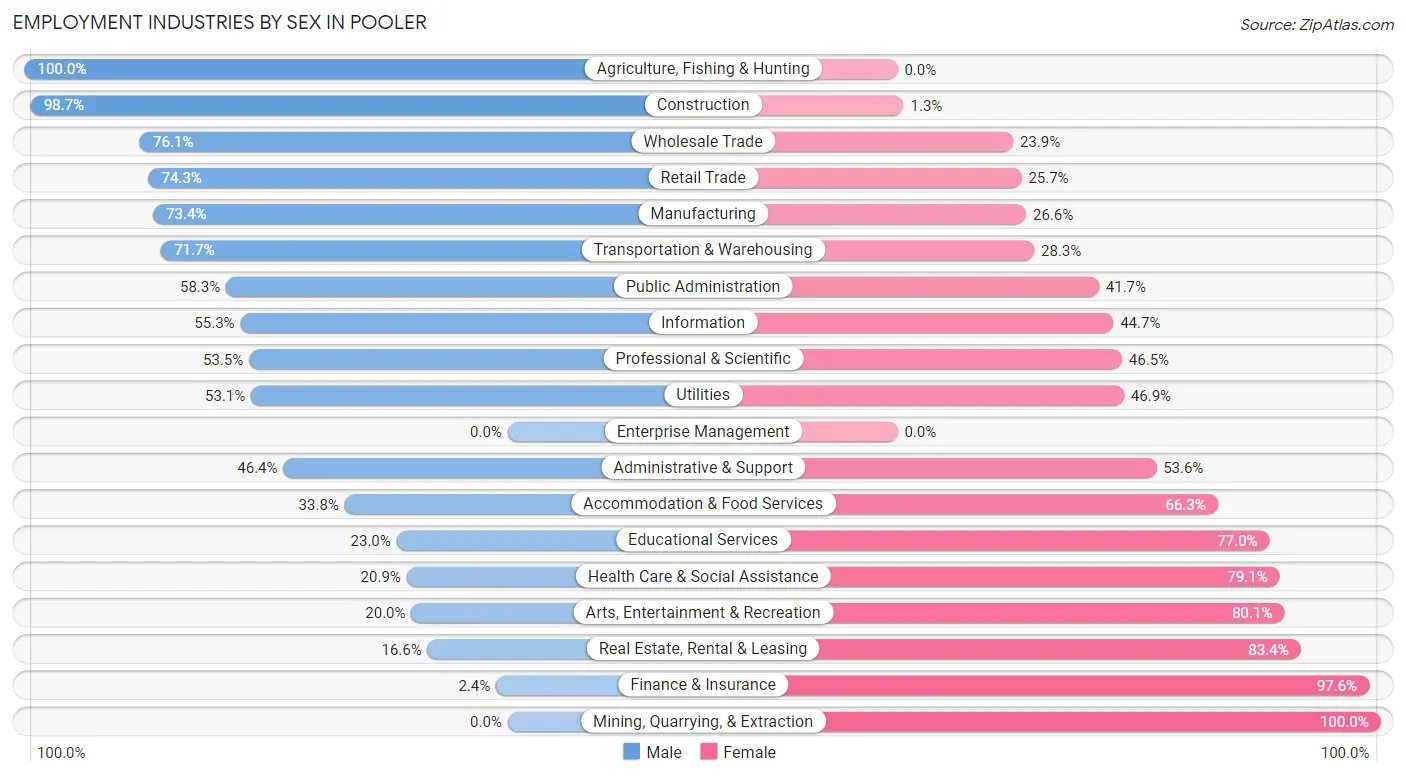
Employment Industries by Sex in Pooler
The Pooler industries that see more men than women are Agriculture, Fishing & Hunting (100.0%), Construction (98.7%), and Wholesale Trade (76.1%), whereas the industries that tend to have a higher number of women are Mining, Quarrying, & Extraction (100.0%), Finance & Insurance (97.6%), and Real Estate, Rental & Leasing (83.4%).
| Industry | Male | Female |
| Agriculture, Fishing & Hunting | 40 (100.0%) | 0 (0.0%) |
| Mining, Quarrying, & Extraction | 0 (0.0%) | 42 (100.0%) |
| Construction | 617 (98.7%) | 8 (1.3%) |
| Manufacturing | 1,243 (73.4%) | 451 (26.6%) |
| Wholesale Trade | 229 (76.1%) | 72 (23.9%) |
| Retail Trade | 1,173 (74.3%) | 405 (25.7%) |
| Transportation & Warehousing | 948 (71.7%) | 374 (28.3%) |
| Utilities | 34 (53.1%) | 30 (46.9%) |
| Information | 109 (55.3%) | 88 (44.7%) |
| Finance & Insurance | 11 (2.4%) | 445 (97.6%) |
| Real Estate, Rental & Leasing | 64 (16.6%) | 322 (83.4%) |
| Professional & Scientific | 478 (53.5%) | 415 (46.5%) |
| Enterprise Management | 0 (0.0%) | 0 (0.0%) |
| Administrative & Support | 228 (46.4%) | 263 (53.6%) |
| Educational Services | 347 (23.0%) | 1,162 (77.0%) |
| Health Care & Social Assistance | 390 (20.9%) | 1,474 (79.1%) |
| Arts, Entertainment & Recreation | 73 (20.0%) | 293 (80.0%) |
| Accommodation & Food Services | 322 (33.8%) | 632 (66.2%) |
| Public Administration | 527 (58.3%) | 377 (41.7%) |
| Total | 7,114 (49.8%) | 7,168 (50.2%) |
Education in Pooler
School Enrollment in Pooler
The most common levels of schooling among the 6,549 students in Pooler are middle school (1,663 | 25.4%), college / undergraduate (1,260 | 19.2%), and high school (1,226 | 18.7%).
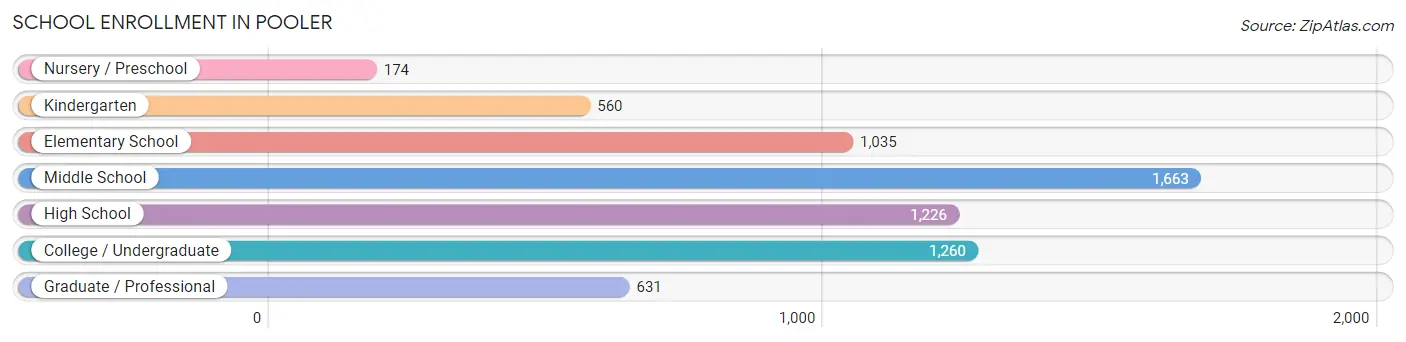
| School Level | # Students | % Students |
| Nursery / Preschool | 174 | 2.7% |
| Kindergarten | 560 | 8.6% |
| Elementary School | 1,035 | 15.8% |
| Middle School | 1,663 | 25.4% |
| High School | 1,226 | 18.7% |
| College / Undergraduate | 1,260 | 19.2% |
| Graduate / Professional | 631 | 9.6% |
| Total | 6,549 | 100.0% |
School Enrollment by Age by Funding Source in Pooler
Out of a total of 6,549 students who are enrolled in schools in Pooler, 1,323 (20.2%) attend a private institution, while the remaining 5,226 (79.8%) are enrolled in public schools. The age group of 3 to 4 year olds has the highest likelihood of being enrolled in private schools, with 107 (61.5% in the age bracket) enrolled. Conversely, the age group of 15 to 17 year olds has the lowest likelihood of being enrolled in a private school, with 843 (92.2% in the age bracket) attending a public institution.
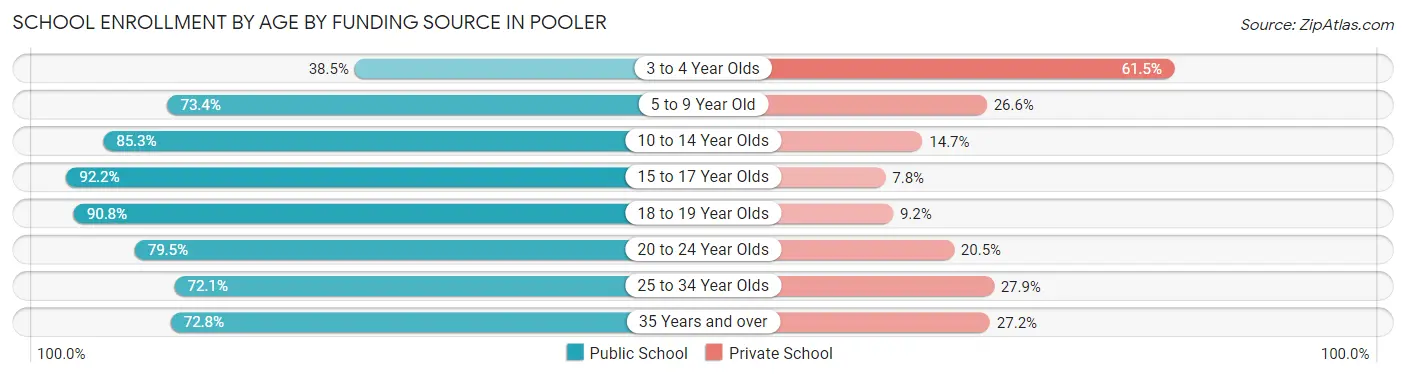
| Age Bracket | Public School | Private School |
| 3 to 4 Year Olds | 67 (38.5%) | 107 (61.5%) |
| 5 to 9 Year Old | 997 (73.4%) | 362 (26.6%) |
| 10 to 14 Year Olds | 1,741 (85.3%) | 299 (14.7%) |
| 15 to 17 Year Olds | 843 (92.2%) | 71 (7.8%) |
| 18 to 19 Year Olds | 267 (90.8%) | 27 (9.2%) |
| 20 to 24 Year Olds | 329 (79.5%) | 85 (20.5%) |
| 25 to 34 Year Olds | 534 (72.1%) | 207 (27.9%) |
| 35 Years and over | 446 (72.8%) | 167 (27.2%) |
| Total | 5,226 (79.8%) | 1,323 (20.2%) |
Educational Attainment by Field of Study in Pooler
Business (2,133 | 25.9%), education (1,049 | 12.8%), social sciences (688 | 8.4%), psychology (668 | 8.1%), and science & technology (628 | 7.6%) are the most common fields of study among 8,224 individuals in Pooler who have obtained a bachelor's degree or higher.
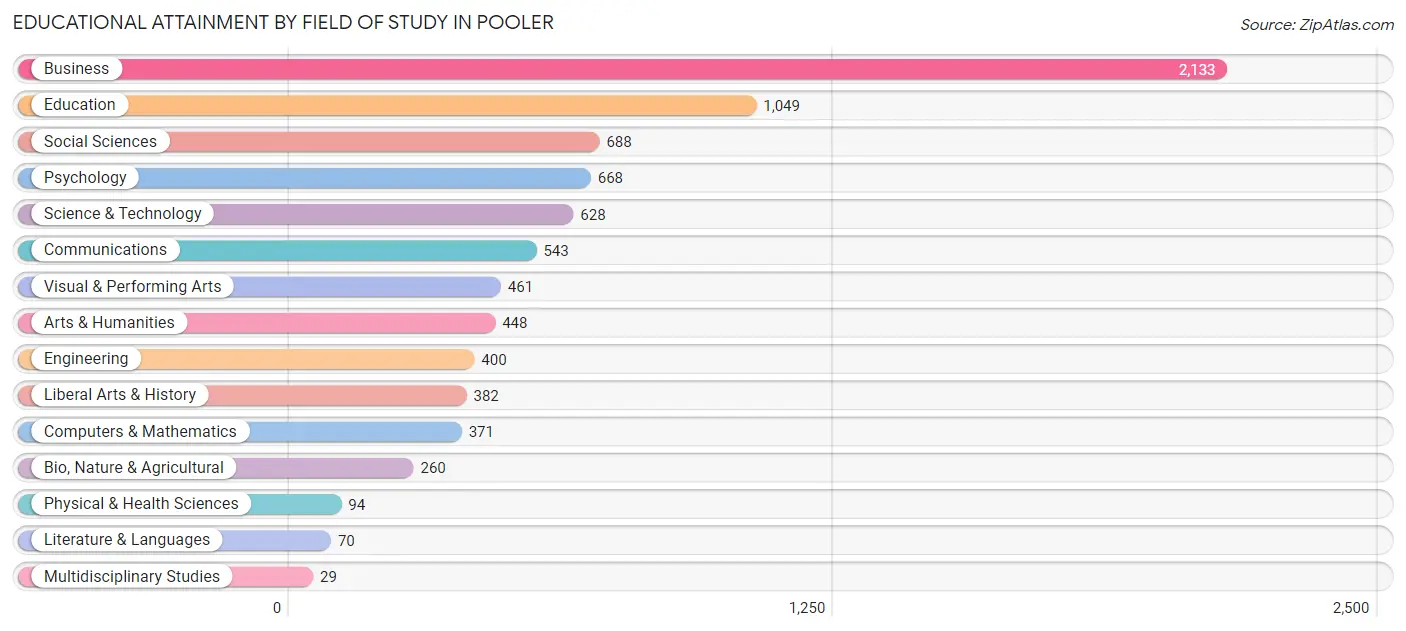
| Field of Study | # Graduates | % Graduates |
| Computers & Mathematics | 371 | 4.5% |
| Bio, Nature & Agricultural | 260 | 3.2% |
| Physical & Health Sciences | 94 | 1.1% |
| Psychology | 668 | 8.1% |
| Social Sciences | 688 | 8.4% |
| Engineering | 400 | 4.9% |
| Multidisciplinary Studies | 29 | 0.4% |
| Science & Technology | 628 | 7.6% |
| Business | 2,133 | 25.9% |
| Education | 1,049 | 12.8% |
| Literature & Languages | 70 | 0.9% |
| Liberal Arts & History | 382 | 4.6% |
| Visual & Performing Arts | 461 | 5.6% |
| Communications | 543 | 6.6% |
| Arts & Humanities | 448 | 5.4% |
| Total | 8,224 | 100.0% |
Transportation & Commute in Pooler
Vehicle Availability by Sex in Pooler
The most prevalent vehicle ownership categories in Pooler are males with 2 vehicles (3,234, accounting for 41.1%) and females with 2 vehicles (3,546, making up 45.0%).
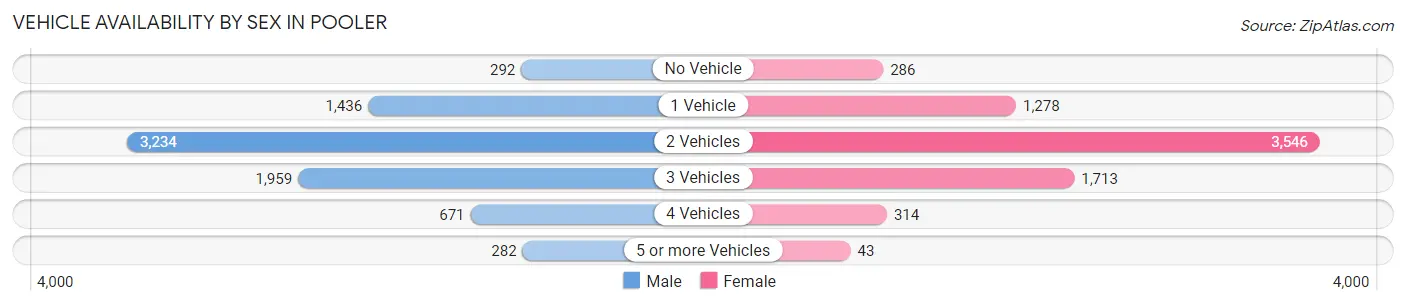
| Vehicles Available | Male | Female |
| No Vehicle | 292 (3.7%) | 286 (4.0%) |
| 1 Vehicle | 1,436 (18.2%) | 1,278 (17.8%) |
| 2 Vehicles | 3,234 (41.1%) | 3,546 (49.4%) |
| 3 Vehicles | 1,959 (24.9%) | 1,713 (23.9%) |
| 4 Vehicles | 671 (8.5%) | 314 (4.4%) |
| 5 or more Vehicles | 282 (3.6%) | 43 (0.6%) |
| Total | 7,874 (100.0%) | 7,180 (100.0%) |
Commute Time in Pooler
The most frequently occuring commute durations in Pooler are 20 to 24 minutes (2,709 commuters, 19.8%), 30 to 34 minutes (2,327 commuters, 17.0%), and 15 to 19 minutes (2,092 commuters, 15.3%).
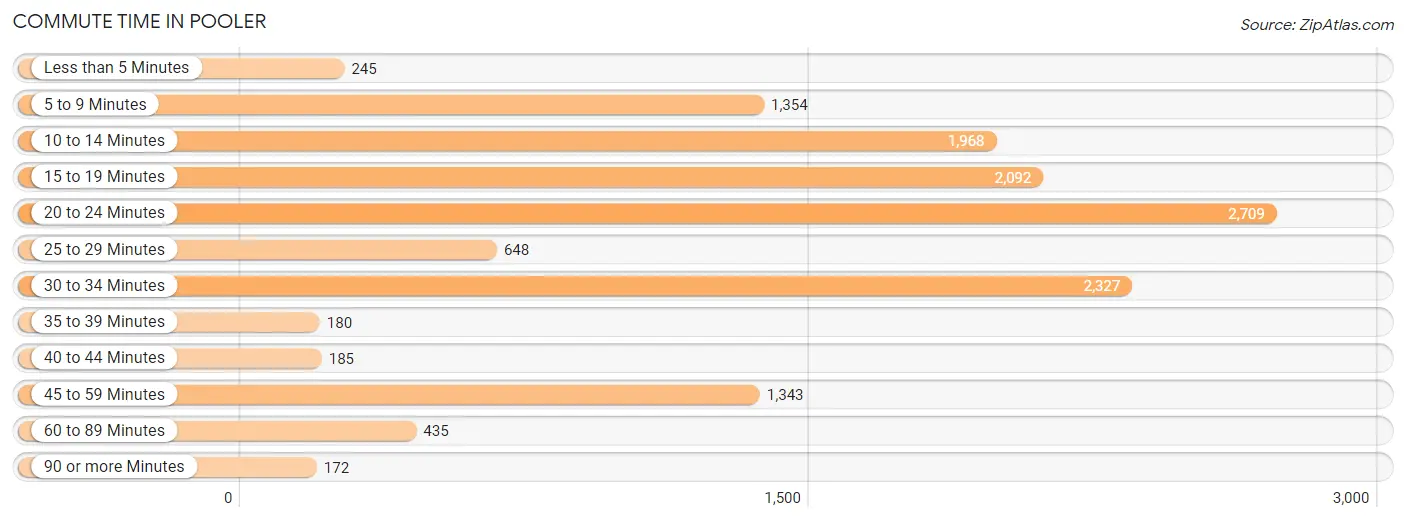
| Commute Time | # Commuters | % Commuters |
| Less than 5 Minutes | 245 | 1.8% |
| 5 to 9 Minutes | 1,354 | 9.9% |
| 10 to 14 Minutes | 1,968 | 14.4% |
| 15 to 19 Minutes | 2,092 | 15.3% |
| 20 to 24 Minutes | 2,709 | 19.8% |
| 25 to 29 Minutes | 648 | 4.7% |
| 30 to 34 Minutes | 2,327 | 17.0% |
| 35 to 39 Minutes | 180 | 1.3% |
| 40 to 44 Minutes | 185 | 1.3% |
| 45 to 59 Minutes | 1,343 | 9.8% |
| 60 to 89 Minutes | 435 | 3.2% |
| 90 or more Minutes | 172 | 1.3% |
Commute Time by Sex in Pooler
The most common commute times in Pooler are 20 to 24 minutes (1,913 commuters, 25.6%) for males and 15 to 19 minutes (1,163 commuters, 18.8%) for females.
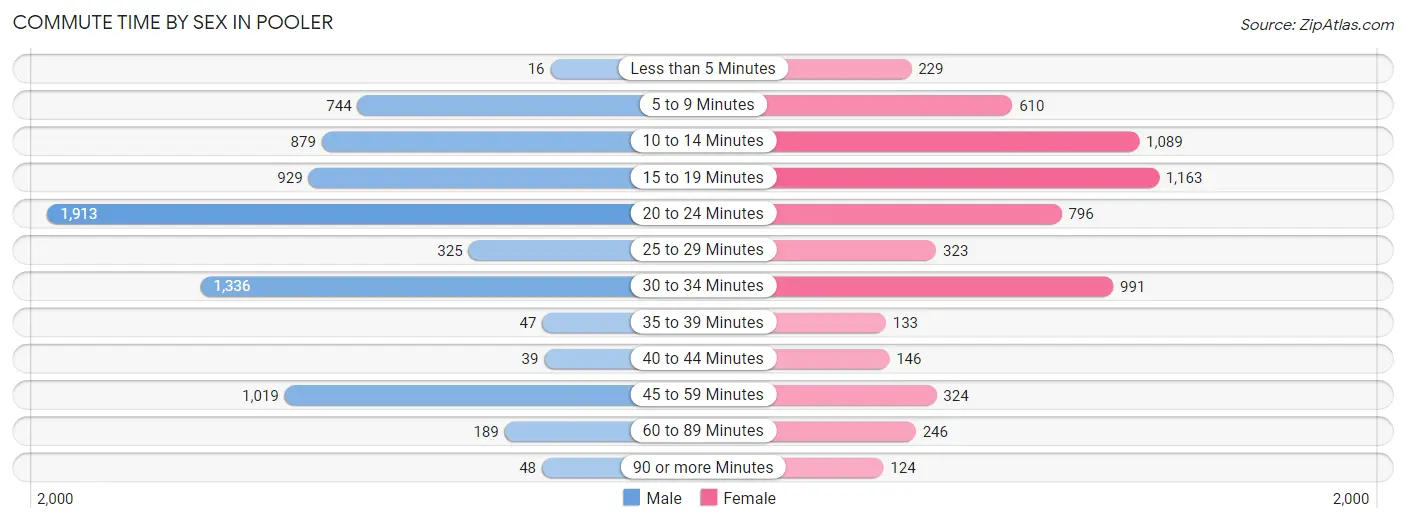
| Commute Time | Male | Female |
| Less than 5 Minutes | 16 (0.2%) | 229 (3.7%) |
| 5 to 9 Minutes | 744 (9.9%) | 610 (9.9%) |
| 10 to 14 Minutes | 879 (11.7%) | 1,089 (17.6%) |
| 15 to 19 Minutes | 929 (12.4%) | 1,163 (18.8%) |
| 20 to 24 Minutes | 1,913 (25.6%) | 796 (12.9%) |
| 25 to 29 Minutes | 325 (4.3%) | 323 (5.2%) |
| 30 to 34 Minutes | 1,336 (17.8%) | 991 (16.1%) |
| 35 to 39 Minutes | 47 (0.6%) | 133 (2.1%) |
| 40 to 44 Minutes | 39 (0.5%) | 146 (2.4%) |
| 45 to 59 Minutes | 1,019 (13.6%) | 324 (5.2%) |
| 60 to 89 Minutes | 189 (2.5%) | 246 (4.0%) |
| 90 or more Minutes | 48 (0.6%) | 124 (2.0%) |
Time of Departure to Work by Sex in Pooler
The most frequent times of departure to work in Pooler are 7:00 AM to 7:29 AM (1,593, 21.3%) for males and 7:00 AM to 7:29 AM (1,163, 18.8%) for females.
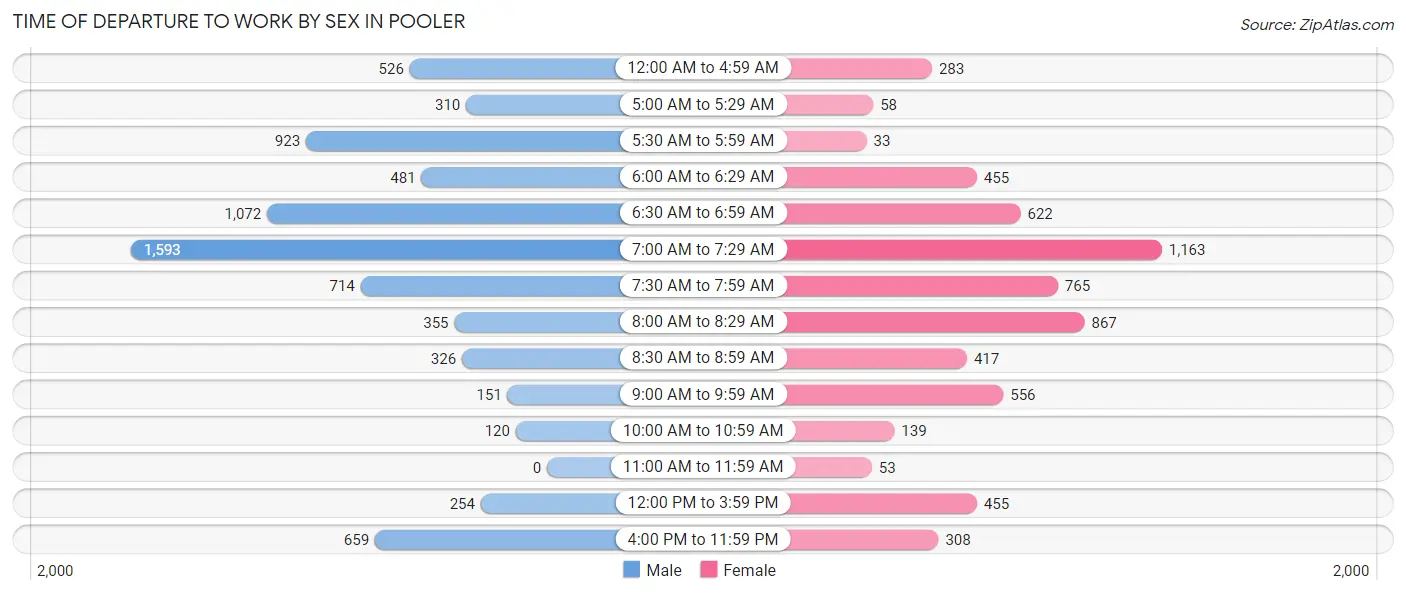
| Time of Departure | Male | Female |
| 12:00 AM to 4:59 AM | 526 (7.0%) | 283 (4.6%) |
| 5:00 AM to 5:29 AM | 310 (4.1%) | 58 (0.9%) |
| 5:30 AM to 5:59 AM | 923 (12.3%) | 33 (0.5%) |
| 6:00 AM to 6:29 AM | 481 (6.4%) | 455 (7.4%) |
| 6:30 AM to 6:59 AM | 1,072 (14.3%) | 622 (10.1%) |
| 7:00 AM to 7:29 AM | 1,593 (21.3%) | 1,163 (18.8%) |
| 7:30 AM to 7:59 AM | 714 (9.5%) | 765 (12.4%) |
| 8:00 AM to 8:29 AM | 355 (4.7%) | 867 (14.0%) |
| 8:30 AM to 8:59 AM | 326 (4.4%) | 417 (6.8%) |
| 9:00 AM to 9:59 AM | 151 (2.0%) | 556 (9.0%) |
| 10:00 AM to 10:59 AM | 120 (1.6%) | 139 (2.2%) |
| 11:00 AM to 11:59 AM | 0 (0.0%) | 53 (0.9%) |
| 12:00 PM to 3:59 PM | 254 (3.4%) | 455 (7.4%) |
| 4:00 PM to 11:59 PM | 659 (8.8%) | 308 (5.0%) |
| Total | 7,484 (100.0%) | 6,174 (100.0%) |
Housing Occupancy in Pooler
Occupancy by Ownership in Pooler
Of the total 10,752 dwellings in Pooler, owner-occupied units account for 6,509 (60.5%), while renter-occupied units make up 4,243 (39.5%).
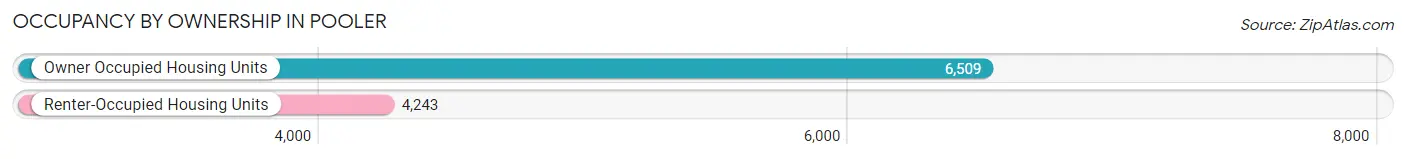
| Occupancy | # Housing Units | % Housing Units |
| Owner Occupied Housing Units | 6,509 | 60.5% |
| Renter-Occupied Housing Units | 4,243 | 39.5% |
| Total Occupied Housing Units | 10,752 | 100.0% |
Occupancy by Household Size in Pooler
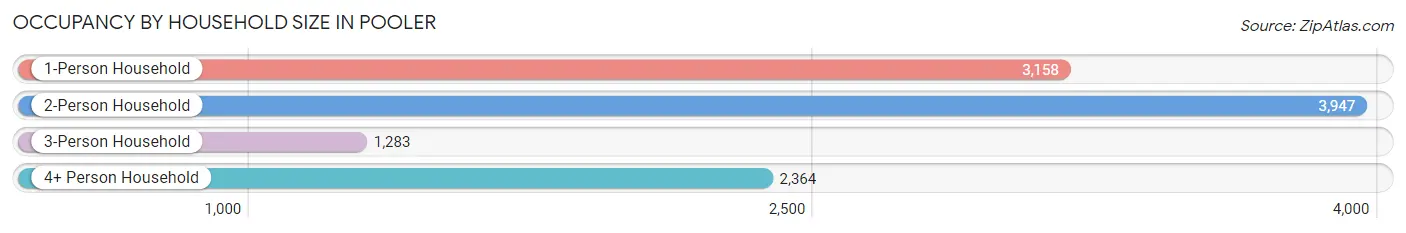
| Household Size | # Housing Units | % Housing Units |
| 1-Person Household | 3,158 | 29.4% |
| 2-Person Household | 3,947 | 36.7% |
| 3-Person Household | 1,283 | 11.9% |
| 4+ Person Household | 2,364 | 22.0% |
| Total Housing Units | 10,752 | 100.0% |
Occupancy by Ownership by Household Size in Pooler
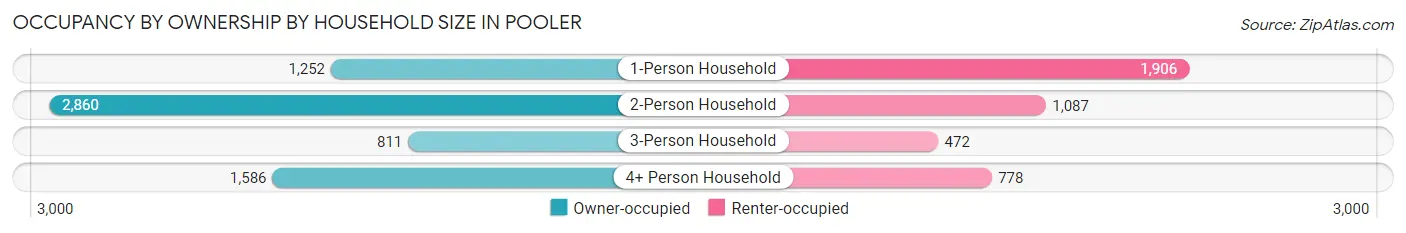
| Household Size | Owner-occupied | Renter-occupied |
| 1-Person Household | 1,252 (39.7%) | 1,906 (60.4%) |
| 2-Person Household | 2,860 (72.5%) | 1,087 (27.5%) |
| 3-Person Household | 811 (63.2%) | 472 (36.8%) |
| 4+ Person Household | 1,586 (67.1%) | 778 (32.9%) |
| Total Housing Units | 6,509 (60.5%) | 4,243 (39.5%) |
Occupancy by Educational Attainment in Pooler
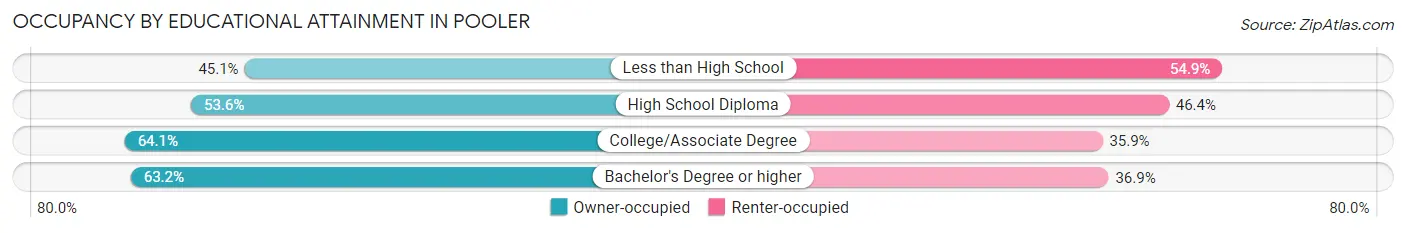
| Household Size | Owner-occupied | Renter-occupied |
| Less than High School | 292 (45.1%) | 355 (54.9%) |
| High School Diploma | 1,106 (53.6%) | 958 (46.4%) |
| College/Associate Degree | 2,229 (64.1%) | 1,248 (35.9%) |
| Bachelor's Degree or higher | 2,882 (63.1%) | 1,682 (36.8%) |
Occupancy by Age of Householder in Pooler
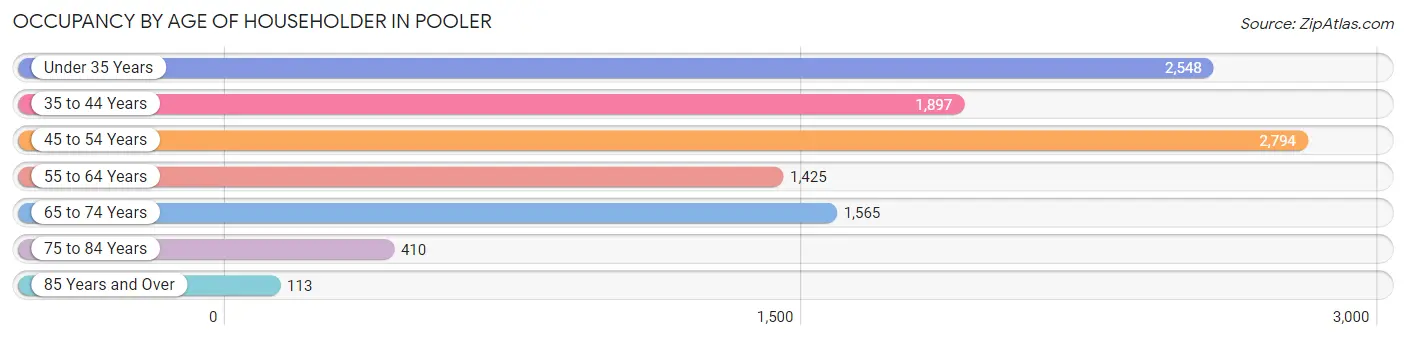
| Age Bracket | # Households | % Households |
| Under 35 Years | 2,548 | 23.7% |
| 35 to 44 Years | 1,897 | 17.6% |
| 45 to 54 Years | 2,794 | 26.0% |
| 55 to 64 Years | 1,425 | 13.3% |
| 65 to 74 Years | 1,565 | 14.6% |
| 75 to 84 Years | 410 | 3.8% |
| 85 Years and Over | 113 | 1.1% |
| Total | 10,752 | 100.0% |
Housing Finances in Pooler
Median Income by Occupancy in Pooler
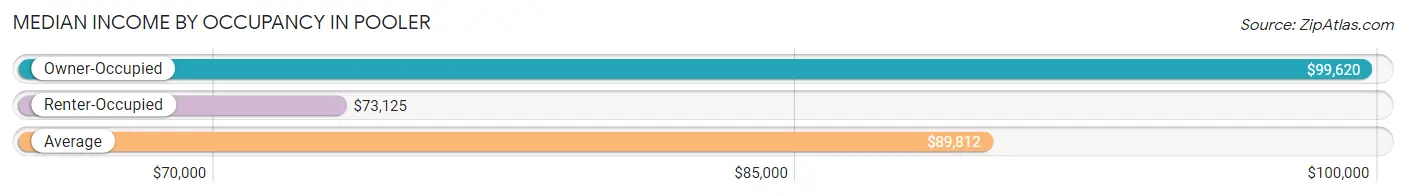
| Occupancy Type | # Households | Median Income |
| Owner-Occupied | 6,509 (60.5%) | $99,620 |
| Renter-Occupied | 4,243 (39.5%) | $73,125 |
| Average | 10,752 (100.0%) | $89,812 |
Occupancy by Householder Income Bracket in Pooler
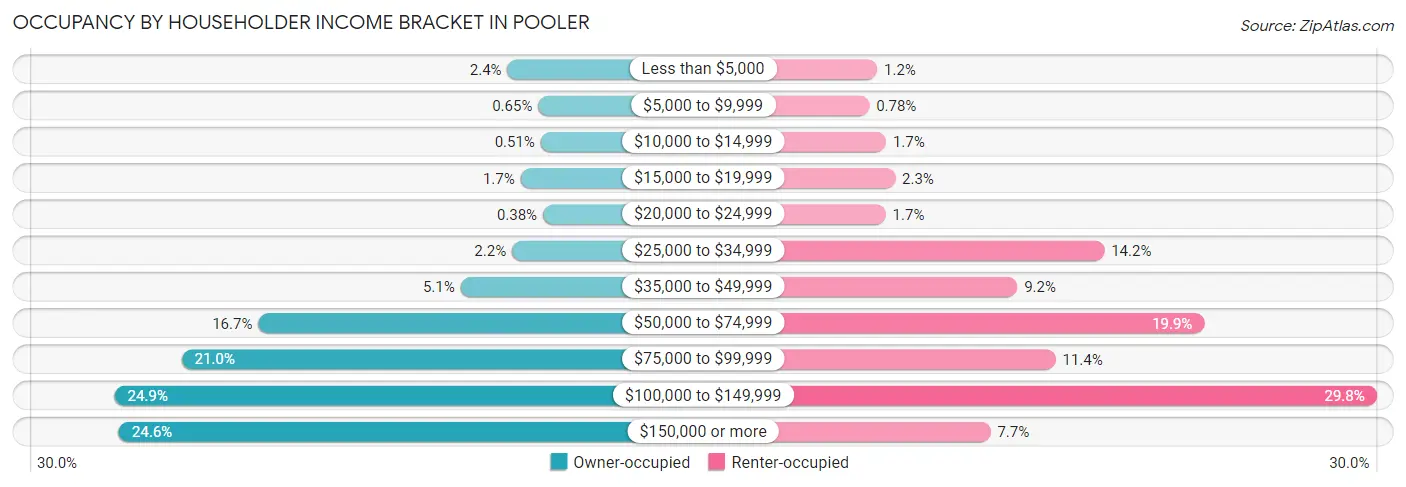
| Income Bracket | Owner-occupied | Renter-occupied |
| Less than $5,000 | 157 (2.4%) | 52 (1.2%) |
| $5,000 to $9,999 | 42 (0.6%) | 33 (0.8%) |
| $10,000 to $14,999 | 33 (0.5%) | 74 (1.7%) |
| $15,000 to $19,999 | 108 (1.7%) | 96 (2.3%) |
| $20,000 to $24,999 | 25 (0.4%) | 73 (1.7%) |
| $25,000 to $34,999 | 140 (2.1%) | 603 (14.2%) |
| $35,000 to $49,999 | 331 (5.1%) | 392 (9.2%) |
| $50,000 to $74,999 | 1,084 (16.7%) | 845 (19.9%) |
| $75,000 to $99,999 | 1,369 (21.0%) | 485 (11.4%) |
| $100,000 to $149,999 | 1,618 (24.9%) | 1,263 (29.8%) |
| $150,000 or more | 1,602 (24.6%) | 327 (7.7%) |
| Total | 6,509 (100.0%) | 4,243 (100.0%) |
Monthly Housing Cost Tiers in Pooler
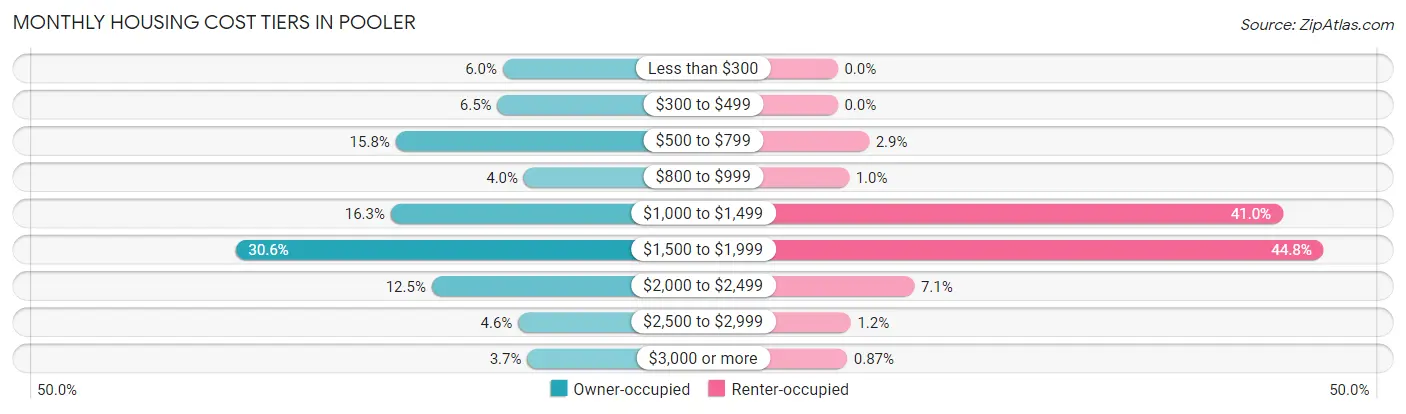
| Monthly Cost | Owner-occupied | Renter-occupied |
| Less than $300 | 389 (6.0%) | 0 (0.0%) |
| $300 to $499 | 421 (6.5%) | 0 (0.0%) |
| $500 to $799 | 1,031 (15.8%) | 122 (2.9%) |
| $800 to $999 | 263 (4.0%) | 44 (1.0%) |
| $1,000 to $1,499 | 1,060 (16.3%) | 1,740 (41.0%) |
| $1,500 to $1,999 | 1,991 (30.6%) | 1,899 (44.8%) |
| $2,000 to $2,499 | 815 (12.5%) | 299 (7.0%) |
| $2,500 to $2,999 | 297 (4.6%) | 51 (1.2%) |
| $3,000 or more | 242 (3.7%) | 37 (0.9%) |
| Total | 6,509 (100.0%) | 4,243 (100.0%) |
Physical Housing Characteristics in Pooler
Housing Structures in Pooler
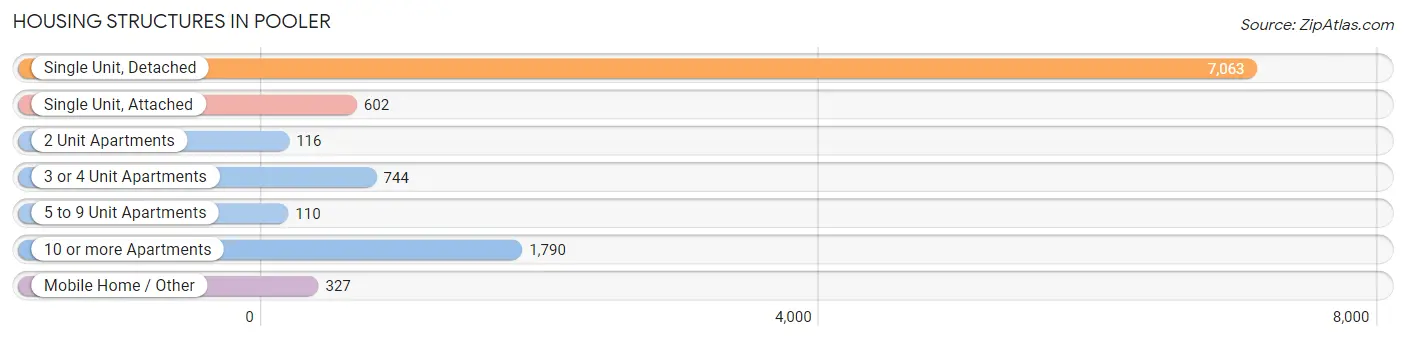
| Structure Type | # Housing Units | % Housing Units |
| Single Unit, Detached | 7,063 | 65.7% |
| Single Unit, Attached | 602 | 5.6% |
| 2 Unit Apartments | 116 | 1.1% |
| 3 or 4 Unit Apartments | 744 | 6.9% |
| 5 to 9 Unit Apartments | 110 | 1.0% |
| 10 or more Apartments | 1,790 | 16.7% |
| Mobile Home / Other | 327 | 3.0% |
| Total | 10,752 | 100.0% |
Housing Structures by Occupancy in Pooler
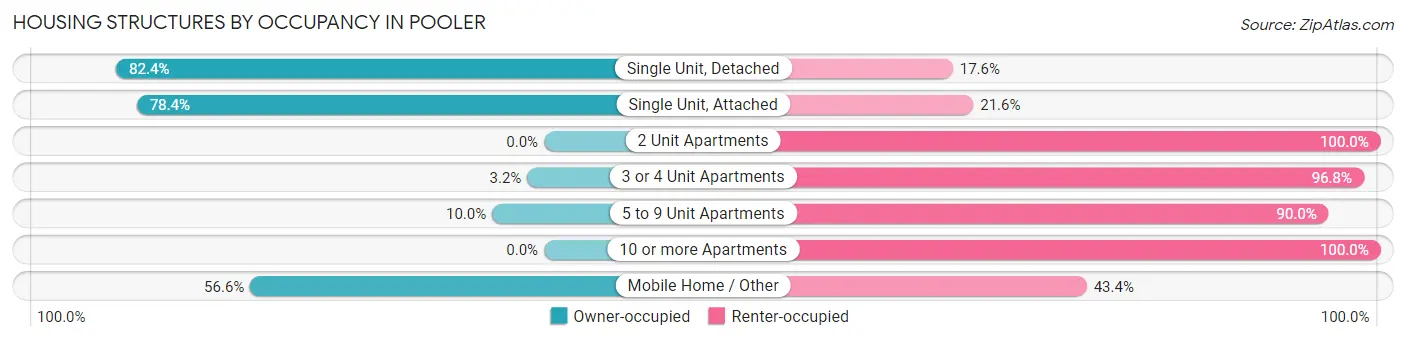
| Structure Type | Owner-occupied | Renter-occupied |
| Single Unit, Detached | 5,817 (82.4%) | 1,246 (17.6%) |
| Single Unit, Attached | 472 (78.4%) | 130 (21.6%) |
| 2 Unit Apartments | 0 (0.0%) | 116 (100.0%) |
| 3 or 4 Unit Apartments | 24 (3.2%) | 720 (96.8%) |
| 5 to 9 Unit Apartments | 11 (10.0%) | 99 (90.0%) |
| 10 or more Apartments | 0 (0.0%) | 1,790 (100.0%) |
| Mobile Home / Other | 185 (56.6%) | 142 (43.4%) |
| Total | 6,509 (60.5%) | 4,243 (39.5%) |
Housing Structures by Number of Rooms in Pooler
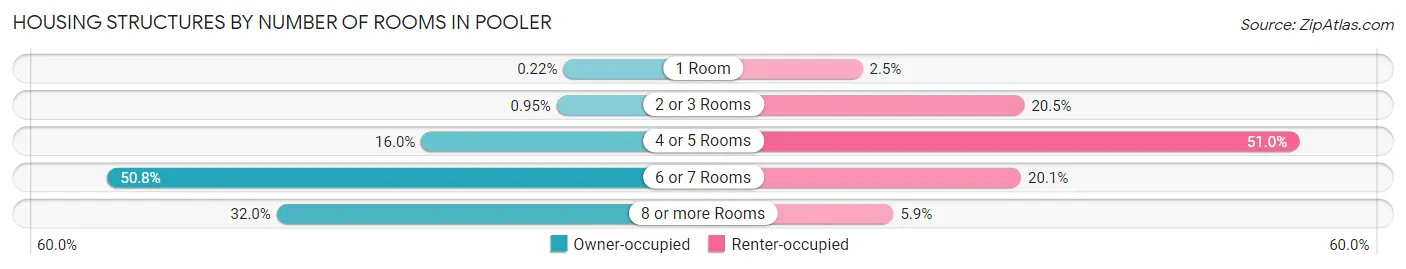
| Number of Rooms | Owner-occupied | Renter-occupied |
| 1 Room | 14 (0.2%) | 107 (2.5%) |
| 2 or 3 Rooms | 62 (0.9%) | 869 (20.5%) |
| 4 or 5 Rooms | 1,041 (16.0%) | 2,162 (50.9%) |
| 6 or 7 Rooms | 3,307 (50.8%) | 853 (20.1%) |
| 8 or more Rooms | 2,085 (32.0%) | 252 (5.9%) |
| Total | 6,509 (100.0%) | 4,243 (100.0%) |
Housing Structure by Heating Type in Pooler
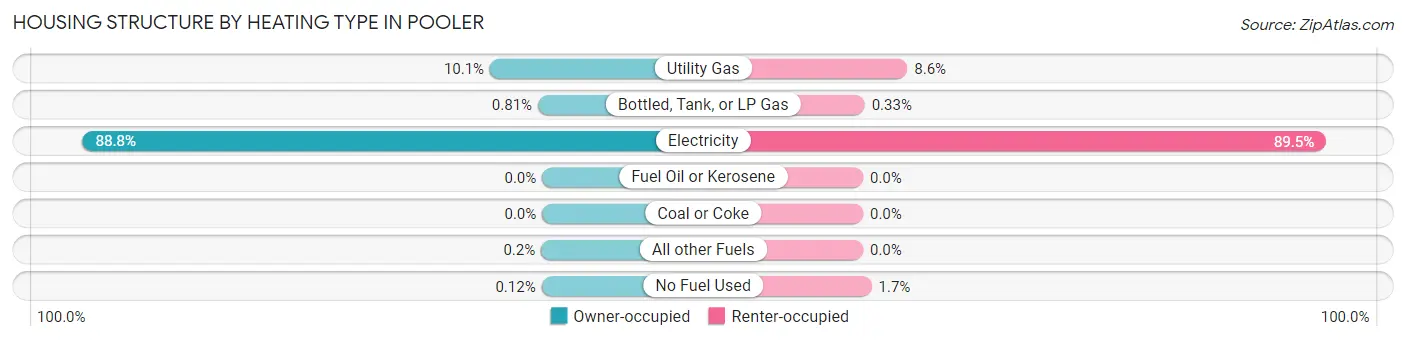
| Heating Type | Owner-occupied | Renter-occupied |
| Utility Gas | 656 (10.1%) | 363 (8.6%) |
| Bottled, Tank, or LP Gas | 53 (0.8%) | 14 (0.3%) |
| Electricity | 5,779 (88.8%) | 3,796 (89.5%) |
| Fuel Oil or Kerosene | 0 (0.0%) | 0 (0.0%) |
| Coal or Coke | 0 (0.0%) | 0 (0.0%) |
| All other Fuels | 13 (0.2%) | 0 (0.0%) |
| No Fuel Used | 8 (0.1%) | 70 (1.7%) |
| Total | 6,509 (100.0%) | 4,243 (100.0%) |
Household Vehicle Usage in Pooler
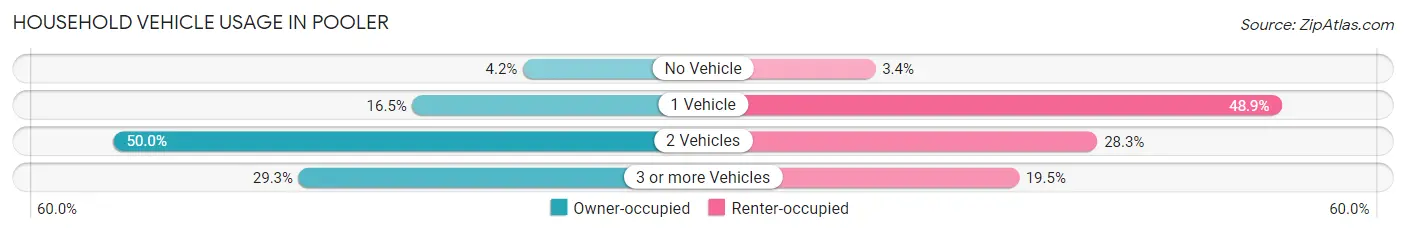
| Vehicles per Household | Owner-occupied | Renter-occupied |
| No Vehicle | 270 (4.2%) | 144 (3.4%) |
| 1 Vehicle | 1,076 (16.5%) | 2,074 (48.9%) |
| 2 Vehicles | 3,257 (50.0%) | 1,199 (28.3%) |
| 3 or more Vehicles | 1,906 (29.3%) | 826 (19.5%) |
| Total | 6,509 (100.0%) | 4,243 (100.0%) |
Real Estate & Mortgages in Pooler
Real Estate and Mortgage Overview in Pooler
| Characteristic | Without Mortgage | With Mortgage |
| Housing Units | 1,830 | 4,679 |
| Median Property Value | $243,000 | $277,400 |
| Median Household Income | $87,663 | $1,360 |
| Monthly Housing Costs | $542 | $242 |
| Real Estate Taxes | $2,027 | $32 |
Property Value by Mortgage Status in Pooler
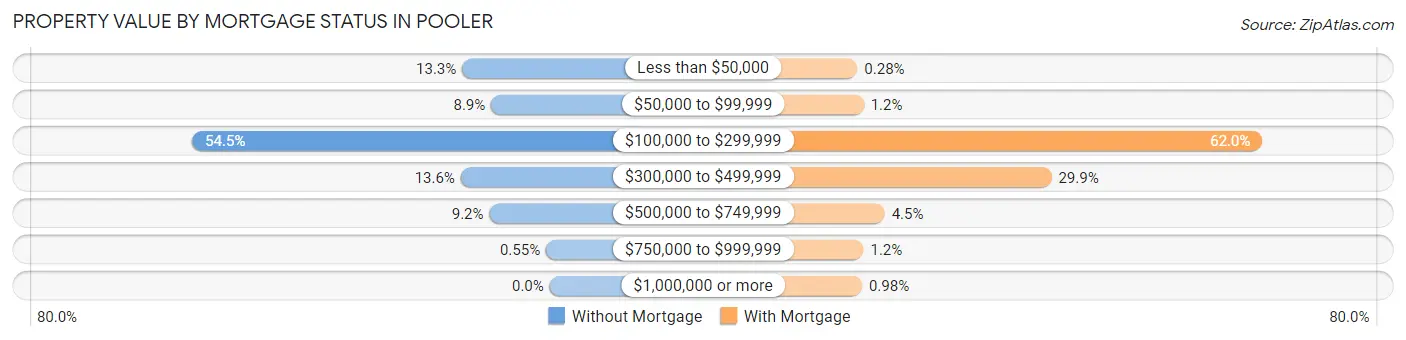
| Property Value | Without Mortgage | With Mortgage |
| Less than $50,000 | 244 (13.3%) | 13 (0.3%) |
| $50,000 to $99,999 | 163 (8.9%) | 58 (1.2%) |
| $100,000 to $299,999 | 997 (54.5%) | 2,900 (62.0%) |
| $300,000 to $499,999 | 248 (13.6%) | 1,397 (29.9%) |
| $500,000 to $749,999 | 168 (9.2%) | 208 (4.4%) |
| $750,000 to $999,999 | 10 (0.5%) | 57 (1.2%) |
| $1,000,000 or more | 0 (0.0%) | 46 (1.0%) |
| Total | 1,830 (100.0%) | 4,679 (100.0%) |
Household Income by Mortgage Status in Pooler
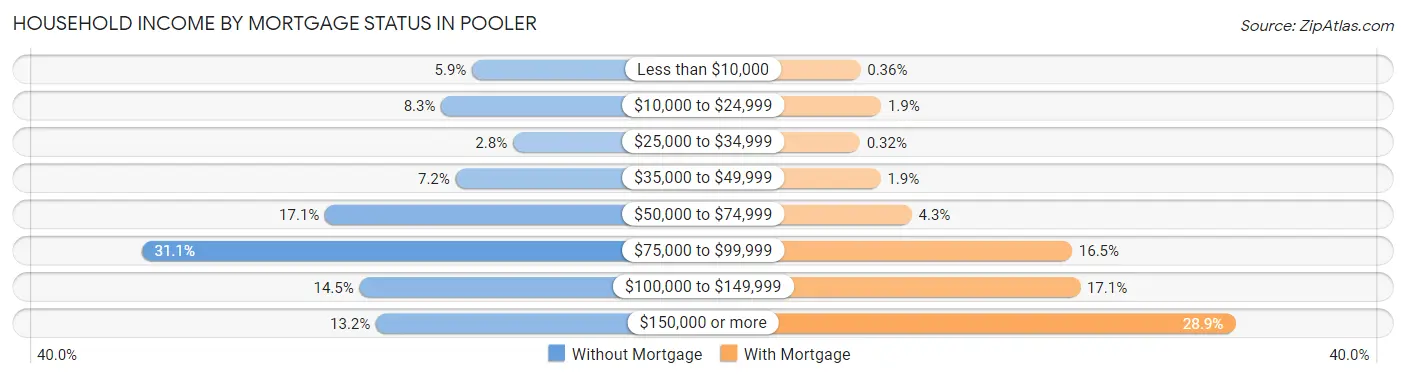
| Household Income | Without Mortgage | With Mortgage |
| Less than $10,000 | 108 (5.9%) | 17 (0.4%) |
| $10,000 to $24,999 | 151 (8.3%) | 91 (1.9%) |
| $25,000 to $34,999 | 51 (2.8%) | 15 (0.3%) |
| $35,000 to $49,999 | 131 (7.2%) | 89 (1.9%) |
| $50,000 to $74,999 | 313 (17.1%) | 200 (4.3%) |
| $75,000 to $99,999 | 569 (31.1%) | 771 (16.5%) |
| $100,000 to $149,999 | 265 (14.5%) | 800 (17.1%) |
| $150,000 or more | 242 (13.2%) | 1,353 (28.9%) |
| Total | 1,830 (100.0%) | 4,679 (100.0%) |
Property Value to Household Income Ratio in Pooler
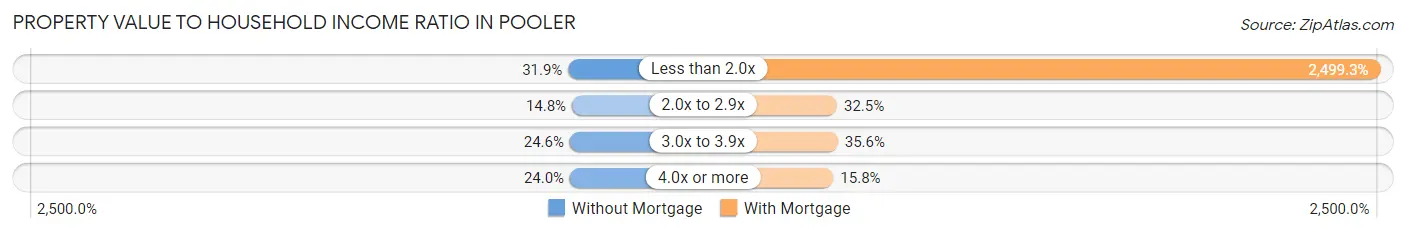
| Value-to-Income Ratio | Without Mortgage | With Mortgage |
| Less than 2.0x | 584 (31.9%) | 116,941 (2,499.3%) |
| 2.0x to 2.9x | 271 (14.8%) | 1,520 (32.5%) |
| 3.0x to 3.9x | 451 (24.6%) | 1,664 (35.6%) |
| 4.0x or more | 439 (24.0%) | 737 (15.8%) |
| Total | 1,830 (100.0%) | 4,679 (100.0%) |
Real Estate Taxes by Mortgage Status in Pooler
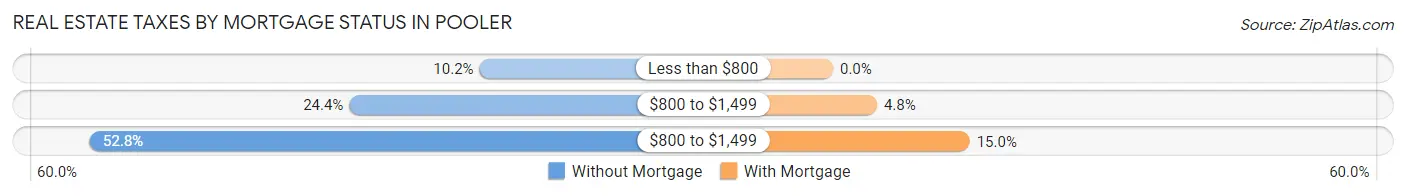
| Property Taxes | Without Mortgage | With Mortgage |
| Less than $800 | 186 (10.2%) | 0 (0.0%) |
| $800 to $1,499 | 447 (24.4%) | 225 (4.8%) |
| $800 to $1,499 | 967 (52.8%) | 701 (15.0%) |
| Total | 1,830 (100.0%) | 4,679 (100.0%) |
Health & Disability in Pooler
Health Insurance Coverage by Age in Pooler
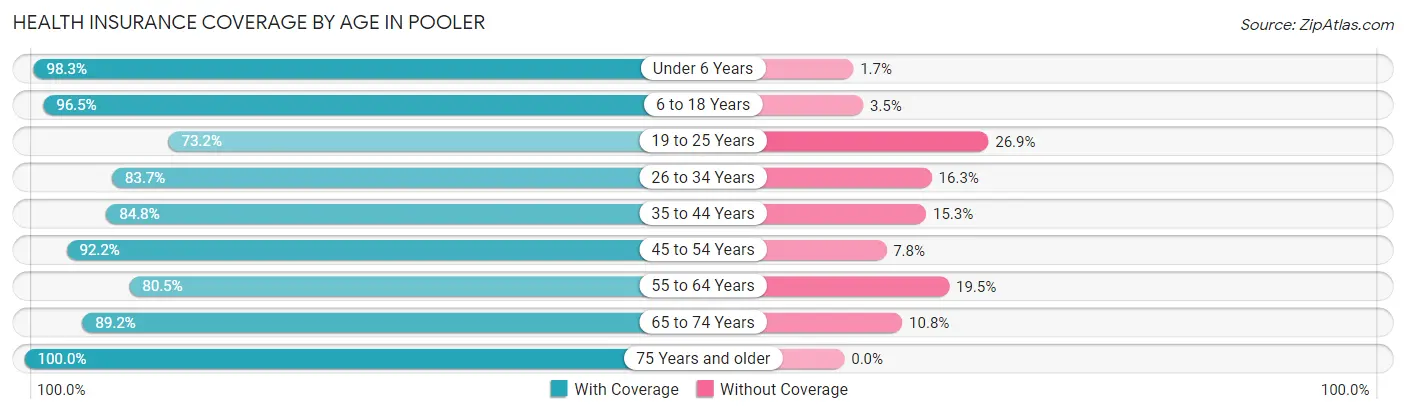
| Age Bracket | With Coverage | Without Coverage |
| Under 6 Years | 1,645 (98.3%) | 28 (1.7%) |
| 6 to 18 Years | 4,056 (96.5%) | 147 (3.5%) |
| 19 to 25 Years | 1,264 (73.2%) | 464 (26.9%) |
| 26 to 34 Years | 3,078 (83.7%) | 599 (16.3%) |
| 35 to 44 Years | 3,063 (84.8%) | 551 (15.2%) |
| 45 to 54 Years | 4,095 (92.2%) | 347 (7.8%) |
| 55 to 64 Years | 2,121 (80.5%) | 515 (19.5%) |
| 65 to 74 Years | 2,332 (89.2%) | 282 (10.8%) |
| 75 Years and older | 773 (100.0%) | 0 (0.0%) |
| Total | 22,427 (88.4%) | 2,933 (11.6%) |
Health Insurance Coverage by Citizenship Status in Pooler
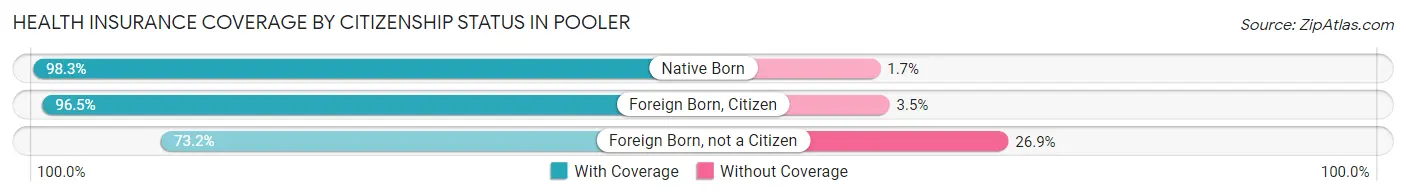
| Citizenship Status | With Coverage | Without Coverage |
| Native Born | 1,645 (98.3%) | 28 (1.7%) |
| Foreign Born, Citizen | 4,056 (96.5%) | 147 (3.5%) |
| Foreign Born, not a Citizen | 1,264 (73.2%) | 464 (26.9%) |
Health Insurance Coverage by Household Income in Pooler
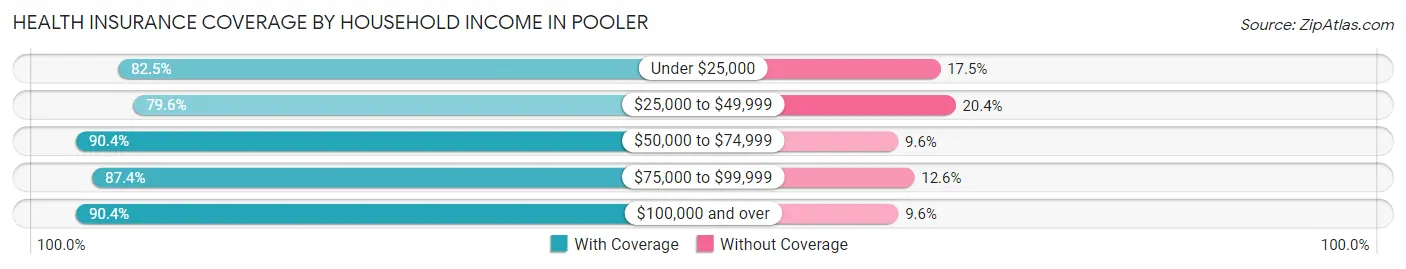
| Household Income | With Coverage | Without Coverage |
| Under $25,000 | 858 (82.5%) | 182 (17.5%) |
| $25,000 to $49,999 | 2,022 (79.6%) | 517 (20.4%) |
| $50,000 to $74,999 | 3,148 (90.4%) | 335 (9.6%) |
| $75,000 to $99,999 | 3,968 (87.4%) | 574 (12.6%) |
| $100,000 and over | 12,428 (90.4%) | 1,325 (9.6%) |
Public vs Private Health Insurance Coverage by Age in Pooler
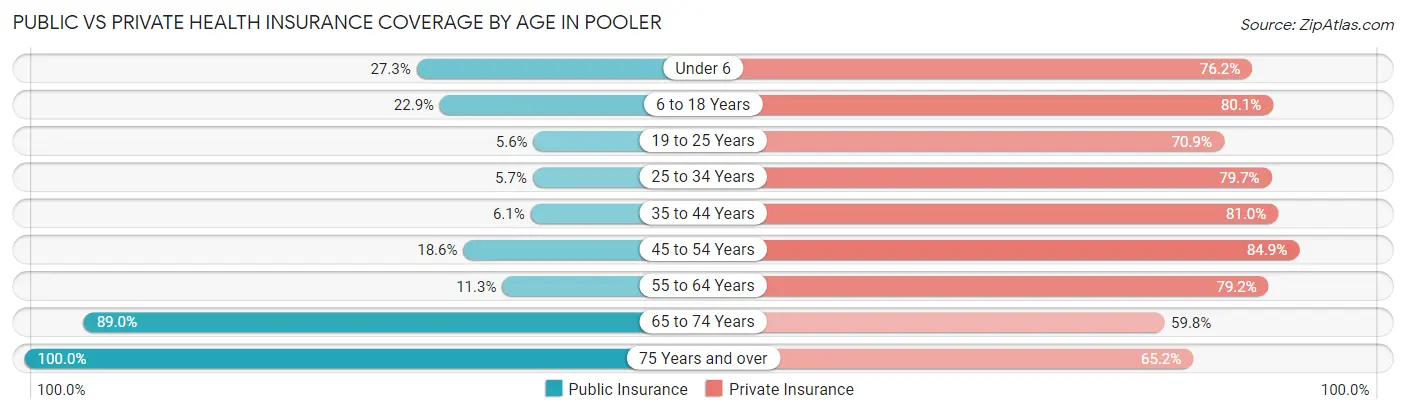
| Age Bracket | Public Insurance | Private Insurance |
| Under 6 | 456 (27.3%) | 1,274 (76.1%) |
| 6 to 18 Years | 963 (22.9%) | 3,365 (80.1%) |
| 19 to 25 Years | 96 (5.6%) | 1,225 (70.9%) |
| 25 to 34 Years | 209 (5.7%) | 2,932 (79.7%) |
| 35 to 44 Years | 220 (6.1%) | 2,926 (81.0%) |
| 45 to 54 Years | 825 (18.6%) | 3,769 (84.9%) |
| 55 to 64 Years | 299 (11.3%) | 2,088 (79.2%) |
| 65 to 74 Years | 2,327 (89.0%) | 1,564 (59.8%) |
| 75 Years and over | 773 (100.0%) | 504 (65.2%) |
| Total | 6,168 (24.3%) | 19,647 (77.5%) |
Disability Status by Sex by Age in Pooler
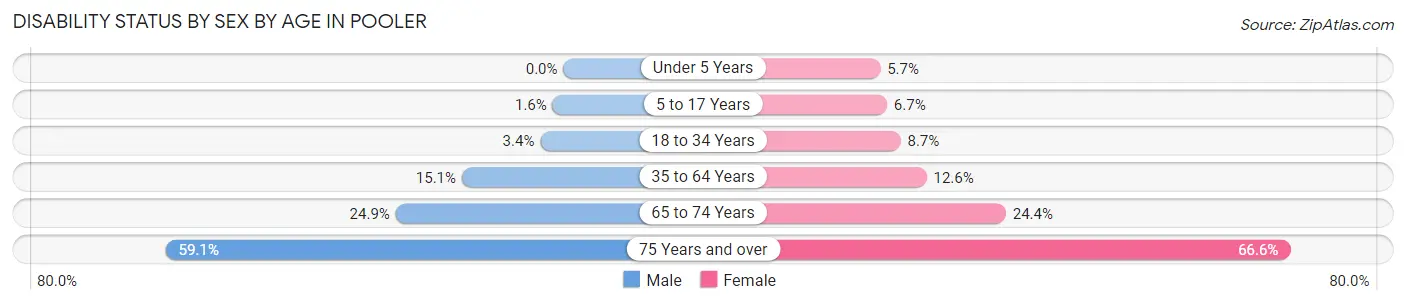
| Age Bracket | Male | Female |
| Under 5 Years | 0 (0.0%) | 36 (5.7%) |
| 5 to 17 Years | 37 (1.6%) | 139 (6.7%) |
| 18 to 34 Years | 98 (3.4%) | 242 (8.7%) |
| 35 to 64 Years | 784 (15.1%) | 691 (12.6%) |
| 65 to 74 Years | 298 (24.9%) | 345 (24.3%) |
| 75 Years and over | 241 (59.1%) | 243 (66.6%) |
Disability Class by Sex by Age in Pooler
Disability Class: Hearing Difficulty
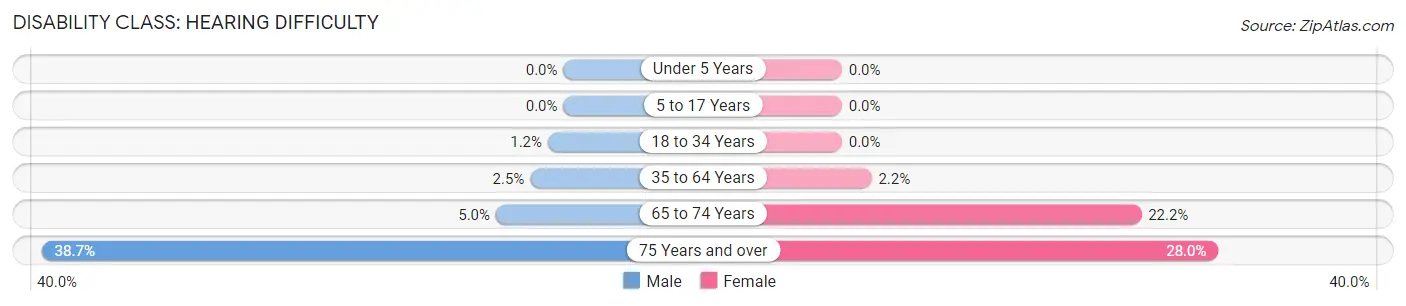
| Age Bracket | Male | Female |
| Under 5 Years | 0 (0.0%) | 0 (0.0%) |
| 5 to 17 Years | 0 (0.0%) | 0 (0.0%) |
| 18 to 34 Years | 33 (1.1%) | 0 (0.0%) |
| 35 to 64 Years | 128 (2.5%) | 121 (2.2%) |
| 65 to 74 Years | 60 (5.0%) | 315 (22.2%) |
| 75 Years and over | 158 (38.7%) | 102 (28.0%) |
Disability Class: Vision Difficulty
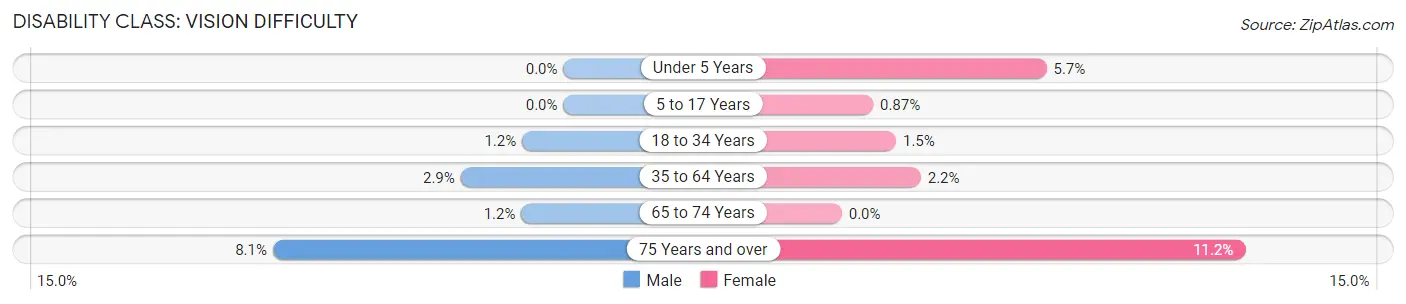
| Age Bracket | Male | Female |
| Under 5 Years | 0 (0.0%) | 36 (5.7%) |
| 5 to 17 Years | 0 (0.0%) | 18 (0.9%) |
| 18 to 34 Years | 33 (1.1%) | 42 (1.5%) |
| 35 to 64 Years | 149 (2.9%) | 121 (2.2%) |
| 65 to 74 Years | 14 (1.2%) | 0 (0.0%) |
| 75 Years and over | 33 (8.1%) | 41 (11.2%) |
Disability Class: Cognitive Difficulty
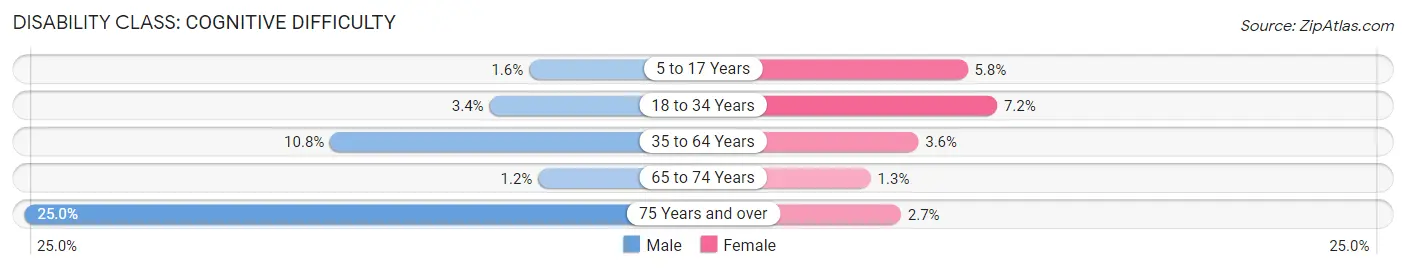
| Age Bracket | Male | Female |
| 5 to 17 Years | 37 (1.6%) | 121 (5.8%) |
| 18 to 34 Years | 98 (3.4%) | 200 (7.2%) |
| 35 to 64 Years | 563 (10.8%) | 195 (3.5%) |
| 65 to 74 Years | 14 (1.2%) | 19 (1.3%) |
| 75 Years and over | 102 (25.0%) | 10 (2.7%) |
Disability Class: Ambulatory Difficulty
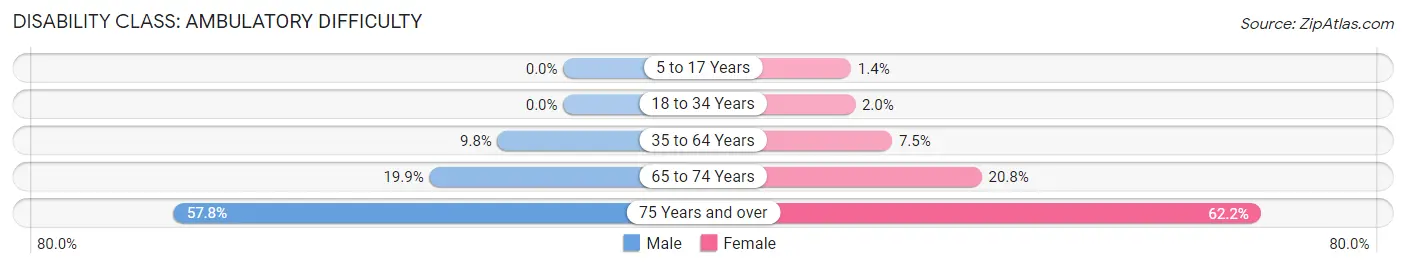
| Age Bracket | Male | Female |
| 5 to 17 Years | 0 (0.0%) | 28 (1.3%) |
| 18 to 34 Years | 0 (0.0%) | 54 (1.9%) |
| 35 to 64 Years | 507 (9.8%) | 409 (7.4%) |
| 65 to 74 Years | 238 (19.9%) | 294 (20.7%) |
| 75 Years and over | 236 (57.8%) | 227 (62.2%) |
Disability Class: Self-Care Difficulty
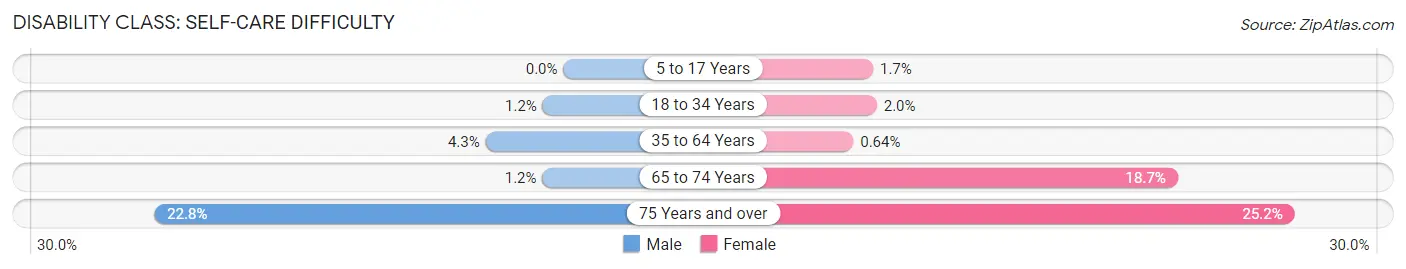
| Age Bracket | Male | Female |
| 5 to 17 Years | 0 (0.0%) | 36 (1.7%) |
| 18 to 34 Years | 33 (1.1%) | 54 (1.9%) |
| 35 to 64 Years | 225 (4.3%) | 35 (0.6%) |
| 65 to 74 Years | 14 (1.2%) | 265 (18.7%) |
| 75 Years and over | 93 (22.8%) | 92 (25.2%) |
Technology Access in Pooler
Computing Device Access in Pooler
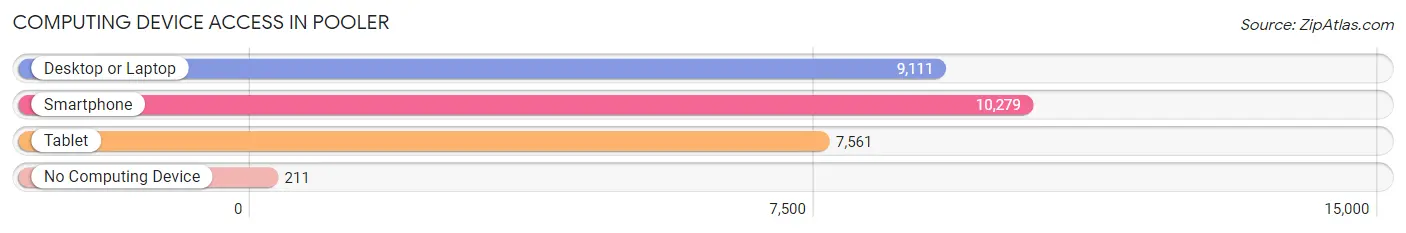
| Device Type | # Households | % Households |
| Desktop or Laptop | 9,111 | 84.7% |
| Smartphone | 10,279 | 95.6% |
| Tablet | 7,561 | 70.3% |
| No Computing Device | 211 | 2.0% |
| Total | 10,752 | 100.0% |
Internet Access in Pooler
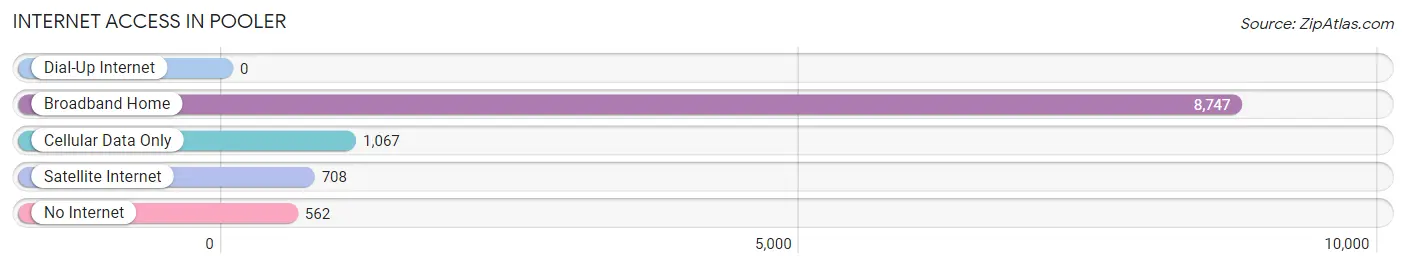
| Internet Type | # Households | % Households |
| Dial-Up Internet | 0 | 0.0% |
| Broadband Home | 8,747 | 81.4% |
| Cellular Data Only | 1,067 | 9.9% |
| Satellite Internet | 708 | 6.6% |
| No Internet | 562 | 5.2% |
| Total | 10,752 | 100.0% |
Pooler Summary
Pooler, Georgia is a small city located in Chatham County, just west of Savannah. It is part of the Savannah Metropolitan Statistical Area and is home to approximately 20,000 people. Pooler has a rich history, diverse geography, and a thriving economy.
History
Pooler was founded in 1838 by Robert William Pooler, a planter from South Carolina. He purchased the land from the Georgia Railroad and Banking Company and named the town after himself. The town was incorporated in 1907 and was primarily a farming community until the 1950s. In the 1950s, Pooler began to experience rapid growth due to the construction of the Savannah Airport and the opening of the nearby Gulfstream Aerospace Corporation. This growth continued into the 1960s and 1970s, when the city began to develop into a suburban community.
Geography
Pooler is located in the Coastal Plain region of Georgia, just west of Savannah. The city is situated on the Savannah River and is bordered by the Ogeechee River to the south. The city is home to several parks, including Pooler Park, which features a playground, walking trails, and a fishing pond. The city also has several golf courses, including the Savannah Quarters Country Club.
Economy
Pooler’s economy is largely driven by the tourism industry. The city is home to several hotels, restaurants, and shopping centers, as well as the Savannah/Hilton Head International Airport. The city is also home to several large employers, including Gulfstream Aerospace Corporation, JCB, and Great Dane Trailers.
Demographics
As of the 2010 census, Pooler had a population of 19,140. The racial makeup of the city was 73.3% White, 17.2% African American, 0.5% Native American, 2.7% Asian, and 5.3% from other races. The median household income was $50,945, and the median family income was $60,945. The city’s population is largely educated, with 87.3% of the population over the age of 25 having a high school diploma or higher.
Pooler is a vibrant city with a rich history, diverse geography, and a thriving economy. The city is home to a diverse population and is a great place to live, work, and play.
Common Questions
What is Per Capita Income in Pooler?
Per Capita income in Pooler is $42,438.
What is the Median Family Income in Pooler?
Median Family Income in Pooler is $110,908.
What is the Median Household income in Pooler?
Median Household Income in Pooler is $89,812.
What is Income or Wage Gap in Pooler?
Income or Wage Gap in Pooler is 6.2%.
Women in Pooler earn 93.8 cents for every dollar earned by a man.
What is Inequality or Gini Index in Pooler?
Inequality or Gini Index in Pooler is 0.35.
What is the Total Population of Pooler?
Total Population of Pooler is 26,264.
What is the Total Male Population of Pooler?
Total Male Population of Pooler is 13,420.
What is the Total Female Population of Pooler?
Total Female Population of Pooler is 12,844.
What is the Ratio of Males per 100 Females in Pooler?
There are 104.48 Males per 100 Females in Pooler.
What is the Ratio of Females per 100 Males in Pooler?
There are 95.71 Females per 100 Males in Pooler.
What is the Median Population Age in Pooler?
Median Population Age in Pooler is 39.2 Years.
What is the Average Family Size in Pooler
Average Family Size in Pooler is 3.0 People.
What is the Average Household Size in Pooler
Average Household Size in Pooler is 2.4 People.
How Large is the Labor Force in Pooler?
There are 15,906 People in the Labor Forcein in Pooler.
What is the Percentage of People in the Labor Force in Pooler?
74.7% of People are in the Labor Force in Pooler.
What is the Unemployment Rate in Pooler?
Unemployment Rate in Pooler is 5.4%.