Zip Codes with the Highest Percentage of Population Employed in Architecture & Engineering in Thomasville, GA
RELATED REPORTS & OPTIONS
Architecture & Engineering
Thomasville
Compare Zip Codes
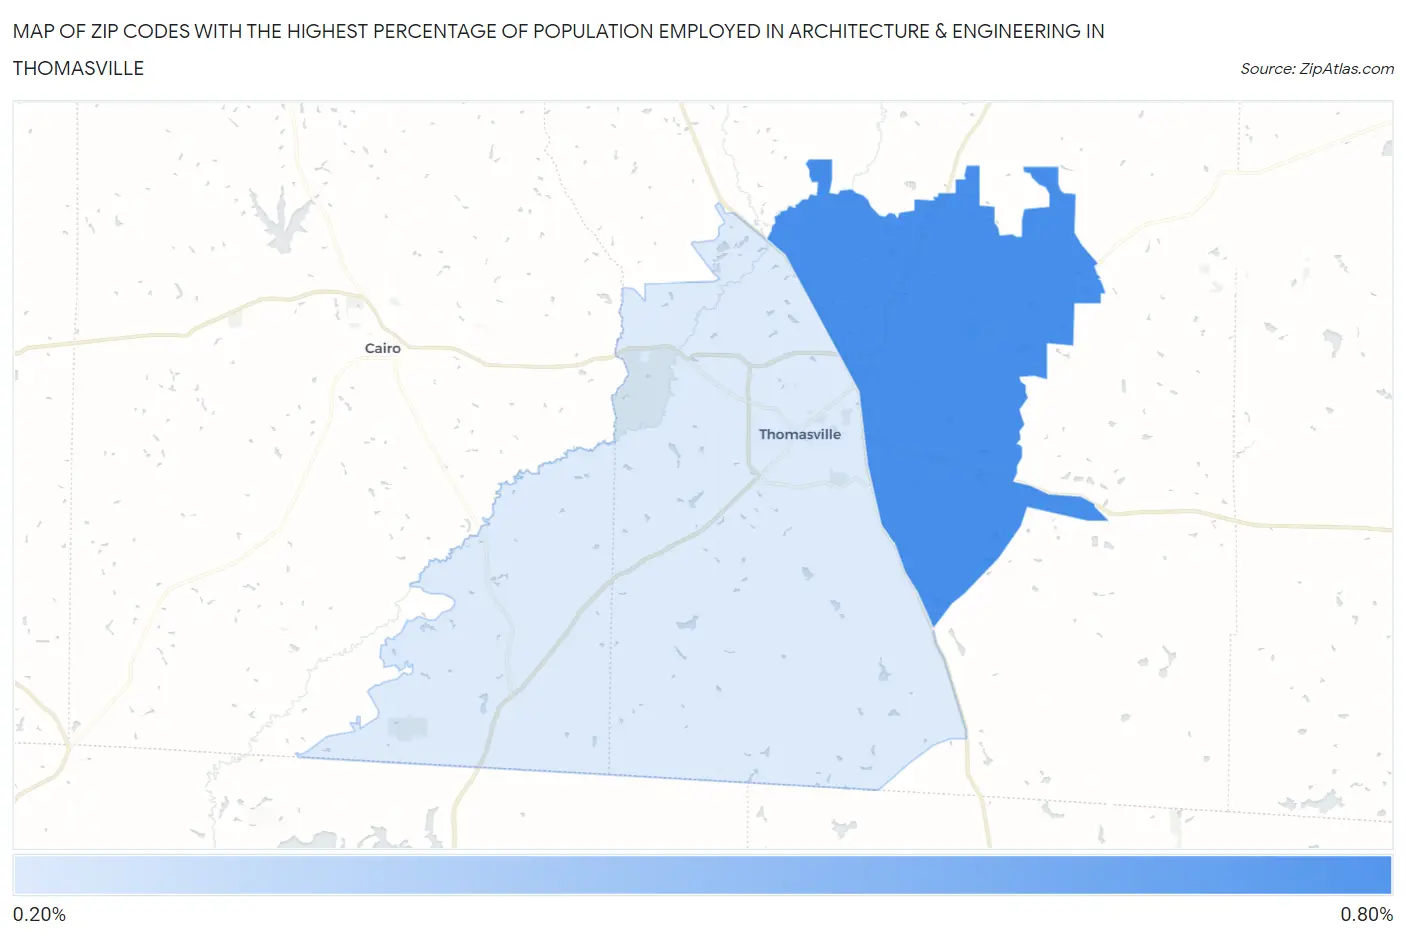
Map of Zip Codes with the Highest Percentage of Population Employed in Architecture & Engineering in Thomasville
0.30%
0.63%
Zip Codes with the Highest Percentage of Population Employed in Architecture & Engineering in Thomasville, GA
| Zip Code | % Employed | vs State | vs National | |
| 1. | 31757 | 0.63% | 1.8%(-1.16)#421 | 2.1%(-1.52)#19,379 |
| 2. | 31792 | 0.30% | 1.8%(-1.50)#477 | 2.1%(-1.85)#21,557 |
1
Common Questions
What are the Top Zip Codes with the Highest Percentage of Population Employed in Architecture & Engineering in Thomasville, GA?
Top Zip Codes with the Highest Percentage of Population Employed in Architecture & Engineering in Thomasville, GA are:
What zip code has the Highest Percentage of Population Employed in Architecture & Engineering in Thomasville, GA?
31757 has the Highest Percentage of Population Employed in Architecture & Engineering in Thomasville, GA with 0.63%.
What is the Percentage of Population Employed in Architecture & Engineering in Thomasville, GA?
Percentage of Population Employed in Architecture & Engineering in Thomasville is 0.16%.
What is the Percentage of Population Employed in Architecture & Engineering in Georgia?
Percentage of Population Employed in Architecture & Engineering in Georgia is 1.8%.
What is the Percentage of Population Employed in Architecture & Engineering in the United States?
Percentage of Population Employed in Architecture & Engineering in the United States is 2.1%.