Braselton, GA Map & Demographics
Braselton Map
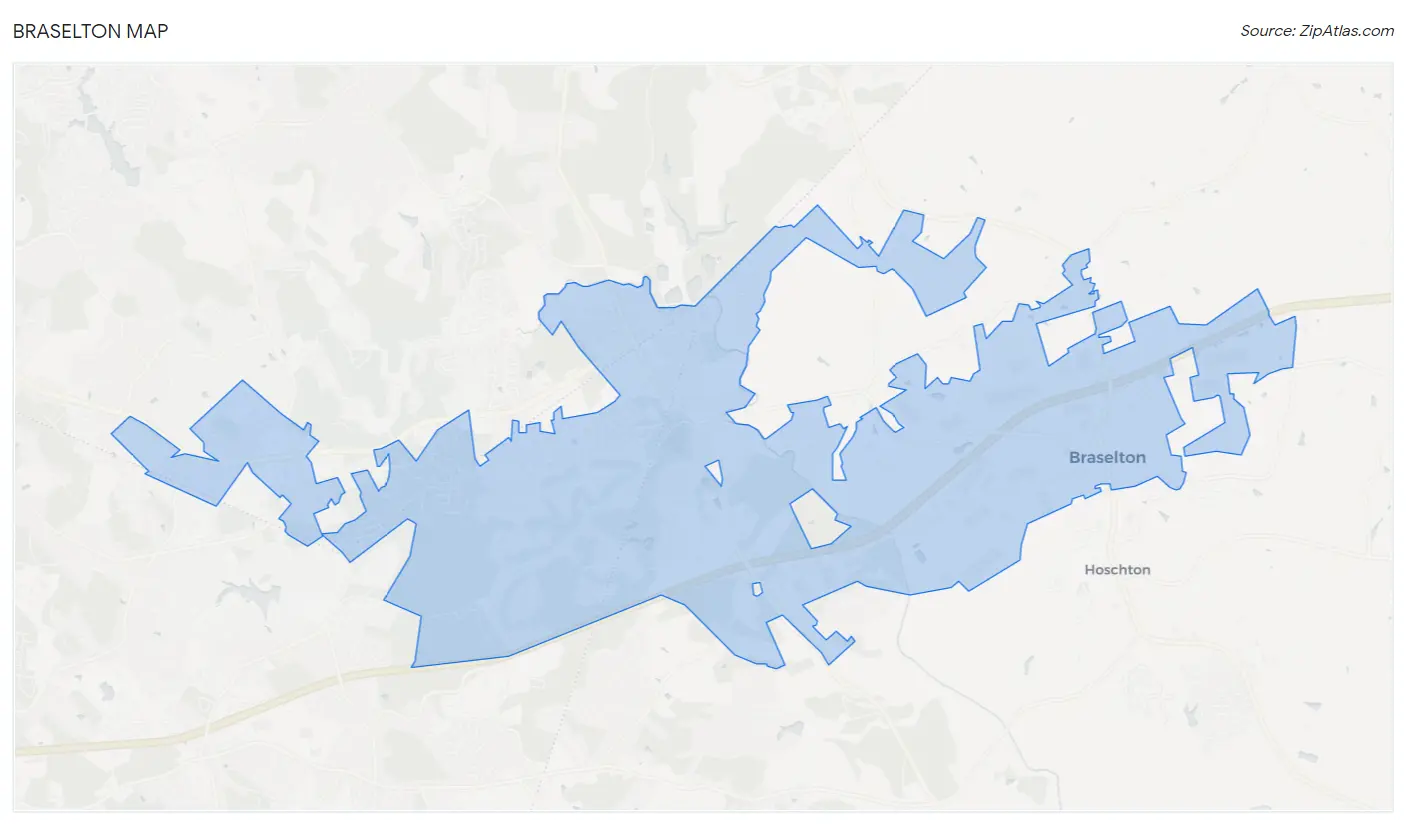
Braselton Overview
$55,465
PER CAPITA INCOME
$127,656
AVG FAMILY INCOME
$111,080
AVG HOUSEHOLD INCOME
47.1%
WAGE / INCOME GAP [ % ]
52.9¢/ $1
WAGE / INCOME GAP [ $ ]
0.45
INEQUALITY / GINI INDEX
13,804
TOTAL POPULATION
6,500
MALE POPULATION
7,304
FEMALE POPULATION
88.99
MALES / 100 FEMALES
112.37
FEMALES / 100 MALES
36.5
MEDIAN AGE
3.0
AVG FAMILY SIZE
2.7
AVG HOUSEHOLD SIZE
7,235
LABOR FORCE [ PEOPLE ]
68.9%
PERCENT IN LABOR FORCE
2.1%
UNEMPLOYMENT RATE
Braselton Zip Codes
Income in Braselton
Income Overview in Braselton
Per Capita Income in Braselton is $55,465, while median incomes of families and households are $127,656 and $111,080 respectively.
| Characteristic | Number | Measure |
| Per Capita Income | 13,804 | $55,465 |
| Median Family Income | 4,176 | $127,656 |
| Mean Family Income | 4,176 | $168,851 |
| Median Household Income | 5,070 | $111,080 |
| Mean Household Income | 5,070 | $150,408 |
| Income Deficit | 4,176 | $0 |
| Wage / Income Gap (%) | 13,804 | 47.15% |
| Wage / Income Gap ($) | 13,804 | 52.85¢ per $1 |
| Gini / Inequality Index | 13,804 | 0.45 |
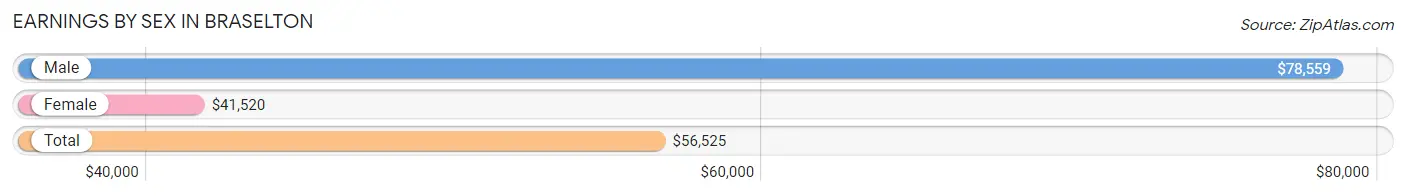
Earnings by Sex in Braselton
Average Earnings in Braselton are $56,525, $78,559 for men and $41,520 for women, a difference of 47.1%.
| Sex | Number | Average Earnings |
| Male | 3,714 (49.6%) | $78,559 |
| Female | 3,771 (50.4%) | $41,520 |
| Total | 7,485 (100.0%) | $56,525 |
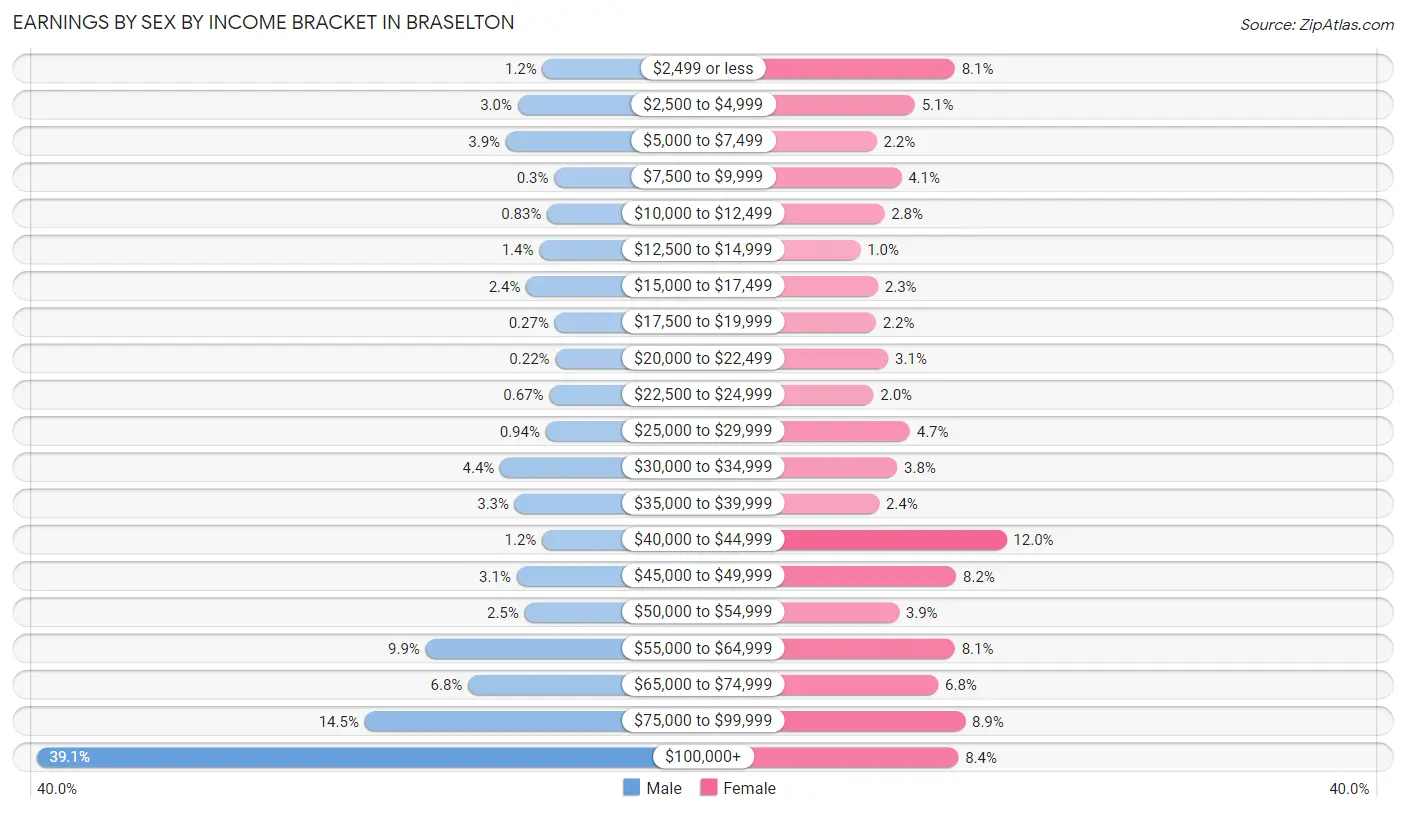
Earnings by Sex by Income Bracket in Braselton
The most common earnings brackets in Braselton are $100,000+ for men (1,452 | 39.1%) and $40,000 to $44,999 for women (451 | 12.0%).
| Income | Male | Female |
| $2,499 or less | 44 (1.2%) | 305 (8.1%) |
| $2,500 to $4,999 | 113 (3.0%) | 192 (5.1%) |
| $5,000 to $7,499 | 146 (3.9%) | 84 (2.2%) |
| $7,500 to $9,999 | 11 (0.3%) | 154 (4.1%) |
| $10,000 to $12,499 | 31 (0.8%) | 106 (2.8%) |
| $12,500 to $14,999 | 53 (1.4%) | 38 (1.0%) |
| $15,000 to $17,499 | 89 (2.4%) | 88 (2.3%) |
| $17,500 to $19,999 | 10 (0.3%) | 82 (2.2%) |
| $20,000 to $22,499 | 8 (0.2%) | 117 (3.1%) |
| $22,500 to $24,999 | 25 (0.7%) | 75 (2.0%) |
| $25,000 to $29,999 | 35 (0.9%) | 178 (4.7%) |
| $30,000 to $34,999 | 162 (4.4%) | 142 (3.8%) |
| $35,000 to $39,999 | 121 (3.3%) | 91 (2.4%) |
| $40,000 to $44,999 | 45 (1.2%) | 451 (12.0%) |
| $45,000 to $49,999 | 116 (3.1%) | 309 (8.2%) |
| $50,000 to $54,999 | 94 (2.5%) | 147 (3.9%) |
| $55,000 to $64,999 | 369 (9.9%) | 305 (8.1%) |
| $65,000 to $74,999 | 251 (6.8%) | 258 (6.8%) |
| $75,000 to $99,999 | 539 (14.5%) | 334 (8.9%) |
| $100,000+ | 1,452 (39.1%) | 315 (8.4%) |
| Total | 3,714 (100.0%) | 3,771 (100.0%) |
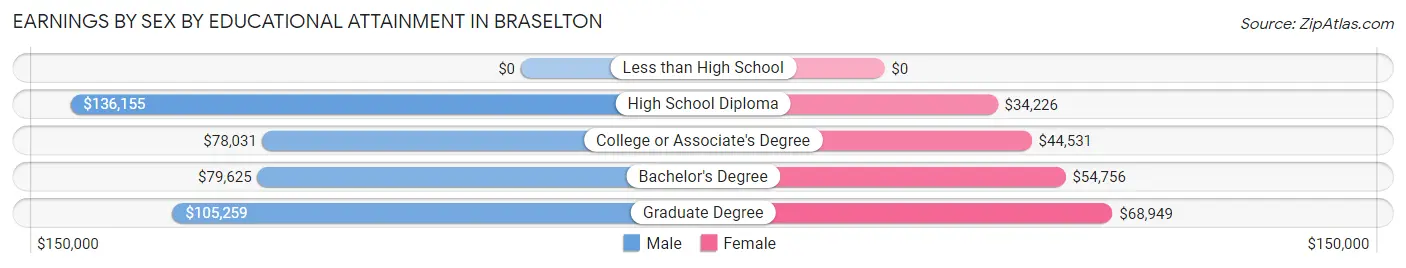
Earnings by Sex by Educational Attainment in Braselton
Average earnings in Braselton are $87,143 for men and $45,233 for women, a difference of 48.1%. Men with an educational attainment of high school diploma enjoy the highest average annual earnings of $136,155, while those with college or associate's degree education earn the least with $78,031. Women with an educational attainment of graduate degree earn the most with the average annual earnings of $68,949, while those with high school diploma education have the smallest earnings of $34,226.
| Educational Attainment | Male Income | Female Income |
| Less than High School | - | - |
| High School Diploma | $136,155 | $34,226 |
| College or Associate's Degree | $78,031 | $44,531 |
| Bachelor's Degree | $79,625 | $54,756 |
| Graduate Degree | $105,259 | $68,949 |
| Total | $87,143 | $45,233 |
Family Income in Braselton
Family Income Brackets in Braselton
According to the Braselton family income data, there are 998 families falling into the $200,000+ income range, which is the most common income bracket and makes up 23.9% of all families. Conversely, the $10,000 to $14,999 income bracket is the least frequent group with only 25 families (0.6%) belonging to this category.
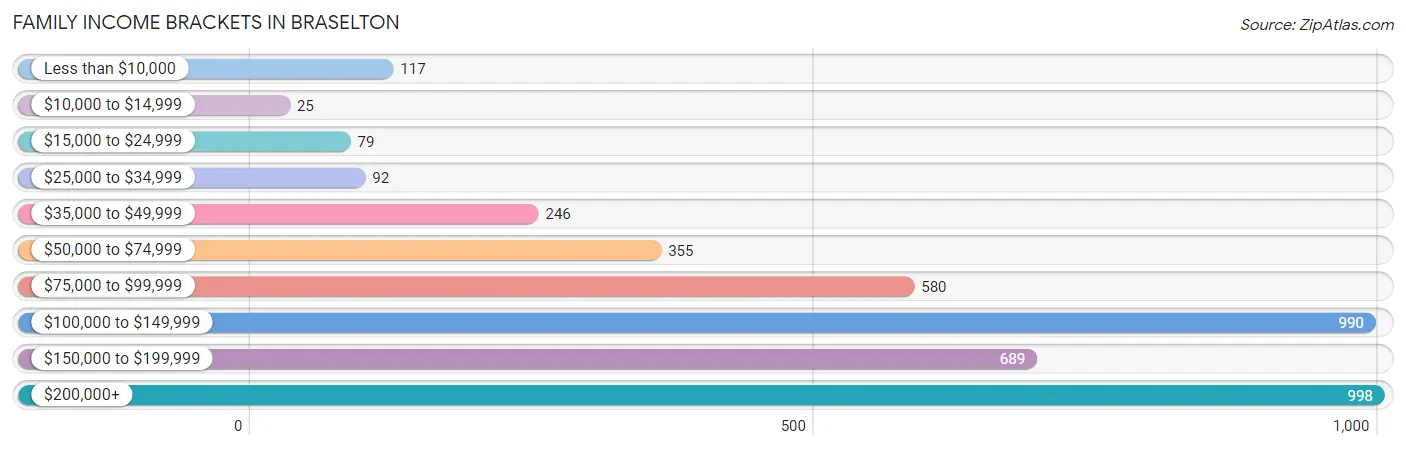
| Income Bracket | # Families | % Families |
| Less than $10,000 | 117 | 2.8% |
| $10,000 to $14,999 | 25 | 0.6% |
| $15,000 to $24,999 | 79 | 1.9% |
| $25,000 to $34,999 | 92 | 2.2% |
| $35,000 to $49,999 | 246 | 5.9% |
| $50,000 to $74,999 | 355 | 8.5% |
| $75,000 to $99,999 | 580 | 13.9% |
| $100,000 to $149,999 | 990 | 23.7% |
| $150,000 to $199,999 | 689 | 16.5% |
| $200,000+ | 998 | 23.9% |
Family Income by Famaliy Size in Braselton
6-person families (99 | 2.4%) account for the highest median family income in Braselton with $211,691 per family, while 2-person families (1,992 | 47.7%) have the highest median income of $55,782 per family member.
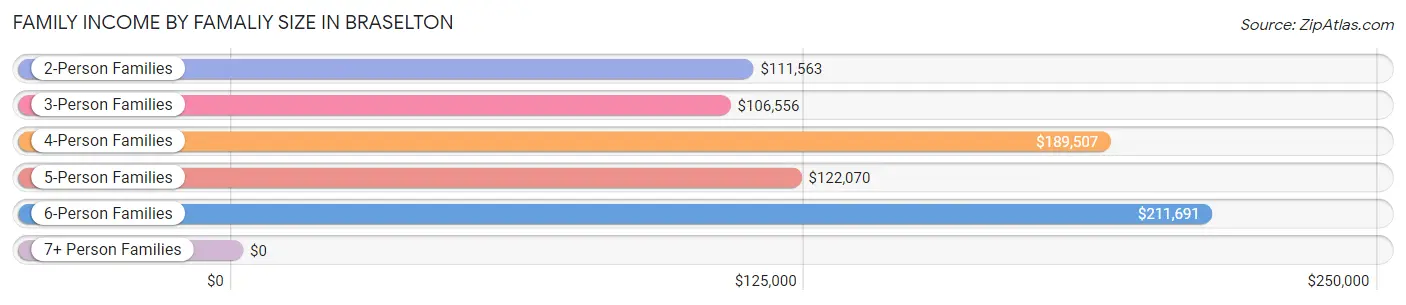
| Income Bracket | # Families | Median Income |
| 2-Person Families | 1,992 (47.7%) | $111,563 |
| 3-Person Families | 779 (18.6%) | $106,556 |
| 4-Person Families | 945 (22.6%) | $189,507 |
| 5-Person Families | 275 (6.6%) | $122,070 |
| 6-Person Families | 99 (2.4%) | $211,691 |
| 7+ Person Families | 86 (2.1%) | $0 |
| Total | 4,176 (100.0%) | $127,656 |
Family Income by Number of Earners in Braselton
The median family income in Braselton is $127,656, with families comprising 3+ earners (435) having the highest median family income of $191,358, while families with no earners (385) have the lowest median family income of $66,932, accounting for 10.4% and 9.2% of families, respectively.
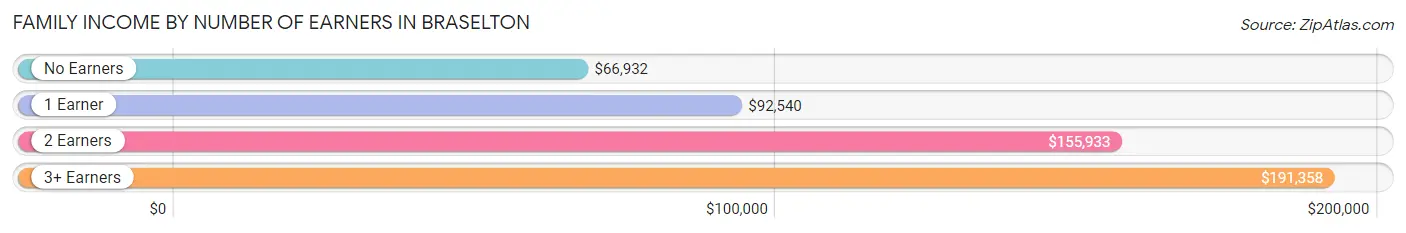
| Number of Earners | # Families | Median Income |
| No Earners | 385 (9.2%) | $66,932 |
| 1 Earner | 1,359 (32.5%) | $92,540 |
| 2 Earners | 1,997 (47.8%) | $155,933 |
| 3+ Earners | 435 (10.4%) | $191,358 |
| Total | 4,176 (100.0%) | $127,656 |
Household Income in Braselton
Household Income Brackets in Braselton
With 1,095 households falling in the category, the $100,000 to $149,999 income range is the most frequent in Braselton, accounting for 21.6% of all households. In contrast, only 35 households (0.7%) fall into the $10,000 to $14,999 income bracket, making it the least populous group.
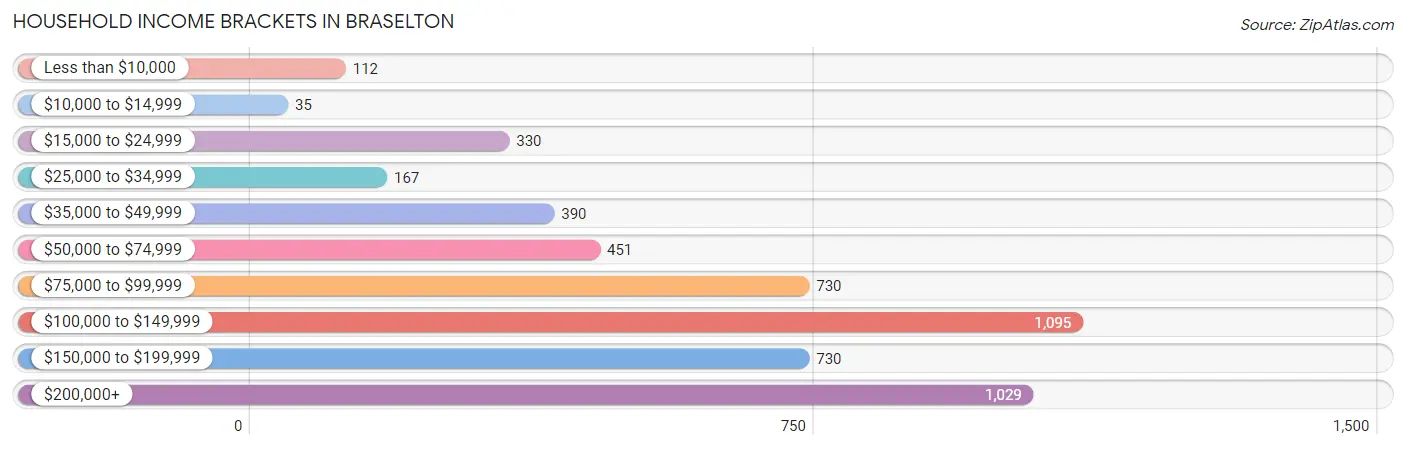
| Income Bracket | # Households | % Households |
| Less than $10,000 | 112 | 2.2% |
| $10,000 to $14,999 | 35 | 0.7% |
| $15,000 to $24,999 | 330 | 6.5% |
| $25,000 to $34,999 | 167 | 3.3% |
| $35,000 to $49,999 | 390 | 7.7% |
| $50,000 to $74,999 | 451 | 8.9% |
| $75,000 to $99,999 | 730 | 14.4% |
| $100,000 to $149,999 | 1,095 | 21.6% |
| $150,000 to $199,999 | 730 | 14.4% |
| $200,000+ | 1,029 | 20.3% |
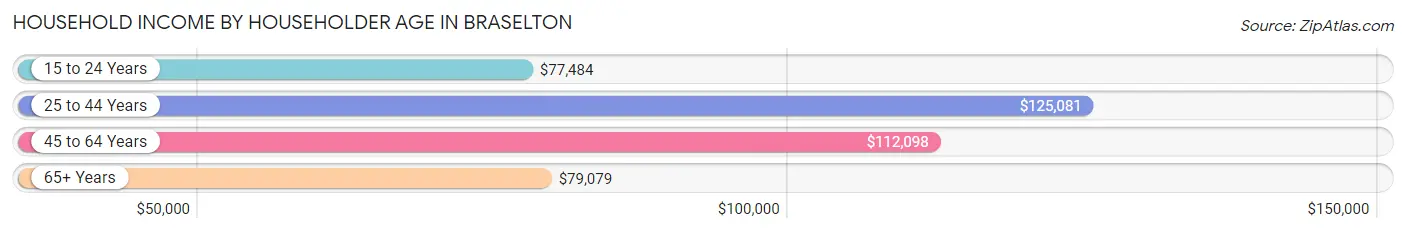
Household Income by Householder Age in Braselton
The median household income in Braselton is $111,080, with the highest median household income of $125,081 found in the 25 to 44 years age bracket for the primary householder. A total of 1,898 households (37.4%) fall into this category. Meanwhile, the 15 to 24 years age bracket for the primary householder has the lowest median household income of $77,484, with 165 households (3.3%) in this group.
| Income Bracket | # Households | Median Income |
| 15 to 24 Years | 165 (3.3%) | $77,484 |
| 25 to 44 Years | 1,898 (37.4%) | $125,081 |
| 45 to 64 Years | 1,851 (36.5%) | $112,098 |
| 65+ Years | 1,156 (22.8%) | $79,079 |
| Total | 5,070 (100.0%) | $111,080 |
Poverty in Braselton
Income Below Poverty by Sex and Age in Braselton
With 5.2% poverty level for males and 6.0% for females among the residents of Braselton, 15 year old males and 18 to 24 year old females are the most vulnerable to poverty, with 42 males (23.1%) and 95 females (18.0%) in their respective age groups living below the poverty level.
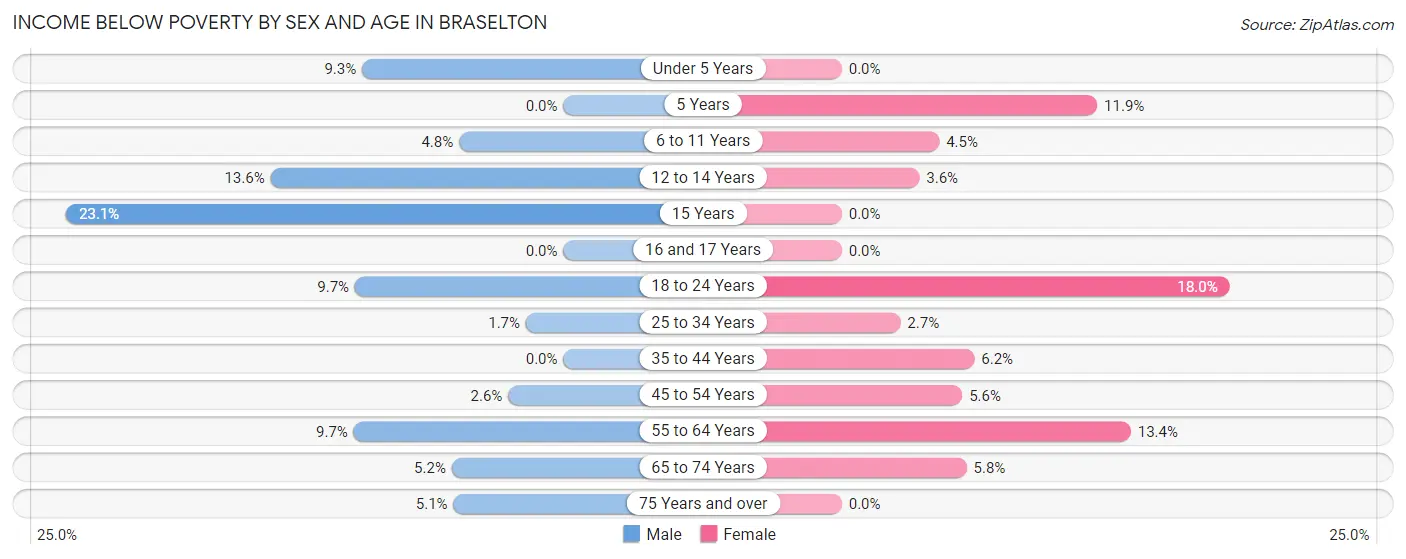
| Age Bracket | Male | Female |
| Under 5 Years | 38 (9.3%) | 0 (0.0%) |
| 5 Years | 0 (0.0%) | 16 (11.8%) |
| 6 to 11 Years | 31 (4.8%) | 29 (4.5%) |
| 12 to 14 Years | 42 (13.6%) | 16 (3.6%) |
| 15 Years | 42 (23.1%) | 0 (0.0%) |
| 16 and 17 Years | 0 (0.0%) | 0 (0.0%) |
| 18 to 24 Years | 58 (9.7%) | 95 (18.0%) |
| 25 to 34 Years | 9 (1.7%) | 24 (2.7%) |
| 35 to 44 Years | 0 (0.0%) | 75 (6.1%) |
| 45 to 54 Years | 21 (2.6%) | 59 (5.6%) |
| 55 to 64 Years | 55 (9.7%) | 87 (13.4%) |
| 65 to 74 Years | 25 (5.2%) | 36 (5.8%) |
| 75 Years and over | 20 (5.1%) | 0 (0.0%) |
| Total | 341 (5.2%) | 437 (6.0%) |
Income Above Poverty by Sex and Age in Braselton
According to the poverty statistics in Braselton, males aged 5 years and females aged under 5 years are the age groups that are most secure financially, with 100.0% of males and 100.0% of females in these age groups living above the poverty line.
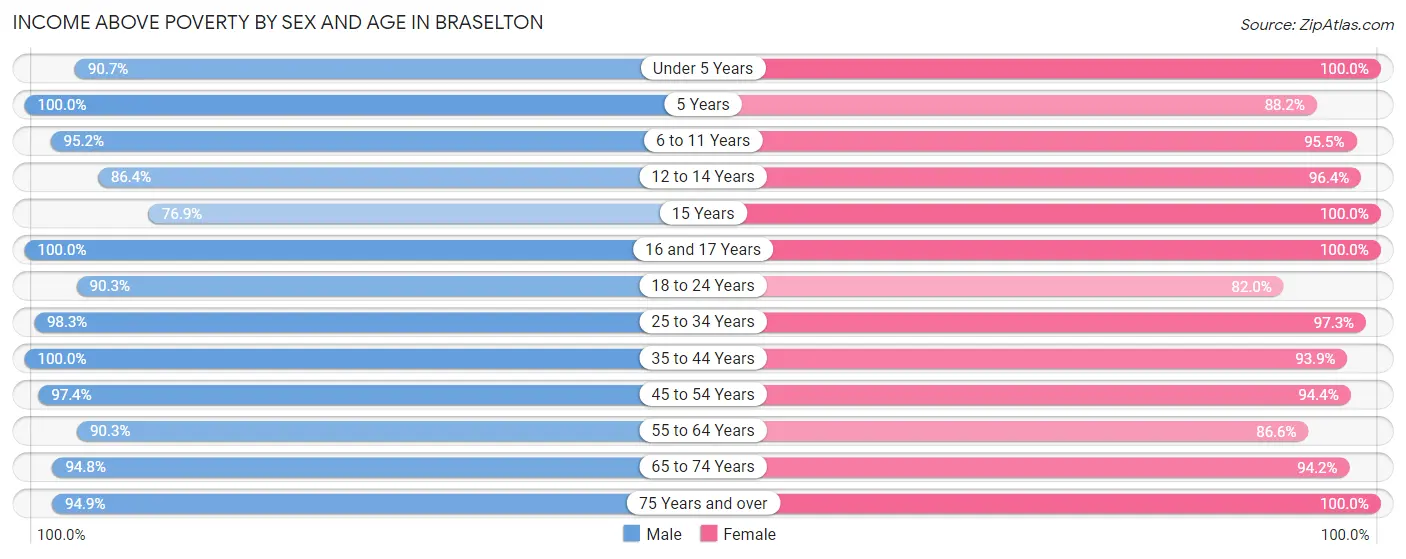
| Age Bracket | Male | Female |
| Under 5 Years | 369 (90.7%) | 296 (100.0%) |
| 5 Years | 106 (100.0%) | 119 (88.1%) |
| 6 to 11 Years | 609 (95.2%) | 613 (95.5%) |
| 12 to 14 Years | 267 (86.4%) | 429 (96.4%) |
| 15 Years | 140 (76.9%) | 141 (100.0%) |
| 16 and 17 Years | 212 (100.0%) | 306 (100.0%) |
| 18 to 24 Years | 542 (90.3%) | 433 (82.0%) |
| 25 to 34 Years | 509 (98.3%) | 859 (97.3%) |
| 35 to 44 Years | 1,266 (100.0%) | 1,145 (93.9%) |
| 45 to 54 Years | 799 (97.4%) | 997 (94.4%) |
| 55 to 64 Years | 510 (90.3%) | 562 (86.6%) |
| 65 to 74 Years | 458 (94.8%) | 586 (94.2%) |
| 75 Years and over | 372 (94.9%) | 381 (100.0%) |
| Total | 6,159 (94.8%) | 6,867 (94.0%) |
Income Below Poverty Among Married-Couple Families in Braselton
The poverty statistics for married-couple families in Braselton show that 1.9% or 63 of the total 3,319 families live below the poverty line. Families with no children have the highest poverty rate of 3.7%, comprising of 63 families. On the other hand, families with 1 or 2 children have the lowest poverty rate of 0.0%, which includes 0 families.
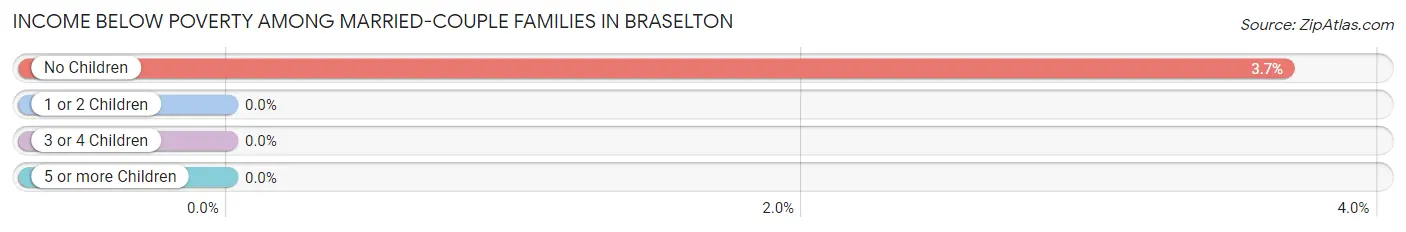
| Children | Above Poverty | Below Poverty |
| No Children | 1,651 (96.3%) | 63 (3.7%) |
| 1 or 2 Children | 1,248 (100.0%) | 0 (0.0%) |
| 3 or 4 Children | 271 (100.0%) | 0 (0.0%) |
| 5 or more Children | 86 (100.0%) | 0 (0.0%) |
| Total | 3,256 (98.1%) | 63 (1.9%) |
Income Below Poverty Among Single-Parent Households in Braselton
According to the poverty data in Braselton, 13.3% or 20 single-father households and 19.0% or 134 single-mother households are living below the poverty line. Among single-father households, those with 1 or 2 children have the highest poverty rate, with 20 households (87.0%) experiencing poverty. Likewise, among single-mother households, those with 1 or 2 children have the highest poverty rate, with 117 households (37.7%) falling below the poverty line.
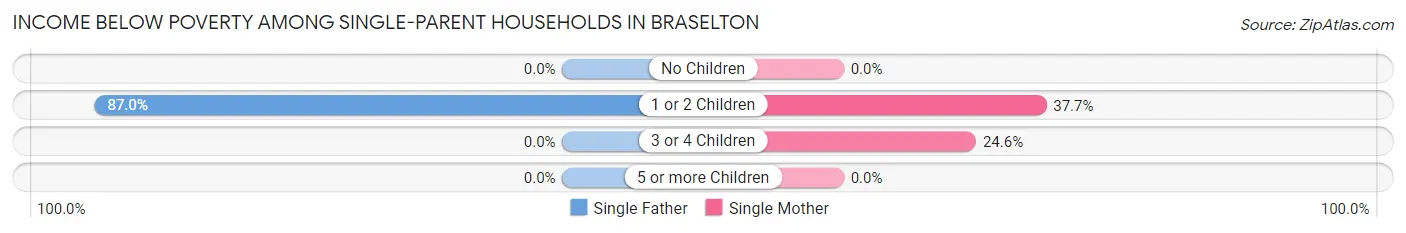
| Children | Single Father | Single Mother |
| No Children | 0 (0.0%) | 0 (0.0%) |
| 1 or 2 Children | 20 (87.0%) | 117 (37.7%) |
| 3 or 4 Children | 0 (0.0%) | 17 (24.6%) |
| 5 or more Children | 0 (0.0%) | 0 (0.0%) |
| Total | 20 (13.3%) | 134 (19.0%) |
Income Below Poverty Among Married-Couple vs Single-Parent Households in Braselton
The poverty data for Braselton shows that 63 of the married-couple family households (1.9%) and 154 of the single-parent households (18.0%) are living below the poverty level. Within the married-couple family households, those with no children have the highest poverty rate, with 63 households (3.7%) falling below the poverty line. Among the single-parent households, those with 1 or 2 children have the highest poverty rate, with 137 household (41.1%) living below poverty.
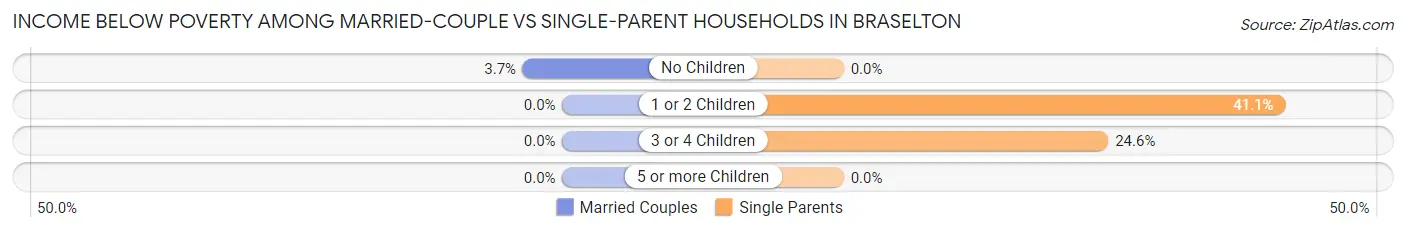
| Children | Married-Couple Families | Single-Parent Households |
| No Children | 63 (3.7%) | 0 (0.0%) |
| 1 or 2 Children | 0 (0.0%) | 137 (41.1%) |
| 3 or 4 Children | 0 (0.0%) | 17 (24.6%) |
| 5 or more Children | 0 (0.0%) | 0 (0.0%) |
| Total | 63 (1.9%) | 154 (18.0%) |
Race in Braselton
The most populous races in Braselton are White / Caucasian (11,623 | 84.2%), Hispanic or Latino (1,125 | 8.2%), and Two or more Races (1,044 | 7.6%).
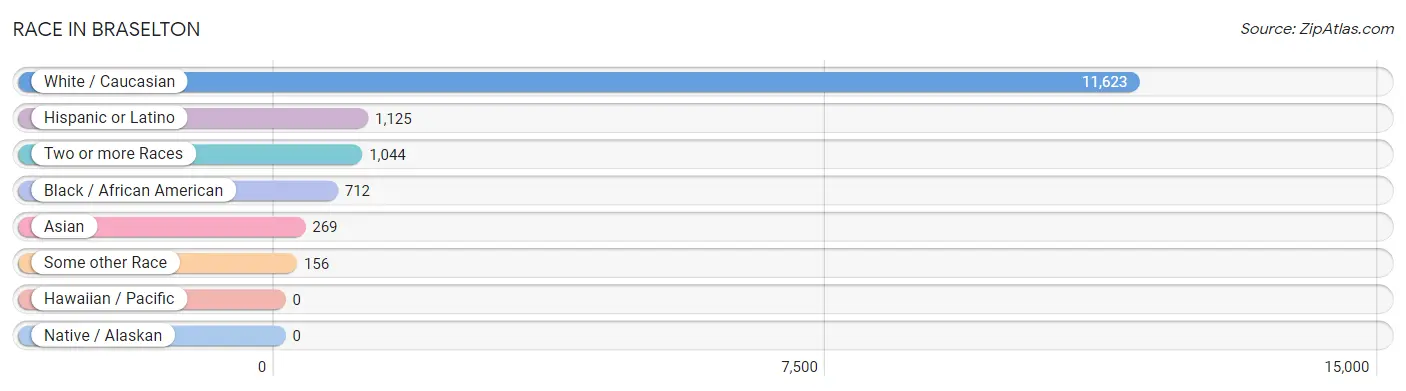
| Race | # Population | % Population |
| Asian | 269 | 1.9% |
| Black / African American | 712 | 5.2% |
| Hawaiian / Pacific | 0 | 0.0% |
| Hispanic or Latino | 1,125 | 8.2% |
| Native / Alaskan | 0 | 0.0% |
| White / Caucasian | 11,623 | 84.2% |
| Two or more Races | 1,044 | 7.6% |
| Some other Race | 156 | 1.1% |
| Total | 13,804 | 100.0% |
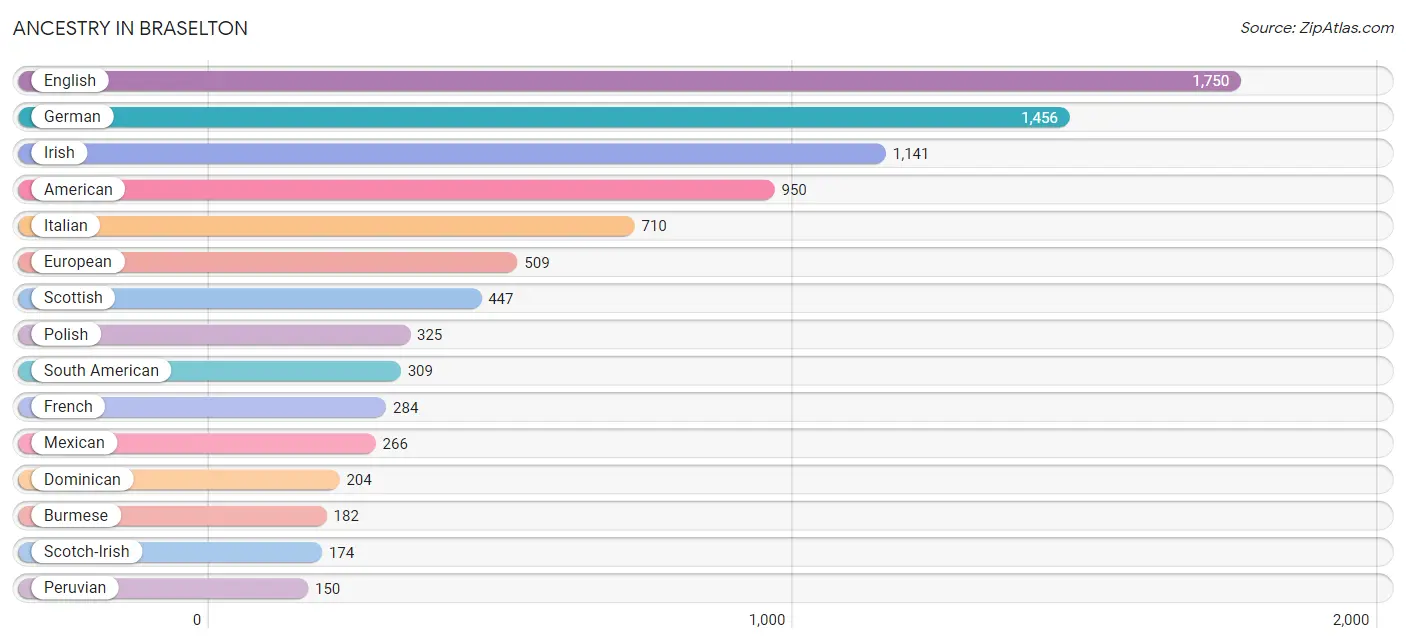
Ancestry in Braselton
The most populous ancestries reported in Braselton are English (1,750 | 12.7%), German (1,456 | 10.5%), Irish (1,141 | 8.3%), American (950 | 6.9%), and Italian (710 | 5.1%), together accounting for 43.5% of all Braselton residents.
| Ancestry | # Population | % Population |
| Albanian | 19 | 0.1% |
| American | 950 | 6.9% |
| Apache | 37 | 0.3% |
| Belgian | 20 | 0.1% |
| British | 41 | 0.3% |
| Burmese | 182 | 1.3% |
| Canadian | 30 | 0.2% |
| Central American | 72 | 0.5% |
| Cherokee | 51 | 0.4% |
| Colombian | 116 | 0.8% |
| Cuban | 89 | 0.6% |
| Czech | 33 | 0.2% |
| Dominican | 204 | 1.5% |
| Dutch | 68 | 0.5% |
| Eastern European | 77 | 0.6% |
| English | 1,750 | 12.7% |
| European | 509 | 3.7% |
| Finnish | 15 | 0.1% |
| French | 284 | 2.1% |
| German | 1,456 | 10.5% |
| Greek | 79 | 0.6% |
| Guatemalan | 60 | 0.4% |
| Guyanese | 39 | 0.3% |
| Haitian | 124 | 0.9% |
| Hungarian | 41 | 0.3% |
| Indian (Asian) | 125 | 0.9% |
| Irish | 1,141 | 8.3% |
| Italian | 710 | 5.1% |
| Jamaican | 27 | 0.2% |
| Korean | 55 | 0.4% |
| Lithuanian | 16 | 0.1% |
| Mexican | 266 | 1.9% |
| Nigerian | 10 | 0.1% |
| Norwegian | 77 | 0.6% |
| Panamanian | 12 | 0.1% |
| Pennsylvania German | 31 | 0.2% |
| Peruvian | 150 | 1.1% |
| Polish | 325 | 2.4% |
| Puerto Rican | 105 | 0.8% |
| Scandinavian | 120 | 0.9% |
| Scotch-Irish | 174 | 1.3% |
| Scottish | 447 | 3.2% |
| South African | 40 | 0.3% |
| South American | 309 | 2.2% |
| Spaniard | 64 | 0.5% |
| Spanish | 16 | 0.1% |
| Sri Lankan | 26 | 0.2% |
| Subsaharan African | 60 | 0.4% |
| Swedish | 109 | 0.8% |
| Swiss | 22 | 0.2% |
| Thai | 31 | 0.2% |
| Ukrainian | 46 | 0.3% |
| Venezuelan | 43 | 0.3% |
| Welsh | 72 | 0.5% | View All 54 Rows |
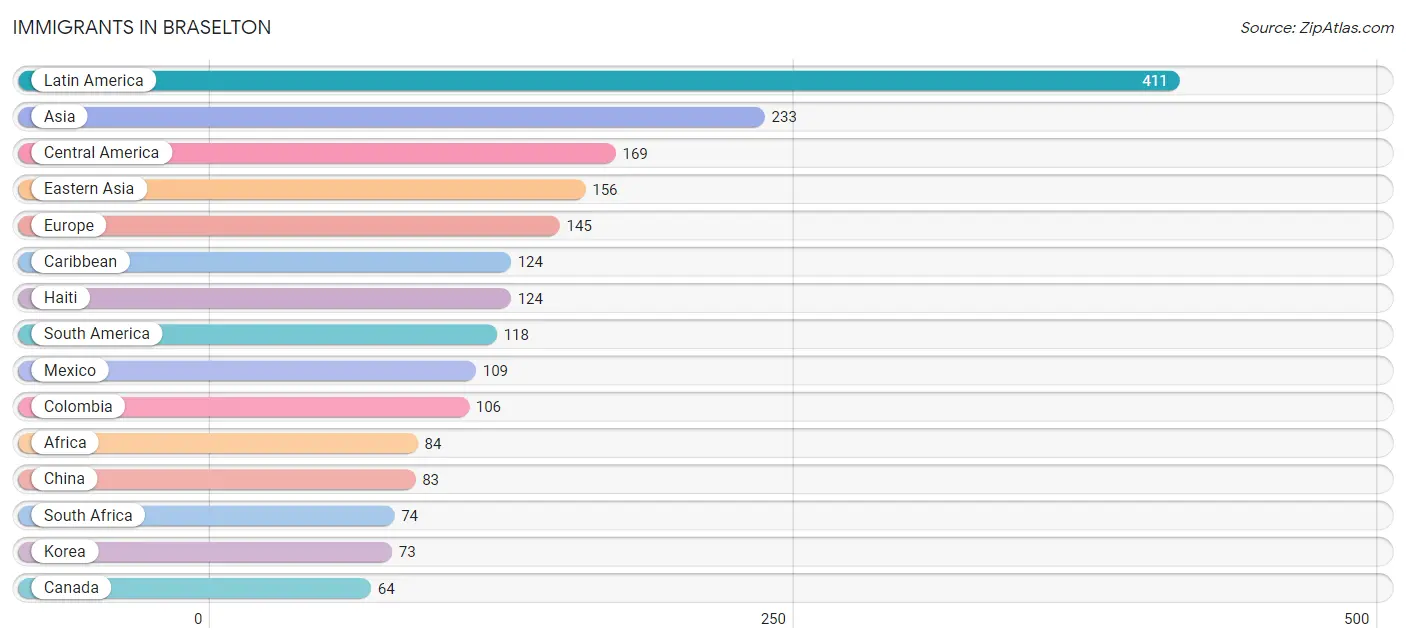
Immigrants in Braselton
The most numerous immigrant groups reported in Braselton came from Latin America (411 | 3.0%), Asia (233 | 1.7%), Central America (169 | 1.2%), Eastern Asia (156 | 1.1%), and Europe (145 | 1.1%), together accounting for 8.1% of all Braselton residents.
| Immigration Origin | # Population | % Population |
| Africa | 84 | 0.6% |
| Albania | 19 | 0.1% |
| Asia | 233 | 1.7% |
| Canada | 64 | 0.5% |
| Caribbean | 124 | 0.9% |
| Central America | 169 | 1.2% |
| China | 83 | 0.6% |
| Colombia | 106 | 0.8% |
| Eastern Asia | 156 | 1.1% |
| Eastern Europe | 51 | 0.4% |
| Europe | 145 | 1.1% |
| Germany | 12 | 0.1% |
| Greece | 21 | 0.2% |
| Guatemala | 48 | 0.4% |
| Guyana | 12 | 0.1% |
| Haiti | 124 | 0.9% |
| India | 31 | 0.2% |
| Ireland | 24 | 0.2% |
| Italy | 14 | 0.1% |
| Korea | 73 | 0.5% |
| Latin America | 411 | 3.0% |
| Mexico | 109 | 0.8% |
| Nigeria | 10 | 0.1% |
| Northern Europe | 47 | 0.3% |
| Panama | 12 | 0.1% |
| Philippines | 20 | 0.1% |
| Poland | 9 | 0.1% |
| South Africa | 74 | 0.5% |
| South America | 118 | 0.9% |
| South Central Asia | 31 | 0.2% |
| South Eastern Asia | 46 | 0.3% |
| Southern Europe | 35 | 0.3% |
| Ukraine | 23 | 0.2% |
| Vietnam | 26 | 0.2% |
| Western Africa | 10 | 0.1% |
| Western Europe | 12 | 0.1% | View All 36 Rows |
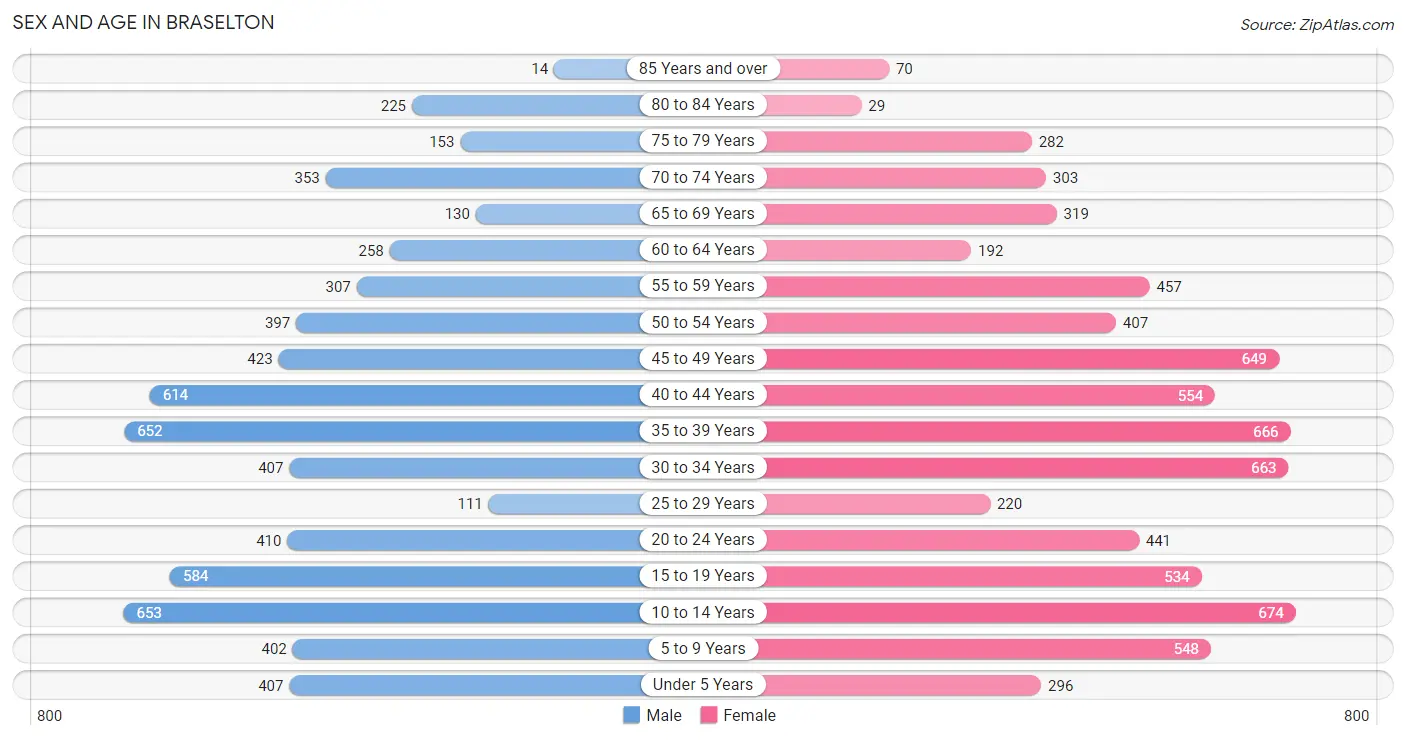
Sex and Age in Braselton
Sex and Age in Braselton
The most populous age groups in Braselton are 10 to 14 Years (653 | 10.1%) for men and 10 to 14 Years (674 | 9.2%) for women.
| Age Bracket | Male | Female |
| Under 5 Years | 407 (6.3%) | 296 (4.1%) |
| 5 to 9 Years | 402 (6.2%) | 548 (7.5%) |
| 10 to 14 Years | 653 (10.1%) | 674 (9.2%) |
| 15 to 19 Years | 584 (9.0%) | 534 (7.3%) |
| 20 to 24 Years | 410 (6.3%) | 441 (6.0%) |
| 25 to 29 Years | 111 (1.7%) | 220 (3.0%) |
| 30 to 34 Years | 407 (6.3%) | 663 (9.1%) |
| 35 to 39 Years | 652 (10.0%) | 666 (9.1%) |
| 40 to 44 Years | 614 (9.5%) | 554 (7.6%) |
| 45 to 49 Years | 423 (6.5%) | 649 (8.9%) |
| 50 to 54 Years | 397 (6.1%) | 407 (5.6%) |
| 55 to 59 Years | 307 (4.7%) | 457 (6.3%) |
| 60 to 64 Years | 258 (4.0%) | 192 (2.6%) |
| 65 to 69 Years | 130 (2.0%) | 319 (4.4%) |
| 70 to 74 Years | 353 (5.4%) | 303 (4.2%) |
| 75 to 79 Years | 153 (2.4%) | 282 (3.9%) |
| 80 to 84 Years | 225 (3.5%) | 29 (0.4%) |
| 85 Years and over | 14 (0.2%) | 70 (1.0%) |
| Total | 6,500 (100.0%) | 7,304 (100.0%) |
Families and Households in Braselton
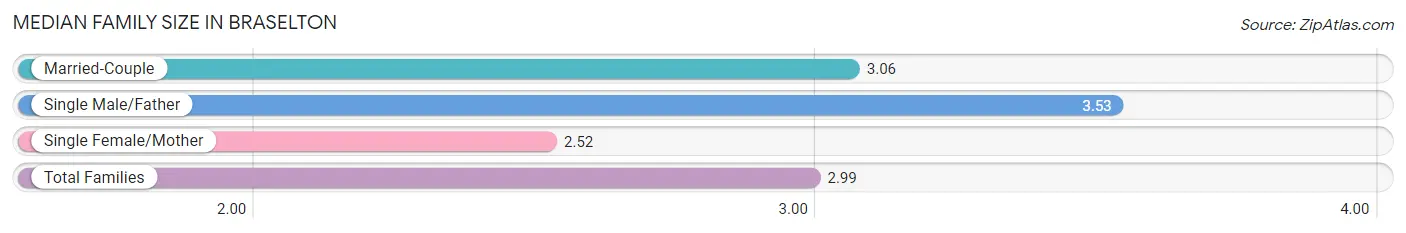
Median Family Size in Braselton
The median family size in Braselton is 2.99 persons per family, with single male/father families (151 | 3.6%) accounting for the largest median family size of 3.53 persons per family. On the other hand, single female/mother families (706 | 16.9%) represent the smallest median family size with 2.52 persons per family.
| Family Type | # Families | Family Size |
| Married-Couple | 3,319 (79.5%) | 3.06 |
| Single Male/Father | 151 (3.6%) | 3.53 |
| Single Female/Mother | 706 (16.9%) | 2.52 |
| Total Families | 4,176 (100.0%) | 2.99 |
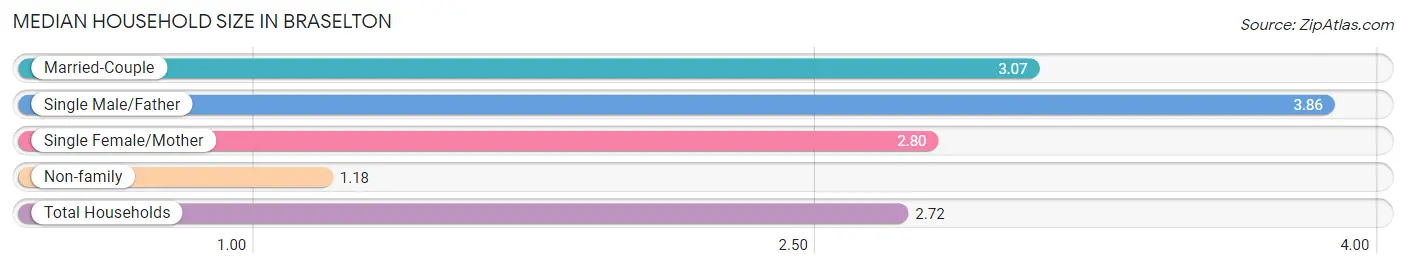
Median Household Size in Braselton
The median household size in Braselton is 2.72 persons per household, with single male/father households (151 | 3.0%) accounting for the largest median household size of 3.86 persons per household. non-family households (894 | 17.6%) represent the smallest median household size with 1.18 persons per household.
| Household Type | # Households | Household Size |
| Married-Couple | 3,319 (65.5%) | 3.07 |
| Single Male/Father | 151 (3.0%) | 3.86 |
| Single Female/Mother | 706 (13.9%) | 2.80 |
| Non-family | 894 (17.6%) | 1.18 |
| Total Households | 5,070 (100.0%) | 2.72 |
Household Size by Marriage Status in Braselton
Out of a total of 5,070 households in Braselton, 4,176 (82.4%) are family households, while 894 (17.6%) are nonfamily households. The most numerous type of family households are 2-person households, comprising 1,853, and the most common type of nonfamily households are 1-person households, comprising 742.
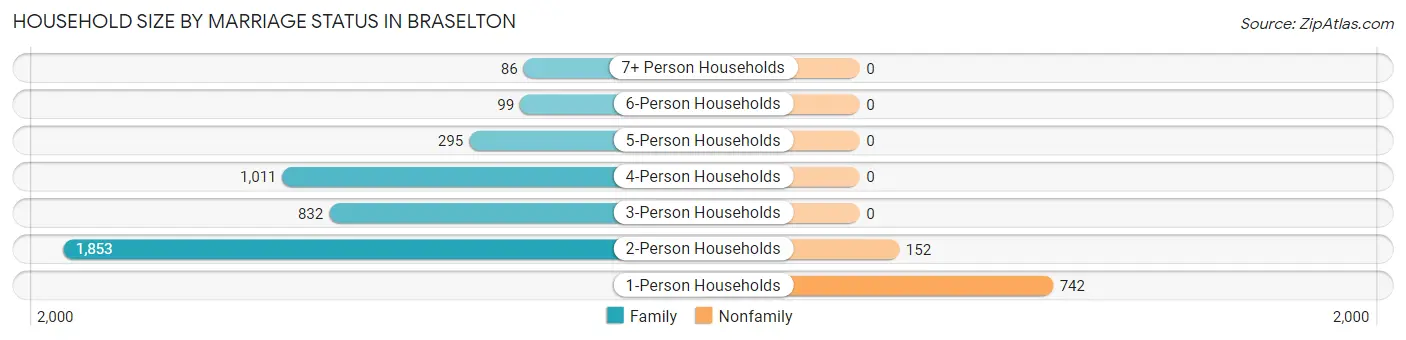
| Household Size | Family Households | Nonfamily Households |
| 1-Person Households | - | 742 (14.6%) |
| 2-Person Households | 1,853 (36.5%) | 152 (3.0%) |
| 3-Person Households | 832 (16.4%) | 0 (0.0%) |
| 4-Person Households | 1,011 (19.9%) | 0 (0.0%) |
| 5-Person Households | 295 (5.8%) | 0 (0.0%) |
| 6-Person Households | 99 (1.9%) | 0 (0.0%) |
| 7+ Person Households | 86 (1.7%) | 0 (0.0%) |
| Total | 4,176 (82.4%) | 894 (17.6%) |
Female Fertility in Braselton
Fertility by Age in Braselton
Average fertility rate in Braselton is 57.0 births per 1,000 women. Women in the age bracket of 20 to 34 years have the highest fertility rate with 98.0 births per 1,000 women. Women in the age bracket of 20 to 34 years acount for 59.4% of all women with births.
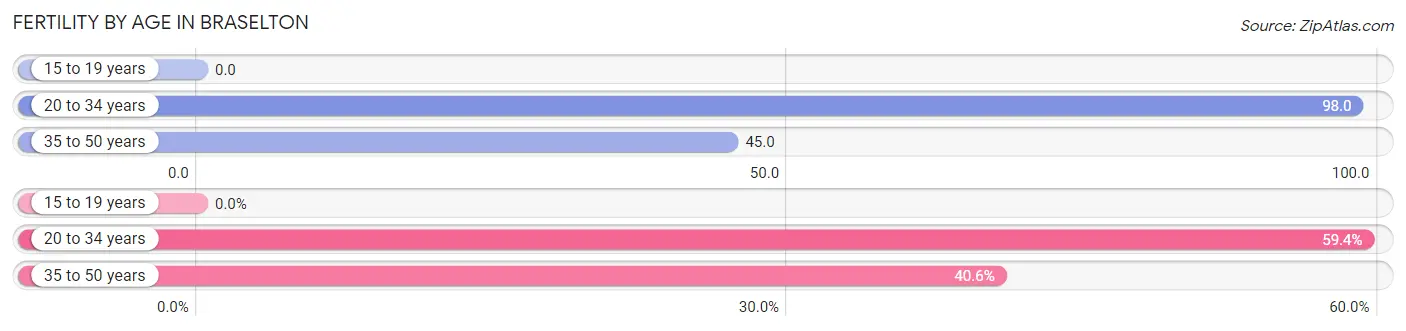
| Age Bracket | Women with Births | Births / 1,000 Women |
| 15 to 19 years | 0 (0.0%) | 0.0 |
| 20 to 34 years | 130 (59.4%) | 98.0 |
| 35 to 50 years | 89 (40.6%) | 45.0 |
| Total | 219 (100.0%) | 57.0 |
Fertility by Age by Marriage Status in Braselton
64.8% of women with births (219) in Braselton are married. The highest percentage of unmarried women with births falls into 20 to 34 years age bracket with 59.2% of them unmarried at the time of birth, while the lowest percentage of unmarried women with births belong to 35 to 50 years age bracket with 0.0% of them unmarried.
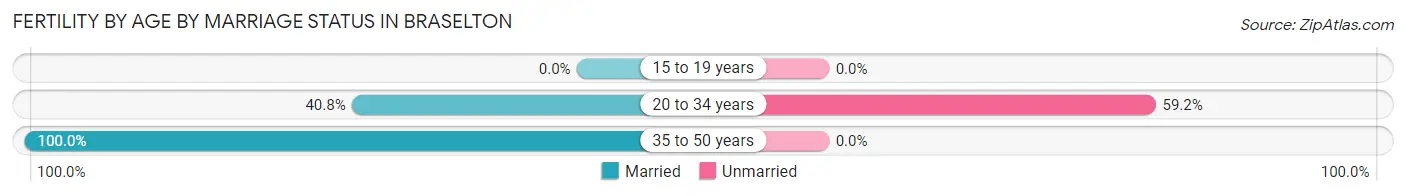
| Age Bracket | Married | Unmarried |
| 15 to 19 years | 0 (0.0%) | 0 (0.0%) |
| 20 to 34 years | 53 (40.8%) | 77 (59.2%) |
| 35 to 50 years | 89 (100.0%) | 0 (0.0%) |
| Total | 142 (64.8%) | 77 (35.2%) |
Fertility by Education in Braselton
Average fertility rate in Braselton is 57.0 births per 1,000 women. Women with the education attainment of less than high school have the highest fertility rate of 108.0 births per 1,000 women, while women with the education attainment of college or associate's degree have the lowest fertility at 15.0 births per 1,000 women. Women with the education attainment of less than high school represent 39.3% of all women with births.
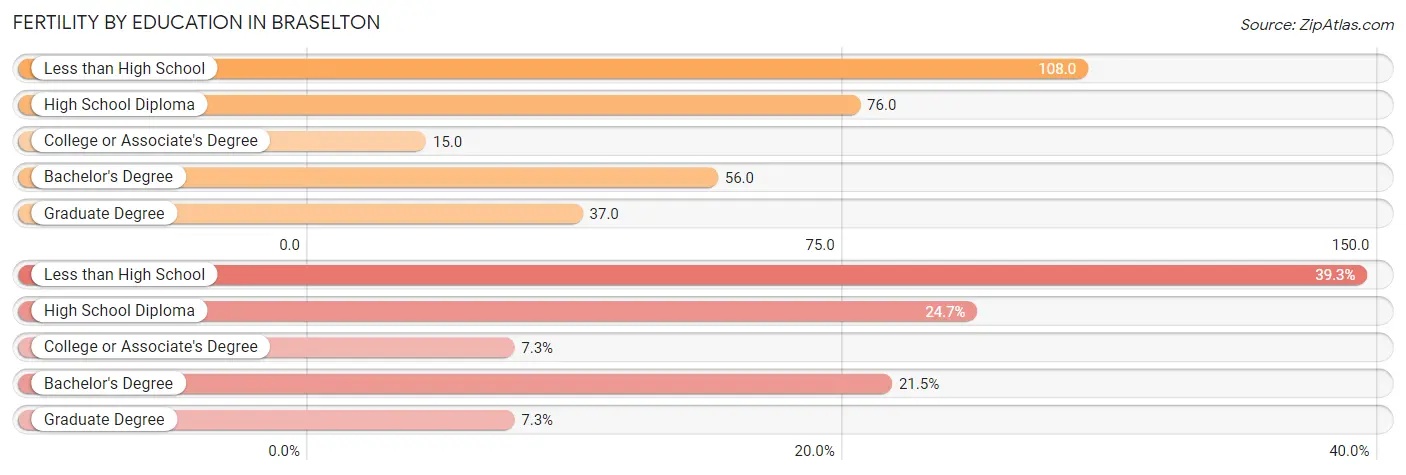
| Educational Attainment | Women with Births | Births / 1,000 Women |
| Less than High School | 86 (39.3%) | 108.0 |
| High School Diploma | 54 (24.7%) | 76.0 |
| College or Associate's Degree | 16 (7.3%) | 15.0 |
| Bachelor's Degree | 47 (21.5%) | 56.0 |
| Graduate Degree | 16 (7.3%) | 37.0 |
| Total | 219 (100.0%) | 57.0 |
Fertility by Education by Marriage Status in Braselton
35.2% of women with births in Braselton are unmarried. Women with the educational attainment of college or associate's degree are most likely to be married with 100.0% of them married at childbirth, while women with the educational attainment of high school diploma are least likely to be married with 81.5% of them unmarried at childbirth.
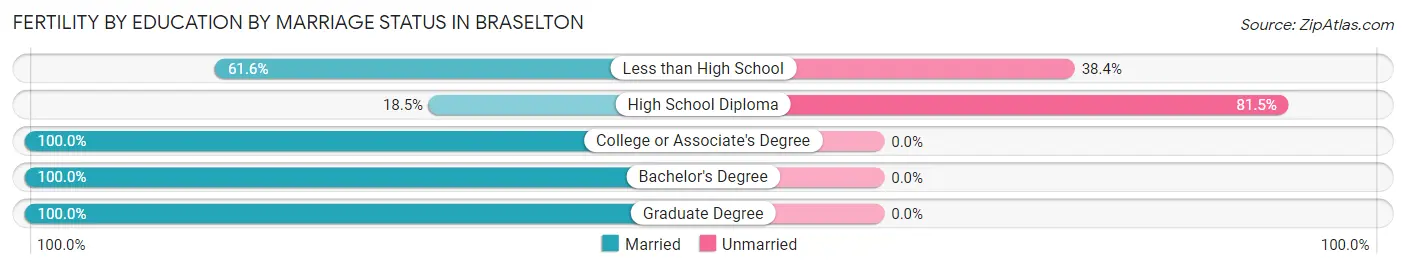
| Educational Attainment | Married | Unmarried |
| Less than High School | 53 (61.6%) | 33 (38.4%) |
| High School Diploma | 10 (18.5%) | 44 (81.5%) |
| College or Associate's Degree | 16 (100.0%) | 0 (0.0%) |
| Bachelor's Degree | 47 (100.0%) | 0 (0.0%) |
| Graduate Degree | 16 (100.0%) | 0 (0.0%) |
| Total | 142 (64.8%) | 77 (35.2%) |
Employment Characteristics in Braselton
Employment by Class of Employer in Braselton
Among the 6,907 employed individuals in Braselton, private company employees (5,067 | 73.4%), local government employees (629 | 9.1%), and not-for-profit organizations (362 | 5.2%) make up the most common classes of employment.
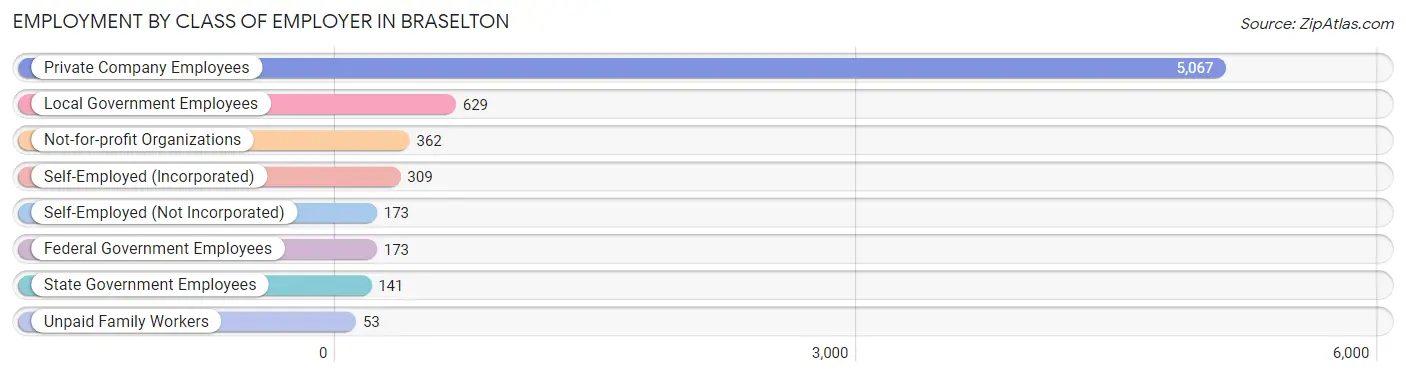
| Employer Class | # Employees | % Employees |
| Private Company Employees | 5,067 | 73.4% |
| Self-Employed (Incorporated) | 309 | 4.5% |
| Self-Employed (Not Incorporated) | 173 | 2.5% |
| Not-for-profit Organizations | 362 | 5.2% |
| Local Government Employees | 629 | 9.1% |
| State Government Employees | 141 | 2.0% |
| Federal Government Employees | 173 | 2.5% |
| Unpaid Family Workers | 53 | 0.8% |
| Total | 6,907 | 100.0% |
Employment Status by Age in Braselton
According to the labor force statistics for Braselton, out of the total population over 16 years of age (10,501), 68.9% or 7,235 individuals are in the labor force, with 2.1% or 152 of them unemployed. The age group with the highest labor force participation rate is 55 to 59 years, with 94.0% or 718 individuals in the labor force. Within the labor force, the 16 to 19 years age range has the highest percentage of unemployed individuals, with 16.9% or 35 of them being unemployed.
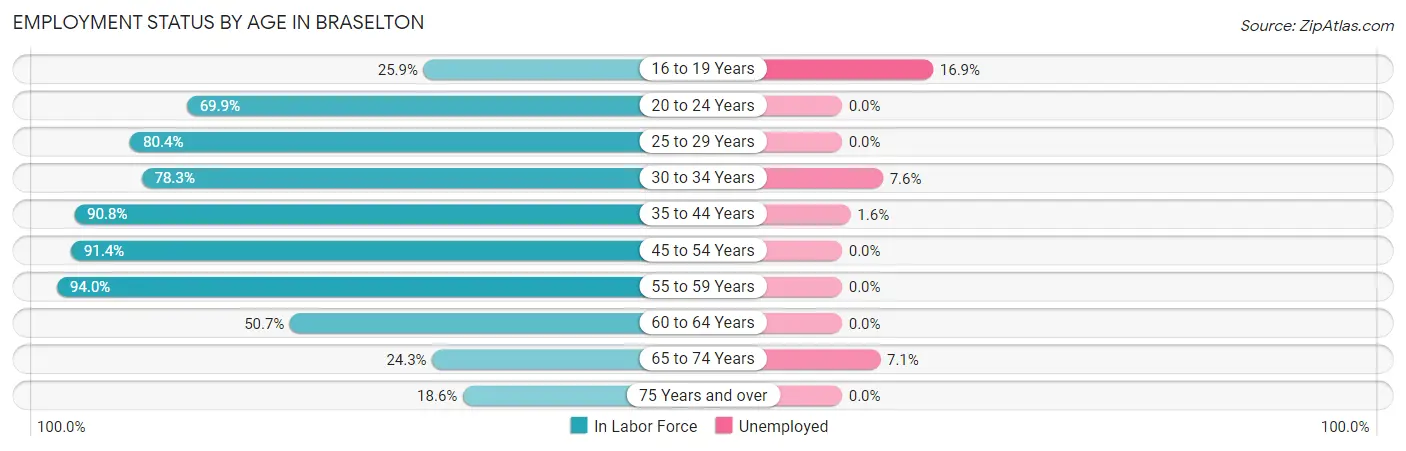
| Age Bracket | In Labor Force | Unemployed |
| 16 to 19 Years | 206 (25.9%) | 35 (16.9%) |
| 20 to 24 Years | 595 (69.9%) | 0 (0.0%) |
| 25 to 29 Years | 266 (80.4%) | 0 (0.0%) |
| 30 to 34 Years | 838 (78.3%) | 64 (7.6%) |
| 35 to 44 Years | 2,257 (90.8%) | 36 (1.6%) |
| 45 to 54 Years | 1,715 (91.4%) | 0 (0.0%) |
| 55 to 59 Years | 718 (94.0%) | 0 (0.0%) |
| 60 to 64 Years | 228 (50.7%) | 0 (0.0%) |
| 65 to 74 Years | 269 (24.3%) | 19 (7.1%) |
| 75 Years and over | 144 (18.6%) | 0 (0.0%) |
| Total | 7,235 (68.9%) | 152 (2.1%) |
Employment Status by Educational Attainment in Braselton
According to labor force statistics for Braselton, 86.3% of individuals (6,021) out of the total population between 25 and 64 years of age (6,977) are in the labor force, with 1.6% or 96 of them being unemployed. The group with the highest labor force participation rate are those with the educational attainment of high school diploma, with 90.8% or 1,299 individuals in the labor force. Within the labor force, individuals with bachelor's degree or higher education have the highest percentage of unemployment, with 2.1% or 63 of them being unemployed.
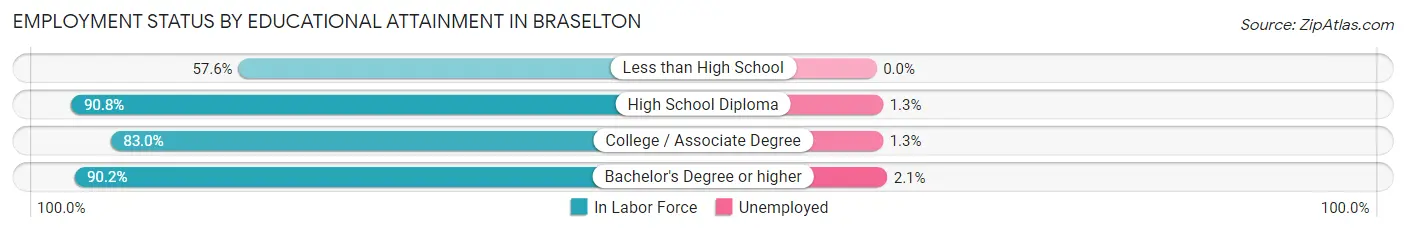
| Educational Attainment | In Labor Force | Unemployed |
| Less than High School | 273 (57.6%) | 0 (0.0%) |
| High School Diploma | 1,299 (90.8%) | 19 (1.3%) |
| College / Associate Degree | 1,460 (83.0%) | 23 (1.3%) |
| Bachelor's Degree or higher | 2,988 (90.2%) | 70 (2.1%) |
| Total | 6,021 (86.3%) | 112 (1.6%) |
Employment Occupations by Sex in Braselton
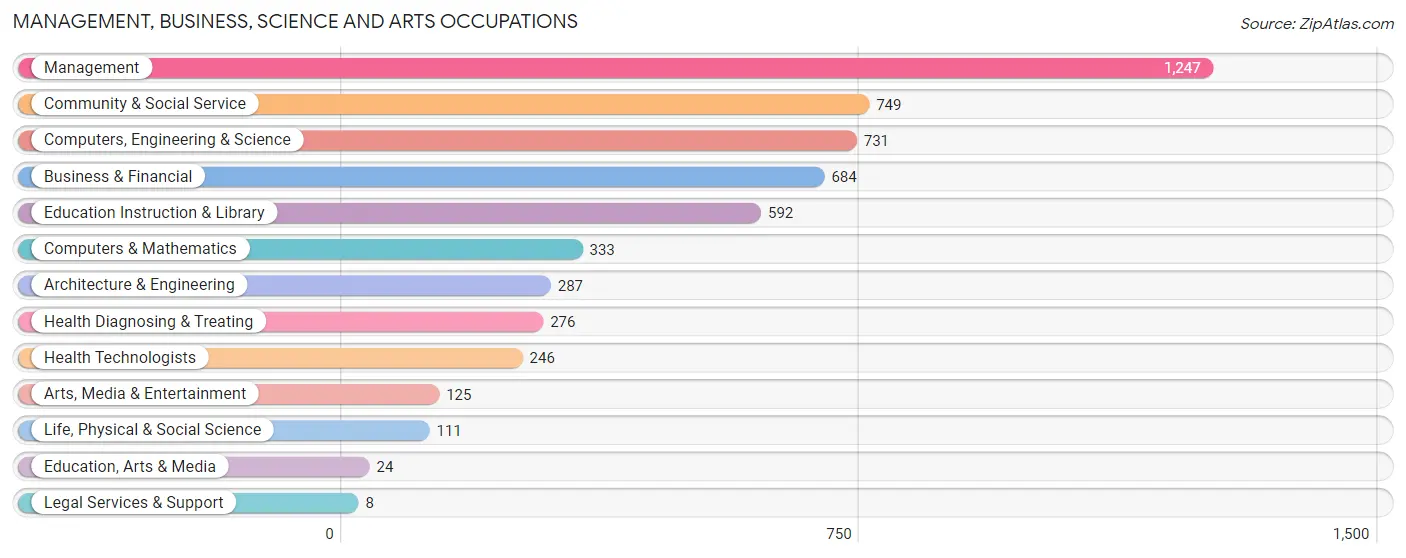
Management, Business, Science and Arts Occupations
The most common Management, Business, Science and Arts occupations in Braselton are Management (1,247 | 17.7%), Community & Social Service (749 | 10.6%), Computers, Engineering & Science (731 | 10.4%), Business & Financial (684 | 9.7%), and Education Instruction & Library (592 | 8.4%).
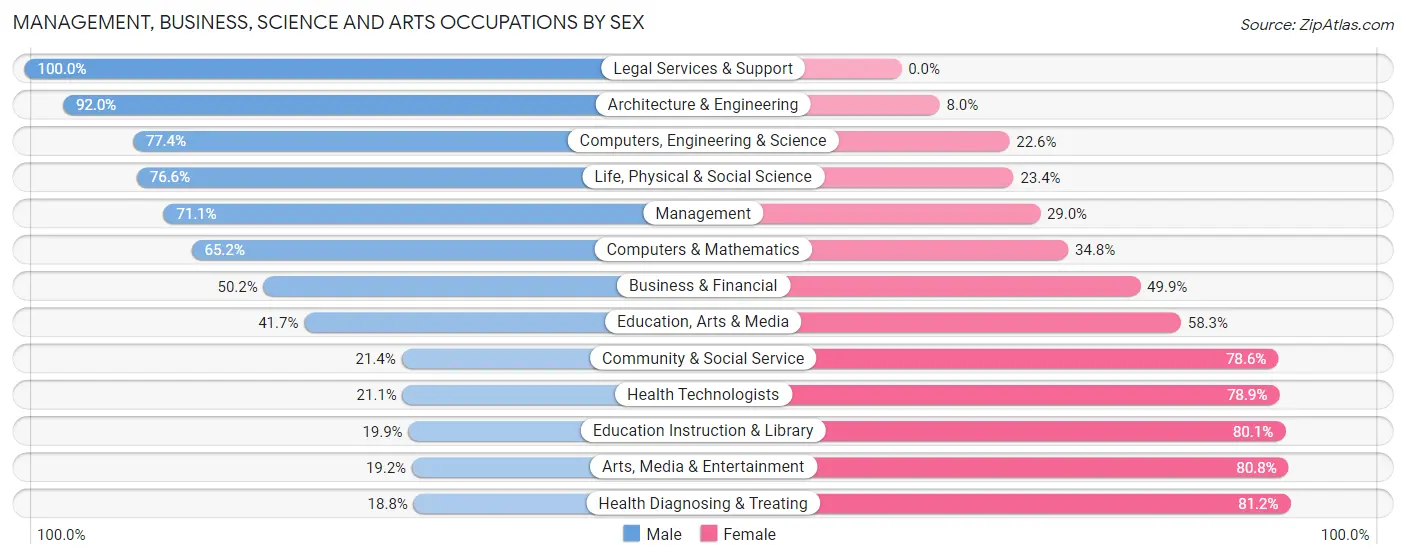
Management, Business, Science and Arts Occupations by Sex
Within the Management, Business, Science and Arts occupations in Braselton, the most male-oriented occupations are Legal Services & Support (100.0%), Architecture & Engineering (92.0%), and Computers, Engineering & Science (77.4%), while the most female-oriented occupations are Health Diagnosing & Treating (81.2%), Arts, Media & Entertainment (80.8%), and Education Instruction & Library (80.1%).
| Occupation | Male | Female |
| Management | 886 (71.1%) | 361 (28.9%) |
| Business & Financial | 343 (50.1%) | 341 (49.8%) |
| Computers, Engineering & Science | 566 (77.4%) | 165 (22.6%) |
| Computers & Mathematics | 217 (65.2%) | 116 (34.8%) |
| Architecture & Engineering | 264 (92.0%) | 23 (8.0%) |
| Life, Physical & Social Science | 85 (76.6%) | 26 (23.4%) |
| Community & Social Service | 160 (21.4%) | 589 (78.6%) |
| Education, Arts & Media | 10 (41.7%) | 14 (58.3%) |
| Legal Services & Support | 8 (100.0%) | 0 (0.0%) |
| Education Instruction & Library | 118 (19.9%) | 474 (80.1%) |
| Arts, Media & Entertainment | 24 (19.2%) | 101 (80.8%) |
| Health Diagnosing & Treating | 52 (18.8%) | 224 (81.2%) |
| Health Technologists | 52 (21.1%) | 194 (78.9%) |
| Total (Category) | 2,007 (54.4%) | 1,680 (45.6%) |
| Total (Overall) | 3,597 (51.0%) | 3,452 (49.0%) |
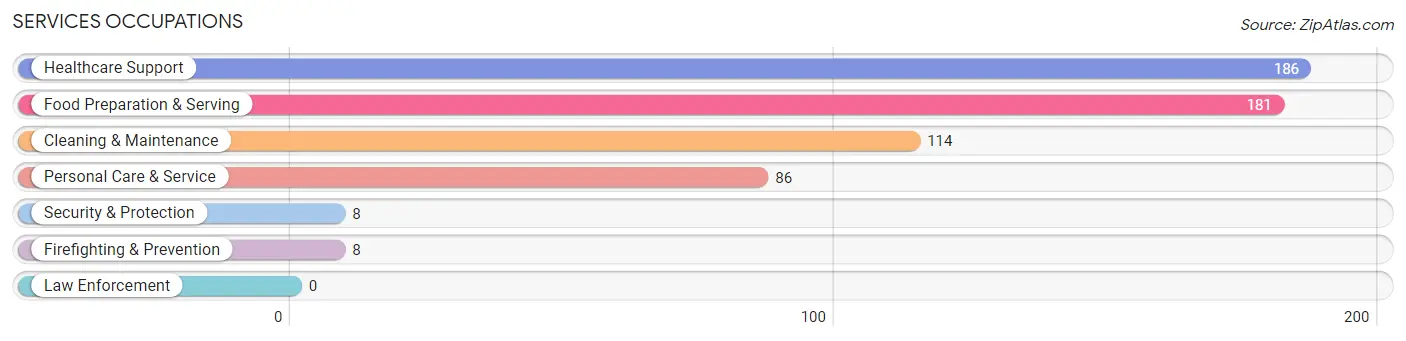
Services Occupations
The most common Services occupations in Braselton are Healthcare Support (186 | 2.6%), Food Preparation & Serving (181 | 2.6%), Cleaning & Maintenance (114 | 1.6%), Personal Care & Service (86 | 1.2%), and Security & Protection (8 | 0.1%).
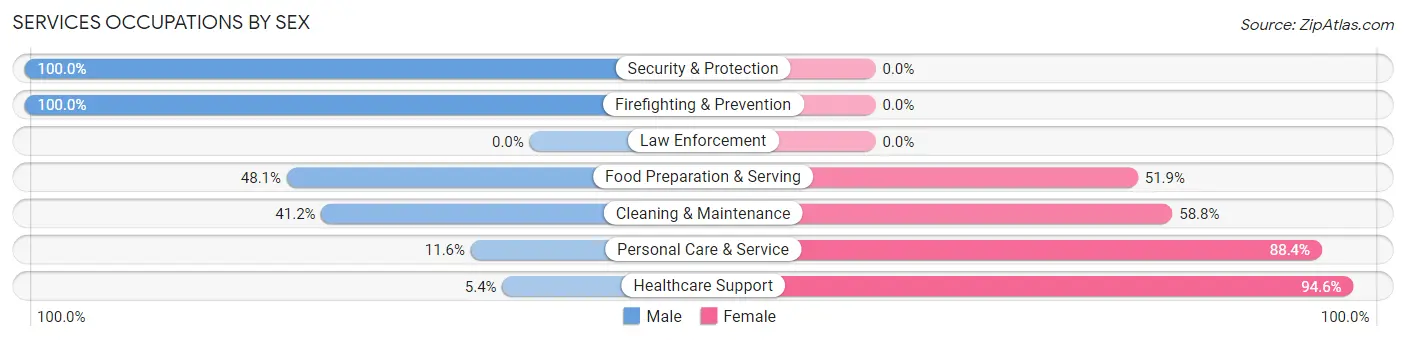
Services Occupations by Sex
Within the Services occupations in Braselton, the most male-oriented occupations are Security & Protection (100.0%), Firefighting & Prevention (100.0%), and Food Preparation & Serving (48.1%), while the most female-oriented occupations are Healthcare Support (94.6%), Personal Care & Service (88.4%), and Cleaning & Maintenance (58.8%).
| Occupation | Male | Female |
| Healthcare Support | 10 (5.4%) | 176 (94.6%) |
| Security & Protection | 8 (100.0%) | 0 (0.0%) |
| Firefighting & Prevention | 8 (100.0%) | 0 (0.0%) |
| Law Enforcement | 0 (0.0%) | 0 (0.0%) |
| Food Preparation & Serving | 87 (48.1%) | 94 (51.9%) |
| Cleaning & Maintenance | 47 (41.2%) | 67 (58.8%) |
| Personal Care & Service | 10 (11.6%) | 76 (88.4%) |
| Total (Category) | 162 (28.2%) | 413 (71.8%) |
| Total (Overall) | 3,597 (51.0%) | 3,452 (49.0%) |
Sales and Office Occupations
The most common Sales and Office occupations in Braselton are Office & Administration (1,050 | 14.9%), and Sales & Related (852 | 12.1%).
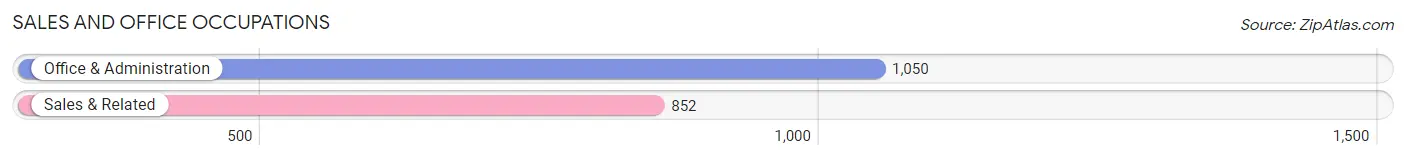
Sales and Office Occupations by Sex
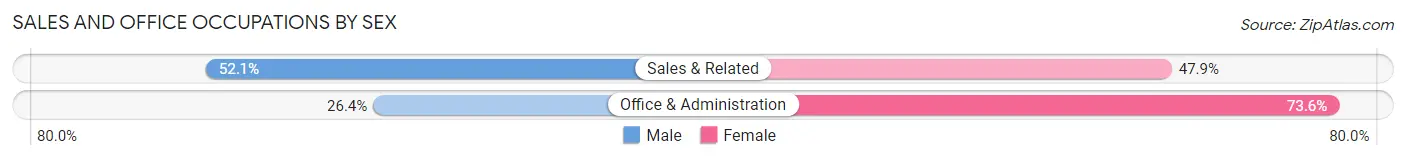
| Occupation | Male | Female |
| Sales & Related | 444 (52.1%) | 408 (47.9%) |
| Office & Administration | 277 (26.4%) | 773 (73.6%) |
| Total (Category) | 721 (37.9%) | 1,181 (62.1%) |
| Total (Overall) | 3,597 (51.0%) | 3,452 (49.0%) |
Natural Resources, Construction and Maintenance Occupations
The most common Natural Resources, Construction and Maintenance occupations in Braselton are Installation, Maintenance & Repair (100 | 1.4%), and Construction & Extraction (79 | 1.1%).
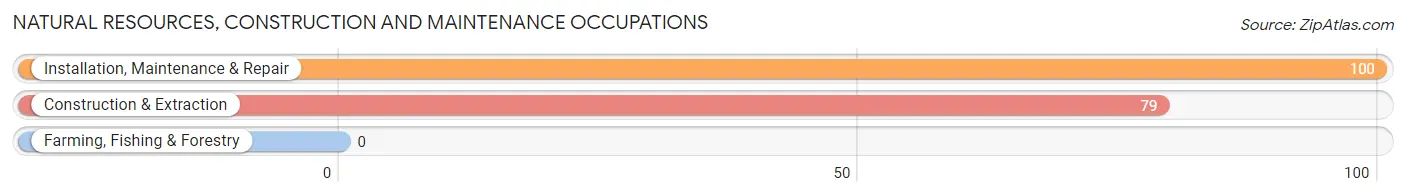
Natural Resources, Construction and Maintenance Occupations by Sex
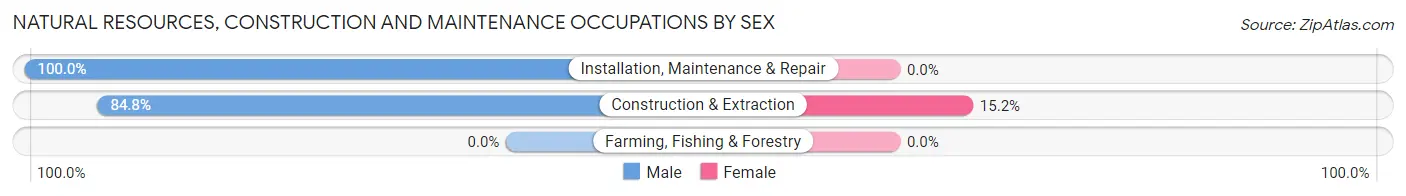
| Occupation | Male | Female |
| Farming, Fishing & Forestry | 0 (0.0%) | 0 (0.0%) |
| Construction & Extraction | 67 (84.8%) | 12 (15.2%) |
| Installation, Maintenance & Repair | 100 (100.0%) | 0 (0.0%) |
| Total (Category) | 167 (93.3%) | 12 (6.7%) |
| Total (Overall) | 3,597 (51.0%) | 3,452 (49.0%) |
Production, Transportation and Moving Occupations
The most common Production, Transportation and Moving occupations in Braselton are Material Moving (295 | 4.2%), Production (284 | 4.0%), and Transportation (127 | 1.8%).
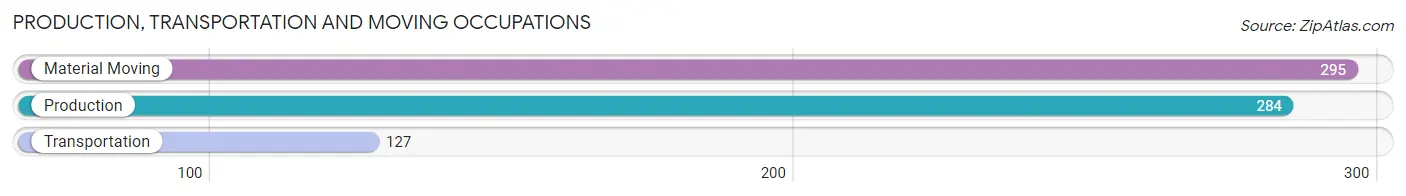
Production, Transportation and Moving Occupations by Sex
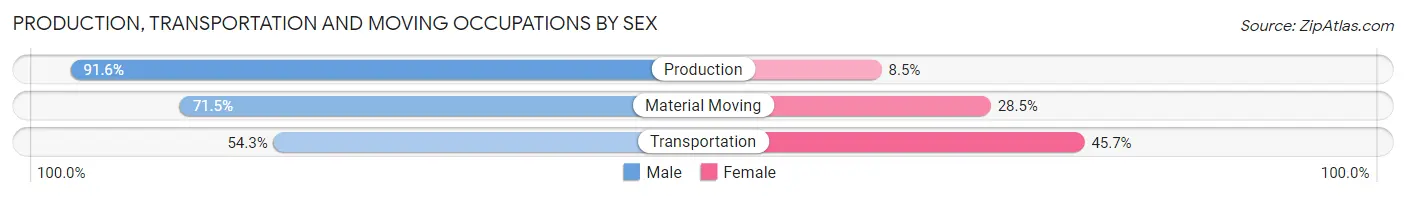
| Occupation | Male | Female |
| Production | 260 (91.5%) | 24 (8.5%) |
| Transportation | 69 (54.3%) | 58 (45.7%) |
| Material Moving | 211 (71.5%) | 84 (28.5%) |
| Total (Category) | 540 (76.5%) | 166 (23.5%) |
| Total (Overall) | 3,597 (51.0%) | 3,452 (49.0%) |
Employment Industries by Sex in Braselton
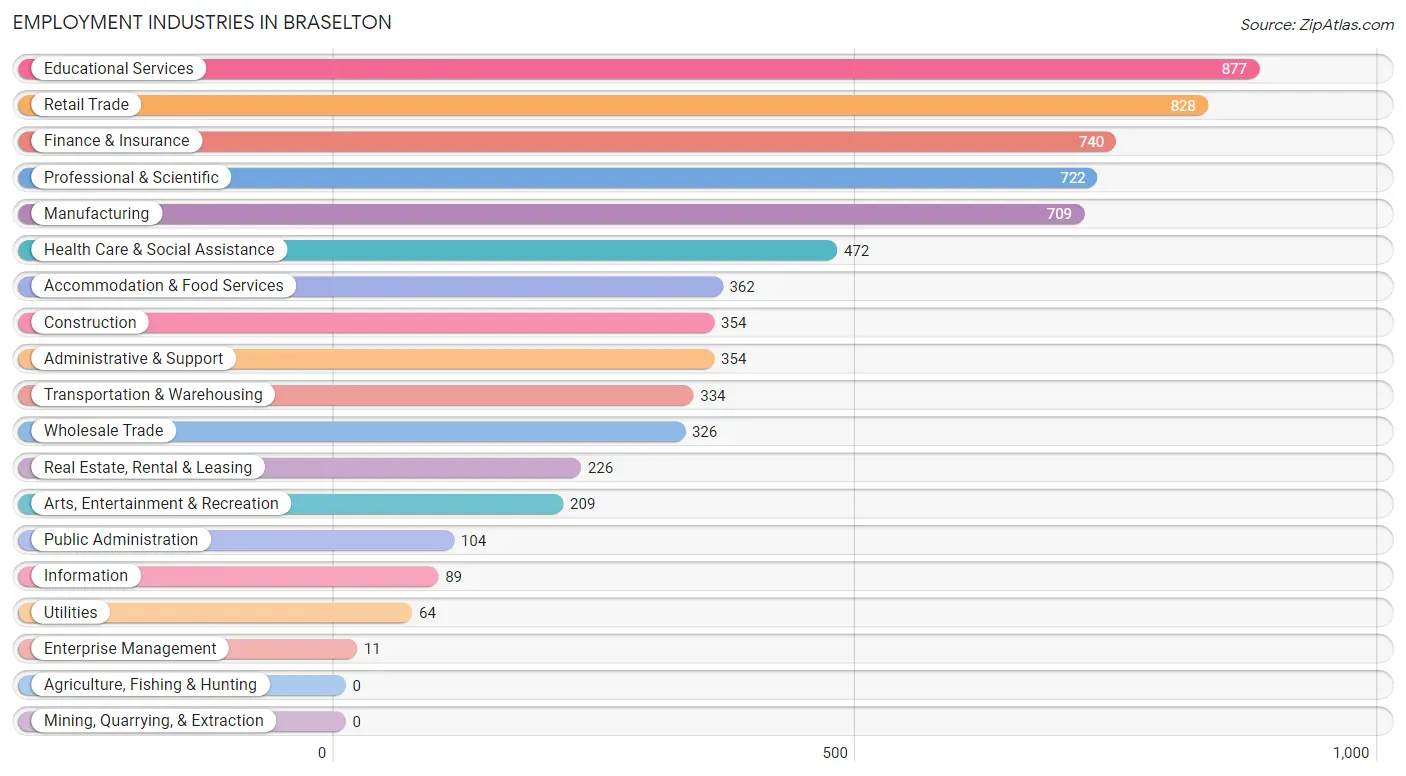
Employment Industries in Braselton
The major employment industries in Braselton include Educational Services (877 | 12.4%), Retail Trade (828 | 11.7%), Finance & Insurance (740 | 10.5%), Professional & Scientific (722 | 10.2%), and Manufacturing (709 | 10.1%).
Employment Industries by Sex in Braselton
The Braselton industries that see more men than women are Enterprise Management (100.0%), Construction (86.4%), and Real Estate, Rental & Leasing (84.5%), whereas the industries that tend to have a higher number of women are Arts, Entertainment & Recreation (100.0%), Health Care & Social Assistance (81.8%), and Educational Services (73.3%).
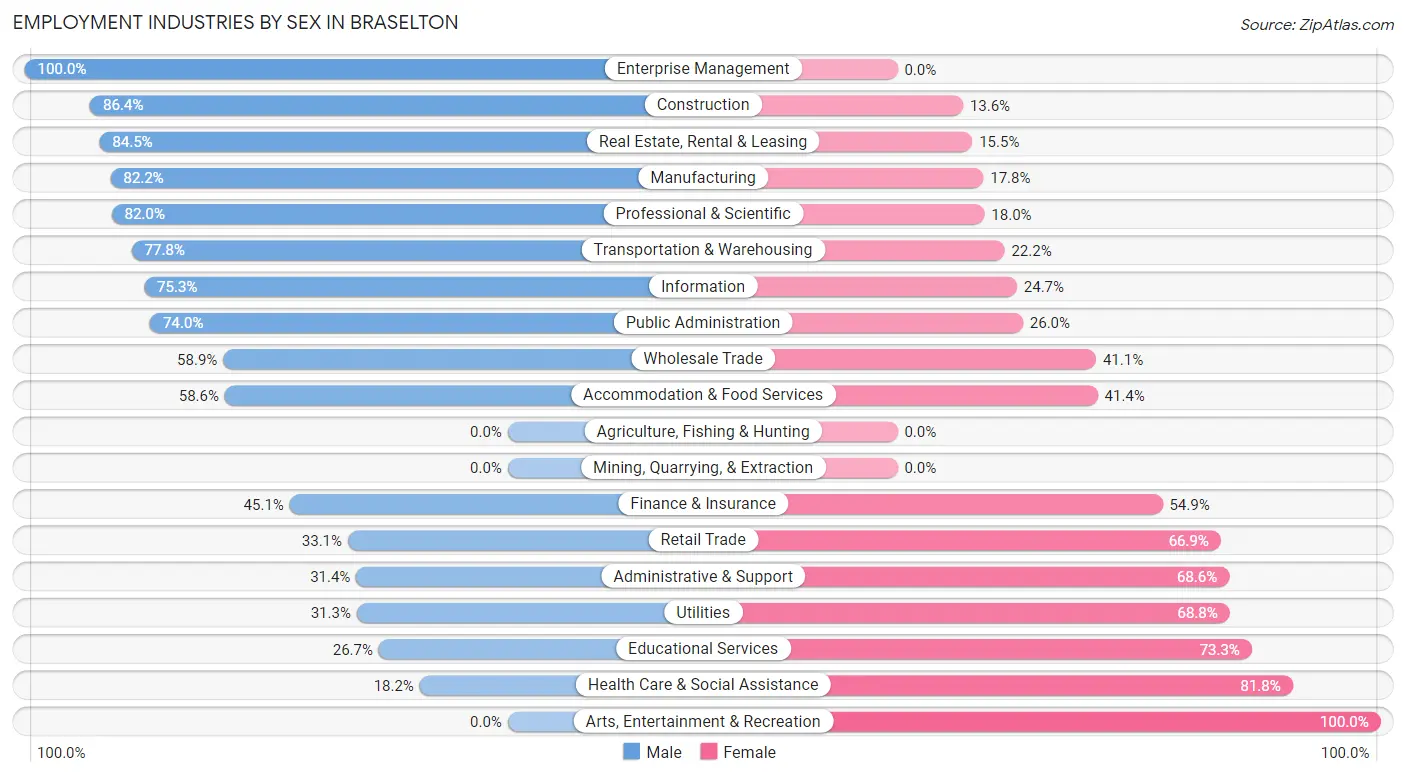
| Industry | Male | Female |
| Agriculture, Fishing & Hunting | 0 (0.0%) | 0 (0.0%) |
| Mining, Quarrying, & Extraction | 0 (0.0%) | 0 (0.0%) |
| Construction | 306 (86.4%) | 48 (13.6%) |
| Manufacturing | 583 (82.2%) | 126 (17.8%) |
| Wholesale Trade | 192 (58.9%) | 134 (41.1%) |
| Retail Trade | 274 (33.1%) | 554 (66.9%) |
| Transportation & Warehousing | 260 (77.8%) | 74 (22.2%) |
| Utilities | 20 (31.2%) | 44 (68.8%) |
| Information | 67 (75.3%) | 22 (24.7%) |
| Finance & Insurance | 334 (45.1%) | 406 (54.9%) |
| Real Estate, Rental & Leasing | 191 (84.5%) | 35 (15.5%) |
| Professional & Scientific | 592 (82.0%) | 130 (18.0%) |
| Enterprise Management | 11 (100.0%) | 0 (0.0%) |
| Administrative & Support | 111 (31.4%) | 243 (68.6%) |
| Educational Services | 234 (26.7%) | 643 (73.3%) |
| Health Care & Social Assistance | 86 (18.2%) | 386 (81.8%) |
| Arts, Entertainment & Recreation | 0 (0.0%) | 209 (100.0%) |
| Accommodation & Food Services | 212 (58.6%) | 150 (41.4%) |
| Public Administration | 77 (74.0%) | 27 (26.0%) |
| Total | 3,597 (51.0%) | 3,452 (49.0%) |
Education in Braselton
School Enrollment in Braselton
The most common levels of schooling among the 4,045 students in Braselton are middle school (1,121 | 27.7%), high school (993 | 24.5%), and elementary school (747 | 18.5%).
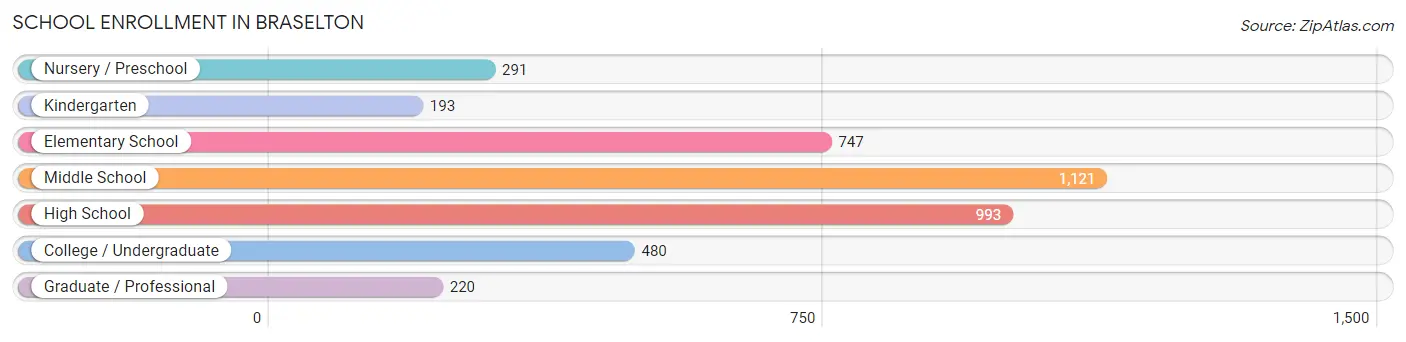
| School Level | # Students | % Students |
| Nursery / Preschool | 291 | 7.2% |
| Kindergarten | 193 | 4.8% |
| Elementary School | 747 | 18.5% |
| Middle School | 1,121 | 27.7% |
| High School | 993 | 24.5% |
| College / Undergraduate | 480 | 11.9% |
| Graduate / Professional | 220 | 5.4% |
| Total | 4,045 | 100.0% |
School Enrollment by Age by Funding Source in Braselton
Out of a total of 4,045 students who are enrolled in schools in Braselton, 498 (12.3%) attend a private institution, while the remaining 3,547 (87.7%) are enrolled in public schools. The age group of 3 to 4 year olds has the highest likelihood of being enrolled in private schools, with 123 (56.2% in the age bracket) enrolled. Conversely, the age group of 15 to 17 year olds has the lowest likelihood of being enrolled in a private school, with 807 (96.0% in the age bracket) attending a public institution.
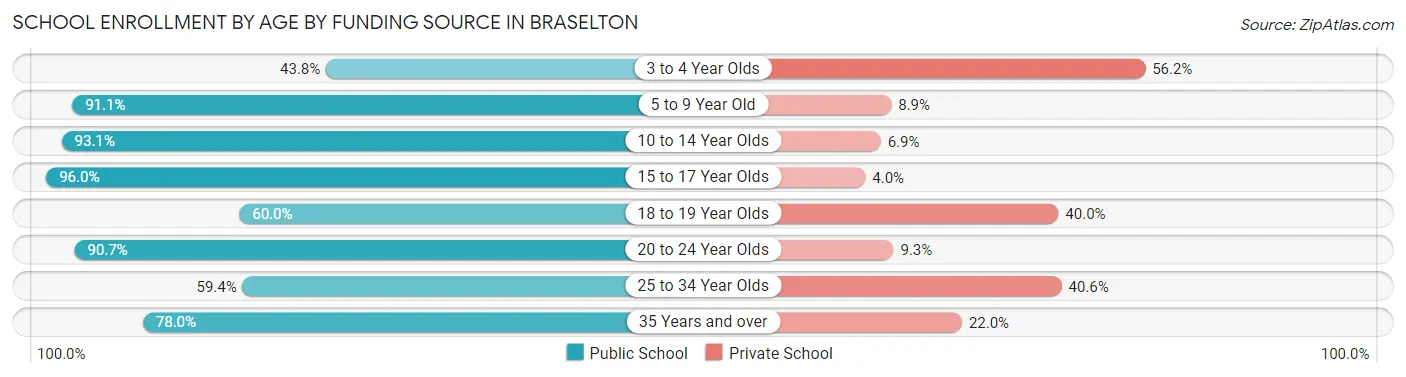
| Age Bracket | Public School | Private School |
| 3 to 4 Year Olds | 96 (43.8%) | 123 (56.2%) |
| 5 to 9 Year Old | 822 (91.1%) | 80 (8.9%) |
| 10 to 14 Year Olds | 1,228 (93.1%) | 91 (6.9%) |
| 15 to 17 Year Olds | 807 (96.0%) | 34 (4.0%) |
| 18 to 19 Year Olds | 69 (60.0%) | 46 (40.0%) |
| 20 to 24 Year Olds | 283 (90.7%) | 29 (9.3%) |
| 25 to 34 Year Olds | 60 (59.4%) | 41 (40.6%) |
| 35 Years and over | 184 (78.0%) | 52 (22.0%) |
| Total | 3,547 (87.7%) | 498 (12.3%) |
Educational Attainment by Field of Study in Braselton
Business (965 | 22.5%), education (655 | 15.3%), science & technology (528 | 12.3%), engineering (446 | 10.4%), and social sciences (365 | 8.5%) are the most common fields of study among 4,283 individuals in Braselton who have obtained a bachelor's degree or higher.
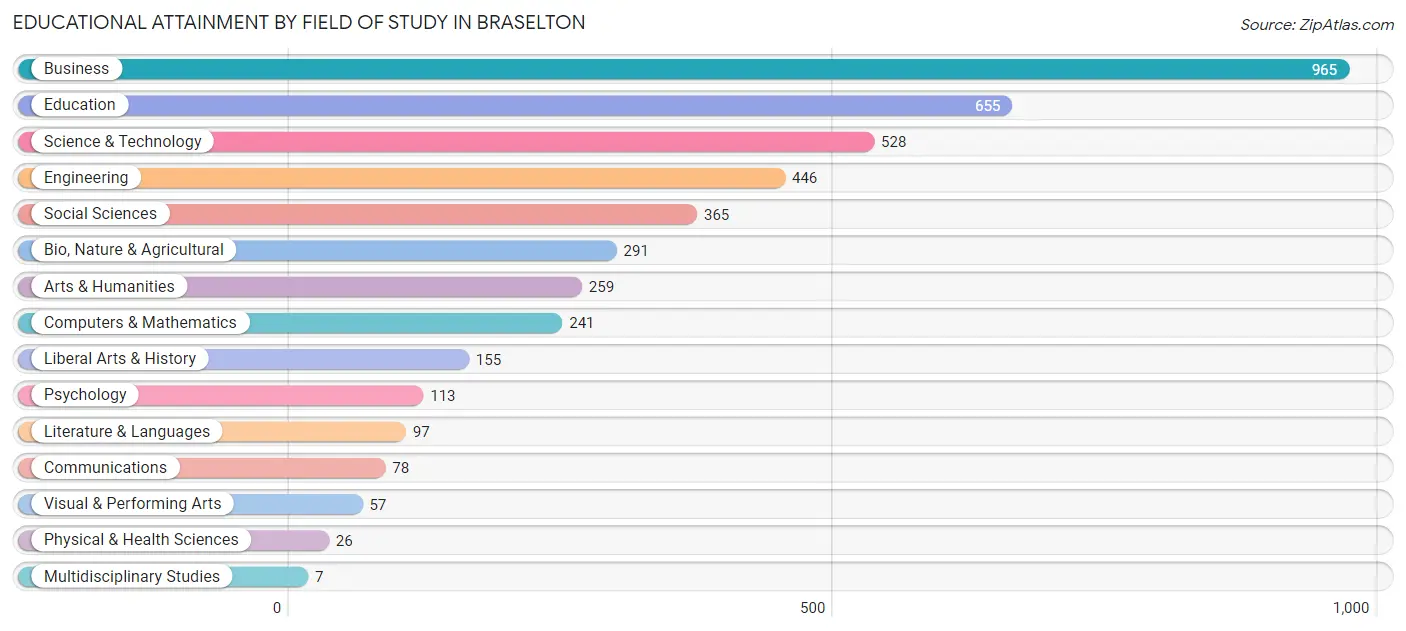
| Field of Study | # Graduates | % Graduates |
| Computers & Mathematics | 241 | 5.6% |
| Bio, Nature & Agricultural | 291 | 6.8% |
| Physical & Health Sciences | 26 | 0.6% |
| Psychology | 113 | 2.6% |
| Social Sciences | 365 | 8.5% |
| Engineering | 446 | 10.4% |
| Multidisciplinary Studies | 7 | 0.2% |
| Science & Technology | 528 | 12.3% |
| Business | 965 | 22.5% |
| Education | 655 | 15.3% |
| Literature & Languages | 97 | 2.3% |
| Liberal Arts & History | 155 | 3.6% |
| Visual & Performing Arts | 57 | 1.3% |
| Communications | 78 | 1.8% |
| Arts & Humanities | 259 | 6.0% |
| Total | 4,283 | 100.0% |
Transportation & Commute in Braselton
Vehicle Availability by Sex in Braselton
The most prevalent vehicle ownership categories in Braselton are males with 2 vehicles (1,991, accounting for 56.0%) and females with 2 vehicles (1,798, making up 59.6%).
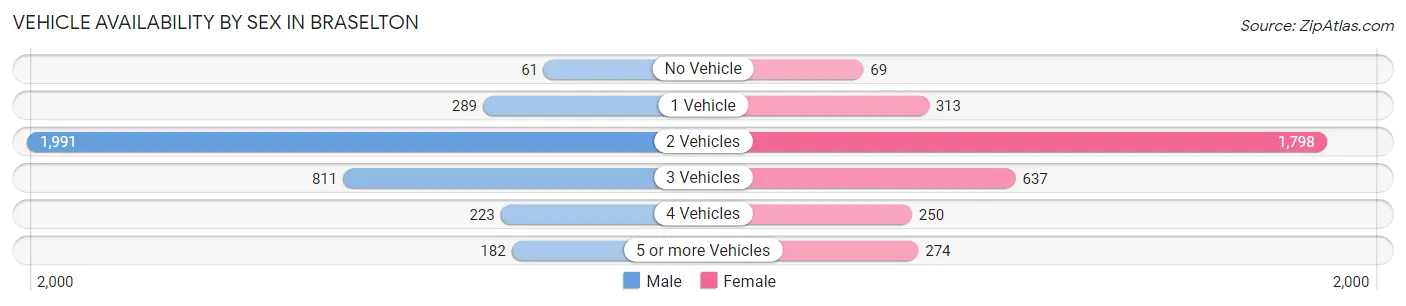
| Vehicles Available | Male | Female |
| No Vehicle | 61 (1.7%) | 69 (2.1%) |
| 1 Vehicle | 289 (8.1%) | 313 (9.4%) |
| 2 Vehicles | 1,991 (56.0%) | 1,798 (53.8%) |
| 3 Vehicles | 811 (22.8%) | 637 (19.1%) |
| 4 Vehicles | 223 (6.3%) | 250 (7.5%) |
| 5 or more Vehicles | 182 (5.1%) | 274 (8.2%) |
| Total | 3,557 (100.0%) | 3,341 (100.0%) |
Commute Time in Braselton
The most frequently occuring commute durations in Braselton are 60 to 89 minutes (948 commuters, 16.9%), 20 to 24 minutes (872 commuters, 15.5%), and 25 to 29 minutes (639 commuters, 11.4%).
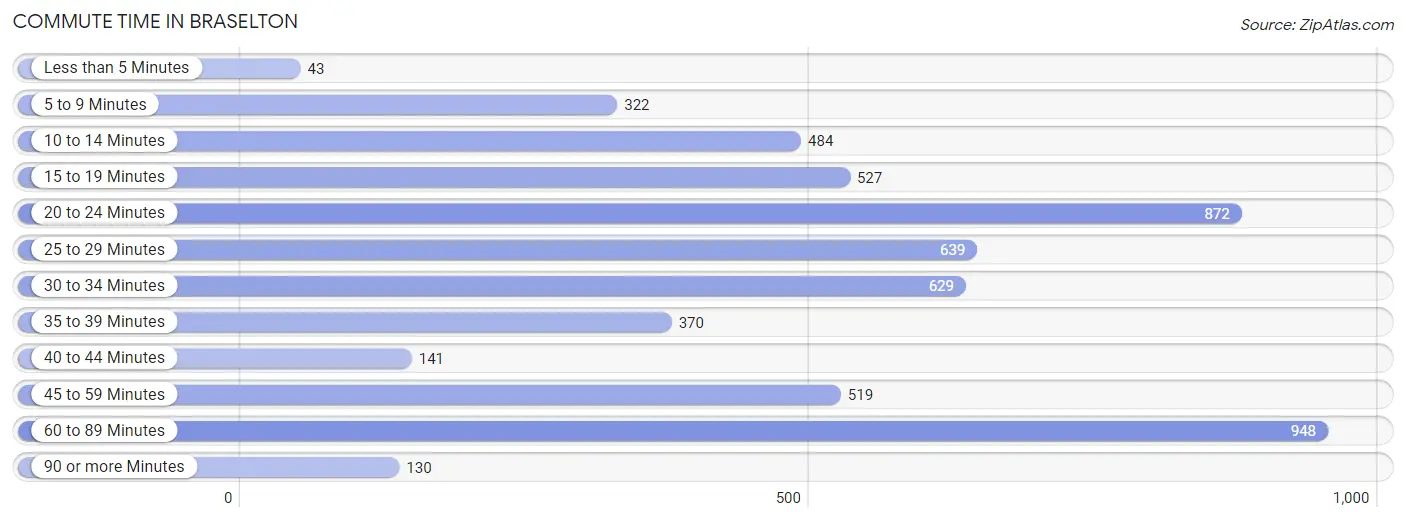
| Commute Time | # Commuters | % Commuters |
| Less than 5 Minutes | 43 | 0.8% |
| 5 to 9 Minutes | 322 | 5.7% |
| 10 to 14 Minutes | 484 | 8.6% |
| 15 to 19 Minutes | 527 | 9.4% |
| 20 to 24 Minutes | 872 | 15.5% |
| 25 to 29 Minutes | 639 | 11.4% |
| 30 to 34 Minutes | 629 | 11.2% |
| 35 to 39 Minutes | 370 | 6.6% |
| 40 to 44 Minutes | 141 | 2.5% |
| 45 to 59 Minutes | 519 | 9.2% |
| 60 to 89 Minutes | 948 | 16.9% |
| 90 or more Minutes | 130 | 2.3% |
Commute Time by Sex in Braselton
The most common commute times in Braselton are 60 to 89 minutes (621 commuters, 21.0%) for males and 25 to 29 minutes (470 commuters, 17.6%) for females.
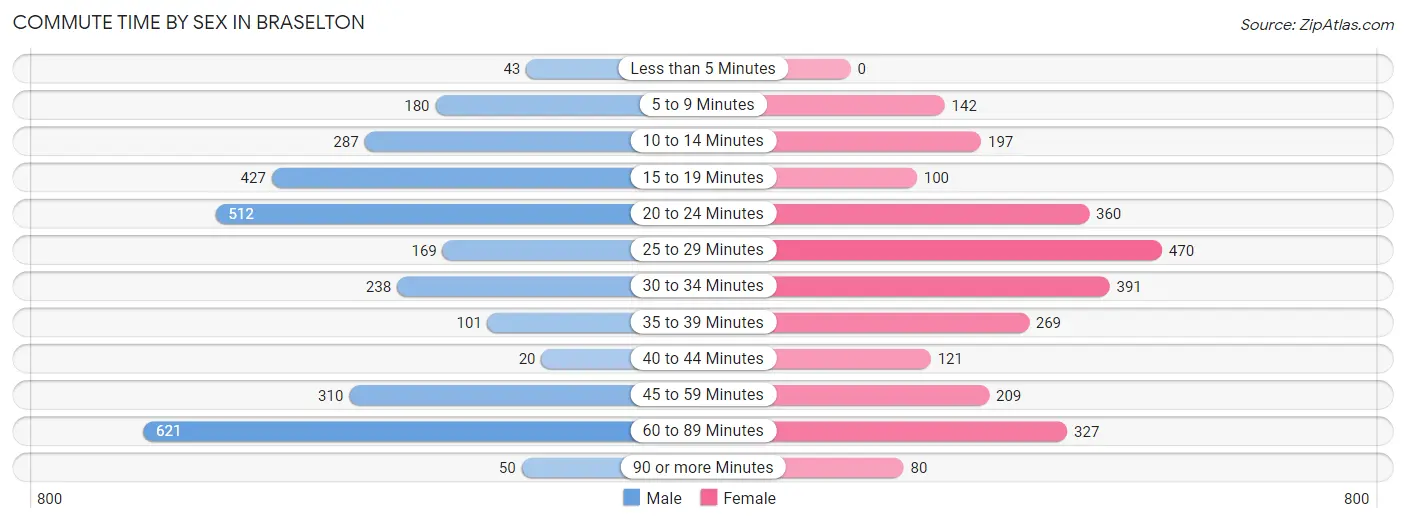
| Commute Time | Male | Female |
| Less than 5 Minutes | 43 (1.5%) | 0 (0.0%) |
| 5 to 9 Minutes | 180 (6.1%) | 142 (5.3%) |
| 10 to 14 Minutes | 287 (9.7%) | 197 (7.4%) |
| 15 to 19 Minutes | 427 (14.4%) | 100 (3.7%) |
| 20 to 24 Minutes | 512 (17.3%) | 360 (13.5%) |
| 25 to 29 Minutes | 169 (5.7%) | 470 (17.6%) |
| 30 to 34 Minutes | 238 (8.1%) | 391 (14.7%) |
| 35 to 39 Minutes | 101 (3.4%) | 269 (10.1%) |
| 40 to 44 Minutes | 20 (0.7%) | 121 (4.5%) |
| 45 to 59 Minutes | 310 (10.5%) | 209 (7.8%) |
| 60 to 89 Minutes | 621 (21.0%) | 327 (12.3%) |
| 90 or more Minutes | 50 (1.7%) | 80 (3.0%) |
Time of Departure to Work by Sex in Braselton
The most frequent times of departure to work in Braselton are 7:00 AM to 7:29 AM (536, 18.1%) for males and 7:00 AM to 7:29 AM (740, 27.8%) for females.
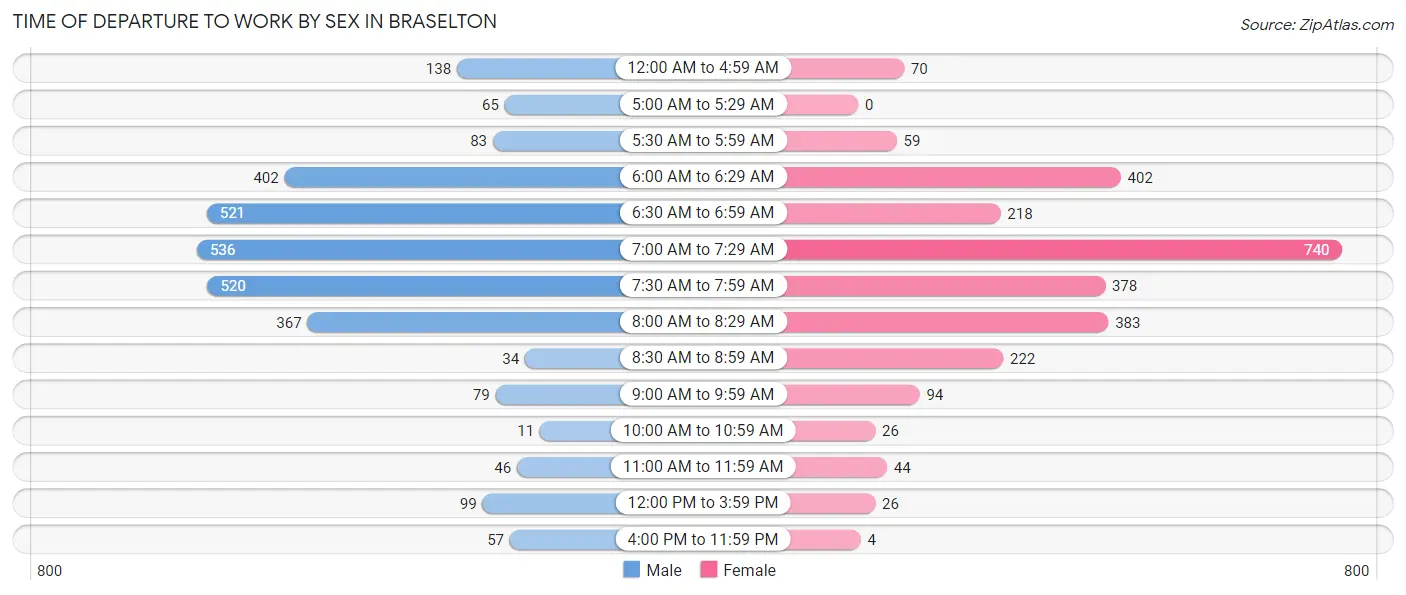
| Time of Departure | Male | Female |
| 12:00 AM to 4:59 AM | 138 (4.7%) | 70 (2.6%) |
| 5:00 AM to 5:29 AM | 65 (2.2%) | 0 (0.0%) |
| 5:30 AM to 5:59 AM | 83 (2.8%) | 59 (2.2%) |
| 6:00 AM to 6:29 AM | 402 (13.6%) | 402 (15.1%) |
| 6:30 AM to 6:59 AM | 521 (17.6%) | 218 (8.2%) |
| 7:00 AM to 7:29 AM | 536 (18.1%) | 740 (27.8%) |
| 7:30 AM to 7:59 AM | 520 (17.6%) | 378 (14.2%) |
| 8:00 AM to 8:29 AM | 367 (12.4%) | 383 (14.4%) |
| 8:30 AM to 8:59 AM | 34 (1.1%) | 222 (8.3%) |
| 9:00 AM to 9:59 AM | 79 (2.7%) | 94 (3.5%) |
| 10:00 AM to 10:59 AM | 11 (0.4%) | 26 (1.0%) |
| 11:00 AM to 11:59 AM | 46 (1.6%) | 44 (1.7%) |
| 12:00 PM to 3:59 PM | 99 (3.4%) | 26 (1.0%) |
| 4:00 PM to 11:59 PM | 57 (1.9%) | 4 (0.2%) |
| Total | 2,958 (100.0%) | 2,666 (100.0%) |
Housing Occupancy in Braselton
Occupancy by Ownership in Braselton
Of the total 5,070 dwellings in Braselton, owner-occupied units account for 4,093 (80.7%), while renter-occupied units make up 977 (19.3%).
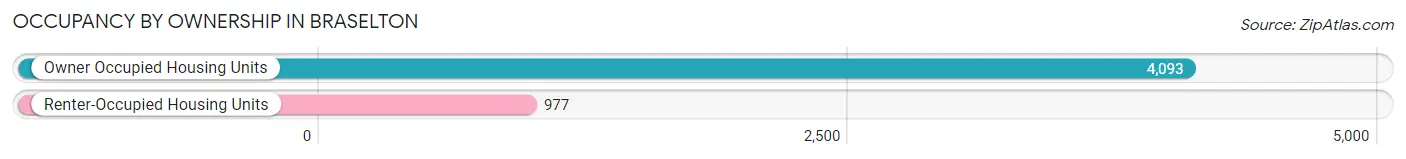
| Occupancy | # Housing Units | % Housing Units |
| Owner Occupied Housing Units | 4,093 | 80.7% |
| Renter-Occupied Housing Units | 977 | 19.3% |
| Total Occupied Housing Units | 5,070 | 100.0% |
Occupancy by Household Size in Braselton
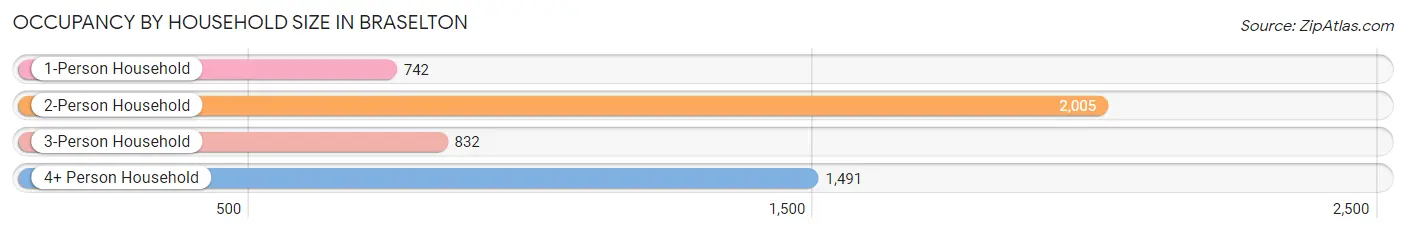
| Household Size | # Housing Units | % Housing Units |
| 1-Person Household | 742 | 14.6% |
| 2-Person Household | 2,005 | 39.6% |
| 3-Person Household | 832 | 16.4% |
| 4+ Person Household | 1,491 | 29.4% |
| Total Housing Units | 5,070 | 100.0% |
Occupancy by Ownership by Household Size in Braselton
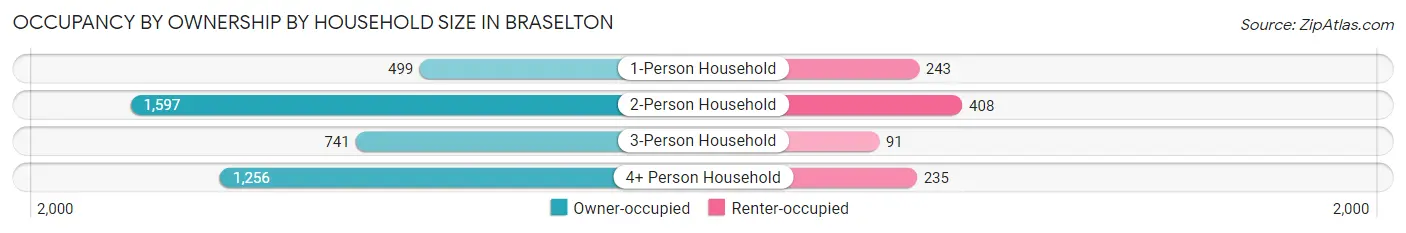
| Household Size | Owner-occupied | Renter-occupied |
| 1-Person Household | 499 (67.2%) | 243 (32.8%) |
| 2-Person Household | 1,597 (79.6%) | 408 (20.3%) |
| 3-Person Household | 741 (89.1%) | 91 (10.9%) |
| 4+ Person Household | 1,256 (84.2%) | 235 (15.8%) |
| Total Housing Units | 4,093 (80.7%) | 977 (19.3%) |
Occupancy by Educational Attainment in Braselton
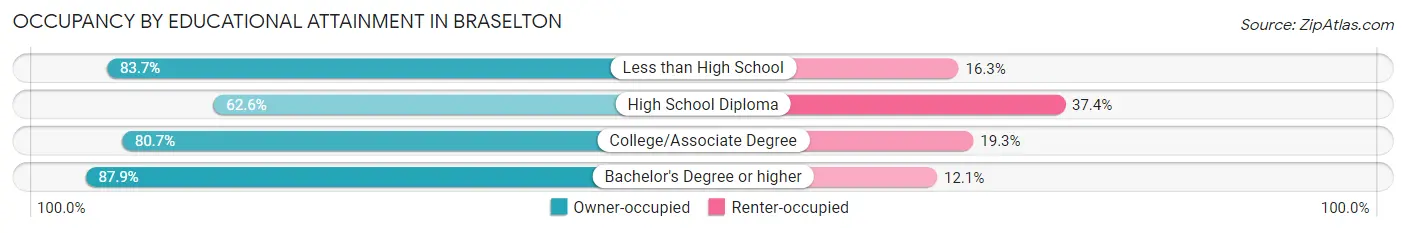
| Household Size | Owner-occupied | Renter-occupied |
| Less than High School | 287 (83.7%) | 56 (16.3%) |
| High School Diploma | 665 (62.6%) | 398 (37.4%) |
| College/Associate Degree | 905 (80.7%) | 216 (19.3%) |
| Bachelor's Degree or higher | 2,236 (87.9%) | 307 (12.1%) |
Occupancy by Age of Householder in Braselton
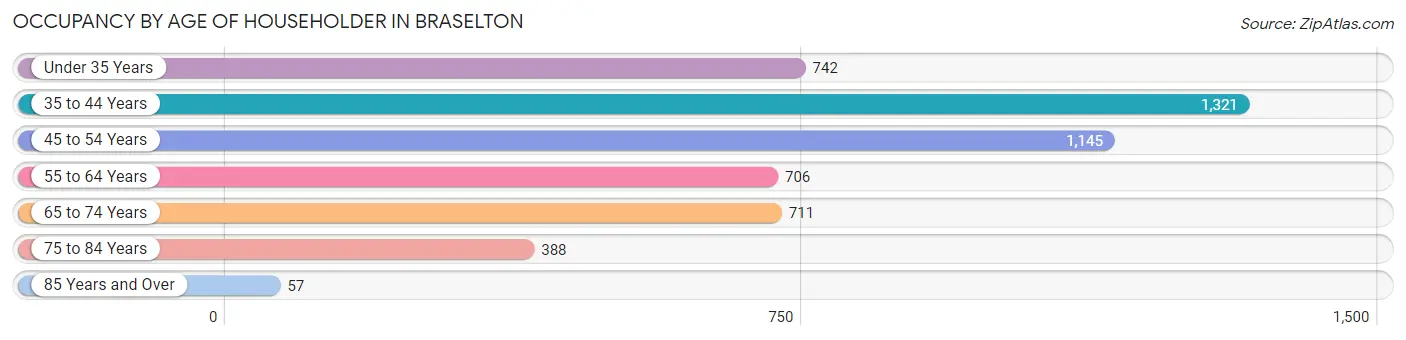
| Age Bracket | # Households | % Households |
| Under 35 Years | 742 | 14.6% |
| 35 to 44 Years | 1,321 | 26.1% |
| 45 to 54 Years | 1,145 | 22.6% |
| 55 to 64 Years | 706 | 13.9% |
| 65 to 74 Years | 711 | 14.0% |
| 75 to 84 Years | 388 | 7.6% |
| 85 Years and Over | 57 | 1.1% |
| Total | 5,070 | 100.0% |
Housing Finances in Braselton
Median Income by Occupancy in Braselton
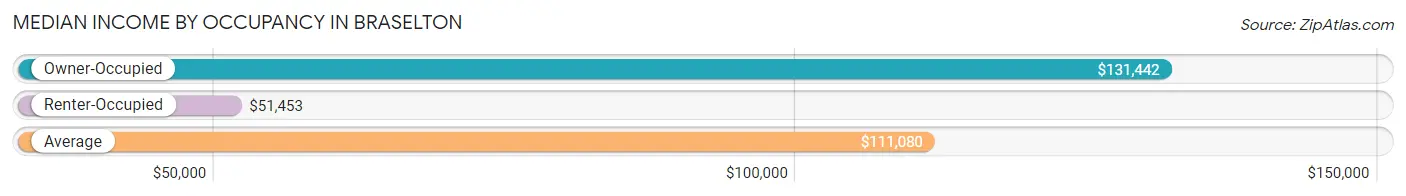
| Occupancy Type | # Households | Median Income |
| Owner-Occupied | 4,093 (80.7%) | $131,442 |
| Renter-Occupied | 977 (19.3%) | $51,453 |
| Average | 5,070 (100.0%) | $111,080 |
Occupancy by Householder Income Bracket in Braselton
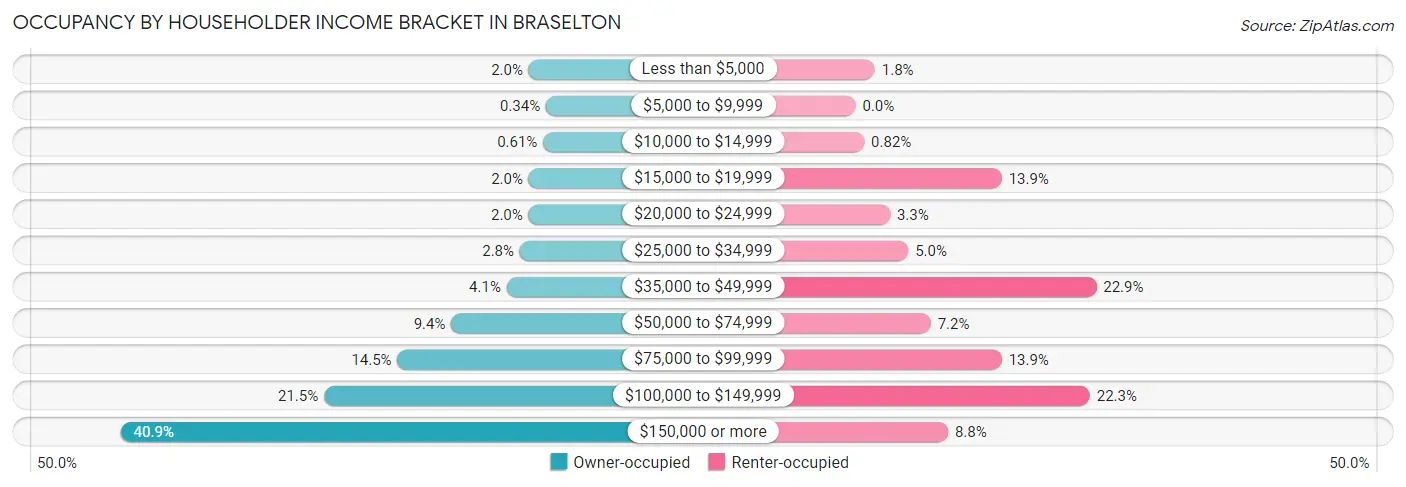
| Income Bracket | Owner-occupied | Renter-occupied |
| Less than $5,000 | 81 (2.0%) | 18 (1.8%) |
| $5,000 to $9,999 | 14 (0.3%) | 0 (0.0%) |
| $10,000 to $14,999 | 25 (0.6%) | 8 (0.8%) |
| $15,000 to $19,999 | 81 (2.0%) | 136 (13.9%) |
| $20,000 to $24,999 | 82 (2.0%) | 32 (3.3%) |
| $25,000 to $34,999 | 116 (2.8%) | 49 (5.0%) |
| $35,000 to $49,999 | 167 (4.1%) | 224 (22.9%) |
| $50,000 to $74,999 | 383 (9.4%) | 70 (7.2%) |
| $75,000 to $99,999 | 593 (14.5%) | 136 (13.9%) |
| $100,000 to $149,999 | 879 (21.5%) | 218 (22.3%) |
| $150,000 or more | 1,672 (40.8%) | 86 (8.8%) |
| Total | 4,093 (100.0%) | 977 (100.0%) |
Monthly Housing Cost Tiers in Braselton
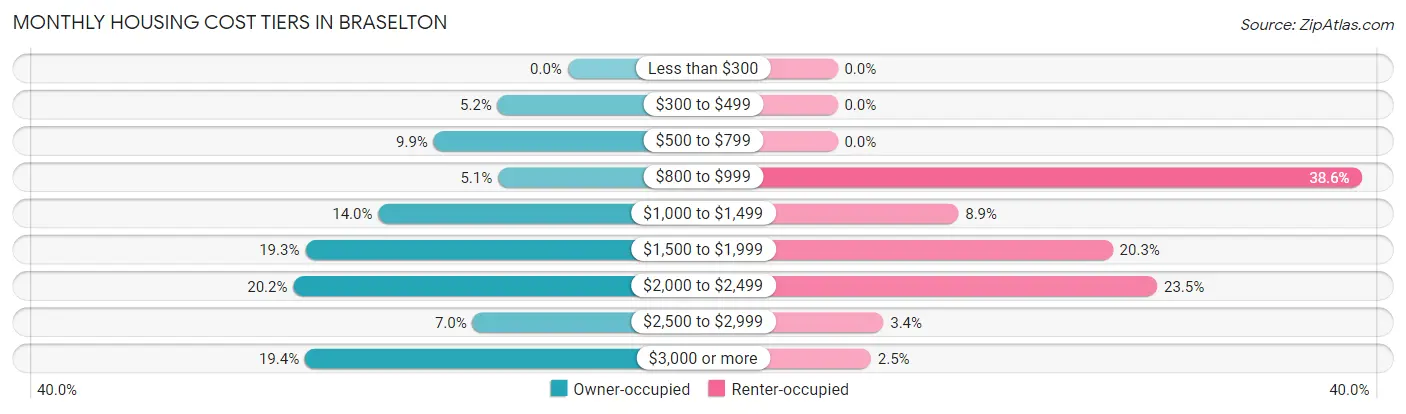
| Monthly Cost | Owner-occupied | Renter-occupied |
| Less than $300 | 0 (0.0%) | 0 (0.0%) |
| $300 to $499 | 211 (5.2%) | 0 (0.0%) |
| $500 to $799 | 404 (9.9%) | 0 (0.0%) |
| $800 to $999 | 210 (5.1%) | 377 (38.6%) |
| $1,000 to $1,499 | 571 (14.0%) | 87 (8.9%) |
| $1,500 to $1,999 | 791 (19.3%) | 198 (20.3%) |
| $2,000 to $2,499 | 827 (20.2%) | 230 (23.5%) |
| $2,500 to $2,999 | 287 (7.0%) | 33 (3.4%) |
| $3,000 or more | 792 (19.4%) | 24 (2.5%) |
| Total | 4,093 (100.0%) | 977 (100.0%) |
Physical Housing Characteristics in Braselton
Housing Structures in Braselton
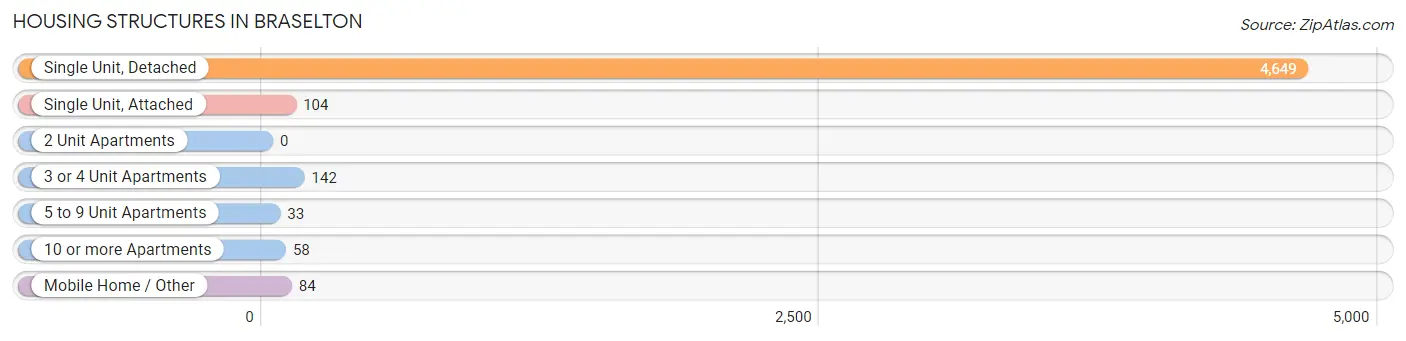
| Structure Type | # Housing Units | % Housing Units |
| Single Unit, Detached | 4,649 | 91.7% |
| Single Unit, Attached | 104 | 2.1% |
| 2 Unit Apartments | 0 | 0.0% |
| 3 or 4 Unit Apartments | 142 | 2.8% |
| 5 to 9 Unit Apartments | 33 | 0.6% |
| 10 or more Apartments | 58 | 1.1% |
| Mobile Home / Other | 84 | 1.7% |
| Total | 5,070 | 100.0% |
Housing Structures by Occupancy in Braselton
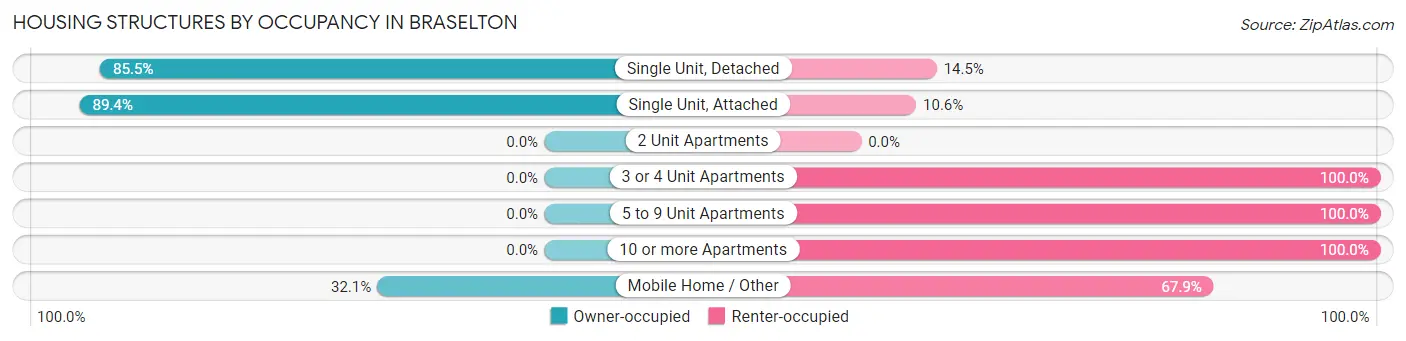
| Structure Type | Owner-occupied | Renter-occupied |
| Single Unit, Detached | 3,973 (85.5%) | 676 (14.5%) |
| Single Unit, Attached | 93 (89.4%) | 11 (10.6%) |
| 2 Unit Apartments | 0 (0.0%) | 0 (0.0%) |
| 3 or 4 Unit Apartments | 0 (0.0%) | 142 (100.0%) |
| 5 to 9 Unit Apartments | 0 (0.0%) | 33 (100.0%) |
| 10 or more Apartments | 0 (0.0%) | 58 (100.0%) |
| Mobile Home / Other | 27 (32.1%) | 57 (67.9%) |
| Total | 4,093 (80.7%) | 977 (19.3%) |
Housing Structures by Number of Rooms in Braselton
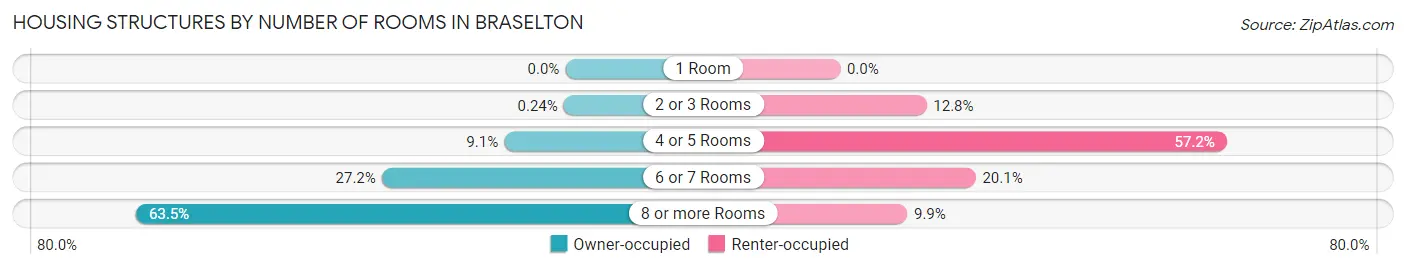
| Number of Rooms | Owner-occupied | Renter-occupied |
| 1 Room | 0 (0.0%) | 0 (0.0%) |
| 2 or 3 Rooms | 10 (0.2%) | 125 (12.8%) |
| 4 or 5 Rooms | 371 (9.1%) | 559 (57.2%) |
| 6 or 7 Rooms | 1,112 (27.2%) | 196 (20.1%) |
| 8 or more Rooms | 2,600 (63.5%) | 97 (9.9%) |
| Total | 4,093 (100.0%) | 977 (100.0%) |
Housing Structure by Heating Type in Braselton
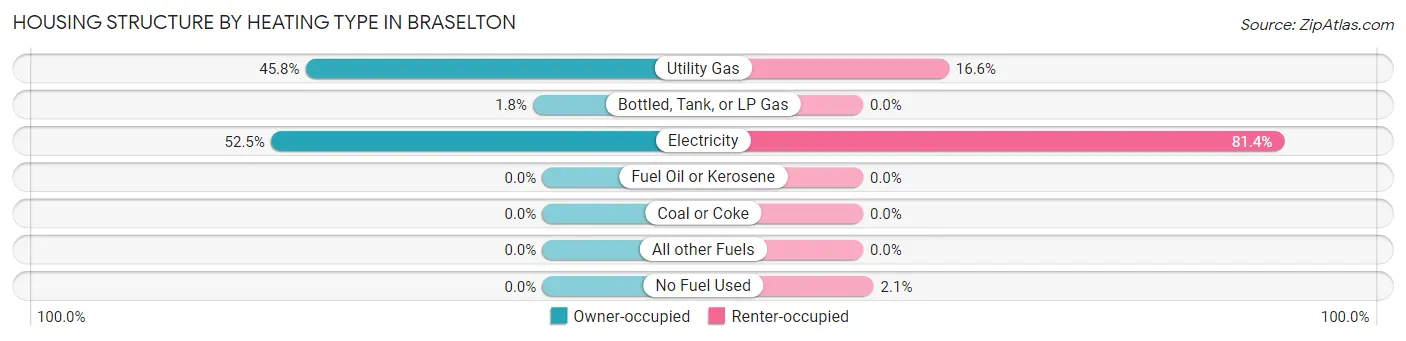
| Heating Type | Owner-occupied | Renter-occupied |
| Utility Gas | 1,873 (45.8%) | 162 (16.6%) |
| Bottled, Tank, or LP Gas | 73 (1.8%) | 0 (0.0%) |
| Electricity | 2,147 (52.5%) | 795 (81.4%) |
| Fuel Oil or Kerosene | 0 (0.0%) | 0 (0.0%) |
| Coal or Coke | 0 (0.0%) | 0 (0.0%) |
| All other Fuels | 0 (0.0%) | 0 (0.0%) |
| No Fuel Used | 0 (0.0%) | 20 (2.1%) |
| Total | 4,093 (100.0%) | 977 (100.0%) |
Household Vehicle Usage in Braselton
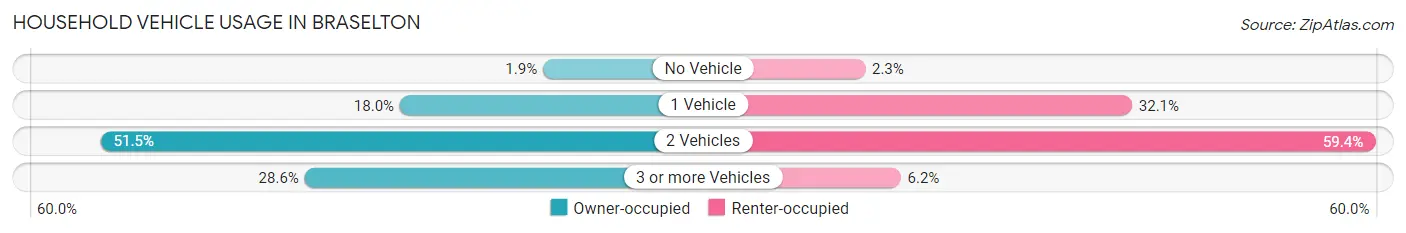
| Vehicles per Household | Owner-occupied | Renter-occupied |
| No Vehicle | 79 (1.9%) | 22 (2.2%) |
| 1 Vehicle | 735 (18.0%) | 314 (32.1%) |
| 2 Vehicles | 2,107 (51.5%) | 580 (59.4%) |
| 3 or more Vehicles | 1,172 (28.6%) | 61 (6.2%) |
| Total | 4,093 (100.0%) | 977 (100.0%) |
Real Estate & Mortgages in Braselton
Real Estate and Mortgage Overview in Braselton
| Characteristic | Without Mortgage | With Mortgage |
| Housing Units | 823 | 3,270 |
| Median Property Value | $322,200 | $404,300 |
| Median Household Income | $75,625 | $1,440 |
| Monthly Housing Costs | $677 | $792 |
| Real Estate Taxes | $3,222 | $14 |
Property Value by Mortgage Status in Braselton
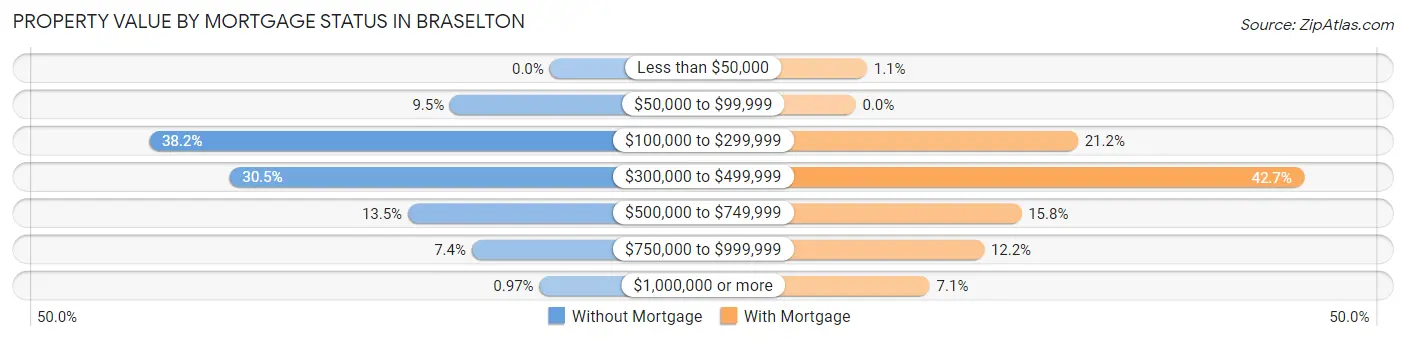
| Property Value | Without Mortgage | With Mortgage |
| Less than $50,000 | 0 (0.0%) | 35 (1.1%) |
| $50,000 to $99,999 | 78 (9.5%) | 0 (0.0%) |
| $100,000 to $299,999 | 314 (38.2%) | 692 (21.2%) |
| $300,000 to $499,999 | 251 (30.5%) | 1,396 (42.7%) |
| $500,000 to $749,999 | 111 (13.5%) | 516 (15.8%) |
| $750,000 to $999,999 | 61 (7.4%) | 400 (12.2%) |
| $1,000,000 or more | 8 (1.0%) | 231 (7.1%) |
| Total | 823 (100.0%) | 3,270 (100.0%) |
Household Income by Mortgage Status in Braselton
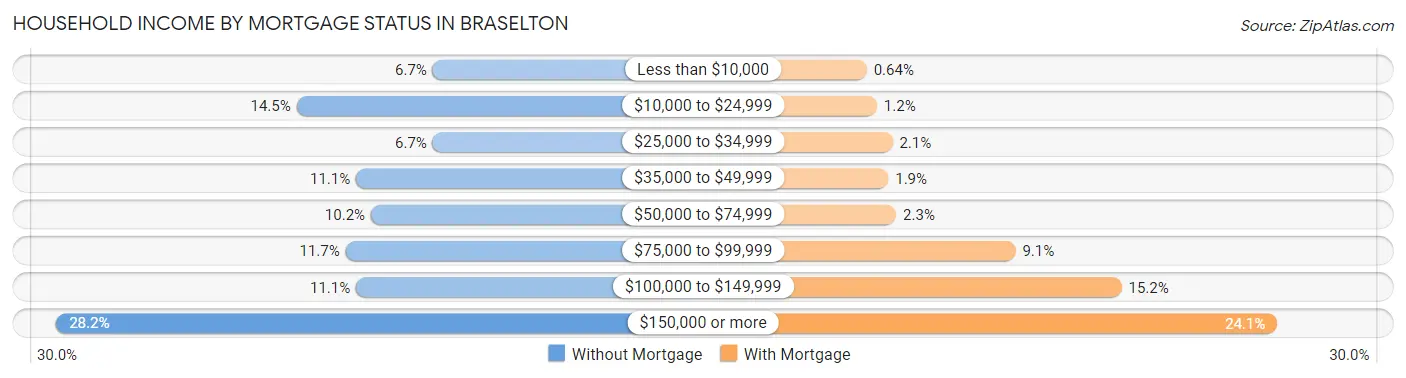
| Household Income | Without Mortgage | With Mortgage |
| Less than $10,000 | 55 (6.7%) | 21 (0.6%) |
| $10,000 to $24,999 | 119 (14.5%) | 40 (1.2%) |
| $25,000 to $34,999 | 55 (6.7%) | 69 (2.1%) |
| $35,000 to $49,999 | 91 (11.1%) | 61 (1.9%) |
| $50,000 to $74,999 | 84 (10.2%) | 76 (2.3%) |
| $75,000 to $99,999 | 96 (11.7%) | 299 (9.1%) |
| $100,000 to $149,999 | 91 (11.1%) | 497 (15.2%) |
| $150,000 or more | 232 (28.2%) | 788 (24.1%) |
| Total | 823 (100.0%) | 3,270 (100.0%) |
Property Value to Household Income Ratio in Braselton
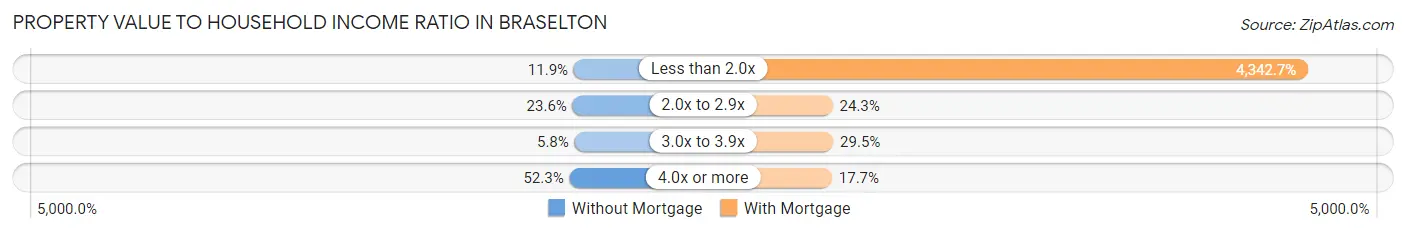
| Value-to-Income Ratio | Without Mortgage | With Mortgage |
| Less than 2.0x | 98 (11.9%) | 142,005 (4,342.7%) |
| 2.0x to 2.9x | 194 (23.6%) | 794 (24.3%) |
| 3.0x to 3.9x | 48 (5.8%) | 964 (29.5%) |
| 4.0x or more | 430 (52.2%) | 577 (17.6%) |
| Total | 823 (100.0%) | 3,270 (100.0%) |
Real Estate Taxes by Mortgage Status in Braselton
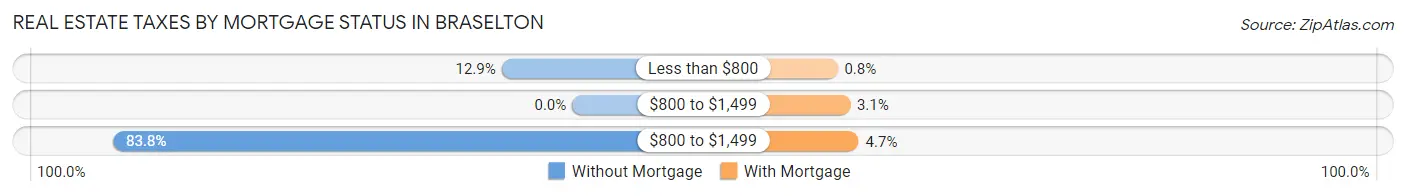
| Property Taxes | Without Mortgage | With Mortgage |
| Less than $800 | 106 (12.9%) | 26 (0.8%) |
| $800 to $1,499 | 0 (0.0%) | 101 (3.1%) |
| $800 to $1,499 | 690 (83.8%) | 153 (4.7%) |
| Total | 823 (100.0%) | 3,270 (100.0%) |
Health & Disability in Braselton
Health Insurance Coverage by Age in Braselton
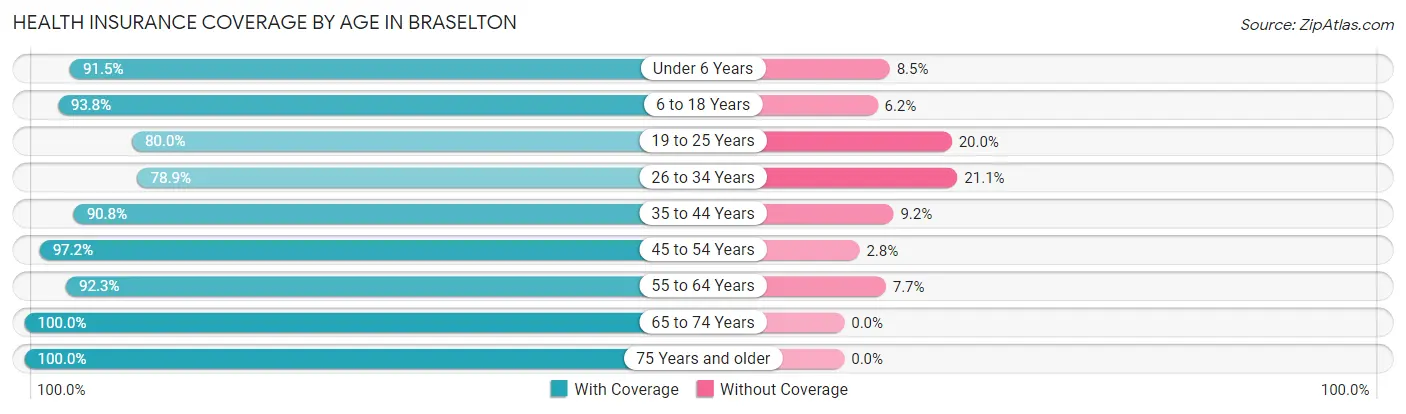
| Age Bracket | With Coverage | Without Coverage |
| Under 6 Years | 864 (91.5%) | 80 (8.5%) |
| 6 to 18 Years | 2,785 (93.8%) | 184 (6.2%) |
| 19 to 25 Years | 934 (80.0%) | 234 (20.0%) |
| 26 to 34 Years | 973 (78.9%) | 260 (21.1%) |
| 35 to 44 Years | 2,258 (90.8%) | 228 (9.2%) |
| 45 to 54 Years | 1,823 (97.2%) | 53 (2.8%) |
| 55 to 64 Years | 1,120 (92.3%) | 94 (7.7%) |
| 65 to 74 Years | 1,105 (100.0%) | 0 (0.0%) |
| 75 Years and older | 773 (100.0%) | 0 (0.0%) |
| Total | 12,635 (91.8%) | 1,133 (8.2%) |
Health Insurance Coverage by Citizenship Status in Braselton
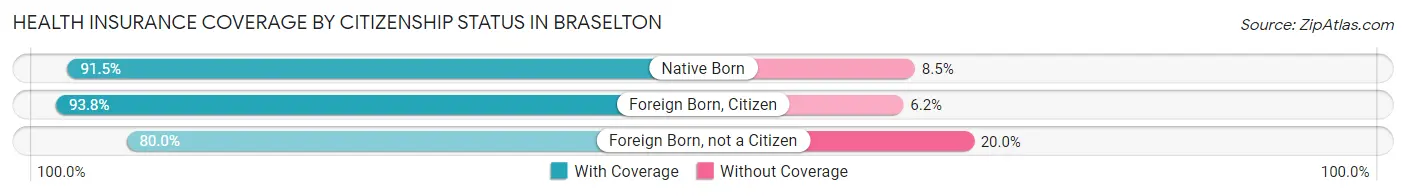
| Citizenship Status | With Coverage | Without Coverage |
| Native Born | 864 (91.5%) | 80 (8.5%) |
| Foreign Born, Citizen | 2,785 (93.8%) | 184 (6.2%) |
| Foreign Born, not a Citizen | 934 (80.0%) | 234 (20.0%) |
Health Insurance Coverage by Household Income in Braselton
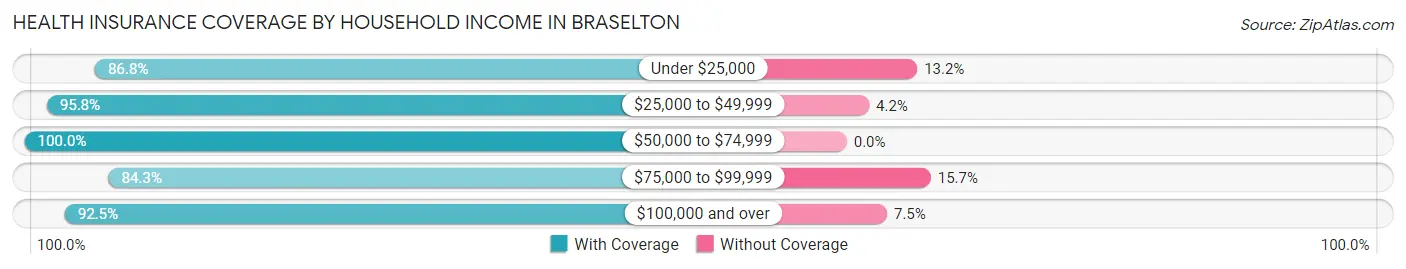
| Household Income | With Coverage | Without Coverage |
| Under $25,000 | 691 (86.8%) | 105 (13.2%) |
| $25,000 to $49,999 | 1,032 (95.8%) | 45 (4.2%) |
| $50,000 to $74,999 | 973 (100.0%) | 0 (0.0%) |
| $75,000 to $99,999 | 1,553 (84.3%) | 290 (15.7%) |
| $100,000 and over | 8,386 (92.5%) | 684 (7.5%) |
Public vs Private Health Insurance Coverage by Age in Braselton
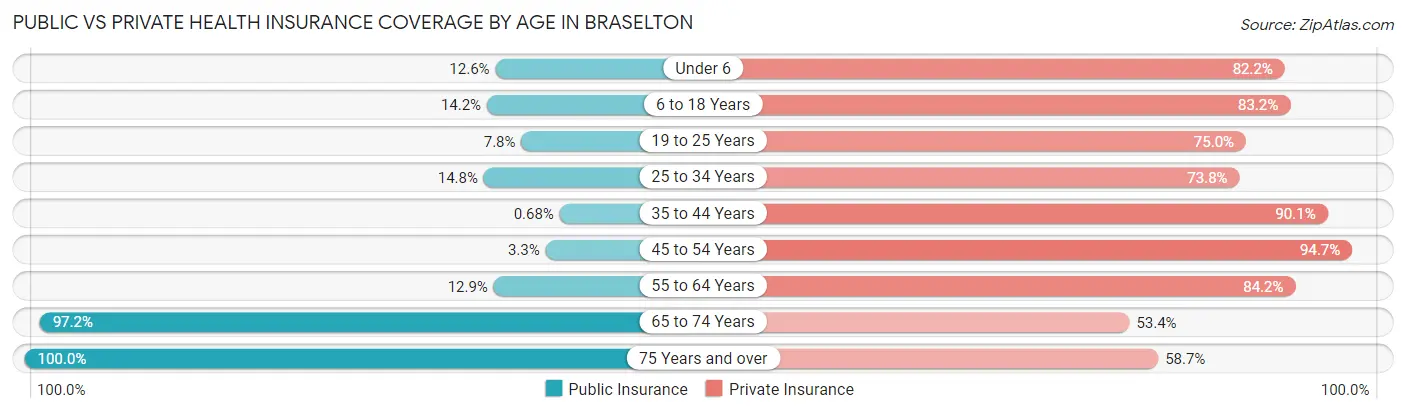
| Age Bracket | Public Insurance | Private Insurance |
| Under 6 | 119 (12.6%) | 776 (82.2%) |
| 6 to 18 Years | 421 (14.2%) | 2,470 (83.2%) |
| 19 to 25 Years | 91 (7.8%) | 876 (75.0%) |
| 25 to 34 Years | 182 (14.8%) | 910 (73.8%) |
| 35 to 44 Years | 17 (0.7%) | 2,241 (90.1%) |
| 45 to 54 Years | 62 (3.3%) | 1,777 (94.7%) |
| 55 to 64 Years | 157 (12.9%) | 1,022 (84.2%) |
| 65 to 74 Years | 1,074 (97.2%) | 590 (53.4%) |
| 75 Years and over | 773 (100.0%) | 454 (58.7%) |
| Total | 2,896 (21.0%) | 11,116 (80.7%) |
Disability Status by Sex by Age in Braselton
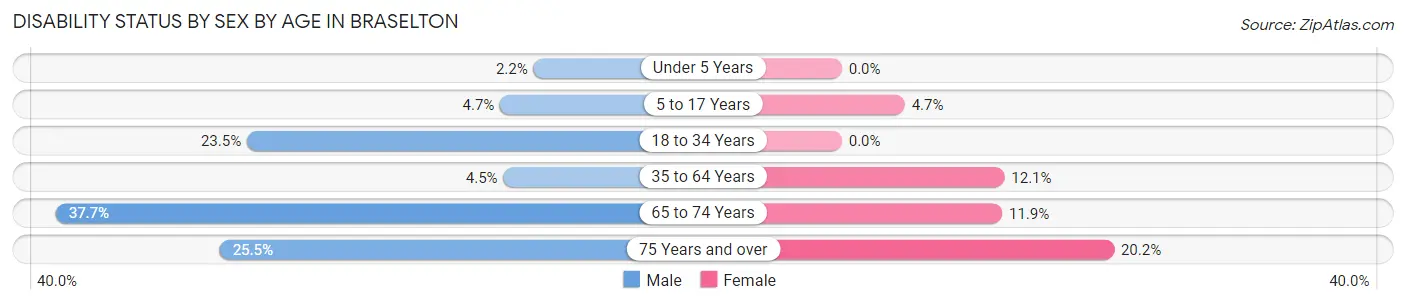
| Age Bracket | Male | Female |
| Under 5 Years | 9 (2.2%) | 0 (0.0%) |
| 5 to 17 Years | 68 (4.7%) | 78 (4.7%) |
| 18 to 34 Years | 260 (23.5%) | 0 (0.0%) |
| 35 to 64 Years | 118 (4.4%) | 353 (12.1%) |
| 65 to 74 Years | 182 (37.7%) | 74 (11.9%) |
| 75 Years and over | 100 (25.5%) | 77 (20.2%) |
Disability Class by Sex by Age in Braselton
Disability Class: Hearing Difficulty
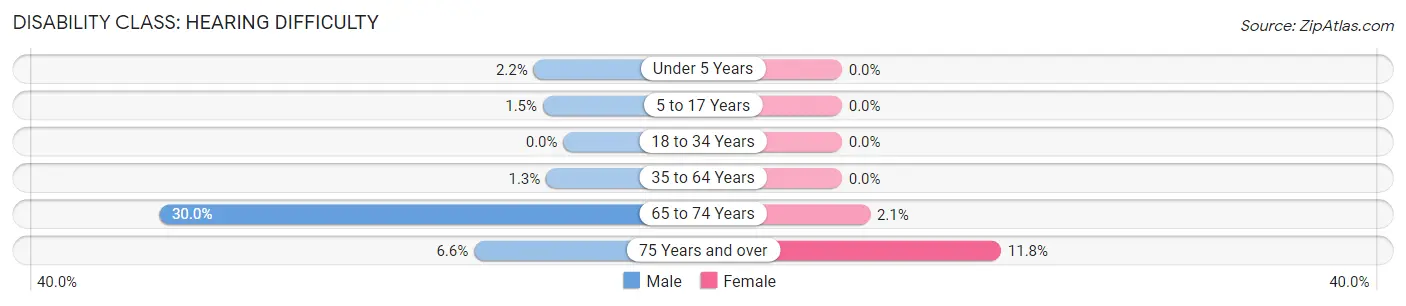
| Age Bracket | Male | Female |
| Under 5 Years | 9 (2.2%) | 0 (0.0%) |
| 5 to 17 Years | 22 (1.5%) | 0 (0.0%) |
| 18 to 34 Years | 0 (0.0%) | 0 (0.0%) |
| 35 to 64 Years | 34 (1.3%) | 0 (0.0%) |
| 65 to 74 Years | 145 (30.0%) | 13 (2.1%) |
| 75 Years and over | 26 (6.6%) | 45 (11.8%) |
Disability Class: Vision Difficulty
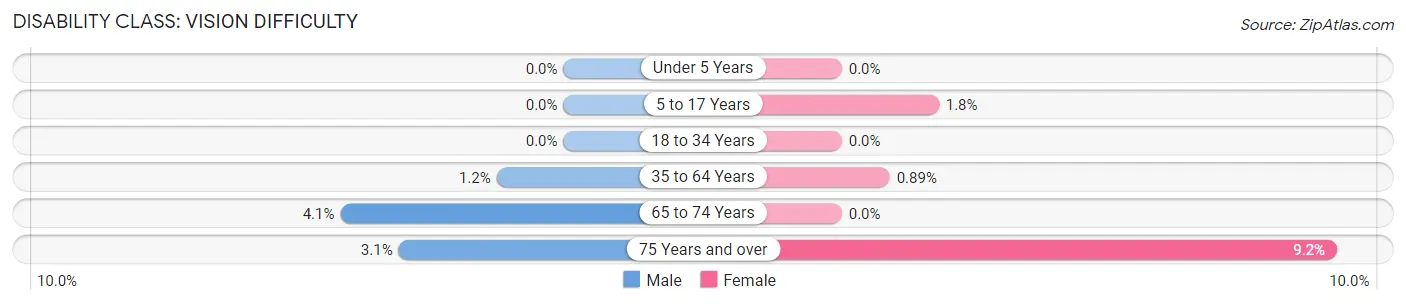
| Age Bracket | Male | Female |
| Under 5 Years | 0 (0.0%) | 0 (0.0%) |
| 5 to 17 Years | 0 (0.0%) | 30 (1.8%) |
| 18 to 34 Years | 0 (0.0%) | 0 (0.0%) |
| 35 to 64 Years | 33 (1.2%) | 26 (0.9%) |
| 65 to 74 Years | 20 (4.1%) | 0 (0.0%) |
| 75 Years and over | 12 (3.1%) | 35 (9.2%) |
Disability Class: Cognitive Difficulty
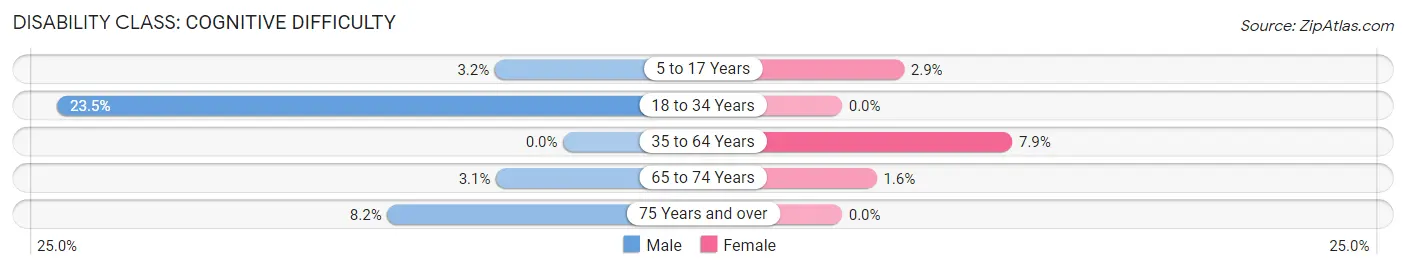
| Age Bracket | Male | Female |
| 5 to 17 Years | 46 (3.2%) | 48 (2.9%) |
| 18 to 34 Years | 260 (23.5%) | 0 (0.0%) |
| 35 to 64 Years | 0 (0.0%) | 231 (7.9%) |
| 65 to 74 Years | 15 (3.1%) | 10 (1.6%) |
| 75 Years and over | 32 (8.2%) | 0 (0.0%) |
Disability Class: Ambulatory Difficulty
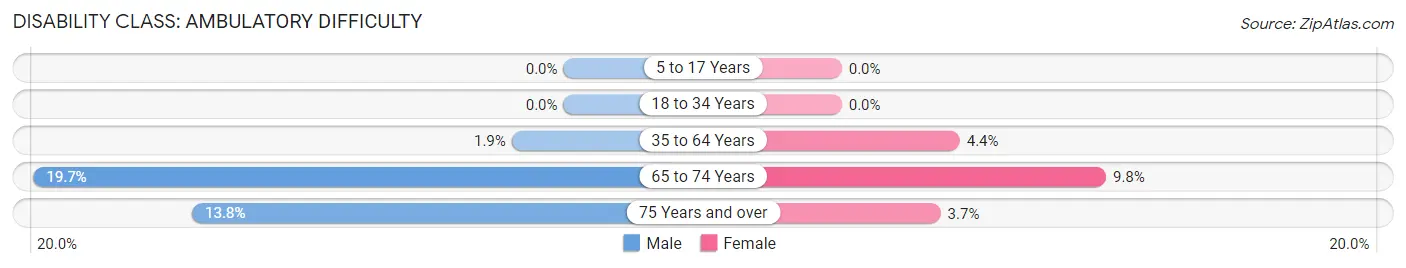
| Age Bracket | Male | Female |
| 5 to 17 Years | 0 (0.0%) | 0 (0.0%) |
| 18 to 34 Years | 0 (0.0%) | 0 (0.0%) |
| 35 to 64 Years | 51 (1.9%) | 128 (4.4%) |
| 65 to 74 Years | 95 (19.7%) | 61 (9.8%) |
| 75 Years and over | 54 (13.8%) | 14 (3.7%) |
Disability Class: Self-Care Difficulty
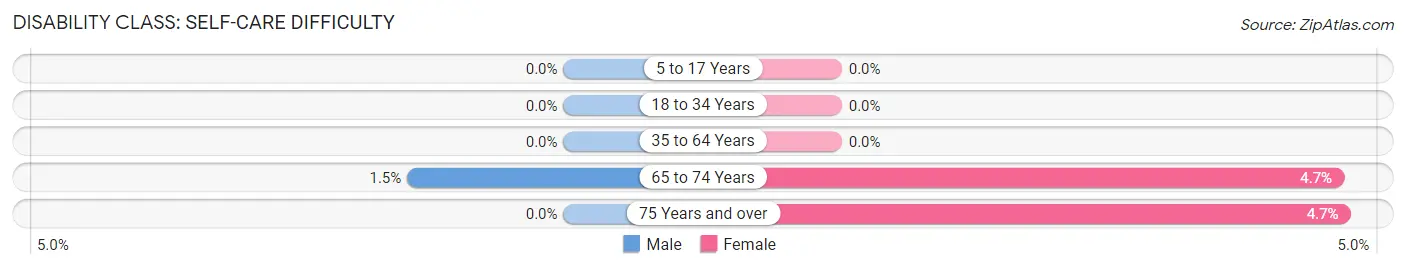
| Age Bracket | Male | Female |
| 5 to 17 Years | 0 (0.0%) | 0 (0.0%) |
| 18 to 34 Years | 0 (0.0%) | 0 (0.0%) |
| 35 to 64 Years | 0 (0.0%) | 0 (0.0%) |
| 65 to 74 Years | 7 (1.5%) | 29 (4.7%) |
| 75 Years and over | 0 (0.0%) | 18 (4.7%) |
Technology Access in Braselton
Computing Device Access in Braselton
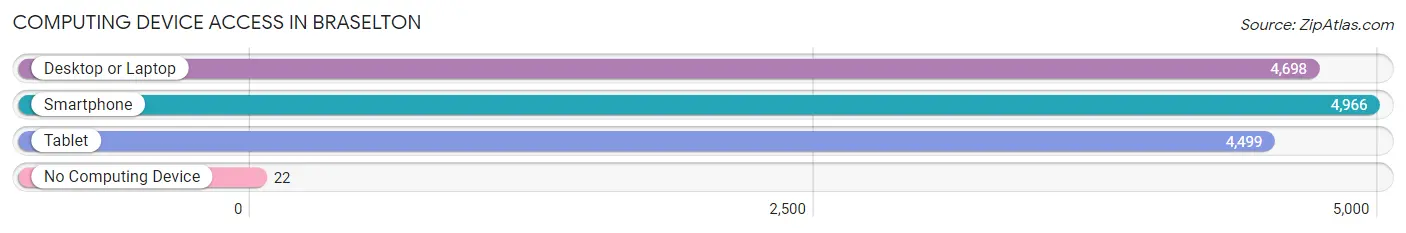
| Device Type | # Households | % Households |
| Desktop or Laptop | 4,698 | 92.7% |
| Smartphone | 4,966 | 98.0% |
| Tablet | 4,499 | 88.7% |
| No Computing Device | 22 | 0.4% |
| Total | 5,070 | 100.0% |
Internet Access in Braselton
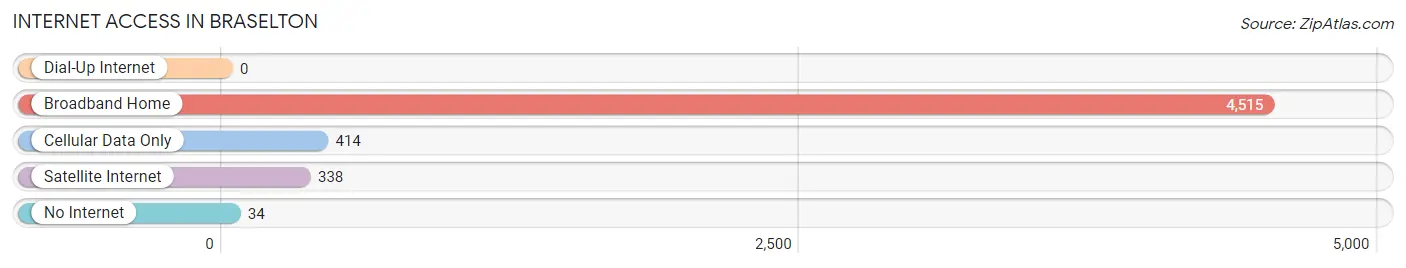
| Internet Type | # Households | % Households |
| Dial-Up Internet | 0 | 0.0% |
| Broadband Home | 4,515 | 89.0% |
| Cellular Data Only | 414 | 8.2% |
| Satellite Internet | 338 | 6.7% |
| No Internet | 34 | 0.7% |
| Total | 5,070 | 100.0% |
Braselton Summary
Braselton is a small town located in Jackson County, Georgia, United States. It is situated in the foothills of the Blue Ridge Mountains, approximately 50 miles northeast of Atlanta. The town was founded in 1887 by Harrison Braselton, a former Confederate soldier, and was incorporated in 1916. As of the 2010 census, the population of Braselton was 7,511.
History
The area that is now Braselton was originally inhabited by the Cherokee and Creek Native American tribes. In 1818, the area was ceded to the United States government in the Treaty of Indian Springs. The land was then divided into lots and sold to settlers.
Harrison Braselton, a former Confederate soldier, purchased a large tract of land in the area in 1887. He built a general store and post office, and the town was named after him. The town was officially incorporated in 1916.
In the early 20th century, Braselton was a thriving agricultural community. The town was known for its production of cotton, corn, and other crops. In the 1950s, Braselton began to experience a period of growth and development. The town was connected to the rest of the state by the completion of Interstate 85 in the 1960s.
Geography
Braselton is located in Jackson County, Georgia, in the foothills of the Blue Ridge Mountains. The town is situated at the intersection of Interstate 85 and Georgia State Route 211. The town is approximately 50 miles northeast of Atlanta.
The town has a total area of 8.3 square miles, of which 8.2 square miles is land and 0.1 square miles is water. The town is located in the Piedmont region of Georgia, and the terrain is mostly hilly.
Economy
Braselton is a small town with a diverse economy. The town is home to several businesses, including manufacturing, retail, and service industries. The town is also home to several wineries and vineyards.
The town is also home to several large employers, including the Chateau Elan Winery and Resort, the Braselton Brothers Automotive Group, and the Braselton Medical Center. The town is also home to several small businesses, including restaurants, shops, and other services.
Demographics
As of the 2010 census, the population of Braselton was 7,511. The racial makeup of the town was 79.2% White, 14.2% African American, 0.3% Native American, 1.7% Asian, 0.1% Pacific Islander, 2.2% from other races, and 2.3% from two or more races. Hispanic or Latino of any race were 5.2% of the population.
The median income for a household in the town was $50,945, and the median income for a family was $60,945. The per capita income for the town was $25,945. About 8.2% of families and 10.2% of the population were below the poverty line, including 14.2% of those under age 18 and 8.2% of those age 65 or over.
Common Questions
What is Per Capita Income in Braselton?
Per Capita income in Braselton is $55,465.
What is the Median Family Income in Braselton?
Median Family Income in Braselton is $127,656.
What is the Median Household income in Braselton?
Median Household Income in Braselton is $111,080.
What is Income or Wage Gap in Braselton?
Income or Wage Gap in Braselton is 47.1%.
Women in Braselton earn 52.9 cents for every dollar earned by a man.
What is Inequality or Gini Index in Braselton?
Inequality or Gini Index in Braselton is 0.45.
What is the Total Population of Braselton?
Total Population of Braselton is 13,804.
What is the Total Male Population of Braselton?
Total Male Population of Braselton is 6,500.
What is the Total Female Population of Braselton?
Total Female Population of Braselton is 7,304.
What is the Ratio of Males per 100 Females in Braselton?
There are 88.99 Males per 100 Females in Braselton.
What is the Ratio of Females per 100 Males in Braselton?
There are 112.37 Females per 100 Males in Braselton.
What is the Median Population Age in Braselton?
Median Population Age in Braselton is 36.5 Years.
What is the Average Family Size in Braselton
Average Family Size in Braselton is 3.0 People.
What is the Average Household Size in Braselton
Average Household Size in Braselton is 2.7 People.
How Large is the Labor Force in Braselton?
There are 7,235 People in the Labor Forcein in Braselton.
What is the Percentage of People in the Labor Force in Braselton?
68.9% of People are in the Labor Force in Braselton.
What is the Unemployment Rate in Braselton?
Unemployment Rate in Braselton is 2.1%.