Druid Hills, GA Map & Demographics
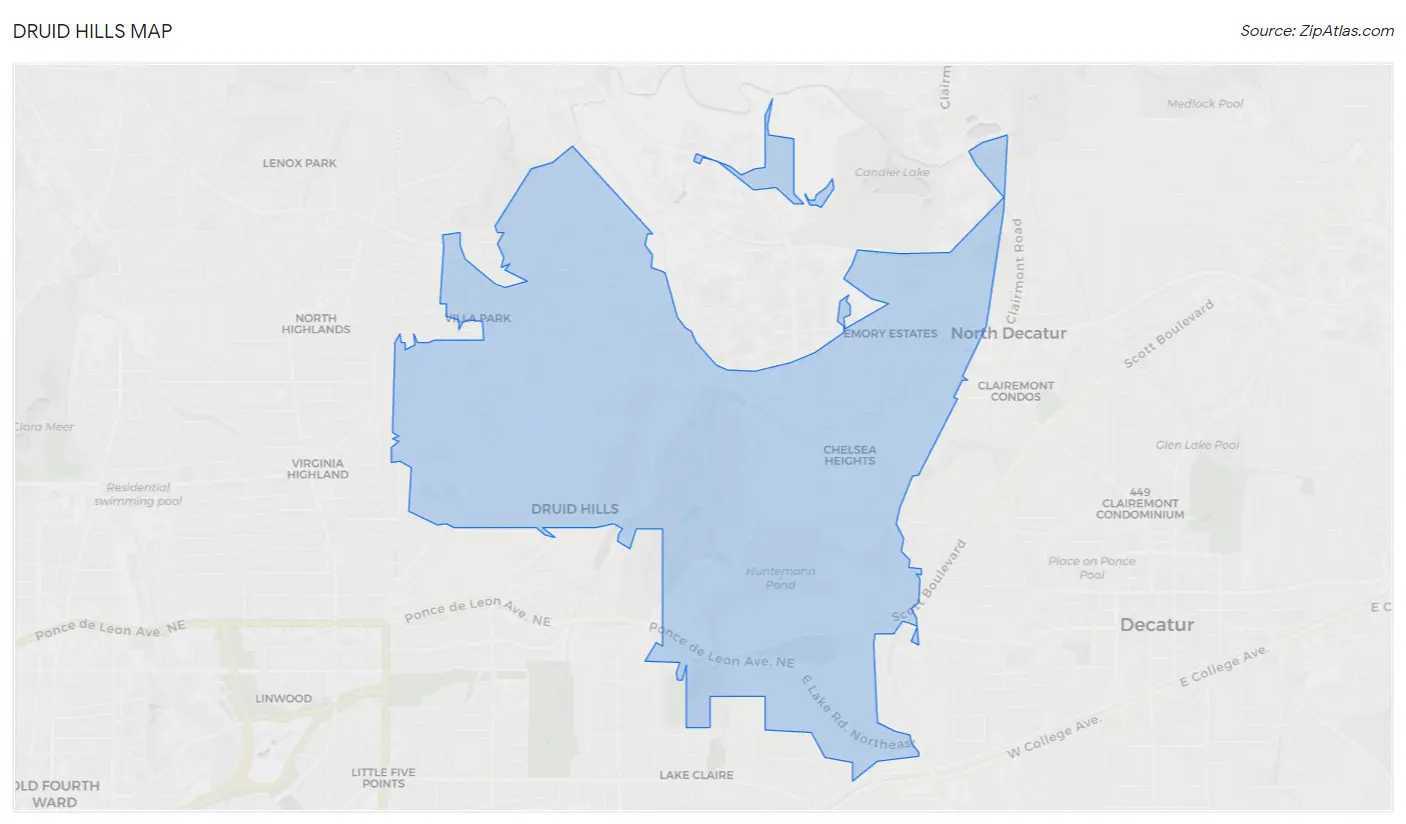
Druid Hills Map
Druid Hills Overview
$91,846
PER CAPITA INCOME
$237,852
AVG FAMILY INCOME
$138,262
AVG HOUSEHOLD INCOME
31.6%
WAGE / INCOME GAP [ % ]
68.4¢/ $1
WAGE / INCOME GAP [ $ ]
0.51
INEQUALITY / GINI INDEX
8,467
TOTAL POPULATION
4,172
MALE POPULATION
4,295
FEMALE POPULATION
97.14
MALES / 100 FEMALES
102.95
FEMALES / 100 MALES
40.3
MEDIAN AGE
2.9
AVG FAMILY SIZE
2.3
AVG HOUSEHOLD SIZE
4,482
LABOR FORCE [ PEOPLE ]
62.5%
PERCENT IN LABOR FORCE
3.3%
UNEMPLOYMENT RATE
Income in Druid Hills
Income Overview in Druid Hills
Per Capita Income in Druid Hills is $91,846, while median incomes of families and households are $237,852 and $138,262 respectively.
| Characteristic | Number | Measure |
| Per Capita Income | 8,467 | $91,846 |
| Median Family Income | 1,929 | $237,852 |
| Mean Family Income | 1,929 | $311,590 |
| Median Household Income | 3,664 | $138,262 |
| Mean Household Income | 3,664 | $212,511 |
| Income Deficit | 1,929 | $0 |
| Wage / Income Gap (%) | 8,467 | 31.63% |
| Wage / Income Gap ($) | 8,467 | 68.37¢ per $1 |
| Gini / Inequality Index | 8,467 | 0.51 |
Earnings by Sex in Druid Hills
Average Earnings in Druid Hills are $75,195, $98,472 for men and $67,326 for women, a difference of 31.6%.
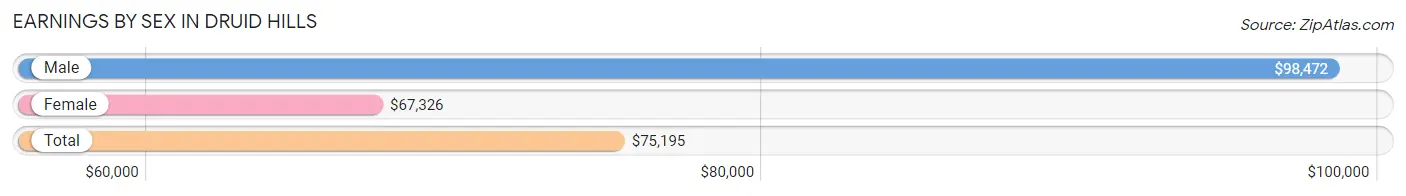
| Sex | Number | Average Earnings |
| Male | 2,454 (50.3%) | $98,472 |
| Female | 2,427 (49.7%) | $67,326 |
| Total | 4,881 (100.0%) | $75,195 |
Earnings by Sex by Income Bracket in Druid Hills
The most common earnings brackets in Druid Hills are $100,000+ for men (1,216 | 49.5%) and $100,000+ for women (706 | 29.1%).
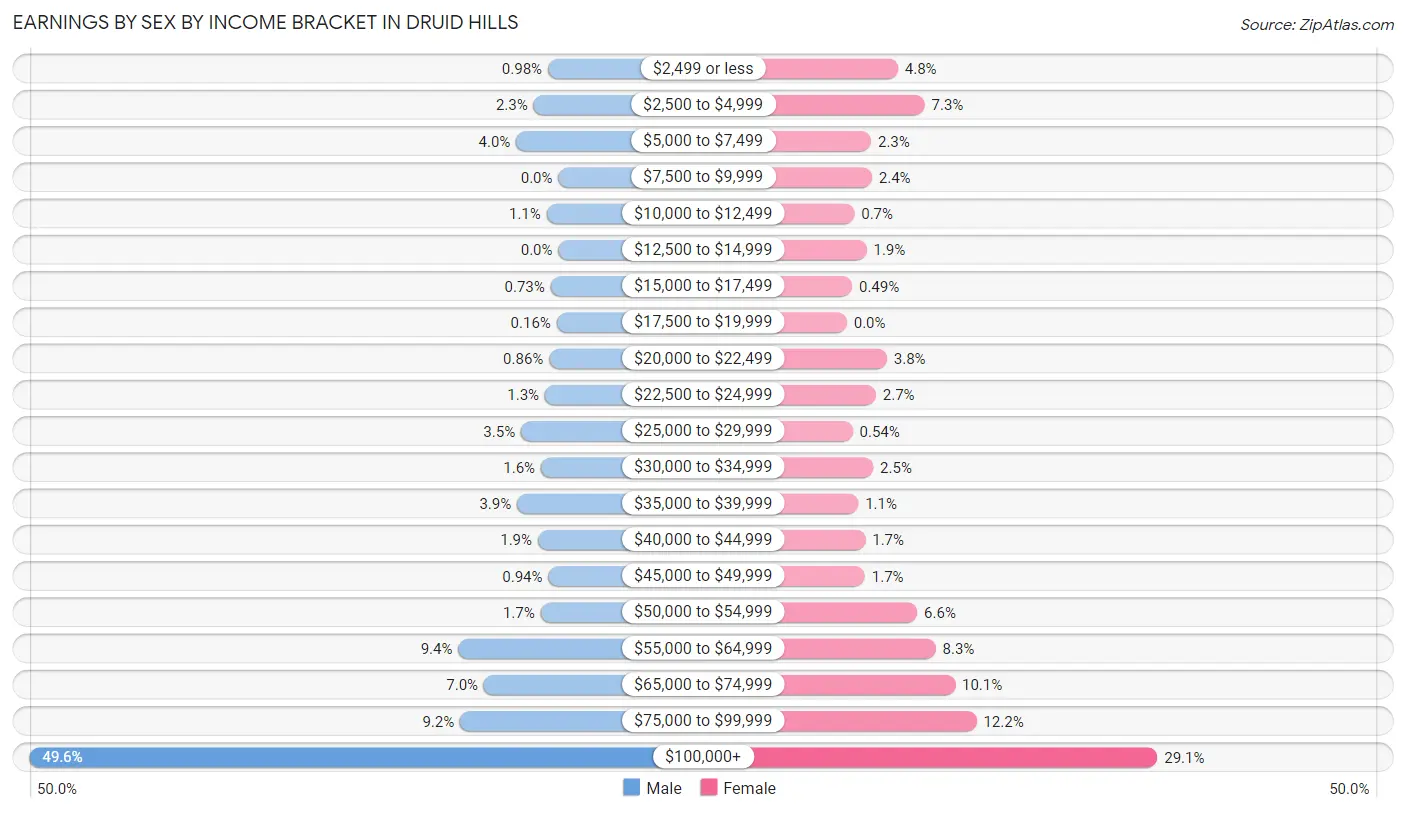
| Income | Male | Female |
| $2,499 or less | 24 (1.0%) | 116 (4.8%) |
| $2,500 to $4,999 | 57 (2.3%) | 177 (7.3%) |
| $5,000 to $7,499 | 97 (4.0%) | 55 (2.3%) |
| $7,500 to $9,999 | 0 (0.0%) | 57 (2.4%) |
| $10,000 to $12,499 | 27 (1.1%) | 17 (0.7%) |
| $12,500 to $14,999 | 0 (0.0%) | 45 (1.8%) |
| $15,000 to $17,499 | 18 (0.7%) | 12 (0.5%) |
| $17,500 to $19,999 | 4 (0.2%) | 0 (0.0%) |
| $20,000 to $22,499 | 21 (0.9%) | 91 (3.7%) |
| $22,500 to $24,999 | 31 (1.3%) | 66 (2.7%) |
| $25,000 to $29,999 | 86 (3.5%) | 13 (0.5%) |
| $30,000 to $34,999 | 40 (1.6%) | 60 (2.5%) |
| $35,000 to $39,999 | 95 (3.9%) | 26 (1.1%) |
| $40,000 to $44,999 | 47 (1.9%) | 42 (1.7%) |
| $45,000 to $49,999 | 23 (0.9%) | 41 (1.7%) |
| $50,000 to $54,999 | 41 (1.7%) | 160 (6.6%) |
| $55,000 to $64,999 | 230 (9.4%) | 202 (8.3%) |
| $65,000 to $74,999 | 171 (7.0%) | 246 (10.1%) |
| $75,000 to $99,999 | 226 (9.2%) | 295 (12.1%) |
| $100,000+ | 1,216 (49.5%) | 706 (29.1%) |
| Total | 2,454 (100.0%) | 2,427 (100.0%) |
Earnings by Sex by Educational Attainment in Druid Hills
Average earnings in Druid Hills are $102,137 for men and $73,216 for women, a difference of 28.3%. Men with an educational attainment of graduate degree enjoy the highest average annual earnings of $149,211, while those with college or associate's degree education earn the least with $62,361. Women with an educational attainment of graduate degree earn the most with the average annual earnings of $83,824, while those with college or associate's degree education have the smallest earnings of $59,500.
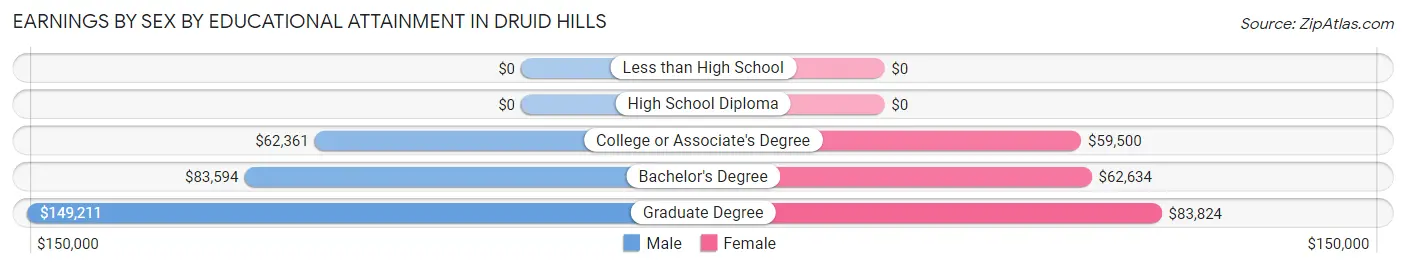
| Educational Attainment | Male Income | Female Income |
| Less than High School | - | - |
| High School Diploma | - | - |
| College or Associate's Degree | $62,361 | $59,500 |
| Bachelor's Degree | $83,594 | $62,634 |
| Graduate Degree | $149,211 | $83,824 |
| Total | $102,137 | $73,216 |
Family Income in Druid Hills
Family Income Brackets in Druid Hills
According to the Druid Hills family income data, there are 1,098 families falling into the $200,000+ income range, which is the most common income bracket and makes up 56.9% of all families.
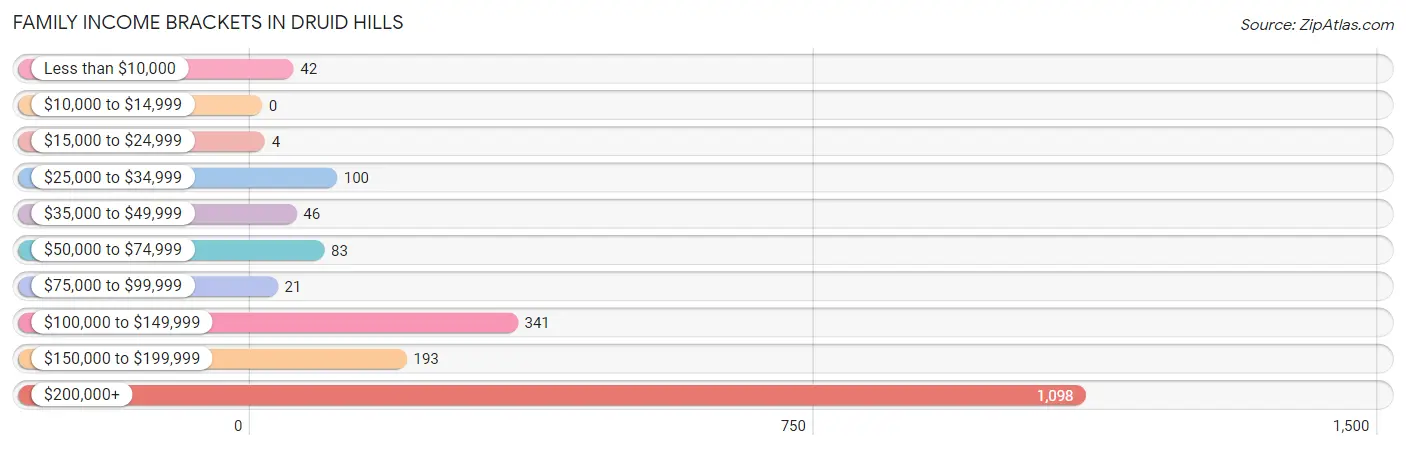
| Income Bracket | # Families | % Families |
| Less than $10,000 | 42 | 2.2% |
| $10,000 to $14,999 | 0 | 0.0% |
| $15,000 to $24,999 | 4 | 0.2% |
| $25,000 to $34,999 | 100 | 5.2% |
| $35,000 to $49,999 | 46 | 2.4% |
| $50,000 to $74,999 | 83 | 4.3% |
| $75,000 to $99,999 | 21 | 1.1% |
| $100,000 to $149,999 | 341 | 17.7% |
| $150,000 to $199,999 | 193 | 10.0% |
| $200,000+ | 1,098 | 56.9% |
Family Income by Famaliy Size in Druid Hills
5-person families (173 | 9.0%) account for the highest median family income in Druid Hills with $250,001 per family, while 2-person families (1,010 | 52.4%) have the highest median income of $116,146 per family member.
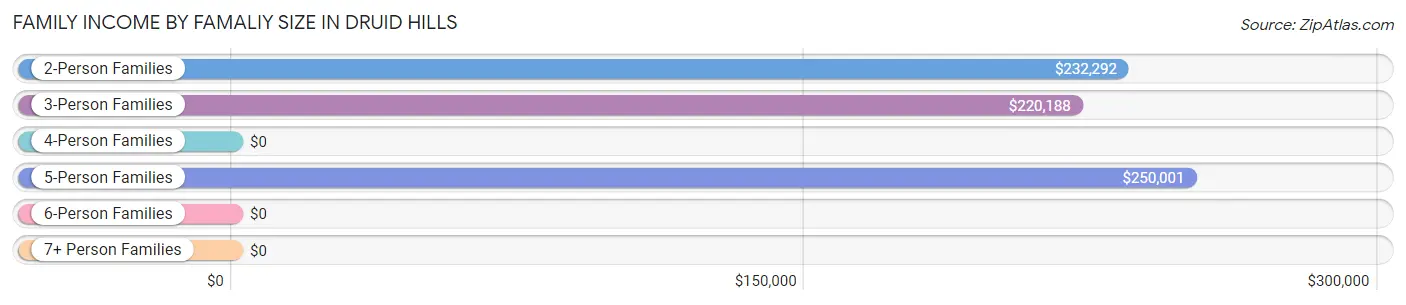
| Income Bracket | # Families | Median Income |
| 2-Person Families | 1,010 (52.4%) | $232,292 |
| 3-Person Families | 305 (15.8%) | $220,188 |
| 4-Person Families | 437 (22.7%) | $0 |
| 5-Person Families | 173 (9.0%) | $250,001 |
| 6-Person Families | 4 (0.2%) | $0 |
| 7+ Person Families | 0 (0.0%) | $0 |
| Total | 1,929 (100.0%) | $237,852 |
Family Income by Number of Earners in Druid Hills
The median family income in Druid Hills is $237,852, with families comprising 2 earners (923) having the highest median family income of $250,001, while families with no earners (210) have the lowest median family income of $109,423, accounting for 47.8% and 10.9% of families, respectively.
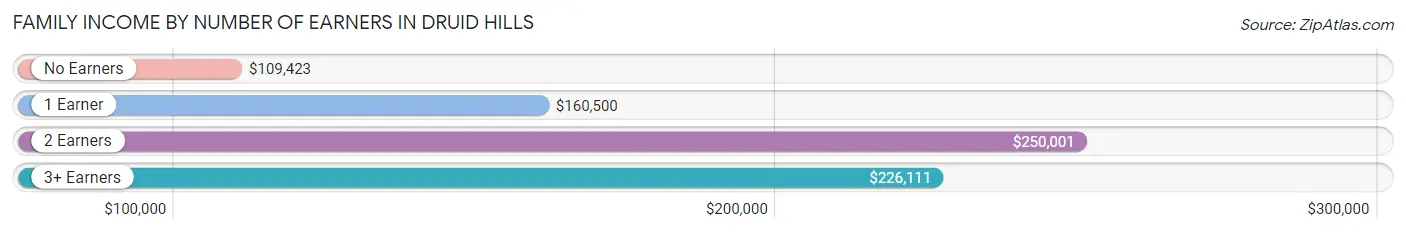
| Number of Earners | # Families | Median Income |
| No Earners | 210 (10.9%) | $109,423 |
| 1 Earner | 704 (36.5%) | $160,500 |
| 2 Earners | 923 (47.8%) | $250,001 |
| 3+ Earners | 92 (4.8%) | $226,111 |
| Total | 1,929 (100.0%) | $237,852 |
Household Income in Druid Hills
Household Income Brackets in Druid Hills
With 1,279 households falling in the category, the $200,000+ income range is the most frequent in Druid Hills, accounting for 34.9% of all households. In contrast, only 48 households (1.3%) fall into the $10,000 to $14,999 income bracket, making it the least populous group.
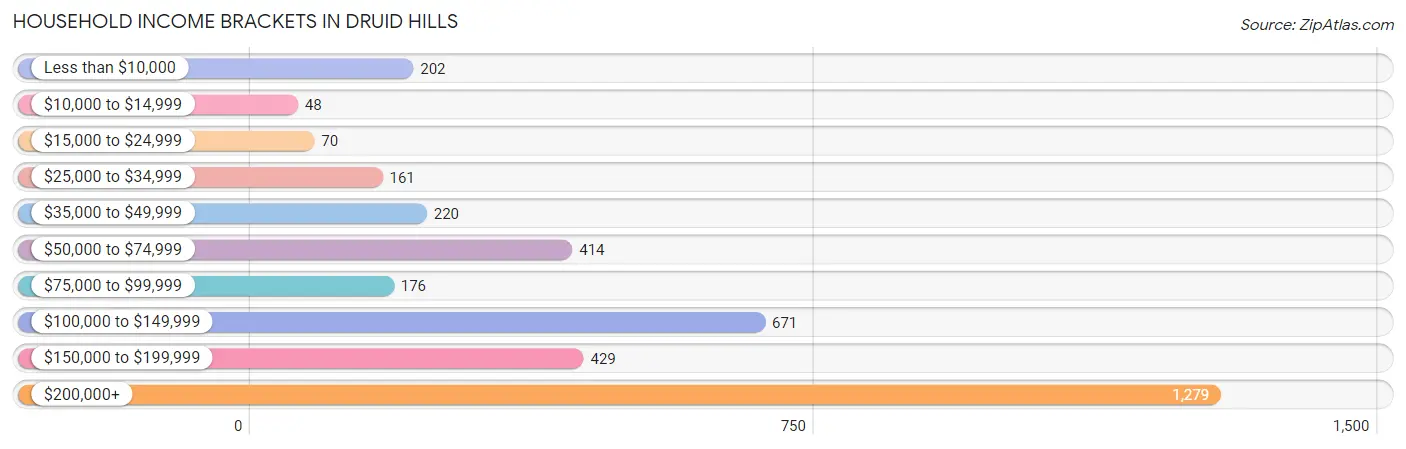
| Income Bracket | # Households | % Households |
| Less than $10,000 | 202 | 5.5% |
| $10,000 to $14,999 | 48 | 1.3% |
| $15,000 to $24,999 | 70 | 1.9% |
| $25,000 to $34,999 | 161 | 4.4% |
| $35,000 to $49,999 | 220 | 6.0% |
| $50,000 to $74,999 | 414 | 11.3% |
| $75,000 to $99,999 | 176 | 4.8% |
| $100,000 to $149,999 | 671 | 18.3% |
| $150,000 to $199,999 | 429 | 11.7% |
| $200,000+ | 1,279 | 34.9% |
Household Income by Householder Age in Druid Hills
The median household income in Druid Hills is $138,262, with the highest median household income of $188,482 found in the 45 to 64 years age bracket for the primary householder. A total of 1,337 households (36.5%) fall into this category. Meanwhile, the 15 to 24 years age bracket for the primary householder has the lowest median household income of $10,066, with 135 households (3.7%) in this group.
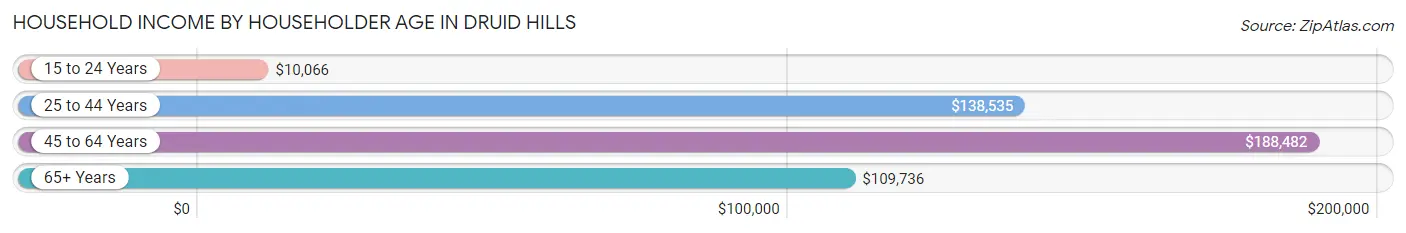
| Income Bracket | # Households | Median Income |
| 15 to 24 Years | 135 (3.7%) | $10,066 |
| 25 to 44 Years | 1,299 (35.4%) | $138,535 |
| 45 to 64 Years | 1,337 (36.5%) | $188,482 |
| 65+ Years | 893 (24.4%) | $109,736 |
| Total | 3,664 (100.0%) | $138,262 |
Poverty in Druid Hills
Income Below Poverty by Sex and Age in Druid Hills
With 7.4% poverty level for males and 10.6% for females among the residents of Druid Hills, 18 to 24 year old males and 18 to 24 year old females are the most vulnerable to poverty, with 76 males (51.3%) and 173 females (40.1%) in their respective age groups living below the poverty level.
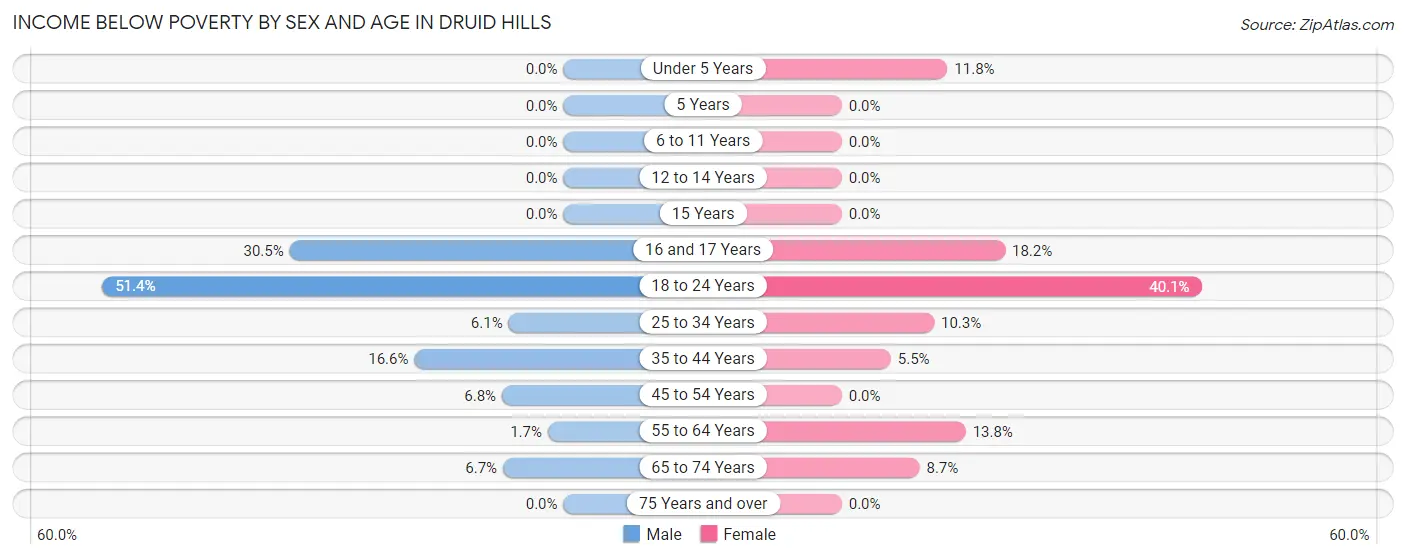
| Age Bracket | Male | Female |
| Under 5 Years | 0 (0.0%) | 22 (11.8%) |
| 5 Years | 0 (0.0%) | 0 (0.0%) |
| 6 to 11 Years | 0 (0.0%) | 0 (0.0%) |
| 12 to 14 Years | 0 (0.0%) | 0 (0.0%) |
| 15 Years | 0 (0.0%) | 0 (0.0%) |
| 16 and 17 Years | 25 (30.5%) | 10 (18.2%) |
| 18 to 24 Years | 76 (51.3%) | 173 (40.1%) |
| 25 to 34 Years | 46 (6.1%) | 95 (10.3%) |
| 35 to 44 Years | 79 (16.6%) | 29 (5.5%) |
| 45 to 54 Years | 36 (6.8%) | 0 (0.0%) |
| 55 to 64 Years | 12 (1.7%) | 86 (13.8%) |
| 65 to 74 Years | 28 (6.7%) | 31 (8.7%) |
| 75 Years and over | 0 (0.0%) | 0 (0.0%) |
| Total | 302 (7.4%) | 446 (10.6%) |
Income Above Poverty by Sex and Age in Druid Hills
According to the poverty statistics in Druid Hills, males aged under 5 years and females aged 6 to 11 years are the age groups that are most secure financially, with 100.0% of males and 100.0% of females in these age groups living above the poverty line.
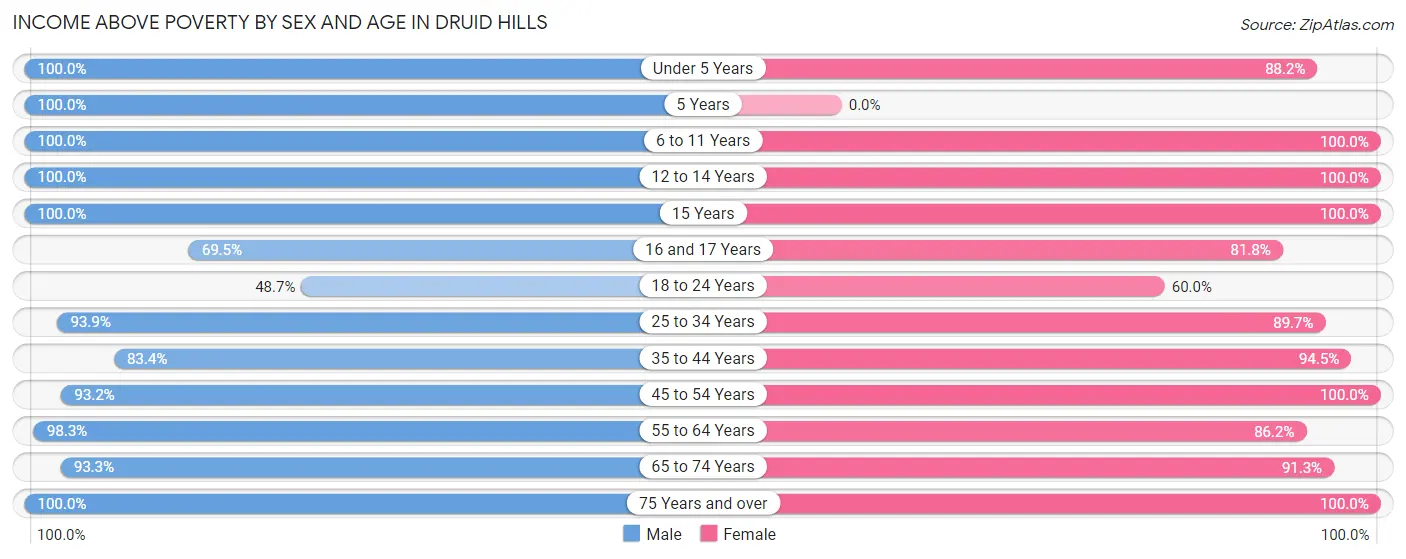
| Age Bracket | Male | Female |
| Under 5 Years | 164 (100.0%) | 165 (88.2%) |
| 5 Years | 14 (100.0%) | 0 (0.0%) |
| 6 to 11 Years | 403 (100.0%) | 288 (100.0%) |
| 12 to 14 Years | 126 (100.0%) | 53 (100.0%) |
| 15 Years | 37 (100.0%) | 24 (100.0%) |
| 16 and 17 Years | 57 (69.5%) | 45 (81.8%) |
| 18 to 24 Years | 72 (48.6%) | 259 (60.0%) |
| 25 to 34 Years | 707 (93.9%) | 830 (89.7%) |
| 35 to 44 Years | 397 (83.4%) | 502 (94.5%) |
| 45 to 54 Years | 490 (93.2%) | 453 (100.0%) |
| 55 to 64 Years | 680 (98.3%) | 537 (86.2%) |
| 65 to 74 Years | 388 (93.3%) | 327 (91.3%) |
| 75 Years and over | 233 (100.0%) | 286 (100.0%) |
| Total | 3,768 (92.6%) | 3,769 (89.4%) |
Income Below Poverty Among Married-Couple Families in Druid Hills
The poverty statistics for married-couple families in Druid Hills show that 0.8% or 15 of the total 1,825 families live below the poverty line. Families with no children have the highest poverty rate of 1.3%, comprising of 15 families. On the other hand, families with 1 or 2 children have the lowest poverty rate of 0.0%, which includes 0 families.
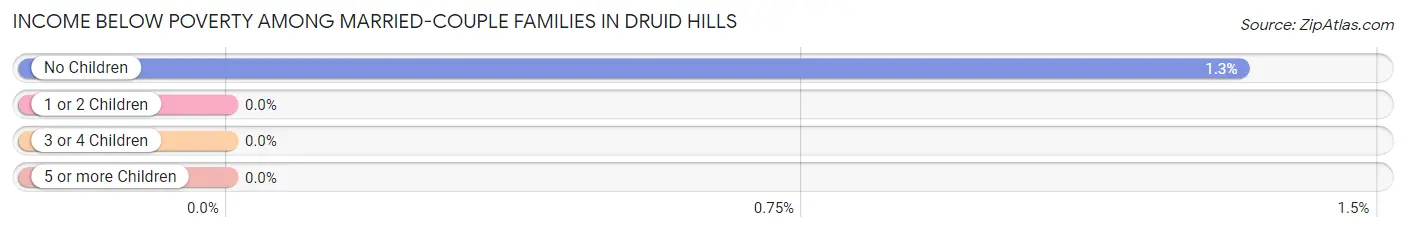
| Children | Above Poverty | Below Poverty |
| No Children | 1,120 (98.7%) | 15 (1.3%) |
| 1 or 2 Children | 577 (100.0%) | 0 (0.0%) |
| 3 or 4 Children | 113 (100.0%) | 0 (0.0%) |
| 5 or more Children | 0 (0.0%) | 0 (0.0%) |
| Total | 1,810 (99.2%) | 15 (0.8%) |
Income Below Poverty Among Single-Parent Households in Druid Hills
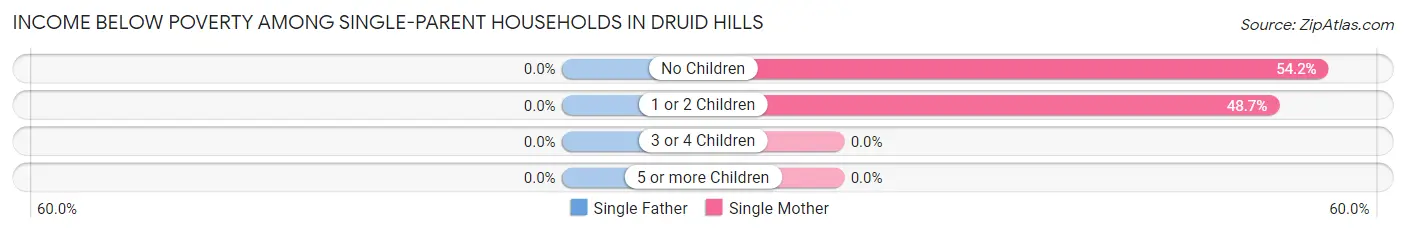
| Children | Single Father | Single Mother |
| No Children | 0 (0.0%) | 13 (54.2%) |
| 1 or 2 Children | 0 (0.0%) | 18 (48.6%) |
| 3 or 4 Children | 0 (0.0%) | 0 (0.0%) |
| 5 or more Children | 0 (0.0%) | 0 (0.0%) |
| Total | 0 (0.0%) | 31 (50.8%) |
Income Below Poverty Among Married-Couple vs Single-Parent Households in Druid Hills
The poverty data for Druid Hills shows that 15 of the married-couple family households (0.8%) and 31 of the single-parent households (29.8%) are living below the poverty level. Within the married-couple family households, those with no children have the highest poverty rate, with 15 households (1.3%) falling below the poverty line. Among the single-parent households, those with no children have the highest poverty rate, with 13 household (37.1%) living below poverty.
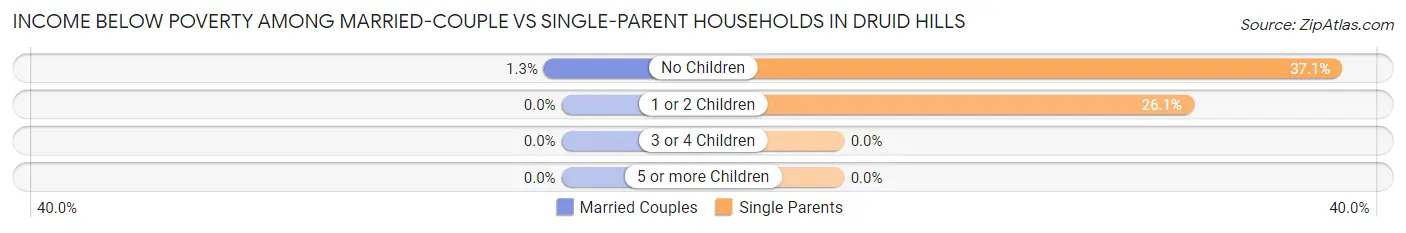
| Children | Married-Couple Families | Single-Parent Households |
| No Children | 15 (1.3%) | 13 (37.1%) |
| 1 or 2 Children | 0 (0.0%) | 18 (26.1%) |
| 3 or 4 Children | 0 (0.0%) | 0 (0.0%) |
| 5 or more Children | 0 (0.0%) | 0 (0.0%) |
| Total | 15 (0.8%) | 31 (29.8%) |
Race in Druid Hills
The most populous races in Druid Hills are White / Caucasian (6,836 | 80.7%), Asian (720 | 8.5%), and Hispanic or Latino (567 | 6.7%).
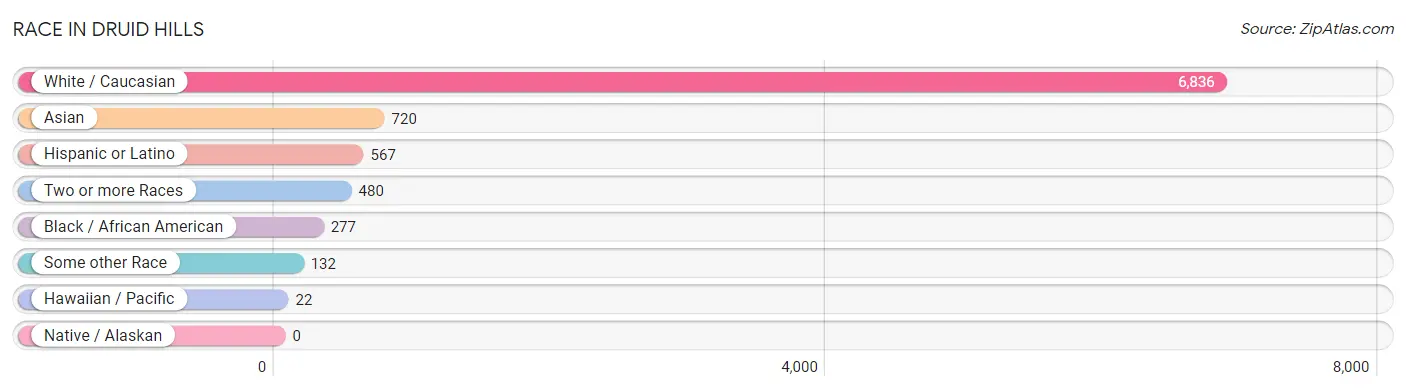
| Race | # Population | % Population |
| Asian | 720 | 8.5% |
| Black / African American | 277 | 3.3% |
| Hawaiian / Pacific | 22 | 0.3% |
| Hispanic or Latino | 567 | 6.7% |
| Native / Alaskan | 0 | 0.0% |
| White / Caucasian | 6,836 | 80.7% |
| Two or more Races | 480 | 5.7% |
| Some other Race | 132 | 1.6% |
| Total | 8,467 | 100.0% |
Ancestry in Druid Hills
The most populous ancestries reported in Druid Hills are English (1,604 | 18.9%), German (1,364 | 16.1%), Irish (1,224 | 14.5%), Scottish (654 | 7.7%), and European (586 | 6.9%), together accounting for 64.2% of all Druid Hills residents.
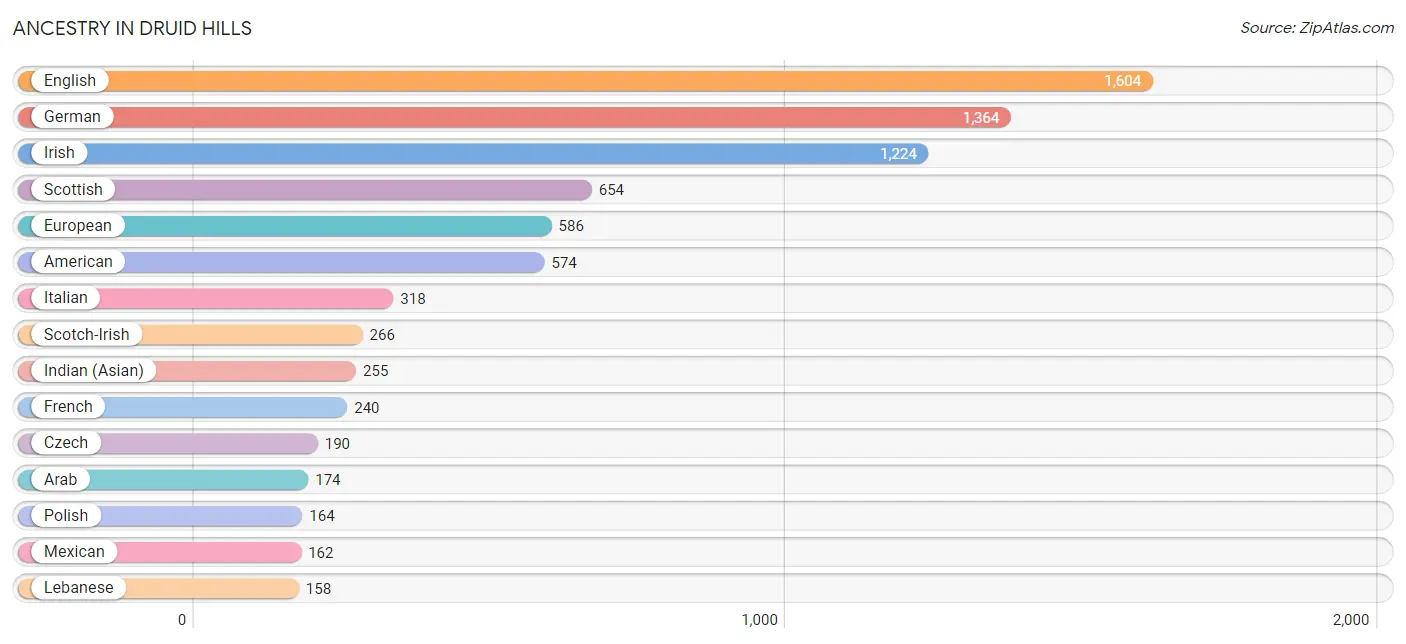
| Ancestry | # Population | % Population |
| Afghan | 56 | 0.7% |
| American | 574 | 6.8% |
| Arab | 174 | 2.1% |
| Austrian | 54 | 0.6% |
| Belgian | 29 | 0.3% |
| Bhutanese | 43 | 0.5% |
| Brazilian | 43 | 0.5% |
| British | 151 | 1.8% |
| Burmese | 75 | 0.9% |
| Cajun | 22 | 0.3% |
| Canadian | 4 | 0.1% |
| Celtic | 10 | 0.1% |
| Central American | 16 | 0.2% |
| Central American Indian | 2 | 0.0% |
| Cherokee | 12 | 0.1% |
| Chilean | 62 | 0.7% |
| Colombian | 13 | 0.2% |
| Cuban | 69 | 0.8% |
| Czech | 190 | 2.2% |
| Danish | 48 | 0.6% |
| Dominican | 9 | 0.1% |
| Dutch | 84 | 1.0% |
| Eastern European | 10 | 0.1% |
| English | 1,604 | 18.9% |
| Ethiopian | 11 | 0.1% |
| European | 586 | 6.9% |
| Filipino | 72 | 0.9% |
| Finnish | 16 | 0.2% |
| French | 240 | 2.8% |
| French Canadian | 27 | 0.3% |
| German | 1,364 | 16.1% |
| German Russian | 14 | 0.2% |
| Greek | 139 | 1.6% |
| Guamanian / Chamorro | 1 | 0.0% |
| Guatemalan | 14 | 0.2% |
| Hungarian | 14 | 0.2% |
| Indian (Asian) | 255 | 3.0% |
| Iranian | 7 | 0.1% |
| Irish | 1,224 | 14.5% |
| Israeli | 19 | 0.2% |
| Italian | 318 | 3.8% |
| Korean | 156 | 1.8% |
| Lebanese | 158 | 1.9% |
| Mexican | 162 | 1.9% |
| Northern European | 64 | 0.8% |
| Norwegian | 72 | 0.9% |
| Peruvian | 8 | 0.1% |
| Pima | 8 | 0.1% |
| Polish | 164 | 1.9% |
| Puerto Rican | 146 | 1.7% |
| Romanian | 13 | 0.2% |
| Russian | 109 | 1.3% |
| Salvadoran | 2 | 0.0% |
| Samoan | 21 | 0.3% |
| Scotch-Irish | 266 | 3.1% |
| Scottish | 654 | 7.7% |
| Serbian | 29 | 0.3% |
| South American | 93 | 1.1% |
| Spanish | 72 | 0.9% |
| Sri Lankan | 25 | 0.3% |
| Subsaharan African | 11 | 0.1% |
| Swedish | 114 | 1.3% |
| Swiss | 69 | 0.8% |
| Syrian | 16 | 0.2% |
| Thai | 152 | 1.8% |
| Turkish | 57 | 0.7% |
| Ukrainian | 22 | 0.3% |
| Venezuelan | 10 | 0.1% |
| Welsh | 28 | 0.3% | View All 69 Rows |
Immigrants in Druid Hills
The most numerous immigrant groups reported in Druid Hills came from Asia (540 | 6.4%), Eastern Asia (291 | 3.4%), Europe (251 | 3.0%), China (206 | 2.4%), and Latin America (162 | 1.9%), together accounting for 17.1% of all Druid Hills residents.
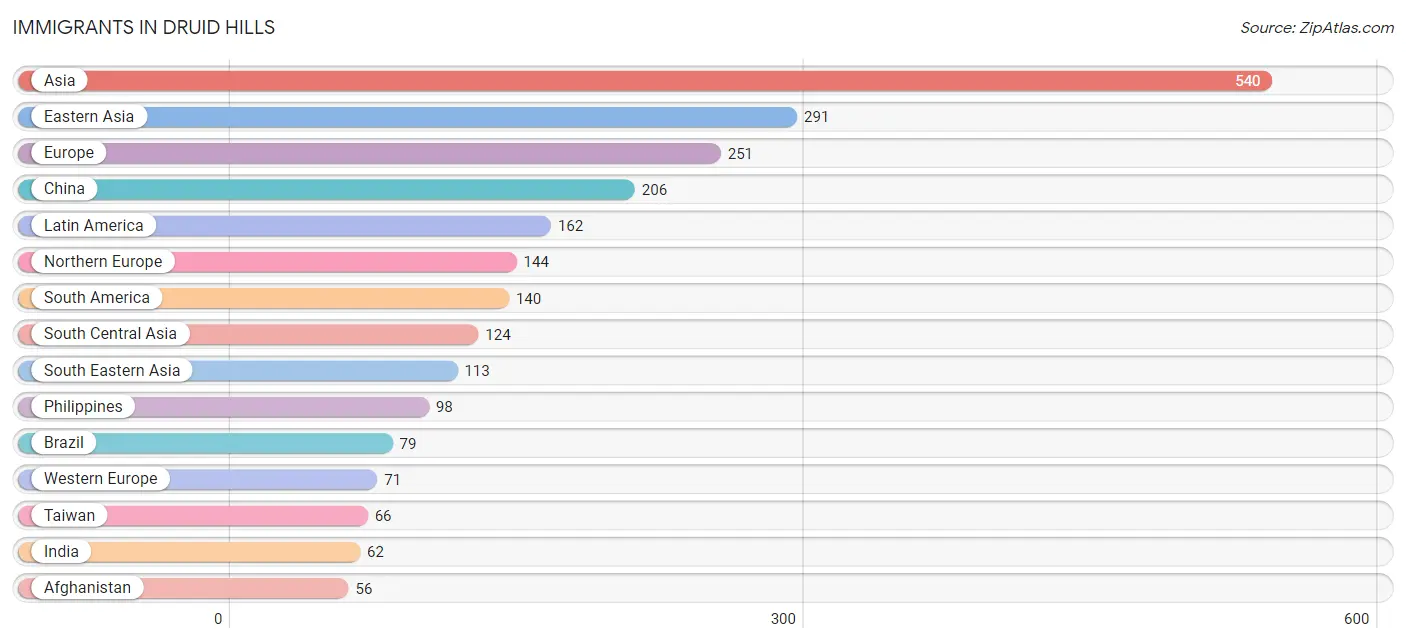
| Immigration Origin | # Population | % Population |
| Afghanistan | 56 | 0.7% |
| Asia | 540 | 6.4% |
| Brazil | 79 | 0.9% |
| Canada | 32 | 0.4% |
| Caribbean | 12 | 0.1% |
| Central America | 10 | 0.1% |
| Chile | 32 | 0.4% |
| China | 206 | 2.4% |
| Colombia | 13 | 0.2% |
| Cuba | 12 | 0.1% |
| Czechoslovakia | 9 | 0.1% |
| Eastern Asia | 291 | 3.4% |
| Eastern Europe | 30 | 0.4% |
| Ecuador | 6 | 0.1% |
| England | 36 | 0.4% |
| Europe | 251 | 3.0% |
| France | 35 | 0.4% |
| Germany | 36 | 0.4% |
| Hong Kong | 1 | 0.0% |
| India | 62 | 0.7% |
| Israel | 12 | 0.1% |
| Italy | 6 | 0.1% |
| Japan | 43 | 0.5% |
| Korea | 42 | 0.5% |
| Latin America | 162 | 1.9% |
| Mexico | 10 | 0.1% |
| Northern Europe | 144 | 1.7% |
| Oceania | 7 | 0.1% |
| Pakistan | 6 | 0.1% |
| Philippines | 98 | 1.2% |
| Poland | 7 | 0.1% |
| Romania | 4 | 0.1% |
| Scotland | 18 | 0.2% |
| Serbia | 10 | 0.1% |
| South America | 140 | 1.7% |
| South Central Asia | 124 | 1.5% |
| South Eastern Asia | 113 | 1.3% |
| Southern Europe | 6 | 0.1% |
| Taiwan | 66 | 0.8% |
| Thailand | 5 | 0.1% |
| Venezuela | 10 | 0.1% |
| Vietnam | 10 | 0.1% |
| Western Asia | 12 | 0.1% |
| Western Europe | 71 | 0.8% | View All 44 Rows |
Sex and Age in Druid Hills
Sex and Age in Druid Hills
The most populous age groups in Druid Hills are 30 to 34 Years (551 | 13.2%) for men and 25 to 29 Years (561 | 13.1%) for women.
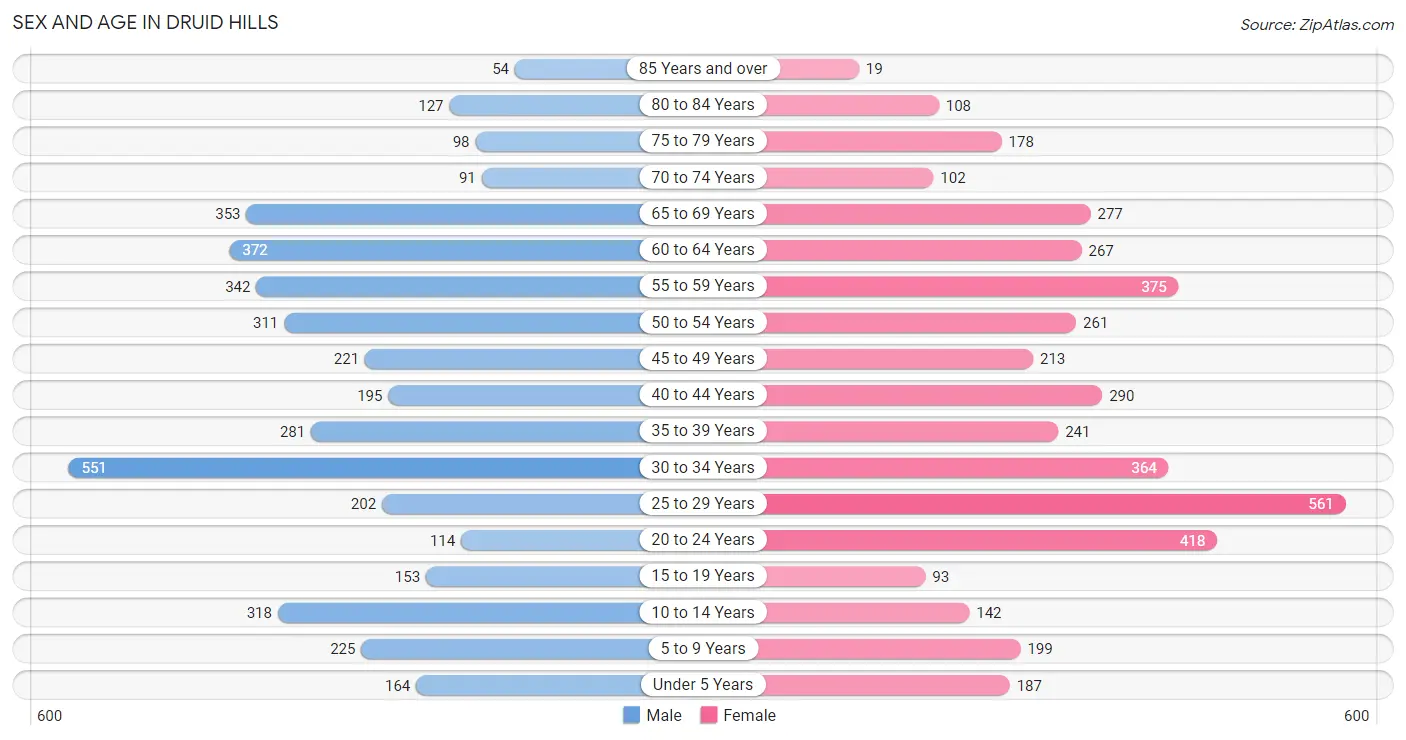
| Age Bracket | Male | Female |
| Under 5 Years | 164 (3.9%) | 187 (4.3%) |
| 5 to 9 Years | 225 (5.4%) | 199 (4.6%) |
| 10 to 14 Years | 318 (7.6%) | 142 (3.3%) |
| 15 to 19 Years | 153 (3.7%) | 93 (2.2%) |
| 20 to 24 Years | 114 (2.7%) | 418 (9.7%) |
| 25 to 29 Years | 202 (4.8%) | 561 (13.1%) |
| 30 to 34 Years | 551 (13.2%) | 364 (8.5%) |
| 35 to 39 Years | 281 (6.7%) | 241 (5.6%) |
| 40 to 44 Years | 195 (4.7%) | 290 (6.8%) |
| 45 to 49 Years | 221 (5.3%) | 213 (5.0%) |
| 50 to 54 Years | 311 (7.4%) | 261 (6.1%) |
| 55 to 59 Years | 342 (8.2%) | 375 (8.7%) |
| 60 to 64 Years | 372 (8.9%) | 267 (6.2%) |
| 65 to 69 Years | 353 (8.5%) | 277 (6.5%) |
| 70 to 74 Years | 91 (2.2%) | 102 (2.4%) |
| 75 to 79 Years | 98 (2.4%) | 178 (4.1%) |
| 80 to 84 Years | 127 (3.0%) | 108 (2.5%) |
| 85 Years and over | 54 (1.3%) | 19 (0.4%) |
| Total | 4,172 (100.0%) | 4,295 (100.0%) |
Families and Households in Druid Hills
Median Family Size in Druid Hills
The median family size in Druid Hills is 2.87 persons per family, with single male/father families (43 | 2.2%) accounting for the largest median family size of 3.12 persons per family. On the other hand, single female/mother families (61 | 3.2%) represent the smallest median family size with 2.77 persons per family.
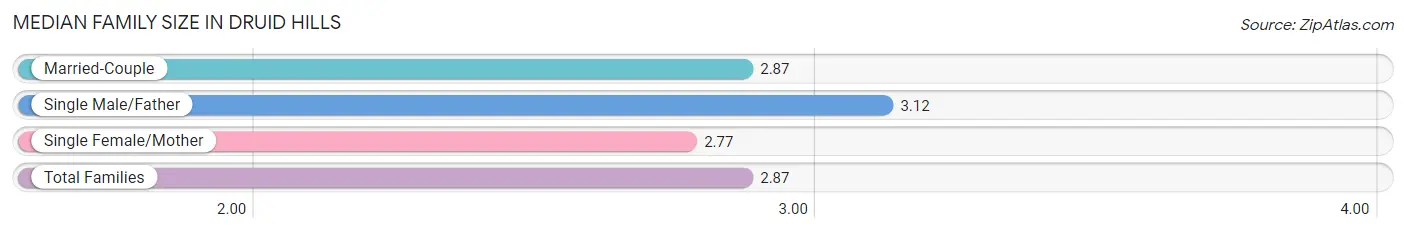
| Family Type | # Families | Family Size |
| Married-Couple | 1,825 (94.6%) | 2.87 |
| Single Male/Father | 43 (2.2%) | 3.12 |
| Single Female/Mother | 61 (3.2%) | 2.77 |
| Total Families | 1,929 (100.0%) | 2.87 |
Median Household Size in Druid Hills
The median household size in Druid Hills is 2.26 persons per household, with single female/mother households (61 | 1.7%) accounting for the largest median household size of 3.51 persons per household. non-family households (1,735 | 47.3%) represent the smallest median household size with 1.47 persons per household.
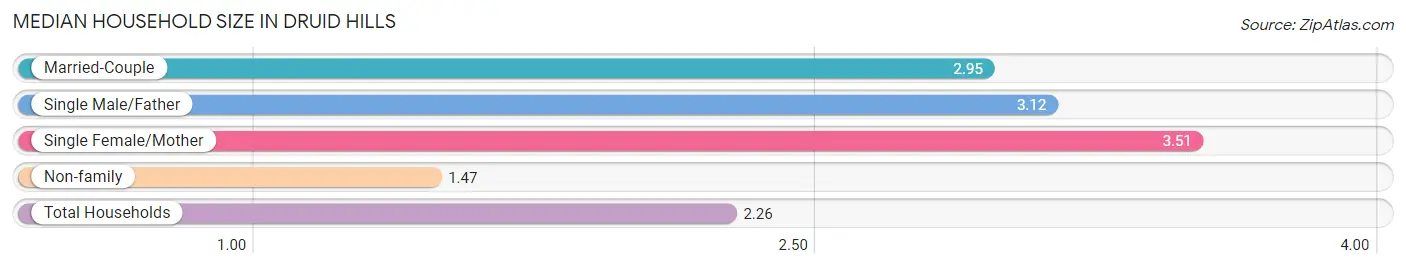
| Household Type | # Households | Household Size |
| Married-Couple | 1,825 (49.8%) | 2.95 |
| Single Male/Father | 43 (1.2%) | 3.12 |
| Single Female/Mother | 61 (1.7%) | 3.51 |
| Non-family | 1,735 (47.3%) | 1.47 |
| Total Households | 3,664 (100.0%) | 2.26 |
Household Size by Marriage Status in Druid Hills
Out of a total of 3,664 households in Druid Hills, 1,929 (52.6%) are family households, while 1,735 (47.3%) are nonfamily households. The most numerous type of family households are 2-person households, comprising 962, and the most common type of nonfamily households are 1-person households, comprising 1,119.
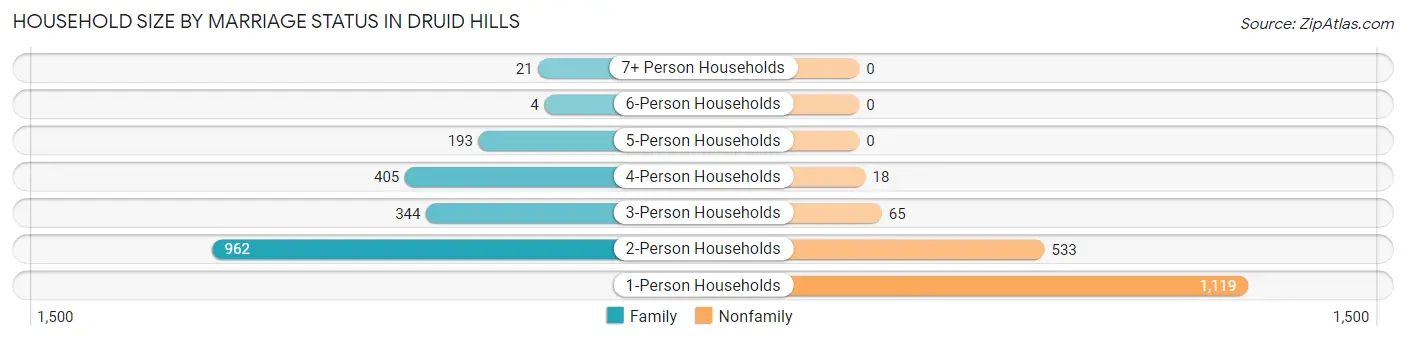
| Household Size | Family Households | Nonfamily Households |
| 1-Person Households | - | 1,119 (30.5%) |
| 2-Person Households | 962 (26.3%) | 533 (14.5%) |
| 3-Person Households | 344 (9.4%) | 65 (1.8%) |
| 4-Person Households | 405 (11.1%) | 18 (0.5%) |
| 5-Person Households | 193 (5.3%) | 0 (0.0%) |
| 6-Person Households | 4 (0.1%) | 0 (0.0%) |
| 7+ Person Households | 21 (0.6%) | 0 (0.0%) |
| Total | 1,929 (52.6%) | 1,735 (47.3%) |
Female Fertility in Druid Hills
Fertility by Age in Druid Hills
Average fertility rate in Druid Hills is 24.0 births per 1,000 women. Women in the age bracket of 35 to 50 years have the highest fertility rate with 47.0 births per 1,000 women. Women in the age bracket of 35 to 50 years acount for 68.5% of all women with births.
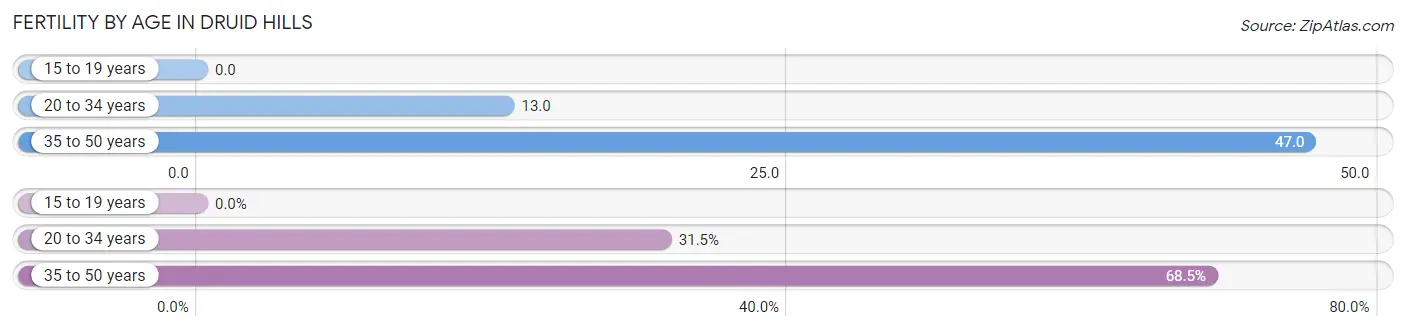
| Age Bracket | Women with Births | Births / 1,000 Women |
| 15 to 19 years | 0 (0.0%) | 0.0 |
| 20 to 34 years | 17 (31.5%) | 13.0 |
| 35 to 50 years | 37 (68.5%) | 47.0 |
| Total | 54 (100.0%) | 24.0 |
Fertility by Age by Marriage Status in Druid Hills
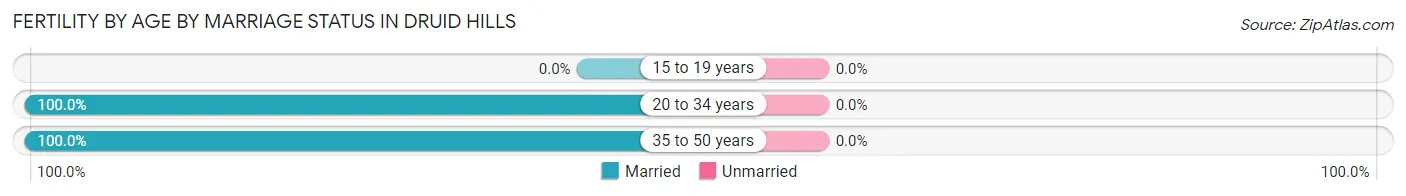
| Age Bracket | Married | Unmarried |
| 15 to 19 years | 0 (0.0%) | 0 (0.0%) |
| 20 to 34 years | 17 (100.0%) | 0 (0.0%) |
| 35 to 50 years | 37 (100.0%) | 0 (0.0%) |
| Total | 54 (100.0%) | 0 (0.0%) |
Fertility by Education in Druid Hills
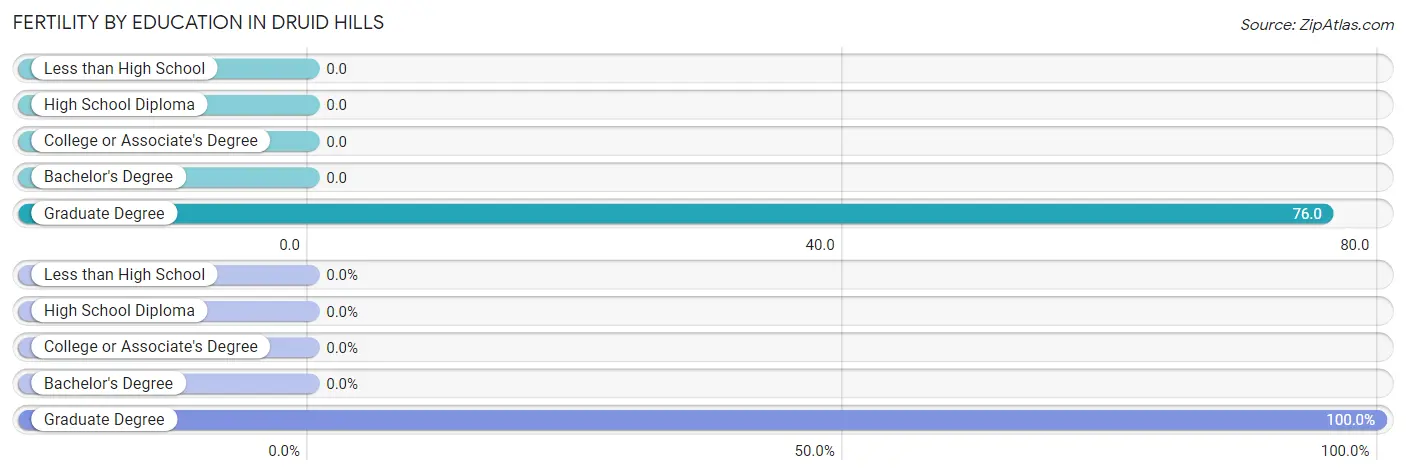
| Educational Attainment | Women with Births | Births / 1,000 Women |
| Less than High School | 0 (0.0%) | 0.0 |
| High School Diploma | 0 (0.0%) | 0.0 |
| College or Associate's Degree | 0 (0.0%) | 0.0 |
| Bachelor's Degree | 0 (0.0%) | 0.0 |
| Graduate Degree | 54 (100.0%) | 76.0 |
| Total | 54 (100.0%) | 24.0 |
Fertility by Education by Marriage Status in Druid Hills
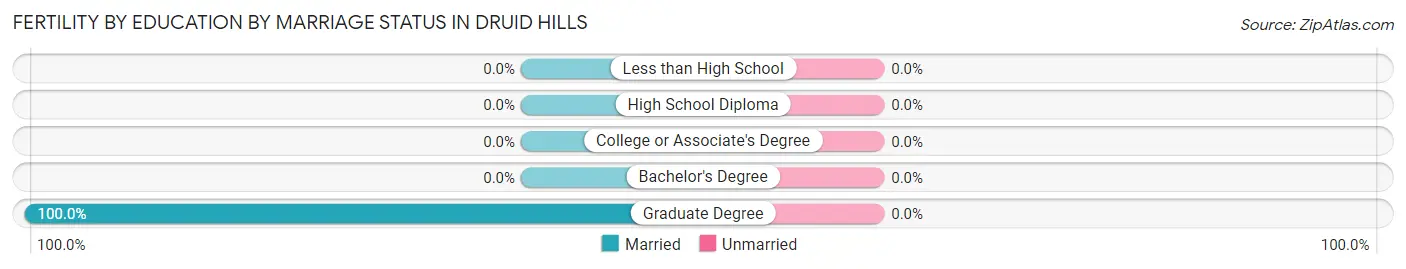
| Educational Attainment | Married | Unmarried |
| Less than High School | 0 (0.0%) | 0 (0.0%) |
| High School Diploma | 0 (0.0%) | 0 (0.0%) |
| College or Associate's Degree | 0 (0.0%) | 0 (0.0%) |
| Bachelor's Degree | 0 (0.0%) | 0 (0.0%) |
| Graduate Degree | 54 (100.0%) | 0 (0.0%) |
| Total | 54 (100.0%) | 0 (0.0%) |
Employment Characteristics in Druid Hills
Employment by Class of Employer in Druid Hills
Among the 4,292 employed individuals in Druid Hills, private company employees (2,427 | 56.6%), not-for-profit organizations (929 | 21.6%), and self-employed (incorporated) (214 | 5.0%) make up the most common classes of employment.
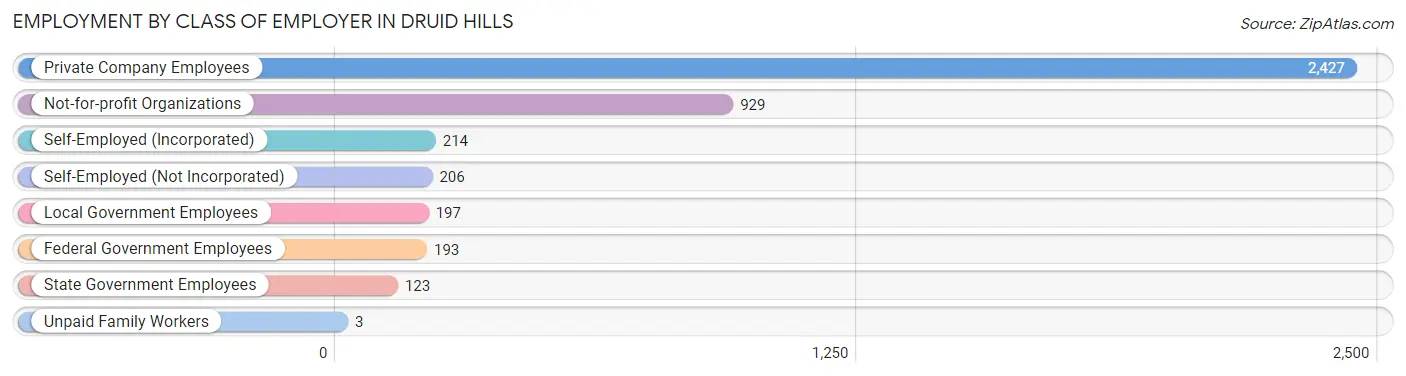
| Employer Class | # Employees | % Employees |
| Private Company Employees | 2,427 | 56.6% |
| Self-Employed (Incorporated) | 214 | 5.0% |
| Self-Employed (Not Incorporated) | 206 | 4.8% |
| Not-for-profit Organizations | 929 | 21.6% |
| Local Government Employees | 197 | 4.6% |
| State Government Employees | 123 | 2.9% |
| Federal Government Employees | 193 | 4.5% |
| Unpaid Family Workers | 3 | 0.1% |
| Total | 4,292 | 100.0% |
Employment Status by Age in Druid Hills
According to the labor force statistics for Druid Hills, out of the total population over 16 years of age (7,171), 62.5% or 4,482 individuals are in the labor force, with 3.3% or 148 of them unemployed. The age group with the highest labor force participation rate is 30 to 34 years, with 90.2% or 825 individuals in the labor force. Within the labor force, the 55 to 59 years age range has the highest percentage of unemployed individuals, with 15.4% or 69 of them being unemployed.
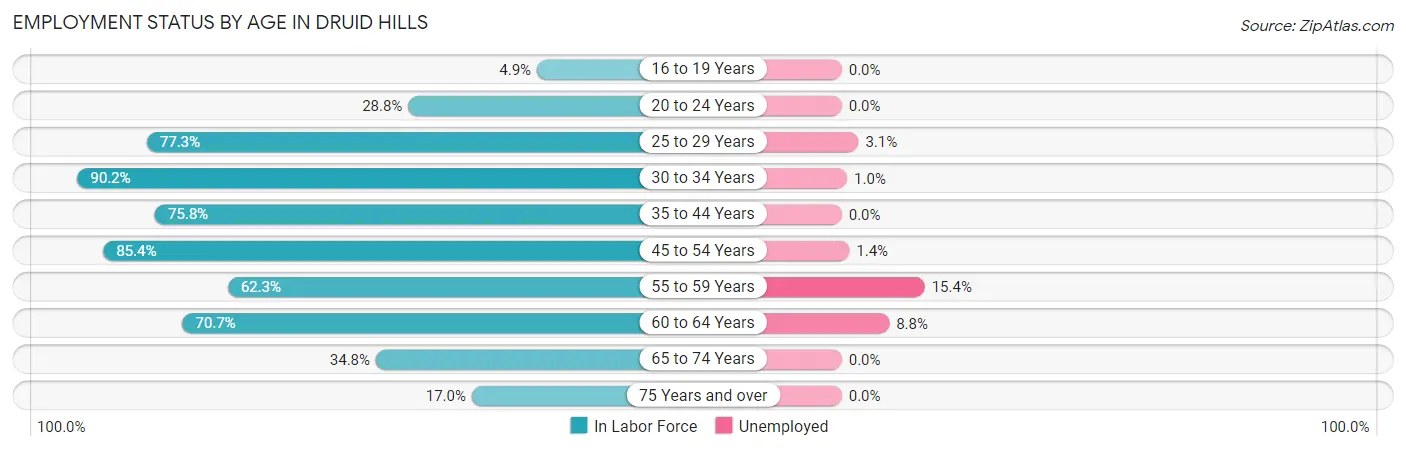
| Age Bracket | In Labor Force | Unemployed |
| 16 to 19 Years | 9 (4.9%) | 0 (0.0%) |
| 20 to 24 Years | 153 (28.8%) | 0 (0.0%) |
| 25 to 29 Years | 590 (77.3%) | 18 (3.1%) |
| 30 to 34 Years | 825 (90.2%) | 8 (1.0%) |
| 35 to 44 Years | 763 (75.8%) | 0 (0.0%) |
| 45 to 54 Years | 859 (85.4%) | 12 (1.4%) |
| 55 to 59 Years | 447 (62.3%) | 69 (15.4%) |
| 60 to 64 Years | 452 (70.7%) | 40 (8.8%) |
| 65 to 74 Years | 286 (34.8%) | 0 (0.0%) |
| 75 Years and over | 99 (17.0%) | 0 (0.0%) |
| Total | 4,482 (62.5%) | 148 (3.3%) |
Employment Status by Educational Attainment in Druid Hills
According to labor force statistics for Druid Hills, 78.0% of individuals (3,937) out of the total population between 25 and 64 years of age (5,047) are in the labor force, with 3.7% or 146 of them being unemployed. The group with the highest labor force participation rate are those with the educational attainment of bachelor's degree or higher, with 82.7% or 3,608 individuals in the labor force. Within the labor force, individuals with college / associate degree education have the highest percentage of unemployment, with 15.5% or 36 of them being unemployed.
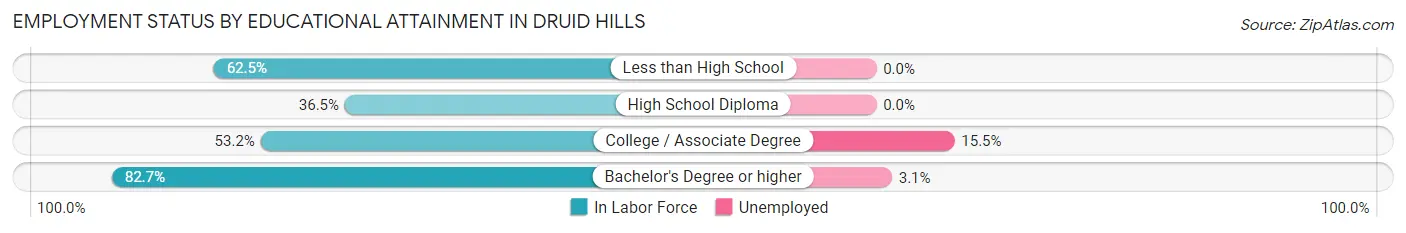
| Educational Attainment | In Labor Force | Unemployed |
| Less than High School | 15 (62.5%) | 0 (0.0%) |
| High School Diploma | 81 (36.5%) | 0 (0.0%) |
| College / Associate Degree | 233 (53.2%) | 68 (15.5%) |
| Bachelor's Degree or higher | 3,608 (82.7%) | 135 (3.1%) |
| Total | 3,937 (78.0%) | 187 (3.7%) |
Employment Occupations by Sex in Druid Hills
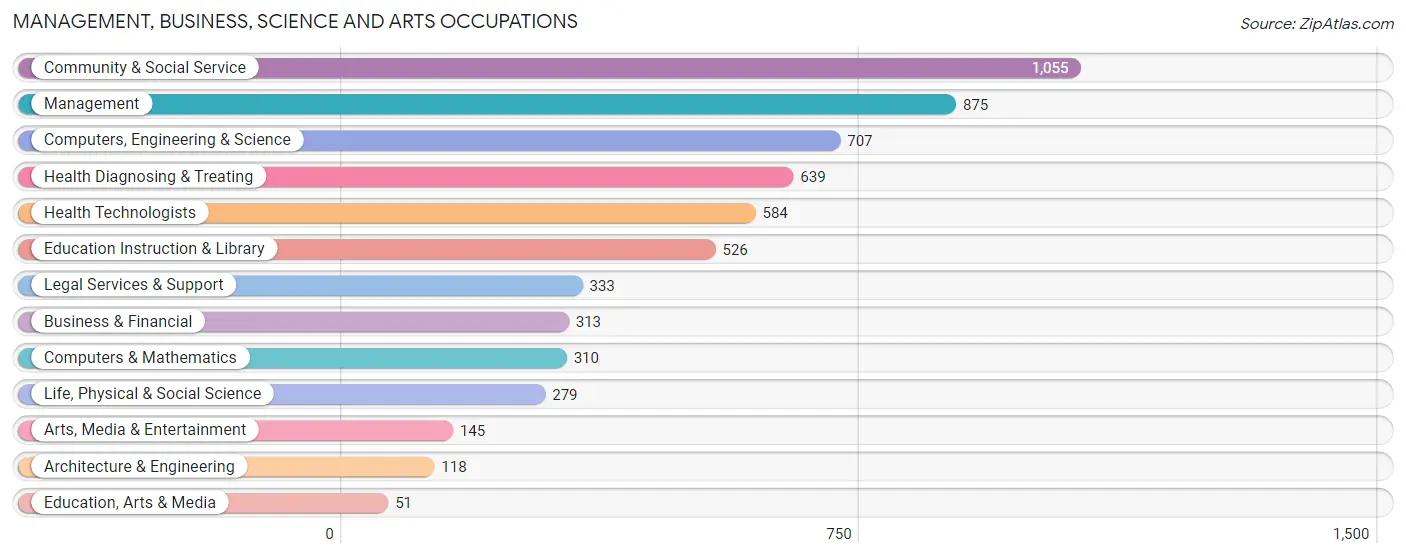
Management, Business, Science and Arts Occupations
The most common Management, Business, Science and Arts occupations in Druid Hills are Community & Social Service (1,055 | 24.3%), Management (875 | 20.2%), Computers, Engineering & Science (707 | 16.3%), Health Diagnosing & Treating (639 | 14.7%), and Health Technologists (584 | 13.5%).
Management, Business, Science and Arts Occupations by Sex
Within the Management, Business, Science and Arts occupations in Druid Hills, the most male-oriented occupations are Legal Services & Support (67.0%), Computers & Mathematics (66.1%), and Architecture & Engineering (66.1%), while the most female-oriented occupations are Health Technologists (71.1%), Health Diagnosing & Treating (69.5%), and Education Instruction & Library (62.2%).
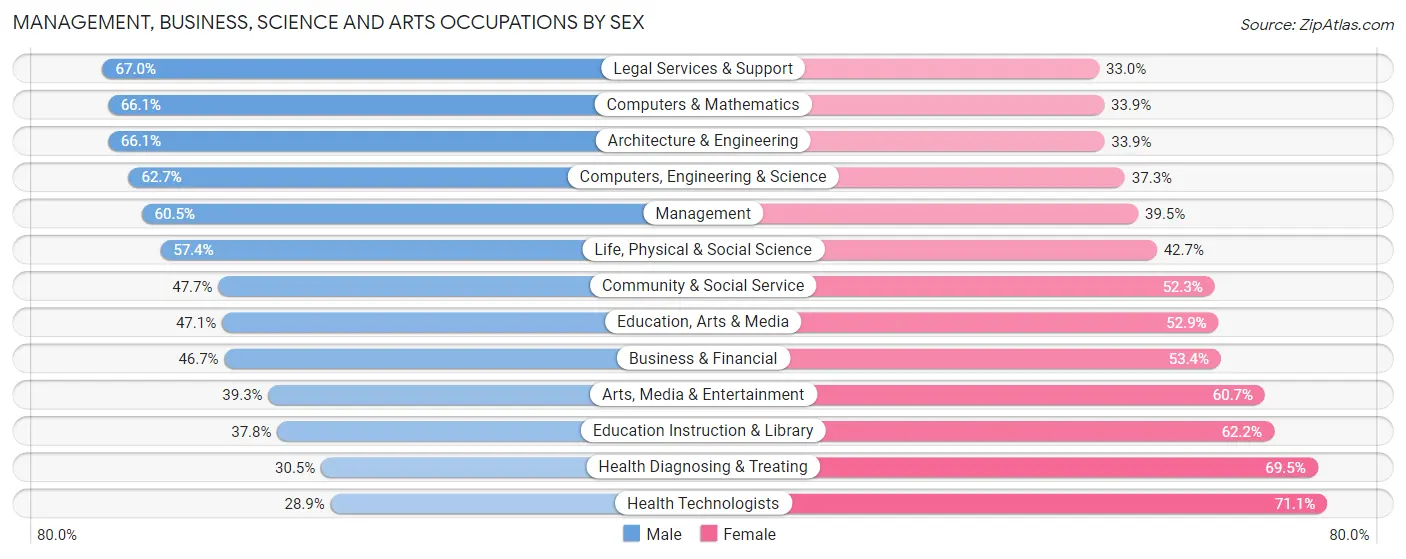
| Occupation | Male | Female |
| Management | 529 (60.5%) | 346 (39.5%) |
| Business & Financial | 146 (46.7%) | 167 (53.3%) |
| Computers, Engineering & Science | 443 (62.7%) | 264 (37.3%) |
| Computers & Mathematics | 205 (66.1%) | 105 (33.9%) |
| Architecture & Engineering | 78 (66.1%) | 40 (33.9%) |
| Life, Physical & Social Science | 160 (57.4%) | 119 (42.6%) |
| Community & Social Service | 503 (47.7%) | 552 (52.3%) |
| Education, Arts & Media | 24 (47.1%) | 27 (52.9%) |
| Legal Services & Support | 223 (67.0%) | 110 (33.0%) |
| Education Instruction & Library | 199 (37.8%) | 327 (62.2%) |
| Arts, Media & Entertainment | 57 (39.3%) | 88 (60.7%) |
| Health Diagnosing & Treating | 195 (30.5%) | 444 (69.5%) |
| Health Technologists | 169 (28.9%) | 415 (71.1%) |
| Total (Category) | 1,816 (50.6%) | 1,773 (49.4%) |
| Total (Overall) | 2,245 (51.8%) | 2,091 (48.2%) |
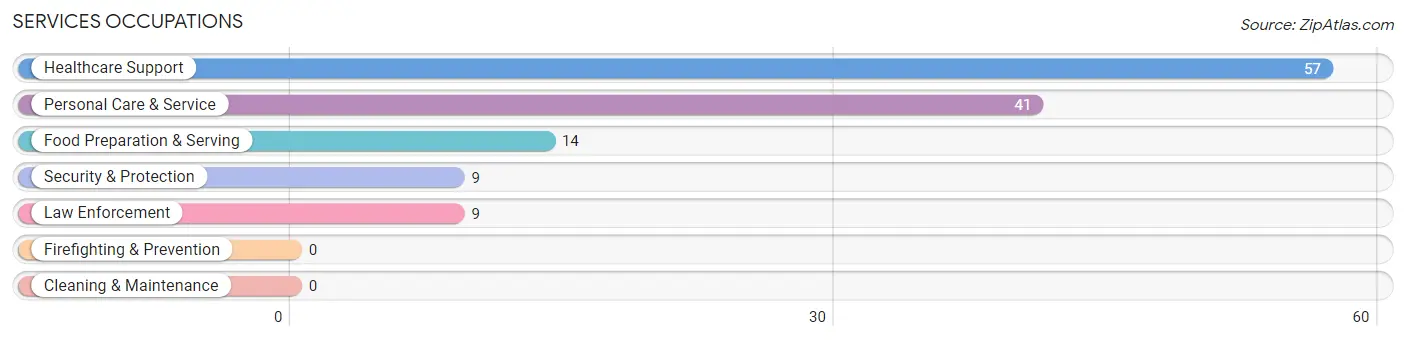
Services Occupations
The most common Services occupations in Druid Hills are Healthcare Support (57 | 1.3%), Personal Care & Service (41 | 0.9%), Food Preparation & Serving (14 | 0.3%), Security & Protection (9 | 0.2%), and Law Enforcement (9 | 0.2%).
Services Occupations by Sex
Within the Services occupations in Druid Hills, the most male-oriented occupations are Security & Protection (100.0%), Law Enforcement (100.0%), and Healthcare Support (7.0%), while the most female-oriented occupations are Food Preparation & Serving (100.0%), Personal Care & Service (100.0%), and Healthcare Support (93.0%).
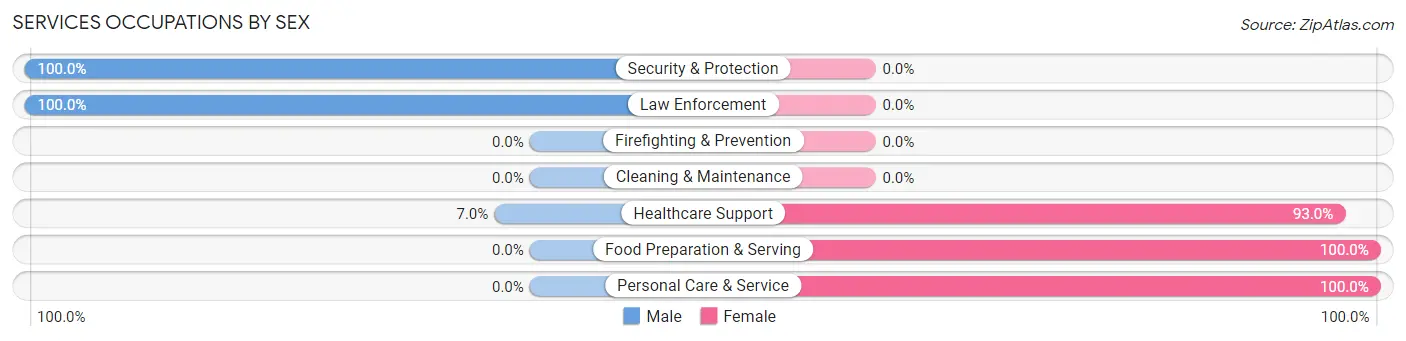
| Occupation | Male | Female |
| Healthcare Support | 4 (7.0%) | 53 (93.0%) |
| Security & Protection | 9 (100.0%) | 0 (0.0%) |
| Firefighting & Prevention | 0 (0.0%) | 0 (0.0%) |
| Law Enforcement | 9 (100.0%) | 0 (0.0%) |
| Food Preparation & Serving | 0 (0.0%) | 14 (100.0%) |
| Cleaning & Maintenance | 0 (0.0%) | 0 (0.0%) |
| Personal Care & Service | 0 (0.0%) | 41 (100.0%) |
| Total (Category) | 13 (10.7%) | 108 (89.3%) |
| Total (Overall) | 2,245 (51.8%) | 2,091 (48.2%) |
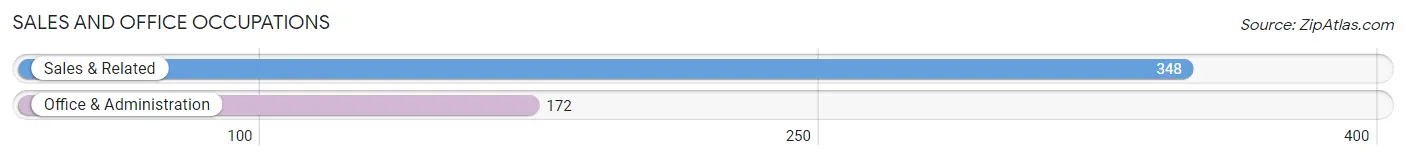
Sales and Office Occupations
The most common Sales and Office occupations in Druid Hills are Sales & Related (348 | 8.0%), and Office & Administration (172 | 4.0%).
Sales and Office Occupations by Sex
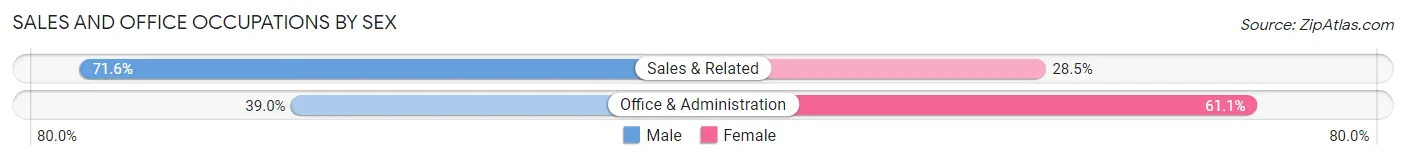
| Occupation | Male | Female |
| Sales & Related | 249 (71.6%) | 99 (28.4%) |
| Office & Administration | 67 (39.0%) | 105 (61.1%) |
| Total (Category) | 316 (60.8%) | 204 (39.2%) |
| Total (Overall) | 2,245 (51.8%) | 2,091 (48.2%) |
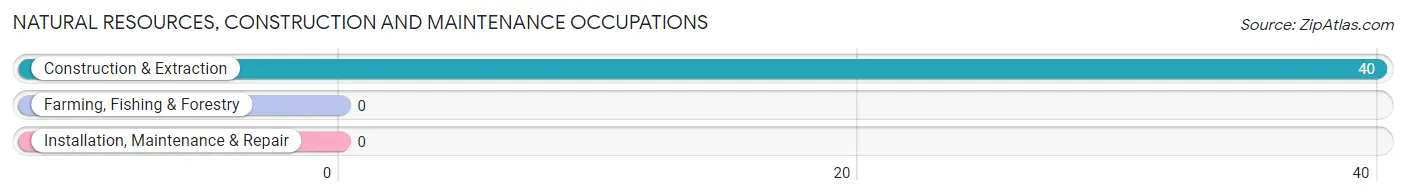
Natural Resources, Construction and Maintenance Occupations
The most common Natural Resources, Construction and Maintenance occupations in Druid Hills are , and Construction & Extraction (40 | 0.9%).
Natural Resources, Construction and Maintenance Occupations by Sex
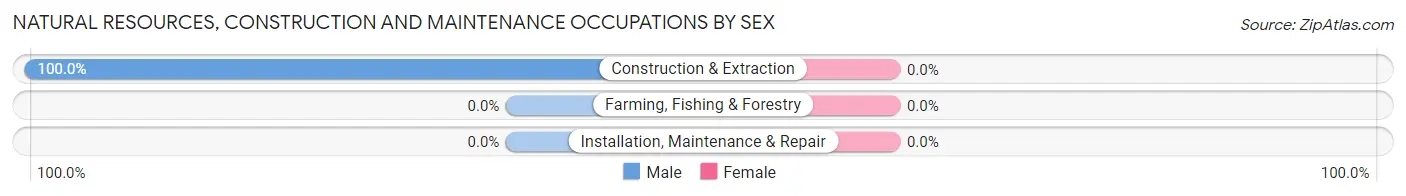
| Occupation | Male | Female |
| Farming, Fishing & Forestry | 0 (0.0%) | 0 (0.0%) |
| Construction & Extraction | 40 (100.0%) | 0 (0.0%) |
| Installation, Maintenance & Repair | 0 (0.0%) | 0 (0.0%) |
| Total (Category) | 40 (100.0%) | 0 (0.0%) |
| Total (Overall) | 2,245 (51.8%) | 2,091 (48.2%) |
Production, Transportation and Moving Occupations
The most common Production, Transportation and Moving occupations in Druid Hills are Material Moving (29 | 0.7%), Production (25 | 0.6%), and Transportation (12 | 0.3%).
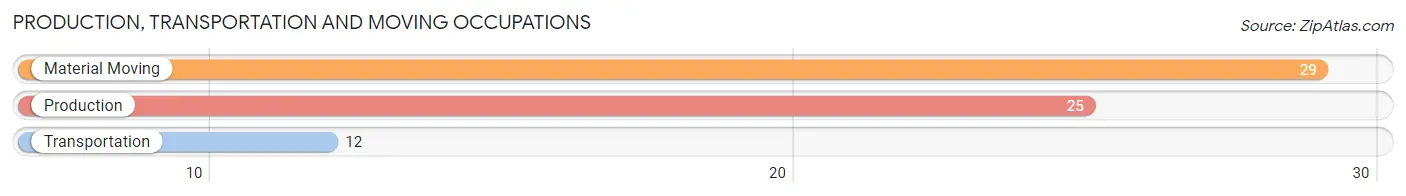
Production, Transportation and Moving Occupations by Sex
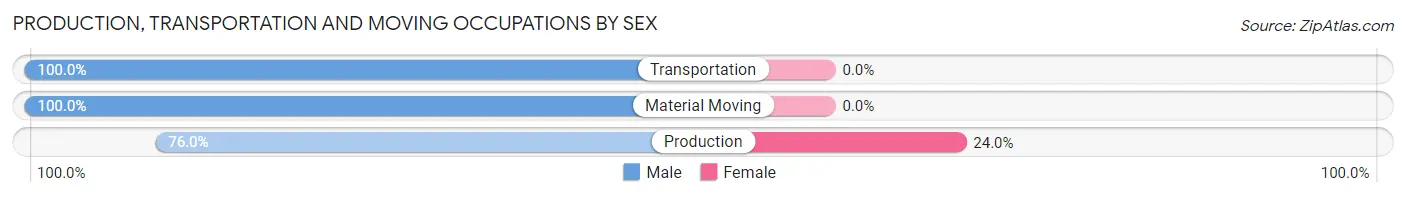
| Occupation | Male | Female |
| Production | 19 (76.0%) | 6 (24.0%) |
| Transportation | 12 (100.0%) | 0 (0.0%) |
| Material Moving | 29 (100.0%) | 0 (0.0%) |
| Total (Category) | 60 (90.9%) | 6 (9.1%) |
| Total (Overall) | 2,245 (51.8%) | 2,091 (48.2%) |
Employment Industries by Sex in Druid Hills
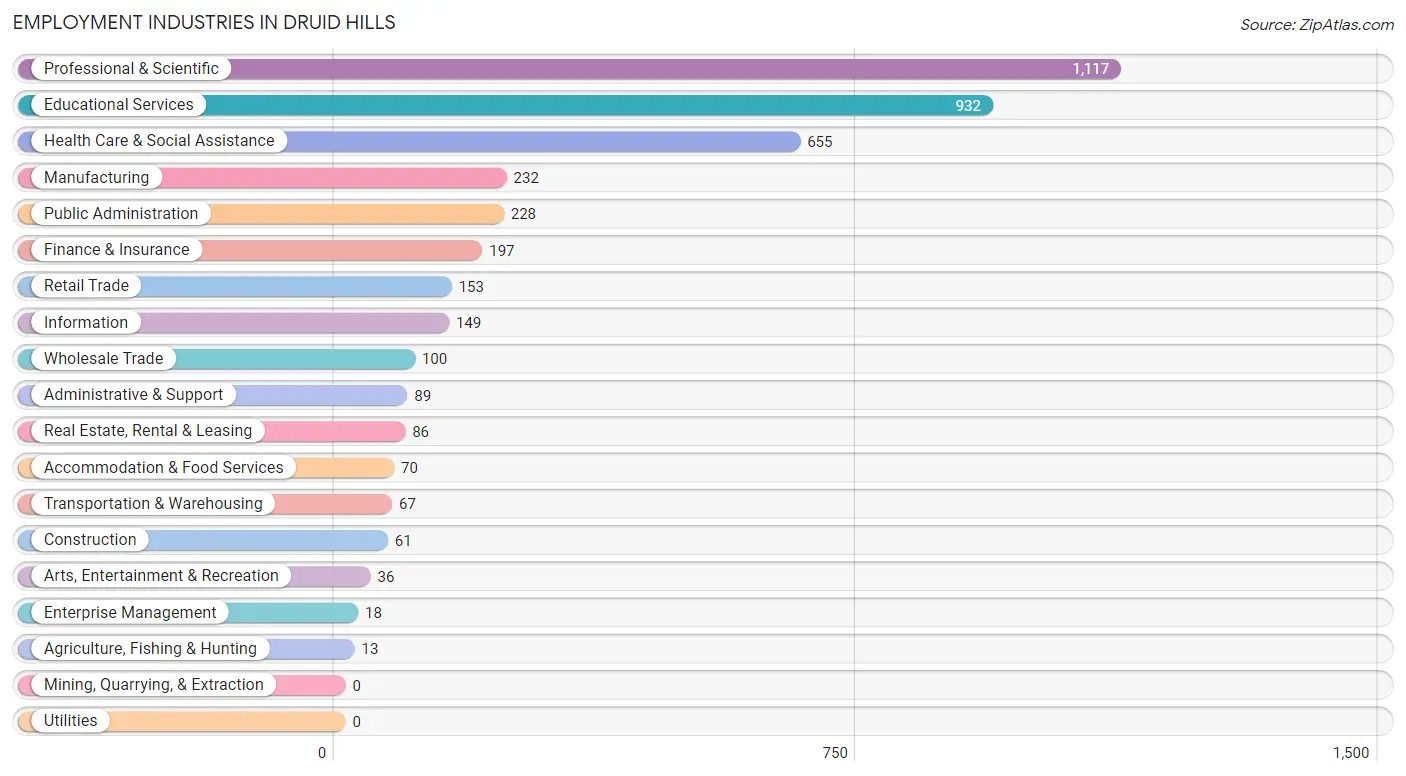
Employment Industries in Druid Hills
The major employment industries in Druid Hills include Professional & Scientific (1,117 | 25.8%), Educational Services (932 | 21.5%), Health Care & Social Assistance (655 | 15.1%), Manufacturing (232 | 5.3%), and Public Administration (228 | 5.3%).
Employment Industries by Sex in Druid Hills
The Druid Hills industries that see more men than women are Agriculture, Fishing & Hunting (100.0%), Construction (100.0%), and Manufacturing (93.1%), whereas the industries that tend to have a higher number of women are Arts, Entertainment & Recreation (100.0%), Accommodation & Food Services (100.0%), and Health Care & Social Assistance (69.9%).
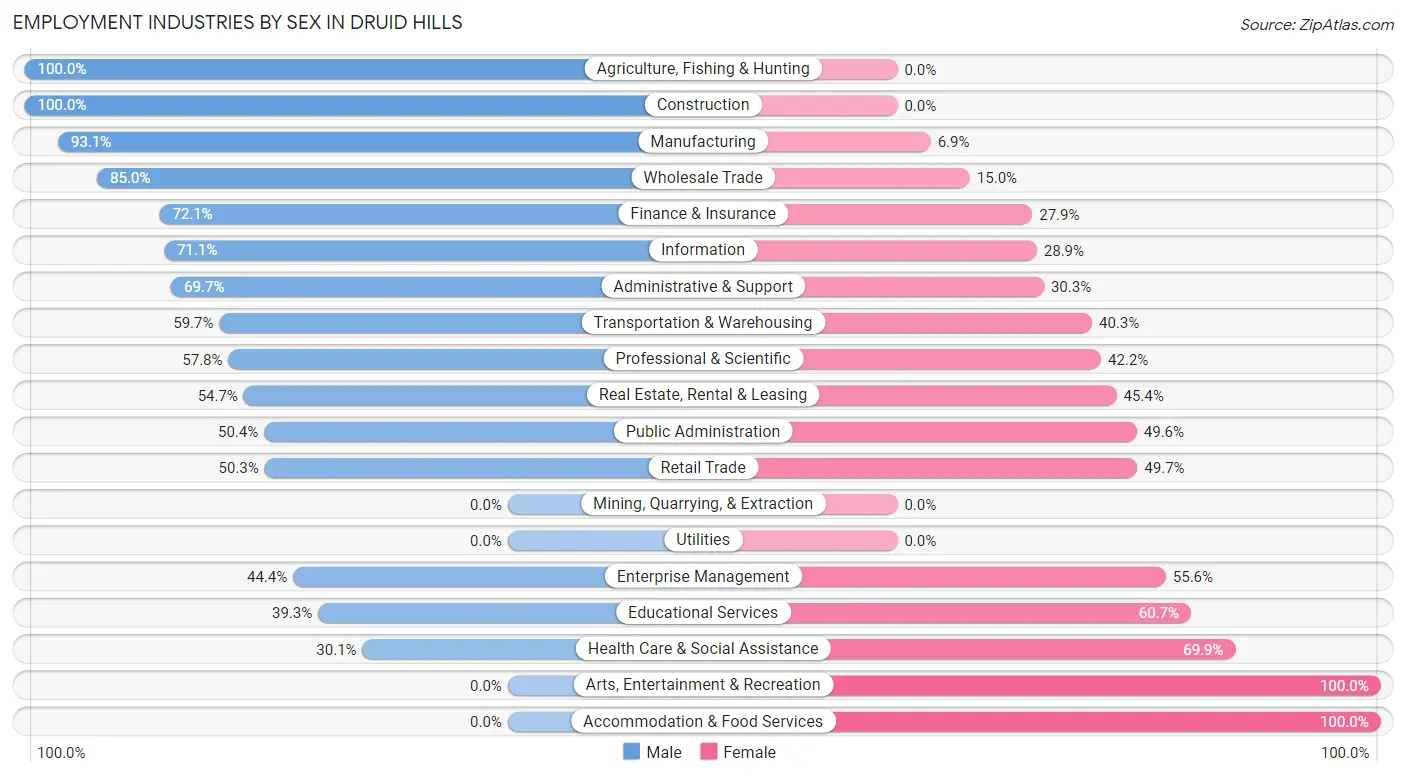
| Industry | Male | Female |
| Agriculture, Fishing & Hunting | 13 (100.0%) | 0 (0.0%) |
| Mining, Quarrying, & Extraction | 0 (0.0%) | 0 (0.0%) |
| Construction | 61 (100.0%) | 0 (0.0%) |
| Manufacturing | 216 (93.1%) | 16 (6.9%) |
| Wholesale Trade | 85 (85.0%) | 15 (15.0%) |
| Retail Trade | 77 (50.3%) | 76 (49.7%) |
| Transportation & Warehousing | 40 (59.7%) | 27 (40.3%) |
| Utilities | 0 (0.0%) | 0 (0.0%) |
| Information | 106 (71.1%) | 43 (28.9%) |
| Finance & Insurance | 142 (72.1%) | 55 (27.9%) |
| Real Estate, Rental & Leasing | 47 (54.6%) | 39 (45.4%) |
| Professional & Scientific | 646 (57.8%) | 471 (42.2%) |
| Enterprise Management | 8 (44.4%) | 10 (55.6%) |
| Administrative & Support | 62 (69.7%) | 27 (30.3%) |
| Educational Services | 366 (39.3%) | 566 (60.7%) |
| Health Care & Social Assistance | 197 (30.1%) | 458 (69.9%) |
| Arts, Entertainment & Recreation | 0 (0.0%) | 36 (100.0%) |
| Accommodation & Food Services | 0 (0.0%) | 70 (100.0%) |
| Public Administration | 115 (50.4%) | 113 (49.6%) |
| Total | 2,245 (51.8%) | 2,091 (48.2%) |
Education in Druid Hills
School Enrollment in Druid Hills
The most common levels of schooling among the 2,221 students in Druid Hills are graduate / professional (670 | 30.2%), middle school (447 | 20.1%), and college / undergraduate (377 | 17.0%).
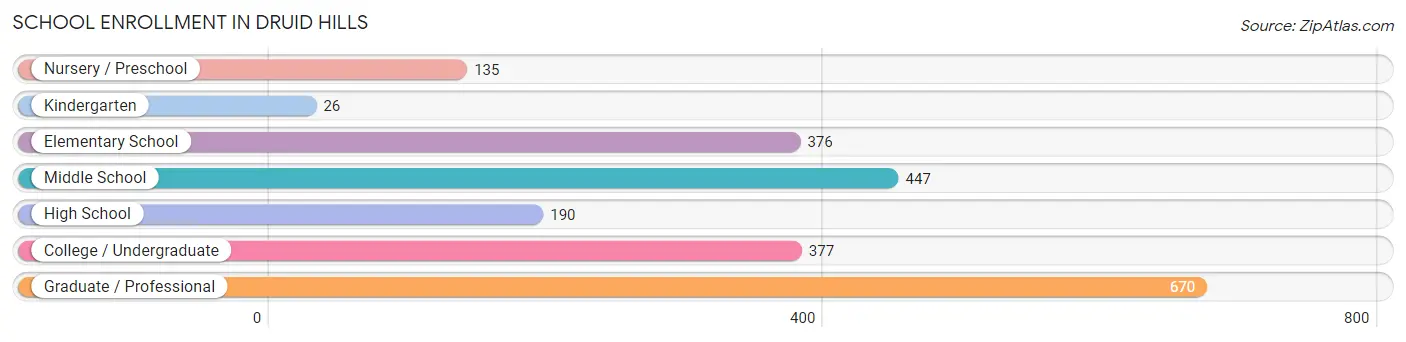
| School Level | # Students | % Students |
| Nursery / Preschool | 135 | 6.1% |
| Kindergarten | 26 | 1.2% |
| Elementary School | 376 | 16.9% |
| Middle School | 447 | 20.1% |
| High School | 190 | 8.6% |
| College / Undergraduate | 377 | 17.0% |
| Graduate / Professional | 670 | 30.2% |
| Total | 2,221 | 100.0% |
School Enrollment by Age by Funding Source in Druid Hills
Out of a total of 2,221 students who are enrolled in schools in Druid Hills, 1,404 (63.2%) attend a private institution, while the remaining 817 (36.8%) are enrolled in public schools. The age group of 3 to 4 year olds has the highest likelihood of being enrolled in private schools, with 117 (96.7% in the age bracket) enrolled. Conversely, the age group of 15 to 17 year olds has the lowest likelihood of being enrolled in a private school, with 115 (61.5% in the age bracket) attending a public institution.
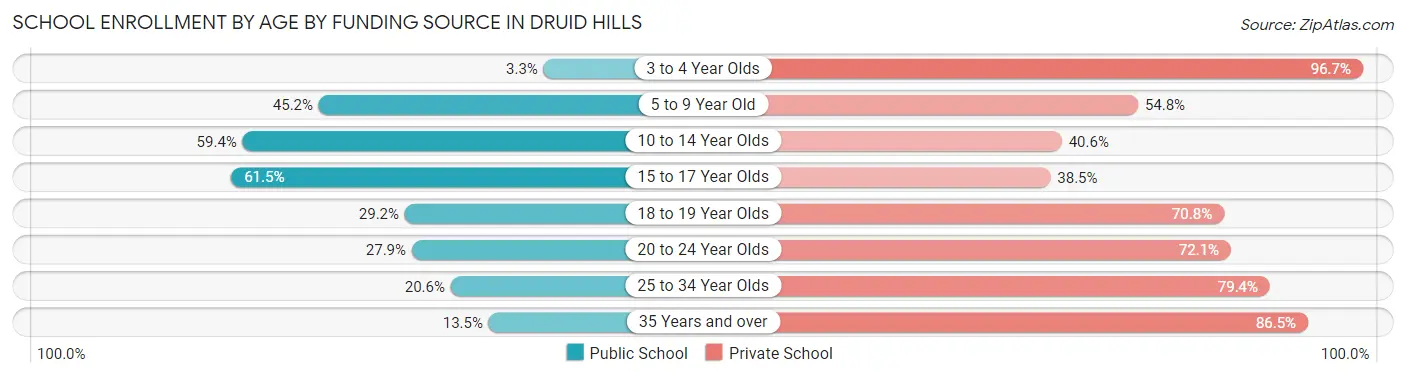
| Age Bracket | Public School | Private School |
| 3 to 4 Year Olds | 4 (3.3%) | 117 (96.7%) |
| 5 to 9 Year Old | 188 (45.2%) | 228 (54.8%) |
| 10 to 14 Year Olds | 266 (59.4%) | 182 (40.6%) |
| 15 to 17 Year Olds | 115 (61.5%) | 72 (38.5%) |
| 18 to 19 Year Olds | 14 (29.2%) | 34 (70.8%) |
| 20 to 24 Year Olds | 141 (27.9%) | 365 (72.1%) |
| 25 to 34 Year Olds | 67 (20.6%) | 258 (79.4%) |
| 35 Years and over | 23 (13.5%) | 147 (86.5%) |
| Total | 817 (36.8%) | 1,404 (63.2%) |
Educational Attainment by Field of Study in Druid Hills
Bio, nature & agricultural (809 | 13.5%), social sciences (753 | 12.5%), science & technology (672 | 11.2%), business (658 | 10.9%), and literature & languages (502 | 8.4%) are the most common fields of study among 6,012 individuals in Druid Hills who have obtained a bachelor's degree or higher.
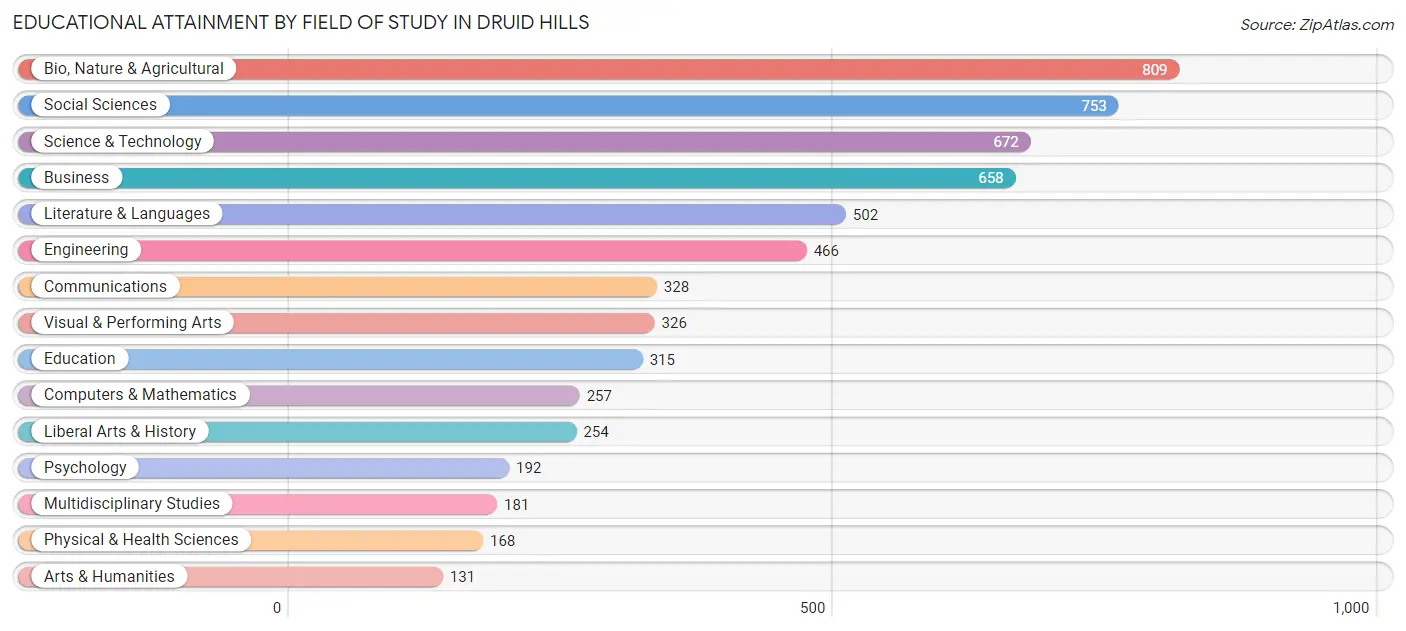
| Field of Study | # Graduates | % Graduates |
| Computers & Mathematics | 257 | 4.3% |
| Bio, Nature & Agricultural | 809 | 13.5% |
| Physical & Health Sciences | 168 | 2.8% |
| Psychology | 192 | 3.2% |
| Social Sciences | 753 | 12.5% |
| Engineering | 466 | 7.7% |
| Multidisciplinary Studies | 181 | 3.0% |
| Science & Technology | 672 | 11.2% |
| Business | 658 | 10.9% |
| Education | 315 | 5.2% |
| Literature & Languages | 502 | 8.4% |
| Liberal Arts & History | 254 | 4.2% |
| Visual & Performing Arts | 326 | 5.4% |
| Communications | 328 | 5.5% |
| Arts & Humanities | 131 | 2.2% |
| Total | 6,012 | 100.0% |
Transportation & Commute in Druid Hills
Vehicle Availability by Sex in Druid Hills
The most prevalent vehicle ownership categories in Druid Hills are males with 2 vehicles (1,233, accounting for 54.9%) and females with 2 vehicles (981, making up 60.2%).
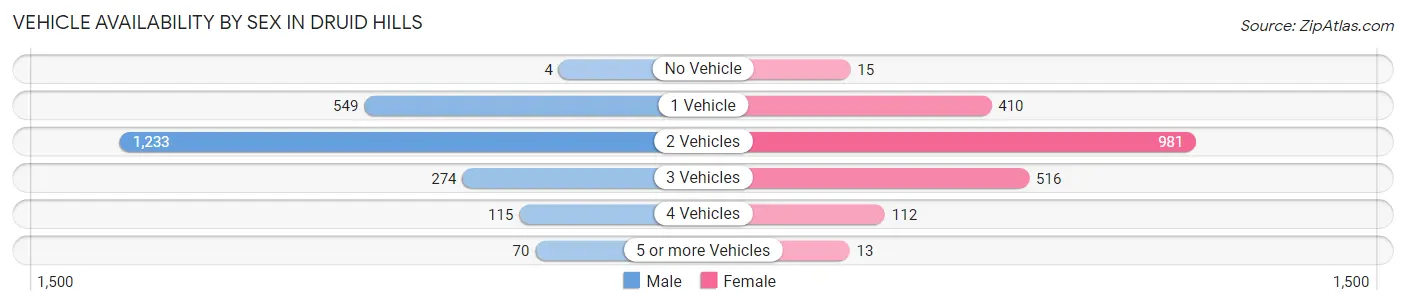
| Vehicles Available | Male | Female |
| No Vehicle | 4 (0.2%) | 15 (0.7%) |
| 1 Vehicle | 549 (24.4%) | 410 (20.0%) |
| 2 Vehicles | 1,233 (54.9%) | 981 (47.9%) |
| 3 Vehicles | 274 (12.2%) | 516 (25.2%) |
| 4 Vehicles | 115 (5.1%) | 112 (5.5%) |
| 5 or more Vehicles | 70 (3.1%) | 13 (0.6%) |
| Total | 2,245 (100.0%) | 2,047 (100.0%) |
Commute Time in Druid Hills
The most frequently occuring commute durations in Druid Hills are 10 to 14 minutes (706 commuters, 21.6%), 20 to 24 minutes (546 commuters, 16.7%), and 30 to 34 minutes (404 commuters, 12.4%).
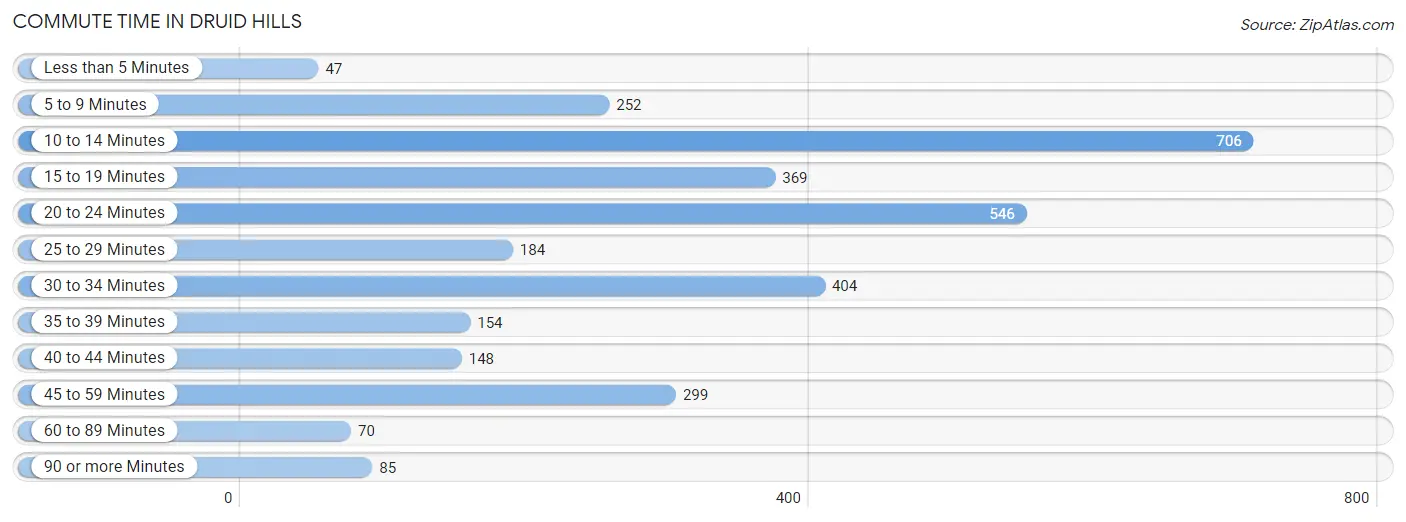
| Commute Time | # Commuters | % Commuters |
| Less than 5 Minutes | 47 | 1.4% |
| 5 to 9 Minutes | 252 | 7.7% |
| 10 to 14 Minutes | 706 | 21.6% |
| 15 to 19 Minutes | 369 | 11.3% |
| 20 to 24 Minutes | 546 | 16.7% |
| 25 to 29 Minutes | 184 | 5.6% |
| 30 to 34 Minutes | 404 | 12.4% |
| 35 to 39 Minutes | 154 | 4.7% |
| 40 to 44 Minutes | 148 | 4.5% |
| 45 to 59 Minutes | 299 | 9.2% |
| 60 to 89 Minutes | 70 | 2.1% |
| 90 or more Minutes | 85 | 2.6% |
Commute Time by Sex in Druid Hills
The most common commute times in Druid Hills are 20 to 24 minutes (283 commuters, 16.4%) for males and 10 to 14 minutes (460 commuters, 29.8%) for females.
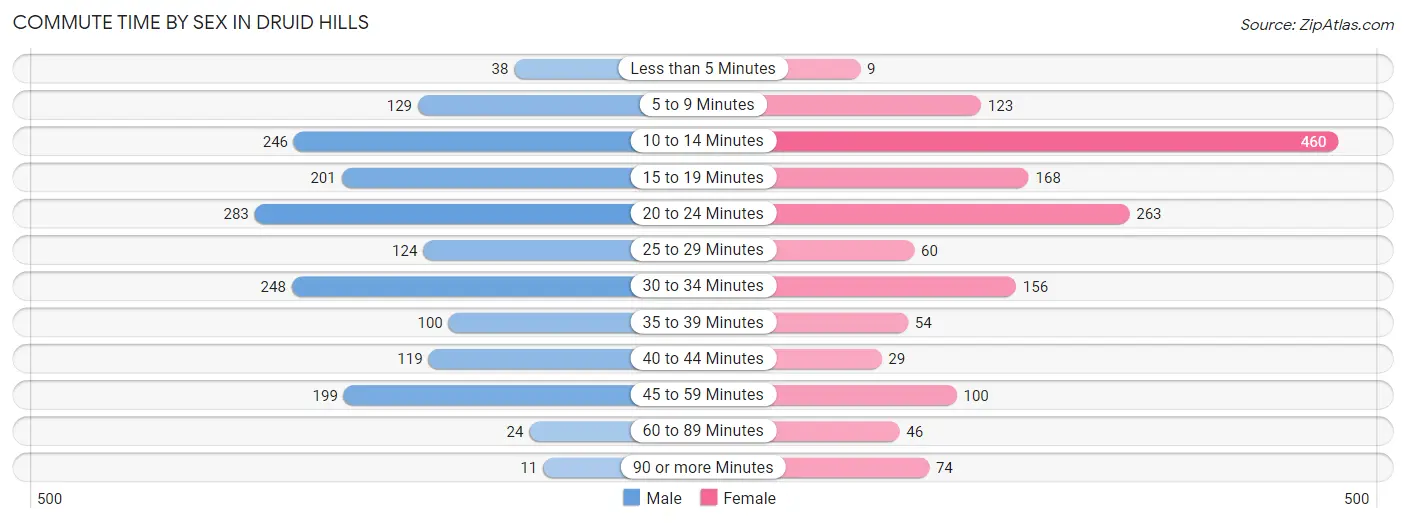
| Commute Time | Male | Female |
| Less than 5 Minutes | 38 (2.2%) | 9 (0.6%) |
| 5 to 9 Minutes | 129 (7.5%) | 123 (8.0%) |
| 10 to 14 Minutes | 246 (14.3%) | 460 (29.8%) |
| 15 to 19 Minutes | 201 (11.7%) | 168 (10.9%) |
| 20 to 24 Minutes | 283 (16.4%) | 263 (17.1%) |
| 25 to 29 Minutes | 124 (7.2%) | 60 (3.9%) |
| 30 to 34 Minutes | 248 (14.4%) | 156 (10.1%) |
| 35 to 39 Minutes | 100 (5.8%) | 54 (3.5%) |
| 40 to 44 Minutes | 119 (6.9%) | 29 (1.9%) |
| 45 to 59 Minutes | 199 (11.6%) | 100 (6.5%) |
| 60 to 89 Minutes | 24 (1.4%) | 46 (3.0%) |
| 90 or more Minutes | 11 (0.6%) | 74 (4.8%) |
Time of Departure to Work by Sex in Druid Hills
The most frequent times of departure to work in Druid Hills are 8:30 AM to 8:59 AM (296, 17.2%) for males and 8:00 AM to 8:29 AM (320, 20.7%) for females.
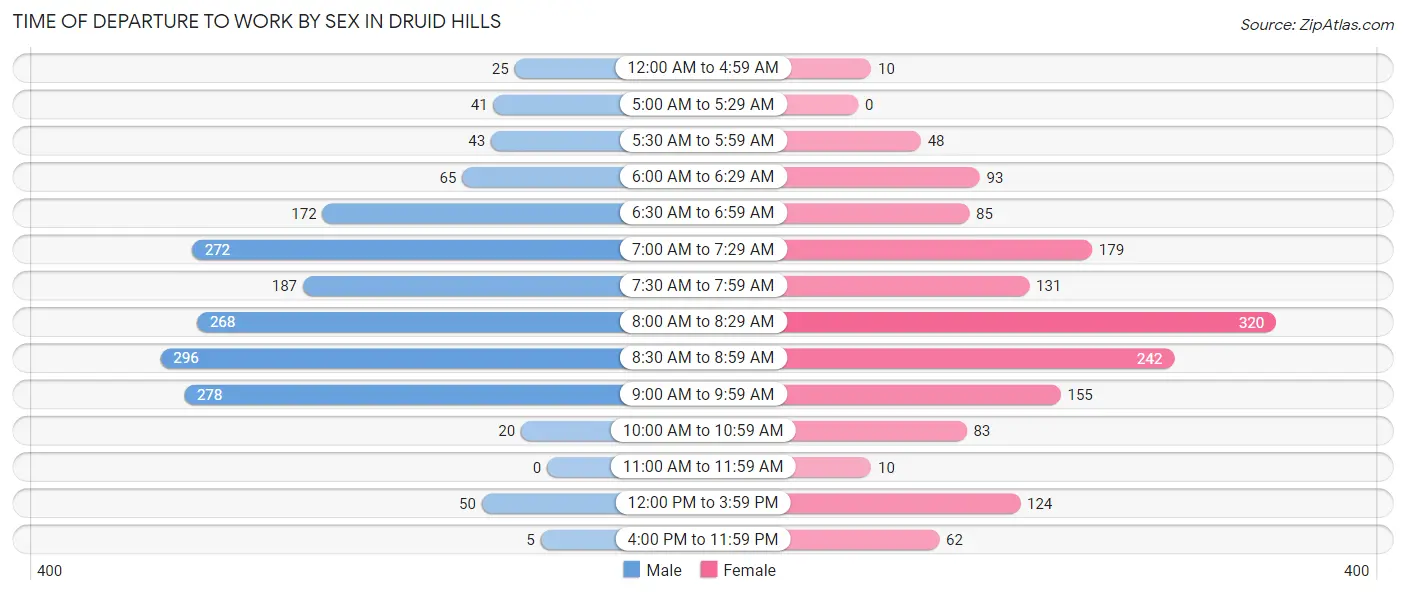
| Time of Departure | Male | Female |
| 12:00 AM to 4:59 AM | 25 (1.5%) | 10 (0.6%) |
| 5:00 AM to 5:29 AM | 41 (2.4%) | 0 (0.0%) |
| 5:30 AM to 5:59 AM | 43 (2.5%) | 48 (3.1%) |
| 6:00 AM to 6:29 AM | 65 (3.8%) | 93 (6.0%) |
| 6:30 AM to 6:59 AM | 172 (10.0%) | 85 (5.5%) |
| 7:00 AM to 7:29 AM | 272 (15.8%) | 179 (11.6%) |
| 7:30 AM to 7:59 AM | 187 (10.9%) | 131 (8.5%) |
| 8:00 AM to 8:29 AM | 268 (15.6%) | 320 (20.7%) |
| 8:30 AM to 8:59 AM | 296 (17.2%) | 242 (15.7%) |
| 9:00 AM to 9:59 AM | 278 (16.1%) | 155 (10.1%) |
| 10:00 AM to 10:59 AM | 20 (1.2%) | 83 (5.4%) |
| 11:00 AM to 11:59 AM | 0 (0.0%) | 10 (0.6%) |
| 12:00 PM to 3:59 PM | 50 (2.9%) | 124 (8.0%) |
| 4:00 PM to 11:59 PM | 5 (0.3%) | 62 (4.0%) |
| Total | 1,722 (100.0%) | 1,542 (100.0%) |
Housing Occupancy in Druid Hills
Occupancy by Ownership in Druid Hills
Of the total 3,664 dwellings in Druid Hills, owner-occupied units account for 2,302 (62.8%), while renter-occupied units make up 1,362 (37.2%).
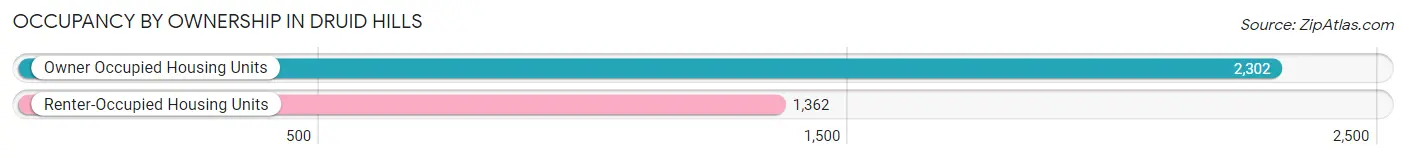
| Occupancy | # Housing Units | % Housing Units |
| Owner Occupied Housing Units | 2,302 | 62.8% |
| Renter-Occupied Housing Units | 1,362 | 37.2% |
| Total Occupied Housing Units | 3,664 | 100.0% |
Occupancy by Household Size in Druid Hills
| Household Size | # Housing Units | % Housing Units |
| 1-Person Household | 1,119 | 30.5% |
| 2-Person Household | 1,495 | 40.8% |
| 3-Person Household | 409 | 11.2% |
| 4+ Person Household | 641 | 17.5% |
| Total Housing Units | 3,664 | 100.0% |
Occupancy by Ownership by Household Size in Druid Hills
| Household Size | Owner-occupied | Renter-occupied |
| 1-Person Household | 448 (40.0%) | 671 (60.0%) |
| 2-Person Household | 1,079 (72.2%) | 416 (27.8%) |
| 3-Person Household | 273 (66.7%) | 136 (33.3%) |
| 4+ Person Household | 502 (78.3%) | 139 (21.7%) |
| Total Housing Units | 2,302 (62.8%) | 1,362 (37.2%) |
Occupancy by Educational Attainment in Druid Hills
| Household Size | Owner-occupied | Renter-occupied |
| Less than High School | 0 (0.0%) | 0 (0.0%) |
| High School Diploma | 38 (48.1%) | 41 (51.9%) |
| College/Associate Degree | 151 (57.6%) | 111 (42.4%) |
| Bachelor's Degree or higher | 2,113 (63.6%) | 1,210 (36.4%) |
Occupancy by Age of Householder in Druid Hills
| Age Bracket | # Households | % Households |
| Under 35 Years | 958 | 26.2% |
| 35 to 44 Years | 476 | 13.0% |
| 45 to 54 Years | 521 | 14.2% |
| 55 to 64 Years | 816 | 22.3% |
| 65 to 74 Years | 528 | 14.4% |
| 75 to 84 Years | 326 | 8.9% |
| 85 Years and Over | 39 | 1.1% |
| Total | 3,664 | 100.0% |
Housing Finances in Druid Hills
Median Income by Occupancy in Druid Hills
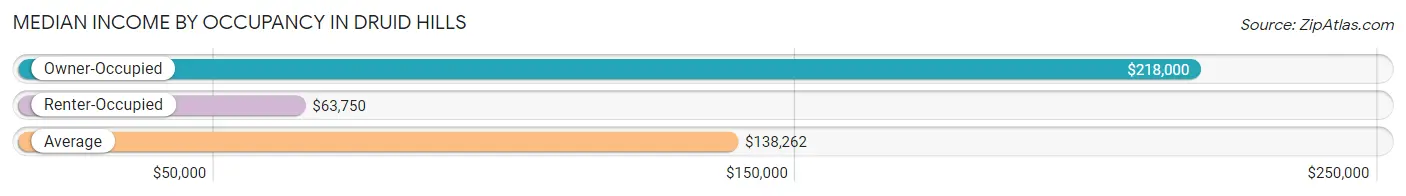
| Occupancy Type | # Households | Median Income |
| Owner-Occupied | 2,302 (62.8%) | $218,000 |
| Renter-Occupied | 1,362 (37.2%) | $63,750 |
| Average | 3,664 (100.0%) | $138,262 |
Occupancy by Householder Income Bracket in Druid Hills
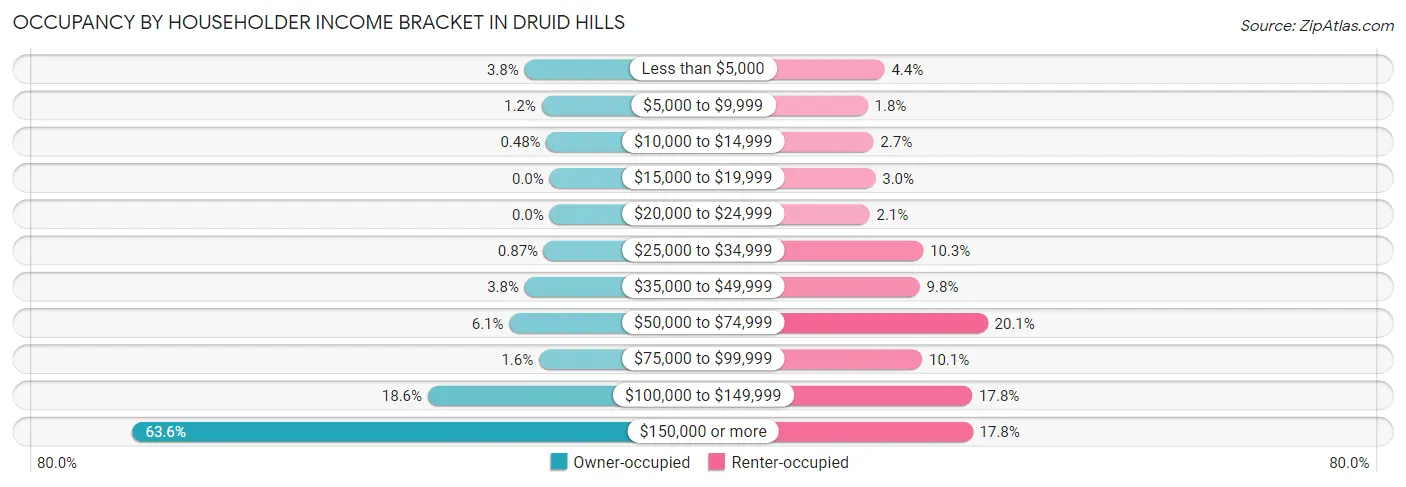
| Income Bracket | Owner-occupied | Renter-occupied |
| Less than $5,000 | 88 (3.8%) | 60 (4.4%) |
| $5,000 to $9,999 | 28 (1.2%) | 25 (1.8%) |
| $10,000 to $14,999 | 11 (0.5%) | 37 (2.7%) |
| $15,000 to $19,999 | 0 (0.0%) | 41 (3.0%) |
| $20,000 to $24,999 | 0 (0.0%) | 29 (2.1%) |
| $25,000 to $34,999 | 20 (0.9%) | 140 (10.3%) |
| $35,000 to $49,999 | 87 (3.8%) | 133 (9.8%) |
| $50,000 to $74,999 | 141 (6.1%) | 274 (20.1%) |
| $75,000 to $99,999 | 37 (1.6%) | 138 (10.1%) |
| $100,000 to $149,999 | 427 (18.5%) | 242 (17.8%) |
| $150,000 or more | 1,463 (63.5%) | 243 (17.8%) |
| Total | 2,302 (100.0%) | 1,362 (100.0%) |
Monthly Housing Cost Tiers in Druid Hills
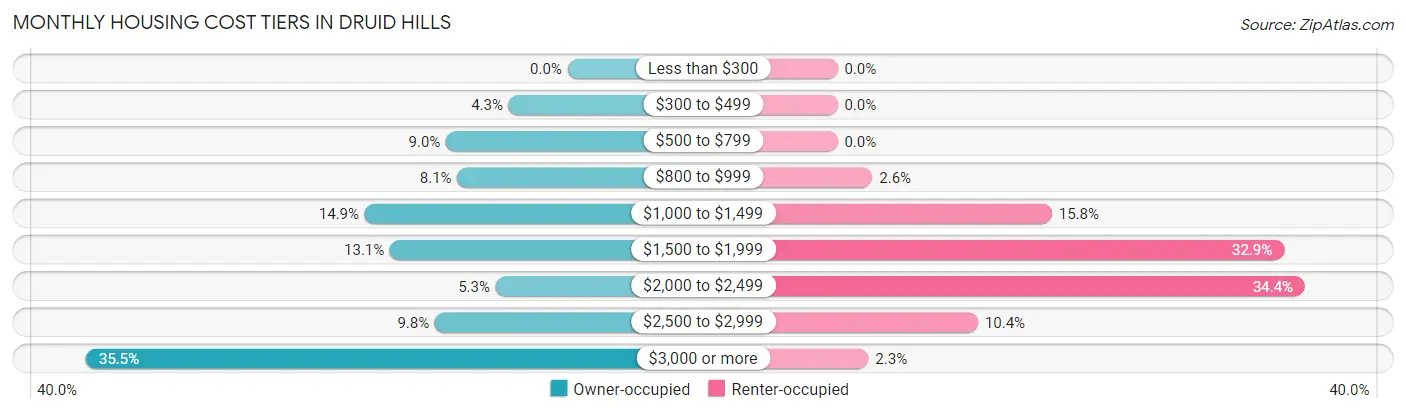
| Monthly Cost | Owner-occupied | Renter-occupied |
| Less than $300 | 0 (0.0%) | 0 (0.0%) |
| $300 to $499 | 100 (4.3%) | 0 (0.0%) |
| $500 to $799 | 206 (8.9%) | 0 (0.0%) |
| $800 to $999 | 187 (8.1%) | 35 (2.6%) |
| $1,000 to $1,499 | 344 (14.9%) | 215 (15.8%) |
| $1,500 to $1,999 | 301 (13.1%) | 448 (32.9%) |
| $2,000 to $2,499 | 122 (5.3%) | 469 (34.4%) |
| $2,500 to $2,999 | 225 (9.8%) | 141 (10.3%) |
| $3,000 or more | 817 (35.5%) | 31 (2.3%) |
| Total | 2,302 (100.0%) | 1,362 (100.0%) |
Physical Housing Characteristics in Druid Hills
Housing Structures in Druid Hills
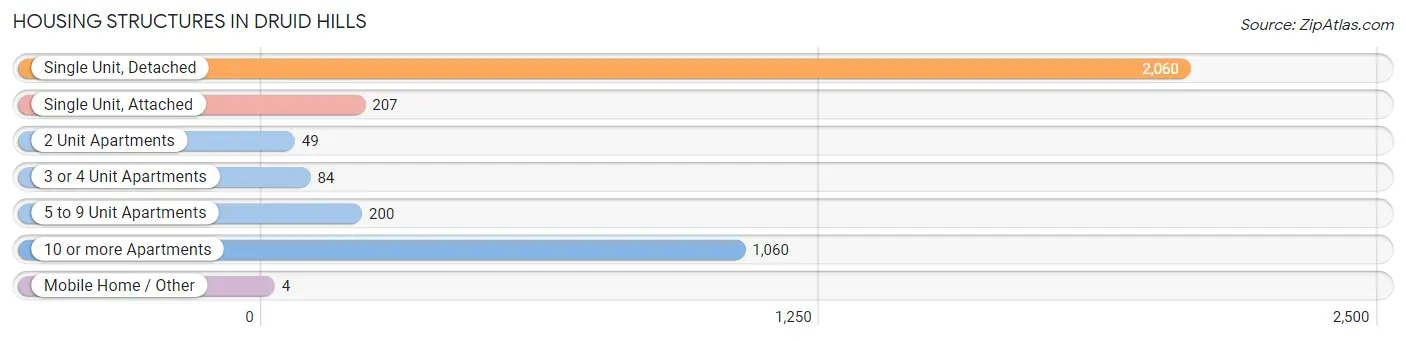
| Structure Type | # Housing Units | % Housing Units |
| Single Unit, Detached | 2,060 | 56.2% |
| Single Unit, Attached | 207 | 5.7% |
| 2 Unit Apartments | 49 | 1.3% |
| 3 or 4 Unit Apartments | 84 | 2.3% |
| 5 to 9 Unit Apartments | 200 | 5.5% |
| 10 or more Apartments | 1,060 | 28.9% |
| Mobile Home / Other | 4 | 0.1% |
| Total | 3,664 | 100.0% |
Housing Structures by Occupancy in Druid Hills
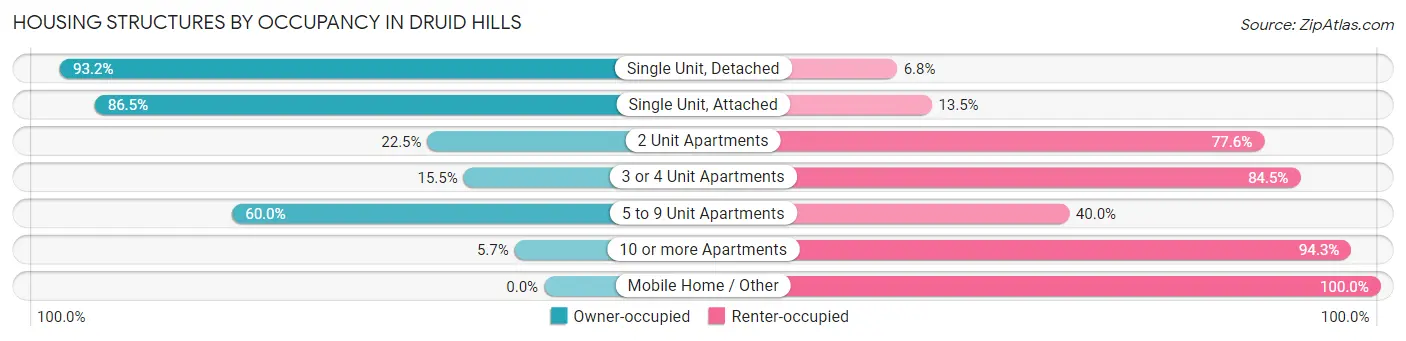
| Structure Type | Owner-occupied | Renter-occupied |
| Single Unit, Detached | 1,919 (93.2%) | 141 (6.8%) |
| Single Unit, Attached | 179 (86.5%) | 28 (13.5%) |
| 2 Unit Apartments | 11 (22.5%) | 38 (77.5%) |
| 3 or 4 Unit Apartments | 13 (15.5%) | 71 (84.5%) |
| 5 to 9 Unit Apartments | 120 (60.0%) | 80 (40.0%) |
| 10 or more Apartments | 60 (5.7%) | 1,000 (94.3%) |
| Mobile Home / Other | 0 (0.0%) | 4 (100.0%) |
| Total | 2,302 (62.8%) | 1,362 (37.2%) |
Housing Structures by Number of Rooms in Druid Hills
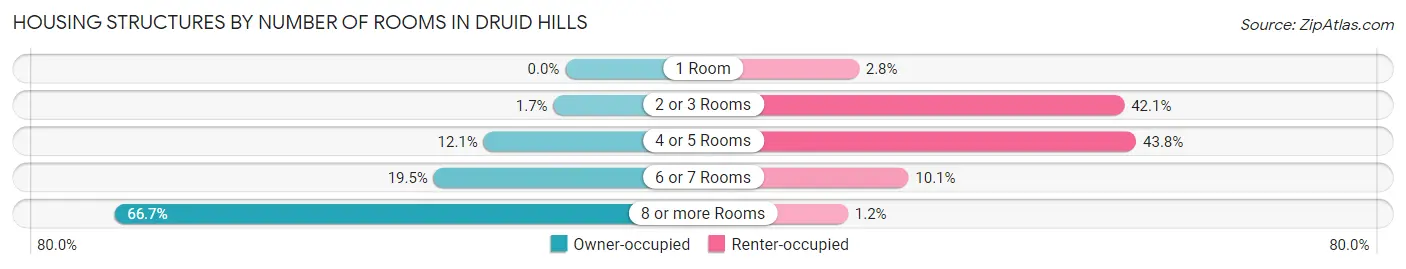
| Number of Rooms | Owner-occupied | Renter-occupied |
| 1 Room | 0 (0.0%) | 38 (2.8%) |
| 2 or 3 Rooms | 40 (1.7%) | 573 (42.1%) |
| 4 or 5 Rooms | 278 (12.1%) | 597 (43.8%) |
| 6 or 7 Rooms | 448 (19.5%) | 138 (10.1%) |
| 8 or more Rooms | 1,536 (66.7%) | 16 (1.2%) |
| Total | 2,302 (100.0%) | 1,362 (100.0%) |
Housing Structure by Heating Type in Druid Hills
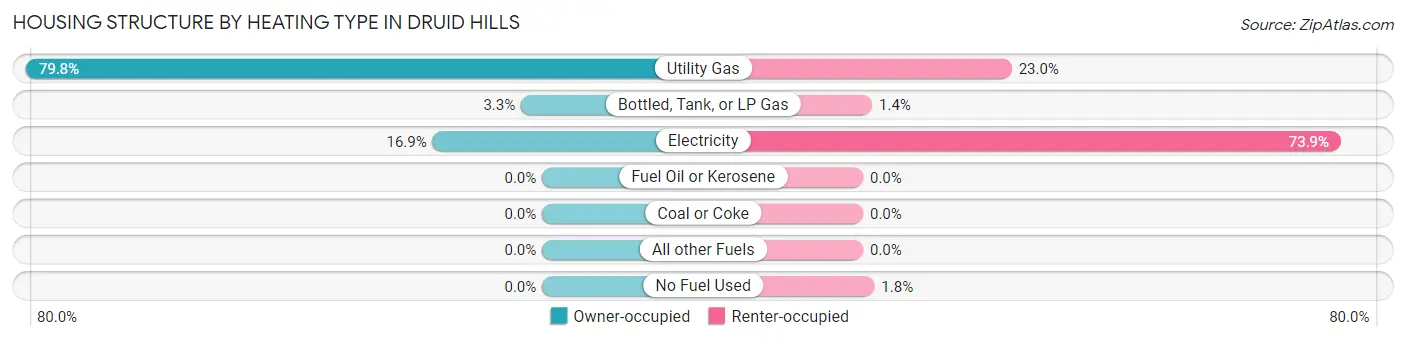
| Heating Type | Owner-occupied | Renter-occupied |
| Utility Gas | 1,837 (79.8%) | 313 (23.0%) |
| Bottled, Tank, or LP Gas | 75 (3.3%) | 19 (1.4%) |
| Electricity | 390 (16.9%) | 1,006 (73.9%) |
| Fuel Oil or Kerosene | 0 (0.0%) | 0 (0.0%) |
| Coal or Coke | 0 (0.0%) | 0 (0.0%) |
| All other Fuels | 0 (0.0%) | 0 (0.0%) |
| No Fuel Used | 0 (0.0%) | 24 (1.8%) |
| Total | 2,302 (100.0%) | 1,362 (100.0%) |
Household Vehicle Usage in Druid Hills
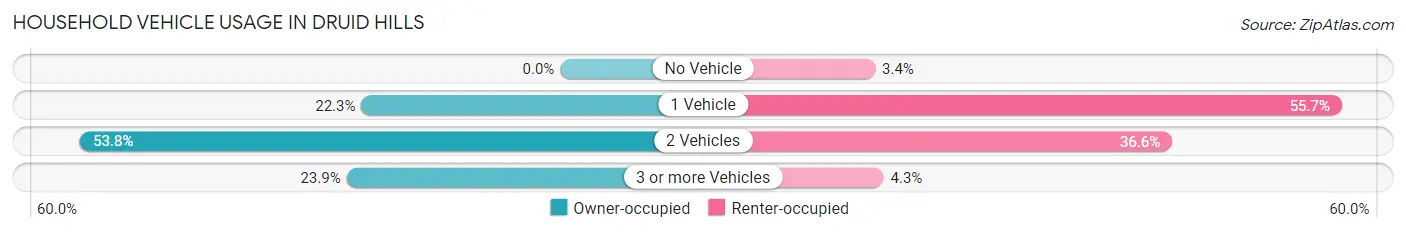
| Vehicles per Household | Owner-occupied | Renter-occupied |
| No Vehicle | 0 (0.0%) | 46 (3.4%) |
| 1 Vehicle | 513 (22.3%) | 758 (55.6%) |
| 2 Vehicles | 1,238 (53.8%) | 499 (36.6%) |
| 3 or more Vehicles | 551 (23.9%) | 59 (4.3%) |
| Total | 2,302 (100.0%) | 1,362 (100.0%) |
Real Estate & Mortgages in Druid Hills
Real Estate and Mortgage Overview in Druid Hills
| Characteristic | Without Mortgage | With Mortgage |
| Housing Units | 916 | 1,386 |
| Median Property Value | $692,300 | $780,500 |
| Median Household Income | $158,864 | $949 |
| Monthly Housing Costs | $1,068 | $817 |
| Real Estate Taxes | $6,946 | $16 |
Property Value by Mortgage Status in Druid Hills
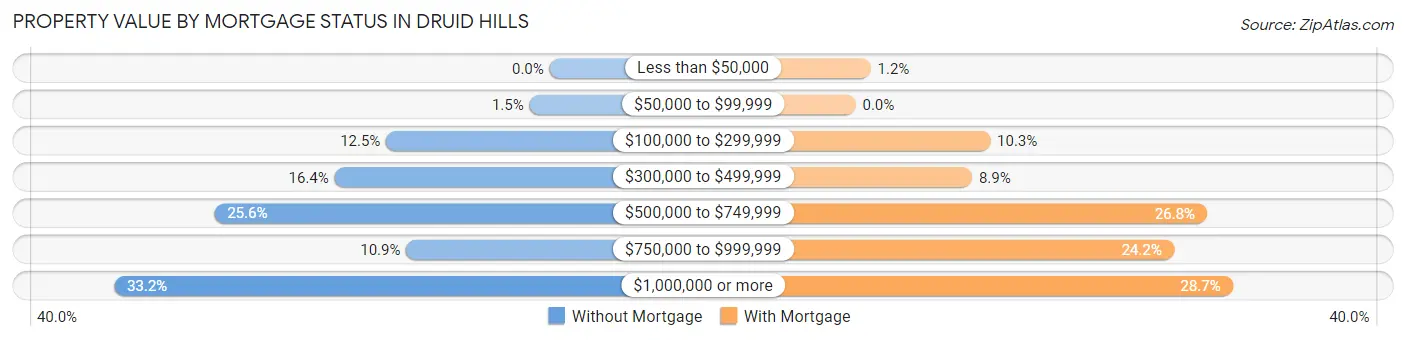
| Property Value | Without Mortgage | With Mortgage |
| Less than $50,000 | 0 (0.0%) | 16 (1.1%) |
| $50,000 to $99,999 | 14 (1.5%) | 0 (0.0%) |
| $100,000 to $299,999 | 114 (12.4%) | 142 (10.2%) |
| $300,000 to $499,999 | 150 (16.4%) | 123 (8.9%) |
| $500,000 to $749,999 | 234 (25.6%) | 371 (26.8%) |
| $750,000 to $999,999 | 100 (10.9%) | 336 (24.2%) |
| $1,000,000 or more | 304 (33.2%) | 398 (28.7%) |
| Total | 916 (100.0%) | 1,386 (100.0%) |
Household Income by Mortgage Status in Druid Hills
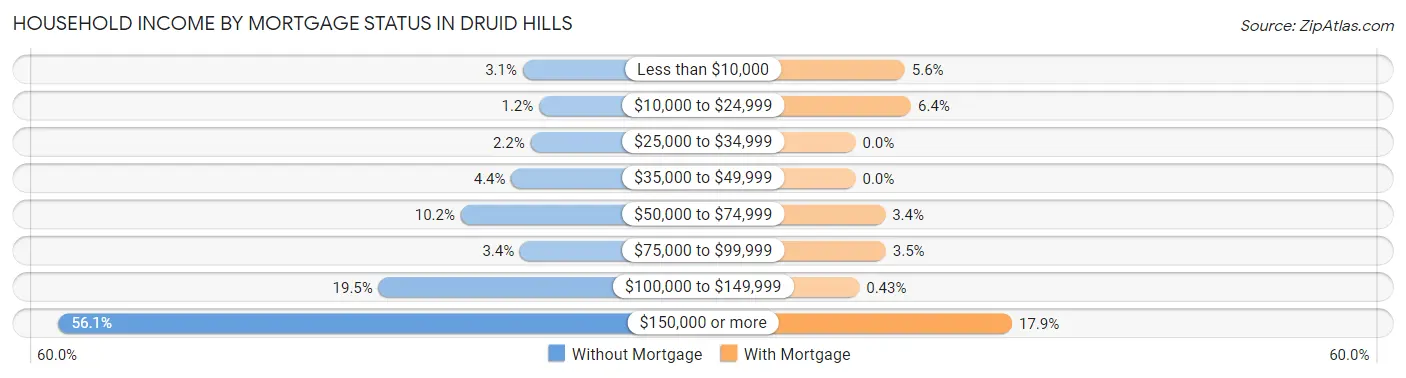
| Household Income | Without Mortgage | With Mortgage |
| Less than $10,000 | 28 (3.1%) | 78 (5.6%) |
| $10,000 to $24,999 | 11 (1.2%) | 88 (6.4%) |
| $25,000 to $34,999 | 20 (2.2%) | 0 (0.0%) |
| $35,000 to $49,999 | 40 (4.4%) | 0 (0.0%) |
| $50,000 to $74,999 | 93 (10.2%) | 47 (3.4%) |
| $75,000 to $99,999 | 31 (3.4%) | 48 (3.5%) |
| $100,000 to $149,999 | 179 (19.5%) | 6 (0.4%) |
| $150,000 or more | 514 (56.1%) | 248 (17.9%) |
| Total | 916 (100.0%) | 1,386 (100.0%) |
Property Value to Household Income Ratio in Druid Hills
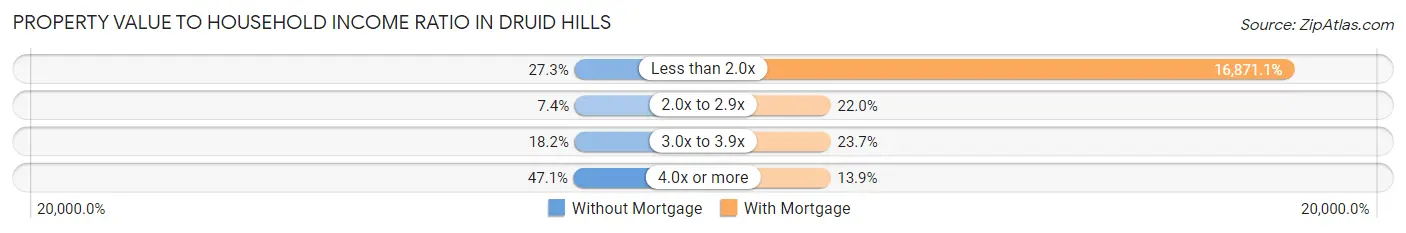
| Value-to-Income Ratio | Without Mortgage | With Mortgage |
| Less than 2.0x | 250 (27.3%) | 233,833 (16,871.1%) |
| 2.0x to 2.9x | 68 (7.4%) | 305 (22.0%) |
| 3.0x to 3.9x | 167 (18.2%) | 329 (23.7%) |
| 4.0x or more | 431 (47.0%) | 193 (13.9%) |
| Total | 916 (100.0%) | 1,386 (100.0%) |
Real Estate Taxes by Mortgage Status in Druid Hills
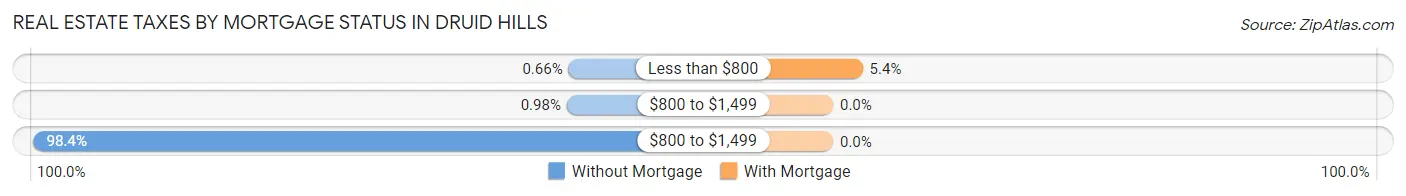
| Property Taxes | Without Mortgage | With Mortgage |
| Less than $800 | 6 (0.7%) | 75 (5.4%) |
| $800 to $1,499 | 9 (1.0%) | 0 (0.0%) |
| $800 to $1,499 | 901 (98.4%) | 0 (0.0%) |
| Total | 916 (100.0%) | 1,386 (100.0%) |
Health & Disability in Druid Hills
Health Insurance Coverage by Age in Druid Hills
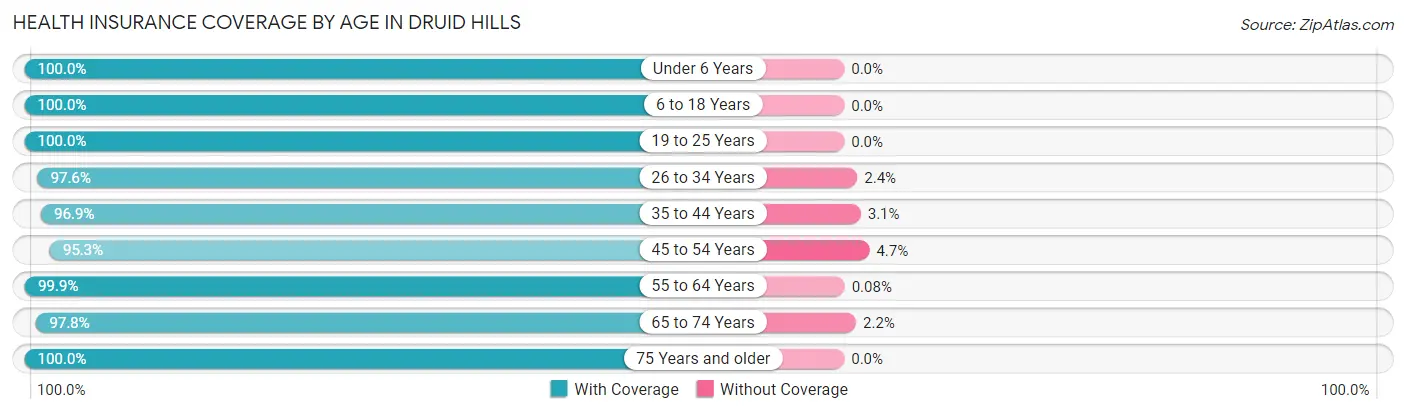
| Age Bracket | With Coverage | Without Coverage |
| Under 6 Years | 365 (100.0%) | 0 (0.0%) |
| 6 to 18 Years | 1,068 (100.0%) | 0 (0.0%) |
| 19 to 25 Years | 694 (100.0%) | 0 (0.0%) |
| 26 to 34 Years | 1,526 (97.6%) | 38 (2.4%) |
| 35 to 44 Years | 976 (96.9%) | 31 (3.1%) |
| 45 to 54 Years | 933 (95.3%) | 46 (4.7%) |
| 55 to 64 Years | 1,314 (99.9%) | 1 (0.1%) |
| 65 to 74 Years | 757 (97.8%) | 17 (2.2%) |
| 75 Years and older | 519 (100.0%) | 0 (0.0%) |
| Total | 8,152 (98.4%) | 133 (1.6%) |
Health Insurance Coverage by Citizenship Status in Druid Hills
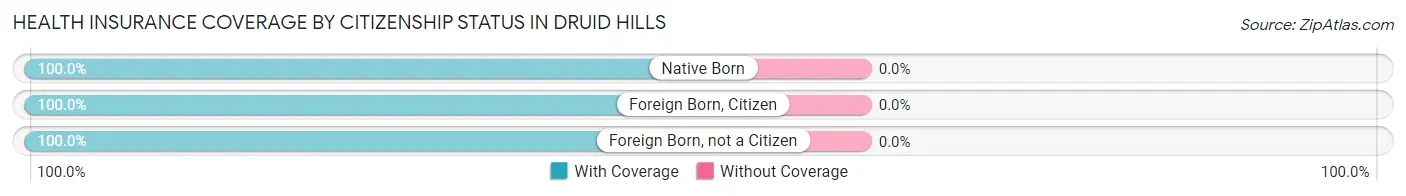
| Citizenship Status | With Coverage | Without Coverage |
| Native Born | 365 (100.0%) | 0 (0.0%) |
| Foreign Born, Citizen | 1,068 (100.0%) | 0 (0.0%) |
| Foreign Born, not a Citizen | 694 (100.0%) | 0 (0.0%) |
Health Insurance Coverage by Household Income in Druid Hills
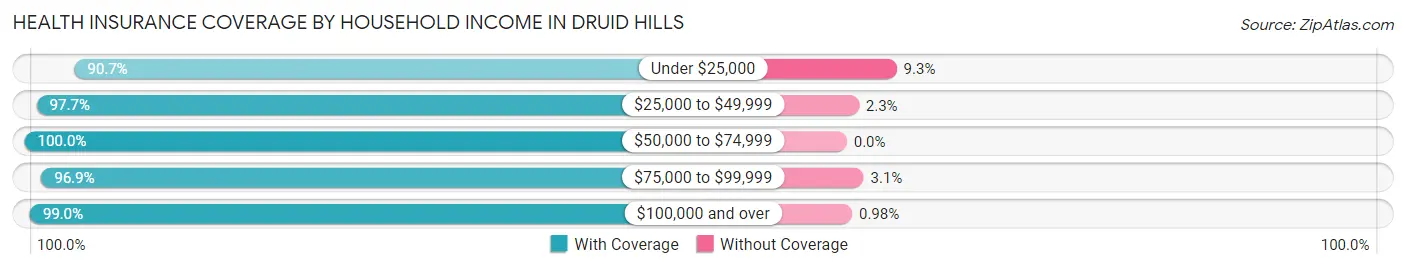
| Household Income | With Coverage | Without Coverage |
| Under $25,000 | 456 (90.7%) | 47 (9.3%) |
| $25,000 to $49,999 | 692 (97.7%) | 16 (2.3%) |
| $50,000 to $74,999 | 616 (100.0%) | 0 (0.0%) |
| $75,000 to $99,999 | 247 (96.9%) | 8 (3.1%) |
| $100,000 and over | 6,141 (99.0%) | 61 (1.0%) |
Public vs Private Health Insurance Coverage by Age in Druid Hills
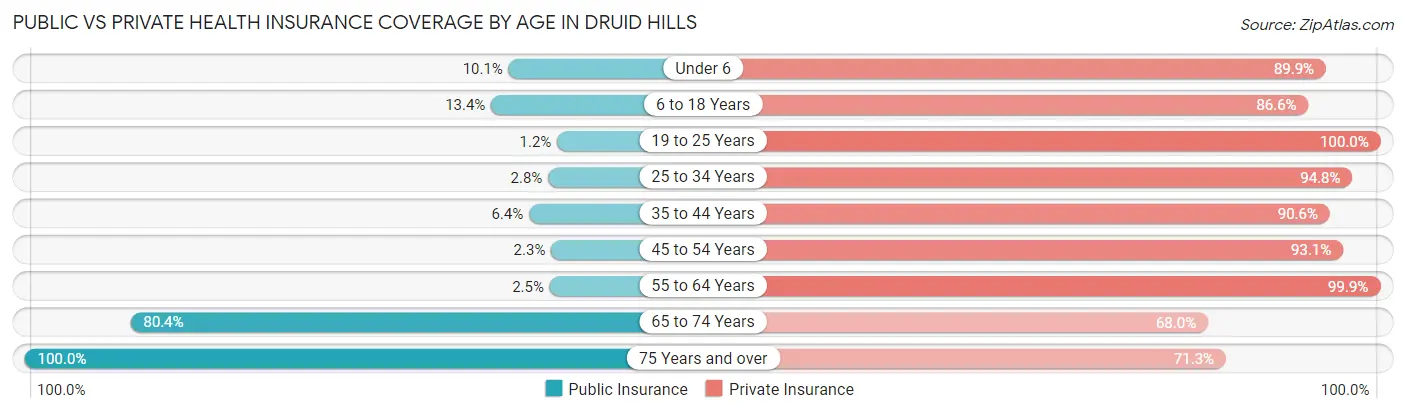
| Age Bracket | Public Insurance | Private Insurance |
| Under 6 | 37 (10.1%) | 328 (89.9%) |
| 6 to 18 Years | 143 (13.4%) | 925 (86.6%) |
| 19 to 25 Years | 8 (1.1%) | 694 (100.0%) |
| 25 to 34 Years | 44 (2.8%) | 1,482 (94.8%) |
| 35 to 44 Years | 64 (6.4%) | 912 (90.6%) |
| 45 to 54 Years | 22 (2.2%) | 911 (93.0%) |
| 55 to 64 Years | 33 (2.5%) | 1,314 (99.9%) |
| 65 to 74 Years | 622 (80.4%) | 526 (68.0%) |
| 75 Years and over | 519 (100.0%) | 370 (71.3%) |
| Total | 1,492 (18.0%) | 7,462 (90.1%) |
Disability Status by Sex by Age in Druid Hills
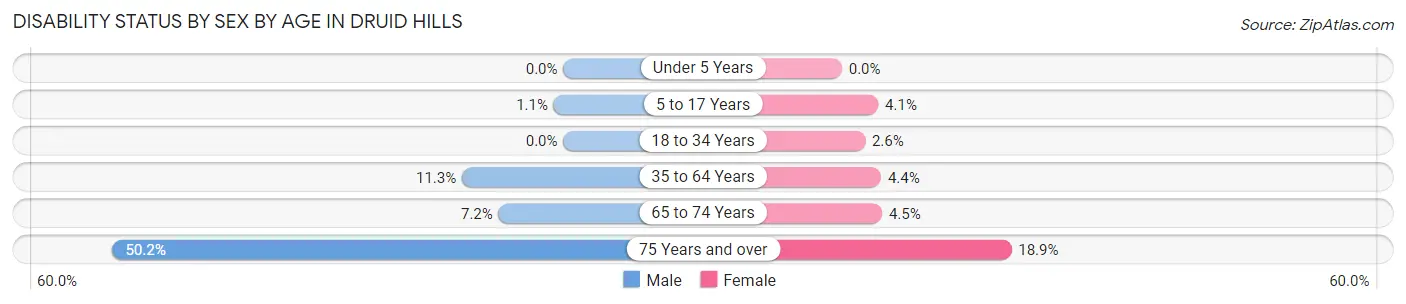
| Age Bracket | Male | Female |
| Under 5 Years | 0 (0.0%) | 0 (0.0%) |
| 5 to 17 Years | 7 (1.1%) | 17 (4.1%) |
| 18 to 34 Years | 0 (0.0%) | 35 (2.6%) |
| 35 to 64 Years | 191 (11.3%) | 70 (4.4%) |
| 65 to 74 Years | 30 (7.2%) | 16 (4.5%) |
| 75 Years and over | 117 (50.2%) | 54 (18.9%) |
Disability Class by Sex by Age in Druid Hills
Disability Class: Hearing Difficulty
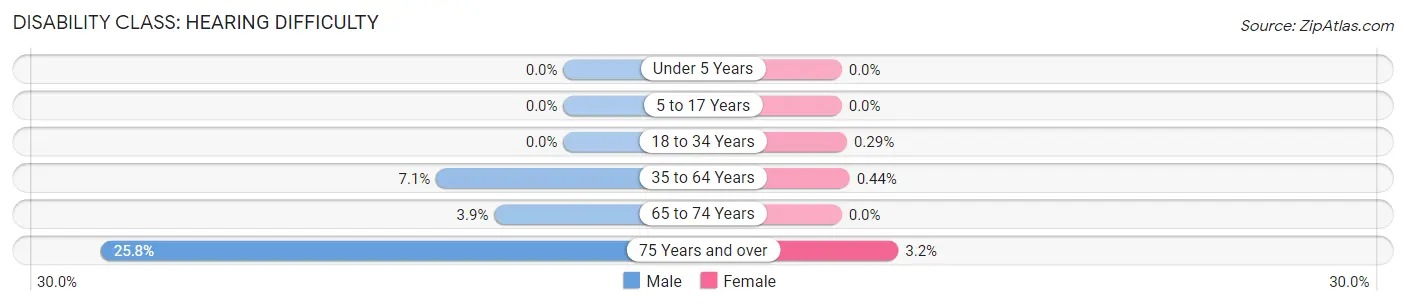
| Age Bracket | Male | Female |
| Under 5 Years | 0 (0.0%) | 0 (0.0%) |
| 5 to 17 Years | 0 (0.0%) | 0 (0.0%) |
| 18 to 34 Years | 0 (0.0%) | 4 (0.3%) |
| 35 to 64 Years | 120 (7.1%) | 7 (0.4%) |
| 65 to 74 Years | 16 (3.8%) | 0 (0.0%) |
| 75 Years and over | 60 (25.8%) | 9 (3.2%) |
Disability Class: Vision Difficulty
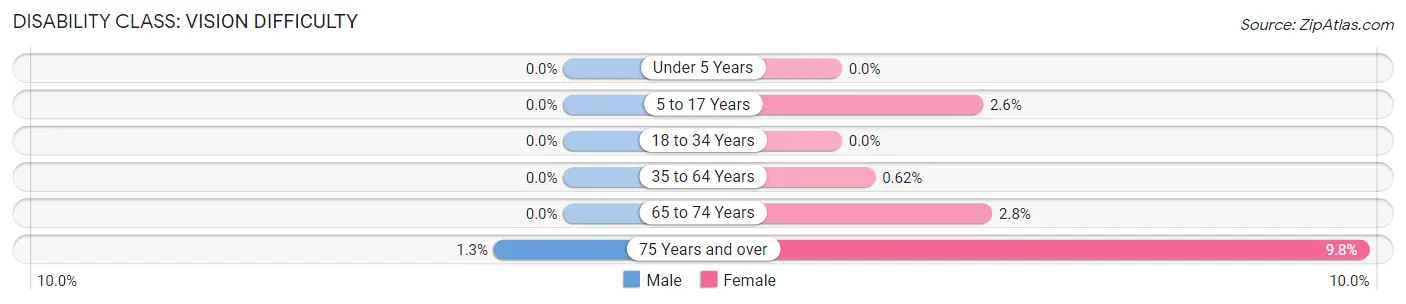
| Age Bracket | Male | Female |
| Under 5 Years | 0 (0.0%) | 0 (0.0%) |
| 5 to 17 Years | 0 (0.0%) | 11 (2.6%) |
| 18 to 34 Years | 0 (0.0%) | 0 (0.0%) |
| 35 to 64 Years | 0 (0.0%) | 10 (0.6%) |
| 65 to 74 Years | 0 (0.0%) | 10 (2.8%) |
| 75 Years and over | 3 (1.3%) | 28 (9.8%) |
Disability Class: Cognitive Difficulty
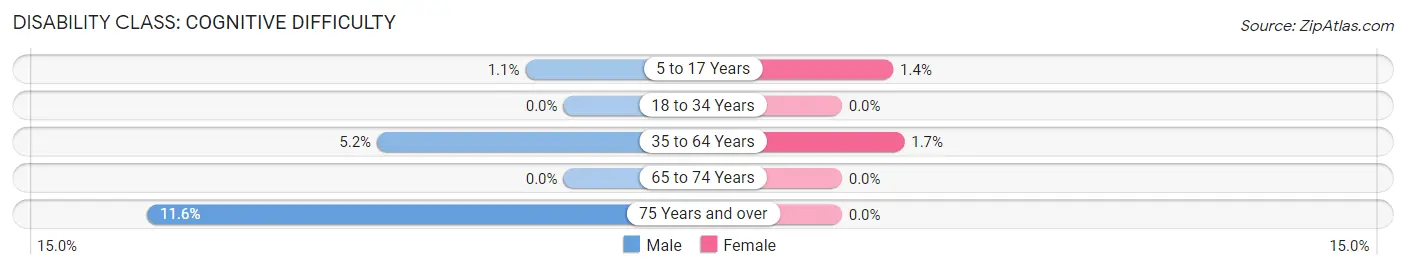
| Age Bracket | Male | Female |
| 5 to 17 Years | 7 (1.1%) | 6 (1.4%) |
| 18 to 34 Years | 0 (0.0%) | 0 (0.0%) |
| 35 to 64 Years | 88 (5.2%) | 28 (1.7%) |
| 65 to 74 Years | 0 (0.0%) | 0 (0.0%) |
| 75 Years and over | 27 (11.6%) | 0 (0.0%) |
Disability Class: Ambulatory Difficulty
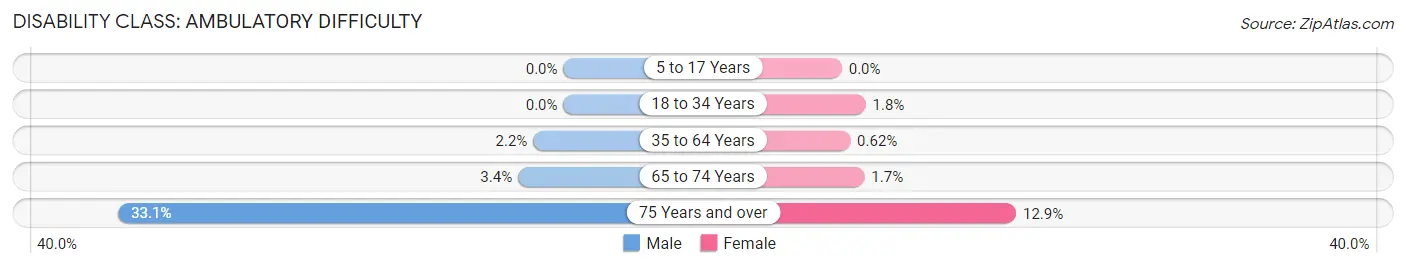
| Age Bracket | Male | Female |
| 5 to 17 Years | 0 (0.0%) | 0 (0.0%) |
| 18 to 34 Years | 0 (0.0%) | 24 (1.8%) |
| 35 to 64 Years | 38 (2.2%) | 10 (0.6%) |
| 65 to 74 Years | 14 (3.4%) | 6 (1.7%) |
| 75 Years and over | 77 (33.1%) | 37 (12.9%) |
Disability Class: Self-Care Difficulty
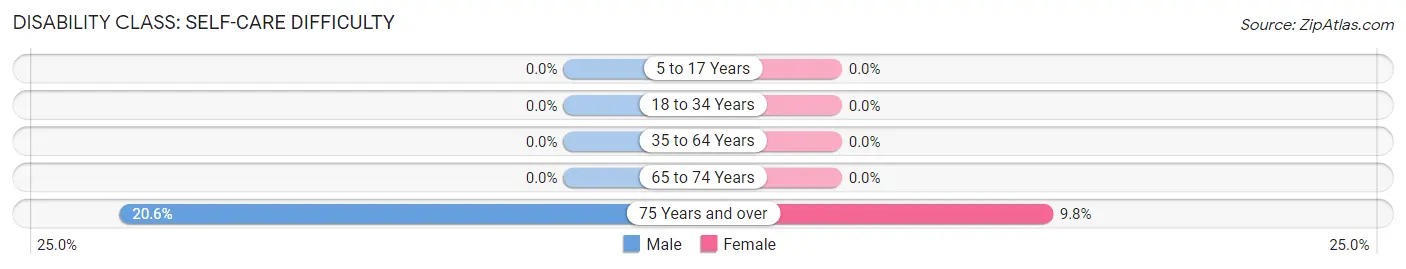
| Age Bracket | Male | Female |
| 5 to 17 Years | 0 (0.0%) | 0 (0.0%) |
| 18 to 34 Years | 0 (0.0%) | 0 (0.0%) |
| 35 to 64 Years | 0 (0.0%) | 0 (0.0%) |
| 65 to 74 Years | 0 (0.0%) | 0 (0.0%) |
| 75 Years and over | 48 (20.6%) | 28 (9.8%) |
Technology Access in Druid Hills
Computing Device Access in Druid Hills
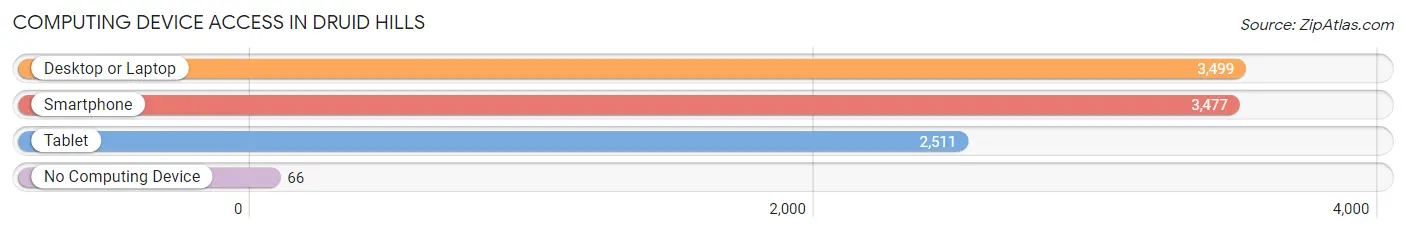
| Device Type | # Households | % Households |
| Desktop or Laptop | 3,499 | 95.5% |
| Smartphone | 3,477 | 94.9% |
| Tablet | 2,511 | 68.5% |
| No Computing Device | 66 | 1.8% |
| Total | 3,664 | 100.0% |
Internet Access in Druid Hills
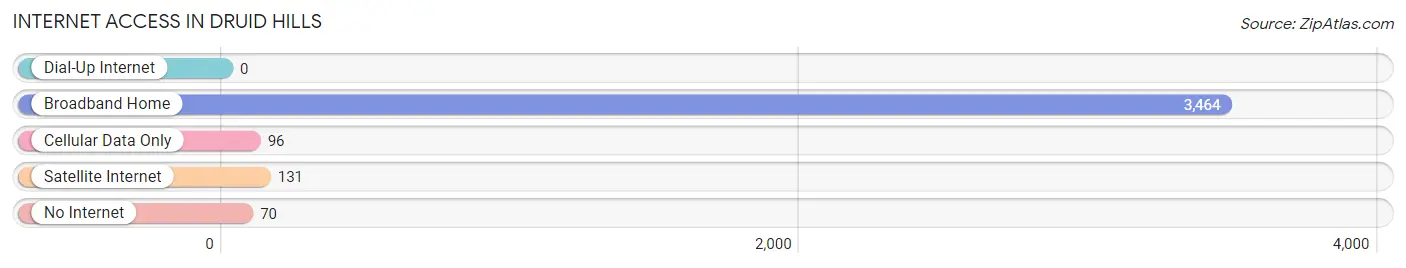
| Internet Type | # Households | % Households |
| Dial-Up Internet | 0 | 0.0% |
| Broadband Home | 3,464 | 94.5% |
| Cellular Data Only | 96 | 2.6% |
| Satellite Internet | 131 | 3.6% |
| No Internet | 70 | 1.9% |
| Total | 3,664 | 100.0% |
Druid Hills Summary
Druid Hills is a neighborhood located in the city of Atlanta, Georgia. It is situated in the northern part of the city, just east of the city of Decatur. The neighborhood is known for its historic homes, lush landscaping, and its proximity to Emory University and the Centers for Disease Control and Prevention (CDC).
History
Druid Hills was founded in the late 19th century by Asa Candler, the founder of the Coca-Cola Company. Candler purchased the land in the area and developed it into a planned community. He hired the Olmsted Brothers, a prominent landscape architecture firm, to design the neighborhood. The Olmsted Brothers designed Druid Hills to be a picturesque, suburban community with winding roads, large lots, and a variety of architectural styles.
The neighborhood was originally intended to be a retreat for Atlanta’s wealthy elite. However, over time, the neighborhood has become more diverse. Today, Druid Hills is home to a variety of people from different backgrounds and income levels.
Geography
Druid Hills is located in the northern part of the city of Atlanta, just east of the city of Decatur. The neighborhood is bordered by Ponce de Leon Avenue to the north, Briarcliff Road to the east, North Decatur Road to the south, and North Druid Hills Road to the west.
The neighborhood is situated on rolling hills and is known for its lush landscaping. The area is home to a variety of trees, including oak, magnolia, and dogwood. The neighborhood also features a variety of parks and green spaces, including the Olmsted Linear Park, which was designed by the Olmsted Brothers.
Economy
Druid Hills is home to a variety of businesses, including restaurants, retail stores, and professional services. The neighborhood is also home to Emory University, which is one of the largest employers in the area. The Centers for Disease Control and Prevention (CDC) is also located in Druid Hills.
The median household income in Druid Hills is $90,845, which is significantly higher than the median household income for the city of Atlanta ($50,936). The unemployment rate in Druid Hills is 3.2%, which is lower than the unemployment rate for the city of Atlanta (4.2%).
Demographics
As of the 2010 census, the population of Druid Hills was 8,719. The racial makeup of the neighborhood was 73.3% White, 15.2% African American, 0.2% Native American, 5.7% Asian, and 5.6% from other races. The median age in Druid Hills was 37.7 years.
The median home value in Druid Hills is $541,000, which is significantly higher than the median home value for the city of Atlanta ($179,000). The median rent in Druid Hills is $1,845, which is also higher than the median rent for the city of Atlanta ($1,072).
Conclusion
Druid Hills is a historic neighborhood located in the northern part of the city of Atlanta, Georgia. The neighborhood is known for its historic homes, lush landscaping, and its proximity to Emory University and the Centers for Disease Control and Prevention (CDC). The economy of Druid Hills is largely driven by Emory University and the CDC, and the median household income in the neighborhood is significantly higher than the median household income for the city of Atlanta. The population of Druid Hills is diverse, and the median home value and median rent in the neighborhood are both higher than the median home value and median rent for the city of Atlanta.
Common Questions
What is Per Capita Income in Druid Hills?
Per Capita income in Druid Hills is $91,846.
What is the Median Family Income in Druid Hills?
Median Family Income in Druid Hills is $237,852.
What is the Median Household income in Druid Hills?
Median Household Income in Druid Hills is $138,262.
What is Income or Wage Gap in Druid Hills?
Income or Wage Gap in Druid Hills is 31.6%.
Women in Druid Hills earn 68.4 cents for every dollar earned by a man.
What is Inequality or Gini Index in Druid Hills?
Inequality or Gini Index in Druid Hills is 0.51.
What is the Total Population of Druid Hills?
Total Population of Druid Hills is 8,467.
What is the Total Male Population of Druid Hills?
Total Male Population of Druid Hills is 4,172.
What is the Total Female Population of Druid Hills?
Total Female Population of Druid Hills is 4,295.
What is the Ratio of Males per 100 Females in Druid Hills?
There are 97.14 Males per 100 Females in Druid Hills.
What is the Ratio of Females per 100 Males in Druid Hills?
There are 102.95 Females per 100 Males in Druid Hills.
What is the Median Population Age in Druid Hills?
Median Population Age in Druid Hills is 40.3 Years.
What is the Average Family Size in Druid Hills
Average Family Size in Druid Hills is 2.9 People.
What is the Average Household Size in Druid Hills
Average Household Size in Druid Hills is 2.3 People.
How Large is the Labor Force in Druid Hills?
There are 4,482 People in the Labor Forcein in Druid Hills.
What is the Percentage of People in the Labor Force in Druid Hills?
62.5% of People are in the Labor Force in Druid Hills.
What is the Unemployment Rate in Druid Hills?
Unemployment Rate in Druid Hills is 3.3%.