Zip Codes with the Highest Percentage of Population Employed in Architecture & Engineering in Griffin, GA
RELATED REPORTS & OPTIONS
Architecture & Engineering
Griffin
Compare Zip Codes
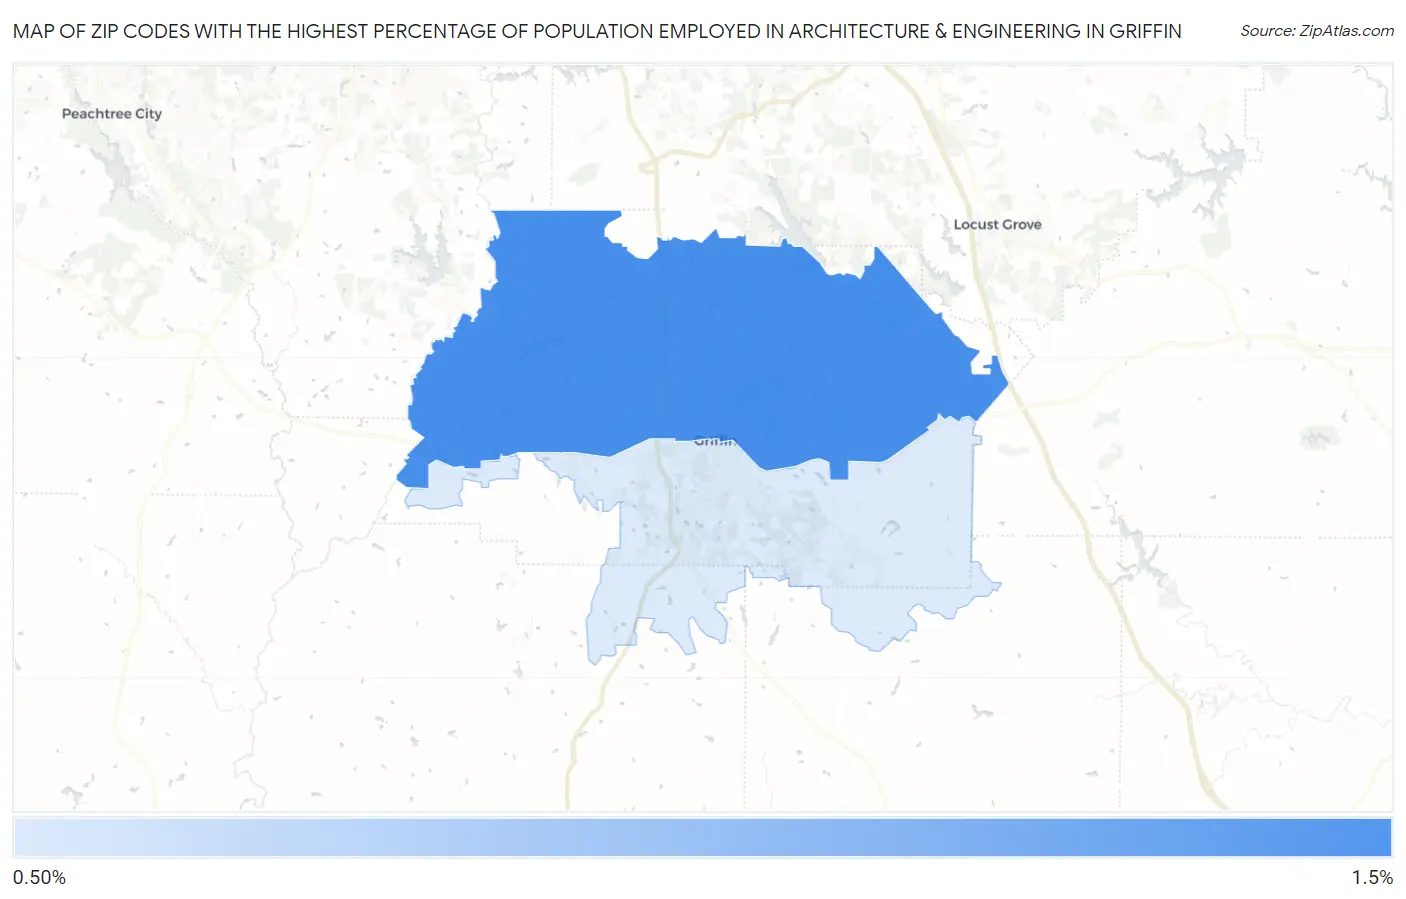
Map of Zip Codes with the Highest Percentage of Population Employed in Architecture & Engineering in Griffin
1.2%
1.2%
Zip Codes with the Highest Percentage of Population Employed in Architecture & Engineering in Griffin, GA
| Zip Code | % Employed | vs State | vs National | |
| 1. | 30223 | 1.2% | 1.8%(-0.559)#292 | 2.1%(-0.913)#14,786 |
| 2. | 30224 | 1.2% | 1.8%(-0.620)#309 | 2.1%(-0.974)#15,279 |
1
Common Questions
What are the Top Zip Codes with the Highest Percentage of Population Employed in Architecture & Engineering in Griffin, GA?
Top Zip Codes with the Highest Percentage of Population Employed in Architecture & Engineering in Griffin, GA are:
What zip code has the Highest Percentage of Population Employed in Architecture & Engineering in Griffin, GA?
30223 has the Highest Percentage of Population Employed in Architecture & Engineering in Griffin, GA with 1.2%.
What is the Percentage of Population Employed in Architecture & Engineering in Griffin, GA?
Percentage of Population Employed in Architecture & Engineering in Griffin is 1.3%.
What is the Percentage of Population Employed in Architecture & Engineering in Georgia?
Percentage of Population Employed in Architecture & Engineering in Georgia is 1.8%.
What is the Percentage of Population Employed in Architecture & Engineering in the United States?
Percentage of Population Employed in Architecture & Engineering in the United States is 2.1%.