Carrollton, GA Map & Demographics
Carrollton Map
Carrollton Overview
$30,143
PER CAPITA INCOME
$70,290
AVG FAMILY INCOME
$46,722
AVG HOUSEHOLD INCOME
41.5%
WAGE / INCOME GAP [ % ]
58.5¢/ $1
WAGE / INCOME GAP [ $ ]
$8,328
FAMILY INCOME DEFICIT
0.54
INEQUALITY / GINI INDEX
26,622
TOTAL POPULATION
12,171
MALE POPULATION
14,451
FEMALE POPULATION
84.22
MALES / 100 FEMALES
118.73
FEMALES / 100 MALES
27.5
MEDIAN AGE
2.9
AVG FAMILY SIZE
2.5
AVG HOUSEHOLD SIZE
13,473
LABOR FORCE [ PEOPLE ]
61.1%
PERCENT IN LABOR FORCE
5.8%
UNEMPLOYMENT RATE
Income in Carrollton
Income Overview in Carrollton
Per Capita Income in Carrollton is $30,143, while median incomes of families and households are $70,290 and $46,722 respectively.
| Characteristic | Number | Measure |
| Per Capita Income | 26,622 | $30,143 |
| Median Family Income | 5,887 | $70,290 |
| Mean Family Income | 5,887 | $99,411 |
| Median Household Income | 9,626 | $46,722 |
| Mean Household Income | 9,626 | $81,208 |
| Income Deficit | 5,887 | $8,328 |
| Wage / Income Gap (%) | 26,622 | 41.46% |
| Wage / Income Gap ($) | 26,622 | 58.54¢ per $1 |
| Gini / Inequality Index | 26,622 | 0.54 |
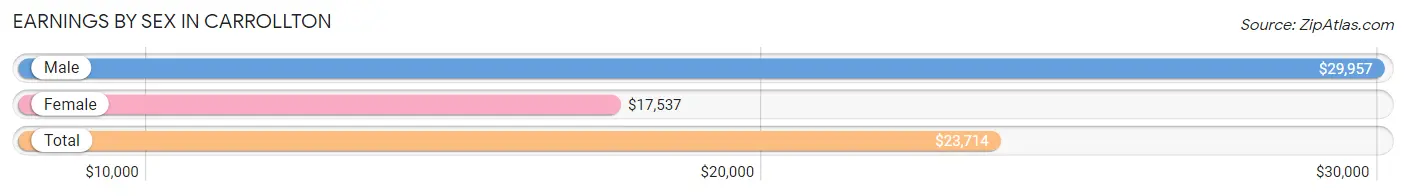
Earnings by Sex in Carrollton
Average Earnings in Carrollton are $23,714, $29,957 for men and $17,537 for women, a difference of 41.5%.
| Sex | Number | Average Earnings |
| Male | 7,403 (49.5%) | $29,957 |
| Female | 7,564 (50.5%) | $17,537 |
| Total | 14,967 (100.0%) | $23,714 |
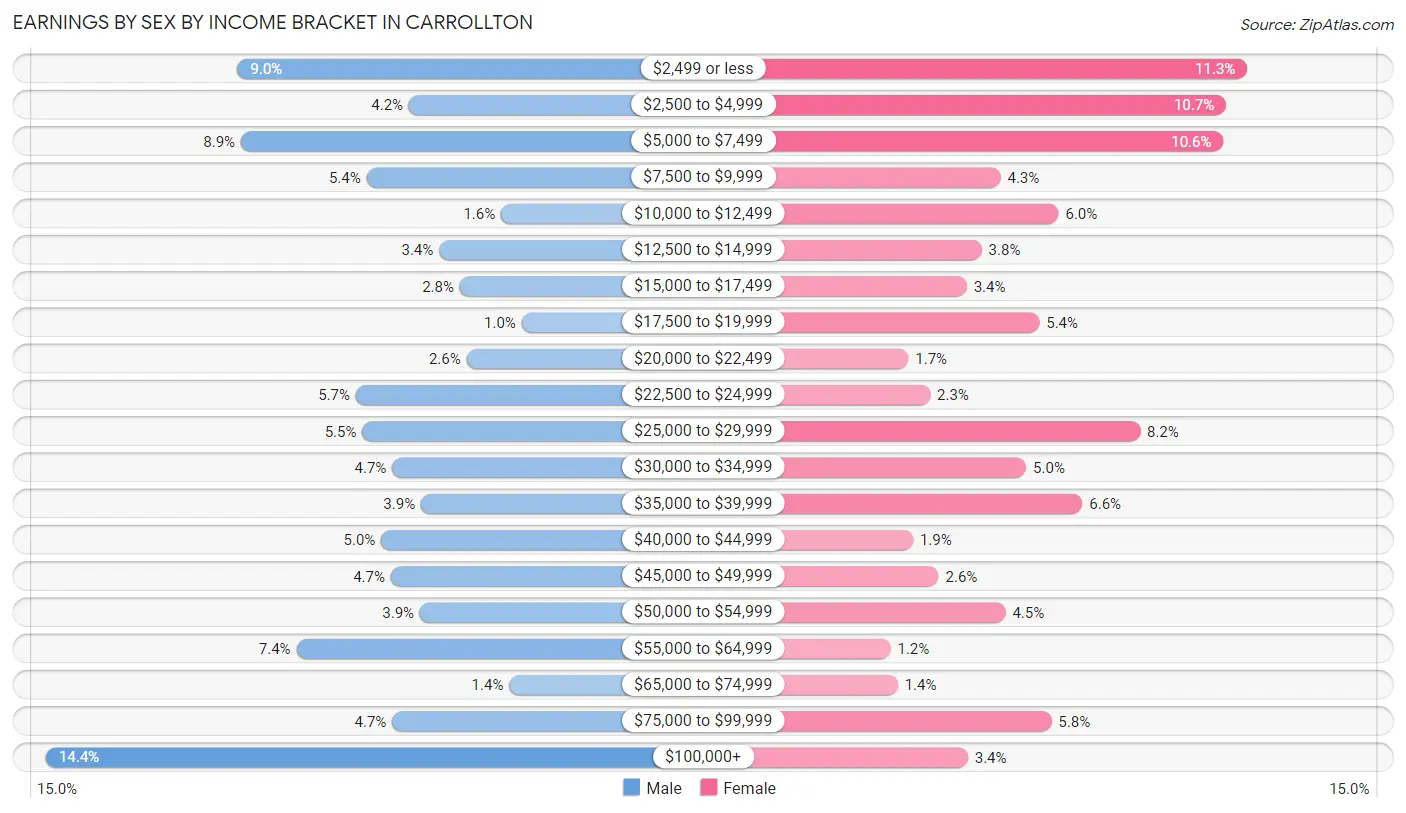
Earnings by Sex by Income Bracket in Carrollton
The most common earnings brackets in Carrollton are $100,000+ for men (1,066 | 14.4%) and $2,499 or less for women (851 | 11.3%).
| Income | Male | Female |
| $2,499 or less | 668 (9.0%) | 851 (11.3%) |
| $2,500 to $4,999 | 311 (4.2%) | 806 (10.7%) |
| $5,000 to $7,499 | 660 (8.9%) | 800 (10.6%) |
| $7,500 to $9,999 | 399 (5.4%) | 327 (4.3%) |
| $10,000 to $12,499 | 119 (1.6%) | 450 (5.9%) |
| $12,500 to $14,999 | 248 (3.4%) | 287 (3.8%) |
| $15,000 to $17,499 | 205 (2.8%) | 255 (3.4%) |
| $17,500 to $19,999 | 76 (1.0%) | 409 (5.4%) |
| $20,000 to $22,499 | 191 (2.6%) | 131 (1.7%) |
| $22,500 to $24,999 | 421 (5.7%) | 177 (2.3%) |
| $25,000 to $29,999 | 408 (5.5%) | 623 (8.2%) |
| $30,000 to $34,999 | 346 (4.7%) | 381 (5.0%) |
| $35,000 to $39,999 | 286 (3.9%) | 501 (6.6%) |
| $40,000 to $44,999 | 369 (5.0%) | 141 (1.9%) |
| $45,000 to $49,999 | 349 (4.7%) | 195 (2.6%) |
| $50,000 to $54,999 | 288 (3.9%) | 337 (4.5%) |
| $55,000 to $64,999 | 545 (7.4%) | 93 (1.2%) |
| $65,000 to $74,999 | 102 (1.4%) | 108 (1.4%) |
| $75,000 to $99,999 | 346 (4.7%) | 435 (5.8%) |
| $100,000+ | 1,066 (14.4%) | 257 (3.4%) |
| Total | 7,403 (100.0%) | 7,564 (100.0%) |
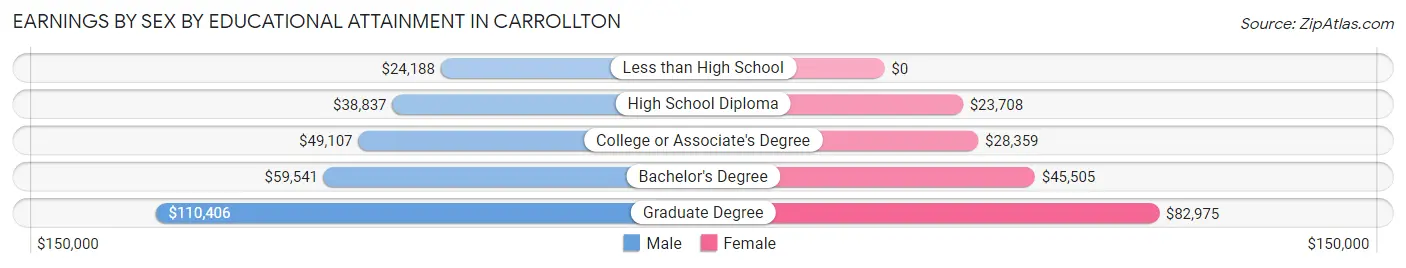
Earnings by Sex by Educational Attainment in Carrollton
Average earnings in Carrollton are $44,357 for men and $28,392 for women, a difference of 36.0%. Men with an educational attainment of graduate degree enjoy the highest average annual earnings of $110,406, while those with less than high school education earn the least with $24,188. Women with an educational attainment of graduate degree earn the most with the average annual earnings of $82,975, while those with high school diploma education have the smallest earnings of $23,708.
| Educational Attainment | Male Income | Female Income |
| Less than High School | $24,188 | $0 |
| High School Diploma | $38,837 | $23,708 |
| College or Associate's Degree | $49,107 | $28,359 |
| Bachelor's Degree | $59,541 | $45,505 |
| Graduate Degree | $110,406 | $82,975 |
| Total | $44,357 | $28,392 |
Family Income in Carrollton
Family Income Brackets in Carrollton
According to the Carrollton family income data, there are 1,030 families falling into the $100,000 to $149,999 income range, which is the most common income bracket and makes up 17.5% of all families. Conversely, the $10,000 to $14,999 income bracket is the least frequent group with only 265 families (4.5%) belonging to this category.
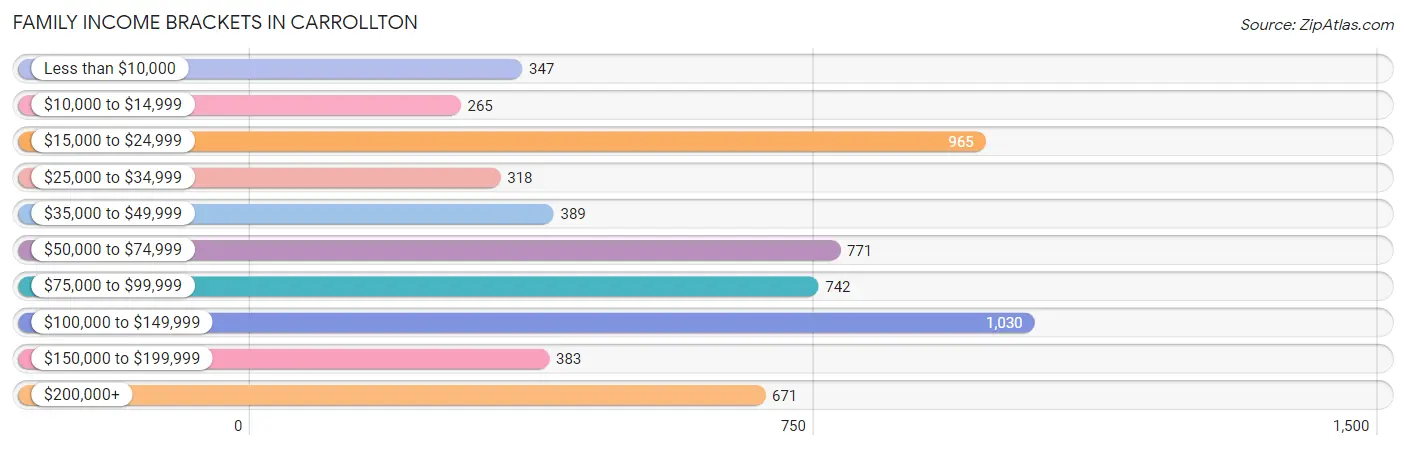
| Income Bracket | # Families | % Families |
| Less than $10,000 | 347 | 5.9% |
| $10,000 to $14,999 | 265 | 4.5% |
| $15,000 to $24,999 | 965 | 16.4% |
| $25,000 to $34,999 | 318 | 5.4% |
| $35,000 to $49,999 | 389 | 6.6% |
| $50,000 to $74,999 | 771 | 13.1% |
| $75,000 to $99,999 | 742 | 12.6% |
| $100,000 to $149,999 | 1,030 | 17.5% |
| $150,000 to $199,999 | 383 | 6.5% |
| $200,000+ | 671 | 11.4% |
Family Income by Famaliy Size in Carrollton
4-person families (867 | 14.7%) account for the highest median family income in Carrollton with $138,051 per family, while 4-person families (867 | 14.7%) have the highest median income of $34,513 per family member.
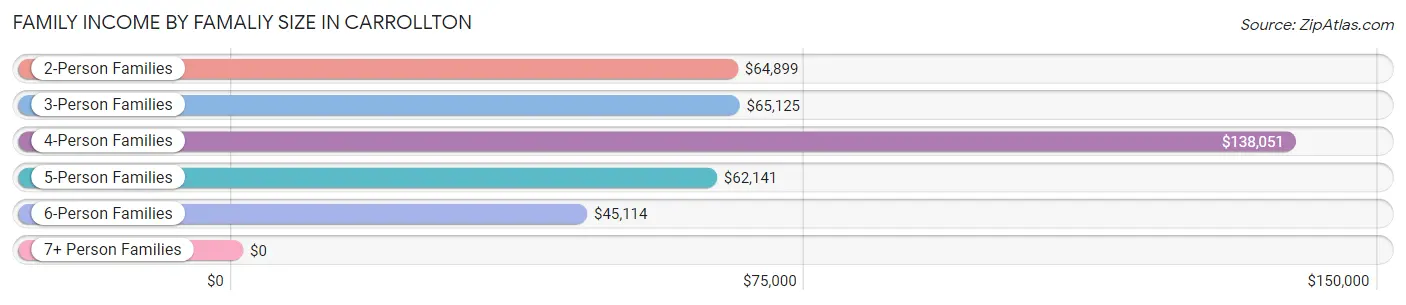
| Income Bracket | # Families | Median Income |
| 2-Person Families | 3,147 (53.5%) | $64,899 |
| 3-Person Families | 1,344 (22.8%) | $65,125 |
| 4-Person Families | 867 (14.7%) | $138,051 |
| 5-Person Families | 373 (6.3%) | $62,141 |
| 6-Person Families | 83 (1.4%) | $45,114 |
| 7+ Person Families | 73 (1.2%) | $0 |
| Total | 5,887 (100.0%) | $70,290 |
Family Income by Number of Earners in Carrollton
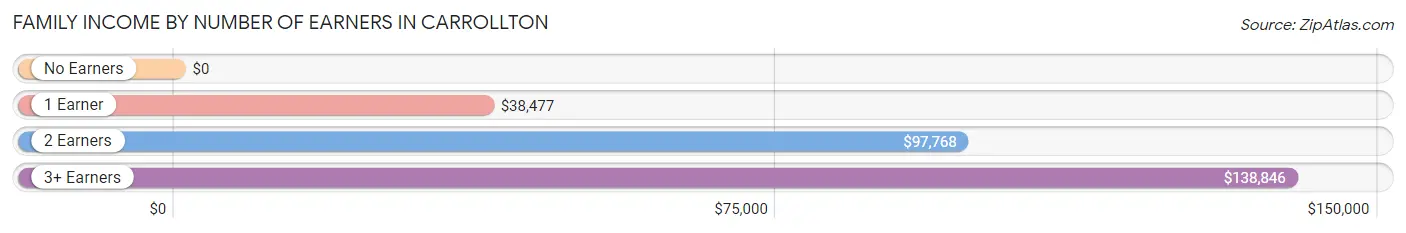
| Number of Earners | # Families | Median Income |
| No Earners | 1,098 (18.6%) | $0 |
| 1 Earner | 2,139 (36.3%) | $38,477 |
| 2 Earners | 2,137 (36.3%) | $97,768 |
| 3+ Earners | 513 (8.7%) | $138,846 |
| Total | 5,887 (100.0%) | $70,290 |
Household Income in Carrollton
Household Income Brackets in Carrollton
With 1,550 households falling in the category, the $15,000 to $24,999 income range is the most frequent in Carrollton, accounting for 16.1% of all households. In contrast, only 510 households (5.3%) fall into the $150,000 to $199,999 income bracket, making it the least populous group.
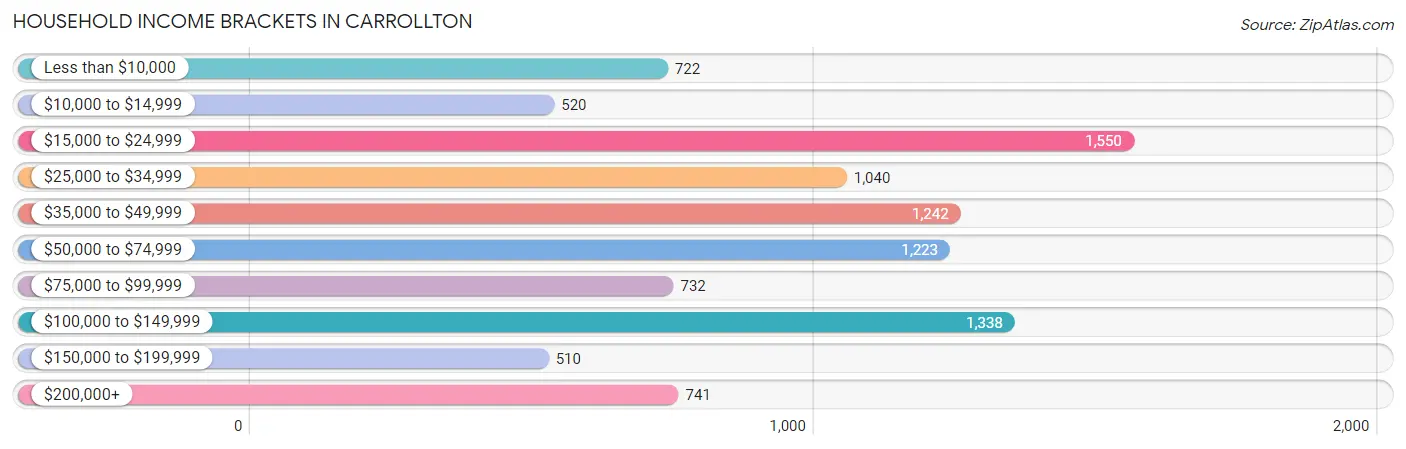
| Income Bracket | # Households | % Households |
| Less than $10,000 | 722 | 7.5% |
| $10,000 to $14,999 | 520 | 5.4% |
| $15,000 to $24,999 | 1,550 | 16.1% |
| $25,000 to $34,999 | 1,040 | 10.8% |
| $35,000 to $49,999 | 1,242 | 12.9% |
| $50,000 to $74,999 | 1,223 | 12.7% |
| $75,000 to $99,999 | 732 | 7.6% |
| $100,000 to $149,999 | 1,338 | 13.9% |
| $150,000 to $199,999 | 510 | 5.3% |
| $200,000+ | 741 | 7.7% |
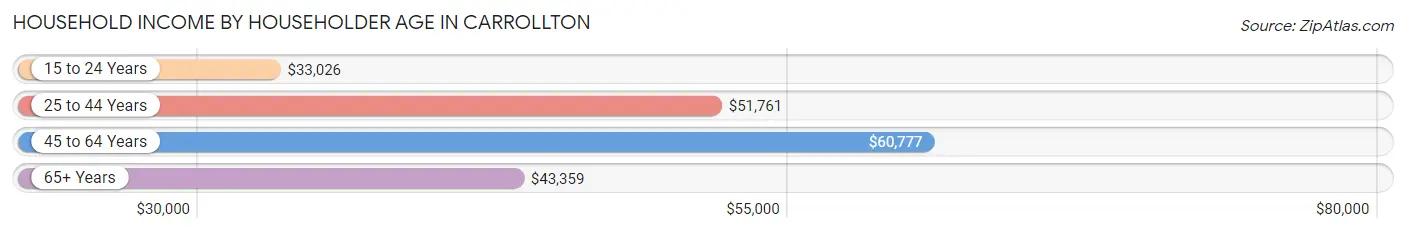
Household Income by Householder Age in Carrollton
The median household income in Carrollton is $46,722, with the highest median household income of $60,777 found in the 45 to 64 years age bracket for the primary householder. A total of 2,919 households (30.3%) fall into this category. Meanwhile, the 15 to 24 years age bracket for the primary householder has the lowest median household income of $33,026, with 1,271 households (13.2%) in this group.
| Income Bracket | # Households | Median Income |
| 15 to 24 Years | 1,271 (13.2%) | $33,026 |
| 25 to 44 Years | 3,324 (34.5%) | $51,761 |
| 45 to 64 Years | 2,919 (30.3%) | $60,777 |
| 65+ Years | 2,112 (21.9%) | $43,359 |
| Total | 9,626 (100.0%) | $46,722 |
Poverty in Carrollton
Income Below Poverty by Sex and Age in Carrollton
With 29.2% poverty level for males and 34.5% for females among the residents of Carrollton, under 5 year old males and 18 to 24 year old females are the most vulnerable to poverty, with 525 males (60.2%) and 1,573 females (61.3%) in their respective age groups living below the poverty level.
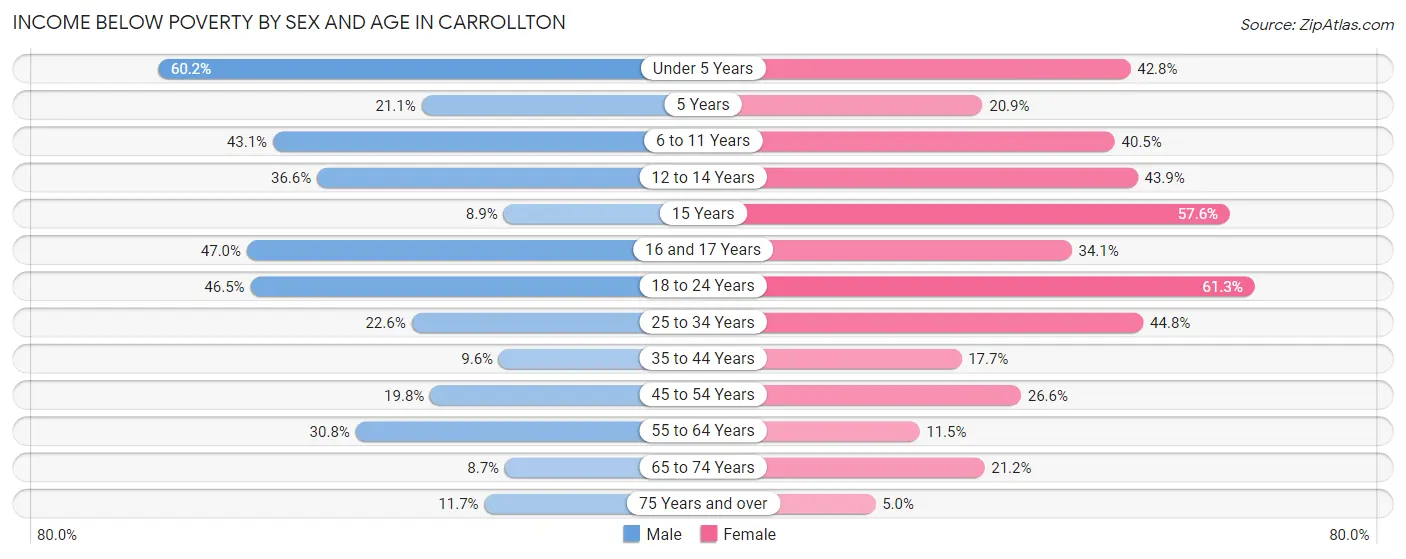
| Age Bracket | Male | Female |
| Under 5 Years | 525 (60.2%) | 398 (42.8%) |
| 5 Years | 52 (21.0%) | 29 (20.9%) |
| 6 to 11 Years | 245 (43.1%) | 410 (40.5%) |
| 12 to 14 Years | 124 (36.6%) | 137 (43.9%) |
| 15 Years | 8 (8.9%) | 34 (57.6%) |
| 16 and 17 Years | 94 (47.0%) | 130 (34.1%) |
| 18 to 24 Years | 882 (46.5%) | 1,573 (61.3%) |
| 25 to 34 Years | 451 (22.6%) | 797 (44.8%) |
| 35 to 44 Years | 109 (9.6%) | 293 (17.7%) |
| 45 to 54 Years | 273 (19.8%) | 340 (26.6%) |
| 55 to 64 Years | 214 (30.8%) | 133 (11.5%) |
| 65 to 74 Years | 67 (8.7%) | 245 (21.2%) |
| 75 Years and over | 47 (11.7%) | 38 (5.0%) |
| Total | 3,091 (29.2%) | 4,557 (34.5%) |
Income Above Poverty by Sex and Age in Carrollton
According to the poverty statistics in Carrollton, males aged 65 to 74 years and females aged 75 years and over are the age groups that are most secure financially, with 91.3% of males and 95.0% of females in these age groups living above the poverty line.
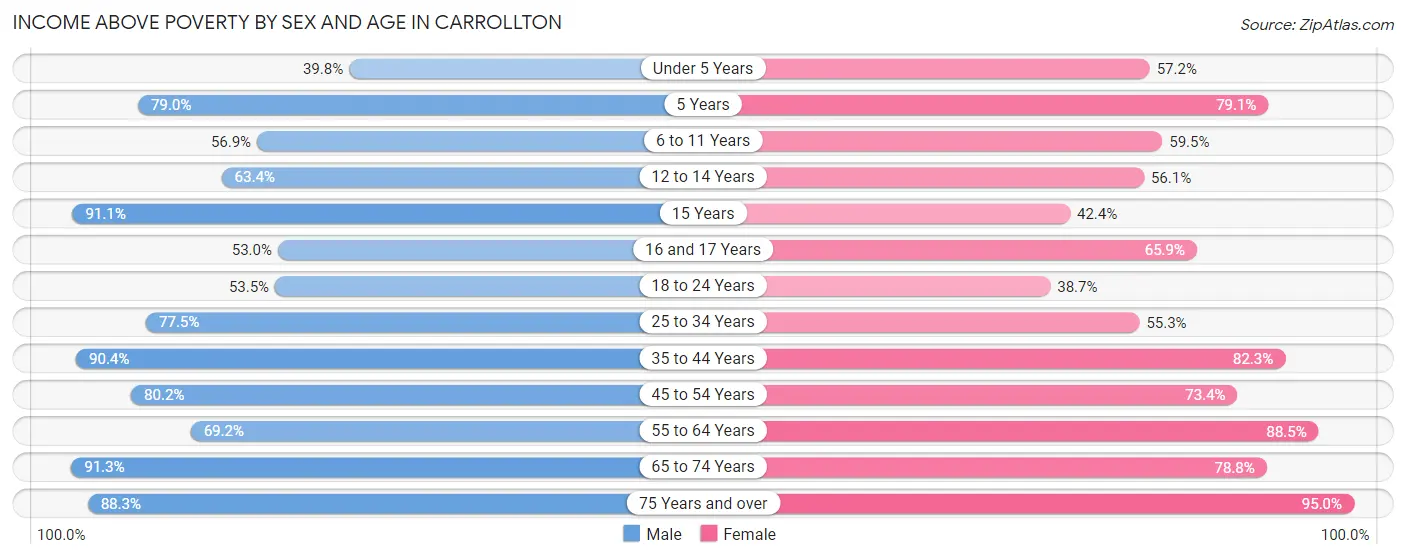
| Age Bracket | Male | Female |
| Under 5 Years | 347 (39.8%) | 531 (57.2%) |
| 5 Years | 195 (78.9%) | 110 (79.1%) |
| 6 to 11 Years | 323 (56.9%) | 602 (59.5%) |
| 12 to 14 Years | 215 (63.4%) | 175 (56.1%) |
| 15 Years | 82 (91.1%) | 25 (42.4%) |
| 16 and 17 Years | 106 (53.0%) | 251 (65.9%) |
| 18 to 24 Years | 1,016 (53.5%) | 993 (38.7%) |
| 25 to 34 Years | 1,549 (77.4%) | 984 (55.2%) |
| 35 to 44 Years | 1,030 (90.4%) | 1,360 (82.3%) |
| 45 to 54 Years | 1,107 (80.2%) | 939 (73.4%) |
| 55 to 64 Years | 480 (69.2%) | 1,023 (88.5%) |
| 65 to 74 Years | 706 (91.3%) | 913 (78.8%) |
| 75 Years and over | 354 (88.3%) | 728 (95.0%) |
| Total | 7,510 (70.8%) | 8,634 (65.4%) |
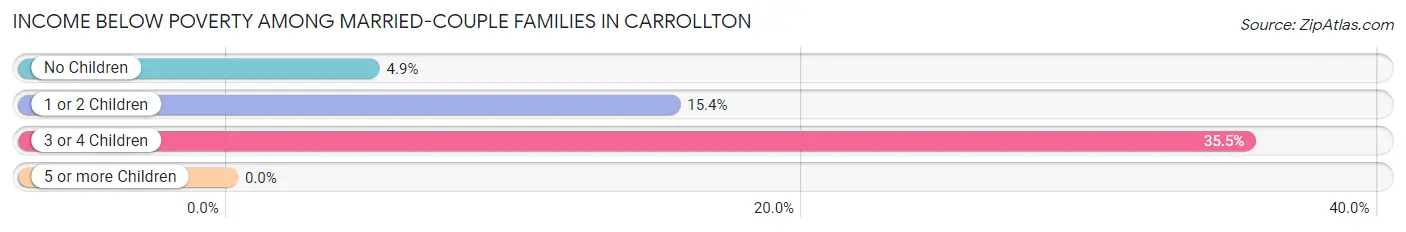
Income Below Poverty Among Married-Couple Families in Carrollton
The poverty statistics for married-couple families in Carrollton show that 10.4% or 371 of the total 3,578 families live below the poverty line. Families with 3 or 4 children have the highest poverty rate of 35.4%, comprising of 67 families. On the other hand, families with 5 or more children have the lowest poverty rate of 0.0%, which includes 0 families.
| Children | Above Poverty | Below Poverty |
| No Children | 1,930 (95.1%) | 100 (4.9%) |
| 1 or 2 Children | 1,121 (84.6%) | 204 (15.4%) |
| 3 or 4 Children | 122 (64.5%) | 67 (35.4%) |
| 5 or more Children | 34 (100.0%) | 0 (0.0%) |
| Total | 3,207 (89.6%) | 371 (10.4%) |
Income Below Poverty Among Single-Parent Households in Carrollton
According to the poverty data in Carrollton, 48.6% or 238 single-father households and 48.8% or 888 single-mother households are living below the poverty line. Among single-father households, those with no children have the highest poverty rate, with 212 households (68.4%) experiencing poverty. Likewise, among single-mother households, those with 5 or more children have the highest poverty rate, with 13 households (100.0%) falling below the poverty line.
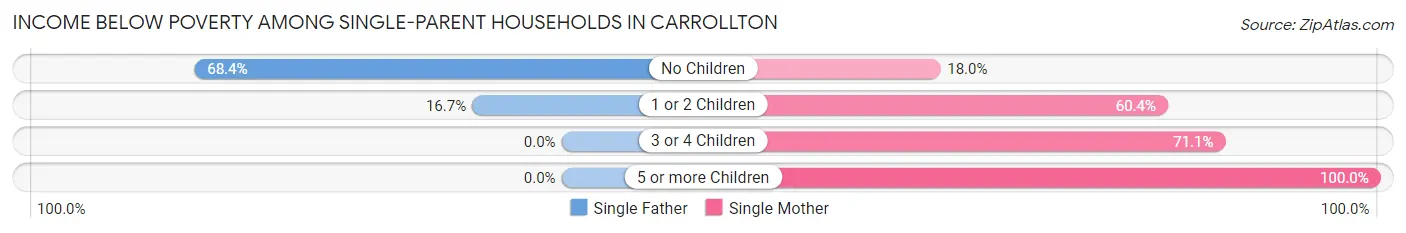
| Children | Single Father | Single Mother |
| No Children | 212 (68.4%) | 99 (18.0%) |
| 1 or 2 Children | 26 (16.7%) | 658 (60.4%) |
| 3 or 4 Children | 0 (0.0%) | 118 (71.1%) |
| 5 or more Children | 0 (0.0%) | 13 (100.0%) |
| Total | 238 (48.6%) | 888 (48.8%) |
Income Below Poverty Among Married-Couple vs Single-Parent Households in Carrollton
The poverty data for Carrollton shows that 371 of the married-couple family households (10.4%) and 1,126 of the single-parent households (48.8%) are living below the poverty level. Within the married-couple family households, those with 3 or 4 children have the highest poverty rate, with 67 households (35.4%) falling below the poverty line. Among the single-parent households, those with 5 or more children have the highest poverty rate, with 13 household (100.0%) living below poverty.
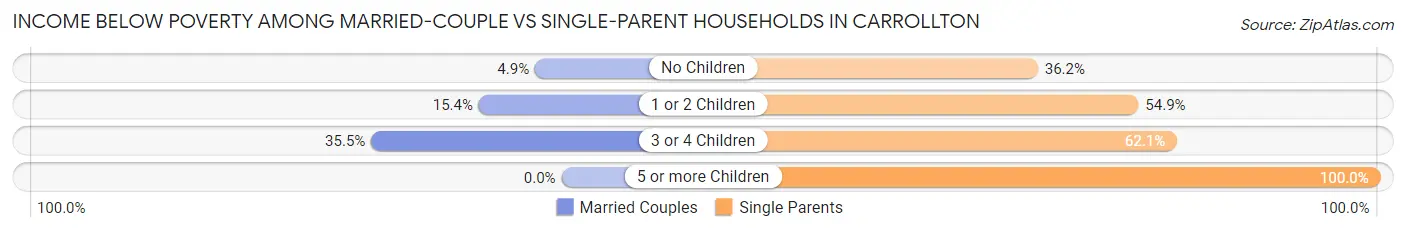
| Children | Married-Couple Families | Single-Parent Households |
| No Children | 100 (4.9%) | 311 (36.2%) |
| 1 or 2 Children | 204 (15.4%) | 684 (54.9%) |
| 3 or 4 Children | 67 (35.4%) | 118 (62.1%) |
| 5 or more Children | 0 (0.0%) | 13 (100.0%) |
| Total | 371 (10.4%) | 1,126 (48.8%) |
Race in Carrollton
The most populous races in Carrollton are White / Caucasian (14,031 | 52.7%), Black / African American (9,856 | 37.0%), and Hispanic or Latino (2,498 | 9.4%).
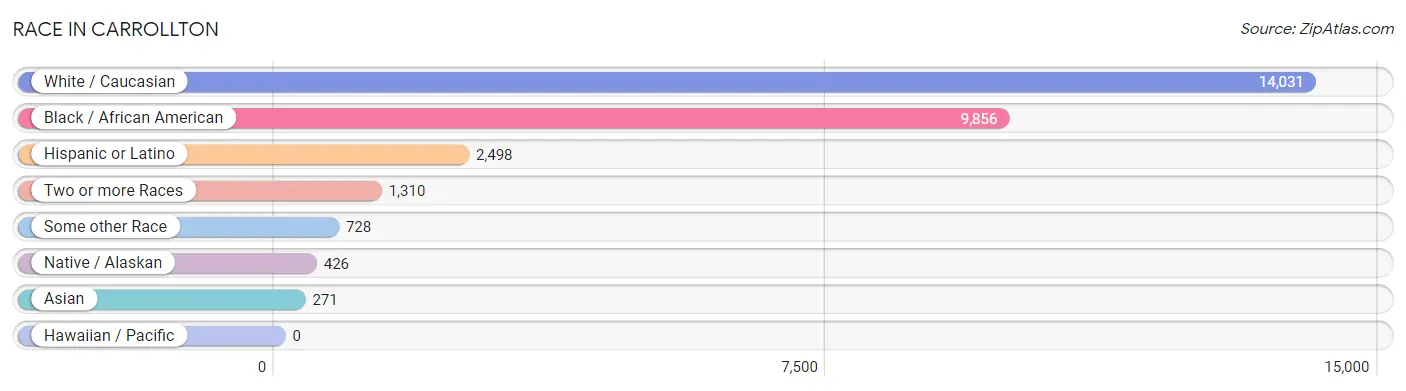
| Race | # Population | % Population |
| Asian | 271 | 1.0% |
| Black / African American | 9,856 | 37.0% |
| Hawaiian / Pacific | 0 | 0.0% |
| Hispanic or Latino | 2,498 | 9.4% |
| Native / Alaskan | 426 | 1.6% |
| White / Caucasian | 14,031 | 52.7% |
| Two or more Races | 1,310 | 4.9% |
| Some other Race | 728 | 2.7% |
| Total | 26,622 | 100.0% |
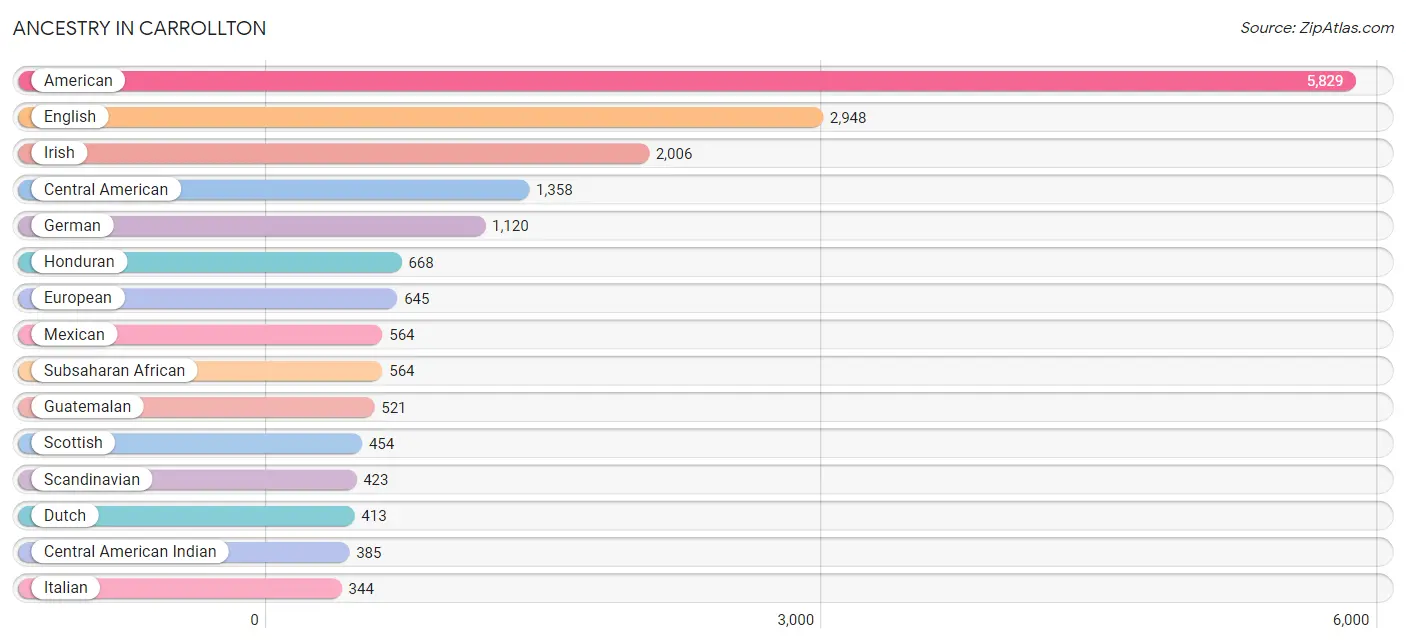
Ancestry in Carrollton
The most populous ancestries reported in Carrollton are American (5,829 | 21.9%), English (2,948 | 11.1%), Irish (2,006 | 7.5%), Central American (1,358 | 5.1%), and German (1,120 | 4.2%), together accounting for 49.8% of all Carrollton residents.
| Ancestry | # Population | % Population |
| African | 9 | 0.0% |
| American | 5,829 | 21.9% |
| Arab | 25 | 0.1% |
| Austrian | 27 | 0.1% |
| Bahamian | 6 | 0.0% |
| Bhutanese | 39 | 0.2% |
| Brazilian | 5 | 0.0% |
| British | 136 | 0.5% |
| Burmese | 25 | 0.1% |
| Cape Verdean | 5 | 0.0% |
| Celtic | 4 | 0.0% |
| Central American | 1,358 | 5.1% |
| Central American Indian | 385 | 1.5% |
| Cherokee | 70 | 0.3% |
| Colombian | 16 | 0.1% |
| Cuban | 69 | 0.3% |
| Czech | 23 | 0.1% |
| Dominican | 37 | 0.1% |
| Dutch | 413 | 1.5% |
| Eastern European | 34 | 0.1% |
| English | 2,948 | 11.1% |
| Ethiopian | 15 | 0.1% |
| European | 645 | 2.4% |
| Filipino | 1 | 0.0% |
| French | 264 | 1.0% |
| French Canadian | 7 | 0.0% |
| German | 1,120 | 4.2% |
| Ghanaian | 73 | 0.3% |
| Guatemalan | 521 | 2.0% |
| Haitian | 73 | 0.3% |
| Honduran | 668 | 2.5% |
| Indian (Asian) | 24 | 0.1% |
| Iranian | 8 | 0.0% |
| Irish | 2,006 | 7.5% |
| Italian | 344 | 1.3% |
| Jamaican | 17 | 0.1% |
| Kenyan | 24 | 0.1% |
| Korean | 65 | 0.2% |
| Laotian | 29 | 0.1% |
| Lebanese | 25 | 0.1% |
| Liberian | 53 | 0.2% |
| Mexican | 564 | 2.1% |
| Native Hawaiian | 46 | 0.2% |
| Navajo | 5 | 0.0% |
| Nicaraguan | 153 | 0.6% |
| Nigerian | 144 | 0.5% |
| Norwegian | 108 | 0.4% |
| Pakistani | 49 | 0.2% |
| Polish | 196 | 0.7% |
| Portuguese | 54 | 0.2% |
| Puerto Rican | 157 | 0.6% |
| Russian | 116 | 0.4% |
| Salvadoran | 16 | 0.1% |
| Scandinavian | 423 | 1.6% |
| Scotch-Irish | 262 | 1.0% |
| Scottish | 454 | 1.7% |
| Sierra Leonean | 11 | 0.0% |
| Slovak | 89 | 0.3% |
| South American | 141 | 0.5% |
| Spanish | 9 | 0.0% |
| Sri Lankan | 45 | 0.2% |
| Subsaharan African | 564 | 2.1% |
| Swedish | 132 | 0.5% |
| Swiss | 6 | 0.0% |
| Thai | 160 | 0.6% |
| Trinidadian and Tobagonian | 13 | 0.1% |
| Ukrainian | 17 | 0.1% |
| Venezuelan | 125 | 0.5% |
| Welsh | 81 | 0.3% |
| West Indian | 42 | 0.2% | View All 70 Rows |
Immigrants in Carrollton
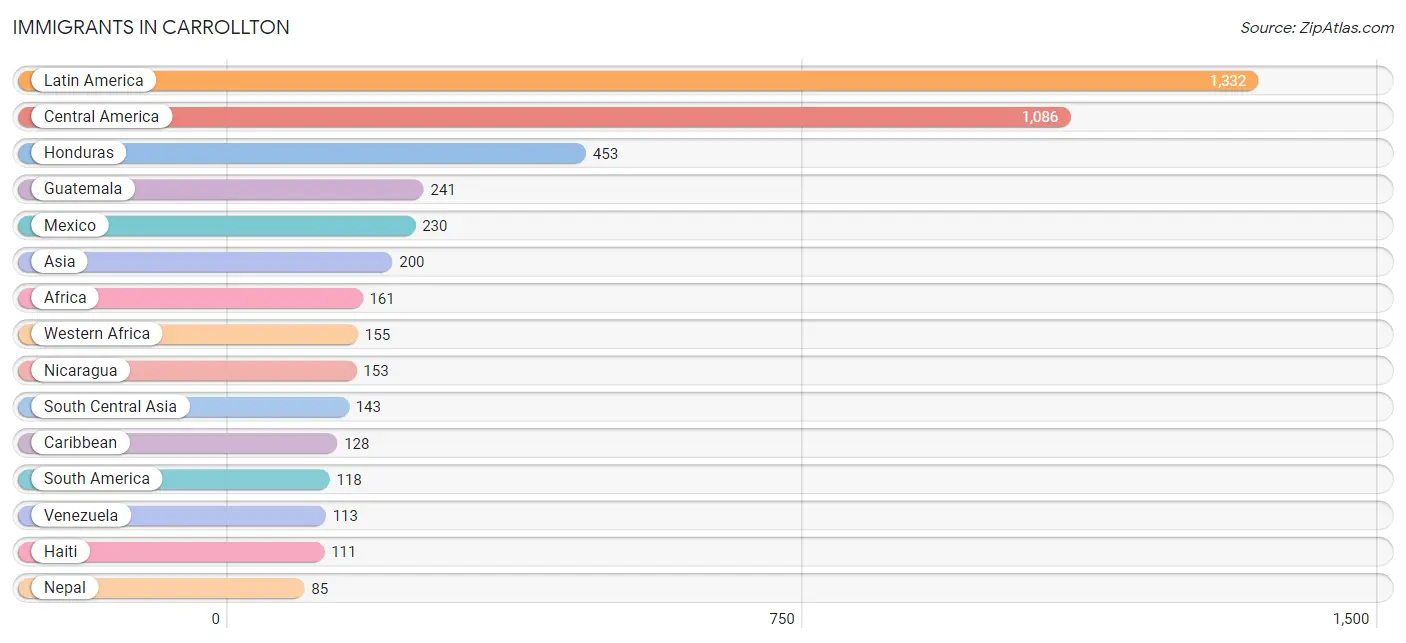
The most numerous immigrant groups reported in Carrollton came from Latin America (1,332 | 5.0%), Central America (1,086 | 4.1%), Honduras (453 | 1.7%), Guatemala (241 | 0.9%), and Mexico (230 | 0.9%), together accounting for 12.6% of all Carrollton residents.
| Immigration Origin | # Population | % Population |
| Africa | 161 | 0.6% |
| Asia | 200 | 0.7% |
| Brazil | 5 | 0.0% |
| Cameroon | 3 | 0.0% |
| Caribbean | 128 | 0.5% |
| Central America | 1,086 | 4.1% |
| China | 12 | 0.1% |
| Cuba | 6 | 0.0% |
| Eastern Africa | 3 | 0.0% |
| Eastern Asia | 12 | 0.1% |
| Eastern Europe | 9 | 0.0% |
| El Salvador | 9 | 0.0% |
| Europe | 15 | 0.1% |
| Ghana | 49 | 0.2% |
| Guatemala | 241 | 0.9% |
| Haiti | 111 | 0.4% |
| Honduras | 453 | 1.7% |
| India | 58 | 0.2% |
| Jamaica | 5 | 0.0% |
| Kenya | 3 | 0.0% |
| Latin America | 1,332 | 5.0% |
| Mexico | 230 | 0.9% |
| Middle Africa | 3 | 0.0% |
| Nepal | 85 | 0.3% |
| Nicaragua | 153 | 0.6% |
| Northern Europe | 6 | 0.0% |
| Russia | 9 | 0.0% |
| South America | 118 | 0.4% |
| South Central Asia | 143 | 0.5% |
| South Eastern Asia | 45 | 0.2% |
| Taiwan | 1 | 0.0% |
| Trinidad and Tobago | 6 | 0.0% |
| Venezuela | 113 | 0.4% |
| Vietnam | 45 | 0.2% |
| Western Africa | 155 | 0.6% | View All 35 Rows |
Sex and Age in Carrollton
Sex and Age in Carrollton
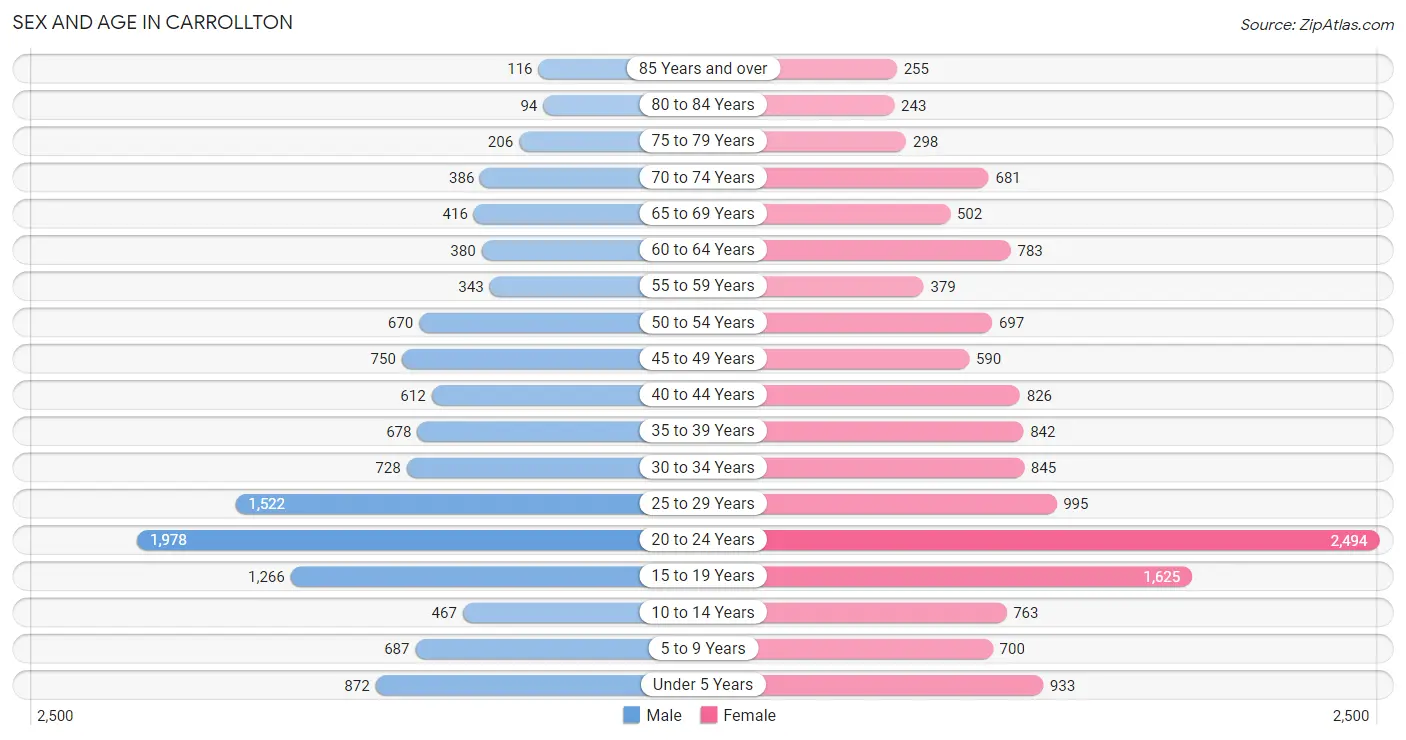
The most populous age groups in Carrollton are 20 to 24 Years (1,978 | 16.3%) for men and 20 to 24 Years (2,494 | 17.3%) for women.
| Age Bracket | Male | Female |
| Under 5 Years | 872 (7.2%) | 933 (6.5%) |
| 5 to 9 Years | 687 (5.6%) | 700 (4.8%) |
| 10 to 14 Years | 467 (3.8%) | 763 (5.3%) |
| 15 to 19 Years | 1,266 (10.4%) | 1,625 (11.2%) |
| 20 to 24 Years | 1,978 (16.3%) | 2,494 (17.3%) |
| 25 to 29 Years | 1,522 (12.5%) | 995 (6.9%) |
| 30 to 34 Years | 728 (6.0%) | 845 (5.9%) |
| 35 to 39 Years | 678 (5.6%) | 842 (5.8%) |
| 40 to 44 Years | 612 (5.0%) | 826 (5.7%) |
| 45 to 49 Years | 750 (6.2%) | 590 (4.1%) |
| 50 to 54 Years | 670 (5.5%) | 697 (4.8%) |
| 55 to 59 Years | 343 (2.8%) | 379 (2.6%) |
| 60 to 64 Years | 380 (3.1%) | 783 (5.4%) |
| 65 to 69 Years | 416 (3.4%) | 502 (3.5%) |
| 70 to 74 Years | 386 (3.2%) | 681 (4.7%) |
| 75 to 79 Years | 206 (1.7%) | 298 (2.1%) |
| 80 to 84 Years | 94 (0.8%) | 243 (1.7%) |
| 85 Years and over | 116 (0.9%) | 255 (1.8%) |
| Total | 12,171 (100.0%) | 14,451 (100.0%) |
Families and Households in Carrollton
Median Family Size in Carrollton
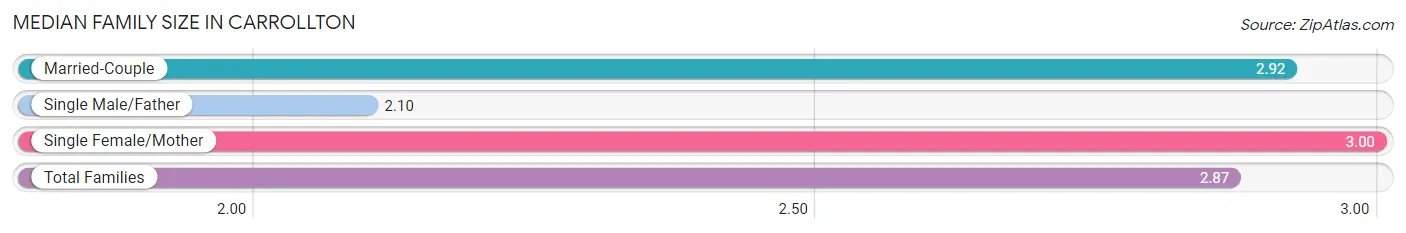
The median family size in Carrollton is 2.87 persons per family, with single female/mother families (1,819 | 30.9%) accounting for the largest median family size of 3 persons per family. On the other hand, single male/father families (490 | 8.3%) represent the smallest median family size with 2.10 persons per family.
| Family Type | # Families | Family Size |
| Married-Couple | 3,578 (60.8%) | 2.92 |
| Single Male/Father | 490 (8.3%) | 2.10 |
| Single Female/Mother | 1,819 (30.9%) | 3.00 |
| Total Families | 5,887 (100.0%) | 2.87 |
Median Household Size in Carrollton
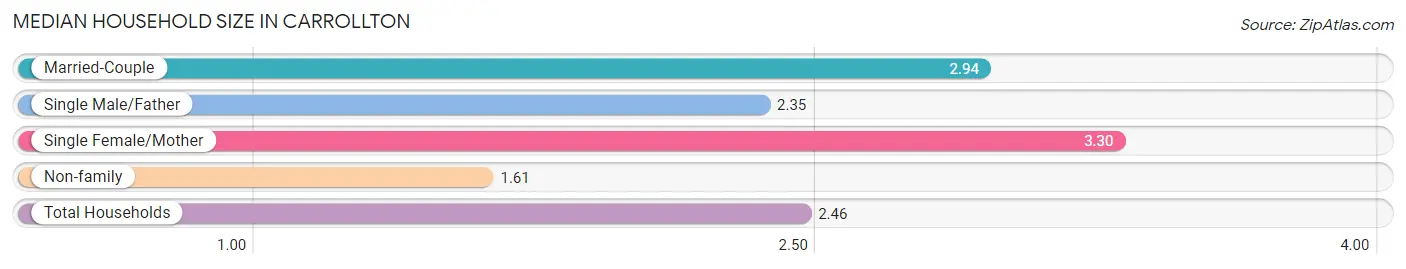
The median household size in Carrollton is 2.46 persons per household, with single female/mother households (1,819 | 18.9%) accounting for the largest median household size of 3.3 persons per household. non-family households (3,739 | 38.8%) represent the smallest median household size with 1.61 persons per household.
| Household Type | # Households | Household Size |
| Married-Couple | 3,578 (37.2%) | 2.94 |
| Single Male/Father | 490 (5.1%) | 2.35 |
| Single Female/Mother | 1,819 (18.9%) | 3.30 |
| Non-family | 3,739 (38.8%) | 1.61 |
| Total Households | 9,626 (100.0%) | 2.46 |
Household Size by Marriage Status in Carrollton
Out of a total of 9,626 households in Carrollton, 5,887 (61.2%) are family households, while 3,739 (38.8%) are nonfamily households. The most numerous type of family households are 2-person households, comprising 2,783, and the most common type of nonfamily households are 1-person households, comprising 2,659.
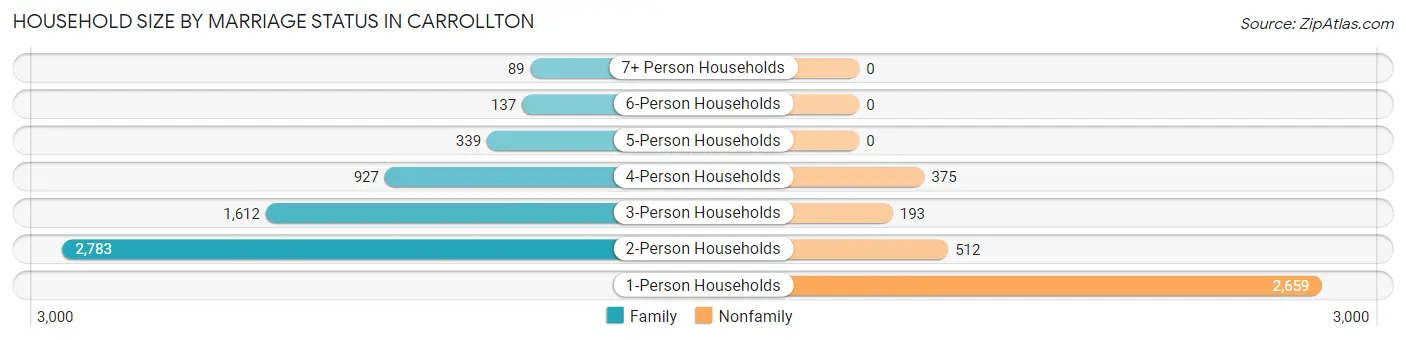
| Household Size | Family Households | Nonfamily Households |
| 1-Person Households | - | 2,659 (27.6%) |
| 2-Person Households | 2,783 (28.9%) | 512 (5.3%) |
| 3-Person Households | 1,612 (16.8%) | 193 (2.0%) |
| 4-Person Households | 927 (9.6%) | 375 (3.9%) |
| 5-Person Households | 339 (3.5%) | 0 (0.0%) |
| 6-Person Households | 137 (1.4%) | 0 (0.0%) |
| 7+ Person Households | 89 (0.9%) | 0 (0.0%) |
| Total | 5,887 (61.2%) | 3,739 (38.8%) |
Female Fertility in Carrollton
Fertility by Age in Carrollton
Average fertility rate in Carrollton is 52.0 births per 1,000 women. Women in the age bracket of 20 to 34 years have the highest fertility rate with 90.0 births per 1,000 women. Women in the age bracket of 20 to 34 years acount for 89.3% of all women with births.
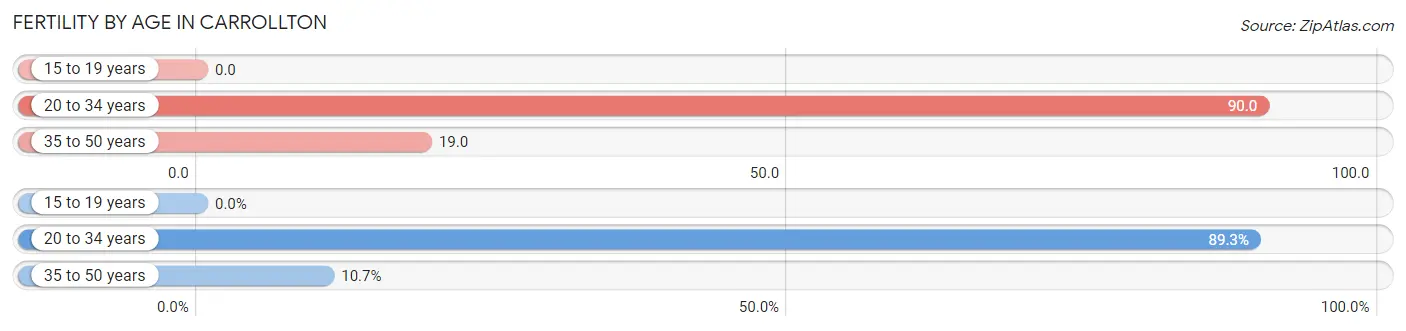
| Age Bracket | Women with Births | Births / 1,000 Women |
| 15 to 19 years | 0 (0.0%) | 0.0 |
| 20 to 34 years | 392 (89.3%) | 90.0 |
| 35 to 50 years | 47 (10.7%) | 19.0 |
| Total | 439 (100.0%) | 52.0 |
Fertility by Age by Marriage Status in Carrollton
32.1% of women with births (439) in Carrollton are married. The highest percentage of unmarried women with births falls into 20 to 34 years age bracket with 70.2% of them unmarried at the time of birth, while the lowest percentage of unmarried women with births belong to 35 to 50 years age bracket with 48.9% of them unmarried.
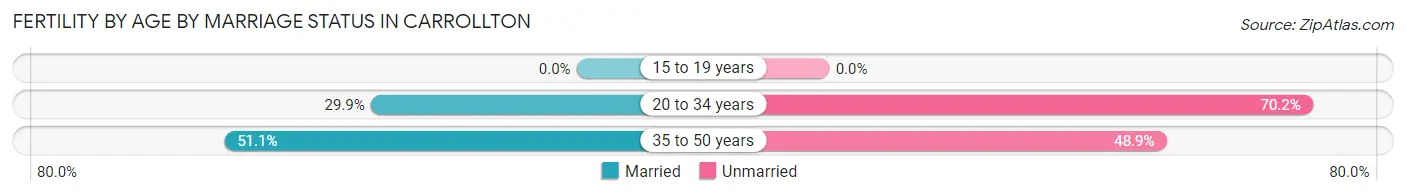
| Age Bracket | Married | Unmarried |
| 15 to 19 years | 0 (0.0%) | 0 (0.0%) |
| 20 to 34 years | 117 (29.8%) | 275 (70.2%) |
| 35 to 50 years | 24 (51.1%) | 23 (48.9%) |
| Total | 141 (32.1%) | 298 (67.9%) |
Fertility by Education in Carrollton
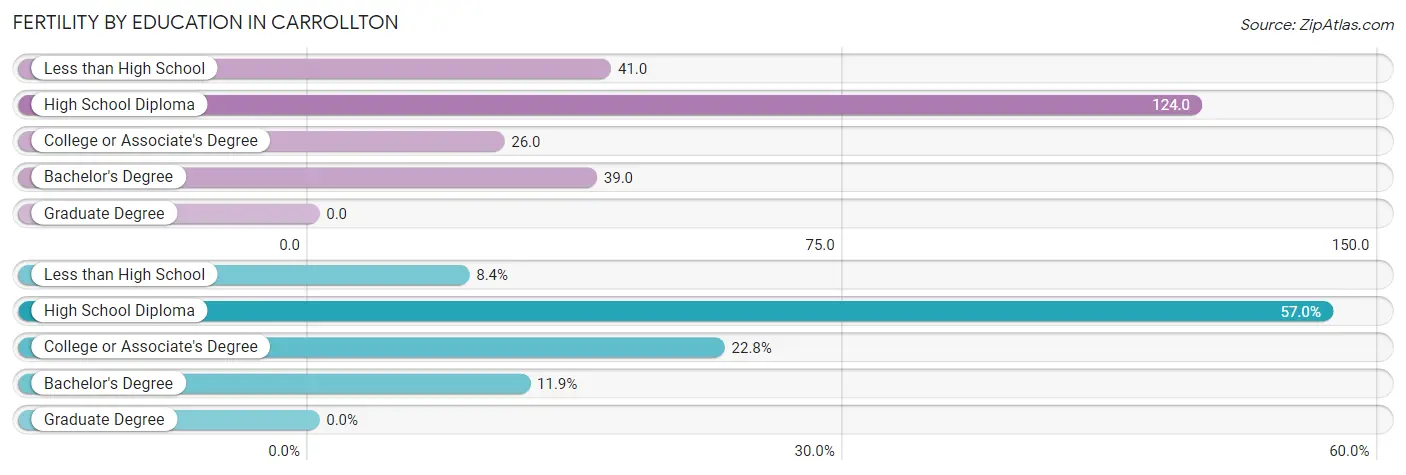
| Educational Attainment | Women with Births | Births / 1,000 Women |
| Less than High School | 37 (8.4%) | 41.0 |
| High School Diploma | 250 (57.0%) | 124.0 |
| College or Associate's Degree | 100 (22.8%) | 26.0 |
| Bachelor's Degree | 52 (11.8%) | 39.0 |
| Graduate Degree | 0 (0.0%) | 0.0 |
| Total | 439 (100.0%) | 52.0 |
Fertility by Education by Marriage Status in Carrollton
67.9% of women with births in Carrollton are unmarried. Women with the educational attainment of less than high school are most likely to be married with 100.0% of them married at childbirth, while women with the educational attainment of high school diploma are least likely to be married with 86.4% of them unmarried at childbirth.
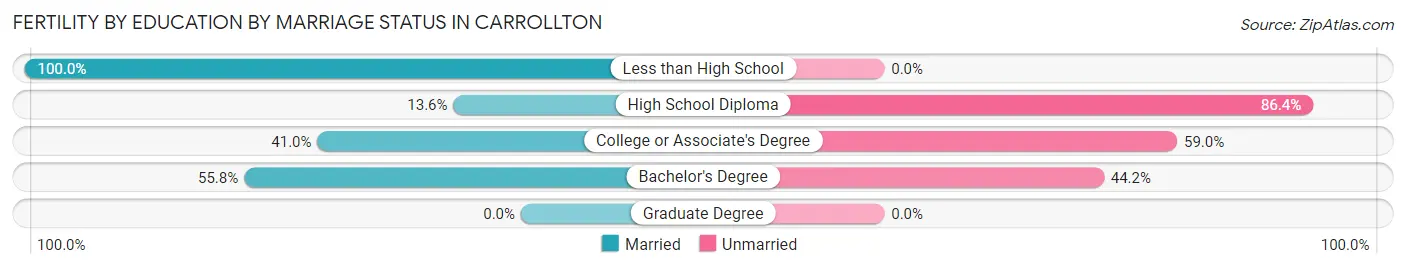
| Educational Attainment | Married | Unmarried |
| Less than High School | 37 (100.0%) | 0 (0.0%) |
| High School Diploma | 34 (13.6%) | 216 (86.4%) |
| College or Associate's Degree | 41 (41.0%) | 59 (59.0%) |
| Bachelor's Degree | 29 (55.8%) | 23 (44.2%) |
| Graduate Degree | 0 (0.0%) | 0 (0.0%) |
| Total | 141 (32.1%) | 298 (67.9%) |
Employment Characteristics in Carrollton
Employment by Class of Employer in Carrollton
Among the 11,886 employed individuals in Carrollton, private company employees (8,301 | 69.8%), state government employees (892 | 7.5%), and not-for-profit organizations (715 | 6.0%) make up the most common classes of employment.
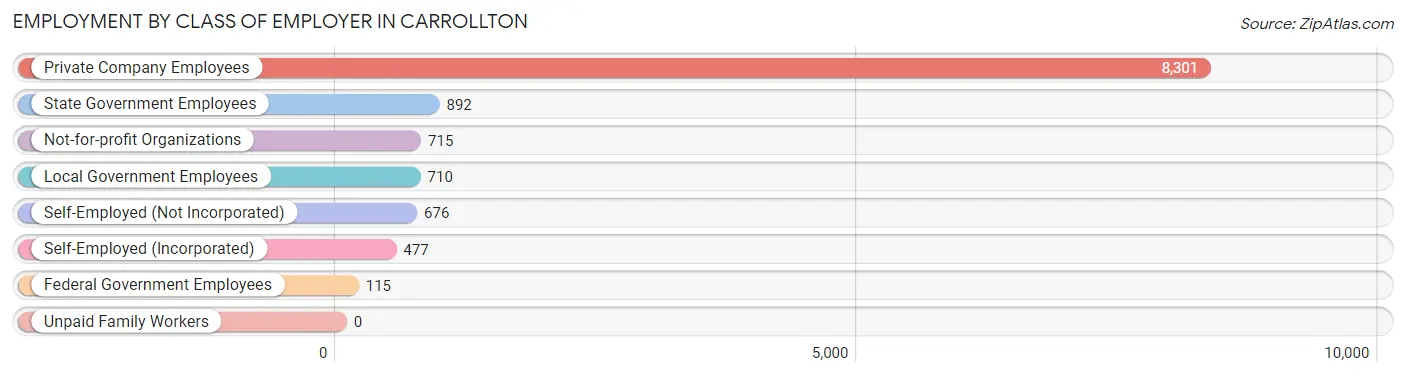
| Employer Class | # Employees | % Employees |
| Private Company Employees | 8,301 | 69.8% |
| Self-Employed (Incorporated) | 477 | 4.0% |
| Self-Employed (Not Incorporated) | 676 | 5.7% |
| Not-for-profit Organizations | 715 | 6.0% |
| Local Government Employees | 710 | 6.0% |
| State Government Employees | 892 | 7.5% |
| Federal Government Employees | 115 | 1.0% |
| Unpaid Family Workers | 0 | 0.0% |
| Total | 11,886 | 100.0% |
Employment Status by Age in Carrollton
According to the labor force statistics for Carrollton, out of the total population over 16 years of age (22,051), 61.1% or 13,473 individuals are in the labor force, with 5.8% or 781 of them unemployed. The age group with the highest labor force participation rate is 25 to 29 years, with 85.5% or 2,152 individuals in the labor force. Within the labor force, the 16 to 19 years age range has the highest percentage of unemployed individuals, with 16.1% or 205 of them being unemployed.
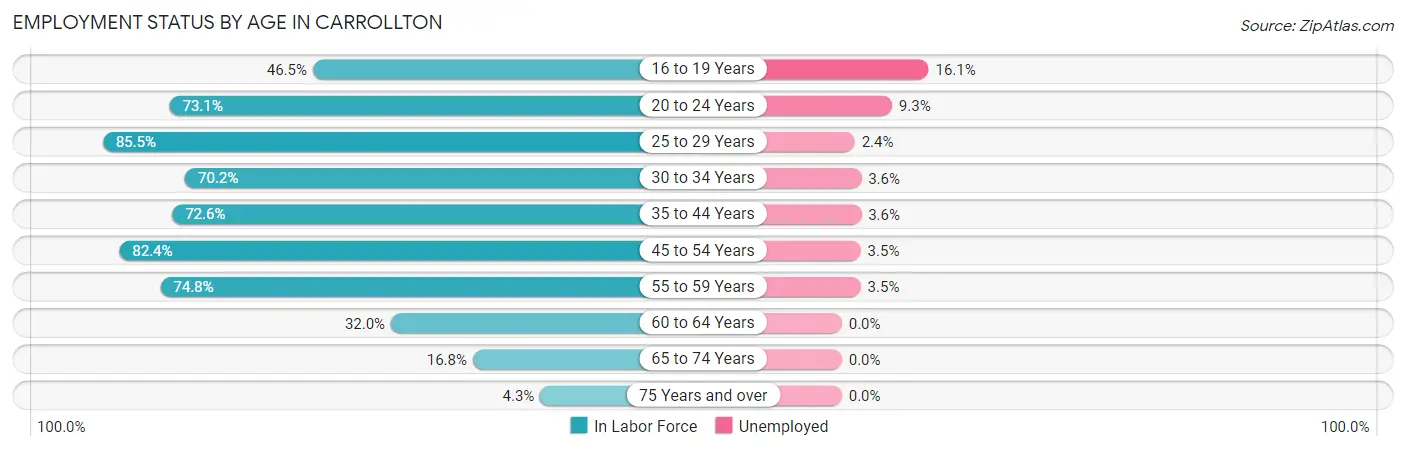
| Age Bracket | In Labor Force | Unemployed |
| 16 to 19 Years | 1,275 (46.5%) | 205 (16.1%) |
| 20 to 24 Years | 3,269 (73.1%) | 304 (9.3%) |
| 25 to 29 Years | 2,152 (85.5%) | 52 (2.4%) |
| 30 to 34 Years | 1,104 (70.2%) | 40 (3.6%) |
| 35 to 44 Years | 2,148 (72.6%) | 77 (3.6%) |
| 45 to 54 Years | 2,231 (82.4%) | 78 (3.5%) |
| 55 to 59 Years | 540 (74.8%) | 19 (3.5%) |
| 60 to 64 Years | 372 (32.0%) | 0 (0.0%) |
| 65 to 74 Years | 333 (16.8%) | 0 (0.0%) |
| 75 Years and over | 52 (4.3%) | 0 (0.0%) |
| Total | 13,473 (61.1%) | 781 (5.8%) |
Employment Status by Educational Attainment in Carrollton
According to labor force statistics for Carrollton, 73.4% of individuals (8,544) out of the total population between 25 and 64 years of age (11,640) are in the labor force, with 3.1% or 265 of them being unemployed. The group with the highest labor force participation rate are those with the educational attainment of bachelor's degree or higher, with 84.0% or 3,125 individuals in the labor force. Within the labor force, individuals with less than high school education have the highest percentage of unemployment, with 10.5% or 93 of them being unemployed.
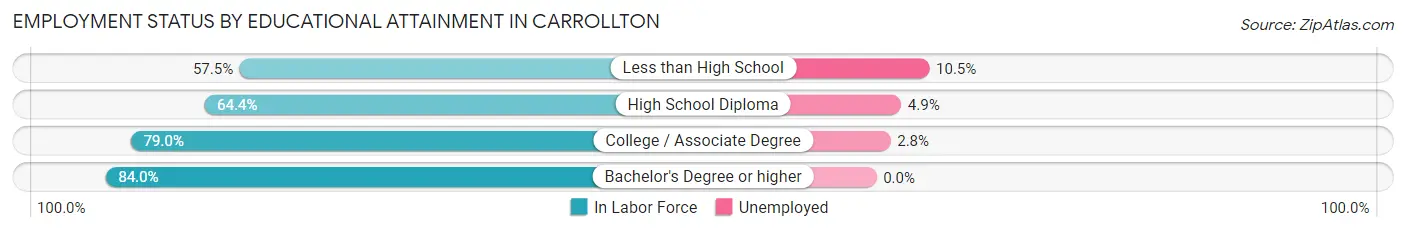
| Educational Attainment | In Labor Force | Unemployed |
| Less than High School | 886 (57.5%) | 162 (10.5%) |
| High School Diploma | 2,221 (64.4%) | 169 (4.9%) |
| College / Associate Degree | 2,316 (79.0%) | 82 (2.8%) |
| Bachelor's Degree or higher | 3,125 (84.0%) | 0 (0.0%) |
| Total | 8,544 (73.4%) | 361 (3.1%) |
Employment Occupations by Sex in Carrollton
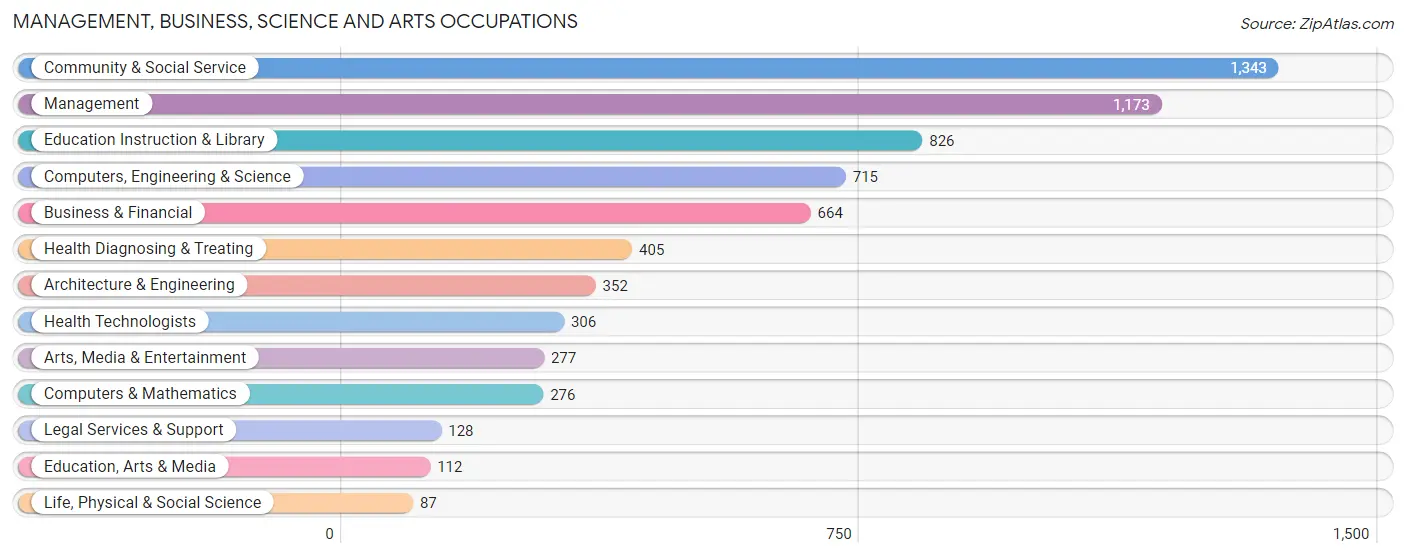
Management, Business, Science and Arts Occupations
The most common Management, Business, Science and Arts occupations in Carrollton are Community & Social Service (1,343 | 10.6%), Management (1,173 | 9.2%), Education Instruction & Library (826 | 6.5%), Computers, Engineering & Science (715 | 5.6%), and Business & Financial (664 | 5.2%).
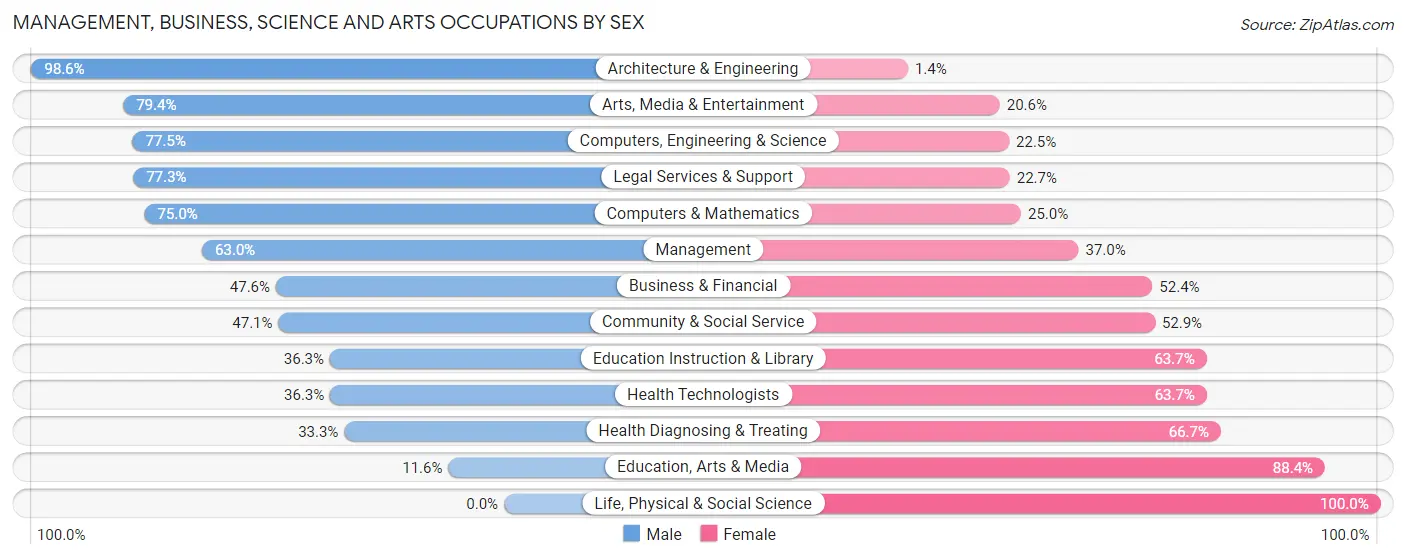
Management, Business, Science and Arts Occupations by Sex
Within the Management, Business, Science and Arts occupations in Carrollton, the most male-oriented occupations are Architecture & Engineering (98.6%), Arts, Media & Entertainment (79.4%), and Computers, Engineering & Science (77.5%), while the most female-oriented occupations are Life, Physical & Social Science (100.0%), Education, Arts & Media (88.4%), and Health Diagnosing & Treating (66.7%).
| Occupation | Male | Female |
| Management | 739 (63.0%) | 434 (37.0%) |
| Business & Financial | 316 (47.6%) | 348 (52.4%) |
| Computers, Engineering & Science | 554 (77.5%) | 161 (22.5%) |
| Computers & Mathematics | 207 (75.0%) | 69 (25.0%) |
| Architecture & Engineering | 347 (98.6%) | 5 (1.4%) |
| Life, Physical & Social Science | 0 (0.0%) | 87 (100.0%) |
| Community & Social Service | 632 (47.1%) | 711 (52.9%) |
| Education, Arts & Media | 13 (11.6%) | 99 (88.4%) |
| Legal Services & Support | 99 (77.3%) | 29 (22.7%) |
| Education Instruction & Library | 300 (36.3%) | 526 (63.7%) |
| Arts, Media & Entertainment | 220 (79.4%) | 57 (20.6%) |
| Health Diagnosing & Treating | 135 (33.3%) | 270 (66.7%) |
| Health Technologists | 111 (36.3%) | 195 (63.7%) |
| Total (Category) | 2,376 (55.3%) | 1,924 (44.7%) |
| Total (Overall) | 5,909 (46.5%) | 6,791 (53.5%) |
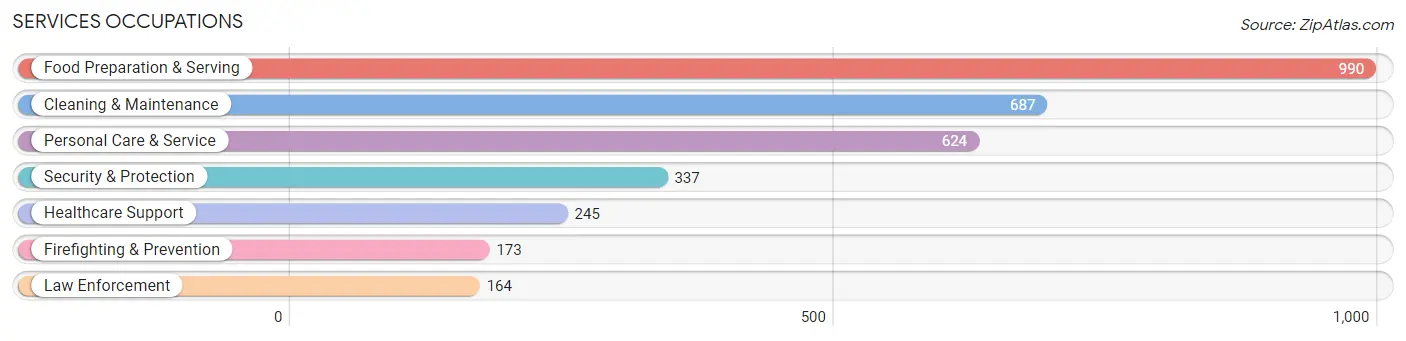
Services Occupations
The most common Services occupations in Carrollton are Food Preparation & Serving (990 | 7.8%), Cleaning & Maintenance (687 | 5.4%), Personal Care & Service (624 | 4.9%), Security & Protection (337 | 2.6%), and Healthcare Support (245 | 1.9%).
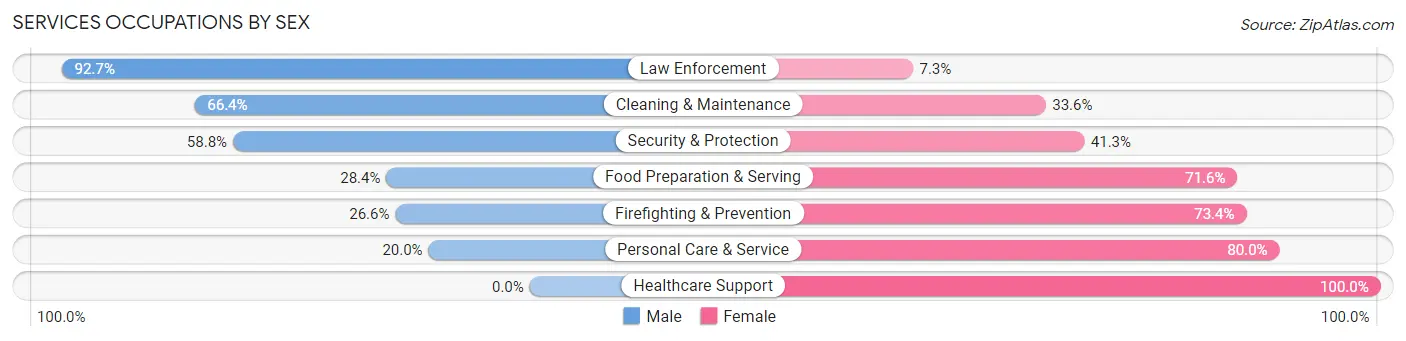
Services Occupations by Sex
Within the Services occupations in Carrollton, the most male-oriented occupations are Law Enforcement (92.7%), Cleaning & Maintenance (66.4%), and Security & Protection (58.8%), while the most female-oriented occupations are Healthcare Support (100.0%), Personal Care & Service (80.0%), and Firefighting & Prevention (73.4%).
| Occupation | Male | Female |
| Healthcare Support | 0 (0.0%) | 245 (100.0%) |
| Security & Protection | 198 (58.8%) | 139 (41.2%) |
| Firefighting & Prevention | 46 (26.6%) | 127 (73.4%) |
| Law Enforcement | 152 (92.7%) | 12 (7.3%) |
| Food Preparation & Serving | 281 (28.4%) | 709 (71.6%) |
| Cleaning & Maintenance | 456 (66.4%) | 231 (33.6%) |
| Personal Care & Service | 125 (20.0%) | 499 (80.0%) |
| Total (Category) | 1,060 (36.8%) | 1,823 (63.2%) |
| Total (Overall) | 5,909 (46.5%) | 6,791 (53.5%) |
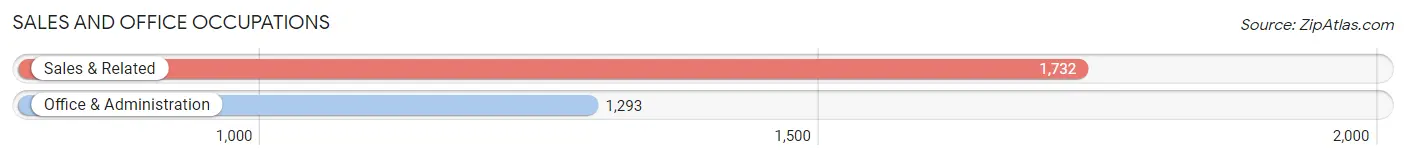
Sales and Office Occupations
The most common Sales and Office occupations in Carrollton are Sales & Related (1,732 | 13.6%), and Office & Administration (1,293 | 10.2%).
Sales and Office Occupations by Sex
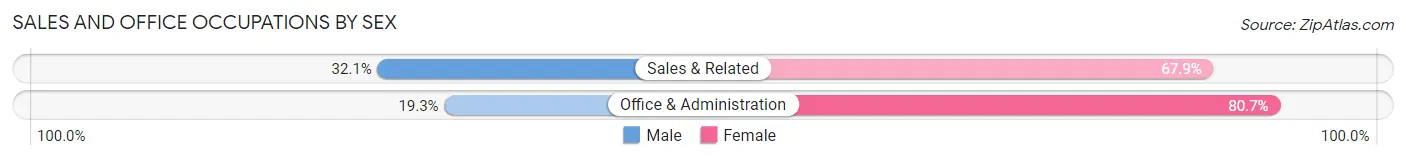
| Occupation | Male | Female |
| Sales & Related | 556 (32.1%) | 1,176 (67.9%) |
| Office & Administration | 249 (19.3%) | 1,044 (80.7%) |
| Total (Category) | 805 (26.6%) | 2,220 (73.4%) |
| Total (Overall) | 5,909 (46.5%) | 6,791 (53.5%) |
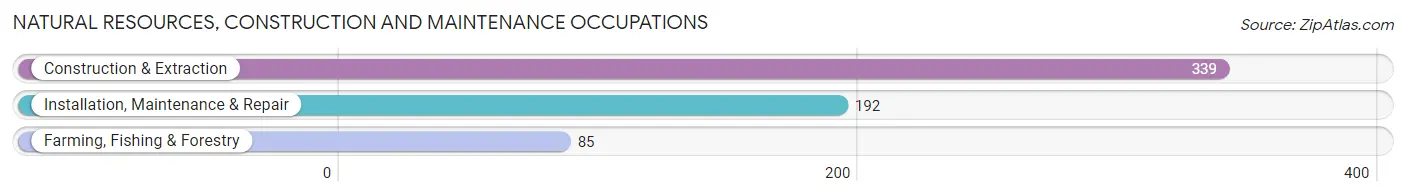
Natural Resources, Construction and Maintenance Occupations
The most common Natural Resources, Construction and Maintenance occupations in Carrollton are Construction & Extraction (339 | 2.7%), Installation, Maintenance & Repair (192 | 1.5%), and Farming, Fishing & Forestry (85 | 0.7%).
Natural Resources, Construction and Maintenance Occupations by Sex
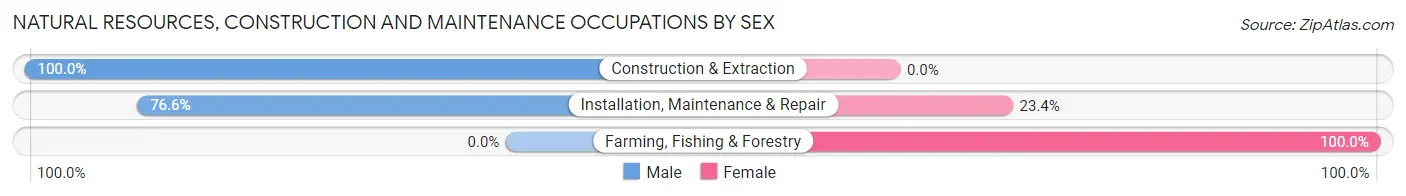
| Occupation | Male | Female |
| Farming, Fishing & Forestry | 0 (0.0%) | 85 (100.0%) |
| Construction & Extraction | 339 (100.0%) | 0 (0.0%) |
| Installation, Maintenance & Repair | 147 (76.6%) | 45 (23.4%) |
| Total (Category) | 486 (78.9%) | 130 (21.1%) |
| Total (Overall) | 5,909 (46.5%) | 6,791 (53.5%) |
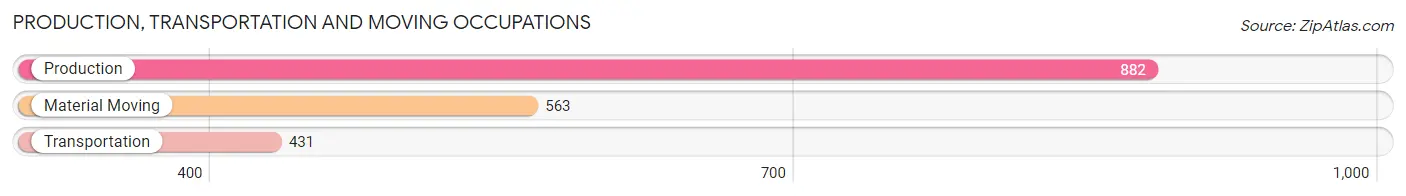
Production, Transportation and Moving Occupations
The most common Production, Transportation and Moving occupations in Carrollton are Production (882 | 6.9%), Material Moving (563 | 4.4%), and Transportation (431 | 3.4%).
Production, Transportation and Moving Occupations by Sex
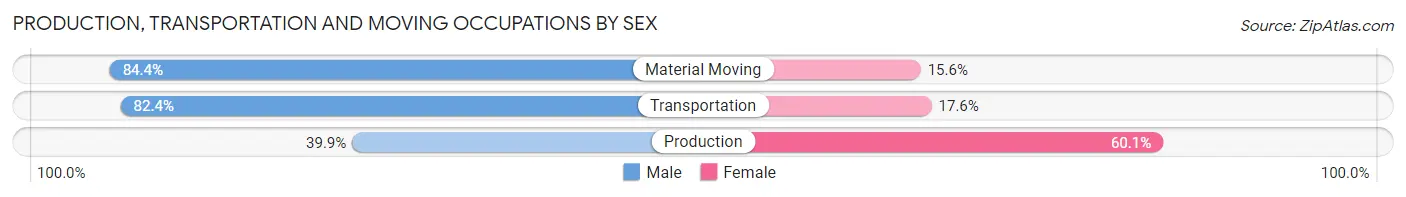
| Occupation | Male | Female |
| Production | 352 (39.9%) | 530 (60.1%) |
| Transportation | 355 (82.4%) | 76 (17.6%) |
| Material Moving | 475 (84.4%) | 88 (15.6%) |
| Total (Category) | 1,182 (63.0%) | 694 (37.0%) |
| Total (Overall) | 5,909 (46.5%) | 6,791 (53.5%) |
Employment Industries by Sex in Carrollton
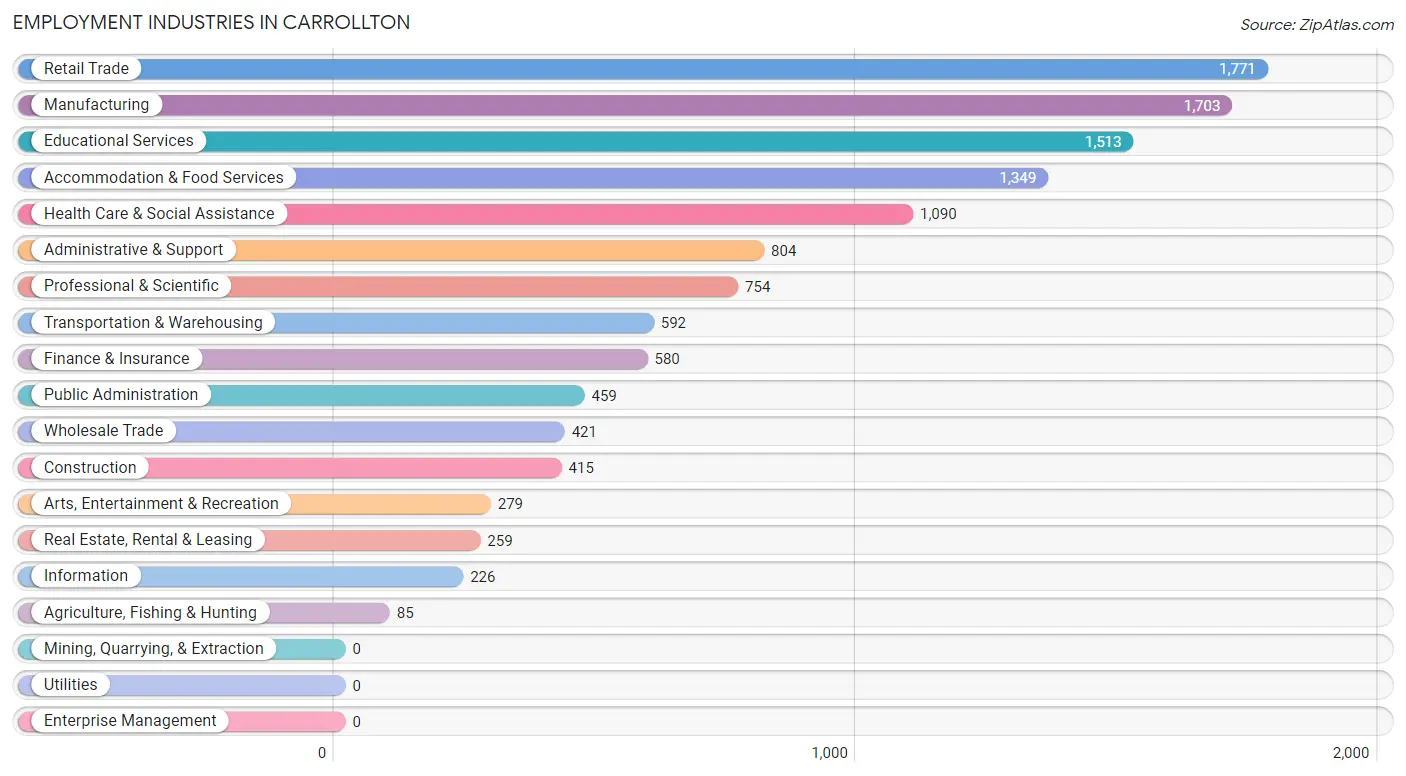
Employment Industries in Carrollton
The major employment industries in Carrollton include Retail Trade (1,771 | 13.9%), Manufacturing (1,703 | 13.4%), Educational Services (1,513 | 11.9%), Accommodation & Food Services (1,349 | 10.6%), and Health Care & Social Assistance (1,090 | 8.6%).
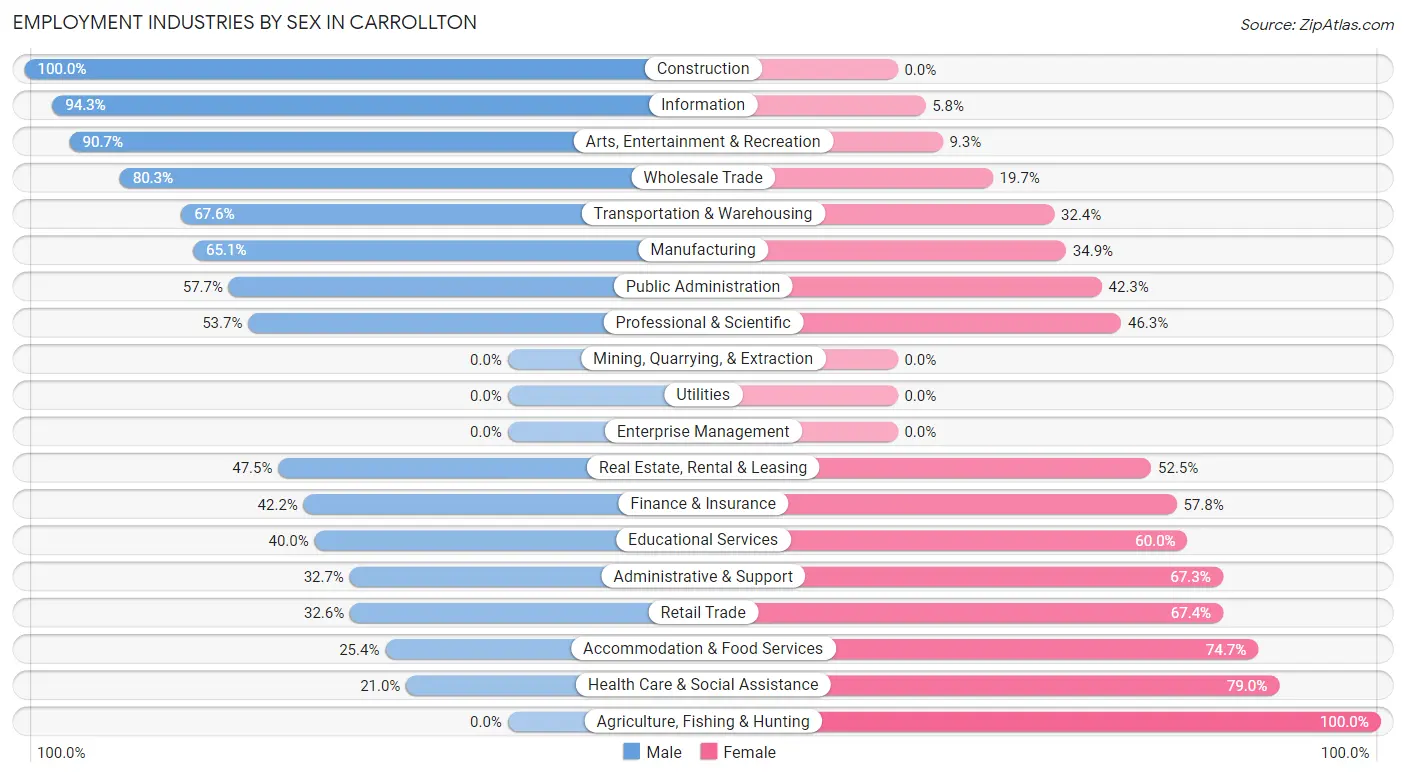
Employment Industries by Sex in Carrollton
The Carrollton industries that see more men than women are Construction (100.0%), Information (94.3%), and Arts, Entertainment & Recreation (90.7%), whereas the industries that tend to have a higher number of women are Agriculture, Fishing & Hunting (100.0%), Health Care & Social Assistance (79.0%), and Accommodation & Food Services (74.7%).
| Industry | Male | Female |
| Agriculture, Fishing & Hunting | 0 (0.0%) | 85 (100.0%) |
| Mining, Quarrying, & Extraction | 0 (0.0%) | 0 (0.0%) |
| Construction | 415 (100.0%) | 0 (0.0%) |
| Manufacturing | 1,109 (65.1%) | 594 (34.9%) |
| Wholesale Trade | 338 (80.3%) | 83 (19.7%) |
| Retail Trade | 578 (32.6%) | 1,193 (67.4%) |
| Transportation & Warehousing | 400 (67.6%) | 192 (32.4%) |
| Utilities | 0 (0.0%) | 0 (0.0%) |
| Information | 213 (94.3%) | 13 (5.8%) |
| Finance & Insurance | 245 (42.2%) | 335 (57.8%) |
| Real Estate, Rental & Leasing | 123 (47.5%) | 136 (52.5%) |
| Professional & Scientific | 405 (53.7%) | 349 (46.3%) |
| Enterprise Management | 0 (0.0%) | 0 (0.0%) |
| Administrative & Support | 263 (32.7%) | 541 (67.3%) |
| Educational Services | 605 (40.0%) | 908 (60.0%) |
| Health Care & Social Assistance | 229 (21.0%) | 861 (79.0%) |
| Arts, Entertainment & Recreation | 253 (90.7%) | 26 (9.3%) |
| Accommodation & Food Services | 342 (25.4%) | 1,007 (74.7%) |
| Public Administration | 265 (57.7%) | 194 (42.3%) |
| Total | 5,909 (46.5%) | 6,791 (53.5%) |
Education in Carrollton
School Enrollment in Carrollton
The most common levels of schooling among the 9,531 students in Carrollton are college / undergraduate (5,238 | 55.0%), elementary school (1,122 | 11.8%), and high school (959 | 10.1%).
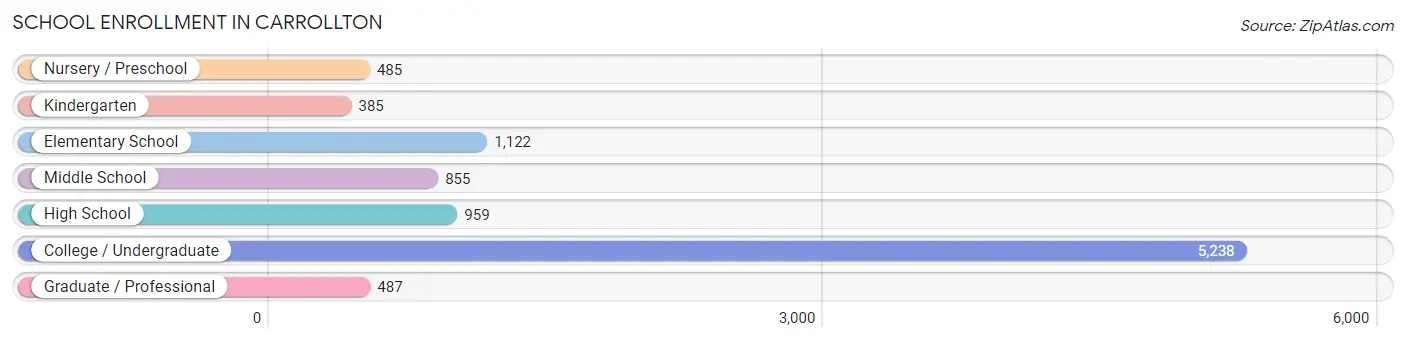
| School Level | # Students | % Students |
| Nursery / Preschool | 485 | 5.1% |
| Kindergarten | 385 | 4.0% |
| Elementary School | 1,122 | 11.8% |
| Middle School | 855 | 9.0% |
| High School | 959 | 10.1% |
| College / Undergraduate | 5,238 | 55.0% |
| Graduate / Professional | 487 | 5.1% |
| Total | 9,531 | 100.0% |
School Enrollment by Age by Funding Source in Carrollton
Out of a total of 9,531 students who are enrolled in schools in Carrollton, 810 (8.5%) attend a private institution, while the remaining 8,721 (91.5%) are enrolled in public schools. The age group of 35 years and over has the highest likelihood of being enrolled in private schools, with 92 (39.3% in the age bracket) enrolled. Conversely, the age group of 5 to 9 year old has the lowest likelihood of being enrolled in a private school, with 1,298 (96.7% in the age bracket) attending a public institution.
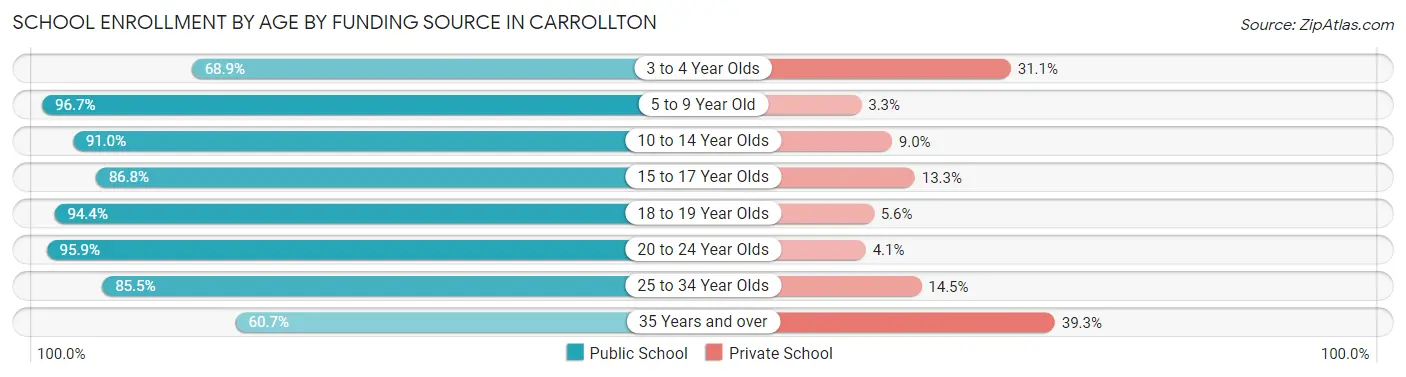
| Age Bracket | Public School | Private School |
| 3 to 4 Year Olds | 281 (68.9%) | 127 (31.1%) |
| 5 to 9 Year Old | 1,298 (96.7%) | 44 (3.3%) |
| 10 to 14 Year Olds | 1,024 (91.0%) | 101 (9.0%) |
| 15 to 17 Year Olds | 661 (86.8%) | 101 (13.3%) |
| 18 to 19 Year Olds | 1,807 (94.4%) | 107 (5.6%) |
| 20 to 24 Year Olds | 2,850 (95.9%) | 122 (4.1%) |
| 25 to 34 Year Olds | 662 (85.5%) | 112 (14.5%) |
| 35 Years and over | 142 (60.7%) | 92 (39.3%) |
| Total | 8,721 (91.5%) | 810 (8.5%) |
Educational Attainment by Field of Study in Carrollton
Business (1,365 | 27.3%), education (524 | 10.5%), psychology (473 | 9.5%), liberal arts & history (393 | 7.9%), and bio, nature & agricultural (386 | 7.7%) are the most common fields of study among 5,003 individuals in Carrollton who have obtained a bachelor's degree or higher.
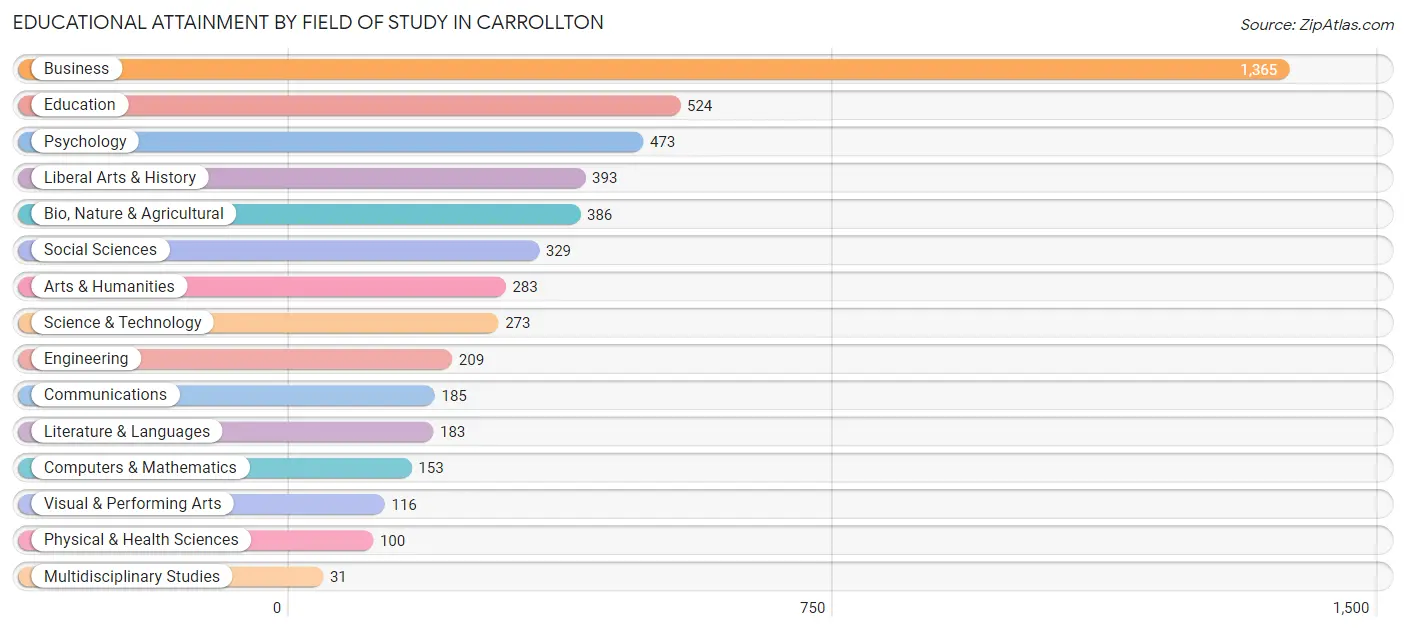
| Field of Study | # Graduates | % Graduates |
| Computers & Mathematics | 153 | 3.1% |
| Bio, Nature & Agricultural | 386 | 7.7% |
| Physical & Health Sciences | 100 | 2.0% |
| Psychology | 473 | 9.5% |
| Social Sciences | 329 | 6.6% |
| Engineering | 209 | 4.2% |
| Multidisciplinary Studies | 31 | 0.6% |
| Science & Technology | 273 | 5.5% |
| Business | 1,365 | 27.3% |
| Education | 524 | 10.5% |
| Literature & Languages | 183 | 3.7% |
| Liberal Arts & History | 393 | 7.9% |
| Visual & Performing Arts | 116 | 2.3% |
| Communications | 185 | 3.7% |
| Arts & Humanities | 283 | 5.7% |
| Total | 5,003 | 100.0% |
Transportation & Commute in Carrollton
Vehicle Availability by Sex in Carrollton
The most prevalent vehicle ownership categories in Carrollton are males with 2 vehicles (2,251, accounting for 44.0%) and females with 2 vehicles (1,768, making up 38.4%).
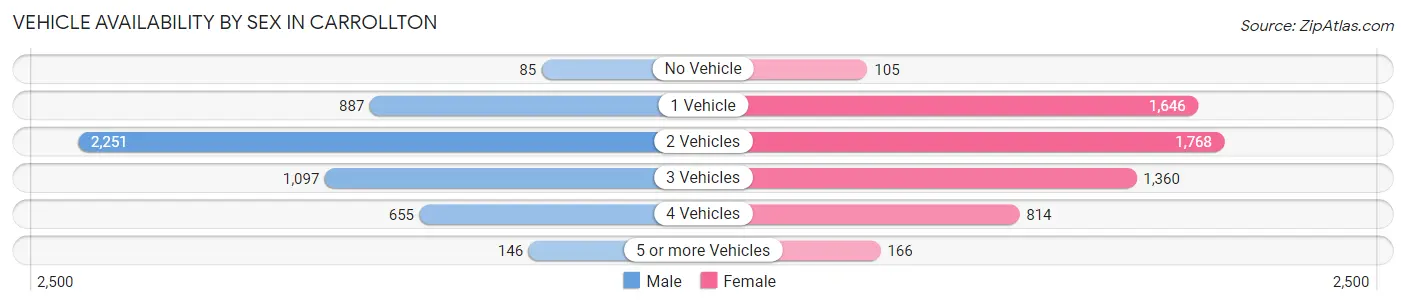
| Vehicles Available | Male | Female |
| No Vehicle | 85 (1.7%) | 105 (1.8%) |
| 1 Vehicle | 887 (17.3%) | 1,646 (28.1%) |
| 2 Vehicles | 2,251 (44.0%) | 1,768 (30.2%) |
| 3 Vehicles | 1,097 (21.4%) | 1,360 (23.2%) |
| 4 Vehicles | 655 (12.8%) | 814 (13.9%) |
| 5 or more Vehicles | 146 (2.9%) | 166 (2.8%) |
| Total | 5,121 (100.0%) | 5,859 (100.0%) |
Commute Time in Carrollton
The most frequently occuring commute durations in Carrollton are 5 to 9 minutes (3,149 commuters, 28.8%), 10 to 14 minutes (2,163 commuters, 19.8%), and 15 to 19 minutes (1,317 commuters, 12.0%).
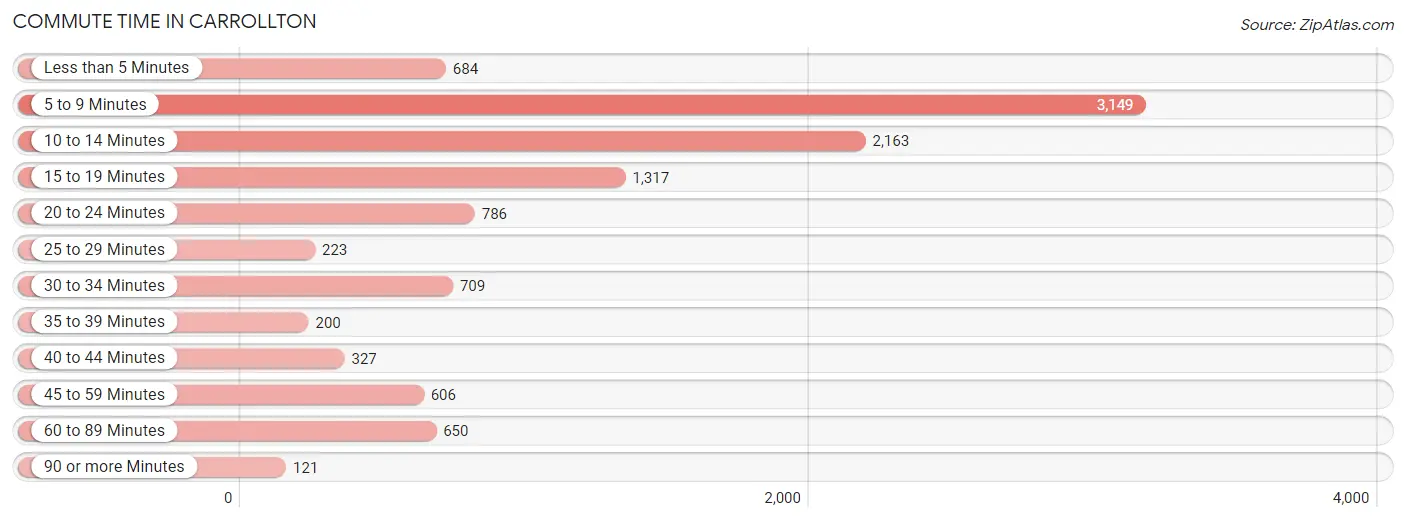
| Commute Time | # Commuters | % Commuters |
| Less than 5 Minutes | 684 | 6.3% |
| 5 to 9 Minutes | 3,149 | 28.8% |
| 10 to 14 Minutes | 2,163 | 19.8% |
| 15 to 19 Minutes | 1,317 | 12.0% |
| 20 to 24 Minutes | 786 | 7.2% |
| 25 to 29 Minutes | 223 | 2.0% |
| 30 to 34 Minutes | 709 | 6.5% |
| 35 to 39 Minutes | 200 | 1.8% |
| 40 to 44 Minutes | 327 | 3.0% |
| 45 to 59 Minutes | 606 | 5.5% |
| 60 to 89 Minutes | 650 | 5.9% |
| 90 or more Minutes | 121 | 1.1% |
Commute Time by Sex in Carrollton
The most common commute times in Carrollton are 5 to 9 minutes (1,546 commuters, 29.7%) for males and 5 to 9 minutes (1,603 commuters, 28.0%) for females.
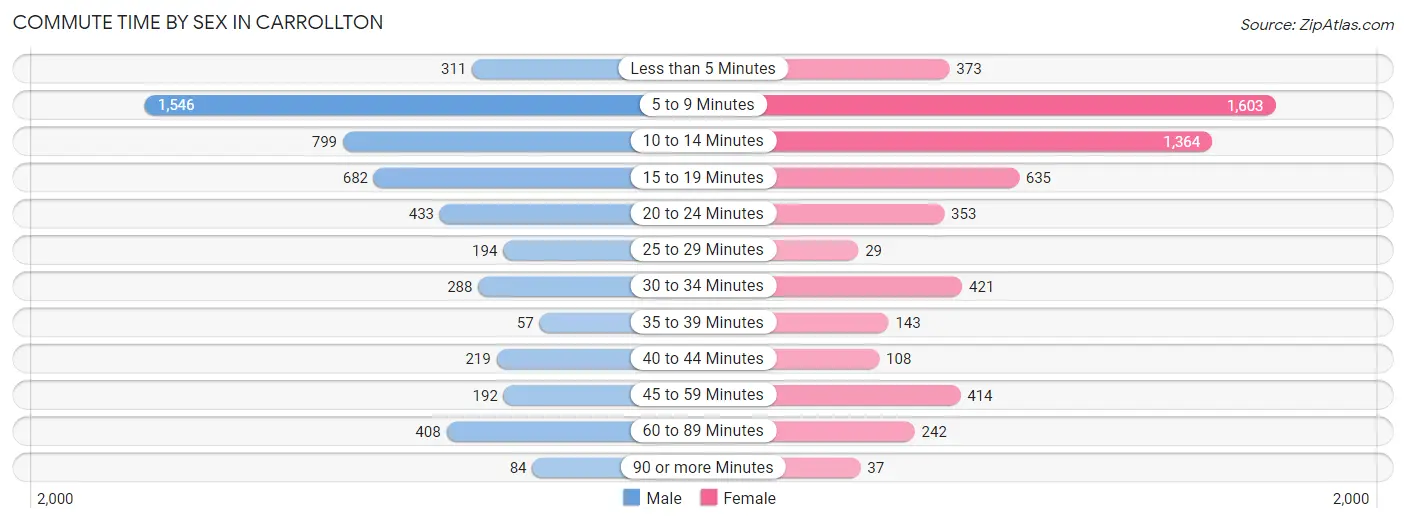
| Commute Time | Male | Female |
| Less than 5 Minutes | 311 (6.0%) | 373 (6.5%) |
| 5 to 9 Minutes | 1,546 (29.7%) | 1,603 (28.0%) |
| 10 to 14 Minutes | 799 (15.3%) | 1,364 (23.8%) |
| 15 to 19 Minutes | 682 (13.1%) | 635 (11.1%) |
| 20 to 24 Minutes | 433 (8.3%) | 353 (6.2%) |
| 25 to 29 Minutes | 194 (3.7%) | 29 (0.5%) |
| 30 to 34 Minutes | 288 (5.5%) | 421 (7.4%) |
| 35 to 39 Minutes | 57 (1.1%) | 143 (2.5%) |
| 40 to 44 Minutes | 219 (4.2%) | 108 (1.9%) |
| 45 to 59 Minutes | 192 (3.7%) | 414 (7.2%) |
| 60 to 89 Minutes | 408 (7.8%) | 242 (4.2%) |
| 90 or more Minutes | 84 (1.6%) | 37 (0.6%) |
Time of Departure to Work by Sex in Carrollton
The most frequent times of departure to work in Carrollton are 7:00 AM to 7:29 AM (732, 14.0%) for males and 7:30 AM to 7:59 AM (672, 11.7%) for females.
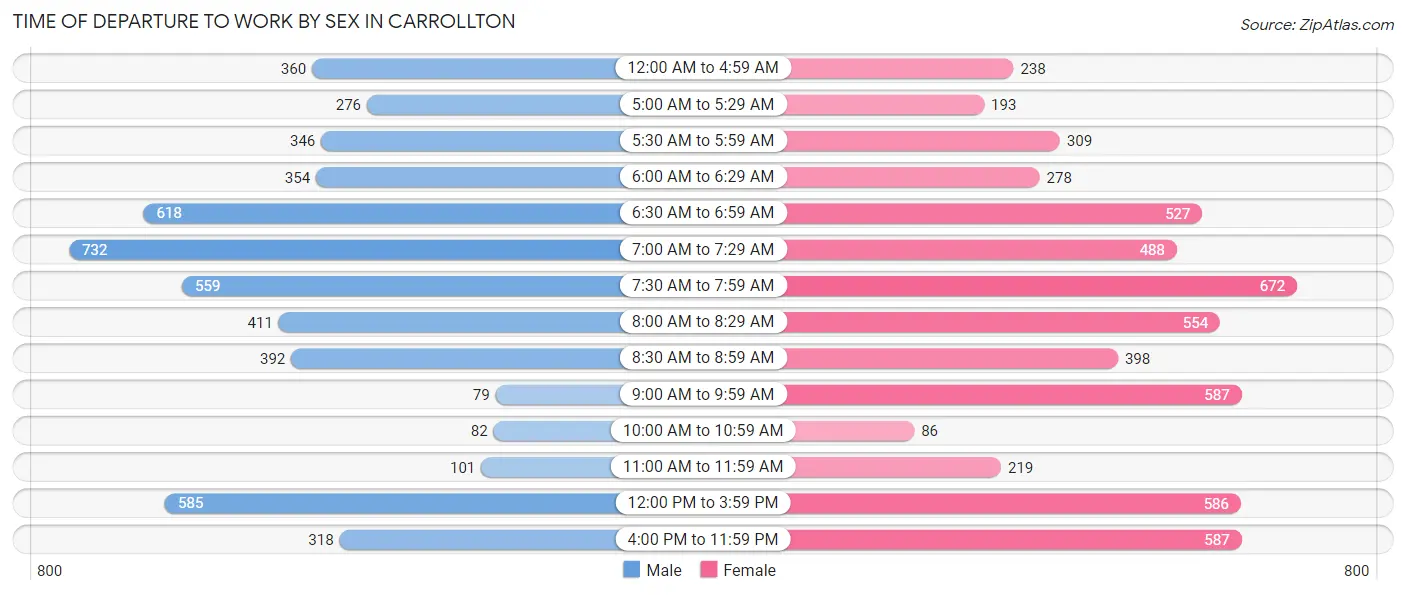
| Time of Departure | Male | Female |
| 12:00 AM to 4:59 AM | 360 (6.9%) | 238 (4.2%) |
| 5:00 AM to 5:29 AM | 276 (5.3%) | 193 (3.4%) |
| 5:30 AM to 5:59 AM | 346 (6.6%) | 309 (5.4%) |
| 6:00 AM to 6:29 AM | 354 (6.8%) | 278 (4.9%) |
| 6:30 AM to 6:59 AM | 618 (11.8%) | 527 (9.2%) |
| 7:00 AM to 7:29 AM | 732 (14.0%) | 488 (8.5%) |
| 7:30 AM to 7:59 AM | 559 (10.7%) | 672 (11.7%) |
| 8:00 AM to 8:29 AM | 411 (7.9%) | 554 (9.7%) |
| 8:30 AM to 8:59 AM | 392 (7.5%) | 398 (7.0%) |
| 9:00 AM to 9:59 AM | 79 (1.5%) | 587 (10.3%) |
| 10:00 AM to 10:59 AM | 82 (1.6%) | 86 (1.5%) |
| 11:00 AM to 11:59 AM | 101 (1.9%) | 219 (3.8%) |
| 12:00 PM to 3:59 PM | 585 (11.2%) | 586 (10.2%) |
| 4:00 PM to 11:59 PM | 318 (6.1%) | 587 (10.3%) |
| Total | 5,213 (100.0%) | 5,722 (100.0%) |
Housing Occupancy in Carrollton
Occupancy by Ownership in Carrollton
Of the total 9,626 dwellings in Carrollton, owner-occupied units account for 3,689 (38.3%), while renter-occupied units make up 5,937 (61.7%).
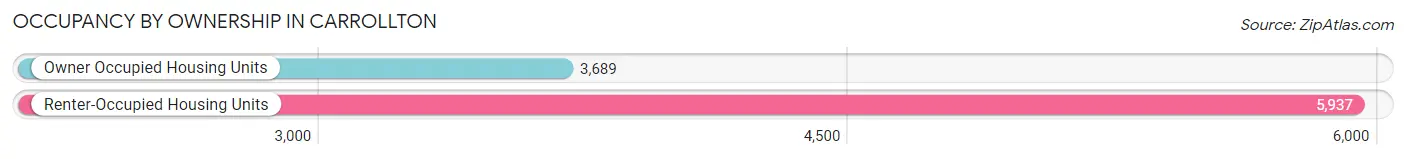
| Occupancy | # Housing Units | % Housing Units |
| Owner Occupied Housing Units | 3,689 | 38.3% |
| Renter-Occupied Housing Units | 5,937 | 61.7% |
| Total Occupied Housing Units | 9,626 | 100.0% |
Occupancy by Household Size in Carrollton
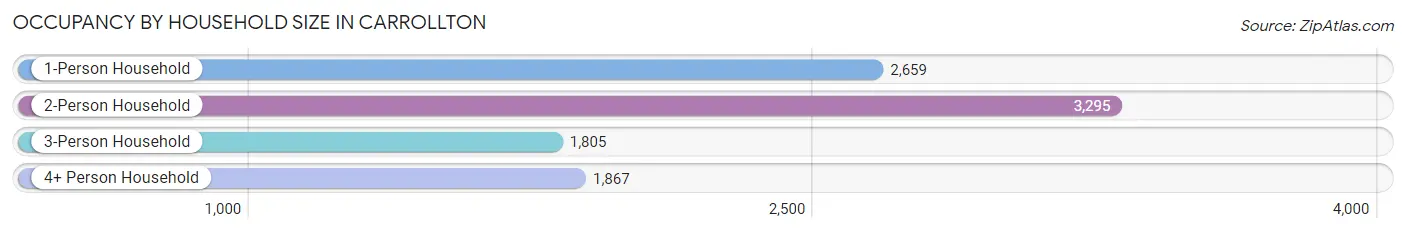
| Household Size | # Housing Units | % Housing Units |
| 1-Person Household | 2,659 | 27.6% |
| 2-Person Household | 3,295 | 34.2% |
| 3-Person Household | 1,805 | 18.8% |
| 4+ Person Household | 1,867 | 19.4% |
| Total Housing Units | 9,626 | 100.0% |
Occupancy by Ownership by Household Size in Carrollton
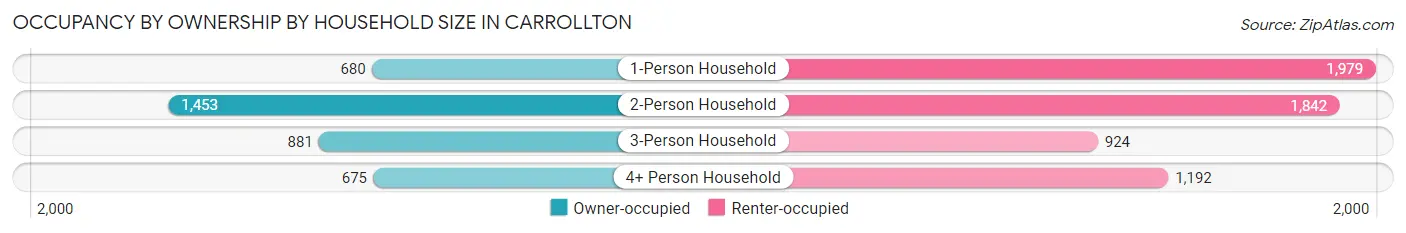
| Household Size | Owner-occupied | Renter-occupied |
| 1-Person Household | 680 (25.6%) | 1,979 (74.4%) |
| 2-Person Household | 1,453 (44.1%) | 1,842 (55.9%) |
| 3-Person Household | 881 (48.8%) | 924 (51.2%) |
| 4+ Person Household | 675 (36.1%) | 1,192 (63.8%) |
| Total Housing Units | 3,689 (38.3%) | 5,937 (61.7%) |
Occupancy by Educational Attainment in Carrollton
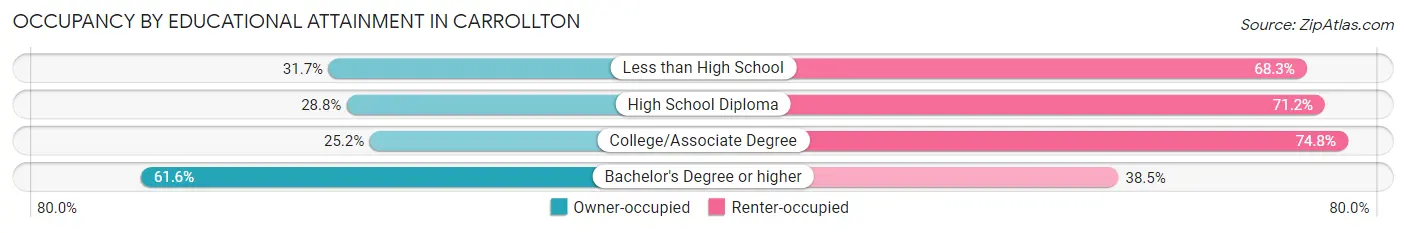
| Household Size | Owner-occupied | Renter-occupied |
| Less than High School | 329 (31.7%) | 708 (68.3%) |
| High School Diploma | 782 (28.8%) | 1,930 (71.2%) |
| College/Associate Degree | 721 (25.2%) | 2,139 (74.8%) |
| Bachelor's Degree or higher | 1,857 (61.6%) | 1,160 (38.5%) |
Occupancy by Age of Householder in Carrollton
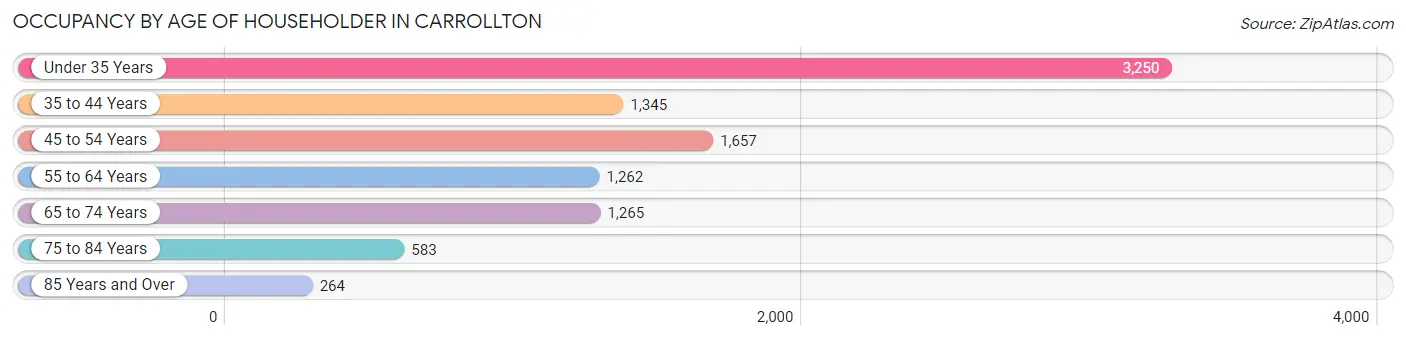
| Age Bracket | # Households | % Households |
| Under 35 Years | 3,250 | 33.8% |
| 35 to 44 Years | 1,345 | 14.0% |
| 45 to 54 Years | 1,657 | 17.2% |
| 55 to 64 Years | 1,262 | 13.1% |
| 65 to 74 Years | 1,265 | 13.1% |
| 75 to 84 Years | 583 | 6.1% |
| 85 Years and Over | 264 | 2.7% |
| Total | 9,626 | 100.0% |
Housing Finances in Carrollton
Median Income by Occupancy in Carrollton
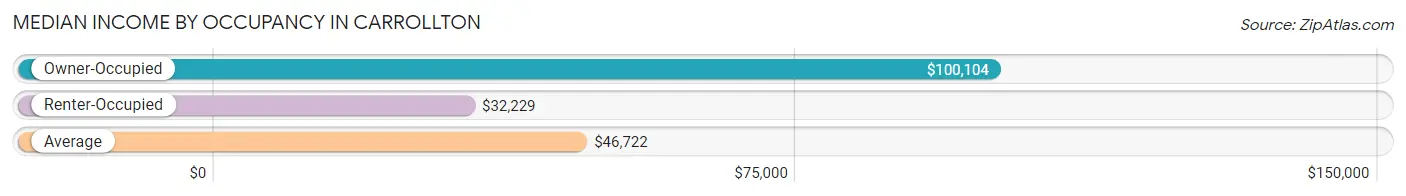
| Occupancy Type | # Households | Median Income |
| Owner-Occupied | 3,689 (38.3%) | $100,104 |
| Renter-Occupied | 5,937 (61.7%) | $32,229 |
| Average | 9,626 (100.0%) | $46,722 |
Occupancy by Householder Income Bracket in Carrollton
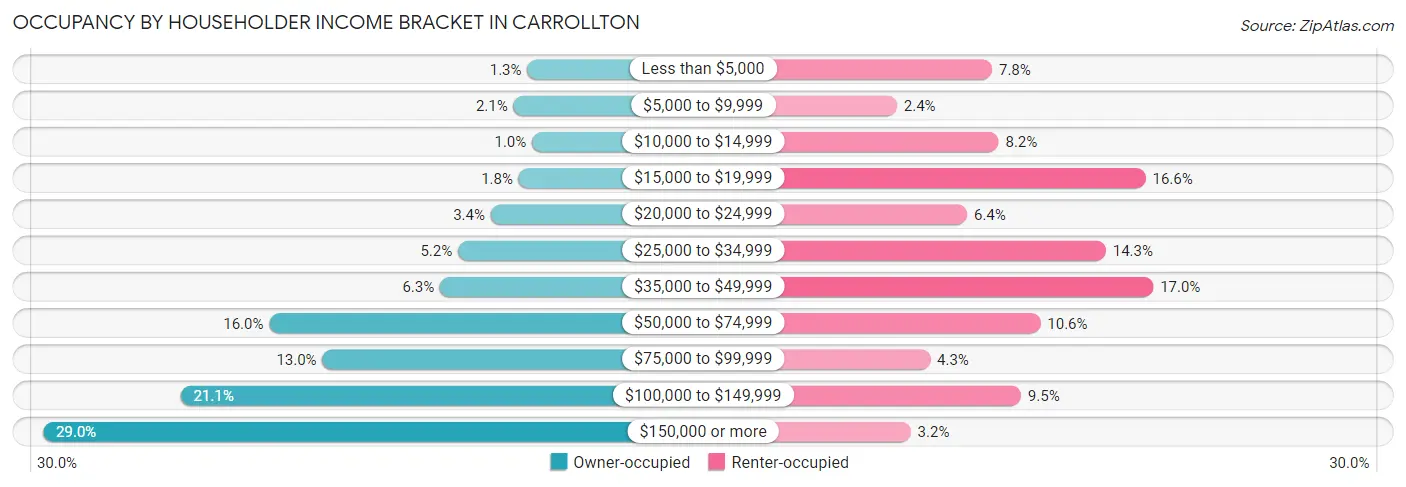
| Income Bracket | Owner-occupied | Renter-occupied |
| Less than $5,000 | 47 (1.3%) | 463 (7.8%) |
| $5,000 to $9,999 | 76 (2.1%) | 140 (2.4%) |
| $10,000 to $14,999 | 37 (1.0%) | 485 (8.2%) |
| $15,000 to $19,999 | 65 (1.8%) | 984 (16.6%) |
| $20,000 to $24,999 | 124 (3.4%) | 378 (6.4%) |
| $25,000 to $34,999 | 193 (5.2%) | 849 (14.3%) |
| $35,000 to $49,999 | 231 (6.3%) | 1,010 (17.0%) |
| $50,000 to $74,999 | 591 (16.0%) | 627 (10.6%) |
| $75,000 to $99,999 | 479 (13.0%) | 253 (4.3%) |
| $100,000 to $149,999 | 778 (21.1%) | 561 (9.5%) |
| $150,000 or more | 1,068 (28.9%) | 187 (3.2%) |
| Total | 3,689 (100.0%) | 5,937 (100.0%) |
Monthly Housing Cost Tiers in Carrollton
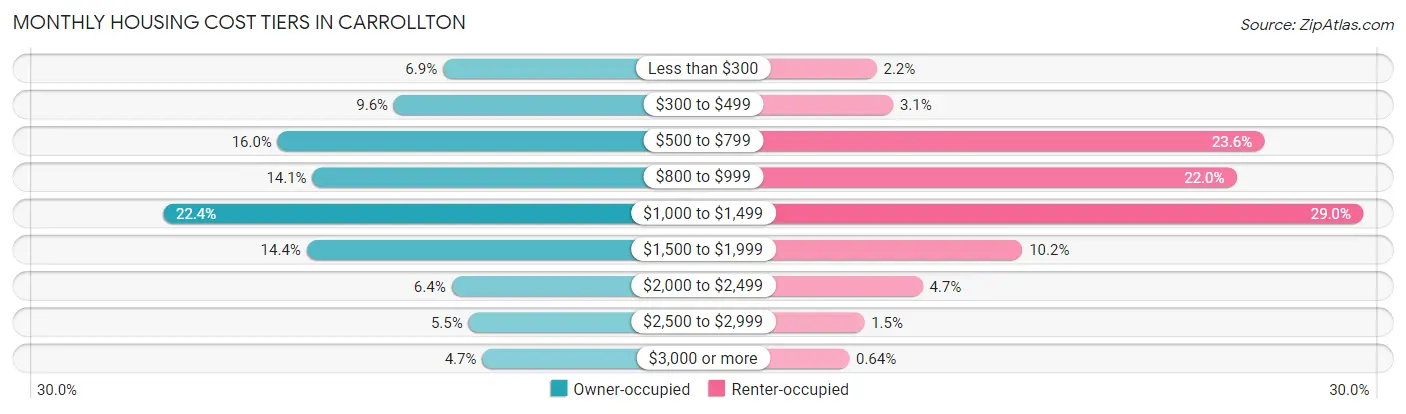
| Monthly Cost | Owner-occupied | Renter-occupied |
| Less than $300 | 254 (6.9%) | 128 (2.2%) |
| $300 to $499 | 354 (9.6%) | 182 (3.1%) |
| $500 to $799 | 591 (16.0%) | 1,399 (23.6%) |
| $800 to $999 | 520 (14.1%) | 1,308 (22.0%) |
| $1,000 to $1,499 | 825 (22.4%) | 1,723 (29.0%) |
| $1,500 to $1,999 | 532 (14.4%) | 606 (10.2%) |
| $2,000 to $2,499 | 237 (6.4%) | 279 (4.7%) |
| $2,500 to $2,999 | 202 (5.5%) | 88 (1.5%) |
| $3,000 or more | 174 (4.7%) | 38 (0.6%) |
| Total | 3,689 (100.0%) | 5,937 (100.0%) |
Physical Housing Characteristics in Carrollton
Housing Structures in Carrollton
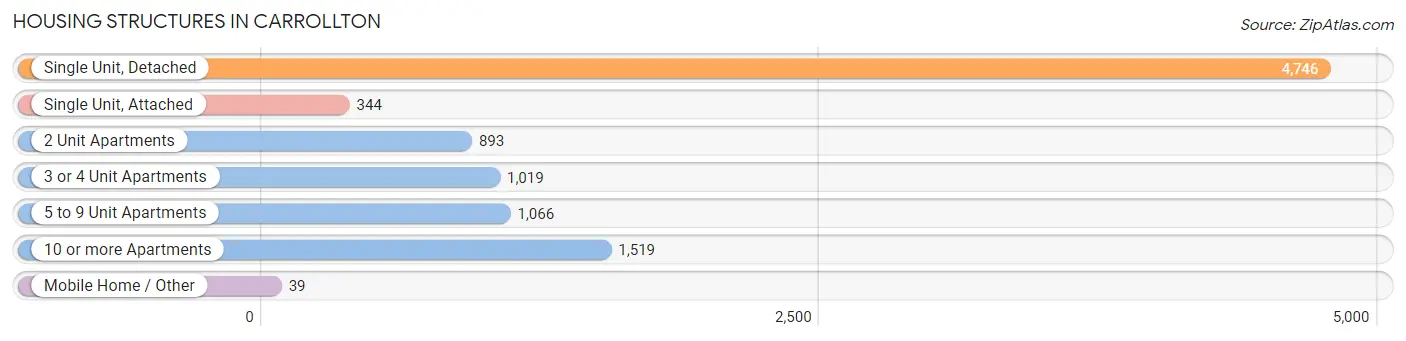
| Structure Type | # Housing Units | % Housing Units |
| Single Unit, Detached | 4,746 | 49.3% |
| Single Unit, Attached | 344 | 3.6% |
| 2 Unit Apartments | 893 | 9.3% |
| 3 or 4 Unit Apartments | 1,019 | 10.6% |
| 5 to 9 Unit Apartments | 1,066 | 11.1% |
| 10 or more Apartments | 1,519 | 15.8% |
| Mobile Home / Other | 39 | 0.4% |
| Total | 9,626 | 100.0% |
Housing Structures by Occupancy in Carrollton
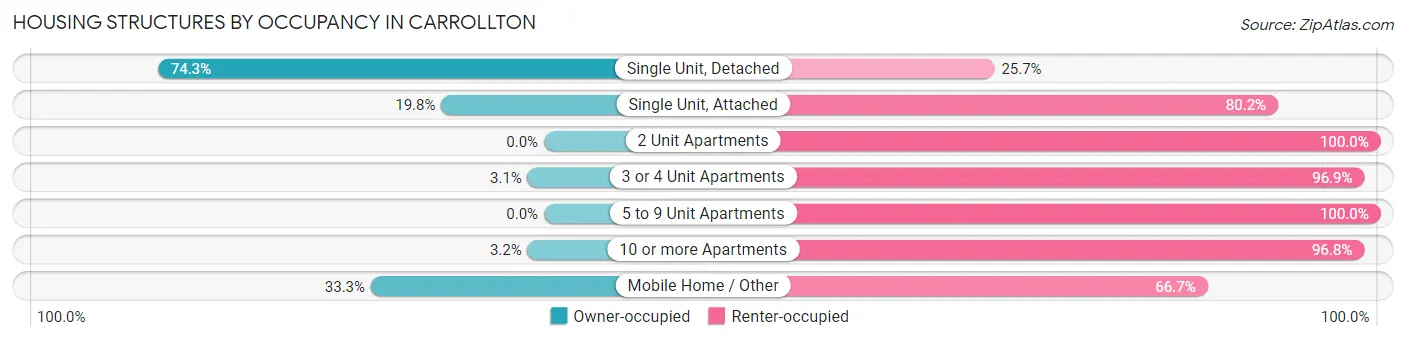
| Structure Type | Owner-occupied | Renter-occupied |
| Single Unit, Detached | 3,528 (74.3%) | 1,218 (25.7%) |
| Single Unit, Attached | 68 (19.8%) | 276 (80.2%) |
| 2 Unit Apartments | 0 (0.0%) | 893 (100.0%) |
| 3 or 4 Unit Apartments | 32 (3.1%) | 987 (96.9%) |
| 5 to 9 Unit Apartments | 0 (0.0%) | 1,066 (100.0%) |
| 10 or more Apartments | 48 (3.2%) | 1,471 (96.8%) |
| Mobile Home / Other | 13 (33.3%) | 26 (66.7%) |
| Total | 3,689 (38.3%) | 5,937 (61.7%) |
Housing Structures by Number of Rooms in Carrollton
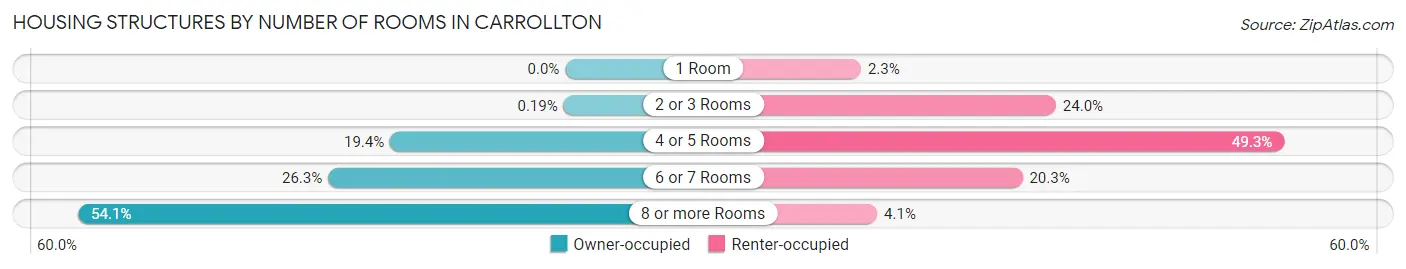
| Number of Rooms | Owner-occupied | Renter-occupied |
| 1 Room | 0 (0.0%) | 139 (2.3%) |
| 2 or 3 Rooms | 7 (0.2%) | 1,423 (24.0%) |
| 4 or 5 Rooms | 717 (19.4%) | 2,927 (49.3%) |
| 6 or 7 Rooms | 971 (26.3%) | 1,203 (20.3%) |
| 8 or more Rooms | 1,994 (54.0%) | 245 (4.1%) |
| Total | 3,689 (100.0%) | 5,937 (100.0%) |
Housing Structure by Heating Type in Carrollton
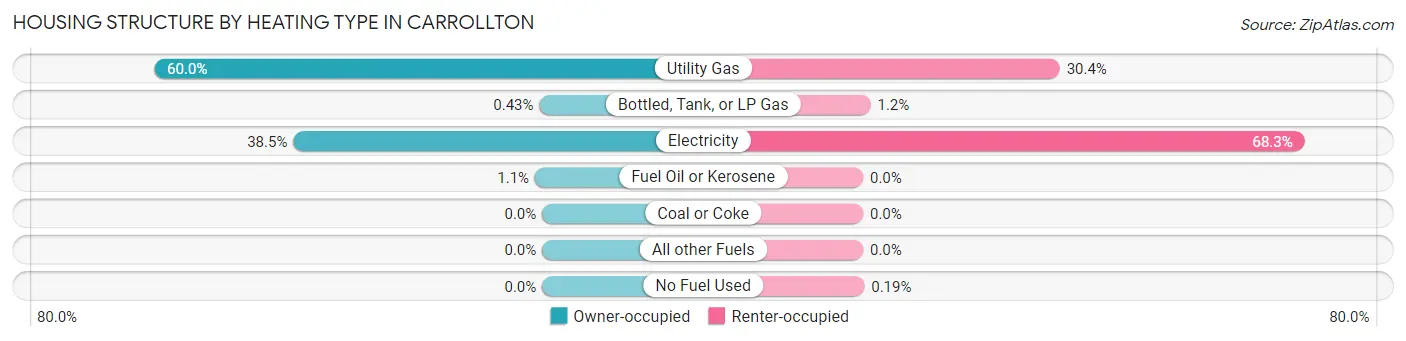
| Heating Type | Owner-occupied | Renter-occupied |
| Utility Gas | 2,213 (60.0%) | 1,805 (30.4%) |
| Bottled, Tank, or LP Gas | 16 (0.4%) | 69 (1.2%) |
| Electricity | 1,419 (38.5%) | 4,052 (68.2%) |
| Fuel Oil or Kerosene | 41 (1.1%) | 0 (0.0%) |
| Coal or Coke | 0 (0.0%) | 0 (0.0%) |
| All other Fuels | 0 (0.0%) | 0 (0.0%) |
| No Fuel Used | 0 (0.0%) | 11 (0.2%) |
| Total | 3,689 (100.0%) | 5,937 (100.0%) |
Household Vehicle Usage in Carrollton
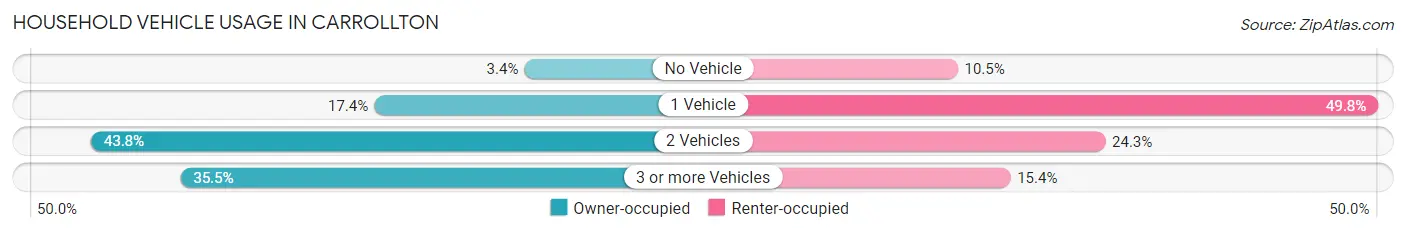
| Vehicles per Household | Owner-occupied | Renter-occupied |
| No Vehicle | 124 (3.4%) | 624 (10.5%) |
| 1 Vehicle | 641 (17.4%) | 2,955 (49.8%) |
| 2 Vehicles | 1,616 (43.8%) | 1,442 (24.3%) |
| 3 or more Vehicles | 1,308 (35.5%) | 916 (15.4%) |
| Total | 3,689 (100.0%) | 5,937 (100.0%) |
Real Estate & Mortgages in Carrollton
Real Estate and Mortgage Overview in Carrollton
| Characteristic | Without Mortgage | With Mortgage |
| Housing Units | 1,606 | 2,083 |
| Median Property Value | $258,200 | $261,000 |
| Median Household Income | $97,574 | $691 |
| Monthly Housing Costs | $554 | $174 |
| Real Estate Taxes | $1,379 | $0 |
Property Value by Mortgage Status in Carrollton
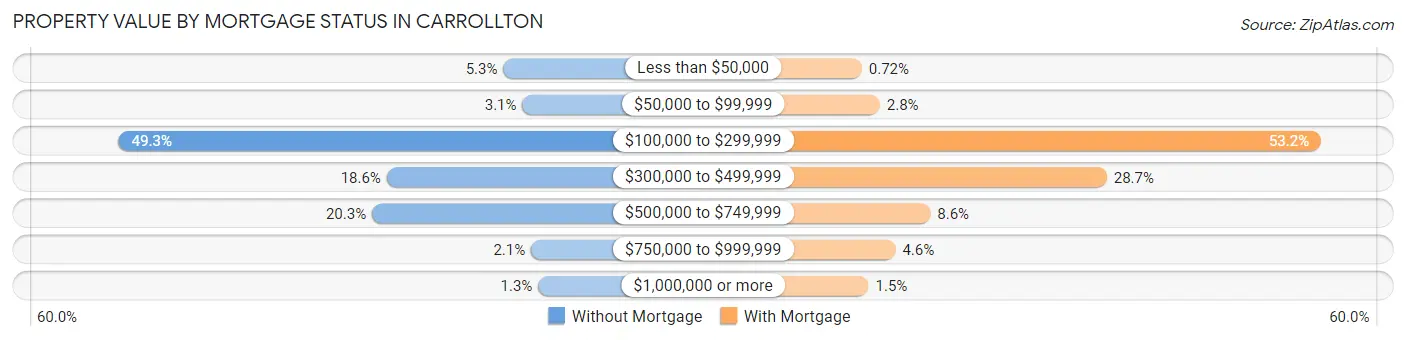
| Property Value | Without Mortgage | With Mortgage |
| Less than $50,000 | 85 (5.3%) | 15 (0.7%) |
| $50,000 to $99,999 | 50 (3.1%) | 58 (2.8%) |
| $100,000 to $299,999 | 791 (49.2%) | 1,108 (53.2%) |
| $300,000 to $499,999 | 299 (18.6%) | 598 (28.7%) |
| $500,000 to $749,999 | 326 (20.3%) | 178 (8.6%) |
| $750,000 to $999,999 | 34 (2.1%) | 95 (4.6%) |
| $1,000,000 or more | 21 (1.3%) | 31 (1.5%) |
| Total | 1,606 (100.0%) | 2,083 (100.0%) |
Household Income by Mortgage Status in Carrollton
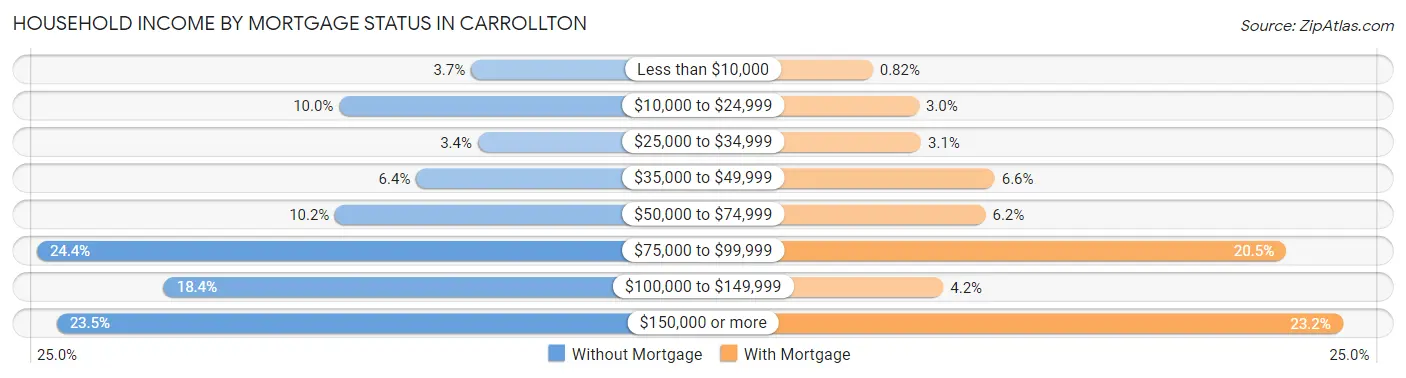
| Household Income | Without Mortgage | With Mortgage |
| Less than $10,000 | 60 (3.7%) | 17 (0.8%) |
| $10,000 to $24,999 | 161 (10.0%) | 63 (3.0%) |
| $25,000 to $34,999 | 55 (3.4%) | 65 (3.1%) |
| $35,000 to $49,999 | 102 (6.4%) | 138 (6.6%) |
| $50,000 to $74,999 | 164 (10.2%) | 129 (6.2%) |
| $75,000 to $99,999 | 392 (24.4%) | 427 (20.5%) |
| $100,000 to $149,999 | 295 (18.4%) | 87 (4.2%) |
| $150,000 or more | 377 (23.5%) | 483 (23.2%) |
| Total | 1,606 (100.0%) | 2,083 (100.0%) |
Property Value to Household Income Ratio in Carrollton
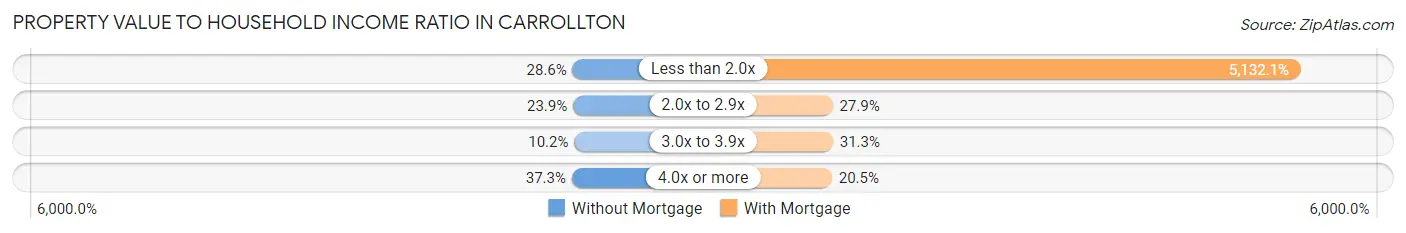
| Value-to-Income Ratio | Without Mortgage | With Mortgage |
| Less than 2.0x | 460 (28.6%) | 106,902 (5,132.1%) |
| 2.0x to 2.9x | 383 (23.8%) | 581 (27.9%) |
| 3.0x to 3.9x | 164 (10.2%) | 652 (31.3%) |
| 4.0x or more | 599 (37.3%) | 426 (20.4%) |
| Total | 1,606 (100.0%) | 2,083 (100.0%) |
Real Estate Taxes by Mortgage Status in Carrollton
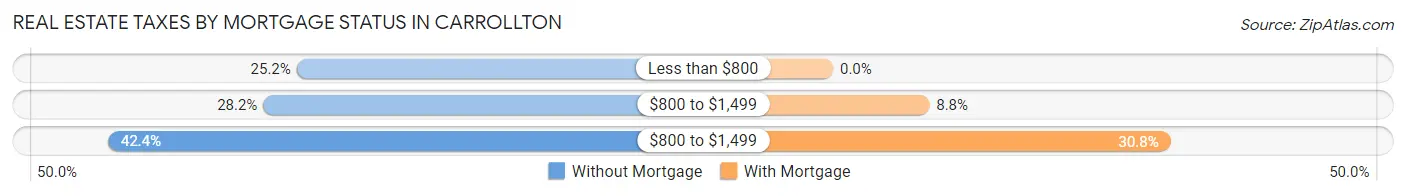
| Property Taxes | Without Mortgage | With Mortgage |
| Less than $800 | 404 (25.2%) | 0 (0.0%) |
| $800 to $1,499 | 453 (28.2%) | 183 (8.8%) |
| $800 to $1,499 | 681 (42.4%) | 642 (30.8%) |
| Total | 1,606 (100.0%) | 2,083 (100.0%) |
Health & Disability in Carrollton
Health Insurance Coverage by Age in Carrollton
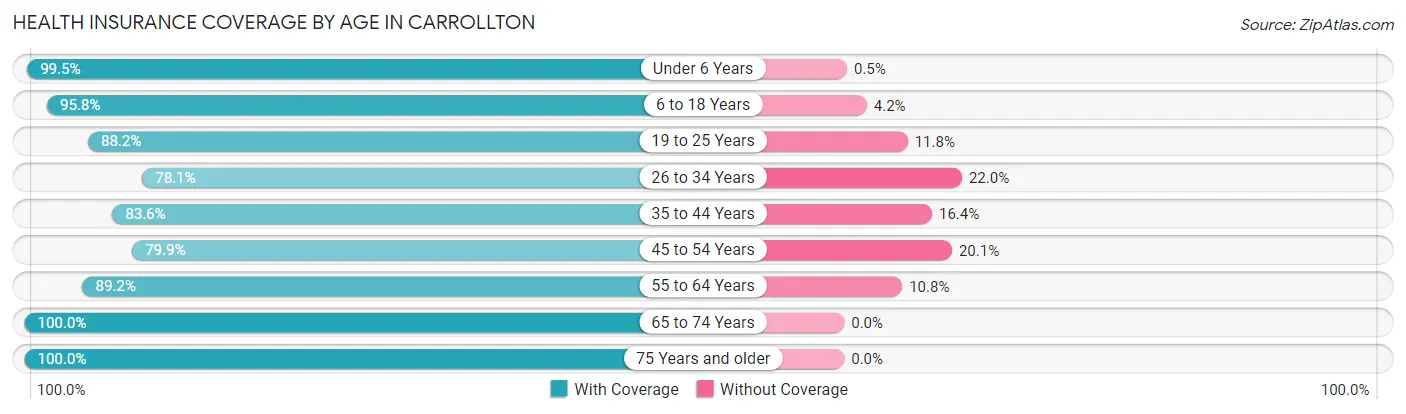
| Age Bracket | With Coverage | Without Coverage |
| Under 6 Years | 2,180 (99.5%) | 11 (0.5%) |
| 6 to 18 Years | 3,560 (95.8%) | 156 (4.2%) |
| 19 to 25 Years | 5,619 (88.2%) | 754 (11.8%) |
| 26 to 34 Years | 2,475 (78.0%) | 696 (22.0%) |
| 35 to 44 Years | 2,335 (83.6%) | 457 (16.4%) |
| 45 to 54 Years | 2,125 (79.9%) | 534 (20.1%) |
| 55 to 64 Years | 1,650 (89.2%) | 200 (10.8%) |
| 65 to 74 Years | 1,931 (100.0%) | 0 (0.0%) |
| 75 Years and older | 1,167 (100.0%) | 0 (0.0%) |
| Total | 23,042 (89.1%) | 2,808 (10.9%) |
Health Insurance Coverage by Citizenship Status in Carrollton
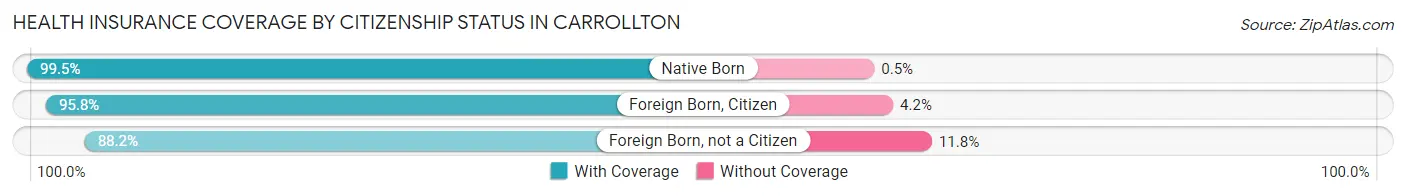
| Citizenship Status | With Coverage | Without Coverage |
| Native Born | 2,180 (99.5%) | 11 (0.5%) |
| Foreign Born, Citizen | 3,560 (95.8%) | 156 (4.2%) |
| Foreign Born, not a Citizen | 5,619 (88.2%) | 754 (11.8%) |
Health Insurance Coverage by Household Income in Carrollton
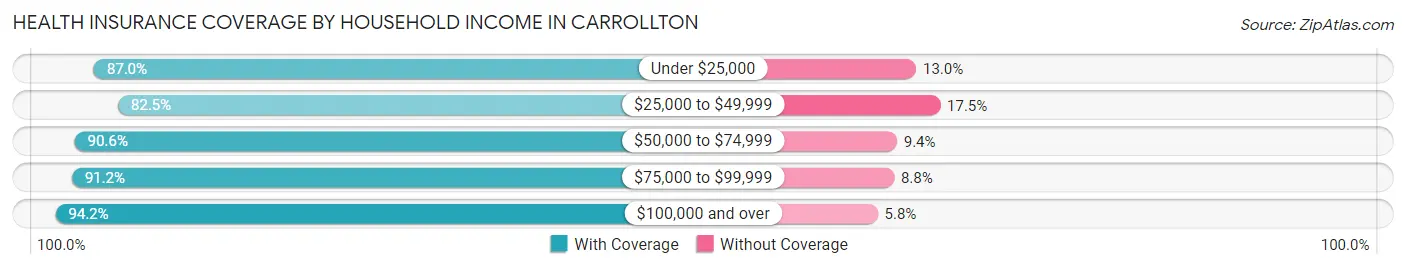
| Household Income | With Coverage | Without Coverage |
| Under $25,000 | 4,969 (87.0%) | 741 (13.0%) |
| $25,000 to $49,999 | 4,598 (82.5%) | 974 (17.5%) |
| $50,000 to $74,999 | 2,729 (90.6%) | 282 (9.4%) |
| $75,000 to $99,999 | 1,684 (91.2%) | 163 (8.8%) |
| $100,000 and over | 7,139 (94.2%) | 437 (5.8%) |
Public vs Private Health Insurance Coverage by Age in Carrollton
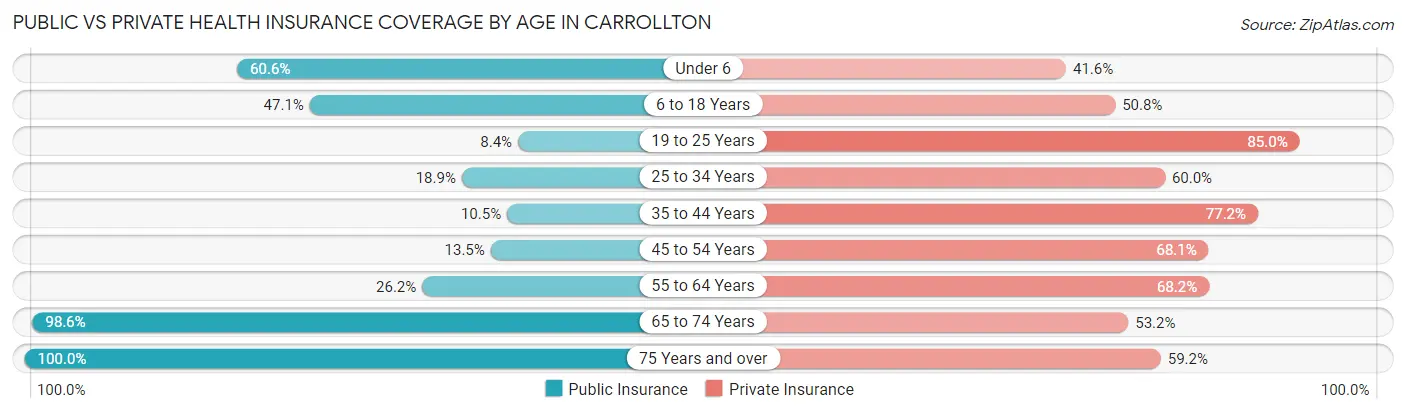
| Age Bracket | Public Insurance | Private Insurance |
| Under 6 | 1,327 (60.6%) | 912 (41.6%) |
| 6 to 18 Years | 1,750 (47.1%) | 1,886 (50.7%) |
| 19 to 25 Years | 537 (8.4%) | 5,414 (85.0%) |
| 25 to 34 Years | 598 (18.9%) | 1,902 (60.0%) |
| 35 to 44 Years | 292 (10.5%) | 2,156 (77.2%) |
| 45 to 54 Years | 359 (13.5%) | 1,810 (68.1%) |
| 55 to 64 Years | 485 (26.2%) | 1,261 (68.2%) |
| 65 to 74 Years | 1,903 (98.6%) | 1,027 (53.2%) |
| 75 Years and over | 1,167 (100.0%) | 691 (59.2%) |
| Total | 8,418 (32.6%) | 17,059 (66.0%) |
Disability Status by Sex by Age in Carrollton
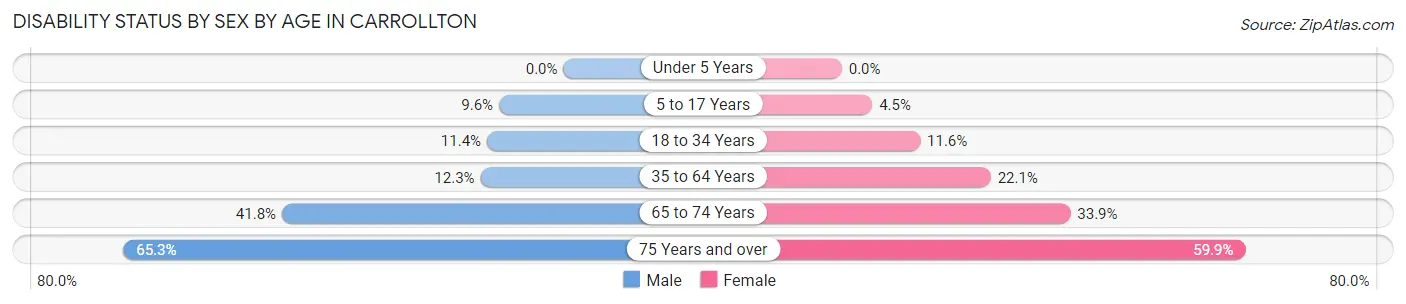
| Age Bracket | Male | Female |
| Under 5 Years | 0 (0.0%) | 0 (0.0%) |
| 5 to 17 Years | 138 (9.6%) | 88 (4.5%) |
| 18 to 34 Years | 550 (11.4%) | 629 (11.6%) |
| 35 to 64 Years | 396 (12.3%) | 904 (22.1%) |
| 65 to 74 Years | 323 (41.8%) | 393 (33.9%) |
| 75 Years and over | 262 (65.3%) | 459 (59.9%) |
Disability Class by Sex by Age in Carrollton
Disability Class: Hearing Difficulty
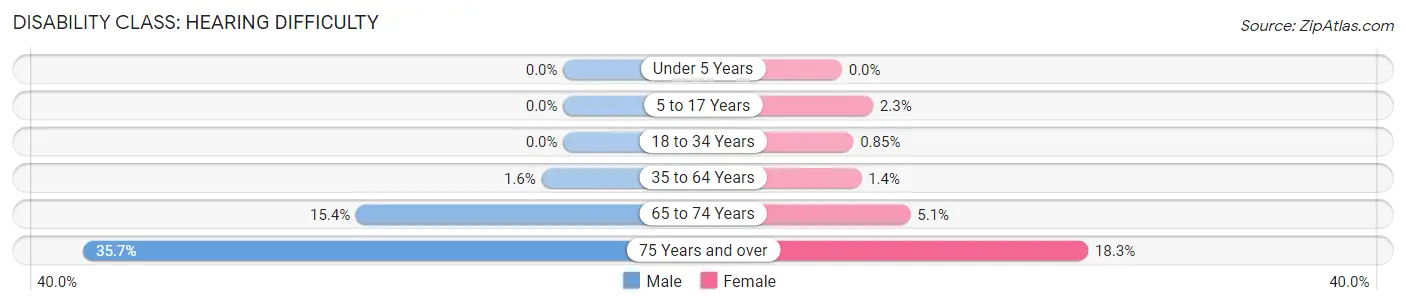
| Age Bracket | Male | Female |
| Under 5 Years | 0 (0.0%) | 0 (0.0%) |
| 5 to 17 Years | 0 (0.0%) | 45 (2.3%) |
| 18 to 34 Years | 0 (0.0%) | 46 (0.9%) |
| 35 to 64 Years | 52 (1.6%) | 59 (1.4%) |
| 65 to 74 Years | 119 (15.4%) | 59 (5.1%) |
| 75 Years and over | 143 (35.7%) | 140 (18.3%) |
Disability Class: Vision Difficulty
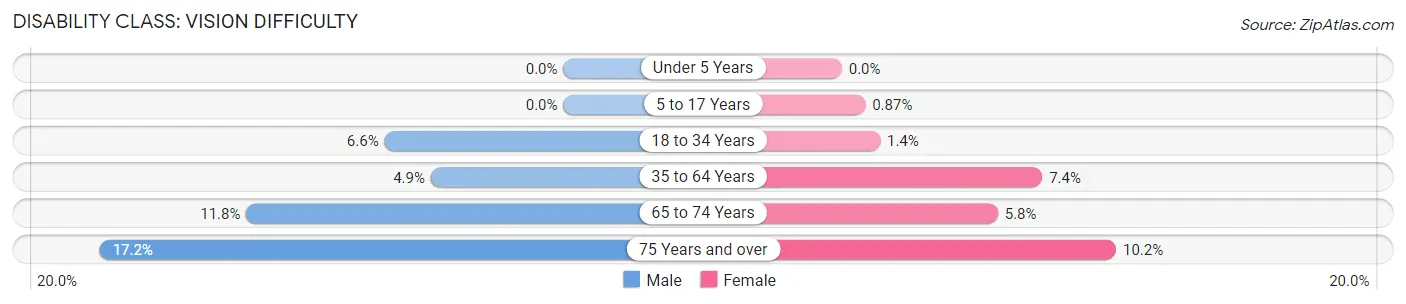
| Age Bracket | Male | Female |
| Under 5 Years | 0 (0.0%) | 0 (0.0%) |
| 5 to 17 Years | 0 (0.0%) | 17 (0.9%) |
| 18 to 34 Years | 322 (6.6%) | 77 (1.4%) |
| 35 to 64 Years | 158 (4.9%) | 304 (7.4%) |
| 65 to 74 Years | 91 (11.8%) | 67 (5.8%) |
| 75 Years and over | 69 (17.2%) | 78 (10.2%) |
Disability Class: Cognitive Difficulty
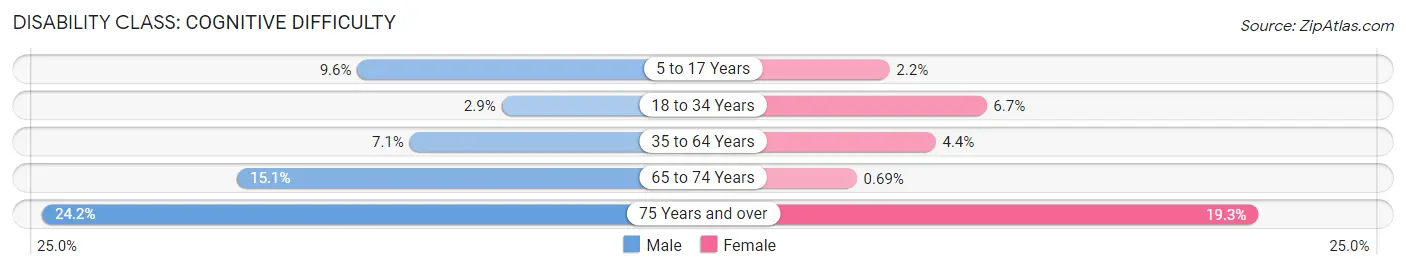
| Age Bracket | Male | Female |
| 5 to 17 Years | 138 (9.6%) | 43 (2.2%) |
| 18 to 34 Years | 139 (2.9%) | 363 (6.7%) |
| 35 to 64 Years | 229 (7.1%) | 178 (4.3%) |
| 65 to 74 Years | 117 (15.1%) | 8 (0.7%) |
| 75 Years and over | 97 (24.2%) | 148 (19.3%) |
Disability Class: Ambulatory Difficulty
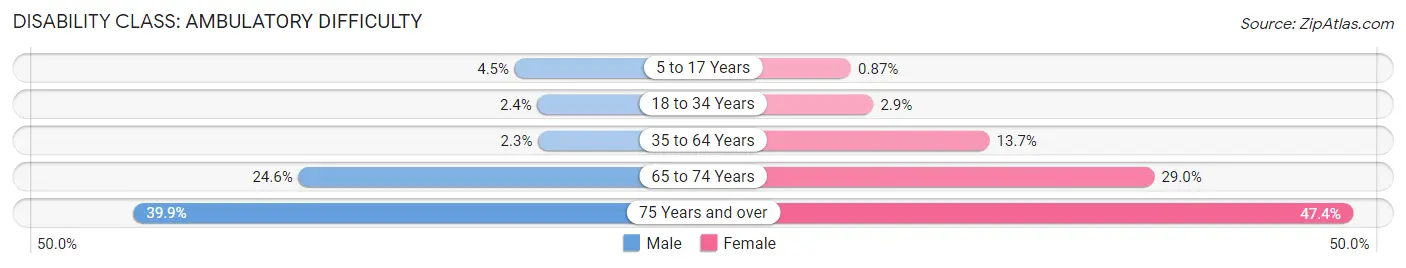
| Age Bracket | Male | Female |
| 5 to 17 Years | 65 (4.5%) | 17 (0.9%) |
| 18 to 34 Years | 116 (2.4%) | 159 (2.9%) |
| 35 to 64 Years | 75 (2.3%) | 561 (13.7%) |
| 65 to 74 Years | 190 (24.6%) | 336 (29.0%) |
| 75 Years and over | 160 (39.9%) | 363 (47.4%) |
Disability Class: Self-Care Difficulty
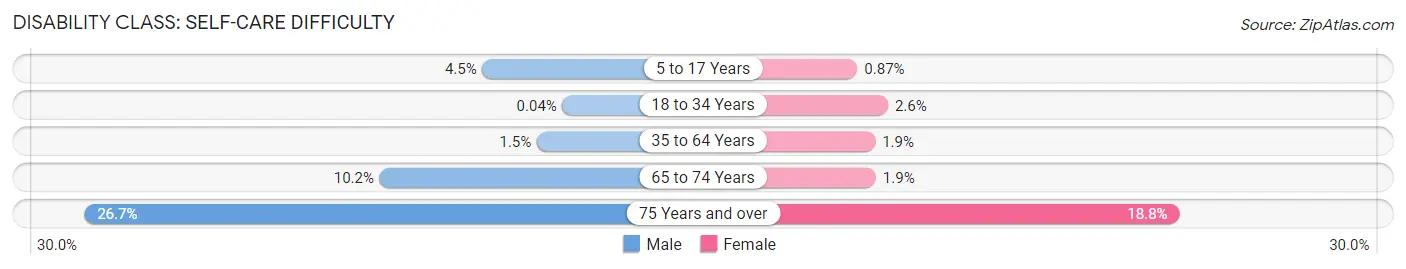
| Age Bracket | Male | Female |
| 5 to 17 Years | 65 (4.5%) | 17 (0.9%) |
| 18 to 34 Years | 2 (0.0%) | 139 (2.6%) |
| 35 to 64 Years | 47 (1.5%) | 76 (1.9%) |
| 65 to 74 Years | 79 (10.2%) | 22 (1.9%) |
| 75 Years and over | 107 (26.7%) | 144 (18.8%) |
Technology Access in Carrollton
Computing Device Access in Carrollton
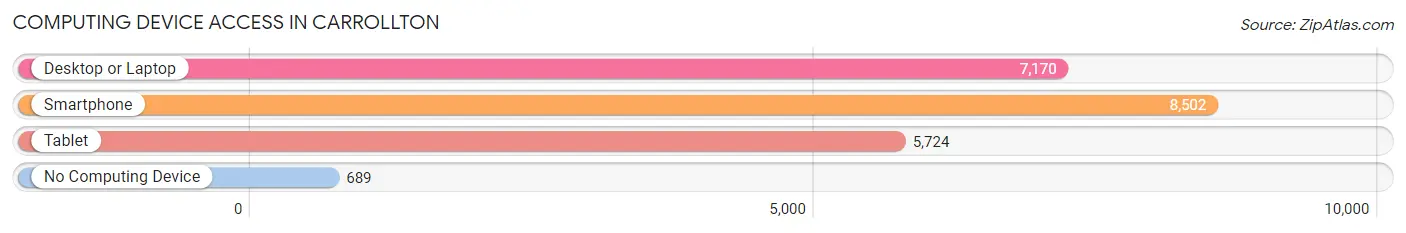
| Device Type | # Households | % Households |
| Desktop or Laptop | 7,170 | 74.5% |
| Smartphone | 8,502 | 88.3% |
| Tablet | 5,724 | 59.5% |
| No Computing Device | 689 | 7.2% |
| Total | 9,626 | 100.0% |
Internet Access in Carrollton
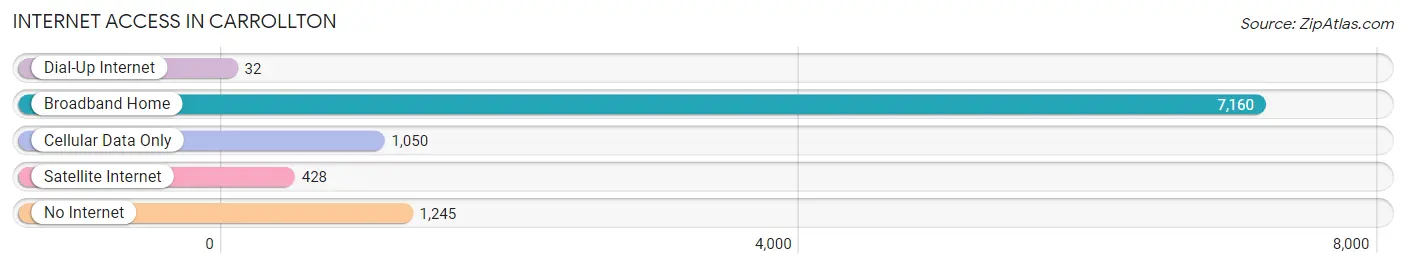
| Internet Type | # Households | % Households |
| Dial-Up Internet | 32 | 0.3% |
| Broadband Home | 7,160 | 74.4% |
| Cellular Data Only | 1,050 | 10.9% |
| Satellite Internet | 428 | 4.4% |
| No Internet | 1,245 | 12.9% |
| Total | 9,626 | 100.0% |
Carrollton Summary
Carrollton, Georgia is a city located in the western part of the state, in the foothills of the Appalachian Mountains. It is the county seat of Carroll County and is part of the Atlanta metropolitan area. The city has a population of approximately 24,000 people and is known for its historic downtown area, which is home to a variety of shops, restaurants, and other attractions.
History
Carrollton was founded in 1826 and named after Charles Carroll of Carrollton, the last surviving signer of the Declaration of Independence. The city was originally a trading post and was the site of a major battle during the Civil War. After the war, the city experienced a period of growth and development, becoming a major center for cotton production and other agricultural activities.
In the late 19th century, the city was home to a number of prominent businesses, including a cotton mill, a flour mill, and a furniture factory. The city also became a major railroad hub, with several lines running through the city.
In the early 20th century, the city experienced a period of decline, as the railroad industry began to decline and the cotton industry moved away. However, the city has since experienced a resurgence, with a number of new businesses and attractions opening in the downtown area.
Geography
Carrollton is located in the western part of Georgia, in the foothills of the Appalachian Mountains. The city is situated on the banks of the Chattahoochee River, which forms the border between Georgia and Alabama. The city is located approximately 50 miles west of Atlanta and is part of the Atlanta metropolitan area.
The city has a total area of 10.3 square miles, of which 10.2 square miles is land and 0.1 square miles is water. The city is located at an elevation of 830 feet above sea level.
Economy
The economy of Carrollton is largely based on agriculture and manufacturing. The city is home to a number of agricultural businesses, including a number of farms and nurseries. The city is also home to a number of manufacturing businesses, including a furniture factory and a number of other industrial businesses.
The city is also home to a number of retail businesses, including a number of shops and restaurants in the downtown area. The city is also home to a number of medical facilities, including a hospital and a number of medical offices.
Demographics
As of the 2010 census, the population of Carrollton was 24,388. The racial makeup of the city was 75.3% White, 19.2% African American, 0.3% Native American, 1.2% Asian, 0.1% Pacific Islander, 2.2% from other races, and 1.9% from two or more races. Hispanic or Latino of any race were 4.7% of the population.
The median income for a household in the city was $37,945, and the median income for a family was $45,945. The per capita income for the city was $20,845. About 14.3% of families and 17.7% of the population were below the poverty line, including 25.2% of those under age 18 and 11.2% of those age 65 or over.
Common Questions
What is Per Capita Income in Carrollton?
Per Capita income in Carrollton is $30,143.
What is the Median Family Income in Carrollton?
Median Family Income in Carrollton is $70,290.
What is the Median Household income in Carrollton?
Median Household Income in Carrollton is $46,722.
What is Income or Wage Gap in Carrollton?
Income or Wage Gap in Carrollton is 41.5%.
Women in Carrollton earn 58.5 cents for every dollar earned by a man.
What is Family Income Deficit in Carrollton?
Family Income Deficit in Carrollton is $8,328.
Families that are below poverty line in Carrollton earn $8,328 less on average than the poverty threshold level.
What is Inequality or Gini Index in Carrollton?
Inequality or Gini Index in Carrollton is 0.54.
What is the Total Population of Carrollton?
Total Population of Carrollton is 26,622.
What is the Total Male Population of Carrollton?
Total Male Population of Carrollton is 12,171.
What is the Total Female Population of Carrollton?
Total Female Population of Carrollton is 14,451.
What is the Ratio of Males per 100 Females in Carrollton?
There are 84.22 Males per 100 Females in Carrollton.
What is the Ratio of Females per 100 Males in Carrollton?
There are 118.73 Females per 100 Males in Carrollton.
What is the Median Population Age in Carrollton?
Median Population Age in Carrollton is 27.5 Years.
What is the Average Family Size in Carrollton
Average Family Size in Carrollton is 2.9 People.
What is the Average Household Size in Carrollton
Average Household Size in Carrollton is 2.5 People.
How Large is the Labor Force in Carrollton?
There are 13,473 People in the Labor Forcein in Carrollton.
What is the Percentage of People in the Labor Force in Carrollton?
61.1% of People are in the Labor Force in Carrollton.
What is the Unemployment Rate in Carrollton?
Unemployment Rate in Carrollton is 5.8%.