Newton, GA Map & Demographics
Newton Map
Newton Overview
$23,152
PER CAPITA INCOME
$53,654
AVG FAMILY INCOME
$31,406
AVG HOUSEHOLD INCOME
0.56
INEQUALITY / GINI INDEX
504
TOTAL POPULATION
239
MALE POPULATION
265
FEMALE POPULATION
90.19
MALES / 100 FEMALES
110.88
FEMALES / 100 MALES
41.0
MEDIAN AGE
3.1
AVG FAMILY SIZE
2.5
AVG HOUSEHOLD SIZE
187
LABOR FORCE [ PEOPLE ]
48.7%
PERCENT IN LABOR FORCE
2.7%
UNEMPLOYMENT RATE
Newton Zip Codes
Newton Area Codes
Income in Newton
Income Overview in Newton
Per Capita Income in Newton is $23,152, while median incomes of families and households are $53,654 and $31,406 respectively.
| Characteristic | Number | Measure |
| Per Capita Income | 504 | $23,152 |
| Median Family Income | 132 | $53,654 |
| Mean Family Income | 132 | $71,264 |
| Median Household Income | 206 | $31,406 |
| Mean Household Income | 206 | $54,037 |
| Income Deficit | 132 | $0 |
| Wage / Income Gap (%) | 504 | 0.00% |
| Wage / Income Gap ($) | 504 | 100.00¢ per $1 |
| Gini / Inequality Index | 504 | 0.56 |
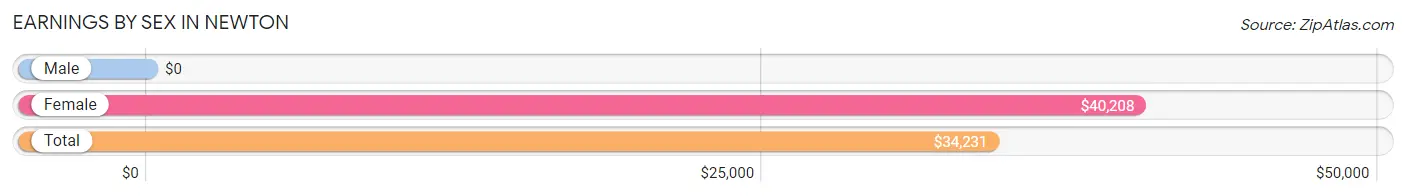
Earnings by Sex in Newton
| Sex | Number | Average Earnings |
| Male | 100 (49.5%) | $0 |
| Female | 102 (50.5%) | $40,208 |
| Total | 202 (100.0%) | $34,231 |
Earnings by Sex by Income Bracket in Newton
The most common earnings brackets in Newton are $2,499 or less for men (24 | 24.0%) and $45,000 to $49,999 for women (25 | 24.5%).

| Income | Male | Female |
| $2,499 or less | 24 (24.0%) | 0 (0.0%) |
| $2,500 to $4,999 | 10 (10.0%) | 0 (0.0%) |
| $5,000 to $7,499 | 0 (0.0%) | 6 (5.9%) |
| $7,500 to $9,999 | 0 (0.0%) | 0 (0.0%) |
| $10,000 to $12,499 | 0 (0.0%) | 0 (0.0%) |
| $12,500 to $14,999 | 10 (10.0%) | 0 (0.0%) |
| $15,000 to $17,499 | 0 (0.0%) | 6 (5.9%) |
| $17,500 to $19,999 | 0 (0.0%) | 5 (4.9%) |
| $20,000 to $22,499 | 0 (0.0%) | 0 (0.0%) |
| $22,500 to $24,999 | 0 (0.0%) | 16 (15.7%) |
| $25,000 to $29,999 | 0 (0.0%) | 15 (14.7%) |
| $30,000 to $34,999 | 13 (13.0%) | 0 (0.0%) |
| $35,000 to $39,999 | 10 (10.0%) | 2 (2.0%) |
| $40,000 to $44,999 | 0 (0.0%) | 12 (11.8%) |
| $45,000 to $49,999 | 0 (0.0%) | 25 (24.5%) |
| $50,000 to $54,999 | 19 (19.0%) | 0 (0.0%) |
| $55,000 to $64,999 | 9 (9.0%) | 0 (0.0%) |
| $65,000 to $74,999 | 0 (0.0%) | 5 (4.9%) |
| $75,000 to $99,999 | 0 (0.0%) | 10 (9.8%) |
| $100,000+ | 5 (5.0%) | 0 (0.0%) |
| Total | 100 (100.0%) | 102 (100.0%) |
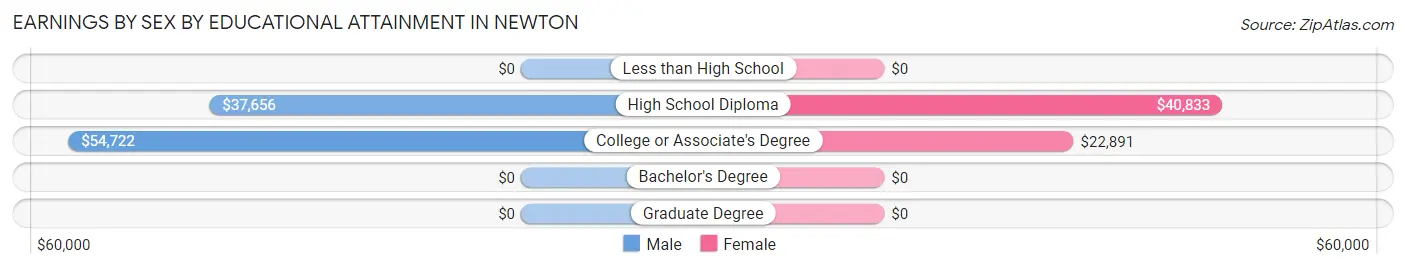
Earnings by Sex by Educational Attainment in Newton
Average earnings in Newton are $37,625 for men and $40,417 for women, a difference of 6.9%. Men with an educational attainment of college or associate's degree enjoy the highest average annual earnings of $54,722, while those with high school diploma education earn the least with $37,656. Women with an educational attainment of high school diploma earn the most with the average annual earnings of $40,833, while those with college or associate's degree education have the smallest earnings of $22,891.
| Educational Attainment | Male Income | Female Income |
| Less than High School | - | - |
| High School Diploma | $37,656 | $40,833 |
| College or Associate's Degree | $54,722 | $22,891 |
| Bachelor's Degree | - | - |
| Graduate Degree | - | - |
| Total | $37,625 | $40,417 |
Family Income in Newton
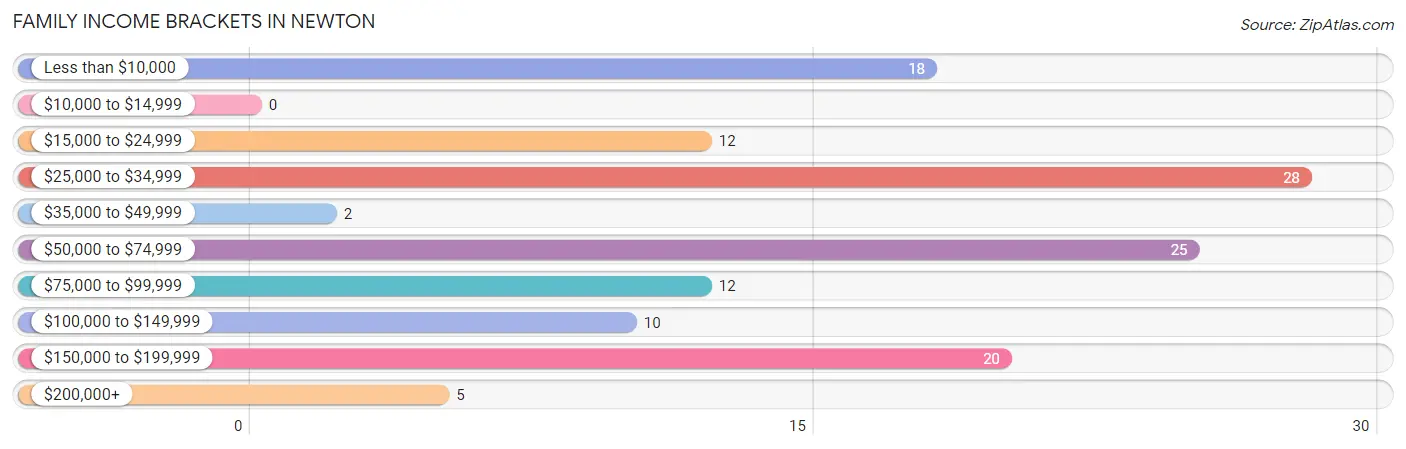
Family Income Brackets in Newton
According to the Newton family income data, there are 28 families falling into the $25,000 to $34,999 income range, which is the most common income bracket and makes up 21.2% of all families.
| Income Bracket | # Families | % Families |
| Less than $10,000 | 18 | 13.6% |
| $10,000 to $14,999 | 0 | 0.0% |
| $15,000 to $24,999 | 12 | 9.1% |
| $25,000 to $34,999 | 28 | 21.2% |
| $35,000 to $49,999 | 2 | 1.5% |
| $50,000 to $74,999 | 25 | 18.9% |
| $75,000 to $99,999 | 12 | 9.1% |
| $100,000 to $149,999 | 10 | 7.6% |
| $150,000 to $199,999 | 20 | 15.2% |
| $200,000+ | 5 | 3.8% |
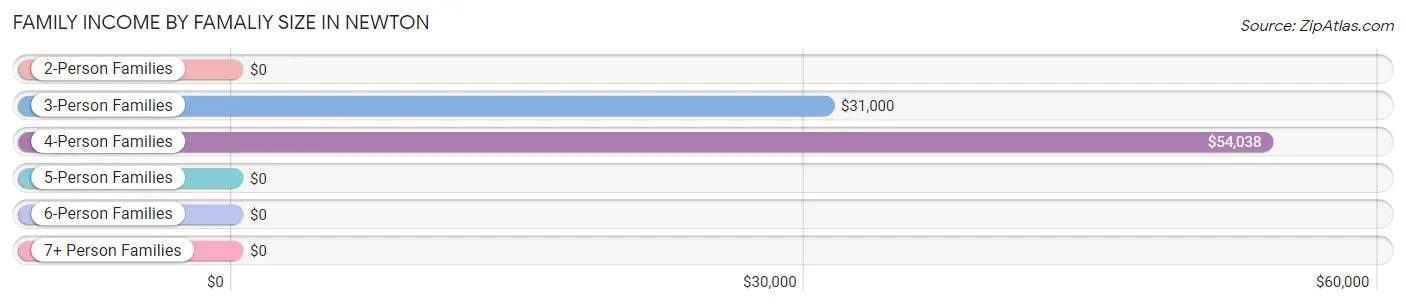
Family Income by Famaliy Size in Newton
4-person families (28 | 21.2%) account for the highest median family income in Newton with $54,038 per family, while 4-person families (28 | 21.2%) have the highest median income of $13,510 per family member.
| Income Bracket | # Families | Median Income |
| 2-Person Families | 83 (62.9%) | $0 |
| 3-Person Families | 8 (6.1%) | $31,000 |
| 4-Person Families | 28 (21.2%) | $54,038 |
| 5-Person Families | 11 (8.3%) | $0 |
| 6-Person Families | 2 (1.5%) | $0 |
| 7+ Person Families | 0 (0.0%) | $0 |
| Total | 132 (100.0%) | $53,654 |
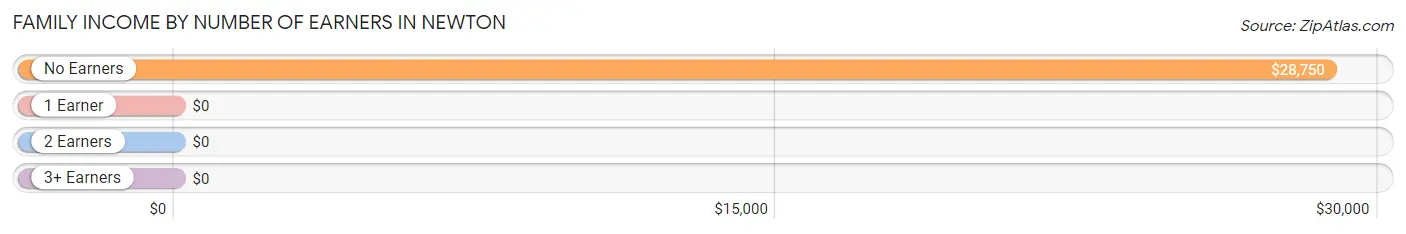
Family Income by Number of Earners in Newton
| Number of Earners | # Families | Median Income |
| No Earners | 40 (30.3%) | $28,750 |
| 1 Earner | 32 (24.2%) | $0 |
| 2 Earners | 51 (38.6%) | $0 |
| 3+ Earners | 9 (6.8%) | $0 |
| Total | 132 (100.0%) | $53,654 |
Household Income in Newton
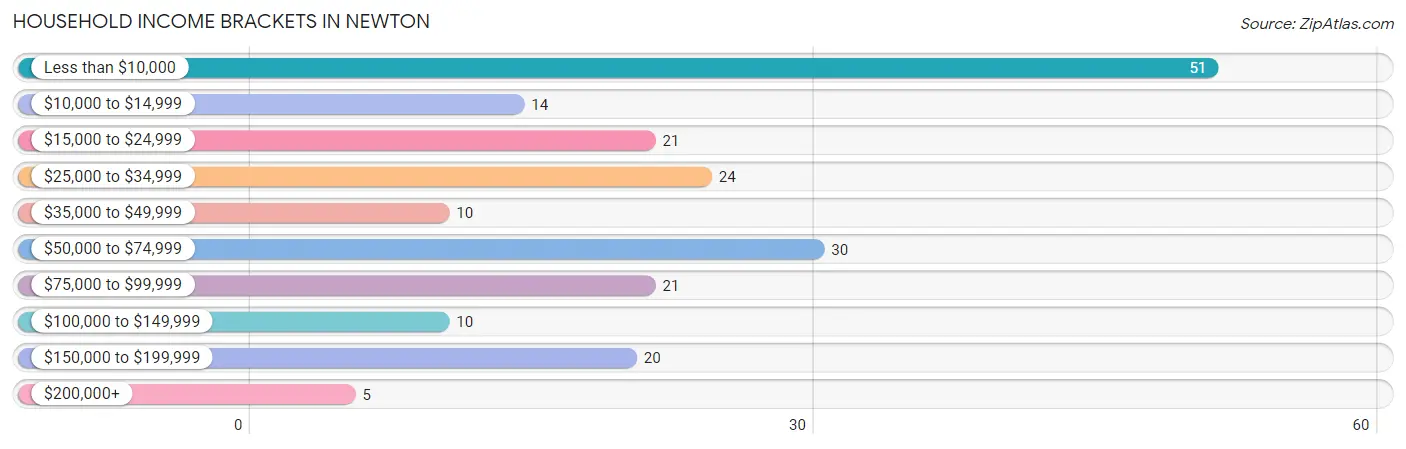
Household Income Brackets in Newton
With 51 households falling in the category, the less than $10,000 income range is the most frequent in Newton, accounting for 24.8% of all households. In contrast, only 5 households (2.4%) fall into the $200,000+ income bracket, making it the least populous group.
| Income Bracket | # Households | % Households |
| Less than $10,000 | 51 | 24.8% |
| $10,000 to $14,999 | 14 | 6.8% |
| $15,000 to $24,999 | 21 | 10.2% |
| $25,000 to $34,999 | 24 | 11.7% |
| $35,000 to $49,999 | 10 | 4.9% |
| $50,000 to $74,999 | 30 | 14.6% |
| $75,000 to $99,999 | 21 | 10.2% |
| $100,000 to $149,999 | 10 | 4.9% |
| $150,000 to $199,999 | 20 | 9.7% |
| $200,000+ | 5 | 2.4% |
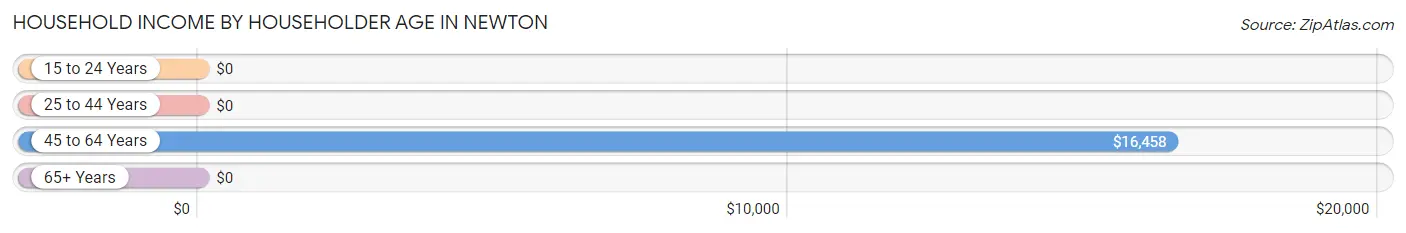
Household Income by Householder Age in Newton
The median household income in Newton is $31,406, with the highest median household income of $16,458 found in the 45 to 64 years age bracket for the primary householder. A total of 67 households (32.5%) fall into this category. Meanwhile, the 15 to 24 years age bracket for the primary householder has the lowest median household income of $0, with 2 households (1.0%) in this group.
| Income Bracket | # Households | Median Income |
| 15 to 24 Years | 2 (1.0%) | $0 |
| 25 to 44 Years | 55 (26.7%) | $0 |
| 45 to 64 Years | 67 (32.5%) | $16,458 |
| 65+ Years | 82 (39.8%) | $0 |
| Total | 206 (100.0%) | $31,406 |
Poverty in Newton
Income Below Poverty by Sex and Age in Newton
With 41.8% poverty level for males and 34.0% for females among the residents of Newton, 6 to 11 year old males and 5 year old females are the most vulnerable to poverty, with 31 males (100.0%) and 7 females (100.0%) in their respective age groups living below the poverty level.
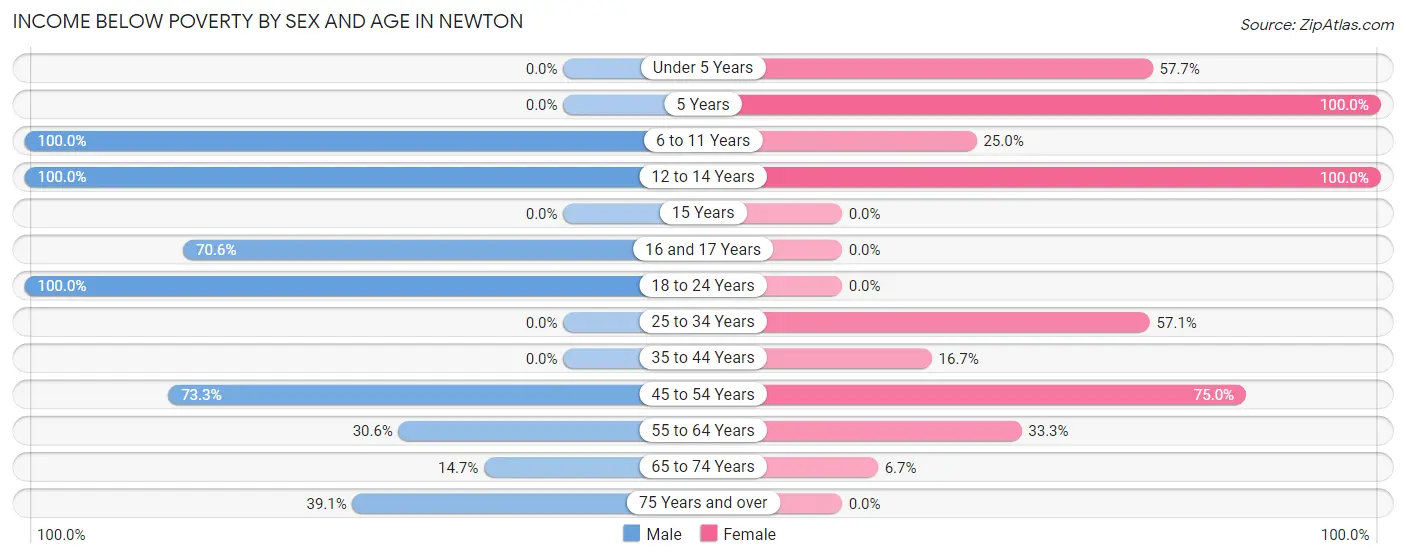
| Age Bracket | Male | Female |
| Under 5 Years | 0 (0.0%) | 15 (57.7%) |
| 5 Years | 0 (0.0%) | 7 (100.0%) |
| 6 to 11 Years | 31 (100.0%) | 7 (25.0%) |
| 12 to 14 Years | 6 (100.0%) | 7 (100.0%) |
| 15 Years | 0 (0.0%) | 0 (0.0%) |
| 16 and 17 Years | 12 (70.6%) | 0 (0.0%) |
| 18 to 24 Years | 15 (100.0%) | 0 (0.0%) |
| 25 to 34 Years | 0 (0.0%) | 24 (57.1%) |
| 35 to 44 Years | 0 (0.0%) | 5 (16.7%) |
| 45 to 54 Years | 11 (73.3%) | 6 (75.0%) |
| 55 to 64 Years | 11 (30.6%) | 16 (33.3%) |
| 65 to 74 Years | 5 (14.7%) | 3 (6.7%) |
| 75 Years and over | 9 (39.1%) | 0 (0.0%) |
| Total | 100 (41.8%) | 90 (34.0%) |
Income Above Poverty by Sex and Age in Newton
According to the poverty statistics in Newton, males aged under 5 years and females aged 18 to 24 years are the age groups that are most secure financially, with 100.0% of males and 100.0% of females in these age groups living above the poverty line.
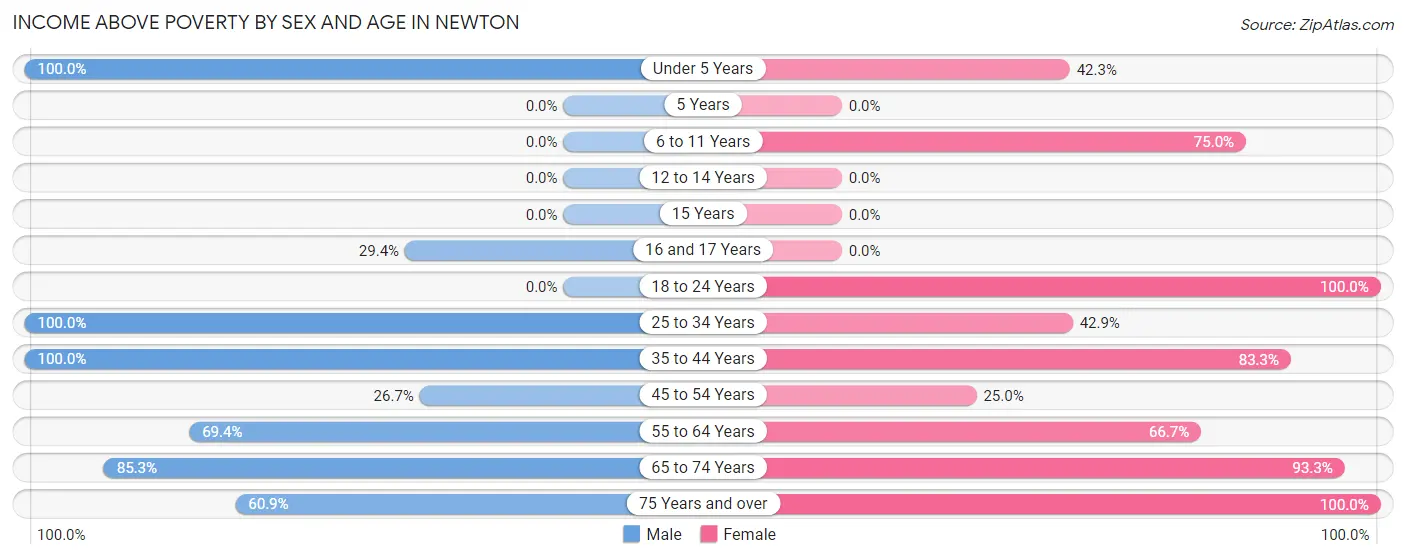
| Age Bracket | Male | Female |
| Under 5 Years | 15 (100.0%) | 11 (42.3%) |
| 5 Years | 0 (0.0%) | 0 (0.0%) |
| 6 to 11 Years | 0 (0.0%) | 21 (75.0%) |
| 12 to 14 Years | 0 (0.0%) | 0 (0.0%) |
| 15 Years | 0 (0.0%) | 0 (0.0%) |
| 16 and 17 Years | 5 (29.4%) | 0 (0.0%) |
| 18 to 24 Years | 0 (0.0%) | 2 (100.0%) |
| 25 to 34 Years | 8 (100.0%) | 18 (42.9%) |
| 35 to 44 Years | 39 (100.0%) | 25 (83.3%) |
| 45 to 54 Years | 4 (26.7%) | 2 (25.0%) |
| 55 to 64 Years | 25 (69.4%) | 32 (66.7%) |
| 65 to 74 Years | 29 (85.3%) | 42 (93.3%) |
| 75 Years and over | 14 (60.9%) | 22 (100.0%) |
| Total | 139 (58.2%) | 175 (66.0%) |
Income Below Poverty Among Married-Couple Families in Newton
The poverty statistics for married-couple families in Newton show that 3.4% or 2 of the total 59 families live below the poverty line. Families with 1 or 2 children have the highest poverty rate of 8.0%, comprising of 2 families. On the other hand, families with no children have the lowest poverty rate of 0.0%, which includes 0 families.
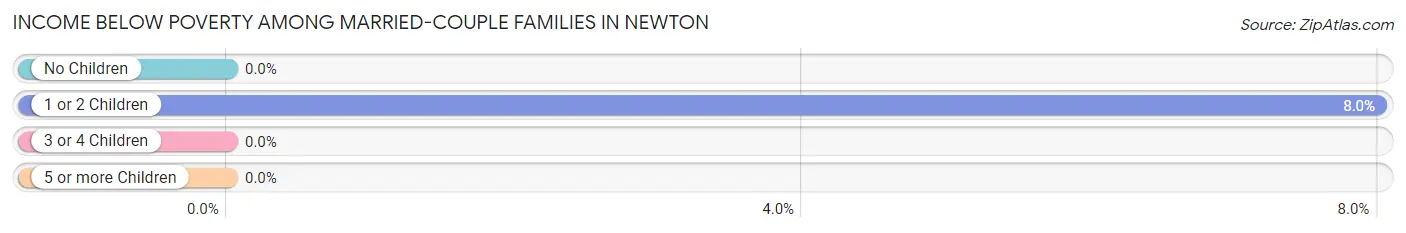
| Children | Above Poverty | Below Poverty |
| No Children | 34 (100.0%) | 0 (0.0%) |
| 1 or 2 Children | 23 (92.0%) | 2 (8.0%) |
| 3 or 4 Children | 0 (0.0%) | 0 (0.0%) |
| 5 or more Children | 0 (0.0%) | 0 (0.0%) |
| Total | 57 (96.6%) | 2 (3.4%) |
Income Below Poverty Among Single-Parent Households in Newton
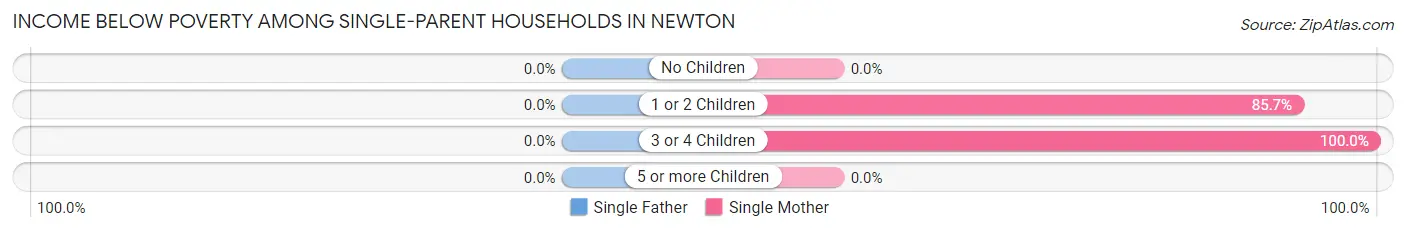
| Children | Single Father | Single Mother |
| No Children | 0 (0.0%) | 0 (0.0%) |
| 1 or 2 Children | 0 (0.0%) | 12 (85.7%) |
| 3 or 4 Children | 0 (0.0%) | 17 (100.0%) |
| 5 or more Children | 0 (0.0%) | 0 (0.0%) |
| Total | 0 (0.0%) | 29 (43.9%) |
Income Below Poverty Among Married-Couple vs Single-Parent Households in Newton
The poverty data for Newton shows that 2 of the married-couple family households (3.4%) and 29 of the single-parent households (39.7%) are living below the poverty level. Within the married-couple family households, those with 1 or 2 children have the highest poverty rate, with 2 households (8.0%) falling below the poverty line. Among the single-parent households, those with 3 or 4 children have the highest poverty rate, with 17 household (89.5%) living below poverty.
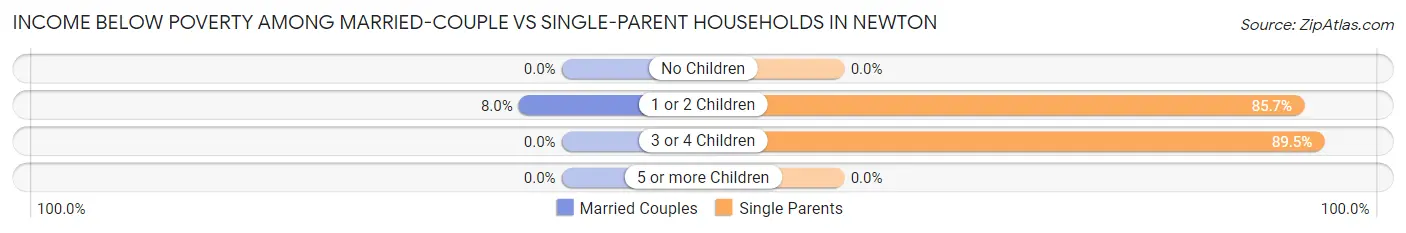
| Children | Married-Couple Families | Single-Parent Households |
| No Children | 0 (0.0%) | 0 (0.0%) |
| 1 or 2 Children | 2 (8.0%) | 12 (85.7%) |
| 3 or 4 Children | 0 (0.0%) | 17 (89.5%) |
| 5 or more Children | 0 (0.0%) | 0 (0.0%) |
| Total | 2 (3.4%) | 29 (39.7%) |
Race in Newton
The most populous races in Newton are White / Caucasian (295 | 58.5%), Black / African American (196 | 38.9%), and Asian (7 | 1.4%).
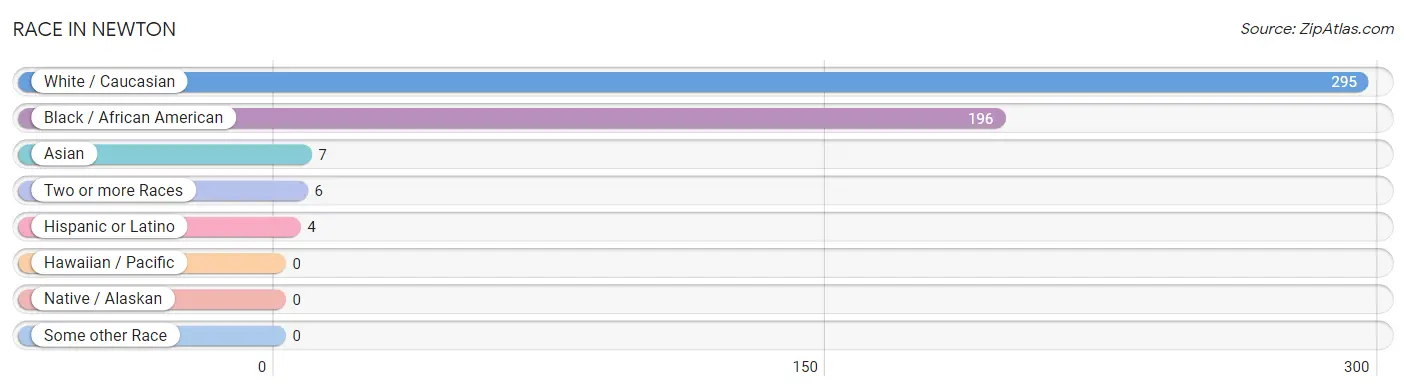
| Race | # Population | % Population |
| Asian | 7 | 1.4% |
| Black / African American | 196 | 38.9% |
| Hawaiian / Pacific | 0 | 0.0% |
| Hispanic or Latino | 4 | 0.8% |
| Native / Alaskan | 0 | 0.0% |
| White / Caucasian | 295 | 58.5% |
| Two or more Races | 6 | 1.2% |
| Some other Race | 0 | 0.0% |
| Total | 504 | 100.0% |
Ancestry in Newton
The most populous ancestries reported in Newton are German (48 | 9.5%), English (27 | 5.4%), American (14 | 2.8%), Korean (7 | 1.4%), and African (5 | 1.0%), together accounting for 20.0% of all Newton residents.
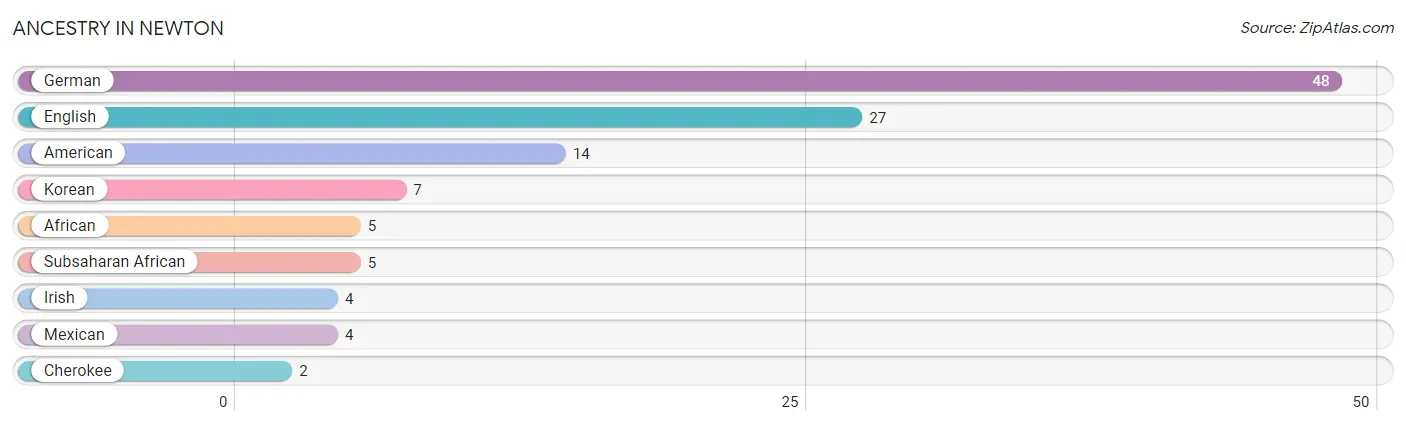
| Ancestry | # Population | % Population |
| African | 5 | 1.0% |
| American | 14 | 2.8% |
| Cherokee | 2 | 0.4% |
| English | 27 | 5.4% |
| German | 48 | 9.5% |
| Irish | 4 | 0.8% |
| Korean | 7 | 1.4% |
| Mexican | 4 | 0.8% |
| Subsaharan African | 5 | 1.0% | View All 9 Rows |
Immigrants in Newton
The most numerous immigrant groups reported in Newton came from Asia (2 | 0.4%), Philippines (2 | 0.4%), and South Eastern Asia (2 | 0.4%), together accounting for 1.2% of all Newton residents.
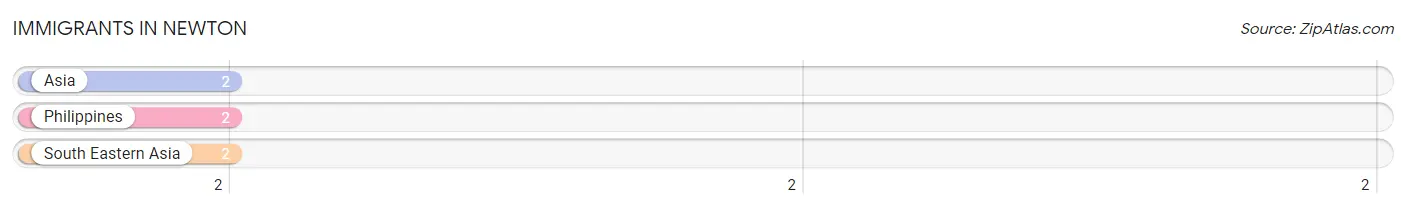
| Immigration Origin | # Population | % Population |
| Asia | 2 | 0.4% |
| Philippines | 2 | 0.4% |
| South Eastern Asia | 2 | 0.4% | View All 3 Rows |
Sex and Age in Newton
Sex and Age in Newton
The most populous age groups in Newton are 15 to 19 Years (32 | 13.4%) for men and 35 to 39 Years (30 | 11.3%) for women.
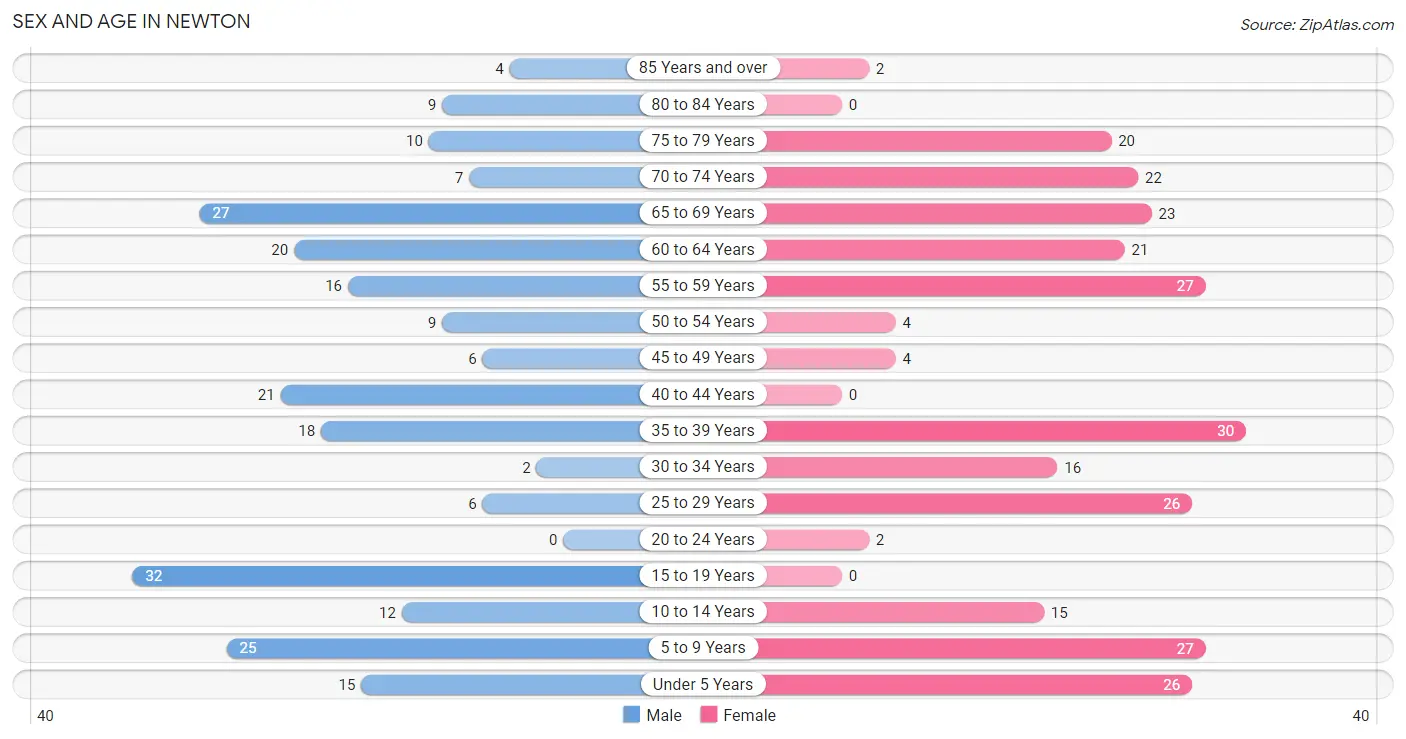
| Age Bracket | Male | Female |
| Under 5 Years | 15 (6.3%) | 26 (9.8%) |
| 5 to 9 Years | 25 (10.5%) | 27 (10.2%) |
| 10 to 14 Years | 12 (5.0%) | 15 (5.7%) |
| 15 to 19 Years | 32 (13.4%) | 0 (0.0%) |
| 20 to 24 Years | 0 (0.0%) | 2 (0.7%) |
| 25 to 29 Years | 6 (2.5%) | 26 (9.8%) |
| 30 to 34 Years | 2 (0.8%) | 16 (6.0%) |
| 35 to 39 Years | 18 (7.5%) | 30 (11.3%) |
| 40 to 44 Years | 21 (8.8%) | 0 (0.0%) |
| 45 to 49 Years | 6 (2.5%) | 4 (1.5%) |
| 50 to 54 Years | 9 (3.8%) | 4 (1.5%) |
| 55 to 59 Years | 16 (6.7%) | 27 (10.2%) |
| 60 to 64 Years | 20 (8.4%) | 21 (7.9%) |
| 65 to 69 Years | 27 (11.3%) | 23 (8.7%) |
| 70 to 74 Years | 7 (2.9%) | 22 (8.3%) |
| 75 to 79 Years | 10 (4.2%) | 20 (7.5%) |
| 80 to 84 Years | 9 (3.8%) | 0 (0.0%) |
| 85 Years and over | 4 (1.7%) | 2 (0.7%) |
| Total | 239 (100.0%) | 265 (100.0%) |
Families and Households in Newton
Median Family Size in Newton
The median family size in Newton is 3.08 persons per family, with single male/father families (7 | 5.3%) accounting for the largest median family size of 3.86 persons per family. On the other hand, single female/mother families (66 | 50.0%) represent the smallest median family size with 2.97 persons per family.
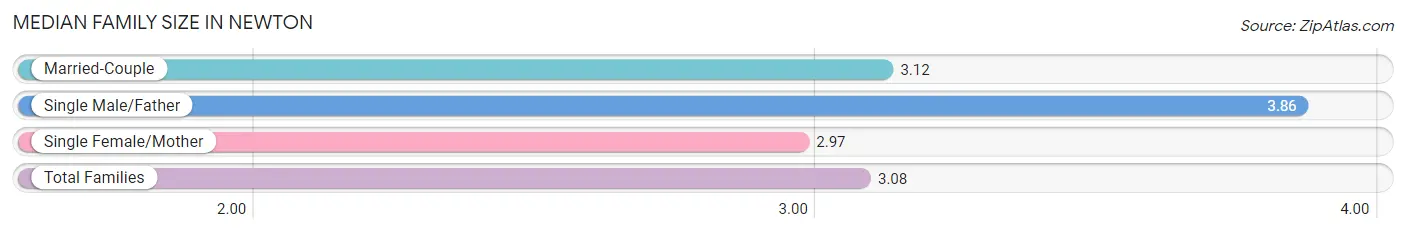
| Family Type | # Families | Family Size |
| Married-Couple | 59 (44.7%) | 3.12 |
| Single Male/Father | 7 (5.3%) | 3.86 |
| Single Female/Mother | 66 (50.0%) | 2.97 |
| Total Families | 132 (100.0%) | 3.08 |
Median Household Size in Newton
The median household size in Newton is 2.45 persons per household, with single male/father households (7 | 3.4%) accounting for the largest median household size of 3.86 persons per household. non-family households (74 | 35.9%) represent the smallest median household size with 1.19 persons per household.
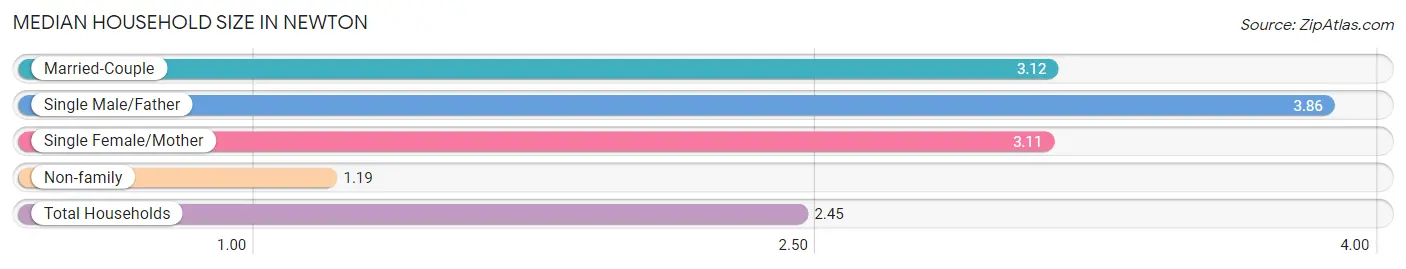
| Household Type | # Households | Household Size |
| Married-Couple | 59 (28.6%) | 3.12 |
| Single Male/Father | 7 (3.4%) | 3.86 |
| Single Female/Mother | 66 (32.0%) | 3.11 |
| Non-family | 74 (35.9%) | 1.19 |
| Total Households | 206 (100.0%) | 2.45 |
Household Size by Marriage Status in Newton
Out of a total of 206 households in Newton, 132 (64.1%) are family households, while 74 (35.9%) are nonfamily households. The most numerous type of family households are 2-person households, comprising 83, and the most common type of nonfamily households are 1-person households, comprising 60.
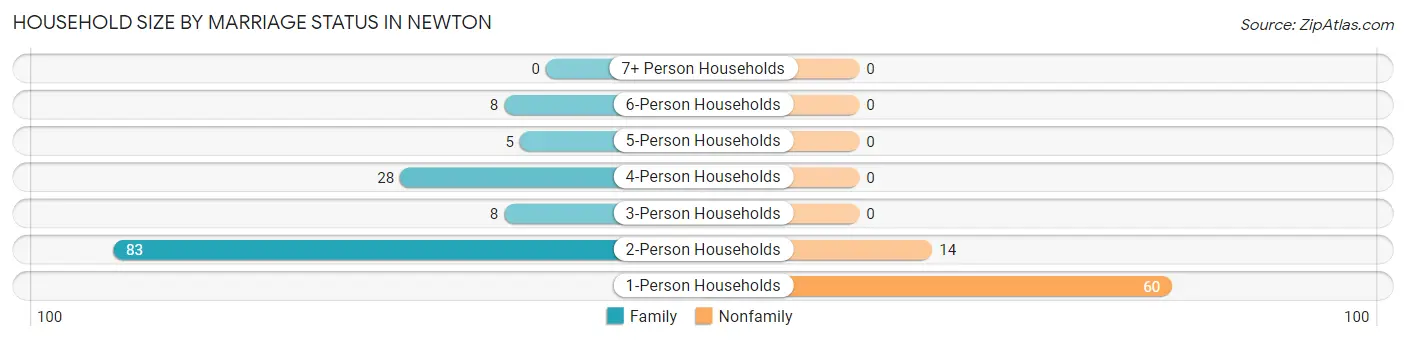
| Household Size | Family Households | Nonfamily Households |
| 1-Person Households | - | 60 (29.1%) |
| 2-Person Households | 83 (40.3%) | 14 (6.8%) |
| 3-Person Households | 8 (3.9%) | 0 (0.0%) |
| 4-Person Households | 28 (13.6%) | 0 (0.0%) |
| 5-Person Households | 5 (2.4%) | 0 (0.0%) |
| 6-Person Households | 8 (3.9%) | 0 (0.0%) |
| 7+ Person Households | 0 (0.0%) | 0 (0.0%) |
| Total | 132 (64.1%) | 74 (35.9%) |
Female Fertility in Newton
Fertility by Age in Newton
Average fertility rate in Newton is 50.0 births per 1,000 women. Women in the age bracket of 35 to 50 years have the highest fertility rate with 111.0 births per 1,000 women. Women in the age bracket of 35 to 50 years acount for 100.0% of all women with births.
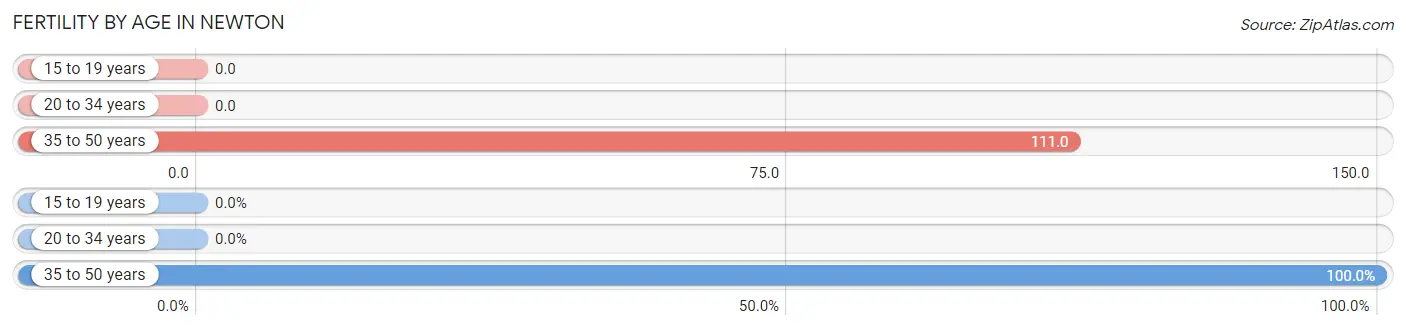
| Age Bracket | Women with Births | Births / 1,000 Women |
| 15 to 19 years | 0 (0.0%) | 0.0 |
| 20 to 34 years | 0 (0.0%) | 0.0 |
| 35 to 50 years | 4 (100.0%) | 111.0 |
| Total | 4 (100.0%) | 50.0 |
Fertility by Age by Marriage Status in Newton
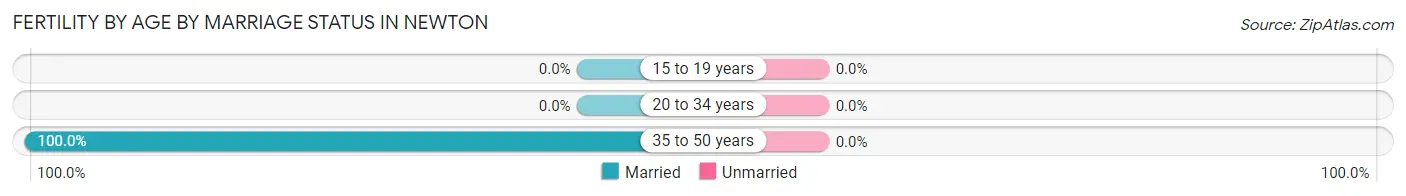
| Age Bracket | Married | Unmarried |
| 15 to 19 years | 0 (0.0%) | 0 (0.0%) |
| 20 to 34 years | 0 (0.0%) | 0 (0.0%) |
| 35 to 50 years | 4 (100.0%) | 0 (0.0%) |
| Total | 4 (100.0%) | 0 (0.0%) |
Fertility by Education in Newton
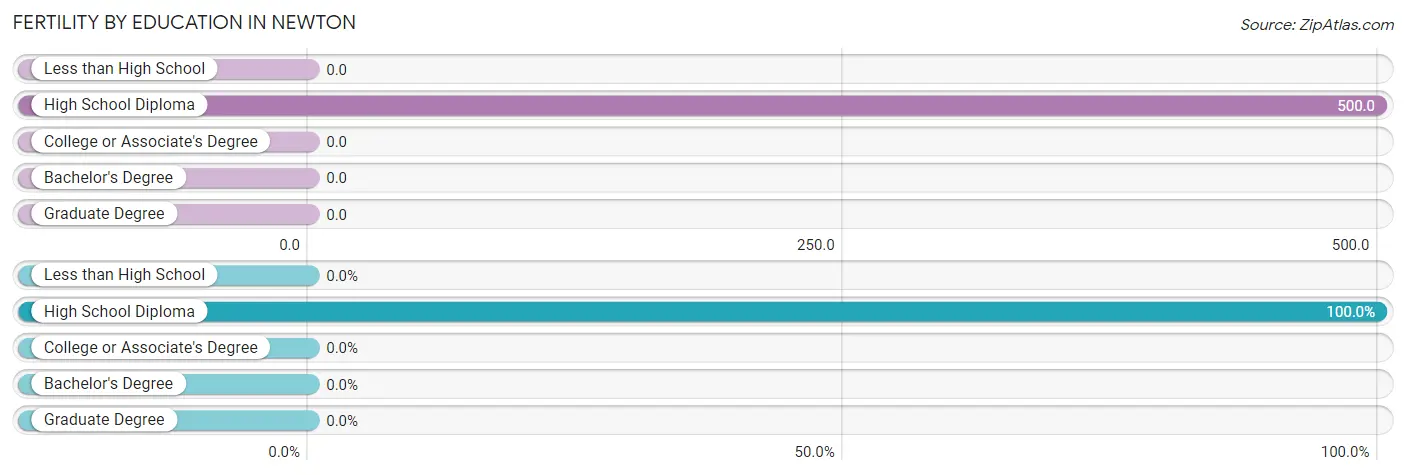
| Educational Attainment | Women with Births | Births / 1,000 Women |
| Less than High School | 0 (0.0%) | 0.0 |
| High School Diploma | 4 (100.0%) | 500.0 |
| College or Associate's Degree | 0 (0.0%) | 0.0 |
| Bachelor's Degree | 0 (0.0%) | 0.0 |
| Graduate Degree | 0 (0.0%) | 0.0 |
| Total | 4 (100.0%) | 50.0 |
Fertility by Education by Marriage Status in Newton
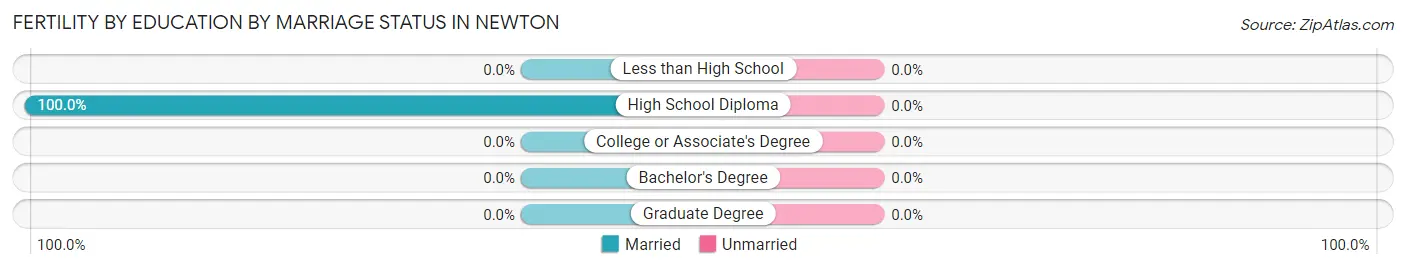
| Educational Attainment | Married | Unmarried |
| Less than High School | 0 (0.0%) | 0 (0.0%) |
| High School Diploma | 4 (100.0%) | 0 (0.0%) |
| College or Associate's Degree | 0 (0.0%) | 0 (0.0%) |
| Bachelor's Degree | 0 (0.0%) | 0 (0.0%) |
| Graduate Degree | 0 (0.0%) | 0 (0.0%) |
| Total | 4 (100.0%) | 0 (0.0%) |
Employment Characteristics in Newton
Employment by Class of Employer in Newton
Among the 174 employed individuals in Newton, private company employees (66 | 37.9%), not-for-profit organizations (51 | 29.3%), and local government employees (25 | 14.4%) make up the most common classes of employment.
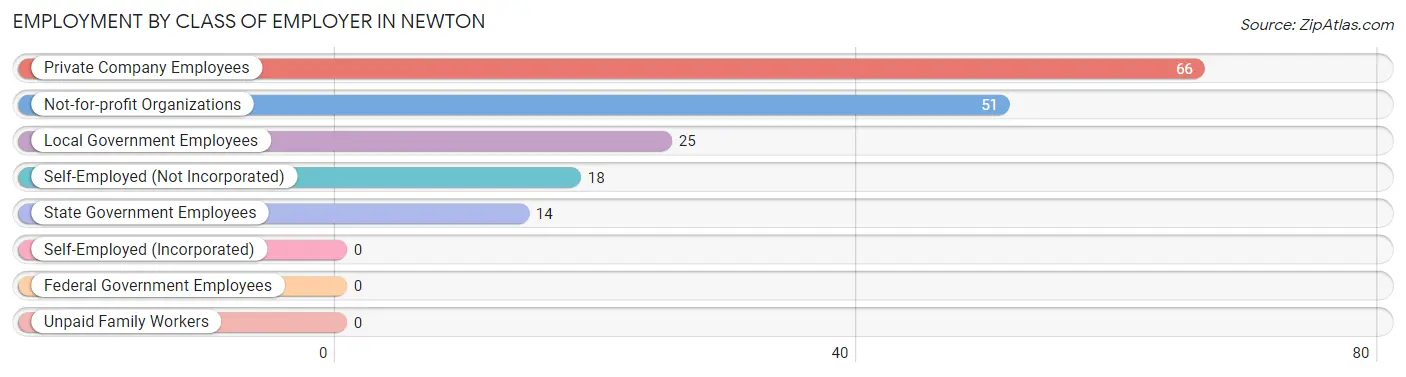
| Employer Class | # Employees | % Employees |
| Private Company Employees | 66 | 37.9% |
| Self-Employed (Incorporated) | 0 | 0.0% |
| Self-Employed (Not Incorporated) | 18 | 10.3% |
| Not-for-profit Organizations | 51 | 29.3% |
| Local Government Employees | 25 | 14.4% |
| State Government Employees | 14 | 8.1% |
| Federal Government Employees | 0 | 0.0% |
| Unpaid Family Workers | 0 | 0.0% |
| Total | 174 | 100.0% |
Employment Status by Age in Newton
According to the labor force statistics for Newton, out of the total population over 16 years of age (384), 48.7% or 187 individuals are in the labor force, with 2.7% or 5 of them unemployed. The age group with the highest labor force participation rate is 20 to 24 years, with 100.0% or 2 individuals in the labor force. Within the labor force, the 45 to 54 years age range has the highest percentage of unemployed individuals, with 55.6% or 5 of them being unemployed.
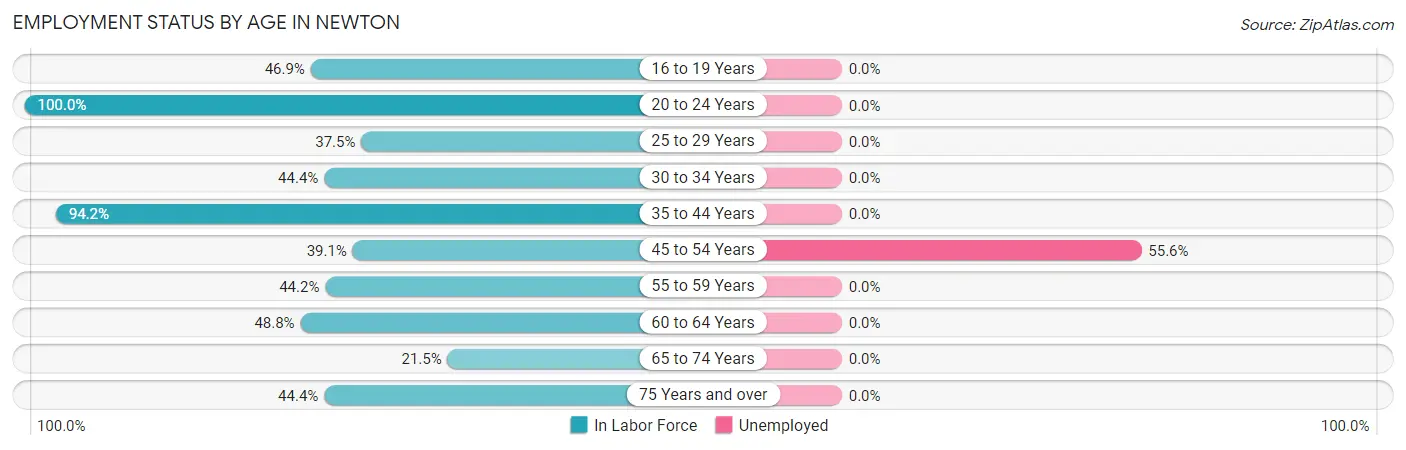
| Age Bracket | In Labor Force | Unemployed |
| 16 to 19 Years | 15 (46.9%) | 0 (0.0%) |
| 20 to 24 Years | 2 (100.0%) | 0 (0.0%) |
| 25 to 29 Years | 12 (37.5%) | 0 (0.0%) |
| 30 to 34 Years | 8 (44.4%) | 0 (0.0%) |
| 35 to 44 Years | 65 (94.2%) | 0 (0.0%) |
| 45 to 54 Years | 9 (39.1%) | 5 (55.6%) |
| 55 to 59 Years | 19 (44.2%) | 0 (0.0%) |
| 60 to 64 Years | 20 (48.8%) | 0 (0.0%) |
| 65 to 74 Years | 17 (21.5%) | 0 (0.0%) |
| 75 Years and over | 20 (44.4%) | 0 (0.0%) |
| Total | 187 (48.7%) | 5 (2.7%) |
Employment Status by Educational Attainment in Newton
According to labor force statistics for Newton, 58.8% of individuals (133) out of the total population between 25 and 64 years of age (226) are in the labor force, with 3.8% or 5 of them being unemployed. The group with the highest labor force participation rate are those with the educational attainment of bachelor's degree or higher, with 65.7% or 23 individuals in the labor force. Within the labor force, individuals with college / associate degree education have the highest percentage of unemployment, with 8.6% or 5 of them being unemployed.
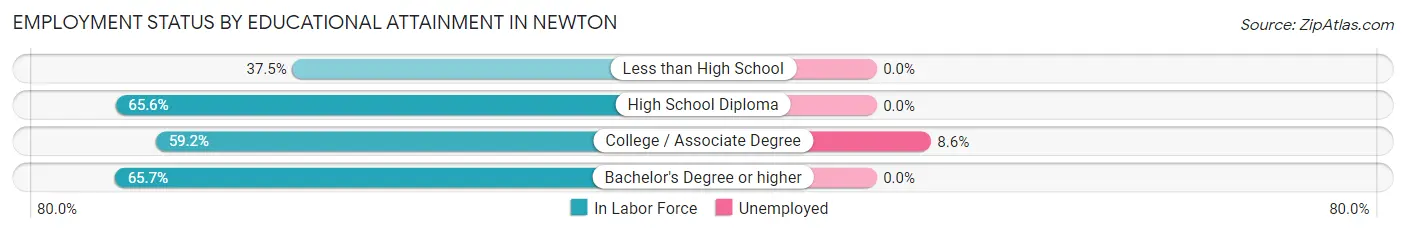
| Educational Attainment | In Labor Force | Unemployed |
| Less than High School | 12 (37.5%) | 0 (0.0%) |
| High School Diploma | 40 (65.6%) | 0 (0.0%) |
| College / Associate Degree | 58 (59.2%) | 8 (8.6%) |
| Bachelor's Degree or higher | 23 (65.7%) | 0 (0.0%) |
| Total | 133 (58.8%) | 9 (3.8%) |
Employment Occupations by Sex in Newton
Management, Business, Science and Arts Occupations
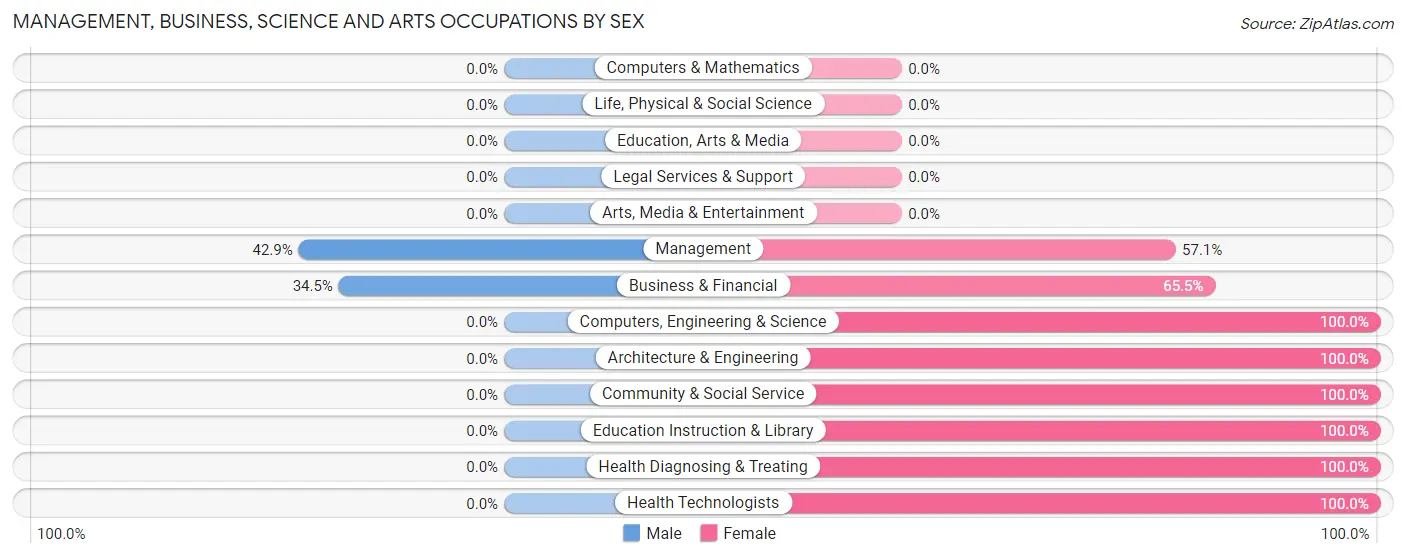
The most common Management, Business, Science and Arts occupations in Newton are Business & Financial (29 | 15.9%), Management (21 | 11.5%), Health Diagnosing & Treating (20 | 11.0%), Health Technologists (20 | 11.0%), and Computers, Engineering & Science (5 | 2.8%).
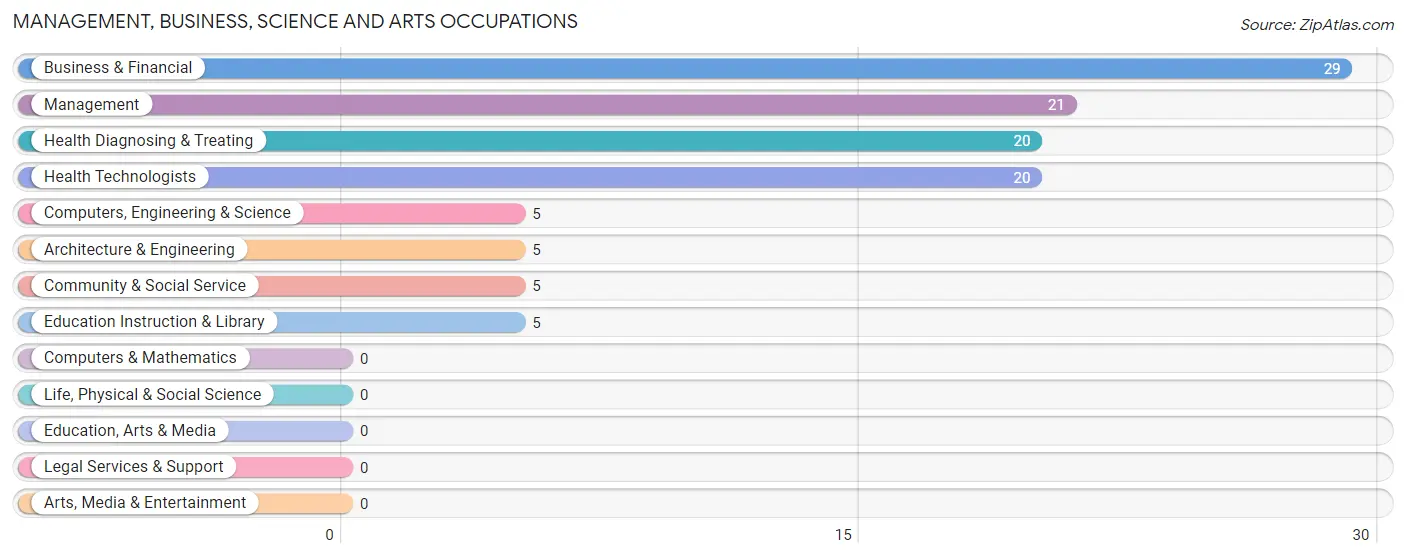
Management, Business, Science and Arts Occupations by Sex
Within the Management, Business, Science and Arts occupations in Newton, the most male-oriented occupations are Management (42.9%), and Business & Financial (34.5%), while the most female-oriented occupations are Computers, Engineering & Science (100.0%), Architecture & Engineering (100.0%), and Community & Social Service (100.0%).
| Occupation | Male | Female |
| Management | 9 (42.9%) | 12 (57.1%) |
| Business & Financial | 10 (34.5%) | 19 (65.5%) |
| Computers, Engineering & Science | 0 (0.0%) | 5 (100.0%) |
| Computers & Mathematics | 0 (0.0%) | 0 (0.0%) |
| Architecture & Engineering | 0 (0.0%) | 5 (100.0%) |
| Life, Physical & Social Science | 0 (0.0%) | 0 (0.0%) |
| Community & Social Service | 0 (0.0%) | 5 (100.0%) |
| Education, Arts & Media | 0 (0.0%) | 0 (0.0%) |
| Legal Services & Support | 0 (0.0%) | 0 (0.0%) |
| Education Instruction & Library | 0 (0.0%) | 5 (100.0%) |
| Arts, Media & Entertainment | 0 (0.0%) | 0 (0.0%) |
| Health Diagnosing & Treating | 0 (0.0%) | 20 (100.0%) |
| Health Technologists | 0 (0.0%) | 20 (100.0%) |
| Total (Category) | 19 (23.7%) | 61 (76.2%) |
| Total (Overall) | 86 (47.2%) | 96 (52.7%) |
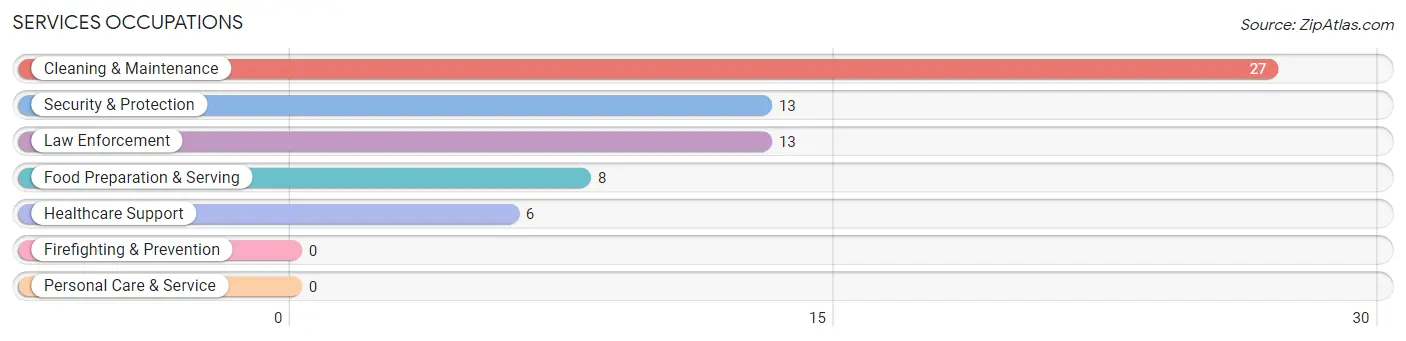
Services Occupations
The most common Services occupations in Newton are Cleaning & Maintenance (27 | 14.8%), Security & Protection (13 | 7.1%), Law Enforcement (13 | 7.1%), Food Preparation & Serving (8 | 4.4%), and Healthcare Support (6 | 3.3%).
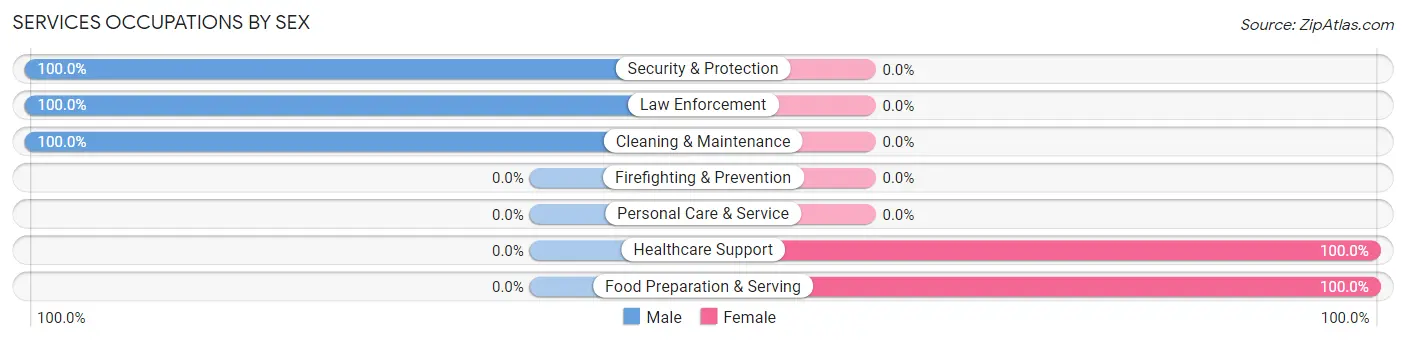
Services Occupations by Sex
Within the Services occupations in Newton, the most male-oriented occupations are Security & Protection (100.0%), Law Enforcement (100.0%), and Cleaning & Maintenance (100.0%), while the most female-oriented occupations are Healthcare Support (100.0%), and Food Preparation & Serving (100.0%).
| Occupation | Male | Female |
| Healthcare Support | 0 (0.0%) | 6 (100.0%) |
| Security & Protection | 13 (100.0%) | 0 (0.0%) |
| Firefighting & Prevention | 0 (0.0%) | 0 (0.0%) |
| Law Enforcement | 13 (100.0%) | 0 (0.0%) |
| Food Preparation & Serving | 0 (0.0%) | 8 (100.0%) |
| Cleaning & Maintenance | 27 (100.0%) | 0 (0.0%) |
| Personal Care & Service | 0 (0.0%) | 0 (0.0%) |
| Total (Category) | 40 (74.1%) | 14 (25.9%) |
| Total (Overall) | 86 (47.2%) | 96 (52.7%) |
Sales and Office Occupations
The most common Sales and Office occupations in Newton are Office & Administration (16 | 8.8%), and Sales & Related (15 | 8.2%).
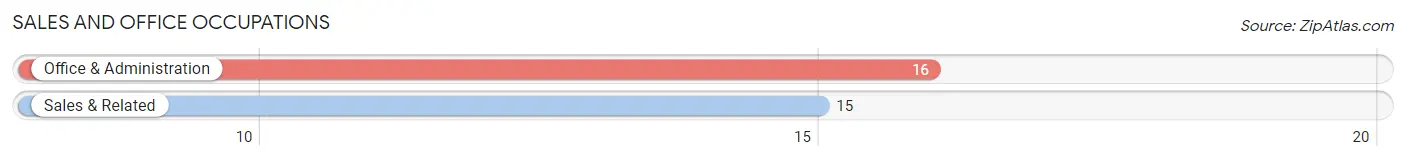
Sales and Office Occupations by Sex

| Occupation | Male | Female |
| Sales & Related | 15 (100.0%) | 0 (0.0%) |
| Office & Administration | 0 (0.0%) | 16 (100.0%) |
| Total (Category) | 15 (48.4%) | 16 (51.6%) |
| Total (Overall) | 86 (47.2%) | 96 (52.7%) |
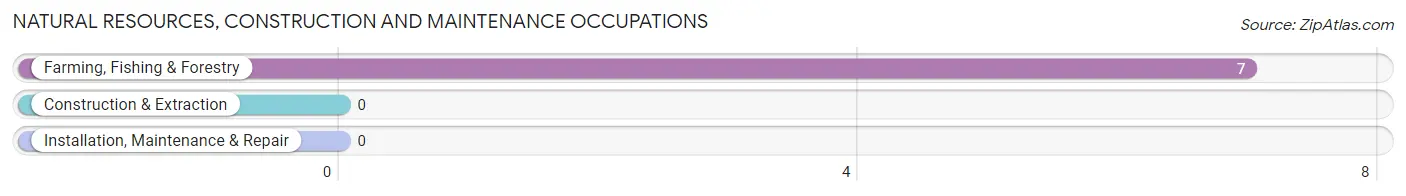
Natural Resources, Construction and Maintenance Occupations
The most common Natural Resources, Construction and Maintenance occupations in Newton are , and Farming, Fishing & Forestry (7 | 3.8%).
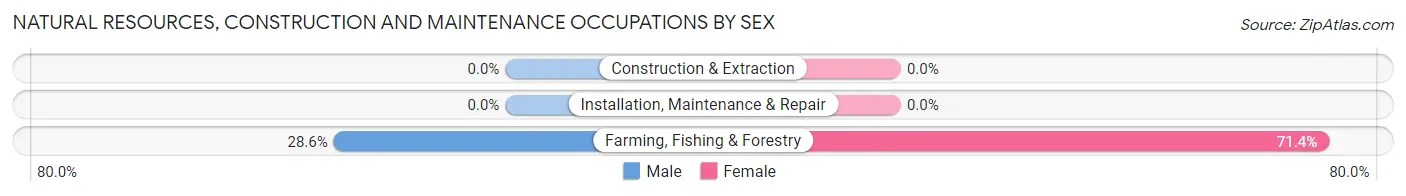
Natural Resources, Construction and Maintenance Occupations by Sex
| Occupation | Male | Female |
| Farming, Fishing & Forestry | 2 (28.6%) | 5 (71.4%) |
| Construction & Extraction | 0 (0.0%) | 0 (0.0%) |
| Installation, Maintenance & Repair | 0 (0.0%) | 0 (0.0%) |
| Total (Category) | 2 (28.6%) | 5 (71.4%) |
| Total (Overall) | 86 (47.2%) | 96 (52.7%) |
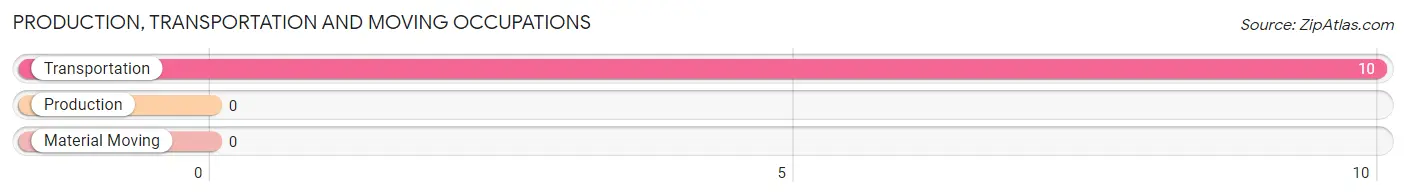
Production, Transportation and Moving Occupations
The most common Production, Transportation and Moving occupations in Newton are , and Transportation (10 | 5.5%).
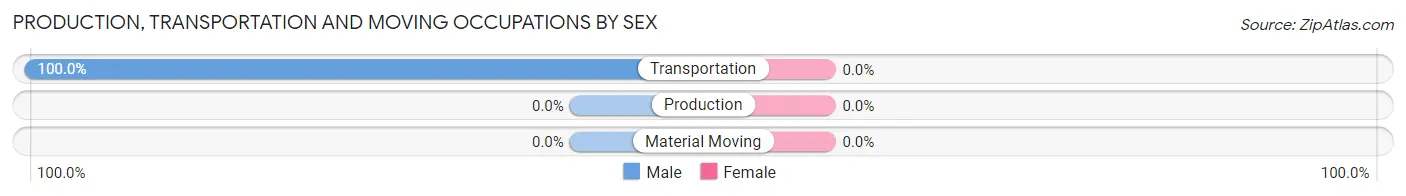
Production, Transportation and Moving Occupations by Sex
| Occupation | Male | Female |
| Production | 0 (0.0%) | 0 (0.0%) |
| Transportation | 10 (100.0%) | 0 (0.0%) |
| Material Moving | 0 (0.0%) | 0 (0.0%) |
| Total (Category) | 10 (100.0%) | 0 (0.0%) |
| Total (Overall) | 86 (47.2%) | 96 (52.7%) |
Employment Industries by Sex in Newton
Employment Industries in Newton
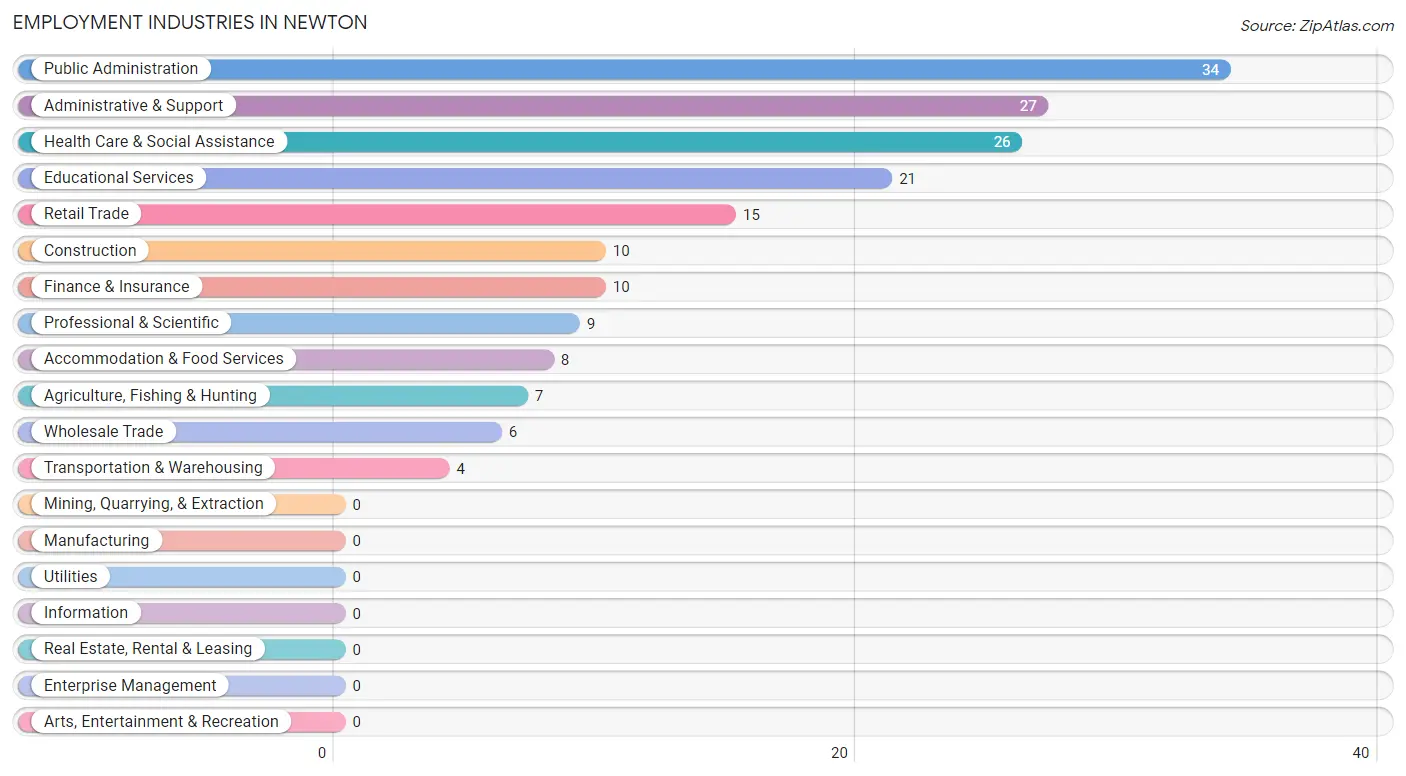
The major employment industries in Newton include Public Administration (34 | 18.7%), Administrative & Support (27 | 14.8%), Health Care & Social Assistance (26 | 14.3%), Educational Services (21 | 11.5%), and Retail Trade (15 | 8.2%).
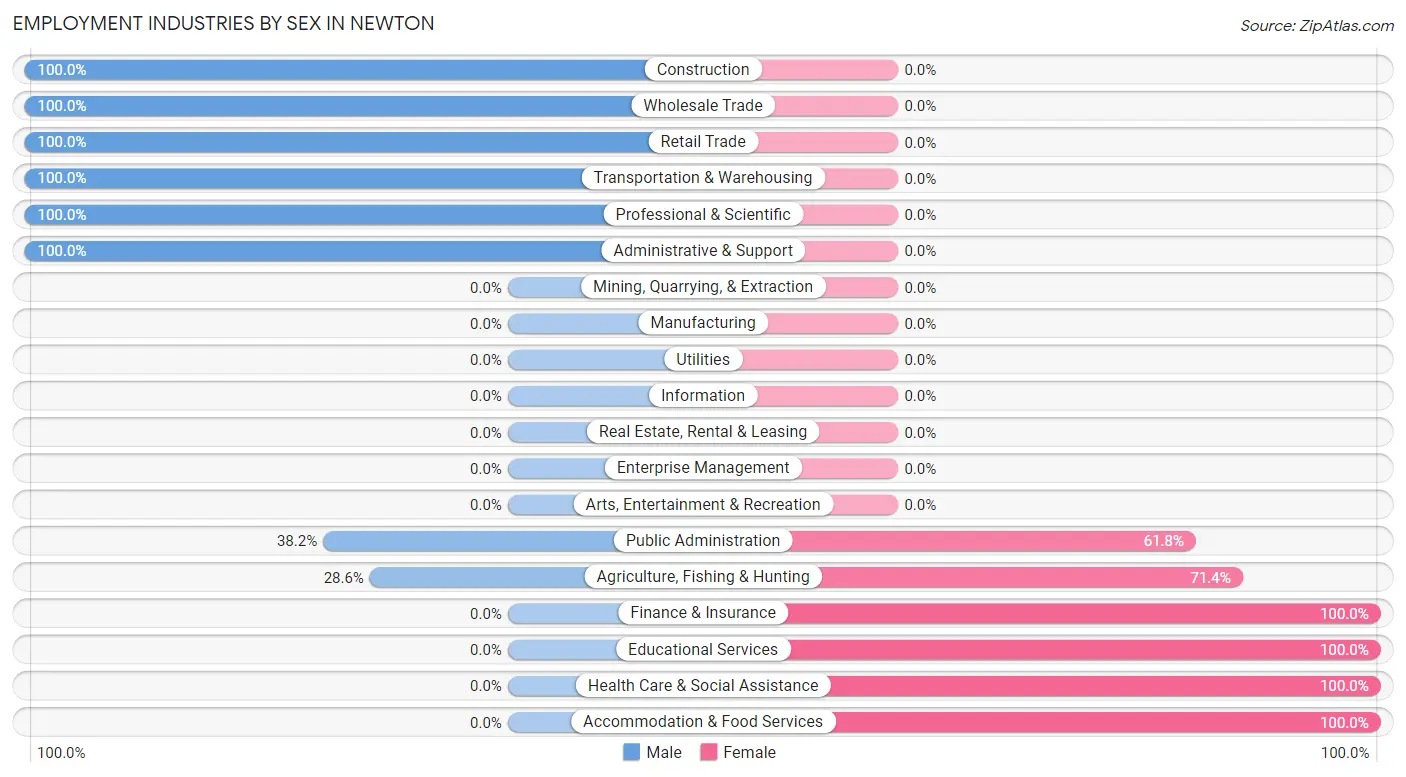
Employment Industries by Sex in Newton
The Newton industries that see more men than women are Construction (100.0%), Wholesale Trade (100.0%), and Retail Trade (100.0%), whereas the industries that tend to have a higher number of women are Finance & Insurance (100.0%), Educational Services (100.0%), and Health Care & Social Assistance (100.0%).
| Industry | Male | Female |
| Agriculture, Fishing & Hunting | 2 (28.6%) | 5 (71.4%) |
| Mining, Quarrying, & Extraction | 0 (0.0%) | 0 (0.0%) |
| Construction | 10 (100.0%) | 0 (0.0%) |
| Manufacturing | 0 (0.0%) | 0 (0.0%) |
| Wholesale Trade | 6 (100.0%) | 0 (0.0%) |
| Retail Trade | 15 (100.0%) | 0 (0.0%) |
| Transportation & Warehousing | 4 (100.0%) | 0 (0.0%) |
| Utilities | 0 (0.0%) | 0 (0.0%) |
| Information | 0 (0.0%) | 0 (0.0%) |
| Finance & Insurance | 0 (0.0%) | 10 (100.0%) |
| Real Estate, Rental & Leasing | 0 (0.0%) | 0 (0.0%) |
| Professional & Scientific | 9 (100.0%) | 0 (0.0%) |
| Enterprise Management | 0 (0.0%) | 0 (0.0%) |
| Administrative & Support | 27 (100.0%) | 0 (0.0%) |
| Educational Services | 0 (0.0%) | 21 (100.0%) |
| Health Care & Social Assistance | 0 (0.0%) | 26 (100.0%) |
| Arts, Entertainment & Recreation | 0 (0.0%) | 0 (0.0%) |
| Accommodation & Food Services | 0 (0.0%) | 8 (100.0%) |
| Public Administration | 13 (38.2%) | 21 (61.8%) |
| Total | 86 (47.2%) | 96 (52.7%) |
Education in Newton
School Enrollment in Newton
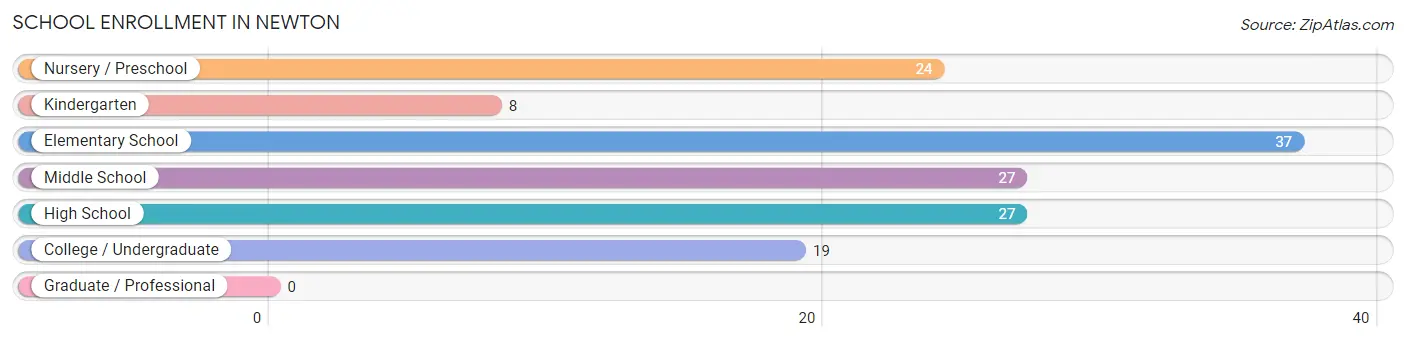
The most common levels of schooling among the 142 students in Newton are elementary school (37 | 26.1%), middle school (27 | 19.0%), and high school (27 | 19.0%).
| School Level | # Students | % Students |
| Nursery / Preschool | 24 | 16.9% |
| Kindergarten | 8 | 5.6% |
| Elementary School | 37 | 26.1% |
| Middle School | 27 | 19.0% |
| High School | 27 | 19.0% |
| College / Undergraduate | 19 | 13.4% |
| Graduate / Professional | 0 | 0.0% |
| Total | 142 | 100.0% |
School Enrollment by Age by Funding Source in Newton
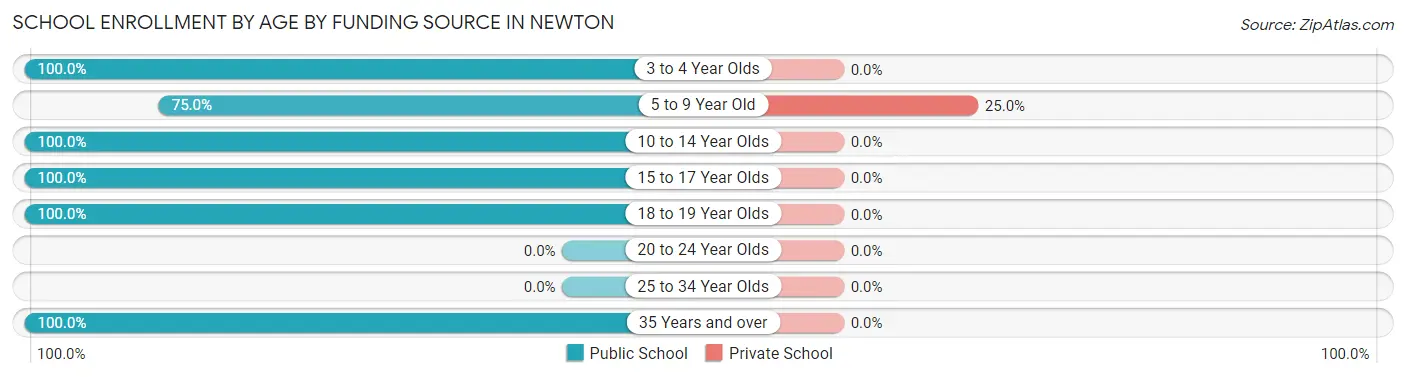
Out of a total of 142 students who are enrolled in schools in Newton, 13 (9.2%) attend a private institution, while the remaining 129 (90.8%) are enrolled in public schools. The age group of 5 to 9 year old has the highest likelihood of being enrolled in private schools, with 13 (25.0% in the age bracket) enrolled. Conversely, the age group of 3 to 4 year olds has the lowest likelihood of being enrolled in a private school, with 17 (100.0% in the age bracket) attending a public institution.
| Age Bracket | Public School | Private School |
| 3 to 4 Year Olds | 17 (100.0%) | 0 (0.0%) |
| 5 to 9 Year Old | 39 (75.0%) | 13 (25.0%) |
| 10 to 14 Year Olds | 27 (100.0%) | 0 (0.0%) |
| 15 to 17 Year Olds | 17 (100.0%) | 0 (0.0%) |
| 18 to 19 Year Olds | 15 (100.0%) | 0 (0.0%) |
| 20 to 24 Year Olds | 0 (0.0%) | 0 (0.0%) |
| 25 to 34 Year Olds | 0 (0.0%) | 0 (0.0%) |
| 35 Years and over | 14 (100.0%) | 0 (0.0%) |
| Total | 129 (90.8%) | 13 (9.2%) |
Educational Attainment by Field of Study in Newton
Science & technology (24 | 43.6%), business (23 | 41.8%), and bio, nature & agricultural (8 | 14.5%) are the most common fields of study among 55 individuals in Newton who have obtained a bachelor's degree or higher.
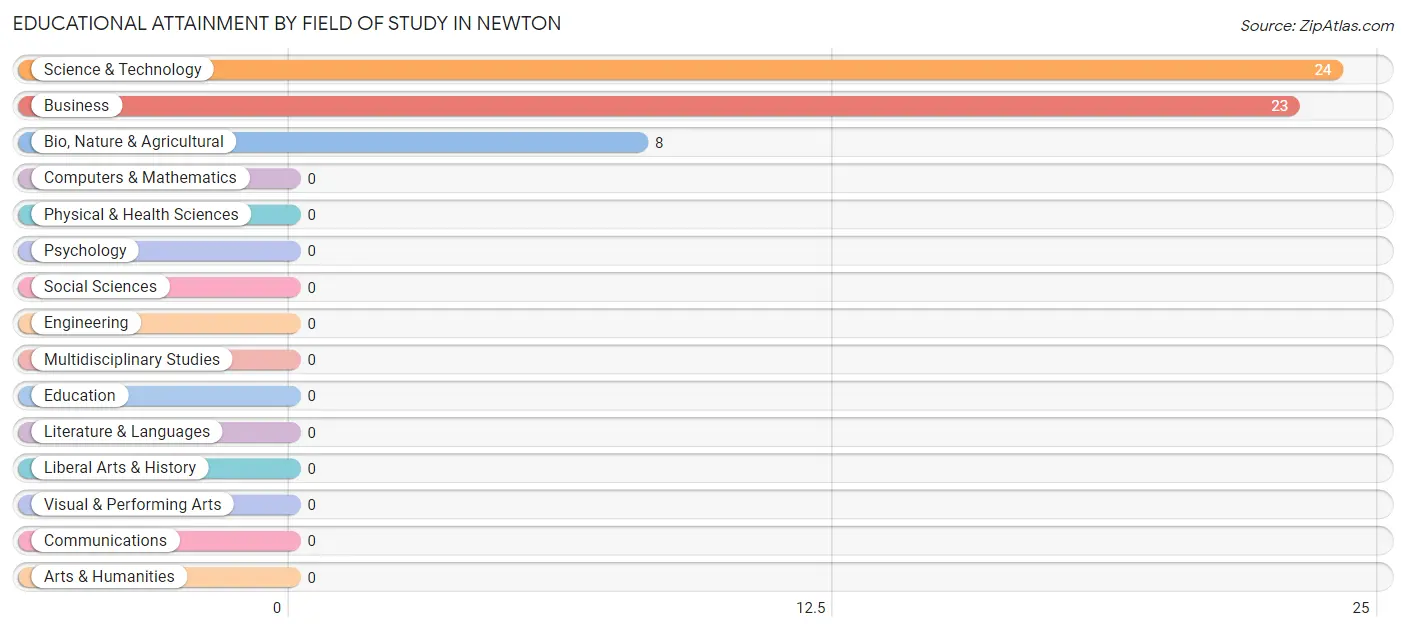
| Field of Study | # Graduates | % Graduates |
| Computers & Mathematics | 0 | 0.0% |
| Bio, Nature & Agricultural | 8 | 14.5% |
| Physical & Health Sciences | 0 | 0.0% |
| Psychology | 0 | 0.0% |
| Social Sciences | 0 | 0.0% |
| Engineering | 0 | 0.0% |
| Multidisciplinary Studies | 0 | 0.0% |
| Science & Technology | 24 | 43.6% |
| Business | 23 | 41.8% |
| Education | 0 | 0.0% |
| Literature & Languages | 0 | 0.0% |
| Liberal Arts & History | 0 | 0.0% |
| Visual & Performing Arts | 0 | 0.0% |
| Communications | 0 | 0.0% |
| Arts & Humanities | 0 | 0.0% |
| Total | 55 | 100.0% |
Transportation & Commute in Newton
Vehicle Availability by Sex in Newton
The most prevalent vehicle ownership categories in Newton are males with 3 vehicles (36, accounting for 46.2%) and females with 3 vehicles (61, making up 37.5%).
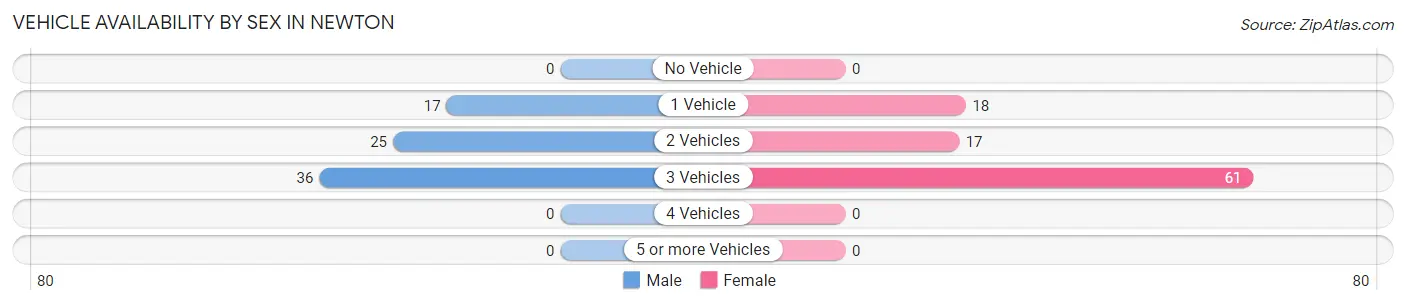
| Vehicles Available | Male | Female |
| No Vehicle | 0 (0.0%) | 0 (0.0%) |
| 1 Vehicle | 17 (21.8%) | 18 (18.8%) |
| 2 Vehicles | 25 (32.1%) | 17 (17.7%) |
| 3 Vehicles | 36 (46.2%) | 61 (63.5%) |
| 4 Vehicles | 0 (0.0%) | 0 (0.0%) |
| 5 or more Vehicles | 0 (0.0%) | 0 (0.0%) |
| Total | 78 (100.0%) | 96 (100.0%) |
Commute Time in Newton
The most frequently occuring commute durations in Newton are 30 to 34 minutes (41 commuters, 24.3%), less than 5 minutes (35 commuters, 20.7%), and 20 to 24 minutes (34 commuters, 20.1%).
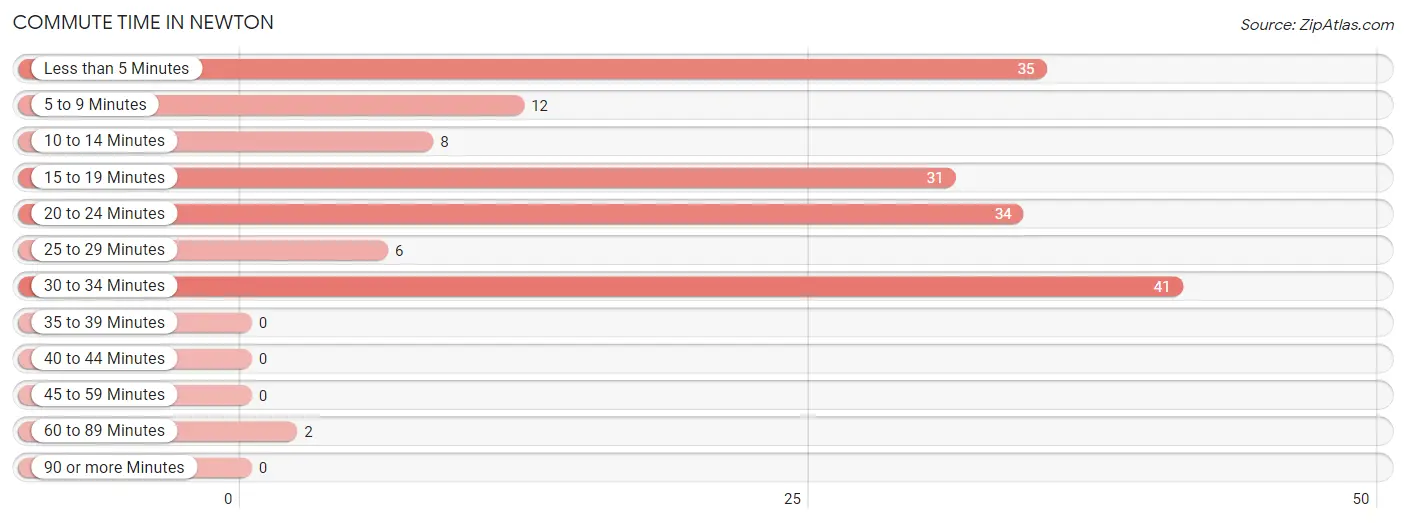
| Commute Time | # Commuters | % Commuters |
| Less than 5 Minutes | 35 | 20.7% |
| 5 to 9 Minutes | 12 | 7.1% |
| 10 to 14 Minutes | 8 | 4.7% |
| 15 to 19 Minutes | 31 | 18.3% |
| 20 to 24 Minutes | 34 | 20.1% |
| 25 to 29 Minutes | 6 | 3.5% |
| 30 to 34 Minutes | 41 | 24.3% |
| 35 to 39 Minutes | 0 | 0.0% |
| 40 to 44 Minutes | 0 | 0.0% |
| 45 to 59 Minutes | 0 | 0.0% |
| 60 to 89 Minutes | 2 | 1.2% |
| 90 or more Minutes | 0 | 0.0% |
Commute Time by Sex in Newton
The most common commute times in Newton are 15 to 19 minutes (26 commuters, 33.3%) for males and 30 to 34 minutes (39 commuters, 42.9%) for females.
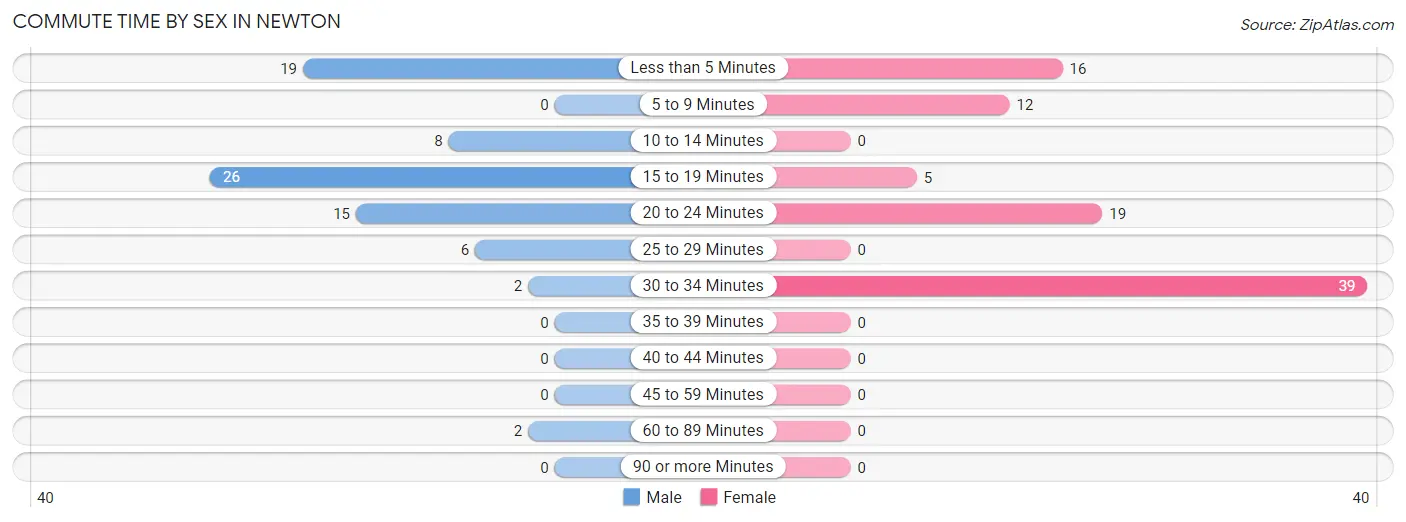
| Commute Time | Male | Female |
| Less than 5 Minutes | 19 (24.4%) | 16 (17.6%) |
| 5 to 9 Minutes | 0 (0.0%) | 12 (13.2%) |
| 10 to 14 Minutes | 8 (10.3%) | 0 (0.0%) |
| 15 to 19 Minutes | 26 (33.3%) | 5 (5.5%) |
| 20 to 24 Minutes | 15 (19.2%) | 19 (20.9%) |
| 25 to 29 Minutes | 6 (7.7%) | 0 (0.0%) |
| 30 to 34 Minutes | 2 (2.6%) | 39 (42.9%) |
| 35 to 39 Minutes | 0 (0.0%) | 0 (0.0%) |
| 40 to 44 Minutes | 0 (0.0%) | 0 (0.0%) |
| 45 to 59 Minutes | 0 (0.0%) | 0 (0.0%) |
| 60 to 89 Minutes | 2 (2.6%) | 0 (0.0%) |
| 90 or more Minutes | 0 (0.0%) | 0 (0.0%) |
Time of Departure to Work by Sex in Newton
The most frequent times of departure to work in Newton are 4:00 PM to 11:59 PM (24, 30.8%) for males and 7:00 AM to 7:29 AM (36, 39.6%) for females.
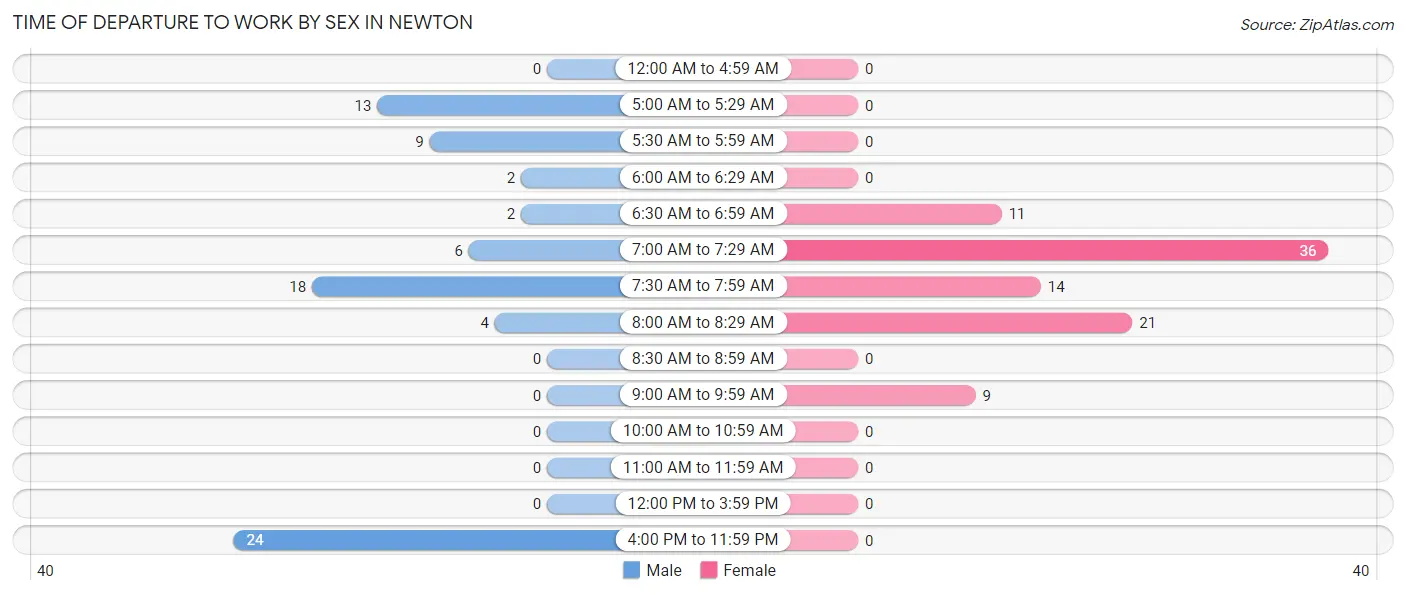
| Time of Departure | Male | Female |
| 12:00 AM to 4:59 AM | 0 (0.0%) | 0 (0.0%) |
| 5:00 AM to 5:29 AM | 13 (16.7%) | 0 (0.0%) |
| 5:30 AM to 5:59 AM | 9 (11.5%) | 0 (0.0%) |
| 6:00 AM to 6:29 AM | 2 (2.6%) | 0 (0.0%) |
| 6:30 AM to 6:59 AM | 2 (2.6%) | 11 (12.1%) |
| 7:00 AM to 7:29 AM | 6 (7.7%) | 36 (39.6%) |
| 7:30 AM to 7:59 AM | 18 (23.1%) | 14 (15.4%) |
| 8:00 AM to 8:29 AM | 4 (5.1%) | 21 (23.1%) |
| 8:30 AM to 8:59 AM | 0 (0.0%) | 0 (0.0%) |
| 9:00 AM to 9:59 AM | 0 (0.0%) | 9 (9.9%) |
| 10:00 AM to 10:59 AM | 0 (0.0%) | 0 (0.0%) |
| 11:00 AM to 11:59 AM | 0 (0.0%) | 0 (0.0%) |
| 12:00 PM to 3:59 PM | 0 (0.0%) | 0 (0.0%) |
| 4:00 PM to 11:59 PM | 24 (30.8%) | 0 (0.0%) |
| Total | 78 (100.0%) | 91 (100.0%) |
Housing Occupancy in Newton
Occupancy by Ownership in Newton
Of the total 206 dwellings in Newton, owner-occupied units account for 138 (67.0%), while renter-occupied units make up 68 (33.0%).
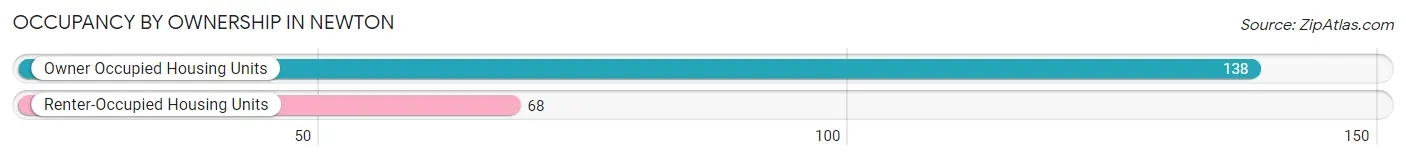
| Occupancy | # Housing Units | % Housing Units |
| Owner Occupied Housing Units | 138 | 67.0% |
| Renter-Occupied Housing Units | 68 | 33.0% |
| Total Occupied Housing Units | 206 | 100.0% |
Occupancy by Household Size in Newton
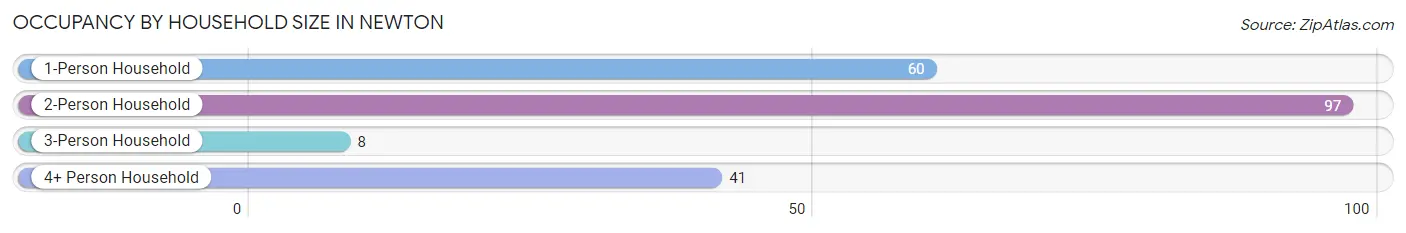
| Household Size | # Housing Units | % Housing Units |
| 1-Person Household | 60 | 29.1% |
| 2-Person Household | 97 | 47.1% |
| 3-Person Household | 8 | 3.9% |
| 4+ Person Household | 41 | 19.9% |
| Total Housing Units | 206 | 100.0% |
Occupancy by Ownership by Household Size in Newton
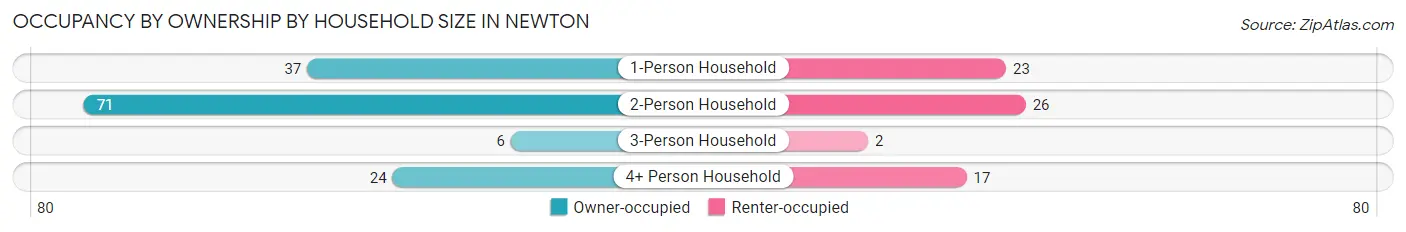
| Household Size | Owner-occupied | Renter-occupied |
| 1-Person Household | 37 (61.7%) | 23 (38.3%) |
| 2-Person Household | 71 (73.2%) | 26 (26.8%) |
| 3-Person Household | 6 (75.0%) | 2 (25.0%) |
| 4+ Person Household | 24 (58.5%) | 17 (41.5%) |
| Total Housing Units | 138 (67.0%) | 68 (33.0%) |
Occupancy by Educational Attainment in Newton
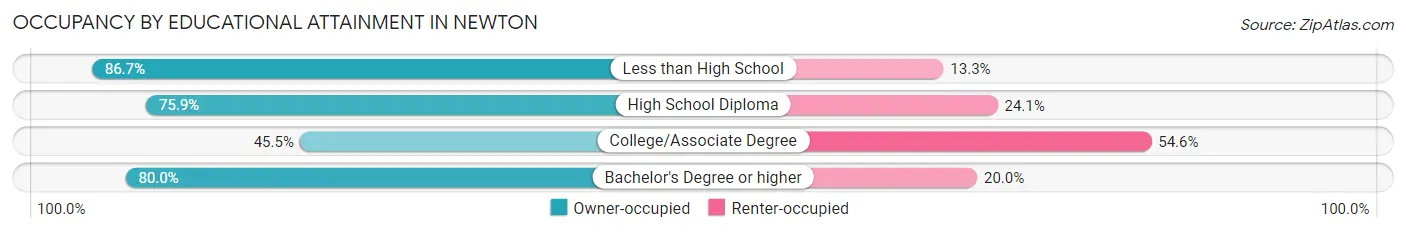
| Household Size | Owner-occupied | Renter-occupied |
| Less than High School | 26 (86.7%) | 4 (13.3%) |
| High School Diploma | 41 (75.9%) | 13 (24.1%) |
| College/Associate Degree | 35 (45.5%) | 42 (54.5%) |
| Bachelor's Degree or higher | 36 (80.0%) | 9 (20.0%) |
Occupancy by Age of Householder in Newton
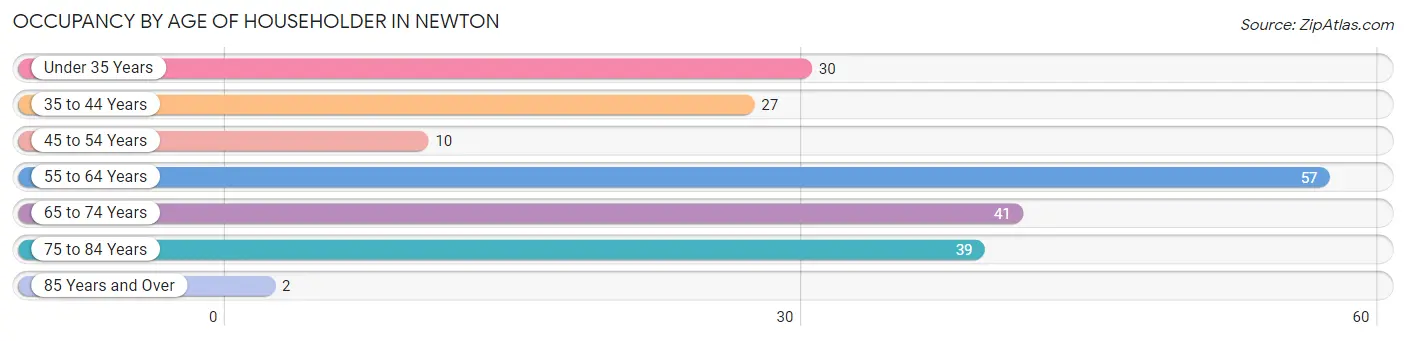
| Age Bracket | # Households | % Households |
| Under 35 Years | 30 | 14.6% |
| 35 to 44 Years | 27 | 13.1% |
| 45 to 54 Years | 10 | 4.9% |
| 55 to 64 Years | 57 | 27.7% |
| 65 to 74 Years | 41 | 19.9% |
| 75 to 84 Years | 39 | 18.9% |
| 85 Years and Over | 2 | 1.0% |
| Total | 206 | 100.0% |
Housing Finances in Newton
Median Income by Occupancy in Newton
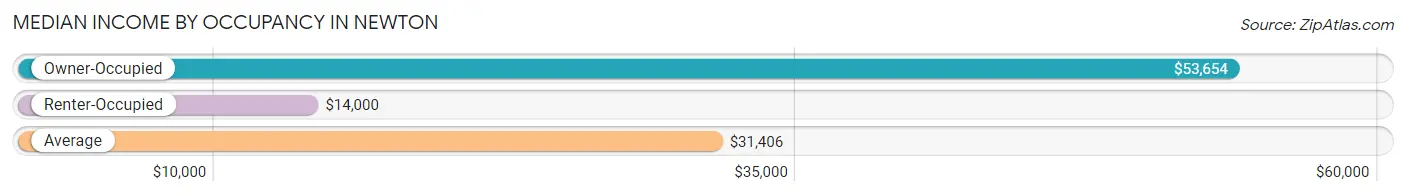
| Occupancy Type | # Households | Median Income |
| Owner-Occupied | 138 (67.0%) | $53,654 |
| Renter-Occupied | 68 (33.0%) | $14,000 |
| Average | 206 (100.0%) | $31,406 |
Occupancy by Householder Income Bracket in Newton
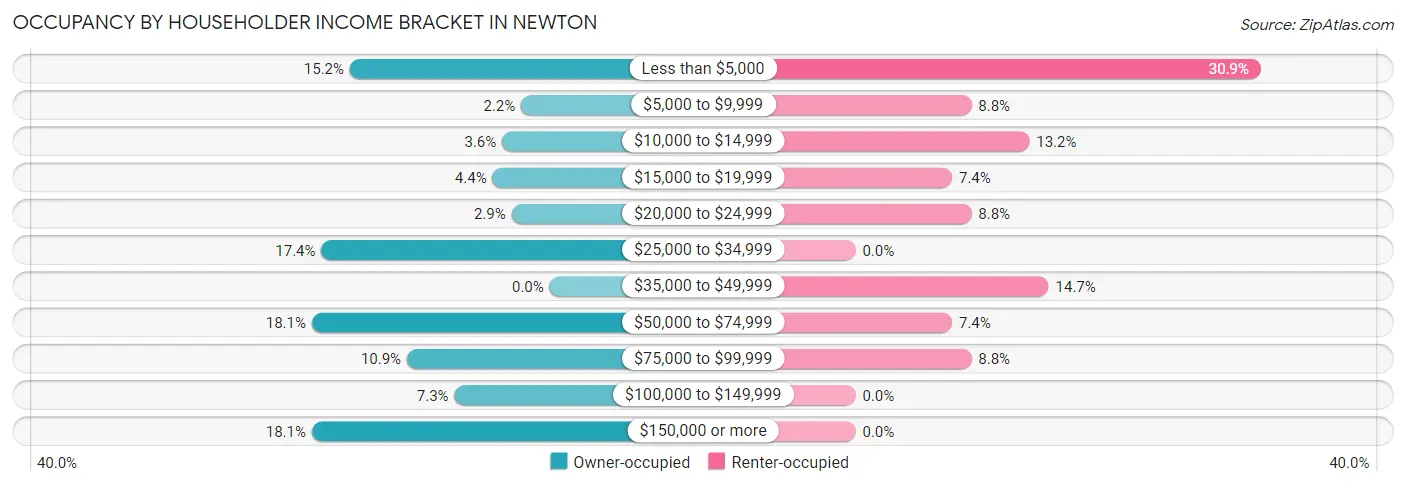
| Income Bracket | Owner-occupied | Renter-occupied |
| Less than $5,000 | 21 (15.2%) | 21 (30.9%) |
| $5,000 to $9,999 | 3 (2.2%) | 6 (8.8%) |
| $10,000 to $14,999 | 5 (3.6%) | 9 (13.2%) |
| $15,000 to $19,999 | 6 (4.3%) | 5 (7.3%) |
| $20,000 to $24,999 | 4 (2.9%) | 6 (8.8%) |
| $25,000 to $34,999 | 24 (17.4%) | 0 (0.0%) |
| $35,000 to $49,999 | 0 (0.0%) | 10 (14.7%) |
| $50,000 to $74,999 | 25 (18.1%) | 5 (7.3%) |
| $75,000 to $99,999 | 15 (10.9%) | 6 (8.8%) |
| $100,000 to $149,999 | 10 (7.2%) | 0 (0.0%) |
| $150,000 or more | 25 (18.1%) | 0 (0.0%) |
| Total | 138 (100.0%) | 68 (100.0%) |
Monthly Housing Cost Tiers in Newton
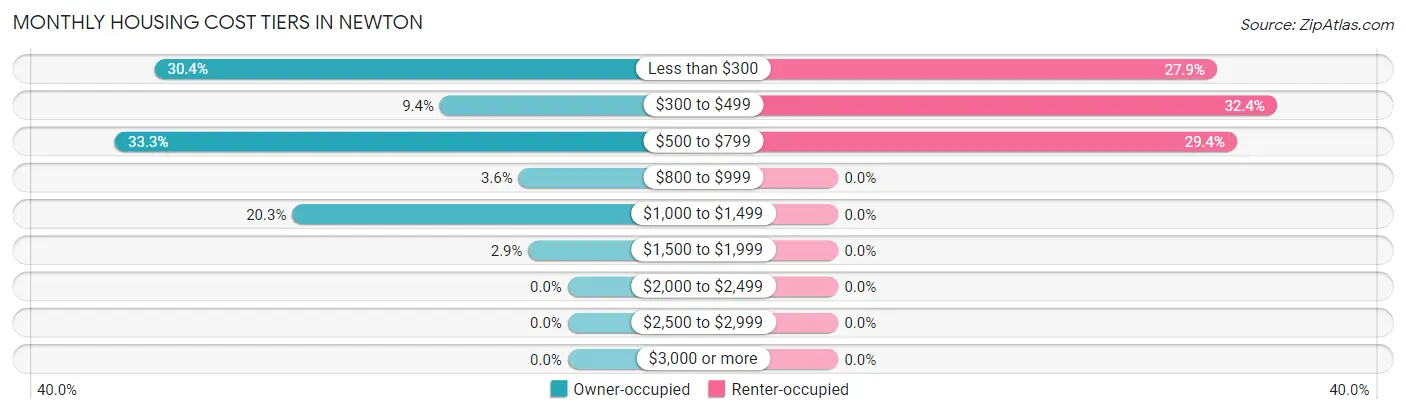
| Monthly Cost | Owner-occupied | Renter-occupied |
| Less than $300 | 42 (30.4%) | 19 (27.9%) |
| $300 to $499 | 13 (9.4%) | 22 (32.4%) |
| $500 to $799 | 46 (33.3%) | 20 (29.4%) |
| $800 to $999 | 5 (3.6%) | 0 (0.0%) |
| $1,000 to $1,499 | 28 (20.3%) | 0 (0.0%) |
| $1,500 to $1,999 | 4 (2.9%) | 0 (0.0%) |
| $2,000 to $2,499 | 0 (0.0%) | 0 (0.0%) |
| $2,500 to $2,999 | 0 (0.0%) | 0 (0.0%) |
| $3,000 or more | 0 (0.0%) | 0 (0.0%) |
| Total | 138 (100.0%) | 68 (100.0%) |
Physical Housing Characteristics in Newton
Housing Structures in Newton
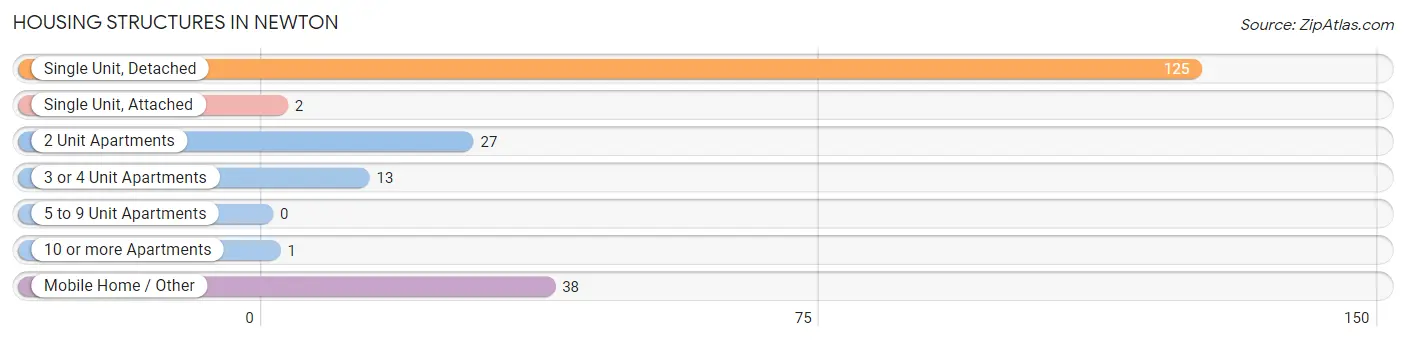
| Structure Type | # Housing Units | % Housing Units |
| Single Unit, Detached | 125 | 60.7% |
| Single Unit, Attached | 2 | 1.0% |
| 2 Unit Apartments | 27 | 13.1% |
| 3 or 4 Unit Apartments | 13 | 6.3% |
| 5 to 9 Unit Apartments | 0 | 0.0% |
| 10 or more Apartments | 1 | 0.5% |
| Mobile Home / Other | 38 | 18.4% |
| Total | 206 | 100.0% |
Housing Structures by Occupancy in Newton
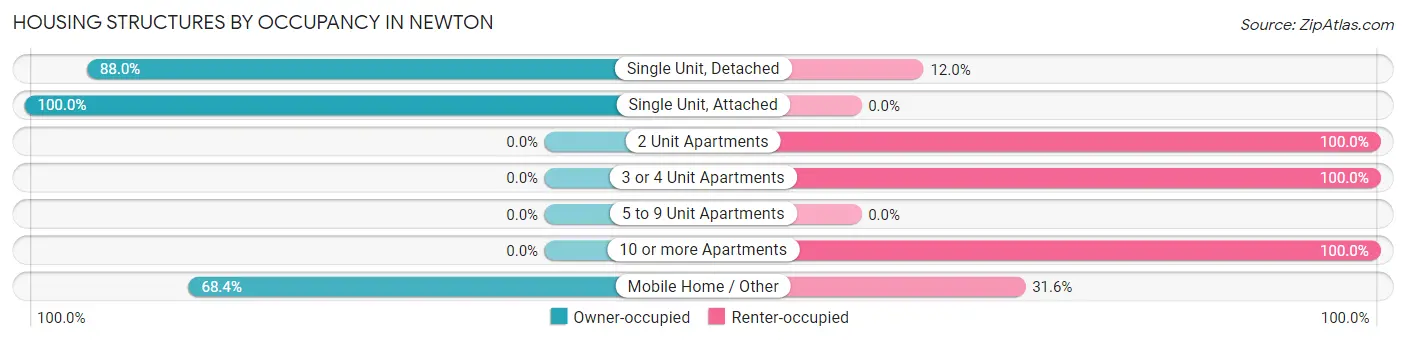
| Structure Type | Owner-occupied | Renter-occupied |
| Single Unit, Detached | 110 (88.0%) | 15 (12.0%) |
| Single Unit, Attached | 2 (100.0%) | 0 (0.0%) |
| 2 Unit Apartments | 0 (0.0%) | 27 (100.0%) |
| 3 or 4 Unit Apartments | 0 (0.0%) | 13 (100.0%) |
| 5 to 9 Unit Apartments | 0 (0.0%) | 0 (0.0%) |
| 10 or more Apartments | 0 (0.0%) | 1 (100.0%) |
| Mobile Home / Other | 26 (68.4%) | 12 (31.6%) |
| Total | 138 (67.0%) | 68 (33.0%) |
Housing Structures by Number of Rooms in Newton
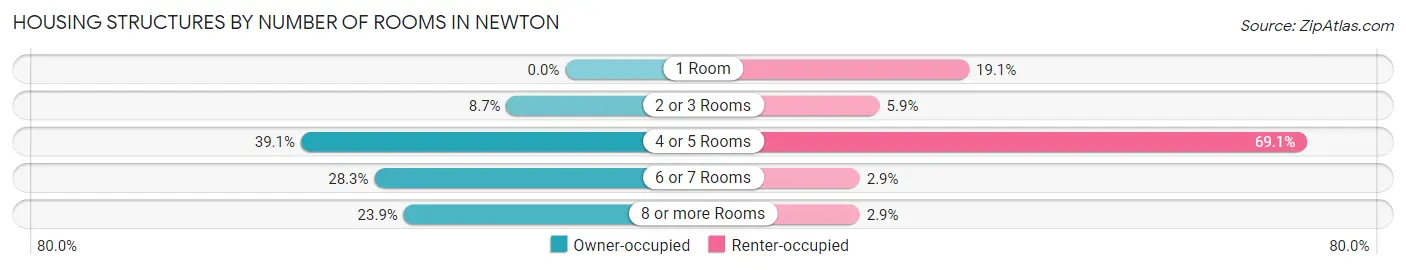
| Number of Rooms | Owner-occupied | Renter-occupied |
| 1 Room | 0 (0.0%) | 13 (19.1%) |
| 2 or 3 Rooms | 12 (8.7%) | 4 (5.9%) |
| 4 or 5 Rooms | 54 (39.1%) | 47 (69.1%) |
| 6 or 7 Rooms | 39 (28.3%) | 2 (2.9%) |
| 8 or more Rooms | 33 (23.9%) | 2 (2.9%) |
| Total | 138 (100.0%) | 68 (100.0%) |
Housing Structure by Heating Type in Newton
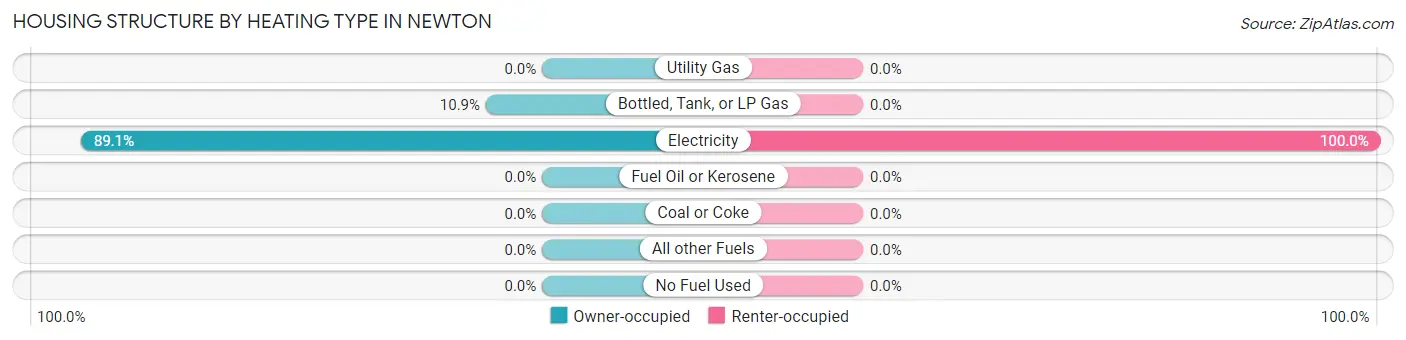
| Heating Type | Owner-occupied | Renter-occupied |
| Utility Gas | 0 (0.0%) | 0 (0.0%) |
| Bottled, Tank, or LP Gas | 15 (10.9%) | 0 (0.0%) |
| Electricity | 123 (89.1%) | 68 (100.0%) |
| Fuel Oil or Kerosene | 0 (0.0%) | 0 (0.0%) |
| Coal or Coke | 0 (0.0%) | 0 (0.0%) |
| All other Fuels | 0 (0.0%) | 0 (0.0%) |
| No Fuel Used | 0 (0.0%) | 0 (0.0%) |
| Total | 138 (100.0%) | 68 (100.0%) |
Household Vehicle Usage in Newton
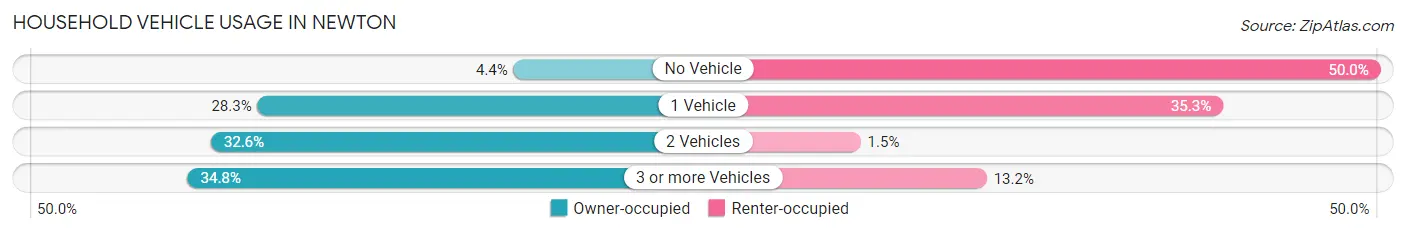
| Vehicles per Household | Owner-occupied | Renter-occupied |
| No Vehicle | 6 (4.3%) | 34 (50.0%) |
| 1 Vehicle | 39 (28.3%) | 24 (35.3%) |
| 2 Vehicles | 45 (32.6%) | 1 (1.5%) |
| 3 or more Vehicles | 48 (34.8%) | 9 (13.2%) |
| Total | 138 (100.0%) | 68 (100.0%) |
Real Estate & Mortgages in Newton
Real Estate and Mortgage Overview in Newton
| Characteristic | Without Mortgage | With Mortgage |
| Housing Units | 79 | 59 |
| Median Property Value | $122,500 | $58,800 |
| Median Household Income | - | - |
| Monthly Housing Costs | $289 | $0 |
| Real Estate Taxes | - | - |
Property Value by Mortgage Status in Newton
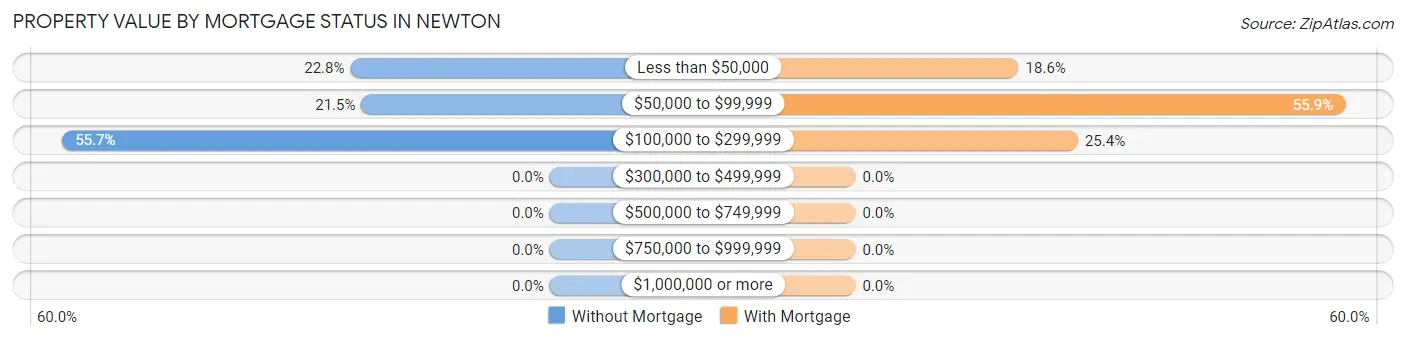
| Property Value | Without Mortgage | With Mortgage |
| Less than $50,000 | 18 (22.8%) | 11 (18.6%) |
| $50,000 to $99,999 | 17 (21.5%) | 33 (55.9%) |
| $100,000 to $299,999 | 44 (55.7%) | 15 (25.4%) |
| $300,000 to $499,999 | 0 (0.0%) | 0 (0.0%) |
| $500,000 to $749,999 | 0 (0.0%) | 0 (0.0%) |
| $750,000 to $999,999 | 0 (0.0%) | 0 (0.0%) |
| $1,000,000 or more | 0 (0.0%) | 0 (0.0%) |
| Total | 79 (100.0%) | 59 (100.0%) |
Household Income by Mortgage Status in Newton
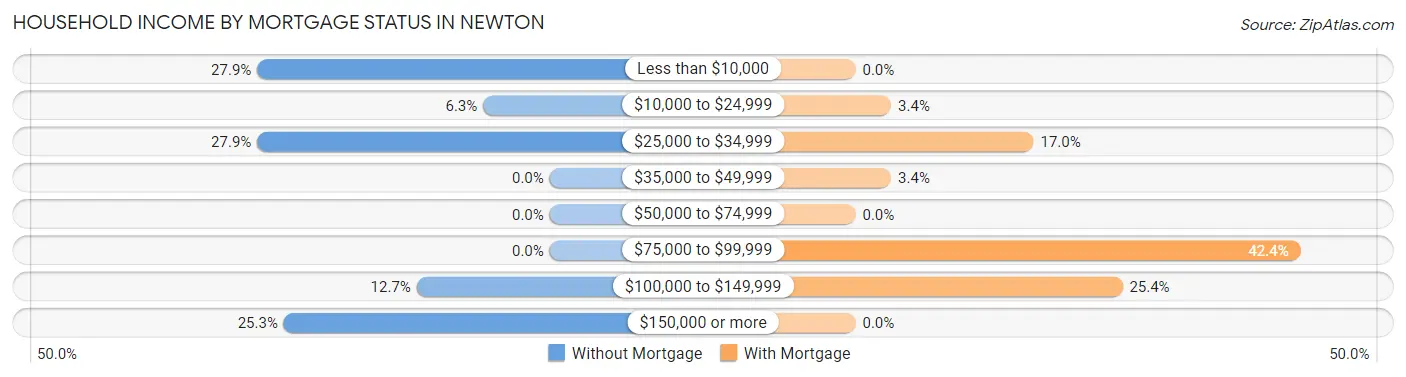
| Household Income | Without Mortgage | With Mortgage |
| Less than $10,000 | 22 (27.9%) | 0 (0.0%) |
| $10,000 to $24,999 | 5 (6.3%) | 2 (3.4%) |
| $25,000 to $34,999 | 22 (27.9%) | 10 (17.0%) |
| $35,000 to $49,999 | 0 (0.0%) | 2 (3.4%) |
| $50,000 to $74,999 | 0 (0.0%) | 0 (0.0%) |
| $75,000 to $99,999 | 0 (0.0%) | 25 (42.4%) |
| $100,000 to $149,999 | 10 (12.7%) | 15 (25.4%) |
| $150,000 or more | 20 (25.3%) | 0 (0.0%) |
| Total | 79 (100.0%) | 59 (100.0%) |
Property Value to Household Income Ratio in Newton
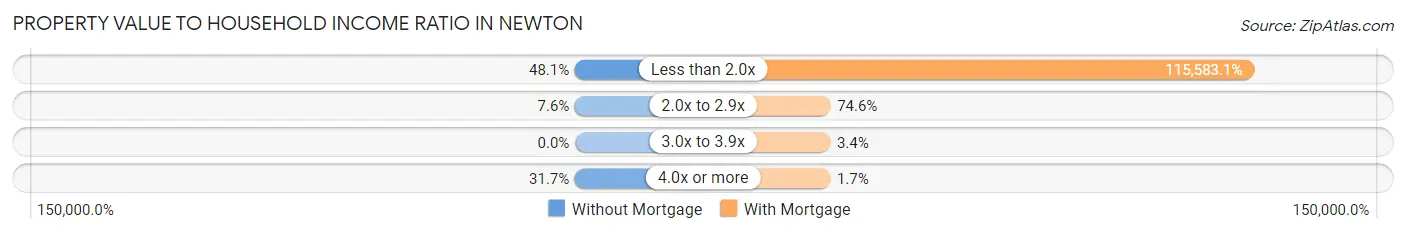
| Value-to-Income Ratio | Without Mortgage | With Mortgage |
| Less than 2.0x | 38 (48.1%) | 68,194 (115,583.1%) |
| 2.0x to 2.9x | 6 (7.6%) | 44 (74.6%) |
| 3.0x to 3.9x | 0 (0.0%) | 2 (3.4%) |
| 4.0x or more | 25 (31.7%) | 1 (1.7%) |
| Total | 79 (100.0%) | 59 (100.0%) |
Real Estate Taxes by Mortgage Status in Newton
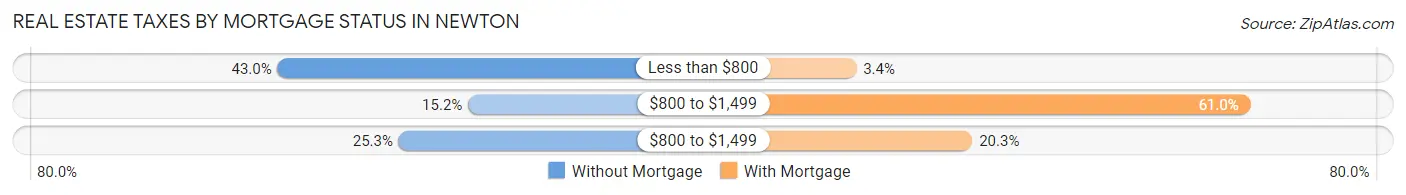
| Property Taxes | Without Mortgage | With Mortgage |
| Less than $800 | 34 (43.0%) | 2 (3.4%) |
| $800 to $1,499 | 12 (15.2%) | 36 (61.0%) |
| $800 to $1,499 | 20 (25.3%) | 12 (20.3%) |
| Total | 79 (100.0%) | 59 (100.0%) |
Health & Disability in Newton
Health Insurance Coverage by Age in Newton
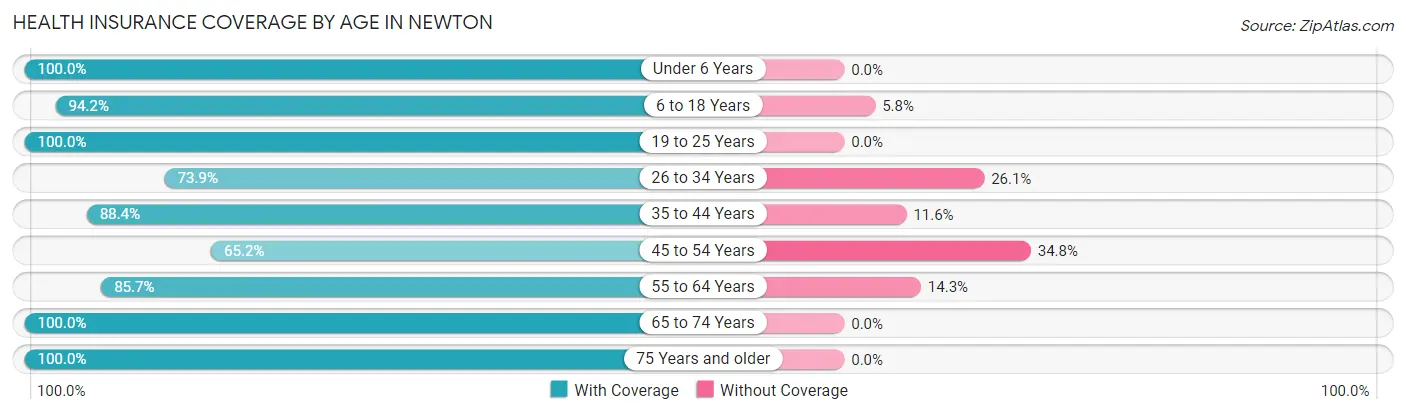
| Age Bracket | With Coverage | Without Coverage |
| Under 6 Years | 48 (100.0%) | 0 (0.0%) |
| 6 to 18 Years | 98 (94.2%) | 6 (5.8%) |
| 19 to 25 Years | 6 (100.0%) | 0 (0.0%) |
| 26 to 34 Years | 34 (73.9%) | 12 (26.1%) |
| 35 to 44 Years | 61 (88.4%) | 8 (11.6%) |
| 45 to 54 Years | 15 (65.2%) | 8 (34.8%) |
| 55 to 64 Years | 72 (85.7%) | 12 (14.3%) |
| 65 to 74 Years | 79 (100.0%) | 0 (0.0%) |
| 75 Years and older | 45 (100.0%) | 0 (0.0%) |
| Total | 458 (90.9%) | 46 (9.1%) |
Health Insurance Coverage by Citizenship Status in Newton
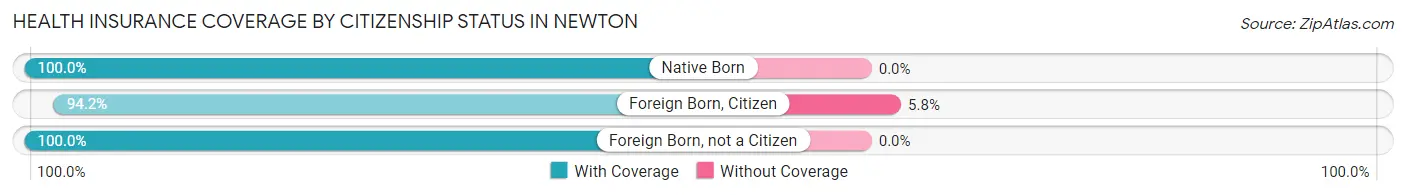
| Citizenship Status | With Coverage | Without Coverage |
| Native Born | 48 (100.0%) | 0 (0.0%) |
| Foreign Born, Citizen | 98 (94.2%) | 6 (5.8%) |
| Foreign Born, not a Citizen | 6 (100.0%) | 0 (0.0%) |
Health Insurance Coverage by Household Income in Newton
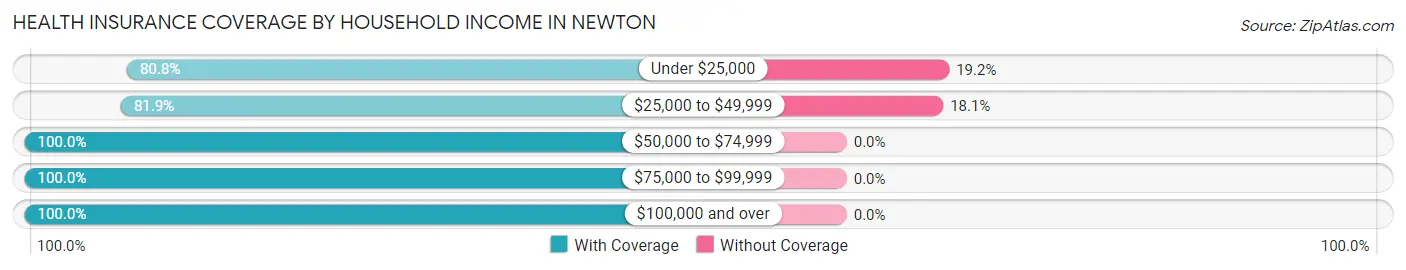
| Household Income | With Coverage | Without Coverage |
| Under $25,000 | 139 (80.8%) | 33 (19.2%) |
| $25,000 to $49,999 | 59 (81.9%) | 13 (18.1%) |
| $50,000 to $74,999 | 124 (100.0%) | 0 (0.0%) |
| $75,000 to $99,999 | 72 (100.0%) | 0 (0.0%) |
| $100,000 and over | 64 (100.0%) | 0 (0.0%) |
Public vs Private Health Insurance Coverage by Age in Newton
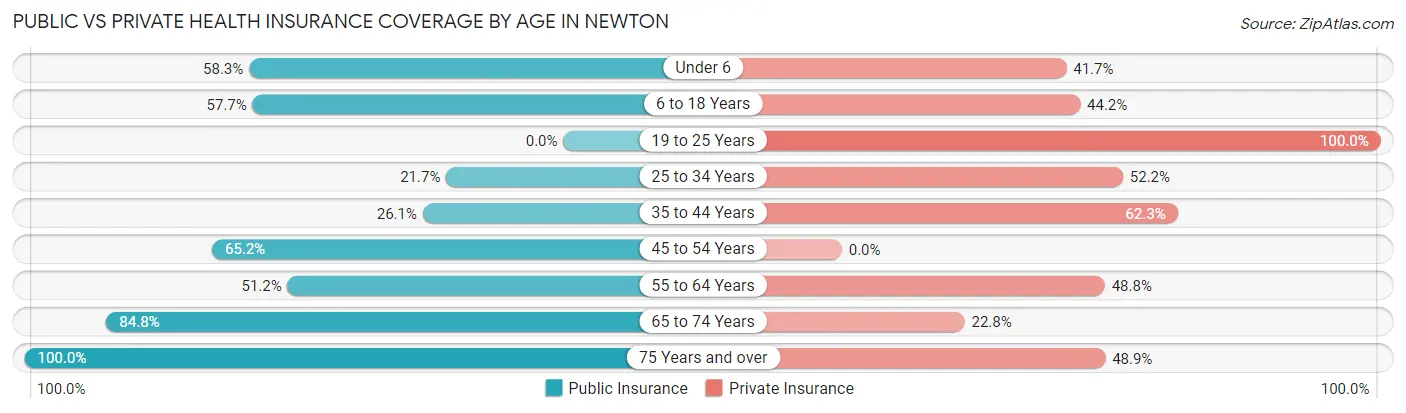
| Age Bracket | Public Insurance | Private Insurance |
| Under 6 | 28 (58.3%) | 20 (41.7%) |
| 6 to 18 Years | 60 (57.7%) | 46 (44.2%) |
| 19 to 25 Years | 0 (0.0%) | 6 (100.0%) |
| 25 to 34 Years | 10 (21.7%) | 24 (52.2%) |
| 35 to 44 Years | 18 (26.1%) | 43 (62.3%) |
| 45 to 54 Years | 15 (65.2%) | 0 (0.0%) |
| 55 to 64 Years | 43 (51.2%) | 41 (48.8%) |
| 65 to 74 Years | 67 (84.8%) | 18 (22.8%) |
| 75 Years and over | 45 (100.0%) | 22 (48.9%) |
| Total | 286 (56.8%) | 220 (43.6%) |
Disability Status by Sex by Age in Newton
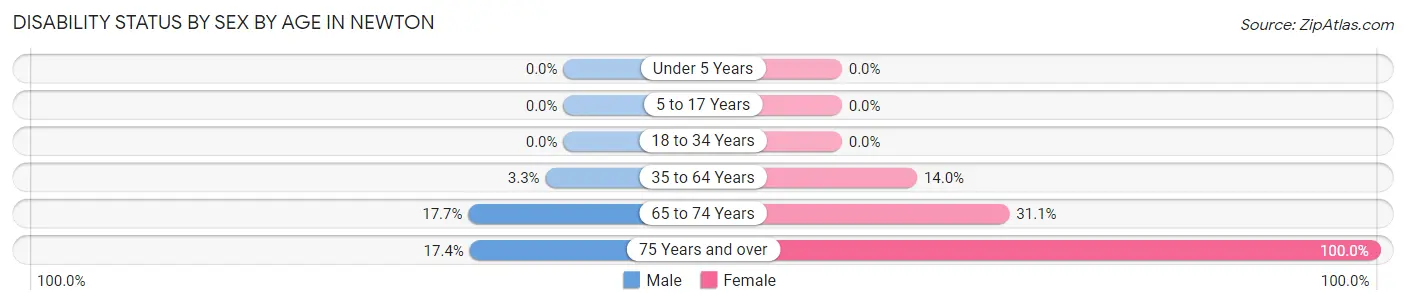
| Age Bracket | Male | Female |
| Under 5 Years | 0 (0.0%) | 0 (0.0%) |
| 5 to 17 Years | 0 (0.0%) | 0 (0.0%) |
| 18 to 34 Years | 0 (0.0%) | 0 (0.0%) |
| 35 to 64 Years | 3 (3.3%) | 12 (14.0%) |
| 65 to 74 Years | 6 (17.6%) | 14 (31.1%) |
| 75 Years and over | 4 (17.4%) | 22 (100.0%) |
Disability Class by Sex by Age in Newton
Disability Class: Hearing Difficulty
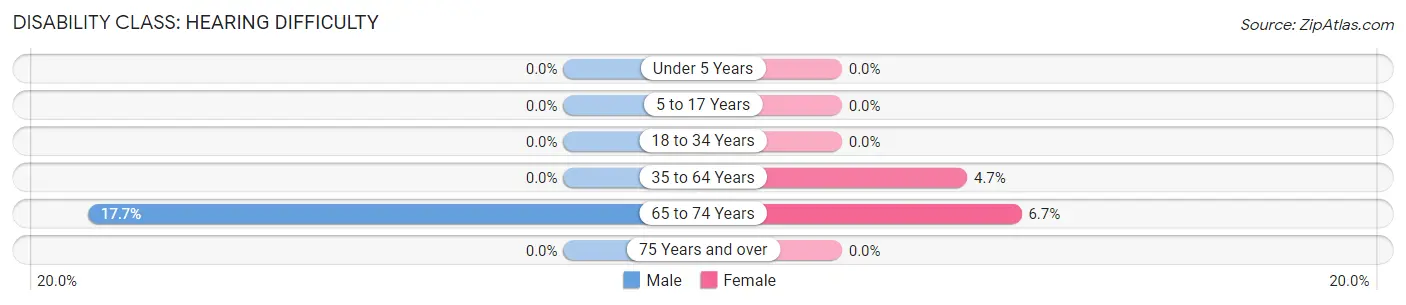
| Age Bracket | Male | Female |
| Under 5 Years | 0 (0.0%) | 0 (0.0%) |
| 5 to 17 Years | 0 (0.0%) | 0 (0.0%) |
| 18 to 34 Years | 0 (0.0%) | 0 (0.0%) |
| 35 to 64 Years | 0 (0.0%) | 4 (4.6%) |
| 65 to 74 Years | 6 (17.6%) | 3 (6.7%) |
| 75 Years and over | 0 (0.0%) | 0 (0.0%) |
Disability Class: Vision Difficulty
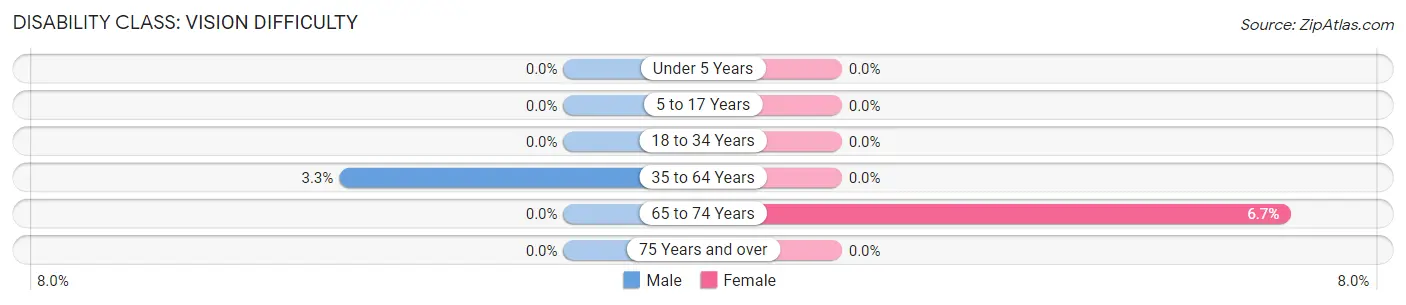
| Age Bracket | Male | Female |
| Under 5 Years | 0 (0.0%) | 0 (0.0%) |
| 5 to 17 Years | 0 (0.0%) | 0 (0.0%) |
| 18 to 34 Years | 0 (0.0%) | 0 (0.0%) |
| 35 to 64 Years | 3 (3.3%) | 0 (0.0%) |
| 65 to 74 Years | 0 (0.0%) | 3 (6.7%) |
| 75 Years and over | 0 (0.0%) | 0 (0.0%) |
Disability Class: Cognitive Difficulty
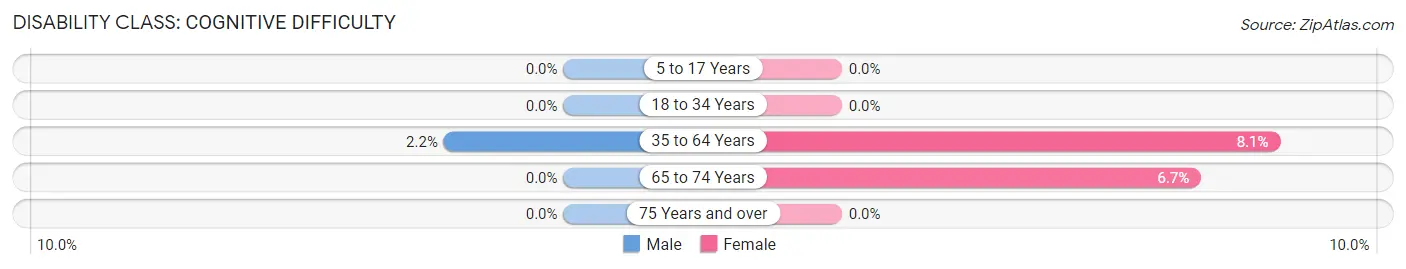
| Age Bracket | Male | Female |
| 5 to 17 Years | 0 (0.0%) | 0 (0.0%) |
| 18 to 34 Years | 0 (0.0%) | 0 (0.0%) |
| 35 to 64 Years | 2 (2.2%) | 7 (8.1%) |
| 65 to 74 Years | 0 (0.0%) | 3 (6.7%) |
| 75 Years and over | 0 (0.0%) | 0 (0.0%) |
Disability Class: Ambulatory Difficulty
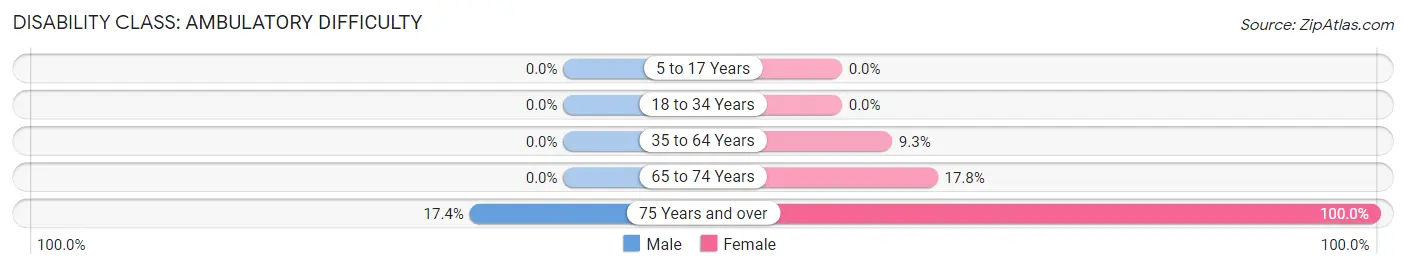
| Age Bracket | Male | Female |
| 5 to 17 Years | 0 (0.0%) | 0 (0.0%) |
| 18 to 34 Years | 0 (0.0%) | 0 (0.0%) |
| 35 to 64 Years | 0 (0.0%) | 8 (9.3%) |
| 65 to 74 Years | 0 (0.0%) | 8 (17.8%) |
| 75 Years and over | 4 (17.4%) | 22 (100.0%) |
Disability Class: Self-Care Difficulty
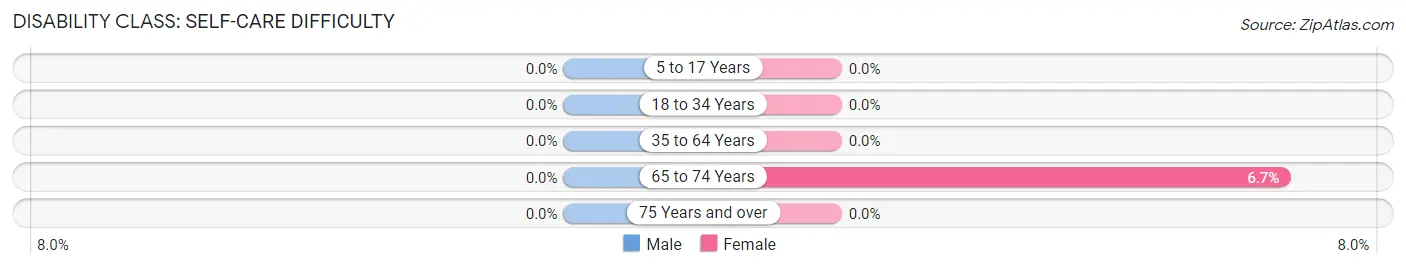
| Age Bracket | Male | Female |
| 5 to 17 Years | 0 (0.0%) | 0 (0.0%) |
| 18 to 34 Years | 0 (0.0%) | 0 (0.0%) |
| 35 to 64 Years | 0 (0.0%) | 0 (0.0%) |
| 65 to 74 Years | 0 (0.0%) | 3 (6.7%) |
| 75 Years and over | 0 (0.0%) | 0 (0.0%) |
Technology Access in Newton
Computing Device Access in Newton
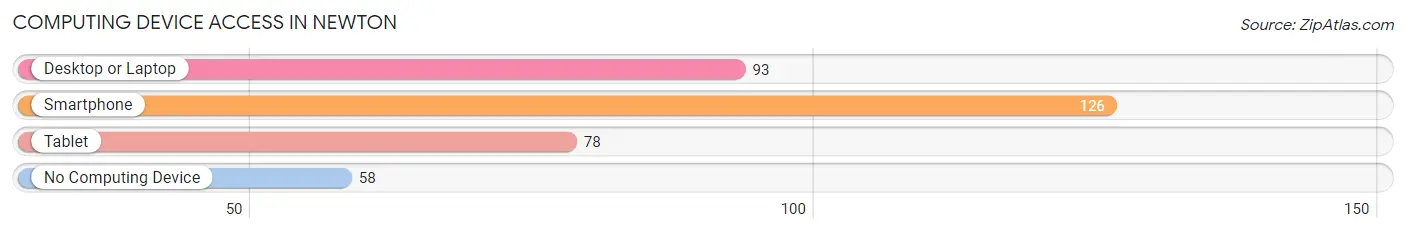
| Device Type | # Households | % Households |
| Desktop or Laptop | 93 | 45.2% |
| Smartphone | 126 | 61.2% |
| Tablet | 78 | 37.9% |
| No Computing Device | 58 | 28.2% |
| Total | 206 | 100.0% |
Internet Access in Newton
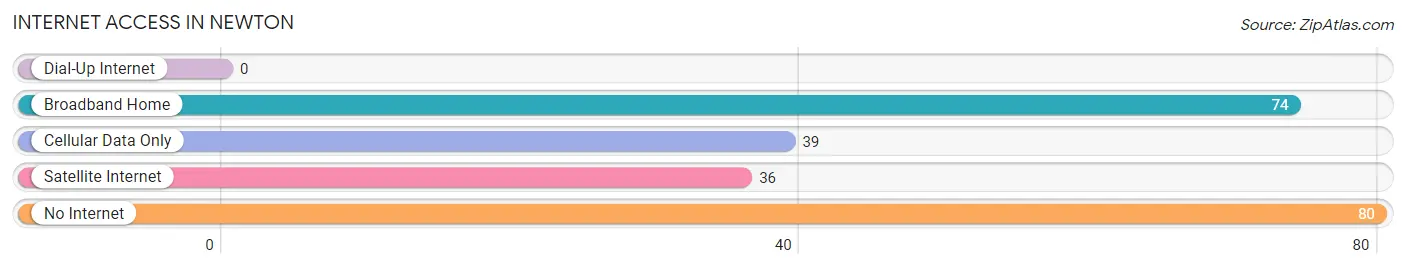
| Internet Type | # Households | % Households |
| Dial-Up Internet | 0 | 0.0% |
| Broadband Home | 74 | 35.9% |
| Cellular Data Only | 39 | 18.9% |
| Satellite Internet | 36 | 17.5% |
| No Internet | 80 | 38.8% |
| Total | 206 | 100.0% |
Newton Summary
Newton is a city located in the state of Georgia, United States. It is the county seat of Newton County and is part of the Atlanta metropolitan area. The city is located approximately 45 miles east of downtown Atlanta and is home to a population of approximately 15,000 people.
History
The area that is now Newton County was originally inhabited by the Creek Indians. The first European settlers arrived in the area in the late 1700s and early 1800s. The county was officially established in 1821 and was named after Sergeant John Newton, a hero of the American Revolutionary War.
The city of Newton was founded in 1823 and was named after the county. The city was originally a small farming community and was home to a few small businesses. In the late 1800s, the city began to grow and develop as the railroad was built through the area. This allowed for the transportation of goods and people to and from the city.
In the early 1900s, the city began to experience a period of growth and development. The city was home to several factories and businesses, including a cotton mill, a sawmill, and a brickyard. The city also became a popular tourist destination due to its proximity to Atlanta.
Geography
Newton is located in the Piedmont region of Georgia. The city is situated in the foothills of the Appalachian Mountains and is located approximately 45 miles east of downtown Atlanta. The city is located at the intersection of Interstate 20 and US Highway 278.
The city has a total area of 8.3 square miles, of which 8.2 square miles is land and 0.1 square miles is water. The city is located in a humid subtropical climate zone and experiences hot, humid summers and mild winters.
Economy
The economy of Newton is largely based on manufacturing and retail. The city is home to several factories and businesses, including a cotton mill, a sawmill, and a brickyard. The city is also home to several retail stores, restaurants, and other businesses.
The city is also home to several educational institutions, including Georgia Piedmont Technical College and Oxford College of Emory University. The city is also home to several parks and recreational areas, including the Newton County Recreation Center and the Newton County Historical Society.
Demographics
As of the 2010 census, the city of Newton had a population of 15,234 people. The racial makeup of the city was 65.3% White, 28.2% African American, 0.3% Native American, 1.2% Asian, 0.1% Pacific Islander, 3.2% from other races, and 1.9% from two or more races. Hispanic or Latino of any race were 6.2% of the population.
The median household income in the city was $37,945 and the median family income was $45,945. The per capita income in the city was $19,945. About 17.2% of the population was below the poverty line.
Newton is a city with a rich history and a vibrant economy. The city is home to several factories and businesses, as well as several educational institutions and recreational areas. The city is also home to a diverse population with a variety of racial and ethnic backgrounds.
Common Questions
What is Per Capita Income in Newton?
Per Capita income in Newton is $23,152.
What is the Median Family Income in Newton?
Median Family Income in Newton is $53,654.
What is the Median Household income in Newton?
Median Household Income in Newton is $31,406.
What is Inequality or Gini Index in Newton?
Inequality or Gini Index in Newton is 0.56.
What is the Total Population of Newton?
Total Population of Newton is 504.
What is the Total Male Population of Newton?
Total Male Population of Newton is 239.
What is the Total Female Population of Newton?
Total Female Population of Newton is 265.
What is the Ratio of Males per 100 Females in Newton?
There are 90.19 Males per 100 Females in Newton.
What is the Ratio of Females per 100 Males in Newton?
There are 110.88 Females per 100 Males in Newton.
What is the Median Population Age in Newton?
Median Population Age in Newton is 41.0 Years.
What is the Average Family Size in Newton
Average Family Size in Newton is 3.1 People.
What is the Average Household Size in Newton
Average Household Size in Newton is 2.5 People.
How Large is the Labor Force in Newton?
There are 187 People in the Labor Forcein in Newton.
What is the Percentage of People in the Labor Force in Newton?
48.7% of People are in the Labor Force in Newton.
What is the Unemployment Rate in Newton?
Unemployment Rate in Newton is 2.7%.