Tifton, GA Map & Demographics
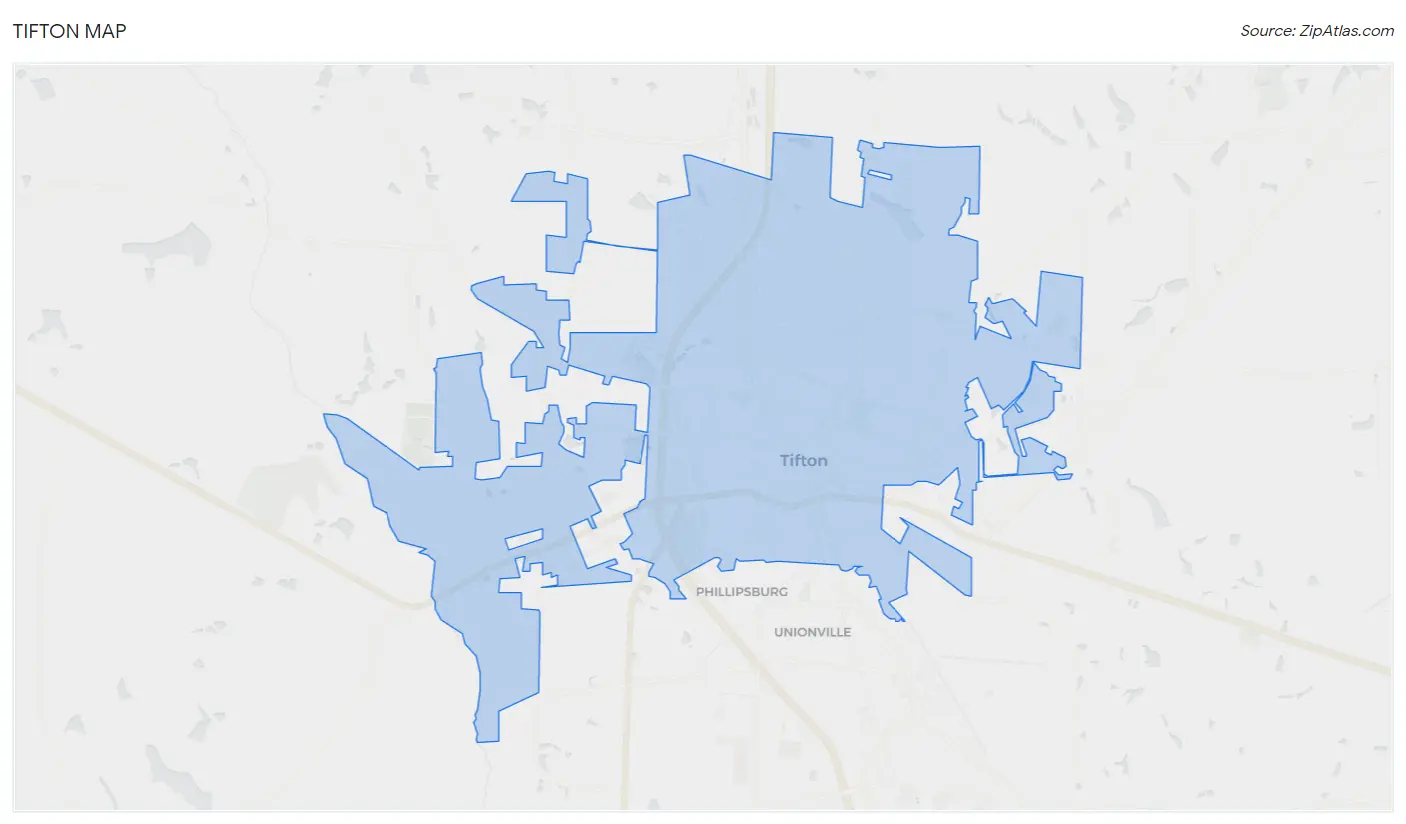
Tifton Map
Tifton Overview
$25,714
PER CAPITA INCOME
$53,268
AVG FAMILY INCOME
$42,200
AVG HOUSEHOLD INCOME
23.4%
WAGE / INCOME GAP [ % ]
76.6¢/ $1
WAGE / INCOME GAP [ $ ]
$13,759
FAMILY INCOME DEFICIT
0.46
INEQUALITY / GINI INDEX
17,059
TOTAL POPULATION
8,357
MALE POPULATION
8,702
FEMALE POPULATION
96.04
MALES / 100 FEMALES
104.13
FEMALES / 100 MALES
34.6
MEDIAN AGE
3.1
AVG FAMILY SIZE
2.3
AVG HOUSEHOLD SIZE
7,426
LABOR FORCE [ PEOPLE ]
54.7%
PERCENT IN LABOR FORCE
2.5%
UNEMPLOYMENT RATE
Tifton Area Codes
Income in Tifton
Income Overview in Tifton
Per Capita Income in Tifton is $25,714, while median incomes of families and households are $53,268 and $42,200 respectively.
| Characteristic | Number | Measure |
| Per Capita Income | 17,059 | $25,714 |
| Median Family Income | 3,777 | $53,268 |
| Mean Family Income | 3,777 | $67,483 |
| Median Household Income | 6,613 | $42,200 |
| Mean Household Income | 6,613 | $60,942 |
| Income Deficit | 3,777 | $13,759 |
| Wage / Income Gap (%) | 17,059 | 23.40% |
| Wage / Income Gap ($) | 17,059 | 76.60¢ per $1 |
| Gini / Inequality Index | 17,059 | 0.46 |
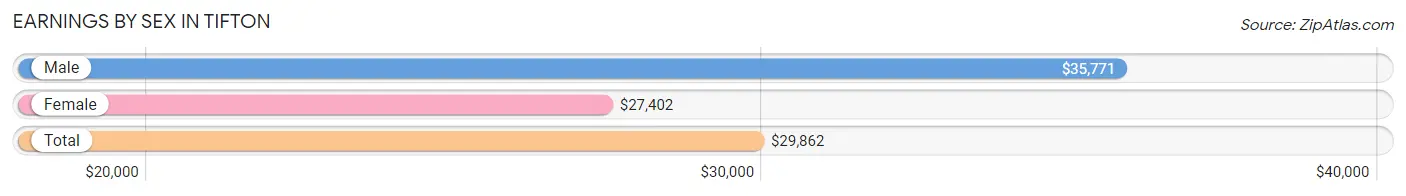
Earnings by Sex in Tifton
Average Earnings in Tifton are $29,862, $35,771 for men and $27,402 for women, a difference of 23.4%.
| Sex | Number | Average Earnings |
| Male | 4,306 (51.4%) | $35,771 |
| Female | 4,068 (48.6%) | $27,402 |
| Total | 8,374 (100.0%) | $29,862 |
Earnings by Sex by Income Bracket in Tifton
The most common earnings brackets in Tifton are $35,000 to $39,999 for men (448 | 10.4%) and $25,000 to $29,999 for women (556 | 13.7%).
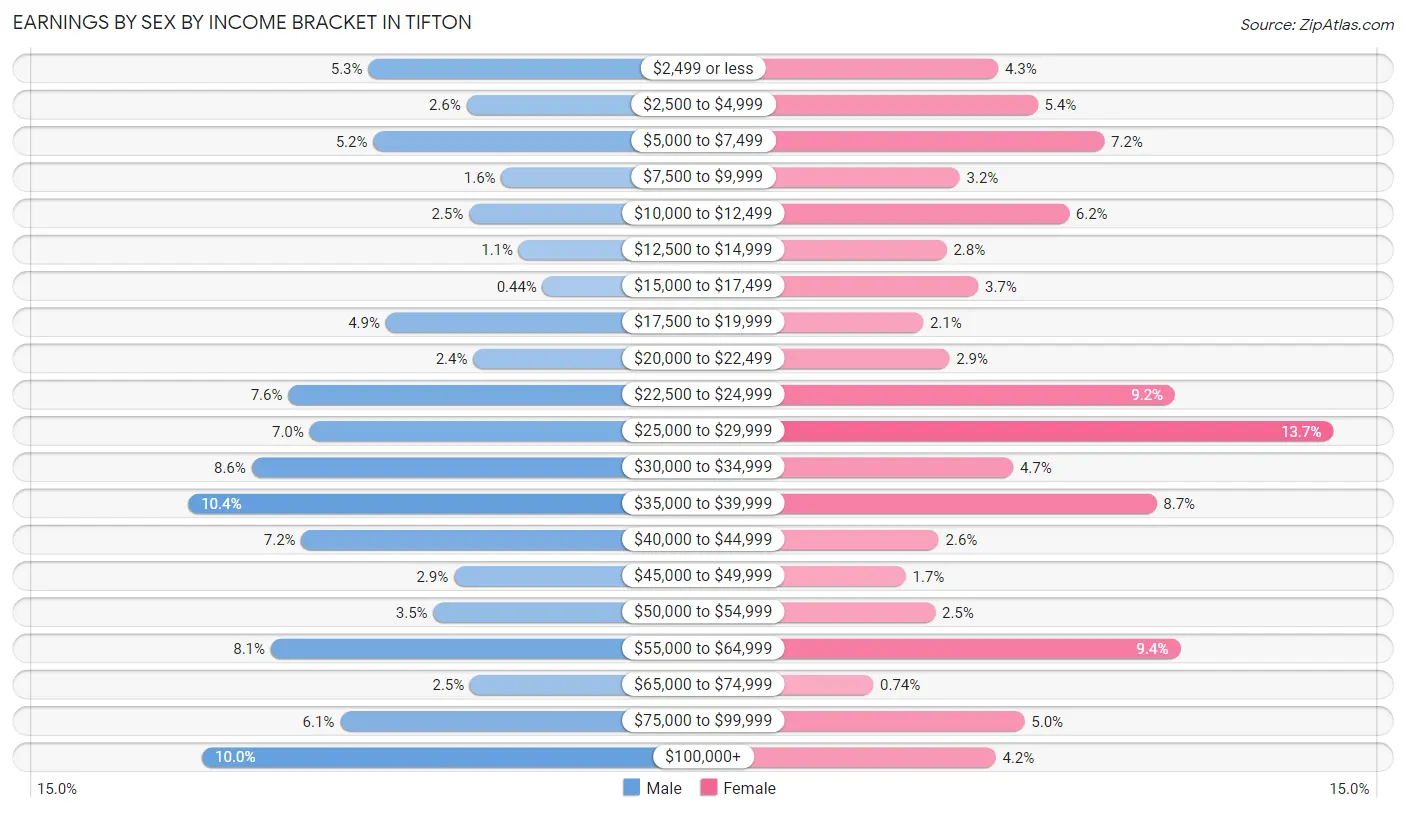
| Income | Male | Female |
| $2,499 or less | 230 (5.3%) | 173 (4.3%) |
| $2,500 to $4,999 | 111 (2.6%) | 218 (5.4%) |
| $5,000 to $7,499 | 224 (5.2%) | 294 (7.2%) |
| $7,500 to $9,999 | 69 (1.6%) | 129 (3.2%) |
| $10,000 to $12,499 | 108 (2.5%) | 254 (6.2%) |
| $12,500 to $14,999 | 48 (1.1%) | 114 (2.8%) |
| $15,000 to $17,499 | 19 (0.4%) | 150 (3.7%) |
| $17,500 to $19,999 | 209 (4.9%) | 87 (2.1%) |
| $20,000 to $22,499 | 103 (2.4%) | 117 (2.9%) |
| $22,500 to $24,999 | 327 (7.6%) | 375 (9.2%) |
| $25,000 to $29,999 | 301 (7.0%) | 556 (13.7%) |
| $30,000 to $34,999 | 371 (8.6%) | 190 (4.7%) |
| $35,000 to $39,999 | 448 (10.4%) | 354 (8.7%) |
| $40,000 to $44,999 | 311 (7.2%) | 105 (2.6%) |
| $45,000 to $49,999 | 126 (2.9%) | 67 (1.7%) |
| $50,000 to $54,999 | 151 (3.5%) | 101 (2.5%) |
| $55,000 to $64,999 | 348 (8.1%) | 381 (9.4%) |
| $65,000 to $74,999 | 107 (2.5%) | 30 (0.7%) |
| $75,000 to $99,999 | 264 (6.1%) | 203 (5.0%) |
| $100,000+ | 431 (10.0%) | 170 (4.2%) |
| Total | 4,306 (100.0%) | 4,068 (100.0%) |
Earnings by Sex by Educational Attainment in Tifton
Average earnings in Tifton are $39,038 for men and $29,278 for women, a difference of 25.0%. Men with an educational attainment of bachelor's degree enjoy the highest average annual earnings of $83,285, while those with high school diploma education earn the least with $36,135. Women with an educational attainment of graduate degree earn the most with the average annual earnings of $62,384, while those with high school diploma education have the smallest earnings of $23,915.
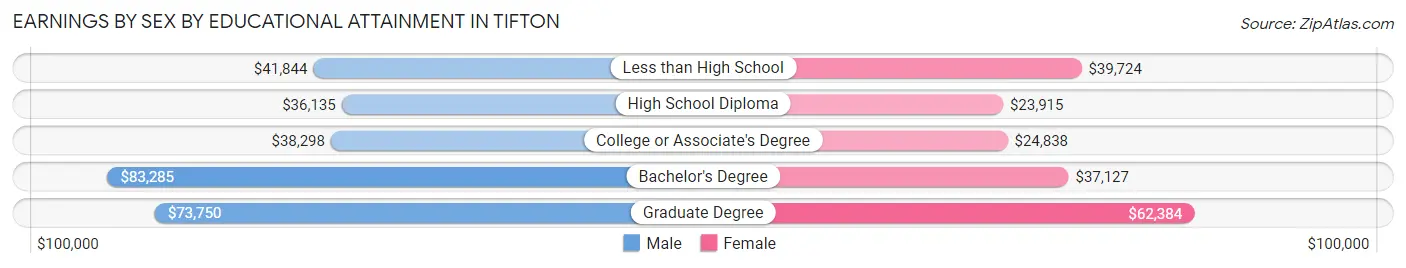
| Educational Attainment | Male Income | Female Income |
| Less than High School | $41,844 | $39,724 |
| High School Diploma | $36,135 | $23,915 |
| College or Associate's Degree | $38,298 | $24,838 |
| Bachelor's Degree | $83,285 | $37,127 |
| Graduate Degree | $73,750 | $62,384 |
| Total | $39,038 | $29,278 |
Family Income in Tifton
Family Income Brackets in Tifton
According to the Tifton family income data, there are 604 families falling into the $50,000 to $74,999 income range, which is the most common income bracket and makes up 16.0% of all families. Conversely, the $200,000+ income bracket is the least frequent group with only 42 families (1.1%) belonging to this category.
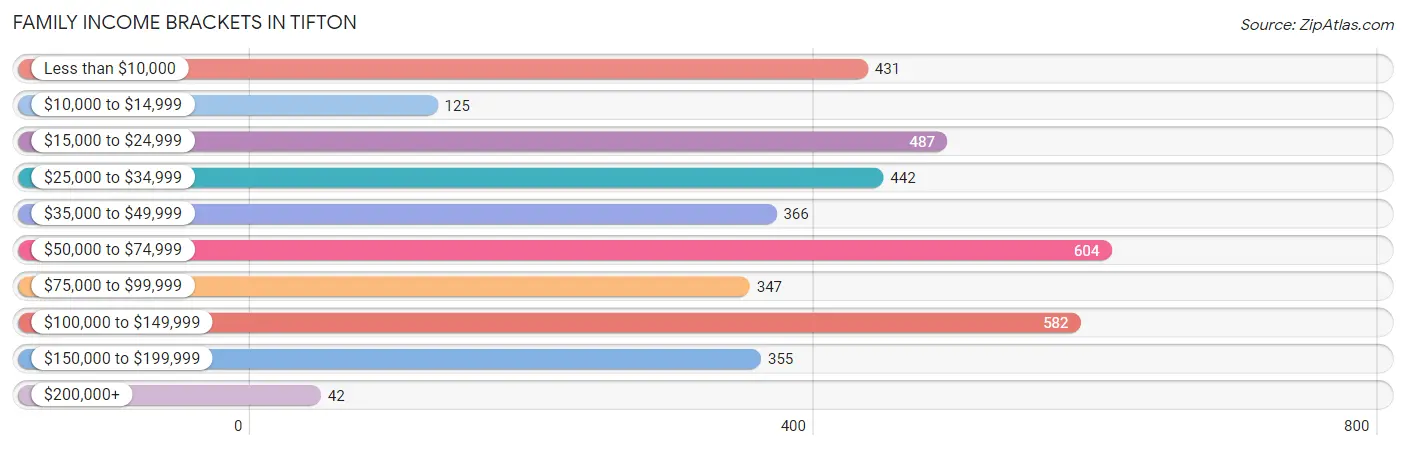
| Income Bracket | # Families | % Families |
| Less than $10,000 | 431 | 11.4% |
| $10,000 to $14,999 | 125 | 3.3% |
| $15,000 to $24,999 | 487 | 12.9% |
| $25,000 to $34,999 | 442 | 11.7% |
| $35,000 to $49,999 | 366 | 9.7% |
| $50,000 to $74,999 | 604 | 16.0% |
| $75,000 to $99,999 | 347 | 9.2% |
| $100,000 to $149,999 | 582 | 15.4% |
| $150,000 to $199,999 | 355 | 9.4% |
| $200,000+ | 42 | 1.1% |
Family Income by Famaliy Size in Tifton
4-person families (793 | 21.0%) account for the highest median family income in Tifton with $83,933 per family, while 2-person families (1,861 | 49.3%) have the highest median income of $22,643 per family member.
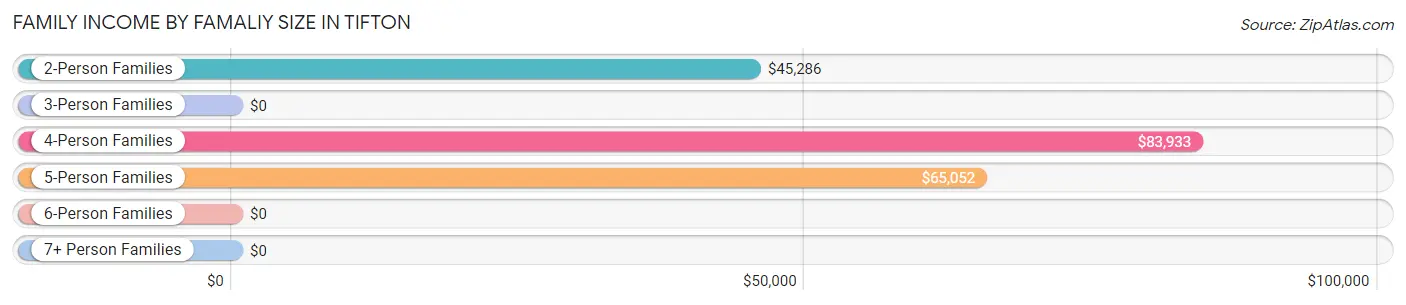
| Income Bracket | # Families | Median Income |
| 2-Person Families | 1,861 (49.3%) | $45,286 |
| 3-Person Families | 961 (25.4%) | $0 |
| 4-Person Families | 793 (21.0%) | $83,933 |
| 5-Person Families | 104 (2.8%) | $65,052 |
| 6-Person Families | 49 (1.3%) | $0 |
| 7+ Person Families | 9 (0.2%) | $0 |
| Total | 3,777 (100.0%) | $53,268 |
Family Income by Number of Earners in Tifton
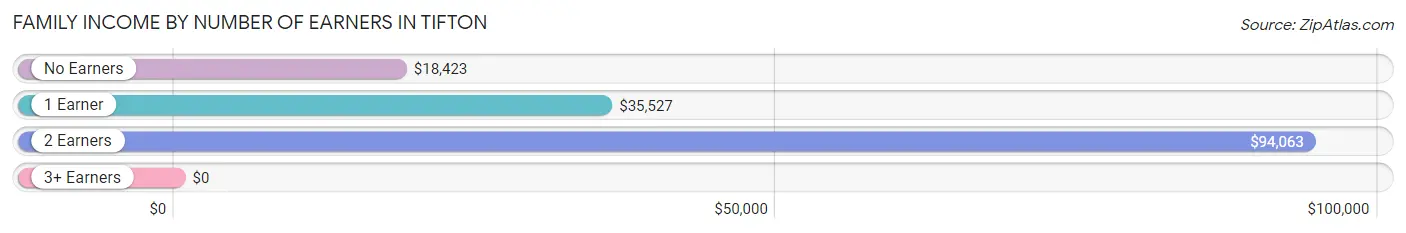
| Number of Earners | # Families | Median Income |
| No Earners | 1,005 (26.6%) | $18,423 |
| 1 Earner | 1,320 (34.9%) | $35,527 |
| 2 Earners | 1,248 (33.0%) | $94,063 |
| 3+ Earners | 204 (5.4%) | $0 |
| Total | 3,777 (100.0%) | $53,268 |
Household Income in Tifton
Household Income Brackets in Tifton
With 1,276 households falling in the category, the $50,000 to $74,999 income range is the most frequent in Tifton, accounting for 19.3% of all households. In contrast, only 79 households (1.2%) fall into the $200,000+ income bracket, making it the least populous group.
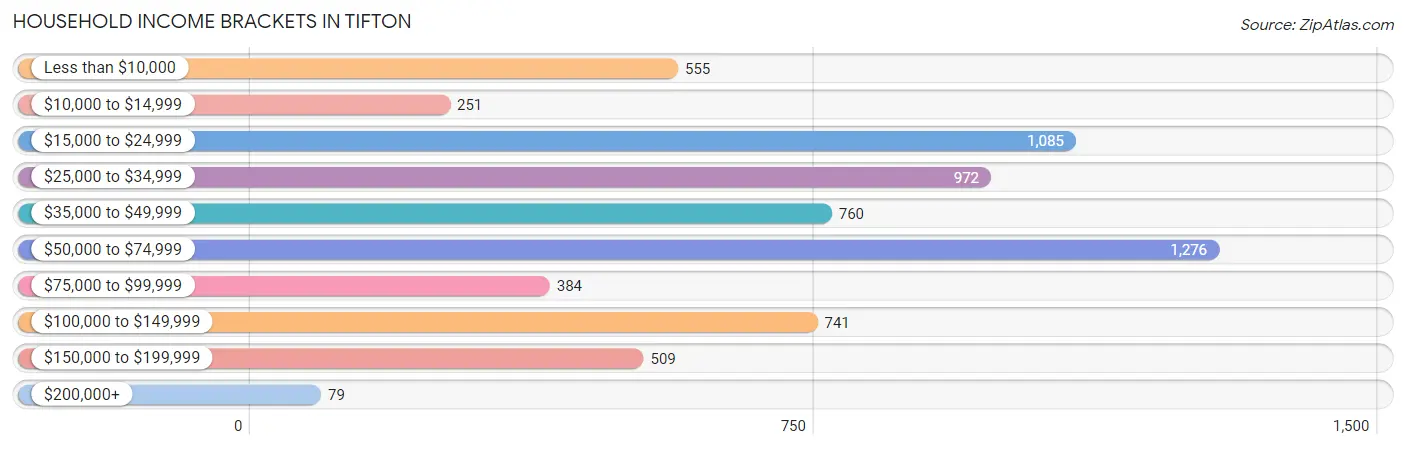
| Income Bracket | # Households | % Households |
| Less than $10,000 | 555 | 8.4% |
| $10,000 to $14,999 | 251 | 3.8% |
| $15,000 to $24,999 | 1,085 | 16.4% |
| $25,000 to $34,999 | 972 | 14.7% |
| $35,000 to $49,999 | 760 | 11.5% |
| $50,000 to $74,999 | 1,276 | 19.3% |
| $75,000 to $99,999 | 384 | 5.8% |
| $100,000 to $149,999 | 741 | 11.2% |
| $150,000 to $199,999 | 509 | 7.7% |
| $200,000+ | 79 | 1.2% |
Household Income by Householder Age in Tifton
The median household income in Tifton is $42,200, with the highest median household income of $52,980 found in the 25 to 44 years age bracket for the primary householder. A total of 2,306 households (34.9%) fall into this category. Meanwhile, the 65+ years age bracket for the primary householder has the lowest median household income of $28,988, with 1,711 households (25.9%) in this group.
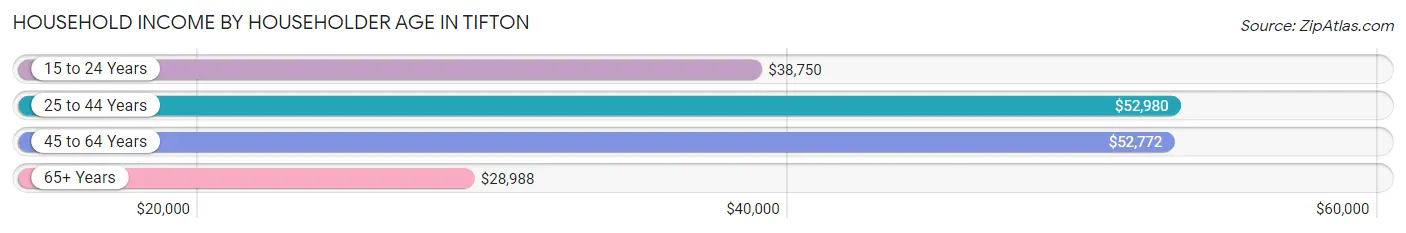
| Income Bracket | # Households | Median Income |
| 15 to 24 Years | 399 (6.0%) | $38,750 |
| 25 to 44 Years | 2,306 (34.9%) | $52,980 |
| 45 to 64 Years | 2,197 (33.2%) | $52,772 |
| 65+ Years | 1,711 (25.9%) | $28,988 |
| Total | 6,613 (100.0%) | $42,200 |
Poverty in Tifton
Income Below Poverty by Sex and Age in Tifton
With 22.0% poverty level for males and 26.7% for females among the residents of Tifton, 5 year old males and 5 year old females are the most vulnerable to poverty, with 97 males (83.6%) and 38 females (100.0%) in their respective age groups living below the poverty level.
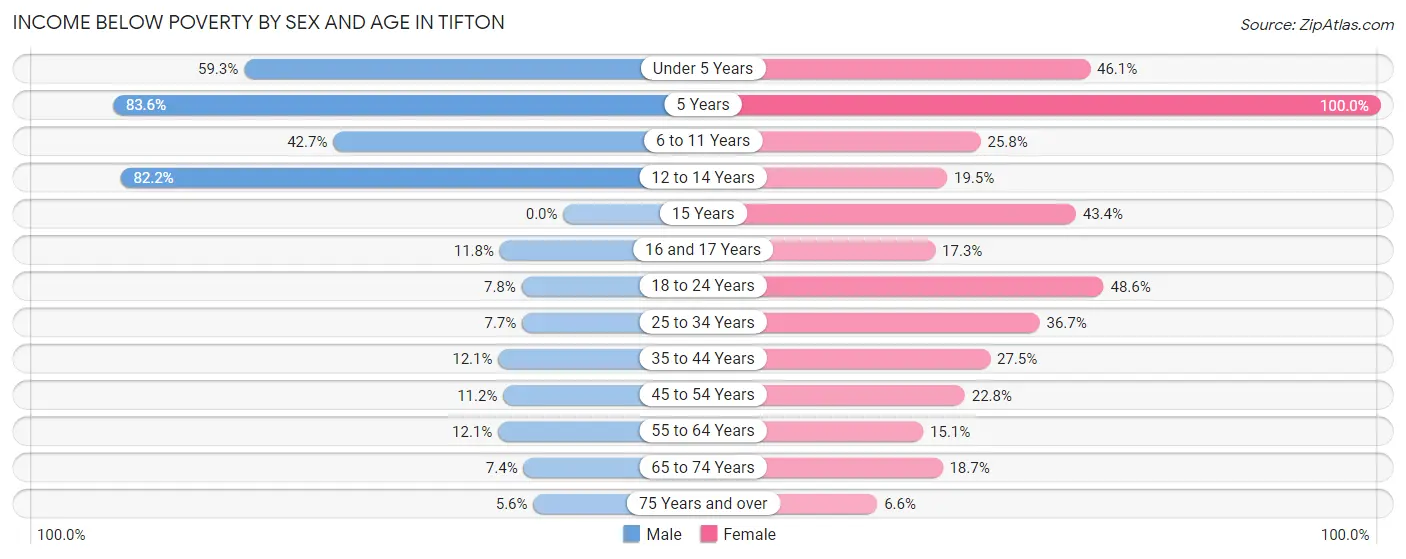
| Age Bracket | Male | Female |
| Under 5 Years | 441 (59.3%) | 241 (46.1%) |
| 5 Years | 97 (83.6%) | 38 (100.0%) |
| 6 to 11 Years | 249 (42.7%) | 146 (25.8%) |
| 12 to 14 Years | 314 (82.2%) | 58 (19.5%) |
| 15 Years | 0 (0.0%) | 53 (43.4%) |
| 16 and 17 Years | 33 (11.8%) | 35 (17.3%) |
| 18 to 24 Years | 42 (7.7%) | 308 (48.6%) |
| 25 to 34 Years | 96 (7.7%) | 388 (36.7%) |
| 35 to 44 Years | 127 (12.1%) | 290 (27.5%) |
| 45 to 54 Years | 70 (11.2%) | 245 (22.8%) |
| 55 to 64 Years | 94 (12.1%) | 148 (15.1%) |
| 65 to 74 Years | 51 (7.4%) | 145 (18.7%) |
| 75 Years and over | 20 (5.6%) | 45 (6.6%) |
| Total | 1,634 (22.0%) | 2,140 (26.7%) |
Income Above Poverty by Sex and Age in Tifton
According to the poverty statistics in Tifton, males aged 15 years and females aged 75 years and over are the age groups that are most secure financially, with 100.0% of males and 93.4% of females in these age groups living above the poverty line.
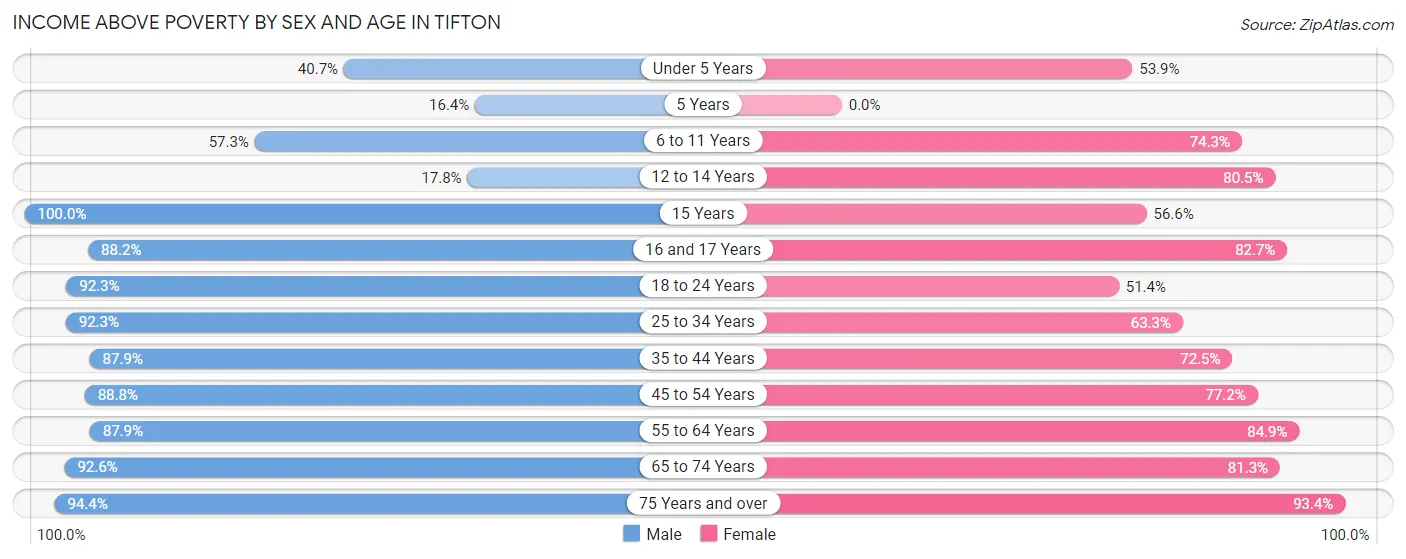
| Age Bracket | Male | Female |
| Under 5 Years | 303 (40.7%) | 282 (53.9%) |
| 5 Years | 19 (16.4%) | 0 (0.0%) |
| 6 to 11 Years | 334 (57.3%) | 421 (74.3%) |
| 12 to 14 Years | 68 (17.8%) | 239 (80.5%) |
| 15 Years | 31 (100.0%) | 69 (56.6%) |
| 16 and 17 Years | 247 (88.2%) | 167 (82.7%) |
| 18 to 24 Years | 500 (92.2%) | 326 (51.4%) |
| 25 to 34 Years | 1,158 (92.3%) | 669 (63.3%) |
| 35 to 44 Years | 924 (87.9%) | 764 (72.5%) |
| 45 to 54 Years | 557 (88.8%) | 828 (77.2%) |
| 55 to 64 Years | 682 (87.9%) | 833 (84.9%) |
| 65 to 74 Years | 638 (92.6%) | 631 (81.3%) |
| 75 Years and over | 339 (94.4%) | 640 (93.4%) |
| Total | 5,800 (78.0%) | 5,869 (73.3%) |
Income Below Poverty Among Married-Couple Families in Tifton
The poverty statistics for married-couple families in Tifton show that 4.5% or 81 of the total 1,799 families live below the poverty line. Families with 1 or 2 children have the highest poverty rate of 10.2%, comprising of 55 families. On the other hand, families with 3 or 4 children have the lowest poverty rate of 0.0%, which includes 0 families.
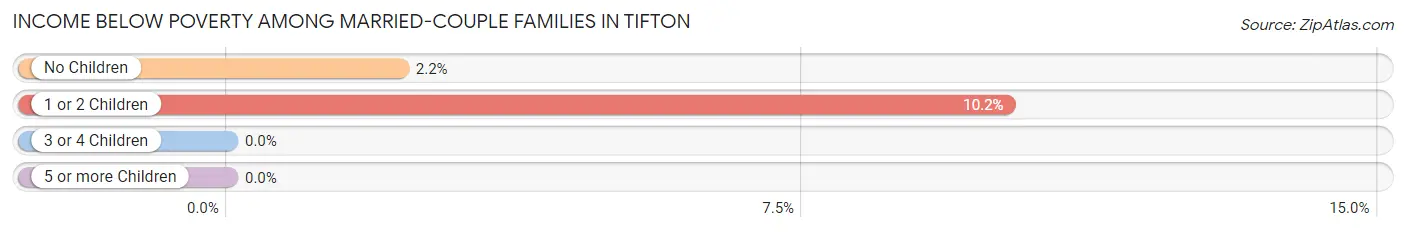
| Children | Above Poverty | Below Poverty |
| No Children | 1,142 (97.8%) | 26 (2.2%) |
| 1 or 2 Children | 487 (89.8%) | 55 (10.2%) |
| 3 or 4 Children | 89 (100.0%) | 0 (0.0%) |
| 5 or more Children | 0 (0.0%) | 0 (0.0%) |
| Total | 1,718 (95.5%) | 81 (4.5%) |
Income Below Poverty Among Single-Parent Households in Tifton
According to the poverty data in Tifton, 19.7% or 93 single-father households and 39.6% or 596 single-mother households are living below the poverty line. Among single-father households, those with 3 or 4 children have the highest poverty rate, with 54 households (85.7%) experiencing poverty. Likewise, among single-mother households, those with 3 or 4 children have the highest poverty rate, with 134 households (57.8%) falling below the poverty line.
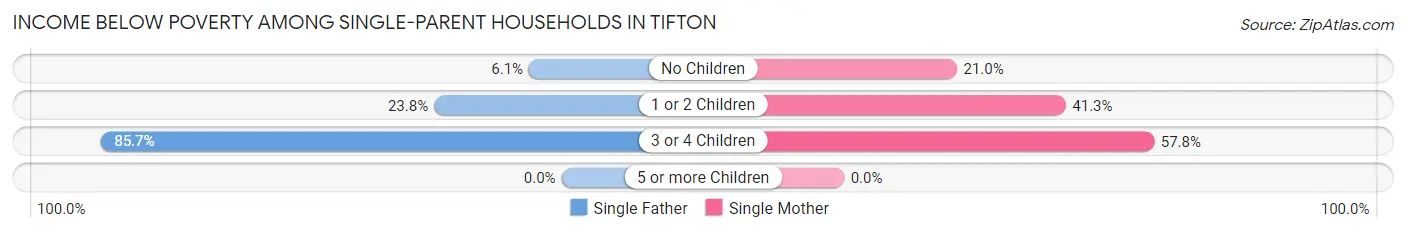
| Children | Single Father | Single Mother |
| No Children | 20 (6.1%) | 66 (21.0%) |
| 1 or 2 Children | 19 (23.7%) | 396 (41.3%) |
| 3 or 4 Children | 54 (85.7%) | 134 (57.8%) |
| 5 or more Children | 0 (0.0%) | 0 (0.0%) |
| Total | 93 (19.7%) | 596 (39.6%) |
Income Below Poverty Among Married-Couple vs Single-Parent Households in Tifton
The poverty data for Tifton shows that 81 of the married-couple family households (4.5%) and 689 of the single-parent households (34.8%) are living below the poverty level. Within the married-couple family households, those with 1 or 2 children have the highest poverty rate, with 55 households (10.2%) falling below the poverty line. Among the single-parent households, those with 3 or 4 children have the highest poverty rate, with 188 household (63.7%) living below poverty.
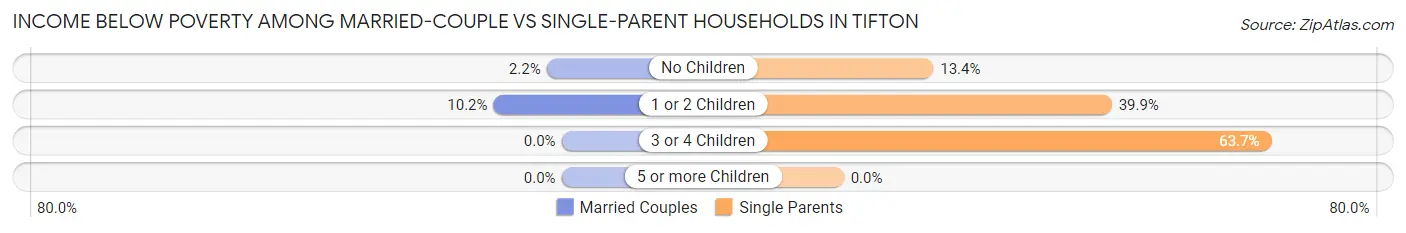
| Children | Married-Couple Families | Single-Parent Households |
| No Children | 26 (2.2%) | 86 (13.4%) |
| 1 or 2 Children | 55 (10.2%) | 415 (39.9%) |
| 3 or 4 Children | 0 (0.0%) | 188 (63.7%) |
| 5 or more Children | 0 (0.0%) | 0 (0.0%) |
| Total | 81 (4.5%) | 689 (34.8%) |
Race in Tifton
The most populous races in Tifton are White / Caucasian (8,528 | 50.0%), Black / African American (5,697 | 33.4%), and Hispanic or Latino (2,472 | 14.5%).
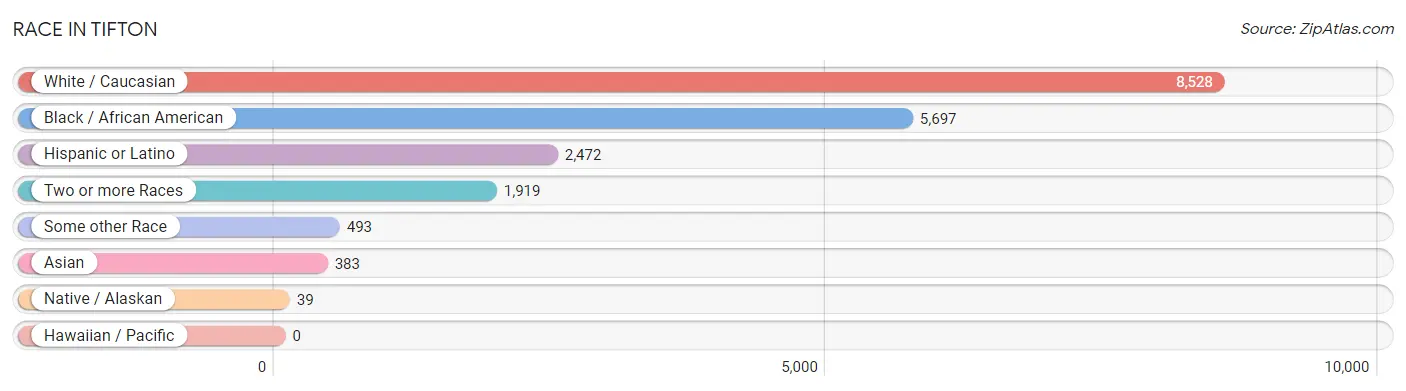
| Race | # Population | % Population |
| Asian | 383 | 2.2% |
| Black / African American | 5,697 | 33.4% |
| Hawaiian / Pacific | 0 | 0.0% |
| Hispanic or Latino | 2,472 | 14.5% |
| Native / Alaskan | 39 | 0.2% |
| White / Caucasian | 8,528 | 50.0% |
| Two or more Races | 1,919 | 11.3% |
| Some other Race | 493 | 2.9% |
| Total | 17,059 | 100.0% |
Ancestry in Tifton
The most populous ancestries reported in Tifton are American (4,408 | 25.8%), Mexican (2,163 | 12.7%), Irish (926 | 5.4%), English (833 | 4.9%), and German (486 | 2.9%), together accounting for 51.7% of all Tifton residents.
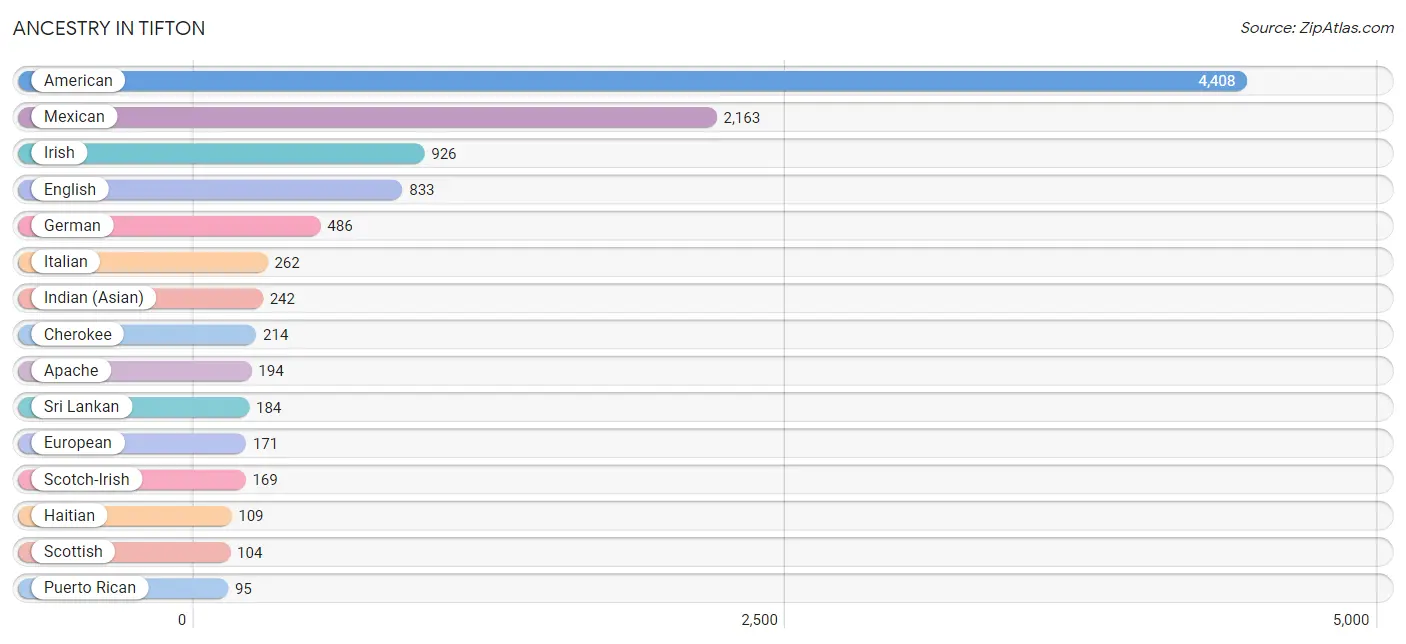
| Ancestry | # Population | % Population |
| African | 54 | 0.3% |
| American | 4,408 | 25.8% |
| Apache | 194 | 1.1% |
| Arab | 60 | 0.4% |
| British | 32 | 0.2% |
| Burmese | 10 | 0.1% |
| Central American | 73 | 0.4% |
| Cherokee | 214 | 1.3% |
| Colville | 7 | 0.0% |
| Cuban | 21 | 0.1% |
| Czech | 13 | 0.1% |
| Danish | 5 | 0.0% |
| Dutch | 53 | 0.3% |
| Eastern European | 14 | 0.1% |
| English | 833 | 4.9% |
| European | 171 | 1.0% |
| French | 77 | 0.4% |
| German | 486 | 2.9% |
| Greek | 11 | 0.1% |
| Haitian | 109 | 0.6% |
| Honduran | 60 | 0.4% |
| Indian (Asian) | 242 | 1.4% |
| Iraqi | 23 | 0.1% |
| Irish | 926 | 5.4% |
| Iroquois | 8 | 0.1% |
| Italian | 262 | 1.5% |
| Korean | 32 | 0.2% |
| Lithuanian | 10 | 0.1% |
| Mexican | 2,163 | 12.7% |
| Norwegian | 12 | 0.1% |
| Panamanian | 13 | 0.1% |
| Polish | 61 | 0.4% |
| Portuguese | 21 | 0.1% |
| Puerto Rican | 95 | 0.6% |
| Scotch-Irish | 169 | 1.0% |
| Scottish | 104 | 0.6% |
| Seminole | 8 | 0.1% |
| Slovak | 13 | 0.1% |
| Spaniard | 30 | 0.2% |
| Spanish | 20 | 0.1% |
| Sri Lankan | 184 | 1.1% |
| Subsaharan African | 54 | 0.3% |
| Thai | 45 | 0.3% |
| Trinidadian and Tobagonian | 1 | 0.0% |
| Welsh | 45 | 0.3% | View All 45 Rows |
Immigrants in Tifton
The most numerous immigrant groups reported in Tifton came from Latin America (735 | 4.3%), Central America (734 | 4.3%), Mexico (674 | 4.0%), Asia (279 | 1.6%), and Eastern Asia (136 | 0.8%), together accounting for 15.0% of all Tifton residents.
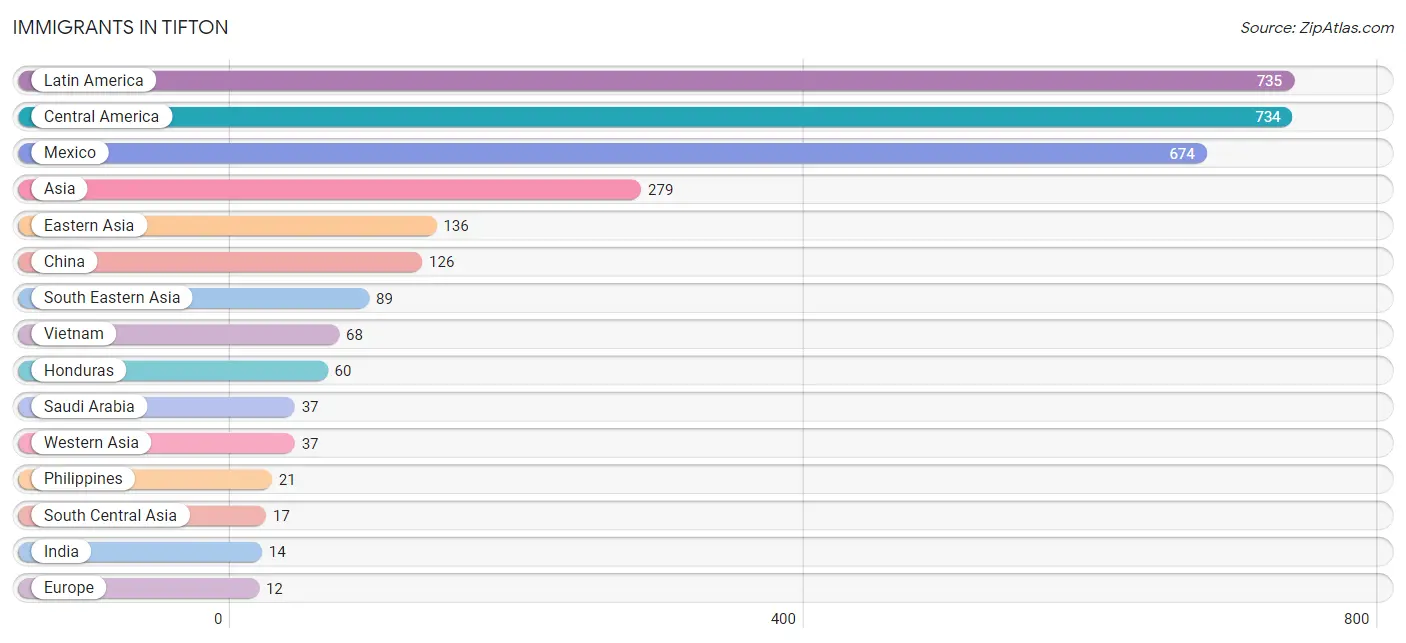
| Immigration Origin | # Population | % Population |
| Asia | 279 | 1.6% |
| Caribbean | 1 | 0.0% |
| Central America | 734 | 4.3% |
| China | 126 | 0.7% |
| Eastern Asia | 136 | 0.8% |
| Europe | 12 | 0.1% |
| France | 12 | 0.1% |
| Honduras | 60 | 0.4% |
| India | 14 | 0.1% |
| Korea | 10 | 0.1% |
| Latin America | 735 | 4.3% |
| Mexico | 674 | 4.0% |
| Philippines | 21 | 0.1% |
| Saudi Arabia | 37 | 0.2% |
| South Central Asia | 17 | 0.1% |
| South Eastern Asia | 89 | 0.5% |
| Sri Lanka | 3 | 0.0% |
| Trinidad and Tobago | 1 | 0.0% |
| Vietnam | 68 | 0.4% |
| Western Asia | 37 | 0.2% |
| Western Europe | 12 | 0.1% | View All 21 Rows |
Sex and Age in Tifton
Sex and Age in Tifton
The most populous age groups in Tifton are 25 to 29 Years (745 | 8.9%) for men and 15 to 19 Years (892 | 10.2%) for women.
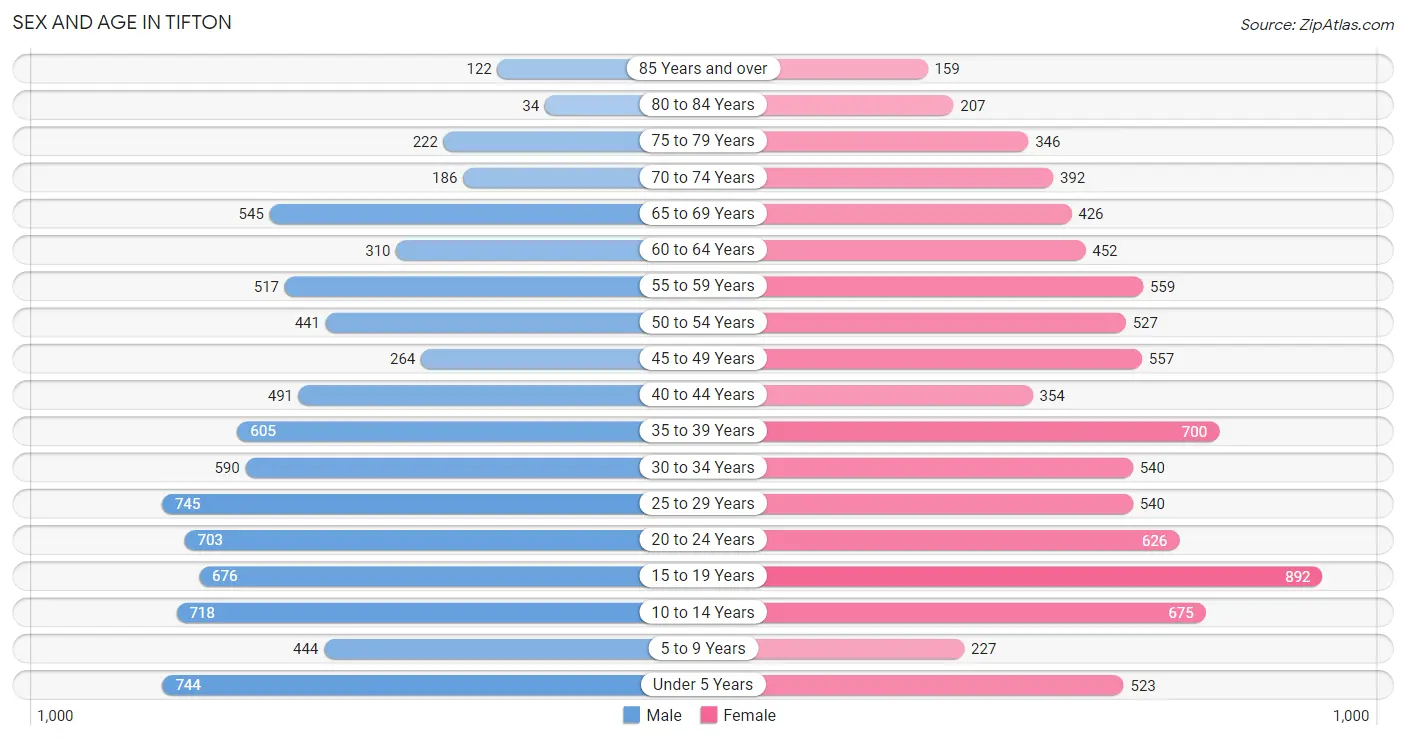
| Age Bracket | Male | Female |
| Under 5 Years | 744 (8.9%) | 523 (6.0%) |
| 5 to 9 Years | 444 (5.3%) | 227 (2.6%) |
| 10 to 14 Years | 718 (8.6%) | 675 (7.8%) |
| 15 to 19 Years | 676 (8.1%) | 892 (10.2%) |
| 20 to 24 Years | 703 (8.4%) | 626 (7.2%) |
| 25 to 29 Years | 745 (8.9%) | 540 (6.2%) |
| 30 to 34 Years | 590 (7.1%) | 540 (6.2%) |
| 35 to 39 Years | 605 (7.2%) | 700 (8.0%) |
| 40 to 44 Years | 491 (5.9%) | 354 (4.1%) |
| 45 to 49 Years | 264 (3.2%) | 557 (6.4%) |
| 50 to 54 Years | 441 (5.3%) | 527 (6.1%) |
| 55 to 59 Years | 517 (6.2%) | 559 (6.4%) |
| 60 to 64 Years | 310 (3.7%) | 452 (5.2%) |
| 65 to 69 Years | 545 (6.5%) | 426 (4.9%) |
| 70 to 74 Years | 186 (2.2%) | 392 (4.5%) |
| 75 to 79 Years | 222 (2.7%) | 346 (4.0%) |
| 80 to 84 Years | 34 (0.4%) | 207 (2.4%) |
| 85 Years and over | 122 (1.5%) | 159 (1.8%) |
| Total | 8,357 (100.0%) | 8,702 (100.0%) |
Families and Households in Tifton
Median Family Size in Tifton
The median family size in Tifton is 3.10 persons per family, with single female/mother families (1,505 | 39.9%) accounting for the largest median family size of 3.2 persons per family. On the other hand, married-couple families (1,799 | 47.6%) represent the smallest median family size with 3.00 persons per family.
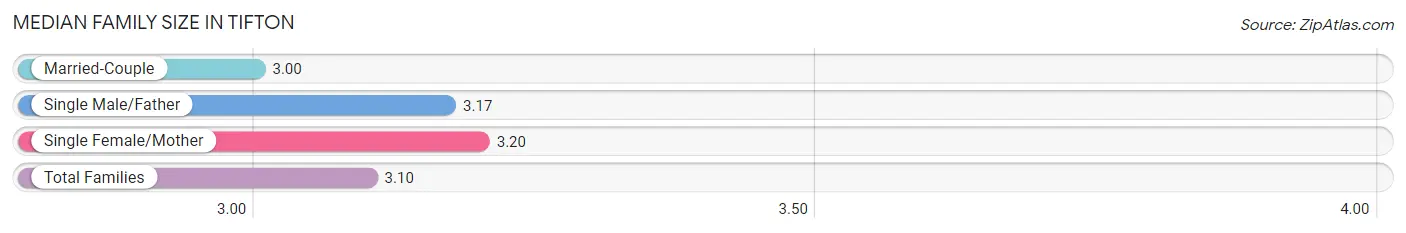
| Family Type | # Families | Family Size |
| Married-Couple | 1,799 (47.6%) | 3.00 |
| Single Male/Father | 473 (12.5%) | 3.17 |
| Single Female/Mother | 1,505 (39.9%) | 3.20 |
| Total Families | 3,777 (100.0%) | 3.10 |
Median Household Size in Tifton
The median household size in Tifton is 2.33 persons per household, with single male/father households (473 | 7.1%) accounting for the largest median household size of 3.61 persons per household. non-family households (2,836 | 42.9%) represent the smallest median household size with 1.17 persons per household.
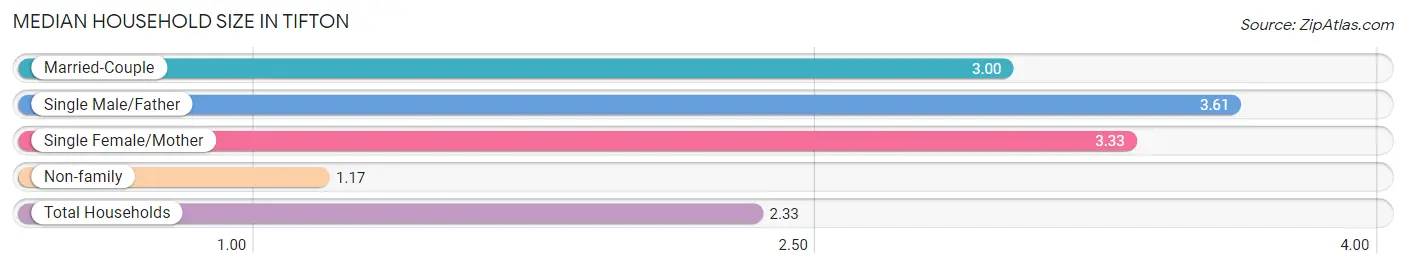
| Household Type | # Households | Household Size |
| Married-Couple | 1,799 (27.2%) | 3.00 |
| Single Male/Father | 473 (7.1%) | 3.61 |
| Single Female/Mother | 1,505 (22.8%) | 3.33 |
| Non-family | 2,836 (42.9%) | 1.17 |
| Total Households | 6,613 (100.0%) | 2.33 |
Household Size by Marriage Status in Tifton
Out of a total of 6,613 households in Tifton, 3,777 (57.1%) are family households, while 2,836 (42.9%) are nonfamily households. The most numerous type of family households are 2-person households, comprising 1,607, and the most common type of nonfamily households are 1-person households, comprising 2,584.
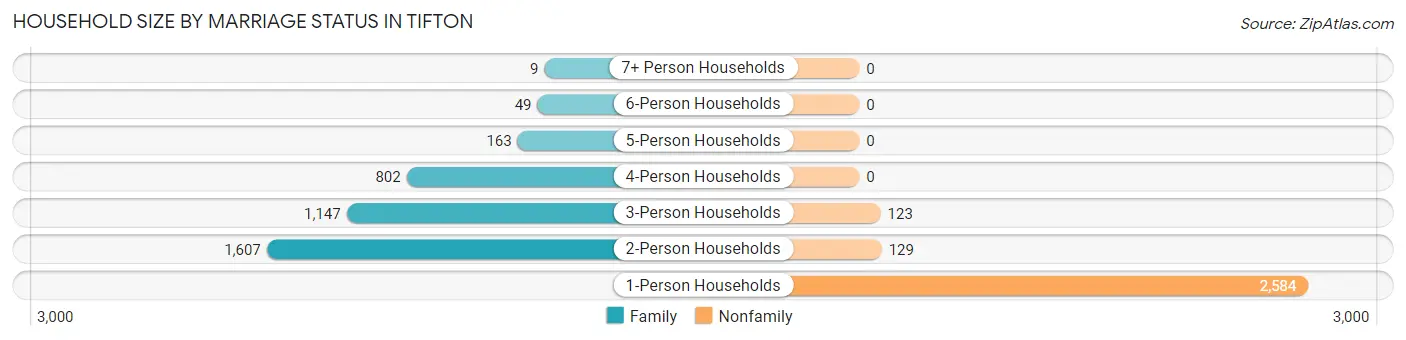
| Household Size | Family Households | Nonfamily Households |
| 1-Person Households | - | 2,584 (39.1%) |
| 2-Person Households | 1,607 (24.3%) | 129 (1.9%) |
| 3-Person Households | 1,147 (17.3%) | 123 (1.9%) |
| 4-Person Households | 802 (12.1%) | 0 (0.0%) |
| 5-Person Households | 163 (2.5%) | 0 (0.0%) |
| 6-Person Households | 49 (0.7%) | 0 (0.0%) |
| 7+ Person Households | 9 (0.1%) | 0 (0.0%) |
| Total | 3,777 (57.1%) | 2,836 (42.9%) |
Female Fertility in Tifton
Fertility by Age in Tifton
Average fertility rate in Tifton is 38.0 births per 1,000 women. Women in the age bracket of 35 to 50 years have the highest fertility rate with 61.0 births per 1,000 women. Women in the age bracket of 35 to 50 years acount for 65.1% of all women with births.
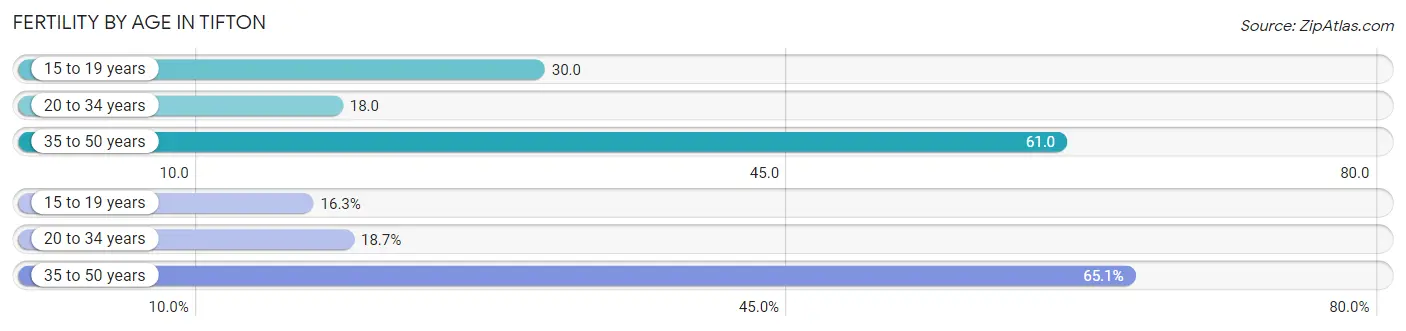
| Age Bracket | Women with Births | Births / 1,000 Women |
| 15 to 19 years | 27 (16.3%) | 30.0 |
| 20 to 34 years | 31 (18.7%) | 18.0 |
| 35 to 50 years | 108 (65.1%) | 61.0 |
| Total | 166 (100.0%) | 38.0 |
Fertility by Age by Marriage Status in Tifton
26.5% of women with births (166) in Tifton are married. The highest percentage of unmarried women with births falls into 15 to 19 years age bracket with 100.0% of them unmarried at the time of birth, while the lowest percentage of unmarried women with births belong to 20 to 34 years age bracket with 0.0% of them unmarried.
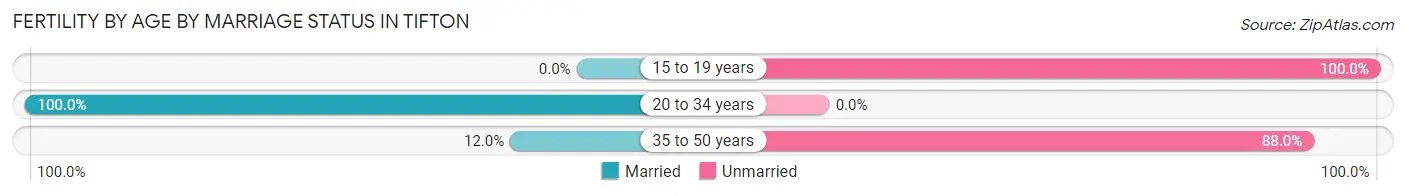
| Age Bracket | Married | Unmarried |
| 15 to 19 years | 0 (0.0%) | 27 (100.0%) |
| 20 to 34 years | 31 (100.0%) | 0 (0.0%) |
| 35 to 50 years | 13 (12.0%) | 95 (88.0%) |
| Total | 44 (26.5%) | 122 (73.5%) |
Fertility by Education in Tifton
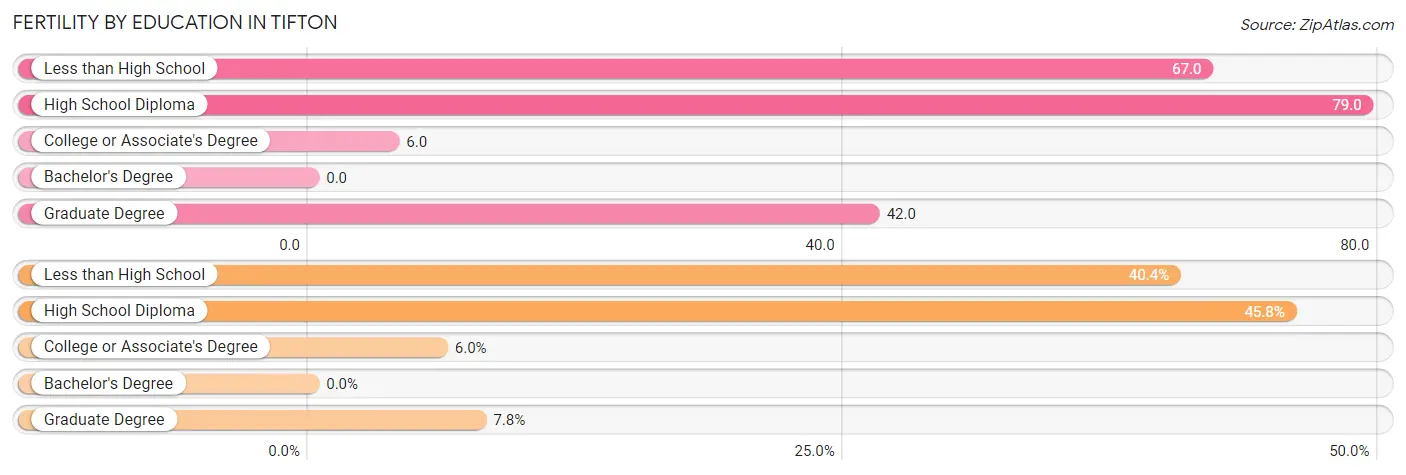
| Educational Attainment | Women with Births | Births / 1,000 Women |
| Less than High School | 67 (40.4%) | 67.0 |
| High School Diploma | 76 (45.8%) | 79.0 |
| College or Associate's Degree | 10 (6.0%) | 6.0 |
| Bachelor's Degree | 0 (0.0%) | 0.0 |
| Graduate Degree | 13 (7.8%) | 42.0 |
| Total | 166 (100.0%) | 38.0 |
Fertility by Education by Marriage Status in Tifton
73.5% of women with births in Tifton are unmarried. Women with the educational attainment of college or associate's degree are most likely to be married with 100.0% of them married at childbirth, while women with the educational attainment of less than high school are least likely to be married with 100.0% of them unmarried at childbirth.
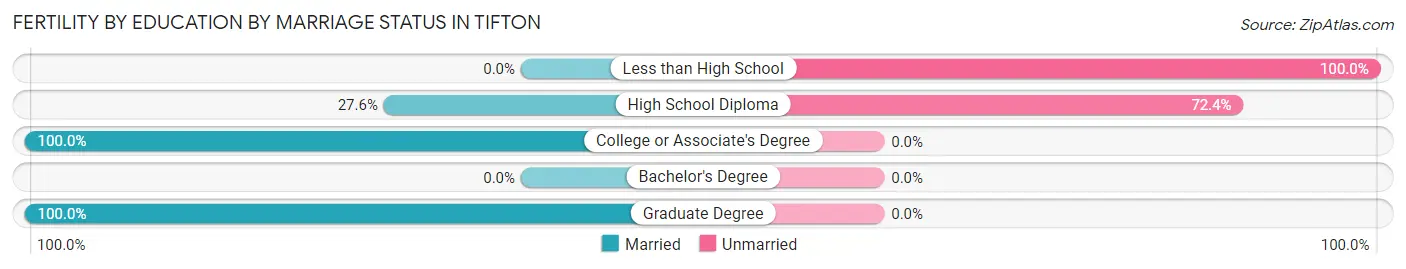
| Educational Attainment | Married | Unmarried |
| Less than High School | 0 (0.0%) | 67 (100.0%) |
| High School Diploma | 21 (27.6%) | 55 (72.4%) |
| College or Associate's Degree | 10 (100.0%) | 0 (0.0%) |
| Bachelor's Degree | 0 (0.0%) | 0 (0.0%) |
| Graduate Degree | 13 (100.0%) | 0 (0.0%) |
| Total | 44 (26.5%) | 122 (73.5%) |
Employment Characteristics in Tifton
Employment by Class of Employer in Tifton
Among the 7,192 employed individuals in Tifton, private company employees (5,199 | 72.3%), not-for-profit organizations (571 | 7.9%), and local government employees (443 | 6.2%) make up the most common classes of employment.
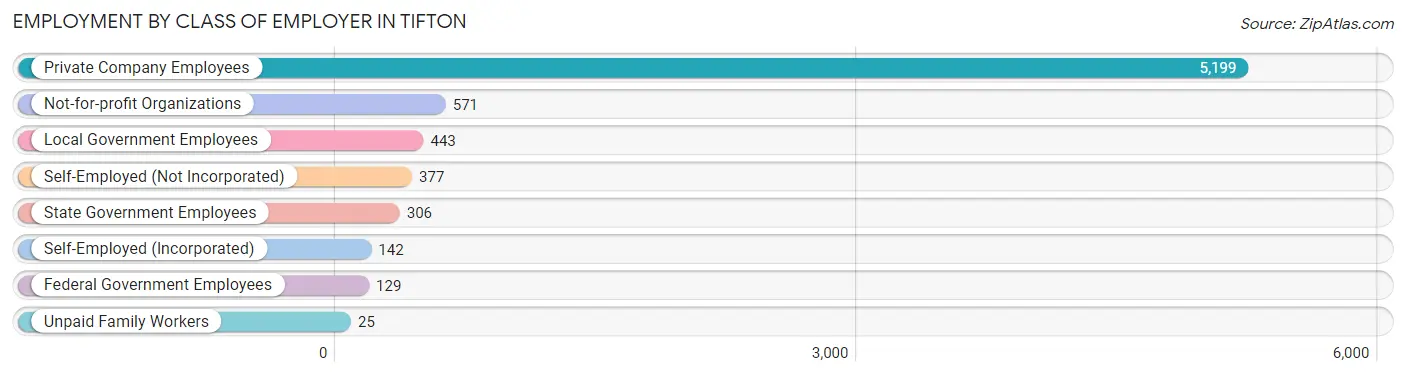
| Employer Class | # Employees | % Employees |
| Private Company Employees | 5,199 | 72.3% |
| Self-Employed (Incorporated) | 142 | 2.0% |
| Self-Employed (Not Incorporated) | 377 | 5.2% |
| Not-for-profit Organizations | 571 | 7.9% |
| Local Government Employees | 443 | 6.2% |
| State Government Employees | 306 | 4.3% |
| Federal Government Employees | 129 | 1.8% |
| Unpaid Family Workers | 25 | 0.4% |
| Total | 7,192 | 100.0% |
Employment Status by Age in Tifton
According to the labor force statistics for Tifton, out of the total population over 16 years of age (13,575), 54.7% or 7,426 individuals are in the labor force, with 2.5% or 186 of them unemployed. The age group with the highest labor force participation rate is 30 to 34 years, with 90.3% or 1,020 individuals in the labor force. Within the labor force, the 16 to 19 years age range has the highest percentage of unemployed individuals, with 21.0% or 80 of them being unemployed.
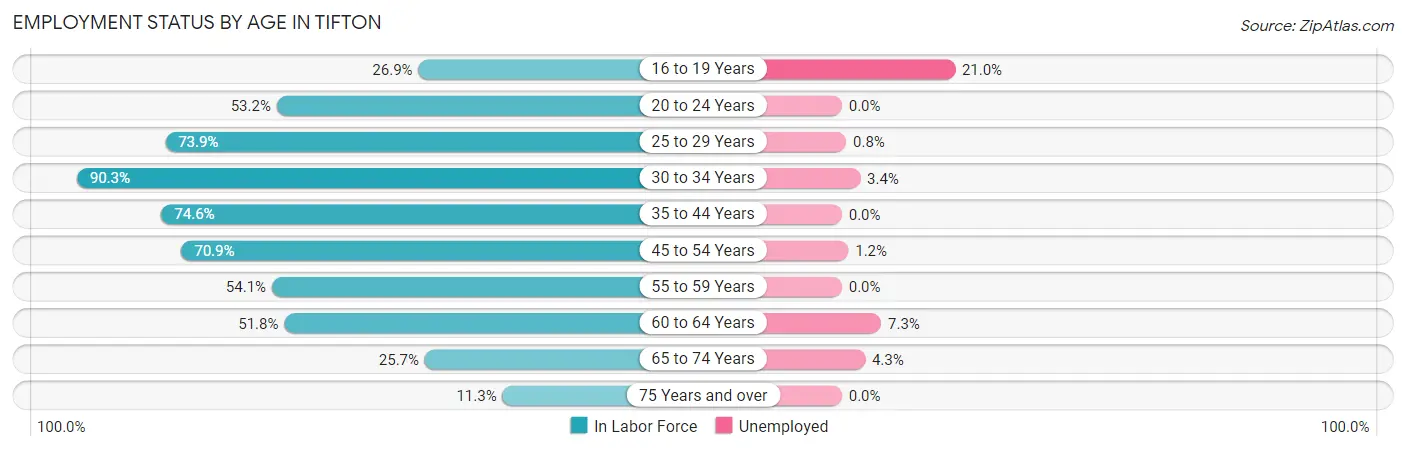
| Age Bracket | In Labor Force | Unemployed |
| 16 to 19 Years | 381 (26.9%) | 80 (21.0%) |
| 20 to 24 Years | 707 (53.2%) | 0 (0.0%) |
| 25 to 29 Years | 950 (73.9%) | 8 (0.8%) |
| 30 to 34 Years | 1,020 (90.3%) | 35 (3.4%) |
| 35 to 44 Years | 1,604 (74.6%) | 0 (0.0%) |
| 45 to 54 Years | 1,268 (70.9%) | 15 (1.2%) |
| 55 to 59 Years | 582 (54.1%) | 0 (0.0%) |
| 60 to 64 Years | 395 (51.8%) | 29 (7.3%) |
| 65 to 74 Years | 398 (25.7%) | 17 (4.3%) |
| 75 Years and over | 123 (11.3%) | 0 (0.0%) |
| Total | 7,426 (54.7%) | 186 (2.5%) |
Employment Status by Educational Attainment in Tifton
According to labor force statistics for Tifton, 71.0% of individuals (5,816) out of the total population between 25 and 64 years of age (8,192) are in the labor force, with 1.5% or 87 of them being unemployed. The group with the highest labor force participation rate are those with the educational attainment of bachelor's degree or higher, with 75.2% or 1,242 individuals in the labor force. Within the labor force, individuals with less than high school education have the highest percentage of unemployment, with 2.8% or 21 of them being unemployed.
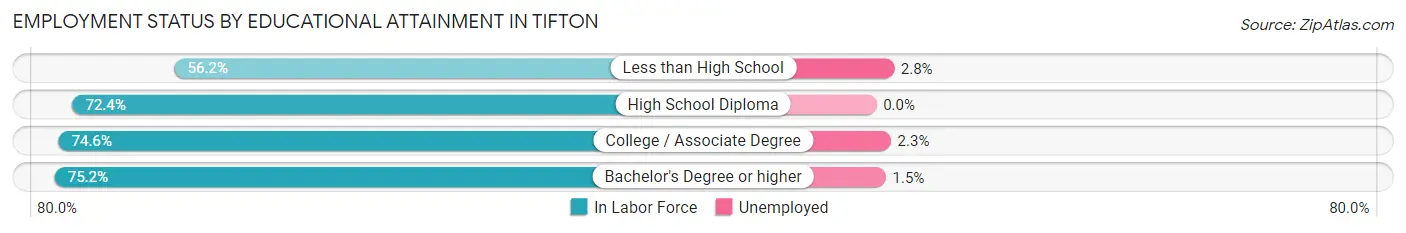
| Educational Attainment | In Labor Force | Unemployed |
| Less than High School | 754 (56.2%) | 38 (2.8%) |
| High School Diploma | 1,823 (72.4%) | 0 (0.0%) |
| College / Associate Degree | 2,001 (74.6%) | 62 (2.3%) |
| Bachelor's Degree or higher | 1,242 (75.2%) | 25 (1.5%) |
| Total | 5,816 (71.0%) | 123 (1.5%) |
Employment Occupations by Sex in Tifton
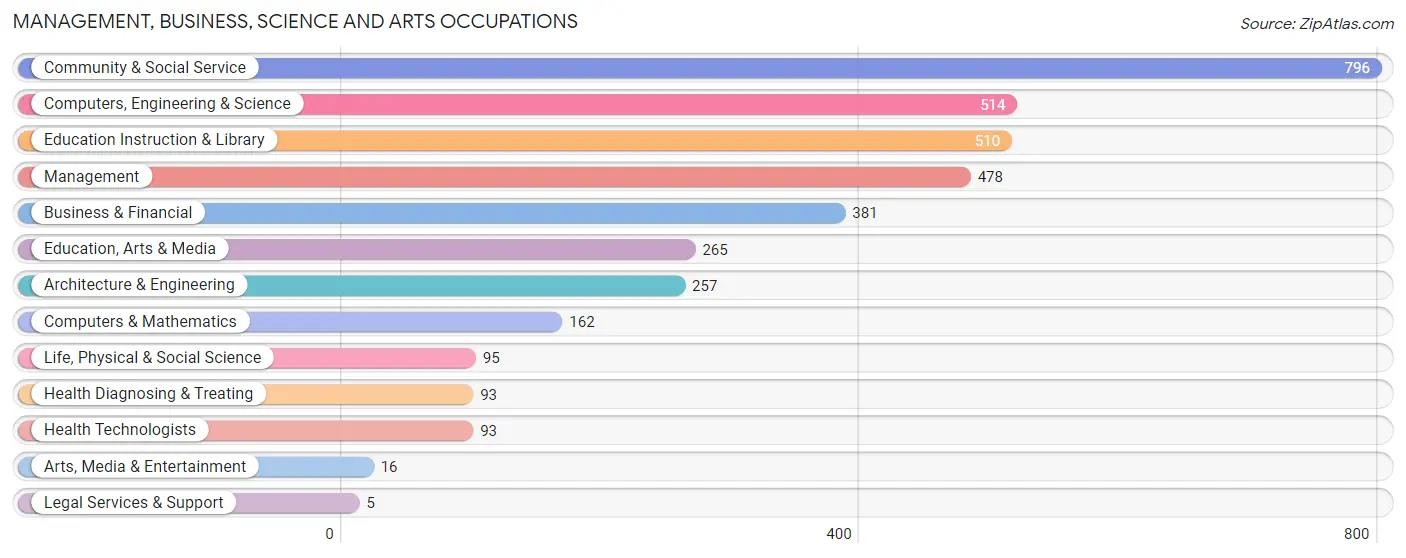
Management, Business, Science and Arts Occupations
The most common Management, Business, Science and Arts occupations in Tifton are Community & Social Service (796 | 11.0%), Computers, Engineering & Science (514 | 7.1%), Education Instruction & Library (510 | 7.0%), Management (478 | 6.6%), and Business & Financial (381 | 5.3%).
Management, Business, Science and Arts Occupations by Sex
Within the Management, Business, Science and Arts occupations in Tifton, the most male-oriented occupations are Architecture & Engineering (84.8%), Business & Financial (79.5%), and Management (78.4%), while the most female-oriented occupations are Legal Services & Support (100.0%), Education Instruction & Library (90.4%), and Life, Physical & Social Science (78.9%).
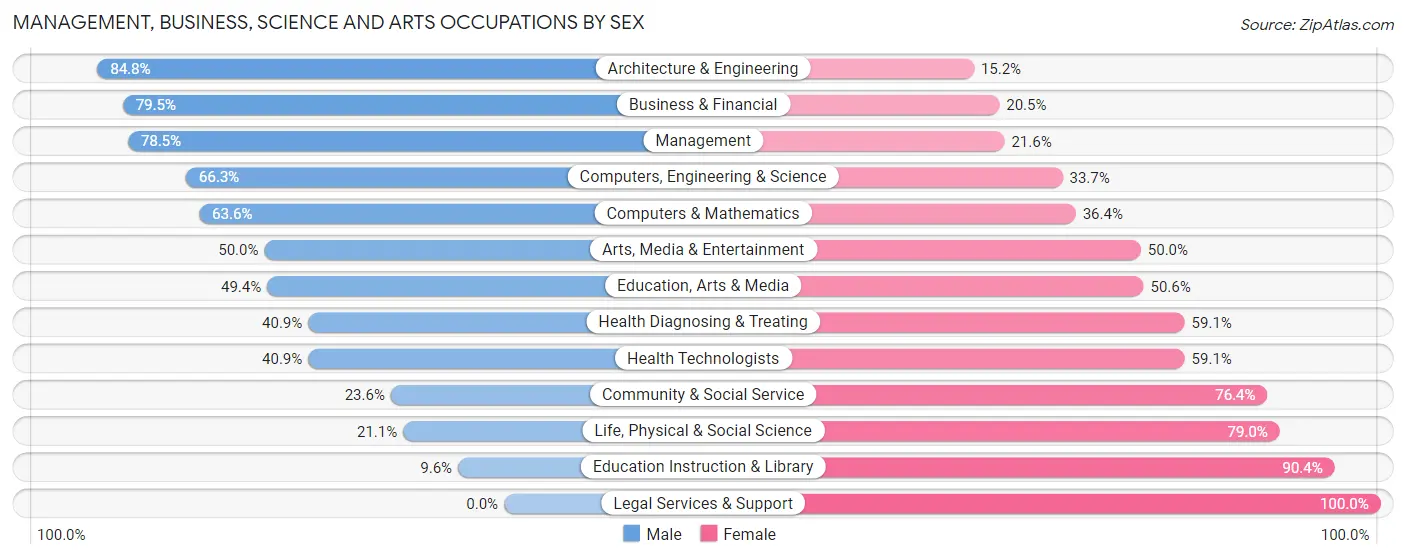
| Occupation | Male | Female |
| Management | 375 (78.4%) | 103 (21.5%) |
| Business & Financial | 303 (79.5%) | 78 (20.5%) |
| Computers, Engineering & Science | 341 (66.3%) | 173 (33.7%) |
| Computers & Mathematics | 103 (63.6%) | 59 (36.4%) |
| Architecture & Engineering | 218 (84.8%) | 39 (15.2%) |
| Life, Physical & Social Science | 20 (21.0%) | 75 (78.9%) |
| Community & Social Service | 188 (23.6%) | 608 (76.4%) |
| Education, Arts & Media | 131 (49.4%) | 134 (50.6%) |
| Legal Services & Support | 0 (0.0%) | 5 (100.0%) |
| Education Instruction & Library | 49 (9.6%) | 461 (90.4%) |
| Arts, Media & Entertainment | 8 (50.0%) | 8 (50.0%) |
| Health Diagnosing & Treating | 38 (40.9%) | 55 (59.1%) |
| Health Technologists | 38 (40.9%) | 55 (59.1%) |
| Total (Category) | 1,245 (55.0%) | 1,017 (45.0%) |
| Total (Overall) | 3,944 (54.4%) | 3,300 (45.6%) |
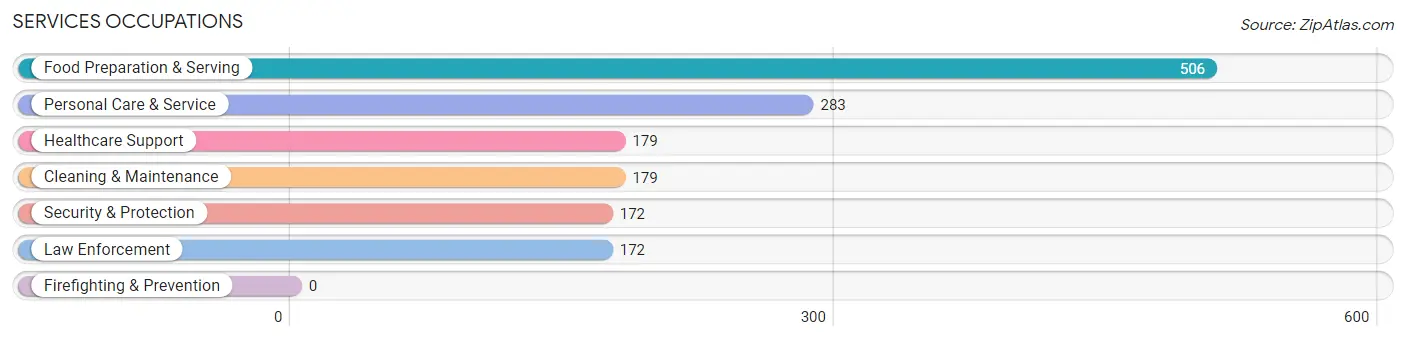
Services Occupations
The most common Services occupations in Tifton are Food Preparation & Serving (506 | 7.0%), Personal Care & Service (283 | 3.9%), Healthcare Support (179 | 2.5%), Cleaning & Maintenance (179 | 2.5%), and Security & Protection (172 | 2.4%).
Services Occupations by Sex
Within the Services occupations in Tifton, the most male-oriented occupations are Security & Protection (100.0%), Law Enforcement (100.0%), and Food Preparation & Serving (62.8%), while the most female-oriented occupations are Healthcare Support (99.4%), Personal Care & Service (90.5%), and Cleaning & Maintenance (38.6%).
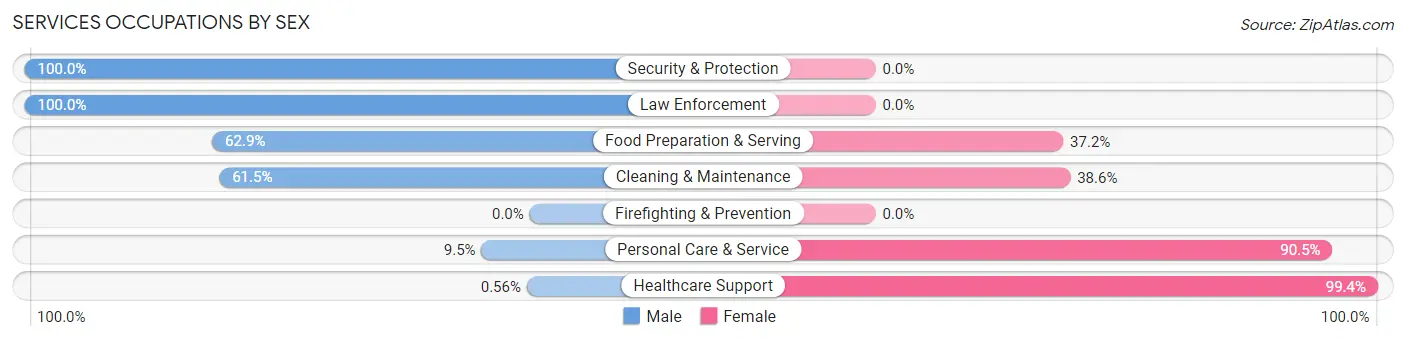
| Occupation | Male | Female |
| Healthcare Support | 1 (0.6%) | 178 (99.4%) |
| Security & Protection | 172 (100.0%) | 0 (0.0%) |
| Firefighting & Prevention | 0 (0.0%) | 0 (0.0%) |
| Law Enforcement | 172 (100.0%) | 0 (0.0%) |
| Food Preparation & Serving | 318 (62.8%) | 188 (37.1%) |
| Cleaning & Maintenance | 110 (61.5%) | 69 (38.6%) |
| Personal Care & Service | 27 (9.5%) | 256 (90.5%) |
| Total (Category) | 628 (47.6%) | 691 (52.4%) |
| Total (Overall) | 3,944 (54.4%) | 3,300 (45.6%) |
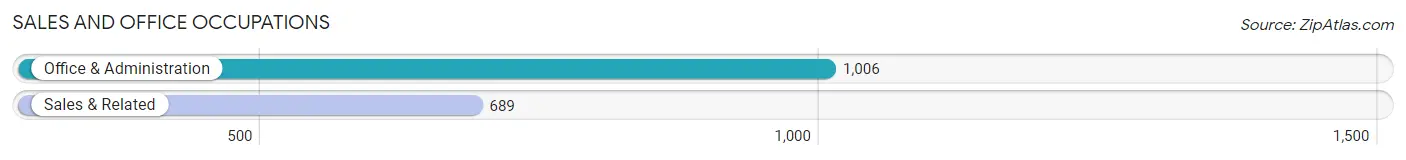
Sales and Office Occupations
The most common Sales and Office occupations in Tifton are Office & Administration (1,006 | 13.9%), and Sales & Related (689 | 9.5%).
Sales and Office Occupations by Sex
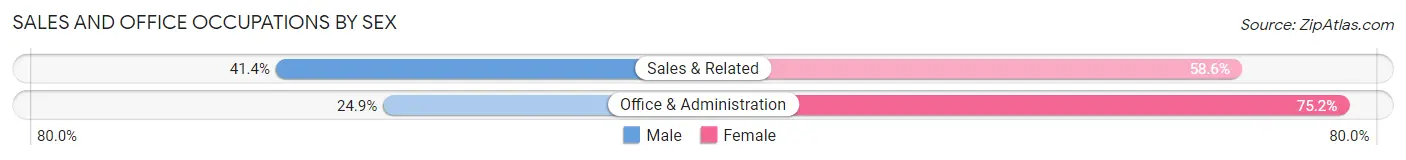
| Occupation | Male | Female |
| Sales & Related | 285 (41.4%) | 404 (58.6%) |
| Office & Administration | 250 (24.8%) | 756 (75.1%) |
| Total (Category) | 535 (31.6%) | 1,160 (68.4%) |
| Total (Overall) | 3,944 (54.4%) | 3,300 (45.6%) |
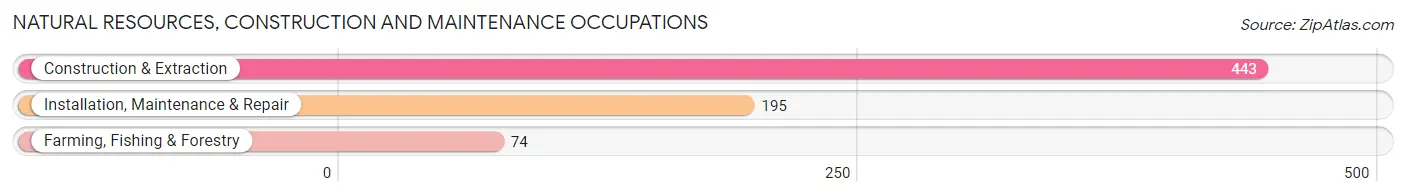
Natural Resources, Construction and Maintenance Occupations
The most common Natural Resources, Construction and Maintenance occupations in Tifton are Construction & Extraction (443 | 6.1%), Installation, Maintenance & Repair (195 | 2.7%), and Farming, Fishing & Forestry (74 | 1.0%).
Natural Resources, Construction and Maintenance Occupations by Sex
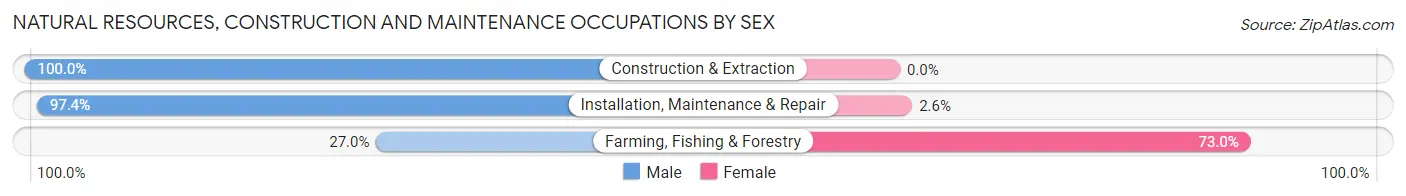
| Occupation | Male | Female |
| Farming, Fishing & Forestry | 20 (27.0%) | 54 (73.0%) |
| Construction & Extraction | 443 (100.0%) | 0 (0.0%) |
| Installation, Maintenance & Repair | 190 (97.4%) | 5 (2.6%) |
| Total (Category) | 653 (91.7%) | 59 (8.3%) |
| Total (Overall) | 3,944 (54.4%) | 3,300 (45.6%) |
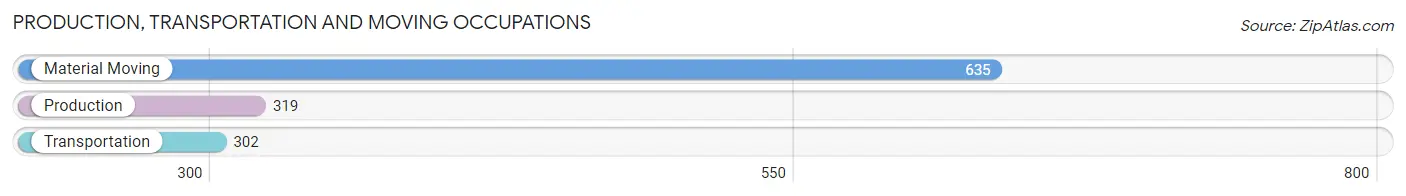
Production, Transportation and Moving Occupations
The most common Production, Transportation and Moving occupations in Tifton are Material Moving (635 | 8.8%), Production (319 | 4.4%), and Transportation (302 | 4.2%).
Production, Transportation and Moving Occupations by Sex
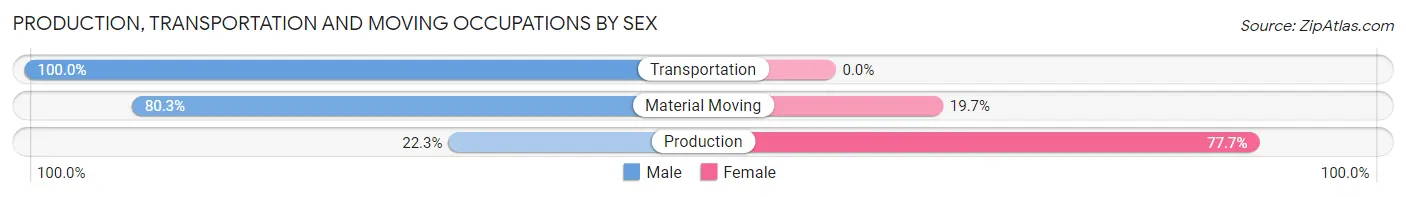
| Occupation | Male | Female |
| Production | 71 (22.3%) | 248 (77.7%) |
| Transportation | 302 (100.0%) | 0 (0.0%) |
| Material Moving | 510 (80.3%) | 125 (19.7%) |
| Total (Category) | 883 (70.3%) | 373 (29.7%) |
| Total (Overall) | 3,944 (54.4%) | 3,300 (45.6%) |
Employment Industries by Sex in Tifton
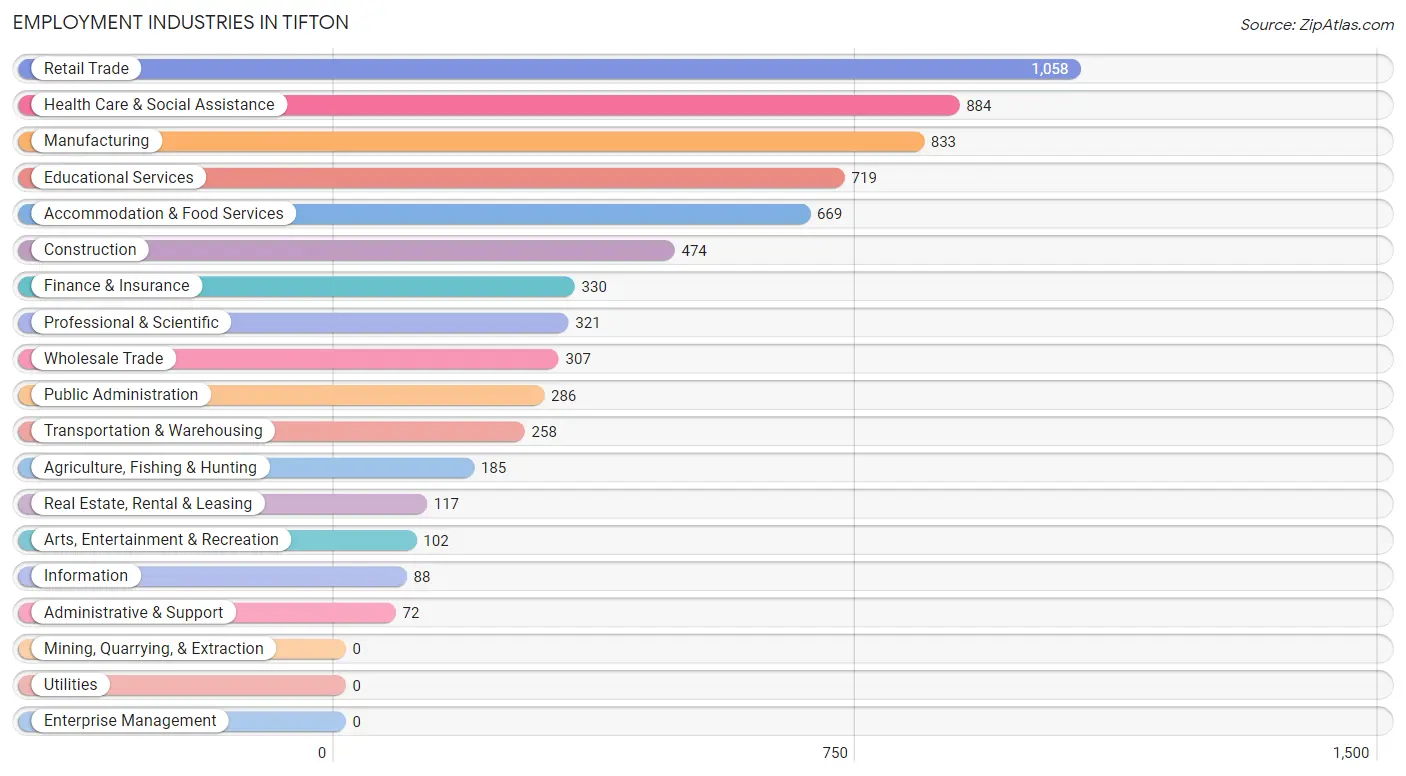
Employment Industries in Tifton
The major employment industries in Tifton include Retail Trade (1,058 | 14.6%), Health Care & Social Assistance (884 | 12.2%), Manufacturing (833 | 11.5%), Educational Services (719 | 9.9%), and Accommodation & Food Services (669 | 9.2%).
Employment Industries by Sex in Tifton
The Tifton industries that see more men than women are Construction (100.0%), Professional & Scientific (96.3%), and Wholesale Trade (95.1%), whereas the industries that tend to have a higher number of women are Arts, Entertainment & Recreation (93.1%), Information (85.2%), and Finance & Insurance (77.9%).
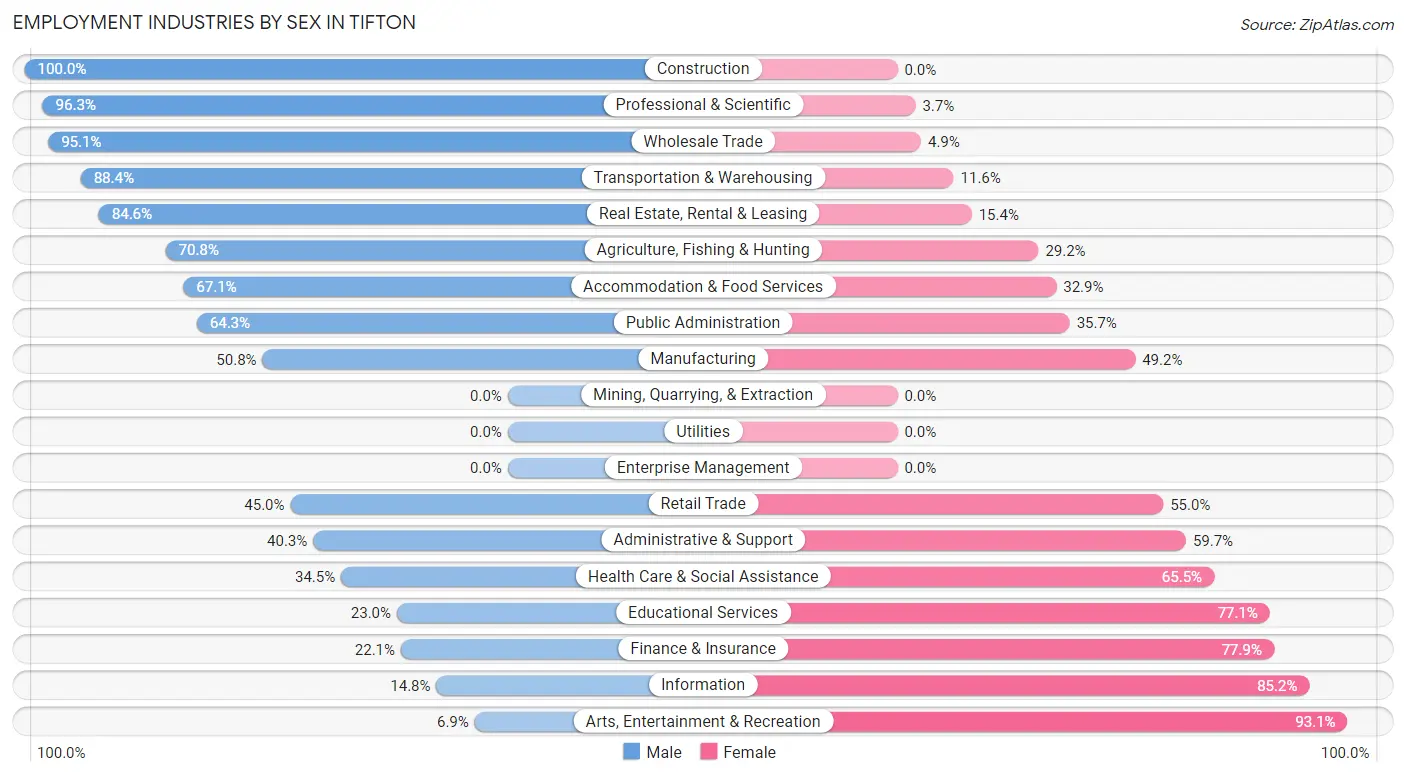
| Industry | Male | Female |
| Agriculture, Fishing & Hunting | 131 (70.8%) | 54 (29.2%) |
| Mining, Quarrying, & Extraction | 0 (0.0%) | 0 (0.0%) |
| Construction | 474 (100.0%) | 0 (0.0%) |
| Manufacturing | 423 (50.8%) | 410 (49.2%) |
| Wholesale Trade | 292 (95.1%) | 15 (4.9%) |
| Retail Trade | 476 (45.0%) | 582 (55.0%) |
| Transportation & Warehousing | 228 (88.4%) | 30 (11.6%) |
| Utilities | 0 (0.0%) | 0 (0.0%) |
| Information | 13 (14.8%) | 75 (85.2%) |
| Finance & Insurance | 73 (22.1%) | 257 (77.9%) |
| Real Estate, Rental & Leasing | 99 (84.6%) | 18 (15.4%) |
| Professional & Scientific | 309 (96.3%) | 12 (3.7%) |
| Enterprise Management | 0 (0.0%) | 0 (0.0%) |
| Administrative & Support | 29 (40.3%) | 43 (59.7%) |
| Educational Services | 165 (23.0%) | 554 (77.0%) |
| Health Care & Social Assistance | 305 (34.5%) | 579 (65.5%) |
| Arts, Entertainment & Recreation | 7 (6.9%) | 95 (93.1%) |
| Accommodation & Food Services | 449 (67.1%) | 220 (32.9%) |
| Public Administration | 184 (64.3%) | 102 (35.7%) |
| Total | 3,944 (54.4%) | 3,300 (45.6%) |
Education in Tifton
School Enrollment in Tifton
The most common levels of schooling among the 5,026 students in Tifton are college / undergraduate (1,682 | 33.5%), high school (1,020 | 20.3%), and middle school (967 | 19.2%).
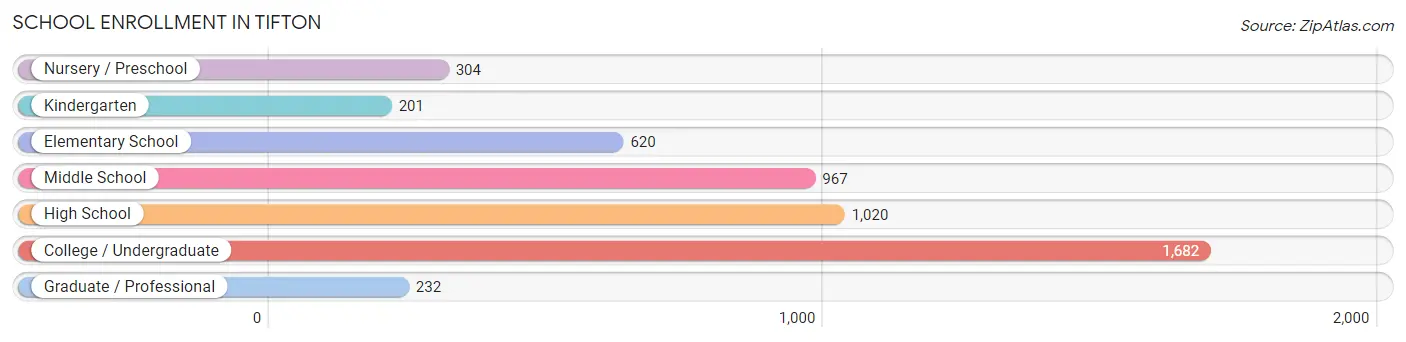
| School Level | # Students | % Students |
| Nursery / Preschool | 304 | 6.0% |
| Kindergarten | 201 | 4.0% |
| Elementary School | 620 | 12.3% |
| Middle School | 967 | 19.2% |
| High School | 1,020 | 20.3% |
| College / Undergraduate | 1,682 | 33.5% |
| Graduate / Professional | 232 | 4.6% |
| Total | 5,026 | 100.0% |
School Enrollment by Age by Funding Source in Tifton
Out of a total of 5,026 students who are enrolled in schools in Tifton, 281 (5.6%) attend a private institution, while the remaining 4,745 (94.4%) are enrolled in public schools. The age group of 25 to 34 year olds has the highest likelihood of being enrolled in private schools, with 65 (19.2% in the age bracket) enrolled. Conversely, the age group of 20 to 24 year olds has the lowest likelihood of being enrolled in a private school, with 722 (99.3% in the age bracket) attending a public institution.
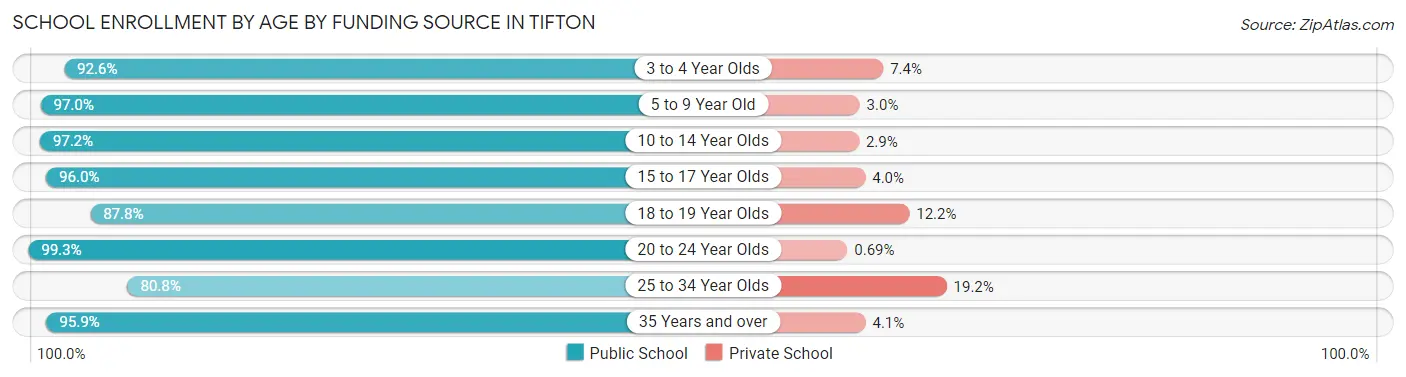
| Age Bracket | Public School | Private School |
| 3 to 4 Year Olds | 264 (92.6%) | 21 (7.4%) |
| 5 to 9 Year Old | 651 (97.0%) | 20 (3.0%) |
| 10 to 14 Year Olds | 1,297 (97.2%) | 38 (2.9%) |
| 15 to 17 Year Olds | 621 (96.0%) | 26 (4.0%) |
| 18 to 19 Year Olds | 703 (87.8%) | 98 (12.2%) |
| 20 to 24 Year Olds | 722 (99.3%) | 5 (0.7%) |
| 25 to 34 Year Olds | 274 (80.8%) | 65 (19.2%) |
| 35 Years and over | 212 (95.9%) | 9 (4.1%) |
| Total | 4,745 (94.4%) | 281 (5.6%) |
Educational Attainment by Field of Study in Tifton
Education (666 | 29.5%), business (595 | 26.4%), bio, nature & agricultural (208 | 9.2%), computers & mathematics (180 | 8.0%), and arts & humanities (115 | 5.1%) are the most common fields of study among 2,257 individuals in Tifton who have obtained a bachelor's degree or higher.
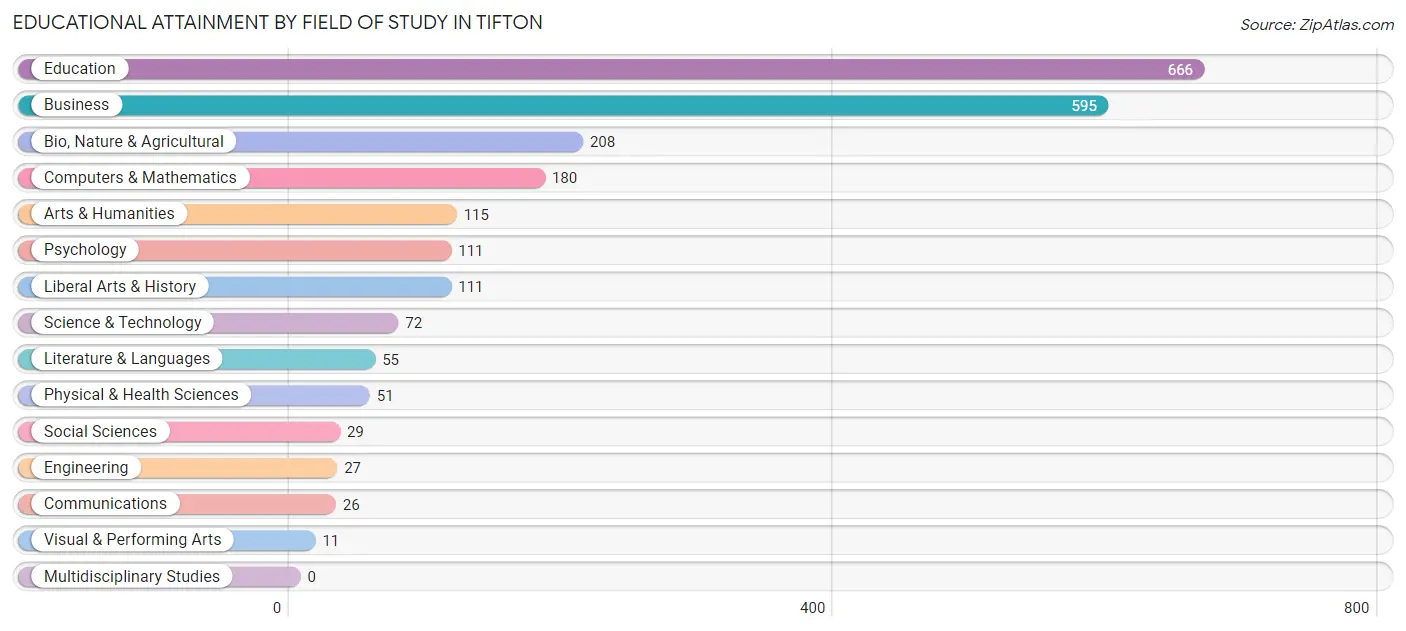
| Field of Study | # Graduates | % Graduates |
| Computers & Mathematics | 180 | 8.0% |
| Bio, Nature & Agricultural | 208 | 9.2% |
| Physical & Health Sciences | 51 | 2.3% |
| Psychology | 111 | 4.9% |
| Social Sciences | 29 | 1.3% |
| Engineering | 27 | 1.2% |
| Multidisciplinary Studies | 0 | 0.0% |
| Science & Technology | 72 | 3.2% |
| Business | 595 | 26.4% |
| Education | 666 | 29.5% |
| Literature & Languages | 55 | 2.4% |
| Liberal Arts & History | 111 | 4.9% |
| Visual & Performing Arts | 11 | 0.5% |
| Communications | 26 | 1.1% |
| Arts & Humanities | 115 | 5.1% |
| Total | 2,257 | 100.0% |
Transportation & Commute in Tifton
Vehicle Availability by Sex in Tifton
The most prevalent vehicle ownership categories in Tifton are males with 2 vehicles (1,414, accounting for 38.2%) and females with 2 vehicles (934, making up 45.4%).
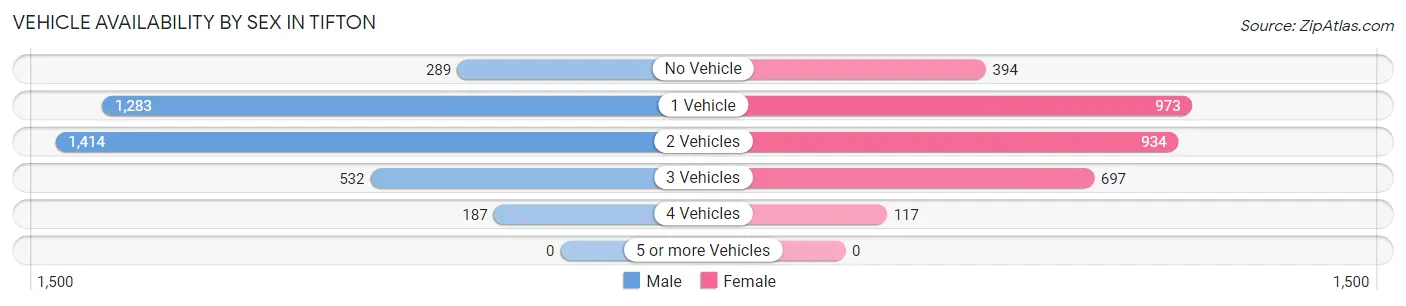
| Vehicles Available | Male | Female |
| No Vehicle | 289 (7.8%) | 394 (12.7%) |
| 1 Vehicle | 1,283 (34.6%) | 973 (31.2%) |
| 2 Vehicles | 1,414 (38.2%) | 934 (30.0%) |
| 3 Vehicles | 532 (14.4%) | 697 (22.4%) |
| 4 Vehicles | 187 (5.1%) | 117 (3.8%) |
| 5 or more Vehicles | 0 (0.0%) | 0 (0.0%) |
| Total | 3,705 (100.0%) | 3,115 (100.0%) |
Commute Time in Tifton
The most frequently occuring commute durations in Tifton are 10 to 14 minutes (2,016 commuters, 29.8%), 5 to 9 minutes (1,163 commuters, 17.2%), and 15 to 19 minutes (1,137 commuters, 16.8%).
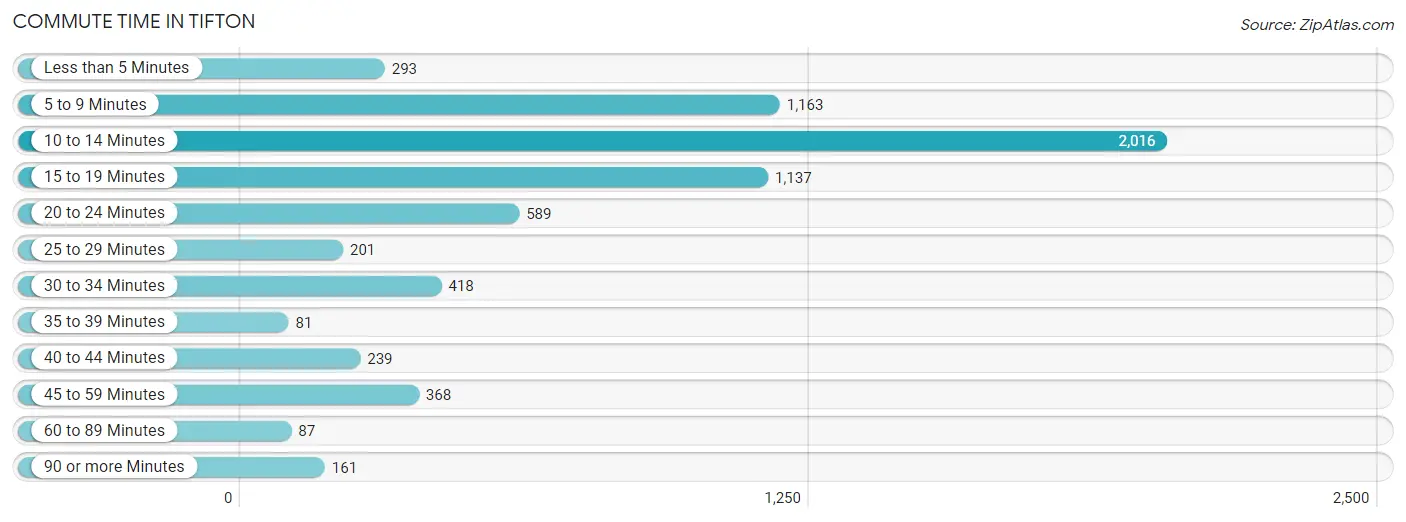
| Commute Time | # Commuters | % Commuters |
| Less than 5 Minutes | 293 | 4.3% |
| 5 to 9 Minutes | 1,163 | 17.2% |
| 10 to 14 Minutes | 2,016 | 29.8% |
| 15 to 19 Minutes | 1,137 | 16.8% |
| 20 to 24 Minutes | 589 | 8.7% |
| 25 to 29 Minutes | 201 | 3.0% |
| 30 to 34 Minutes | 418 | 6.2% |
| 35 to 39 Minutes | 81 | 1.2% |
| 40 to 44 Minutes | 239 | 3.5% |
| 45 to 59 Minutes | 368 | 5.4% |
| 60 to 89 Minutes | 87 | 1.3% |
| 90 or more Minutes | 161 | 2.4% |
Commute Time by Sex in Tifton
The most common commute times in Tifton are 10 to 14 minutes (1,474 commuters, 41.4%) for males and 5 to 9 minutes (903 commuters, 28.3%) for females.
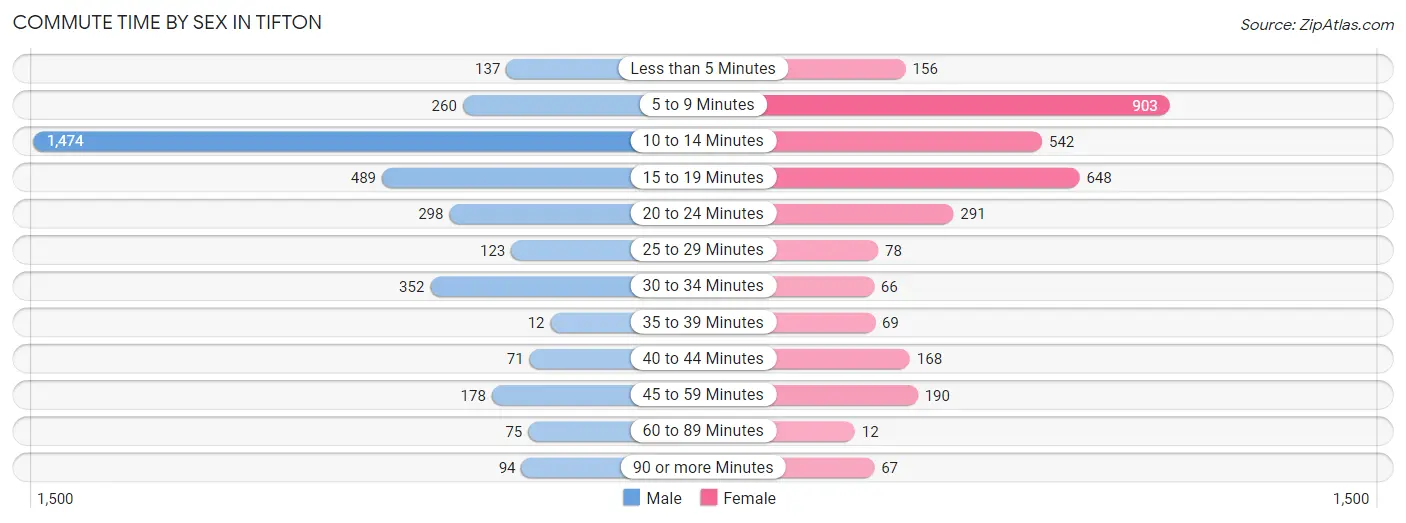
| Commute Time | Male | Female |
| Less than 5 Minutes | 137 (3.8%) | 156 (4.9%) |
| 5 to 9 Minutes | 260 (7.3%) | 903 (28.3%) |
| 10 to 14 Minutes | 1,474 (41.4%) | 542 (17.0%) |
| 15 to 19 Minutes | 489 (13.7%) | 648 (20.3%) |
| 20 to 24 Minutes | 298 (8.4%) | 291 (9.1%) |
| 25 to 29 Minutes | 123 (3.5%) | 78 (2.5%) |
| 30 to 34 Minutes | 352 (9.9%) | 66 (2.1%) |
| 35 to 39 Minutes | 12 (0.3%) | 69 (2.2%) |
| 40 to 44 Minutes | 71 (2.0%) | 168 (5.3%) |
| 45 to 59 Minutes | 178 (5.0%) | 190 (6.0%) |
| 60 to 89 Minutes | 75 (2.1%) | 12 (0.4%) |
| 90 or more Minutes | 94 (2.6%) | 67 (2.1%) |
Time of Departure to Work by Sex in Tifton
The most frequent times of departure to work in Tifton are 7:30 AM to 7:59 AM (909, 25.5%) for males and 6:30 AM to 6:59 AM (614, 19.3%) for females.
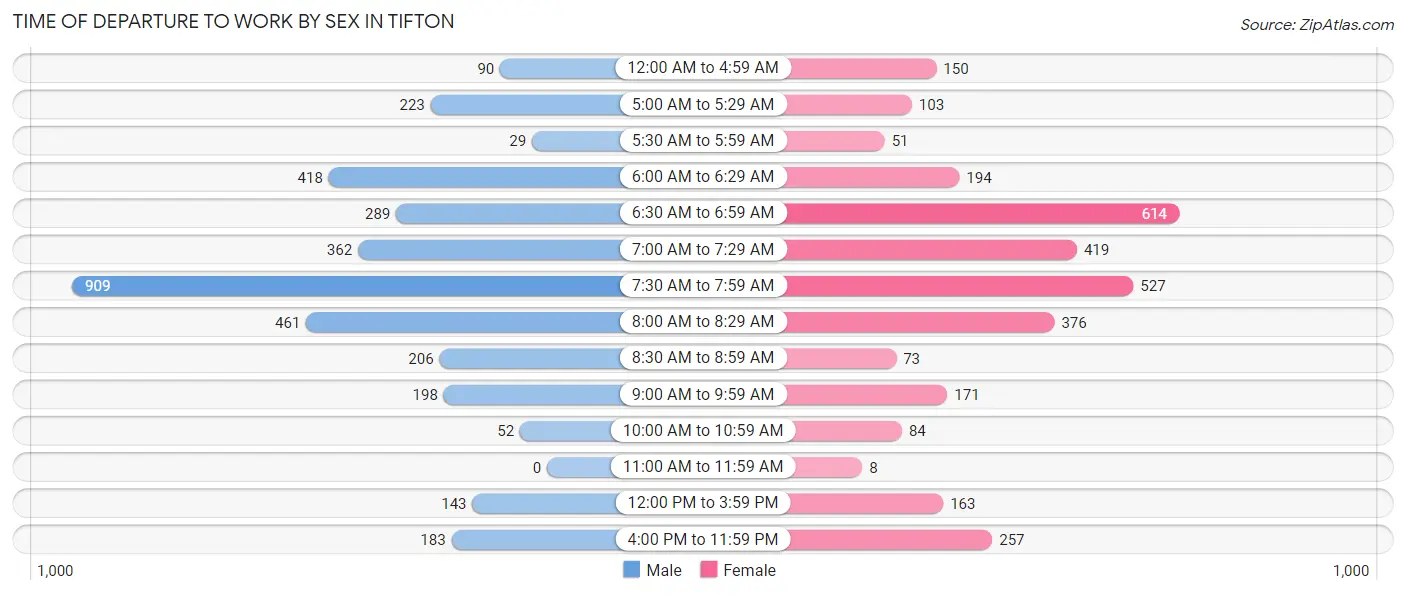
| Time of Departure | Male | Female |
| 12:00 AM to 4:59 AM | 90 (2.5%) | 150 (4.7%) |
| 5:00 AM to 5:29 AM | 223 (6.3%) | 103 (3.2%) |
| 5:30 AM to 5:59 AM | 29 (0.8%) | 51 (1.6%) |
| 6:00 AM to 6:29 AM | 418 (11.7%) | 194 (6.1%) |
| 6:30 AM to 6:59 AM | 289 (8.1%) | 614 (19.3%) |
| 7:00 AM to 7:29 AM | 362 (10.2%) | 419 (13.1%) |
| 7:30 AM to 7:59 AM | 909 (25.5%) | 527 (16.5%) |
| 8:00 AM to 8:29 AM | 461 (12.9%) | 376 (11.8%) |
| 8:30 AM to 8:59 AM | 206 (5.8%) | 73 (2.3%) |
| 9:00 AM to 9:59 AM | 198 (5.6%) | 171 (5.4%) |
| 10:00 AM to 10:59 AM | 52 (1.5%) | 84 (2.6%) |
| 11:00 AM to 11:59 AM | 0 (0.0%) | 8 (0.3%) |
| 12:00 PM to 3:59 PM | 143 (4.0%) | 163 (5.1%) |
| 4:00 PM to 11:59 PM | 183 (5.1%) | 257 (8.1%) |
| Total | 3,563 (100.0%) | 3,190 (100.0%) |
Housing Occupancy in Tifton
Occupancy by Ownership in Tifton
Of the total 6,613 dwellings in Tifton, owner-occupied units account for 2,552 (38.6%), while renter-occupied units make up 4,061 (61.4%).
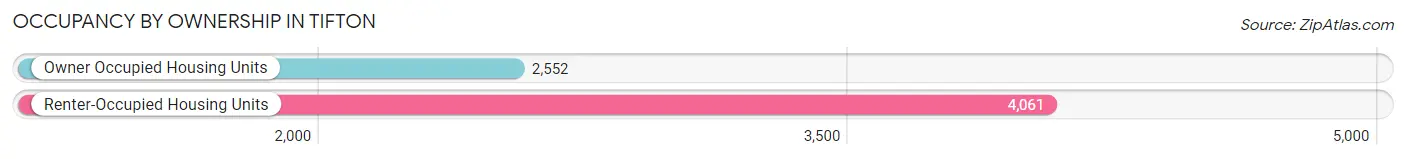
| Occupancy | # Housing Units | % Housing Units |
| Owner Occupied Housing Units | 2,552 | 38.6% |
| Renter-Occupied Housing Units | 4,061 | 61.4% |
| Total Occupied Housing Units | 6,613 | 100.0% |
Occupancy by Household Size in Tifton
| Household Size | # Housing Units | % Housing Units |
| 1-Person Household | 2,584 | 39.1% |
| 2-Person Household | 1,736 | 26.3% |
| 3-Person Household | 1,270 | 19.2% |
| 4+ Person Household | 1,023 | 15.5% |
| Total Housing Units | 6,613 | 100.0% |
Occupancy by Ownership by Household Size in Tifton
| Household Size | Owner-occupied | Renter-occupied |
| 1-Person Household | 520 (20.1%) | 2,064 (79.9%) |
| 2-Person Household | 1,006 (58.0%) | 730 (42.0%) |
| 3-Person Household | 392 (30.9%) | 878 (69.1%) |
| 4+ Person Household | 634 (62.0%) | 389 (38.0%) |
| Total Housing Units | 2,552 (38.6%) | 4,061 (61.4%) |
Occupancy by Educational Attainment in Tifton
| Household Size | Owner-occupied | Renter-occupied |
| Less than High School | 351 (27.8%) | 912 (72.2%) |
| High School Diploma | 416 (25.8%) | 1,196 (74.2%) |
| College/Associate Degree | 974 (38.7%) | 1,540 (61.3%) |
| Bachelor's Degree or higher | 811 (66.3%) | 413 (33.7%) |
Occupancy by Age of Householder in Tifton
| Age Bracket | # Households | % Households |
| Under 35 Years | 1,502 | 22.7% |
| 35 to 44 Years | 1,203 | 18.2% |
| 45 to 54 Years | 1,234 | 18.7% |
| 55 to 64 Years | 963 | 14.6% |
| 65 to 74 Years | 1,046 | 15.8% |
| 75 to 84 Years | 454 | 6.9% |
| 85 Years and Over | 211 | 3.2% |
| Total | 6,613 | 100.0% |
Housing Finances in Tifton
Median Income by Occupancy in Tifton
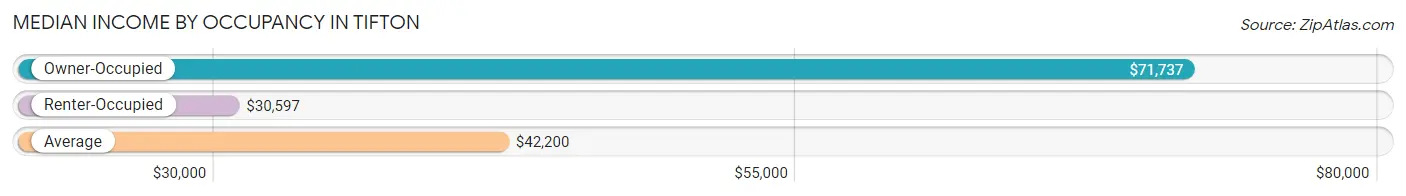
| Occupancy Type | # Households | Median Income |
| Owner-Occupied | 2,552 (38.6%) | $71,737 |
| Renter-Occupied | 4,061 (61.4%) | $30,597 |
| Average | 6,613 (100.0%) | $42,200 |
Occupancy by Householder Income Bracket in Tifton
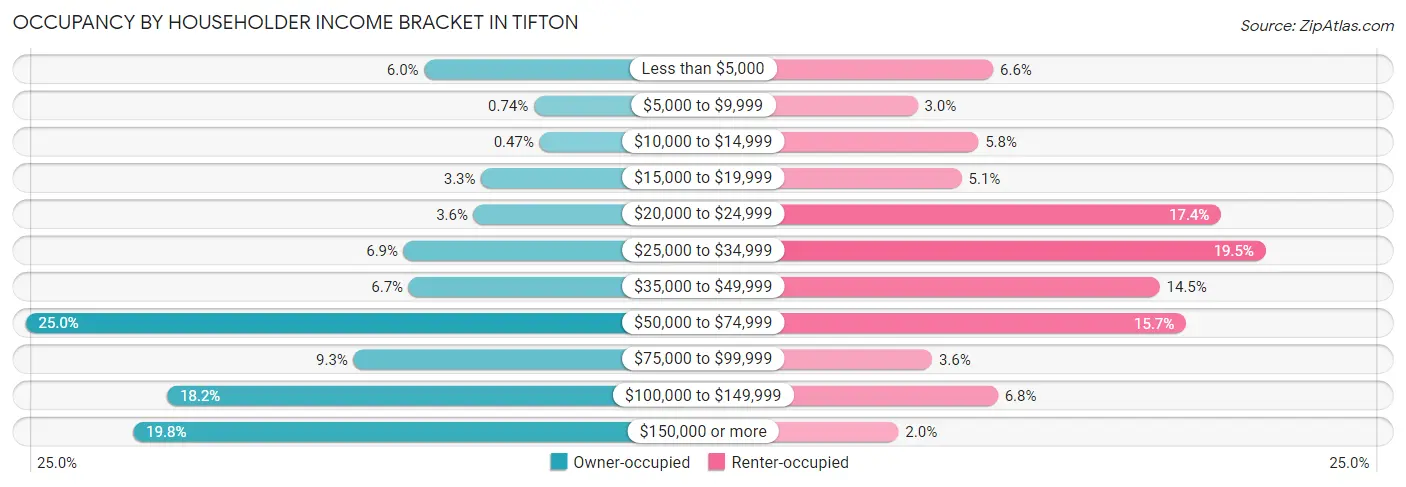
| Income Bracket | Owner-occupied | Renter-occupied |
| Less than $5,000 | 152 (6.0%) | 266 (6.6%) |
| $5,000 to $9,999 | 19 (0.7%) | 120 (2.9%) |
| $10,000 to $14,999 | 12 (0.5%) | 237 (5.8%) |
| $15,000 to $19,999 | 83 (3.3%) | 205 (5.1%) |
| $20,000 to $24,999 | 92 (3.6%) | 707 (17.4%) |
| $25,000 to $34,999 | 177 (6.9%) | 793 (19.5%) |
| $35,000 to $49,999 | 171 (6.7%) | 588 (14.5%) |
| $50,000 to $74,999 | 637 (25.0%) | 639 (15.7%) |
| $75,000 to $99,999 | 238 (9.3%) | 148 (3.6%) |
| $100,000 to $149,999 | 465 (18.2%) | 275 (6.8%) |
| $150,000 or more | 506 (19.8%) | 83 (2.0%) |
| Total | 2,552 (100.0%) | 4,061 (100.0%) |
Monthly Housing Cost Tiers in Tifton
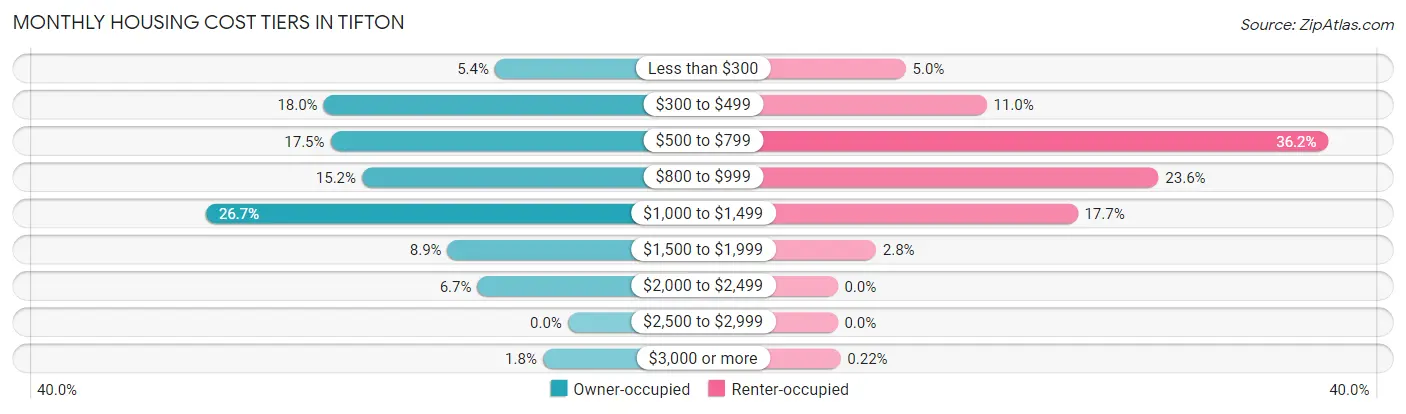
| Monthly Cost | Owner-occupied | Renter-occupied |
| Less than $300 | 137 (5.4%) | 204 (5.0%) |
| $300 to $499 | 459 (18.0%) | 446 (11.0%) |
| $500 to $799 | 446 (17.5%) | 1,468 (36.1%) |
| $800 to $999 | 387 (15.2%) | 960 (23.6%) |
| $1,000 to $1,499 | 680 (26.7%) | 718 (17.7%) |
| $1,500 to $1,999 | 226 (8.9%) | 115 (2.8%) |
| $2,000 to $2,499 | 170 (6.7%) | 0 (0.0%) |
| $2,500 to $2,999 | 0 (0.0%) | 0 (0.0%) |
| $3,000 or more | 47 (1.8%) | 9 (0.2%) |
| Total | 2,552 (100.0%) | 4,061 (100.0%) |
Physical Housing Characteristics in Tifton
Housing Structures in Tifton
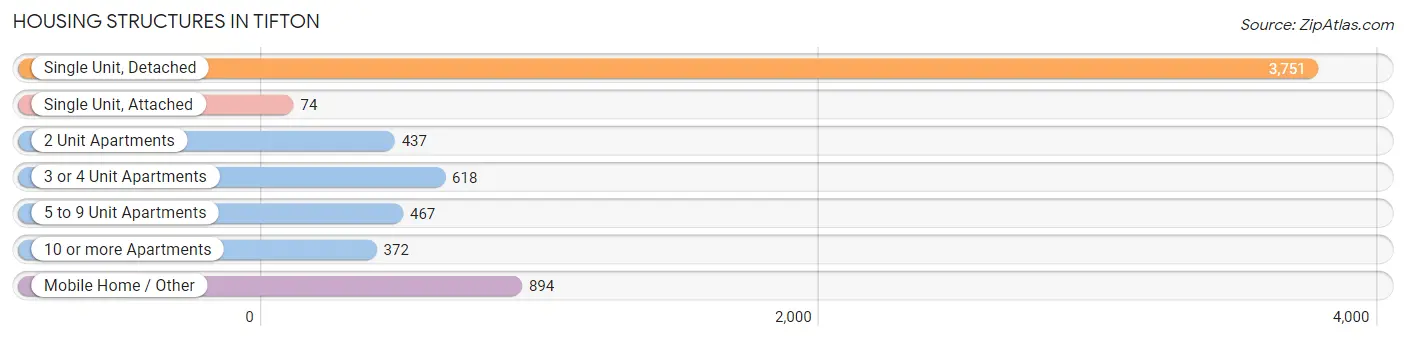
| Structure Type | # Housing Units | % Housing Units |
| Single Unit, Detached | 3,751 | 56.7% |
| Single Unit, Attached | 74 | 1.1% |
| 2 Unit Apartments | 437 | 6.6% |
| 3 or 4 Unit Apartments | 618 | 9.3% |
| 5 to 9 Unit Apartments | 467 | 7.1% |
| 10 or more Apartments | 372 | 5.6% |
| Mobile Home / Other | 894 | 13.5% |
| Total | 6,613 | 100.0% |
Housing Structures by Occupancy in Tifton
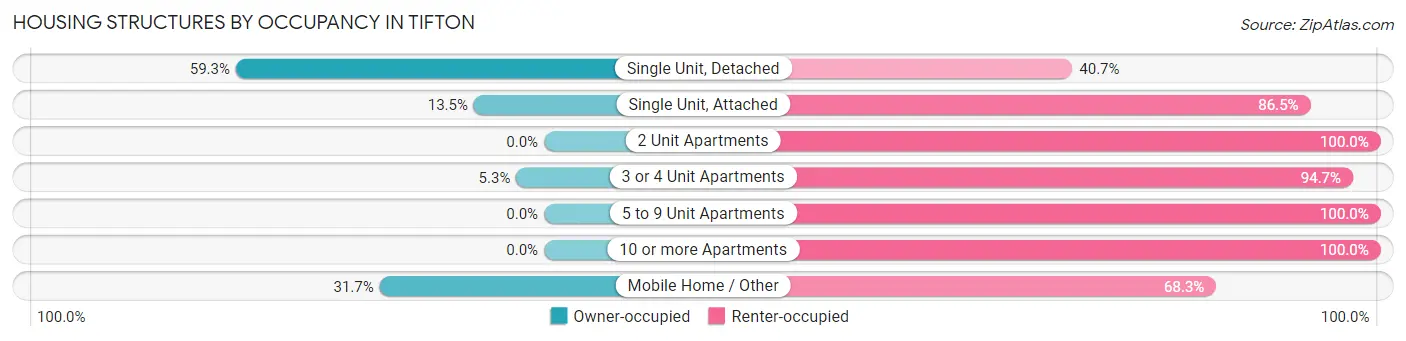
| Structure Type | Owner-occupied | Renter-occupied |
| Single Unit, Detached | 2,226 (59.3%) | 1,525 (40.7%) |
| Single Unit, Attached | 10 (13.5%) | 64 (86.5%) |
| 2 Unit Apartments | 0 (0.0%) | 437 (100.0%) |
| 3 or 4 Unit Apartments | 33 (5.3%) | 585 (94.7%) |
| 5 to 9 Unit Apartments | 0 (0.0%) | 467 (100.0%) |
| 10 or more Apartments | 0 (0.0%) | 372 (100.0%) |
| Mobile Home / Other | 283 (31.7%) | 611 (68.3%) |
| Total | 2,552 (38.6%) | 4,061 (61.4%) |
Housing Structures by Number of Rooms in Tifton
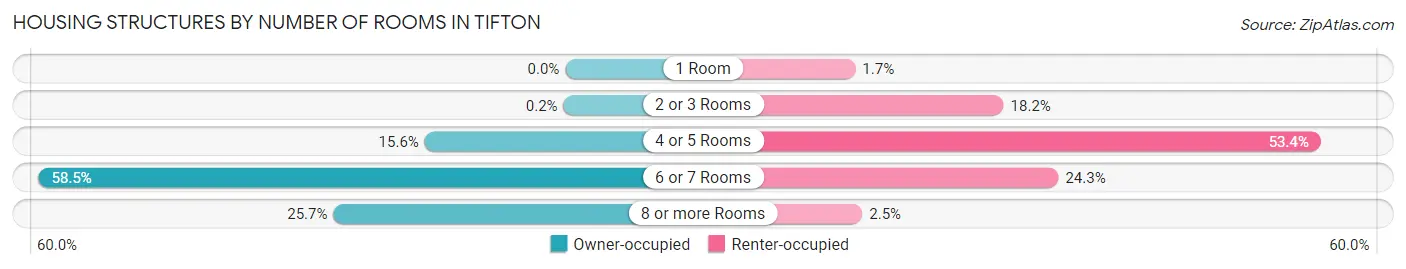
| Number of Rooms | Owner-occupied | Renter-occupied |
| 1 Room | 0 (0.0%) | 70 (1.7%) |
| 2 or 3 Rooms | 5 (0.2%) | 738 (18.2%) |
| 4 or 5 Rooms | 398 (15.6%) | 2,167 (53.4%) |
| 6 or 7 Rooms | 1,492 (58.5%) | 985 (24.3%) |
| 8 or more Rooms | 657 (25.7%) | 101 (2.5%) |
| Total | 2,552 (100.0%) | 4,061 (100.0%) |
Housing Structure by Heating Type in Tifton
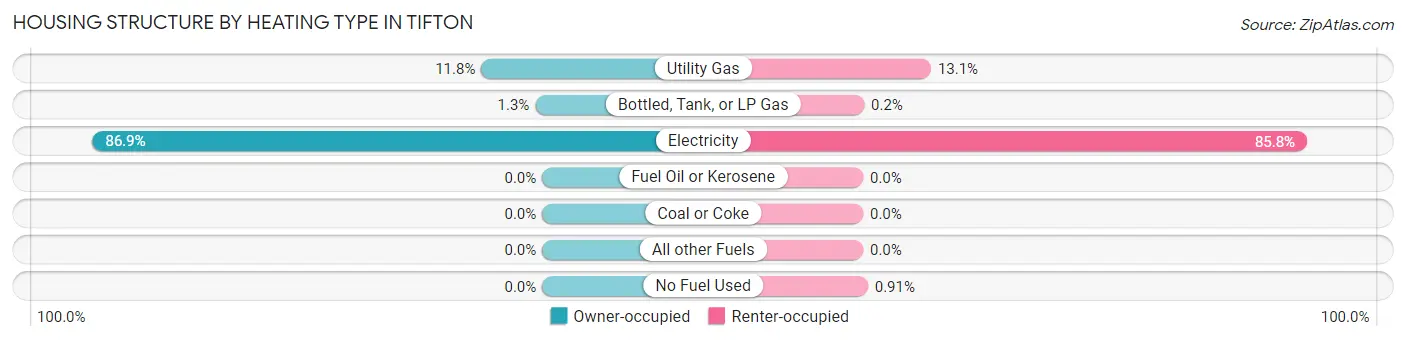
| Heating Type | Owner-occupied | Renter-occupied |
| Utility Gas | 300 (11.8%) | 533 (13.1%) |
| Bottled, Tank, or LP Gas | 34 (1.3%) | 8 (0.2%) |
| Electricity | 2,218 (86.9%) | 3,483 (85.8%) |
| Fuel Oil or Kerosene | 0 (0.0%) | 0 (0.0%) |
| Coal or Coke | 0 (0.0%) | 0 (0.0%) |
| All other Fuels | 0 (0.0%) | 0 (0.0%) |
| No Fuel Used | 0 (0.0%) | 37 (0.9%) |
| Total | 2,552 (100.0%) | 4,061 (100.0%) |
Household Vehicle Usage in Tifton
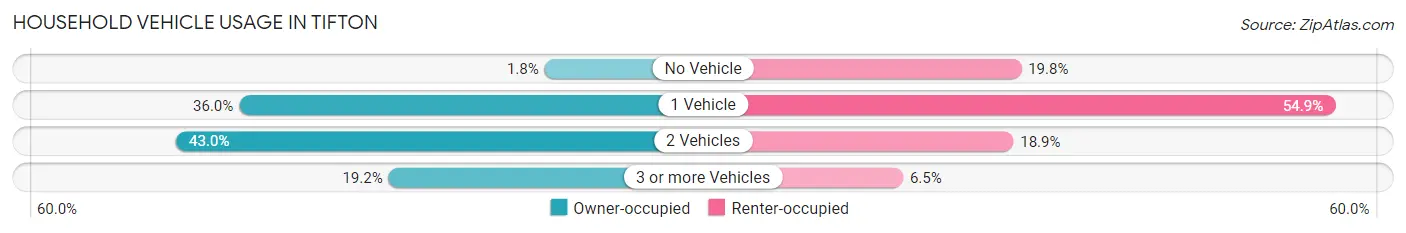
| Vehicles per Household | Owner-occupied | Renter-occupied |
| No Vehicle | 45 (1.8%) | 802 (19.8%) |
| 1 Vehicle | 918 (36.0%) | 2,229 (54.9%) |
| 2 Vehicles | 1,098 (43.0%) | 766 (18.9%) |
| 3 or more Vehicles | 491 (19.2%) | 264 (6.5%) |
| Total | 2,552 (100.0%) | 4,061 (100.0%) |
Real Estate & Mortgages in Tifton
Real Estate and Mortgage Overview in Tifton
| Characteristic | Without Mortgage | With Mortgage |
| Housing Units | 985 | 1,567 |
| Median Property Value | $150,600 | $169,300 |
| Median Household Income | $62,331 | $319 |
| Monthly Housing Costs | $456 | $47 |
| Real Estate Taxes | $989 | $0 |
Property Value by Mortgage Status in Tifton
| Property Value | Without Mortgage | With Mortgage |
| Less than $50,000 | 150 (15.2%) | 11 (0.7%) |
| $50,000 to $99,999 | 171 (17.4%) | 152 (9.7%) |
| $100,000 to $299,999 | 510 (51.8%) | 1,152 (73.5%) |
| $300,000 to $499,999 | 109 (11.1%) | 205 (13.1%) |
| $500,000 to $749,999 | 45 (4.6%) | 47 (3.0%) |
| $750,000 to $999,999 | 0 (0.0%) | 0 (0.0%) |
| $1,000,000 or more | 0 (0.0%) | 0 (0.0%) |
| Total | 985 (100.0%) | 1,567 (100.0%) |
Household Income by Mortgage Status in Tifton
| Household Income | Without Mortgage | With Mortgage |
| Less than $10,000 | 44 (4.5%) | 0 (0.0%) |
| $10,000 to $24,999 | 150 (15.2%) | 127 (8.1%) |
| $25,000 to $34,999 | 121 (12.3%) | 37 (2.4%) |
| $35,000 to $49,999 | 55 (5.6%) | 56 (3.6%) |
| $50,000 to $74,999 | 198 (20.1%) | 116 (7.4%) |
| $75,000 to $99,999 | 75 (7.6%) | 439 (28.0%) |
| $100,000 to $149,999 | 155 (15.7%) | 163 (10.4%) |
| $150,000 or more | 187 (19.0%) | 310 (19.8%) |
| Total | 985 (100.0%) | 1,567 (100.0%) |
Property Value to Household Income Ratio in Tifton
| Value-to-Income Ratio | Without Mortgage | With Mortgage |
| Less than 2.0x | 570 (57.9%) | 76,771 (4,899.2%) |
| 2.0x to 2.9x | 39 (4.0%) | 761 (48.6%) |
| 3.0x to 3.9x | 137 (13.9%) | 260 (16.6%) |
| 4.0x or more | 239 (24.3%) | 189 (12.1%) |
| Total | 985 (100.0%) | 1,567 (100.0%) |
Real Estate Taxes by Mortgage Status in Tifton
| Property Taxes | Without Mortgage | With Mortgage |
| Less than $800 | 360 (36.5%) | 127 (8.1%) |
| $800 to $1,499 | 180 (18.3%) | 110 (7.0%) |
| $800 to $1,499 | 363 (36.8%) | 571 (36.4%) |
| Total | 985 (100.0%) | 1,567 (100.0%) |
Health & Disability in Tifton
Health Insurance Coverage by Age in Tifton
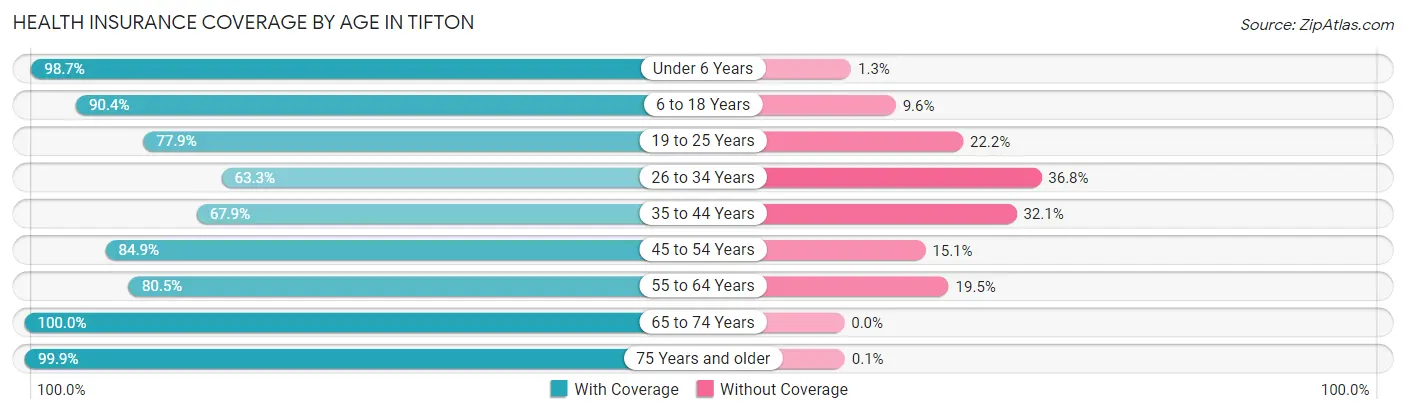
| Age Bracket | With Coverage | Without Coverage |
| Under 6 Years | 1,403 (98.7%) | 18 (1.3%) |
| 6 to 18 Years | 2,848 (90.4%) | 302 (9.6%) |
| 19 to 25 Years | 1,427 (77.8%) | 406 (22.2%) |
| 26 to 34 Years | 1,356 (63.2%) | 788 (36.7%) |
| 35 to 44 Years | 1,429 (67.9%) | 676 (32.1%) |
| 45 to 54 Years | 1,443 (84.9%) | 257 (15.1%) |
| 55 to 64 Years | 1,415 (80.5%) | 342 (19.5%) |
| 65 to 74 Years | 1,465 (100.0%) | 0 (0.0%) |
| 75 Years and older | 1,043 (99.9%) | 1 (0.1%) |
| Total | 13,829 (83.2%) | 2,790 (16.8%) |
Health Insurance Coverage by Citizenship Status in Tifton
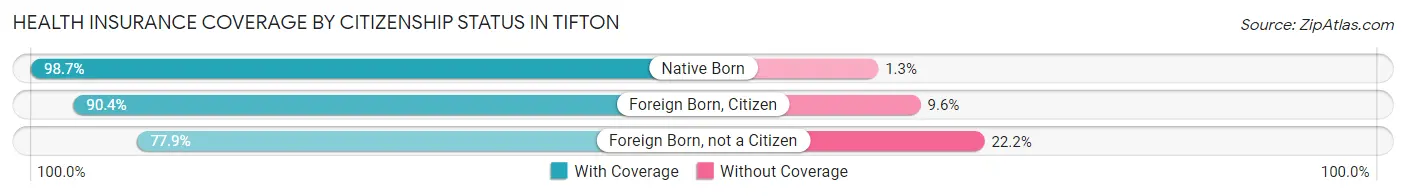
| Citizenship Status | With Coverage | Without Coverage |
| Native Born | 1,403 (98.7%) | 18 (1.3%) |
| Foreign Born, Citizen | 2,848 (90.4%) | 302 (9.6%) |
| Foreign Born, not a Citizen | 1,427 (77.8%) | 406 (22.2%) |
Health Insurance Coverage by Household Income in Tifton
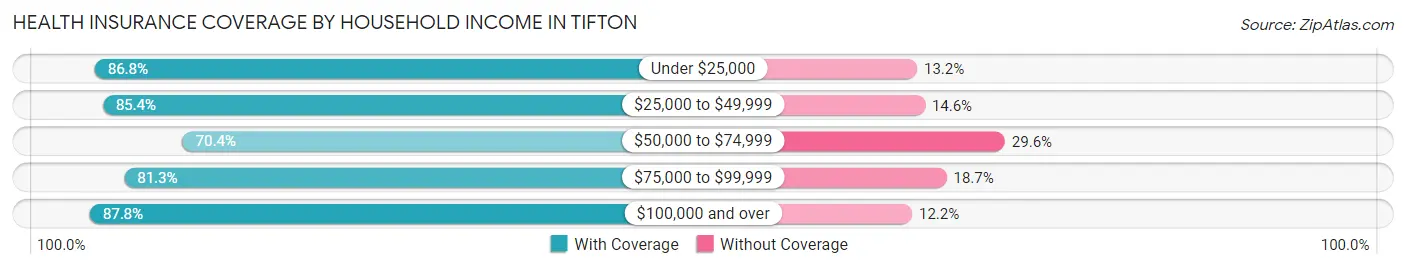
| Household Income | With Coverage | Without Coverage |
| Under $25,000 | 3,287 (86.8%) | 498 (13.2%) |
| $25,000 to $49,999 | 3,155 (85.4%) | 541 (14.6%) |
| $50,000 to $74,999 | 2,017 (70.4%) | 849 (29.6%) |
| $75,000 to $99,999 | 996 (81.3%) | 229 (18.7%) |
| $100,000 and over | 3,395 (87.8%) | 473 (12.2%) |
Public vs Private Health Insurance Coverage by Age in Tifton
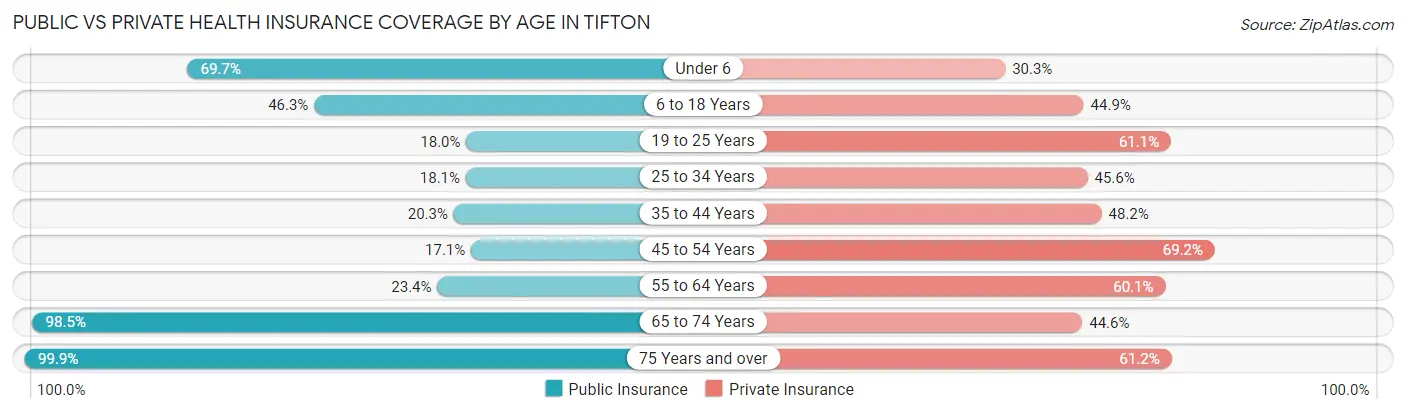
| Age Bracket | Public Insurance | Private Insurance |
| Under 6 | 991 (69.7%) | 431 (30.3%) |
| 6 to 18 Years | 1,457 (46.3%) | 1,414 (44.9%) |
| 19 to 25 Years | 330 (18.0%) | 1,120 (61.1%) |
| 25 to 34 Years | 388 (18.1%) | 978 (45.6%) |
| 35 to 44 Years | 428 (20.3%) | 1,015 (48.2%) |
| 45 to 54 Years | 291 (17.1%) | 1,177 (69.2%) |
| 55 to 64 Years | 411 (23.4%) | 1,055 (60.1%) |
| 65 to 74 Years | 1,443 (98.5%) | 654 (44.6%) |
| 75 Years and over | 1,043 (99.9%) | 639 (61.2%) |
| Total | 6,782 (40.8%) | 8,483 (51.0%) |
Disability Status by Sex by Age in Tifton
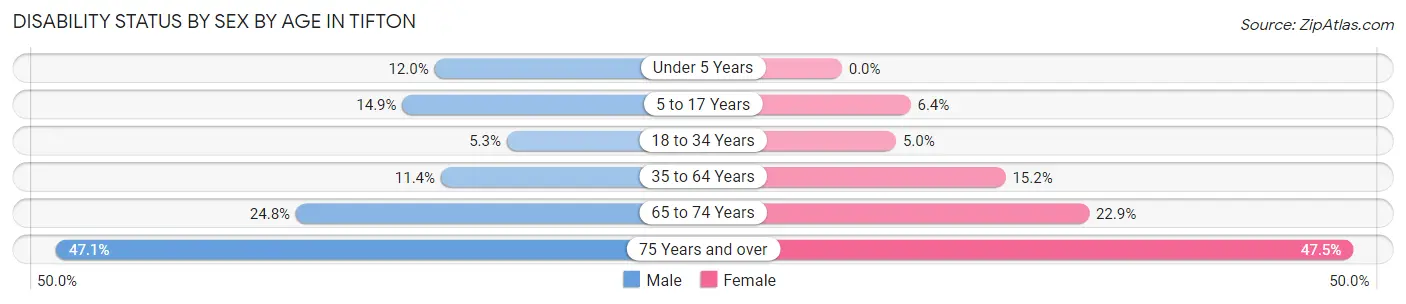
| Age Bracket | Male | Female |
| Under 5 Years | 89 (12.0%) | 0 (0.0%) |
| 5 to 17 Years | 220 (14.9%) | 79 (6.4%) |
| 18 to 34 Years | 123 (5.2%) | 112 (5.0%) |
| 35 to 64 Years | 279 (11.4%) | 472 (15.2%) |
| 65 to 74 Years | 171 (24.8%) | 178 (22.9%) |
| 75 Years and over | 169 (47.1%) | 325 (47.4%) |
Disability Class by Sex by Age in Tifton
Disability Class: Hearing Difficulty
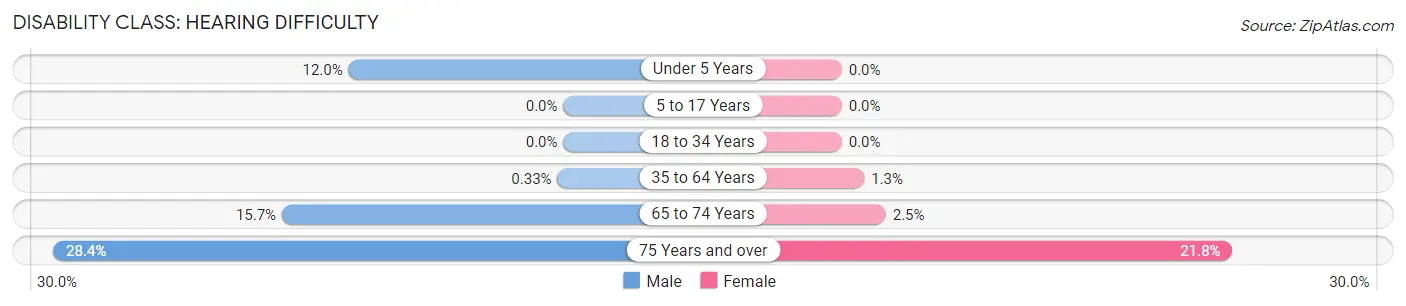
| Age Bracket | Male | Female |
| Under 5 Years | 89 (12.0%) | 0 (0.0%) |
| 5 to 17 Years | 0 (0.0%) | 0 (0.0%) |
| 18 to 34 Years | 0 (0.0%) | 0 (0.0%) |
| 35 to 64 Years | 8 (0.3%) | 39 (1.3%) |
| 65 to 74 Years | 108 (15.7%) | 19 (2.5%) |
| 75 Years and over | 102 (28.4%) | 149 (21.7%) |
Disability Class: Vision Difficulty
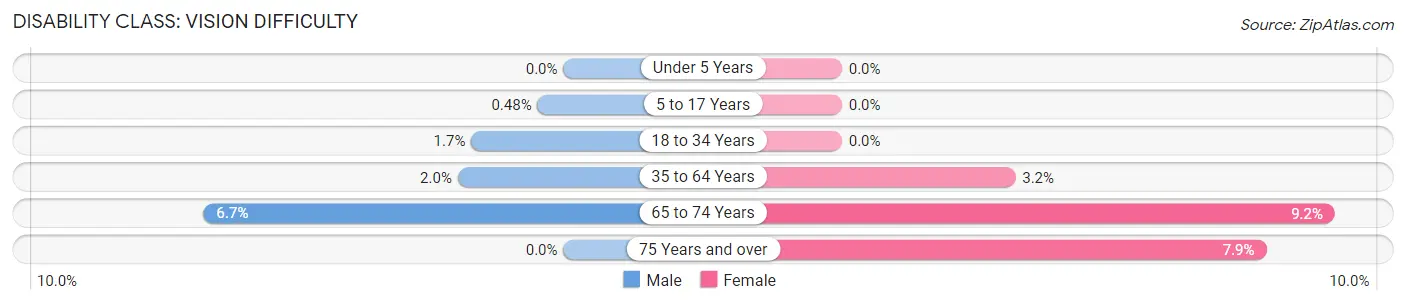
| Age Bracket | Male | Female |
| Under 5 Years | 0 (0.0%) | 0 (0.0%) |
| 5 to 17 Years | 7 (0.5%) | 0 (0.0%) |
| 18 to 34 Years | 40 (1.7%) | 0 (0.0%) |
| 35 to 64 Years | 48 (2.0%) | 100 (3.2%) |
| 65 to 74 Years | 46 (6.7%) | 71 (9.1%) |
| 75 Years and over | 0 (0.0%) | 54 (7.9%) |
Disability Class: Cognitive Difficulty
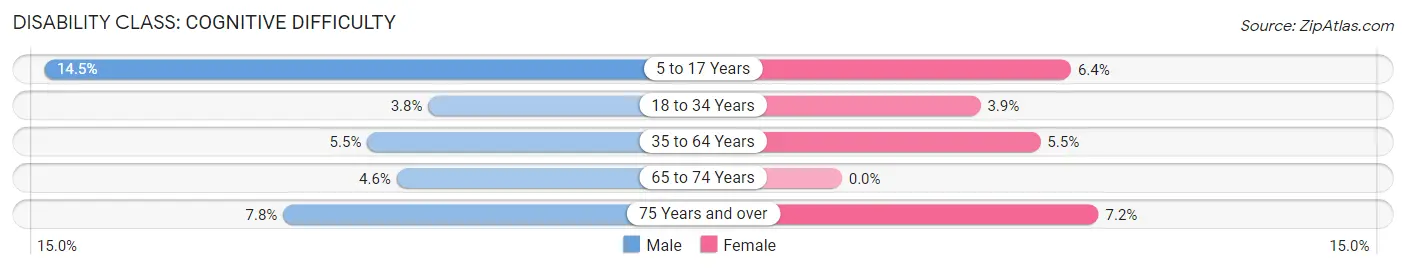
| Age Bracket | Male | Female |
| 5 to 17 Years | 213 (14.5%) | 79 (6.4%) |
| 18 to 34 Years | 88 (3.8%) | 86 (3.9%) |
| 35 to 64 Years | 134 (5.5%) | 172 (5.5%) |
| 65 to 74 Years | 32 (4.6%) | 0 (0.0%) |
| 75 Years and over | 28 (7.8%) | 49 (7.1%) |
Disability Class: Ambulatory Difficulty
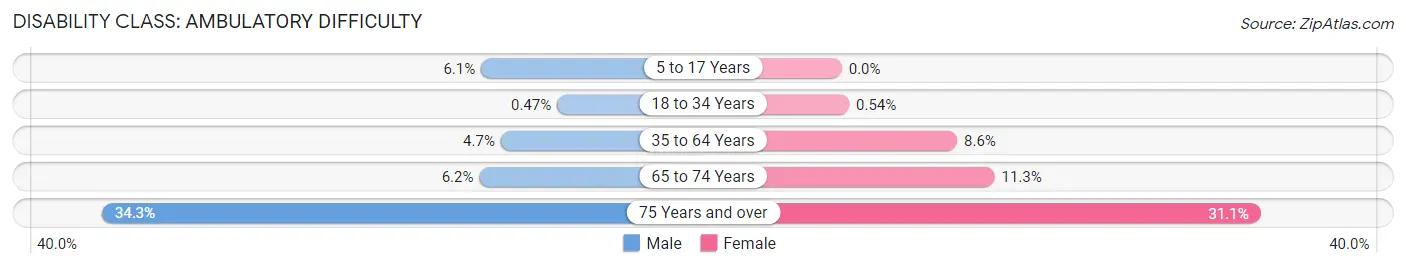
| Age Bracket | Male | Female |
| 5 to 17 Years | 90 (6.1%) | 0 (0.0%) |
| 18 to 34 Years | 11 (0.5%) | 12 (0.5%) |
| 35 to 64 Years | 114 (4.6%) | 266 (8.6%) |
| 65 to 74 Years | 43 (6.2%) | 88 (11.3%) |
| 75 Years and over | 123 (34.3%) | 213 (31.1%) |
Disability Class: Self-Care Difficulty
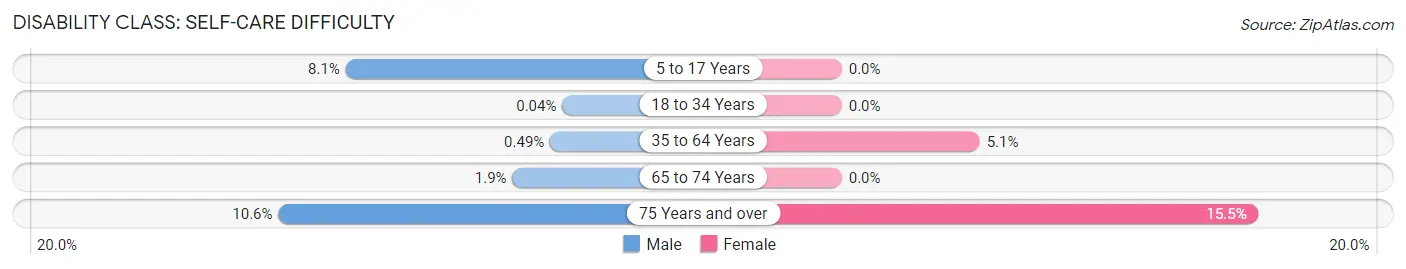
| Age Bracket | Male | Female |
| 5 to 17 Years | 119 (8.1%) | 0 (0.0%) |
| 18 to 34 Years | 1 (0.0%) | 0 (0.0%) |
| 35 to 64 Years | 12 (0.5%) | 159 (5.1%) |
| 65 to 74 Years | 13 (1.9%) | 0 (0.0%) |
| 75 Years and over | 38 (10.6%) | 106 (15.5%) |
Technology Access in Tifton
Computing Device Access in Tifton
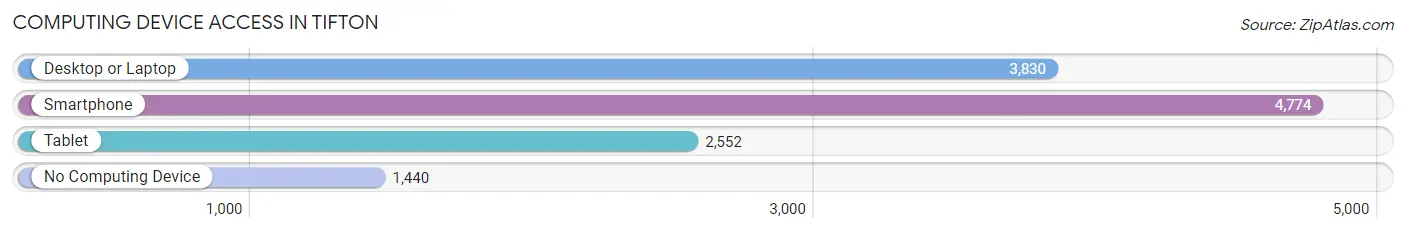
| Device Type | # Households | % Households |
| Desktop or Laptop | 3,830 | 57.9% |
| Smartphone | 4,774 | 72.2% |
| Tablet | 2,552 | 38.6% |
| No Computing Device | 1,440 | 21.8% |
| Total | 6,613 | 100.0% |
Internet Access in Tifton
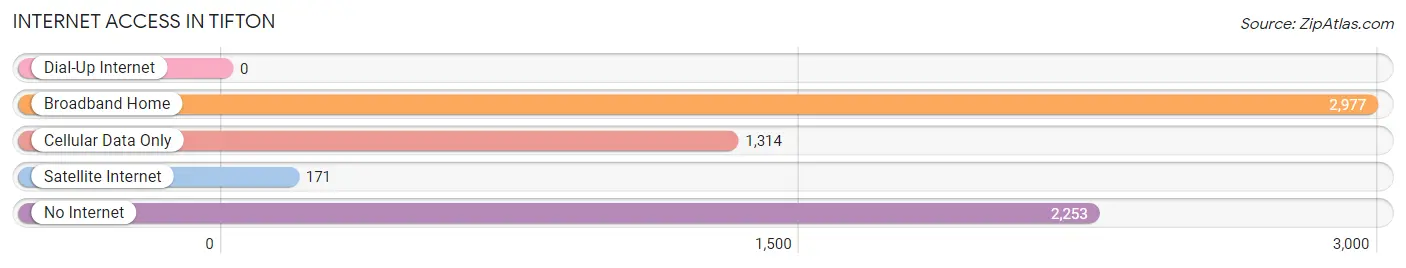
| Internet Type | # Households | % Households |
| Dial-Up Internet | 0 | 0.0% |
| Broadband Home | 2,977 | 45.0% |
| Cellular Data Only | 1,314 | 19.9% |
| Satellite Internet | 171 | 2.6% |
| No Internet | 2,253 | 34.1% |
| Total | 6,613 | 100.0% |
Tifton Summary
Tifton is a city located in Tift County, Georgia, United States. It is the county seat of Tift County and the largest city in the county. The population was 16,350 at the 2000 census. The city is the home of Abraham Baldwin Agricultural College, a two-year college of the University System of Georgia.
History
Tifton was founded in 1872 by Henry Harding Tift, a cotton merchant and railroad builder. The city was named after Tift's father, Nathan Tift, who was a cotton merchant and planter. The city was incorporated in 1890.
Tifton was a major center of the cotton industry in the late 19th and early 20th centuries. The city was home to several cotton mills, including the Tifton Cotton Mill, which was the largest cotton mill in the world at the time. The city was also home to several other industries, including a sawmill, a grist mill, and a brickyard.
Geography
Tifton is located at 31°27'N 83°31'W (31.45, -83.52). According to the United States Census Bureau, the city has a total area of 16.2 square miles (41.8 km2), of which 16.1 square miles (41.6 km2) is land and 0.1 square miles (0.2 km2) (0.62%) is water.
Economy
Tifton's economy is largely based on agriculture and agribusiness. The city is home to several large agricultural companies, including Syngenta, a global agribusiness company, and Tift Regional Medical Center, a regional healthcare provider. The city is also home to several smaller businesses, including restaurants, retail stores, and professional services.
Demographics
As of the census of 2000, there were 16,350 people, 6,541 households, and 4,521 families residing in the city. The population density was 1,006.2 people per square mile (389.2/km2). There were 7,093 housing units at an average density of 437.7 per square mile (169.2/km2). The racial makeup of the city was 57.2% White, 39.2% African American, 0.3% Native American, 1.2% Asian, 0.1% Pacific Islander, 0.9% from other races, and 1.1% from two or more races. Hispanic or Latino of any race were 2.3% of the population.
There were 6,541 households, out of which 32.2% had children under the age of 18 living with them, 48.2% were married couples living together, 17.2% had a female householder with no husband present, and 30.2% were non-families. 25.7% of all households were made up of individuals, and 10.2% had someone living alone who was 65 years of age or older. The average household size was 2.48 and the average family size was 2.97.
In the city, the population was spread out, with 25.2% under the age of 18, 11.2% from 18 to 24, 27.2% from 25 to 44, 22.2% from 45 to 64, and 14.2% who were 65 years of age or older. The median age was 35 years. For every 100 females, there were 87.7 males. For every 100 females age 18 and over, there were 83.2 males.
The median income for a household in the city was $30,945, and the median income for a family was $37,813. Males had a median income of $30,845 versus $21,845 for females. The per capita income for the city was $16,945. About 16.2% of families and 19.3% of the population were below the poverty line, including 25.2% of those under age 18 and 16.2% of those age 65 or over.
Common Questions
What is Per Capita Income in Tifton?
Per Capita income in Tifton is $25,714.
What is the Median Family Income in Tifton?
Median Family Income in Tifton is $53,268.
What is the Median Household income in Tifton?
Median Household Income in Tifton is $42,200.
What is Income or Wage Gap in Tifton?
Income or Wage Gap in Tifton is 23.4%.
Women in Tifton earn 76.6 cents for every dollar earned by a man.
What is Family Income Deficit in Tifton?
Family Income Deficit in Tifton is $13,759.
Families that are below poverty line in Tifton earn $13,759 less on average than the poverty threshold level.
What is Inequality or Gini Index in Tifton?
Inequality or Gini Index in Tifton is 0.46.
What is the Total Population of Tifton?
Total Population of Tifton is 17,059.
What is the Total Male Population of Tifton?
Total Male Population of Tifton is 8,357.
What is the Total Female Population of Tifton?
Total Female Population of Tifton is 8,702.
What is the Ratio of Males per 100 Females in Tifton?
There are 96.04 Males per 100 Females in Tifton.
What is the Ratio of Females per 100 Males in Tifton?
There are 104.13 Females per 100 Males in Tifton.
What is the Median Population Age in Tifton?
Median Population Age in Tifton is 34.6 Years.
What is the Average Family Size in Tifton
Average Family Size in Tifton is 3.1 People.
What is the Average Household Size in Tifton
Average Household Size in Tifton is 2.3 People.
How Large is the Labor Force in Tifton?
There are 7,426 People in the Labor Forcein in Tifton.
What is the Percentage of People in the Labor Force in Tifton?
54.7% of People are in the Labor Force in Tifton.
What is the Unemployment Rate in Tifton?
Unemployment Rate in Tifton is 2.5%.