Zip Codes with the Highest Percentage of Population Employed in Architecture & Engineering in Lithonia, GA
RELATED REPORTS & OPTIONS
Architecture & Engineering
Lithonia
Compare Zip Codes
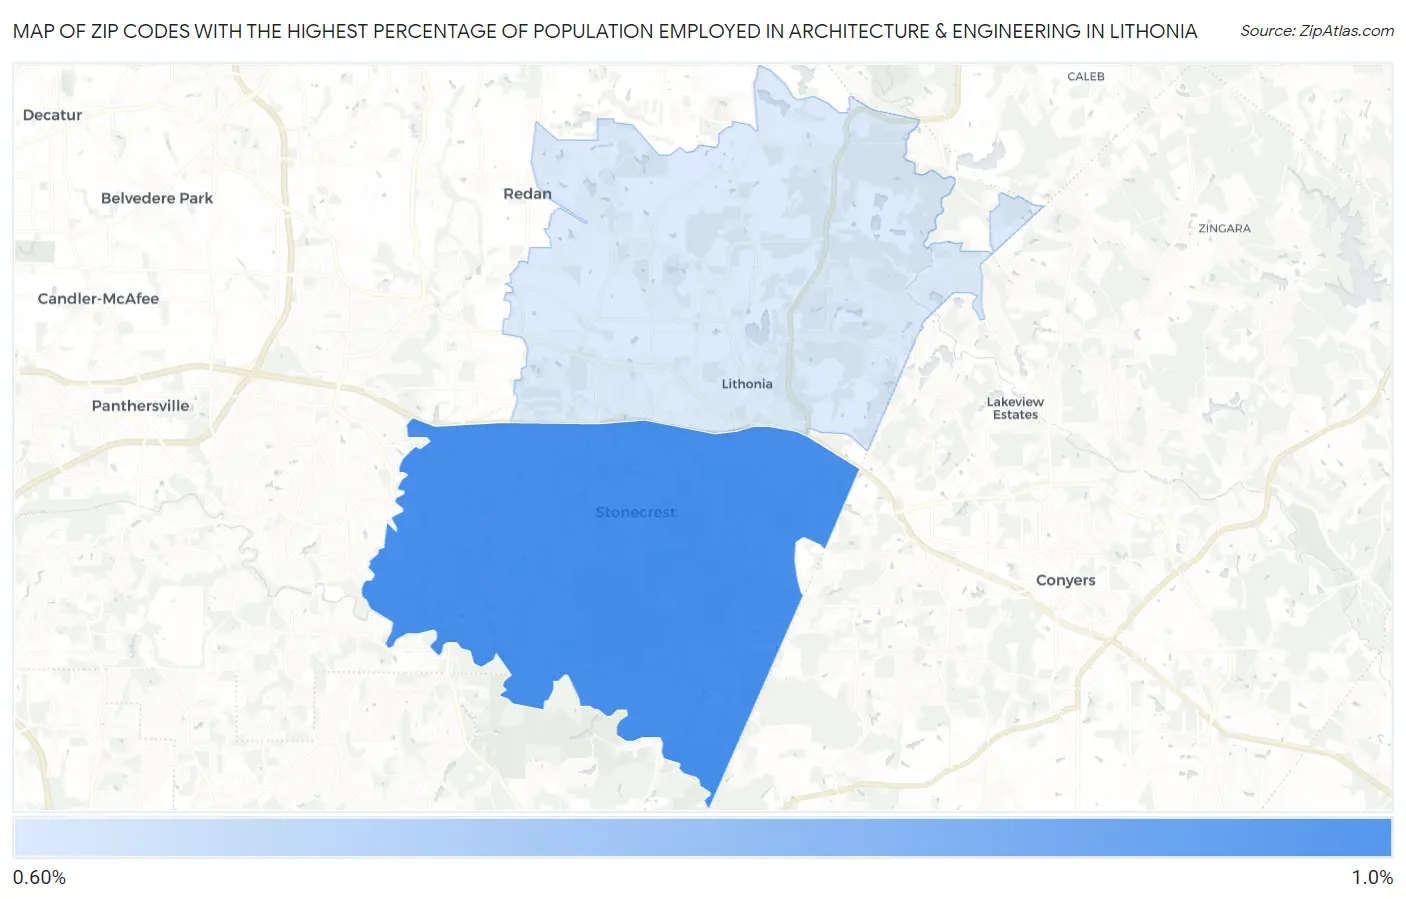
Map of Zip Codes with the Highest Percentage of Population Employed in Architecture & Engineering in Lithonia
0.69%
0.83%
Zip Codes with the Highest Percentage of Population Employed in Architecture & Engineering in Lithonia, GA
| Zip Code | % Employed | vs State | vs National | |
| 1. | 30038 | 0.83% | 1.8%(-0.965)#370 | 2.1%(-1.32)#17,922 |
| 2. | 30058 | 0.69% | 1.8%(-1.11)#406 | 2.1%(-1.46)#18,970 |
1
Common Questions
What are the Top Zip Codes with the Highest Percentage of Population Employed in Architecture & Engineering in Lithonia, GA?
Top Zip Codes with the Highest Percentage of Population Employed in Architecture & Engineering in Lithonia, GA are:
What zip code has the Highest Percentage of Population Employed in Architecture & Engineering in Lithonia, GA?
30038 has the Highest Percentage of Population Employed in Architecture & Engineering in Lithonia, GA with 0.83%.
What is the Percentage of Population Employed in Architecture & Engineering in Georgia?
Percentage of Population Employed in Architecture & Engineering in Georgia is 1.8%.
What is the Percentage of Population Employed in Architecture & Engineering in the United States?
Percentage of Population Employed in Architecture & Engineering in the United States is 2.1%.