Zip Codes with the Highest Percentage of Population Employed in Architecture & Engineering in Marietta, GA
RELATED REPORTS & OPTIONS
Architecture & Engineering
Marietta
Compare Zip Codes
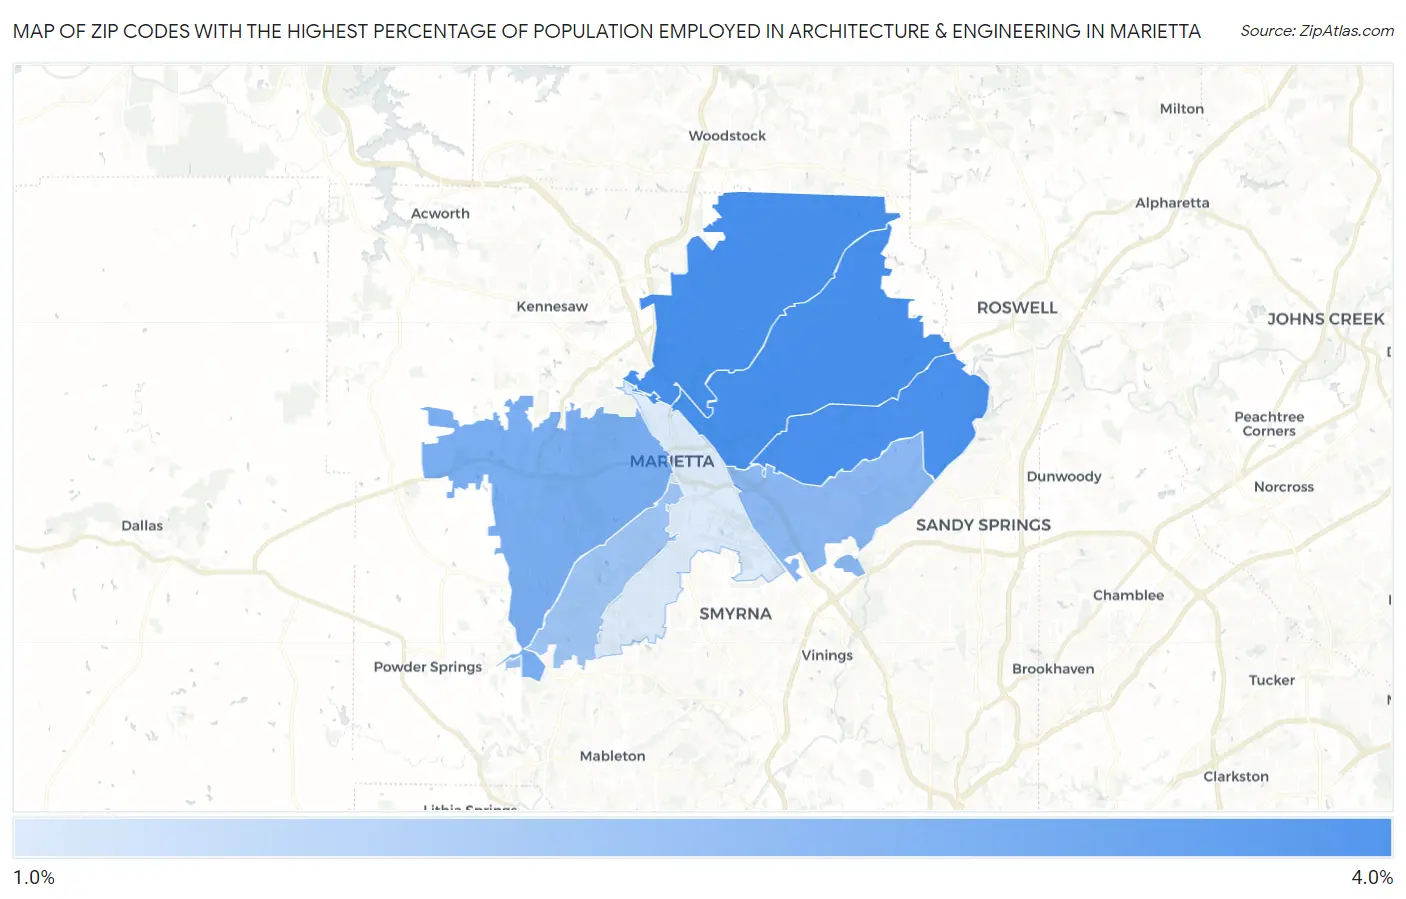
Map of Zip Codes with the Highest Percentage of Population Employed in Architecture & Engineering in Marietta
1.1%
3.2%
Zip Codes with the Highest Percentage of Population Employed in Architecture & Engineering in Marietta, GA
| Zip Code | % Employed | vs State | vs National | |
| 1. | 30066 | 3.2% | 1.8%(+1.44)#60 | 2.1%(+1.09)#4,355 |
| 2. | 30062 | 3.2% | 1.8%(+1.44)#62 | 2.1%(+1.08)#4,382 |
| 3. | 30068 | 3.2% | 1.8%(+1.41)#64 | 2.1%(+1.06)#4,452 |
| 4. | 30064 | 2.5% | 1.8%(+0.725)#121 | 2.1%(+0.370)#6,913 |
| 5. | 30067 | 2.3% | 1.8%(+0.477)#151 | 2.1%(+0.123)#8,089 |
| 6. | 30008 | 2.0% | 1.8%(+0.201)#186 | 2.1%(-0.153)#9,629 |
| 7. | 30060 | 1.1% | 1.8%(-0.691)#323 | 2.1%(-1.04)#15,816 |
1
Common Questions
What are the Top 5 Zip Codes with the Highest Percentage of Population Employed in Architecture & Engineering in Marietta, GA?
Top 5 Zip Codes with the Highest Percentage of Population Employed in Architecture & Engineering in Marietta, GA are:
What zip code has the Highest Percentage of Population Employed in Architecture & Engineering in Marietta, GA?
30066 has the Highest Percentage of Population Employed in Architecture & Engineering in Marietta, GA with 3.2%.
What is the Percentage of Population Employed in Architecture & Engineering in Marietta, GA?
Percentage of Population Employed in Architecture & Engineering in Marietta is 2.3%.
What is the Percentage of Population Employed in Architecture & Engineering in Georgia?
Percentage of Population Employed in Architecture & Engineering in Georgia is 1.8%.
What is the Percentage of Population Employed in Architecture & Engineering in the United States?
Percentage of Population Employed in Architecture & Engineering in the United States is 2.1%.