Springville, UT Map & Demographics
Springville Map
Springville Overview
$29,444
PER CAPITA INCOME
$94,450
AVG FAMILY INCOME
$84,699
AVG HOUSEHOLD INCOME
49.1%
WAGE / INCOME GAP [ % ]
50.9¢/ $1
WAGE / INCOME GAP [ $ ]
0.38
INEQUALITY / GINI INDEX
35,195
TOTAL POPULATION
17,657
MALE POPULATION
17,538
FEMALE POPULATION
100.68
MALES / 100 FEMALES
99.33
FEMALES / 100 MALES
26.9
MEDIAN AGE
3.9
AVG FAMILY SIZE
3.4
AVG HOUSEHOLD SIZE
16,464
LABOR FORCE [ PEOPLE ]
69.8%
PERCENT IN LABOR FORCE
2.7%
UNEMPLOYMENT RATE
Springville Zip Codes
Income in Springville
Income Overview in Springville
Per Capita Income in Springville is $29,444, while median incomes of families and households are $94,450 and $84,699 respectively.
| Characteristic | Number | Measure |
| Per Capita Income | 35,195 | $29,444 |
| Median Family Income | 8,193 | $94,450 |
| Mean Family Income | 8,193 | $110,695 |
| Median Household Income | 10,258 | $84,699 |
| Mean Household Income | 10,258 | $99,894 |
| Income Deficit | 8,193 | $0 |
| Wage / Income Gap (%) | 35,195 | 49.07% |
| Wage / Income Gap ($) | 35,195 | 50.93¢ per $1 |
| Gini / Inequality Index | 35,195 | 0.38 |
Earnings by Sex in Springville
Average Earnings in Springville are $36,324, $51,856 for men and $26,410 for women, a difference of 49.1%.

| Sex | Number | Average Earnings |
| Male | 9,742 (55.9%) | $51,856 |
| Female | 7,696 (44.1%) | $26,410 |
| Total | 17,438 (100.0%) | $36,324 |
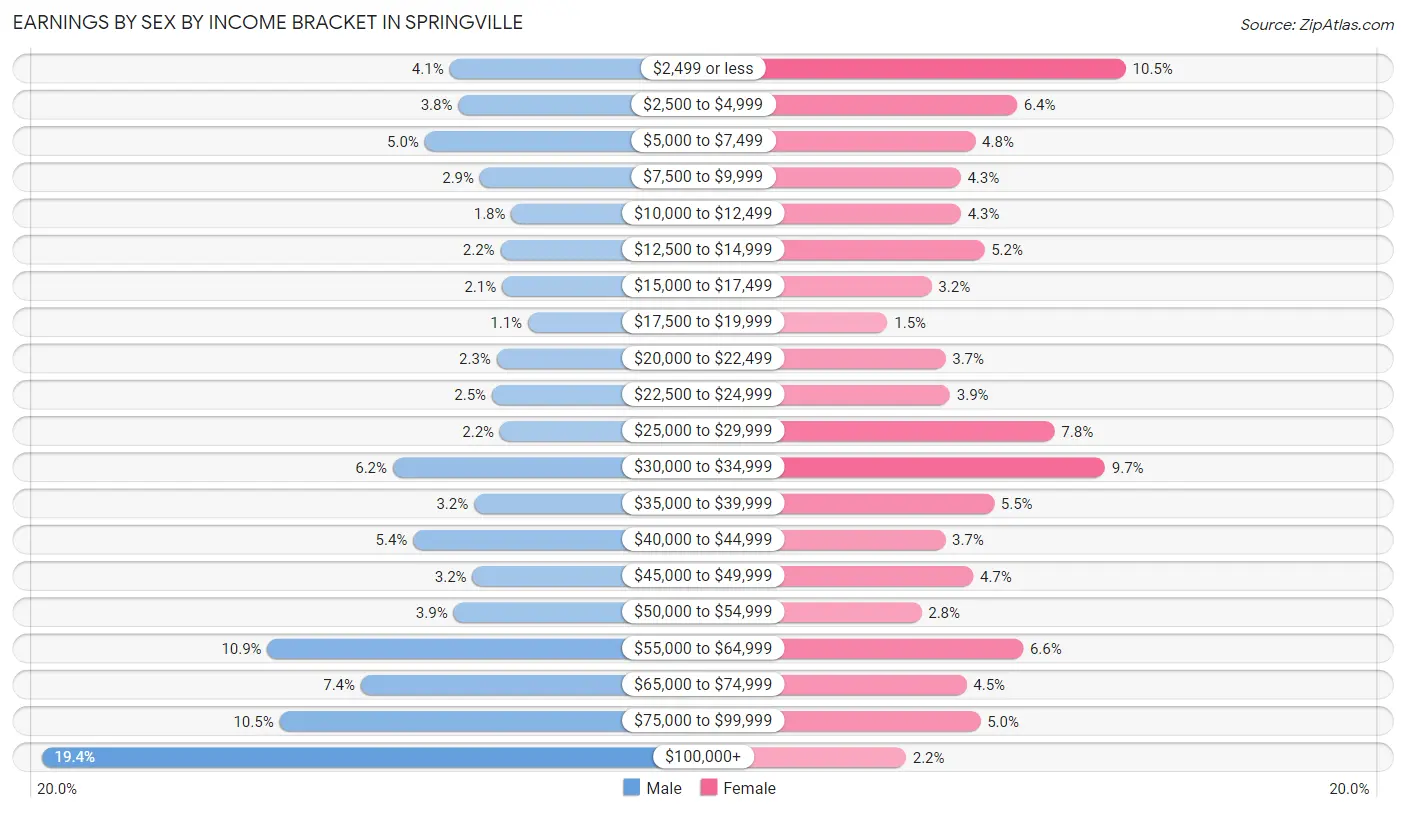
Earnings by Sex by Income Bracket in Springville
The most common earnings brackets in Springville are $100,000+ for men (1,886 | 19.4%) and $2,499 or less for women (804 | 10.4%).
| Income | Male | Female |
| $2,499 or less | 397 (4.1%) | 804 (10.4%) |
| $2,500 to $4,999 | 365 (3.7%) | 490 (6.4%) |
| $5,000 to $7,499 | 488 (5.0%) | 370 (4.8%) |
| $7,500 to $9,999 | 286 (2.9%) | 328 (4.3%) |
| $10,000 to $12,499 | 171 (1.8%) | 329 (4.3%) |
| $12,500 to $14,999 | 211 (2.2%) | 396 (5.1%) |
| $15,000 to $17,499 | 206 (2.1%) | 244 (3.2%) |
| $17,500 to $19,999 | 111 (1.1%) | 117 (1.5%) |
| $20,000 to $22,499 | 225 (2.3%) | 284 (3.7%) |
| $22,500 to $24,999 | 243 (2.5%) | 297 (3.9%) |
| $25,000 to $29,999 | 213 (2.2%) | 599 (7.8%) |
| $30,000 to $34,999 | 604 (6.2%) | 744 (9.7%) |
| $35,000 to $39,999 | 308 (3.2%) | 424 (5.5%) |
| $40,000 to $44,999 | 530 (5.4%) | 283 (3.7%) |
| $45,000 to $49,999 | 314 (3.2%) | 364 (4.7%) |
| $50,000 to $54,999 | 383 (3.9%) | 215 (2.8%) |
| $55,000 to $64,999 | 1,062 (10.9%) | 508 (6.6%) |
| $65,000 to $74,999 | 721 (7.4%) | 345 (4.5%) |
| $75,000 to $99,999 | 1,018 (10.4%) | 385 (5.0%) |
| $100,000+ | 1,886 (19.4%) | 170 (2.2%) |
| Total | 9,742 (100.0%) | 7,696 (100.0%) |
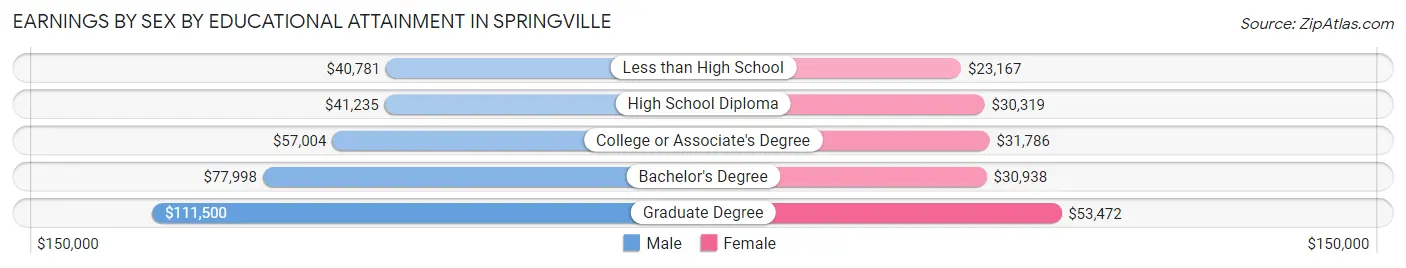
Earnings by Sex by Educational Attainment in Springville
Average earnings in Springville are $61,006 for men and $31,735 for women, a difference of 48.0%. Men with an educational attainment of graduate degree enjoy the highest average annual earnings of $111,500, while those with less than high school education earn the least with $40,781. Women with an educational attainment of graduate degree earn the most with the average annual earnings of $53,472, while those with less than high school education have the smallest earnings of $23,167.
| Educational Attainment | Male Income | Female Income |
| Less than High School | $40,781 | $23,167 |
| High School Diploma | $41,235 | $30,319 |
| College or Associate's Degree | $57,004 | $31,786 |
| Bachelor's Degree | $77,998 | $30,938 |
| Graduate Degree | $111,500 | $53,472 |
| Total | $61,006 | $31,735 |
Family Income in Springville
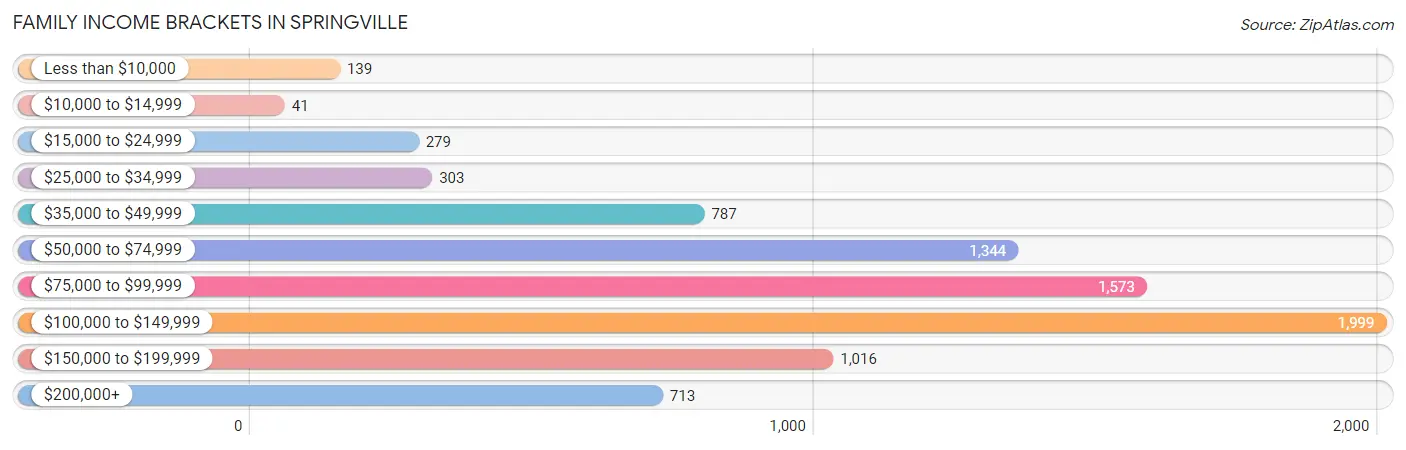
Family Income Brackets in Springville
According to the Springville family income data, there are 1,999 families falling into the $100,000 to $149,999 income range, which is the most common income bracket and makes up 24.4% of all families. Conversely, the $10,000 to $14,999 income bracket is the least frequent group with only 41 families (0.5%) belonging to this category.
| Income Bracket | # Families | % Families |
| Less than $10,000 | 139 | 1.7% |
| $10,000 to $14,999 | 41 | 0.5% |
| $15,000 to $24,999 | 279 | 3.4% |
| $25,000 to $34,999 | 303 | 3.7% |
| $35,000 to $49,999 | 787 | 9.6% |
| $50,000 to $74,999 | 1,344 | 16.4% |
| $75,000 to $99,999 | 1,573 | 19.2% |
| $100,000 to $149,999 | 1,999 | 24.4% |
| $150,000 to $199,999 | 1,016 | 12.4% |
| $200,000+ | 713 | 8.7% |
Family Income by Famaliy Size in Springville
7+ person families (626 | 7.6%) account for the highest median family income in Springville with $120,938 per family, while 2-person families (2,409 | 29.4%) have the highest median income of $40,625 per family member.
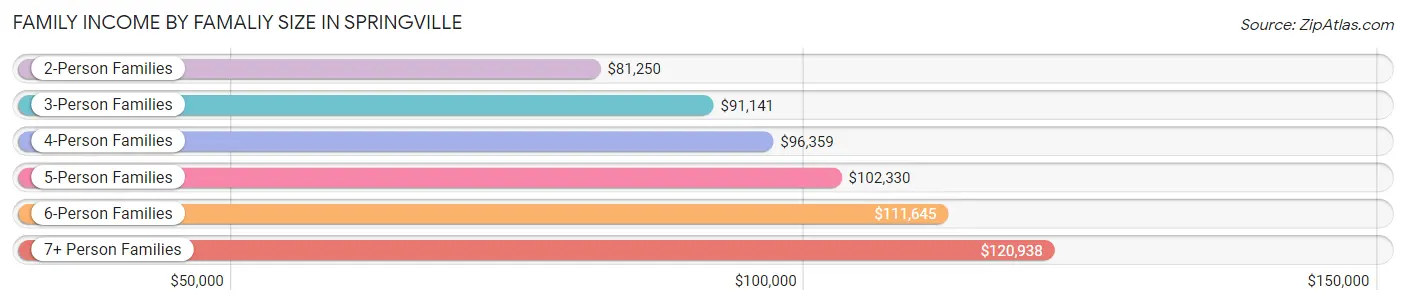
| Income Bracket | # Families | Median Income |
| 2-Person Families | 2,409 (29.4%) | $81,250 |
| 3-Person Families | 1,713 (20.9%) | $91,141 |
| 4-Person Families | 1,681 (20.5%) | $96,359 |
| 5-Person Families | 851 (10.4%) | $102,330 |
| 6-Person Families | 913 (11.1%) | $111,645 |
| 7+ Person Families | 626 (7.6%) | $120,938 |
| Total | 8,193 (100.0%) | $94,450 |
Family Income by Number of Earners in Springville
The median family income in Springville is $94,450, with families comprising 3+ earners (1,429) having the highest median family income of $167,550, while families with no earners (565) have the lowest median family income of $59,911, accounting for 17.4% and 6.9% of families, respectively.
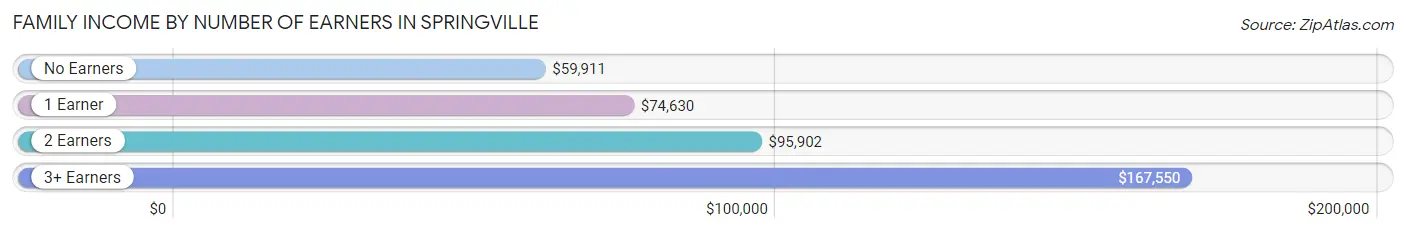
| Number of Earners | # Families | Median Income |
| No Earners | 565 (6.9%) | $59,911 |
| 1 Earner | 2,446 (29.8%) | $74,630 |
| 2 Earners | 3,753 (45.8%) | $95,902 |
| 3+ Earners | 1,429 (17.4%) | $167,550 |
| Total | 8,193 (100.0%) | $94,450 |
Household Income in Springville
Household Income Brackets in Springville
With 2,175 households falling in the category, the $100,000 to $149,999 income range is the most frequent in Springville, accounting for 21.2% of all households. In contrast, only 205 households (2.0%) fall into the less than $10,000 income bracket, making it the least populous group.
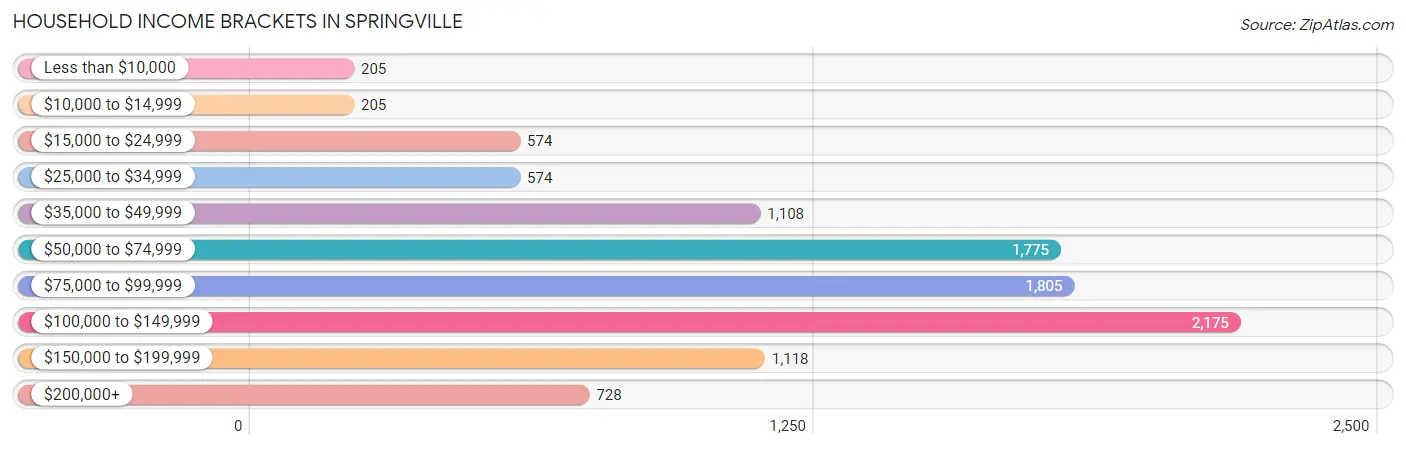
| Income Bracket | # Households | % Households |
| Less than $10,000 | 205 | 2.0% |
| $10,000 to $14,999 | 205 | 2.0% |
| $15,000 to $24,999 | 574 | 5.6% |
| $25,000 to $34,999 | 574 | 5.6% |
| $35,000 to $49,999 | 1,108 | 10.8% |
| $50,000 to $74,999 | 1,775 | 17.3% |
| $75,000 to $99,999 | 1,805 | 17.6% |
| $100,000 to $149,999 | 2,175 | 21.2% |
| $150,000 to $199,999 | 1,118 | 10.9% |
| $200,000+ | 728 | 7.1% |
Household Income by Householder Age in Springville
The median household income in Springville is $84,699, with the highest median household income of $103,956 found in the 45 to 64 years age bracket for the primary householder. A total of 2,987 households (29.1%) fall into this category. Meanwhile, the 15 to 24 years age bracket for the primary householder has the lowest median household income of $44,750, with 671 households (6.5%) in this group.
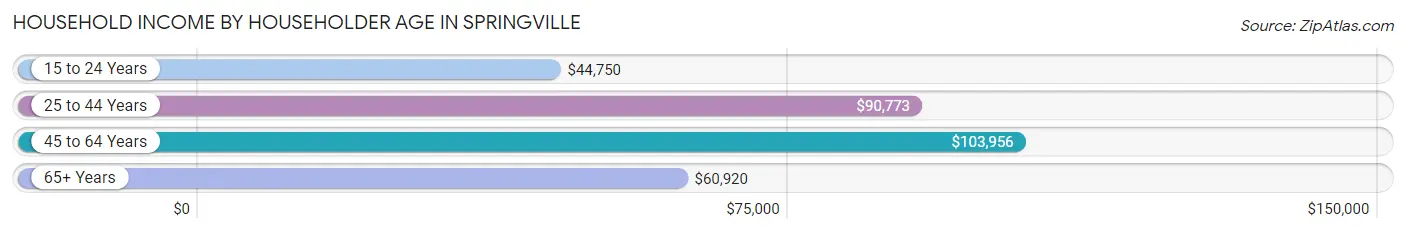
| Income Bracket | # Households | Median Income |
| 15 to 24 Years | 671 (6.5%) | $44,750 |
| 25 to 44 Years | 4,535 (44.2%) | $90,773 |
| 45 to 64 Years | 2,987 (29.1%) | $103,956 |
| 65+ Years | 2,065 (20.1%) | $60,920 |
| Total | 10,258 (100.0%) | $84,699 |
Poverty in Springville
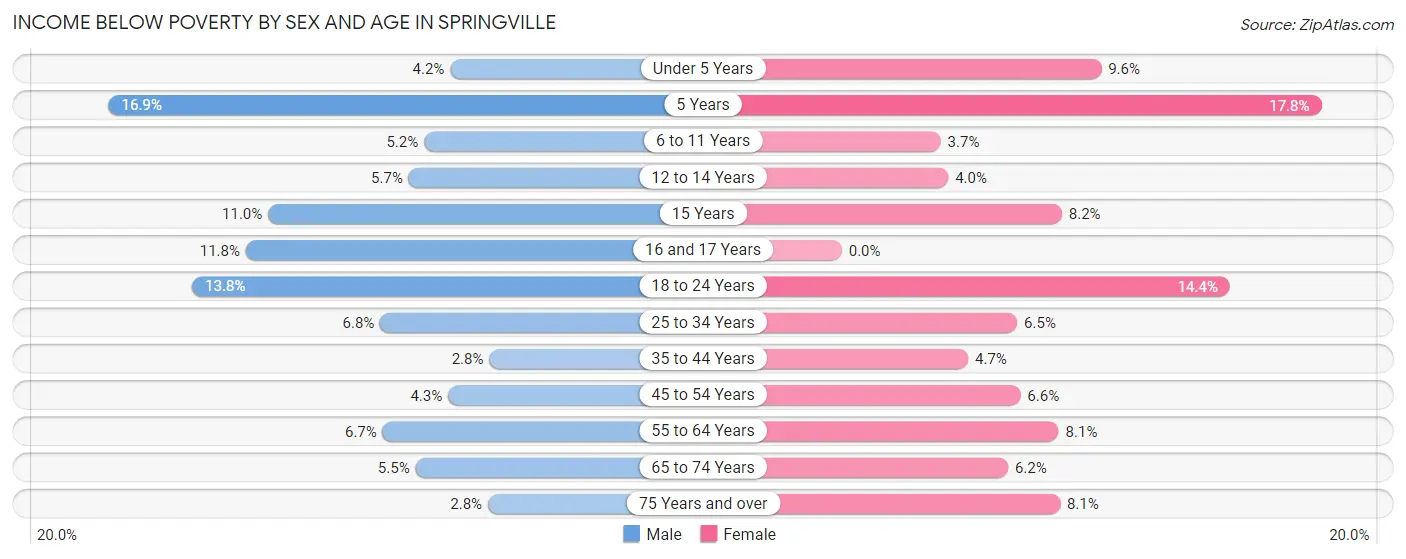
Income Below Poverty by Sex and Age in Springville
With 6.7% poverty level for males and 7.2% for females among the residents of Springville, 5 year old males and 5 year old females are the most vulnerable to poverty, with 93 males (16.9%) and 60 females (17.8%) in their respective age groups living below the poverty level.
| Age Bracket | Male | Female |
| Under 5 Years | 73 (4.2%) | 174 (9.6%) |
| 5 Years | 93 (16.9%) | 60 (17.8%) |
| 6 to 11 Years | 117 (5.2%) | 78 (3.7%) |
| 12 to 14 Years | 55 (5.7%) | 38 (4.0%) |
| 15 Years | 49 (11.0%) | 25 (8.2%) |
| 16 and 17 Years | 81 (11.8%) | 0 (0.0%) |
| 18 to 24 Years | 240 (13.8%) | 276 (14.4%) |
| 25 to 34 Years | 201 (6.8%) | 184 (6.5%) |
| 35 to 44 Years | 59 (2.8%) | 102 (4.7%) |
| 45 to 54 Years | 66 (4.3%) | 102 (6.6%) |
| 55 to 64 Years | 83 (6.7%) | 100 (8.1%) |
| 65 to 74 Years | 45 (5.5%) | 66 (6.2%) |
| 75 Years and over | 14 (2.8%) | 57 (8.1%) |
| Total | 1,176 (6.7%) | 1,262 (7.2%) |
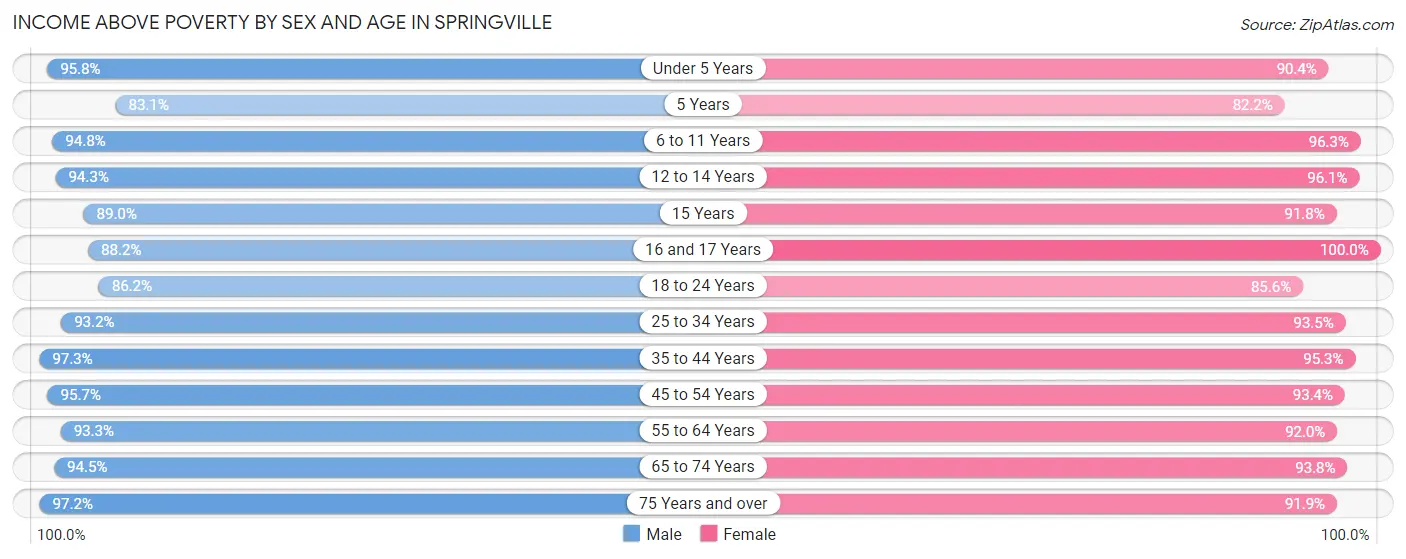
Income Above Poverty by Sex and Age in Springville
According to the poverty statistics in Springville, males aged 35 to 44 years and females aged 16 and 17 years are the age groups that are most secure financially, with 97.3% of males and 100.0% of females in these age groups living above the poverty line.
| Age Bracket | Male | Female |
| Under 5 Years | 1,666 (95.8%) | 1,633 (90.4%) |
| 5 Years | 458 (83.1%) | 277 (82.2%) |
| 6 to 11 Years | 2,145 (94.8%) | 2,050 (96.3%) |
| 12 to 14 Years | 904 (94.3%) | 925 (96.1%) |
| 15 Years | 398 (89.0%) | 281 (91.8%) |
| 16 and 17 Years | 606 (88.2%) | 404 (100.0%) |
| 18 to 24 Years | 1,502 (86.2%) | 1,641 (85.6%) |
| 25 to 34 Years | 2,755 (93.2%) | 2,641 (93.5%) |
| 35 to 44 Years | 2,083 (97.3%) | 2,071 (95.3%) |
| 45 to 54 Years | 1,477 (95.7%) | 1,437 (93.4%) |
| 55 to 64 Years | 1,154 (93.3%) | 1,143 (91.9%) |
| 65 to 74 Years | 775 (94.5%) | 1,004 (93.8%) |
| 75 Years and over | 486 (97.2%) | 647 (91.9%) |
| Total | 16,409 (93.3%) | 16,154 (92.7%) |
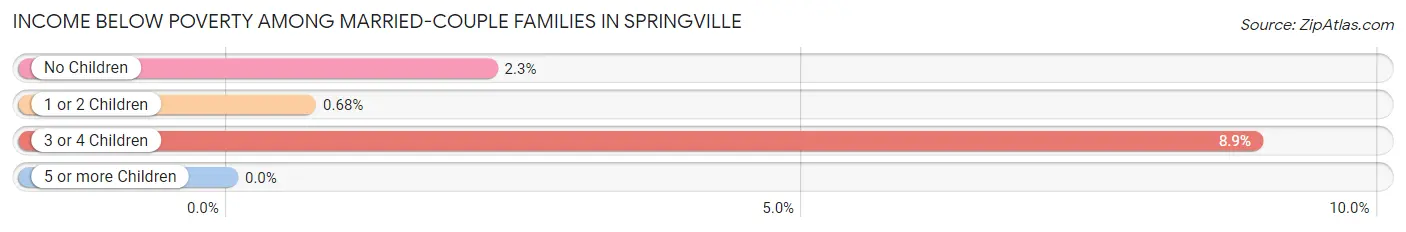
Income Below Poverty Among Married-Couple Families in Springville
The poverty statistics for married-couple families in Springville show that 3.0% or 209 of the total 6,946 families live below the poverty line. Families with 3 or 4 children have the highest poverty rate of 8.9%, comprising of 132 families. On the other hand, families with 5 or more children have the lowest poverty rate of 0.0%, which includes 0 families.
| Children | Above Poverty | Below Poverty |
| No Children | 2,590 (97.7%) | 60 (2.3%) |
| 1 or 2 Children | 2,476 (99.3%) | 17 (0.7%) |
| 3 or 4 Children | 1,348 (91.1%) | 132 (8.9%) |
| 5 or more Children | 323 (100.0%) | 0 (0.0%) |
| Total | 6,737 (97.0%) | 209 (3.0%) |
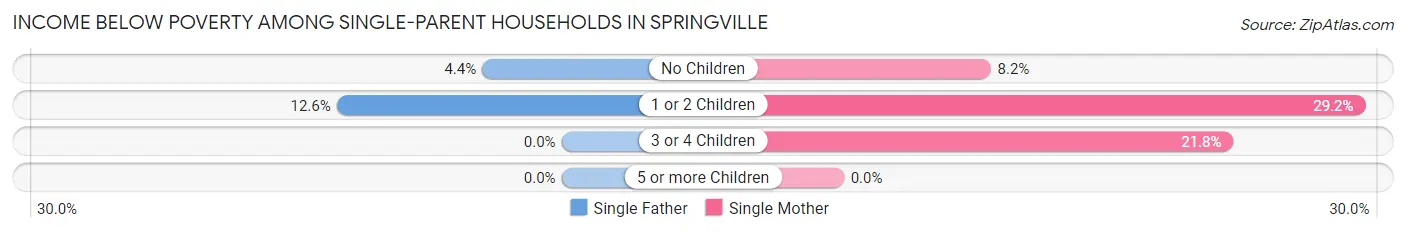
Income Below Poverty Among Single-Parent Households in Springville
According to the poverty data in Springville, 7.2% or 30 single-father households and 20.6% or 172 single-mother households are living below the poverty line. Among single-father households, those with 1 or 2 children have the highest poverty rate, with 22 households (12.6%) experiencing poverty. Likewise, among single-mother households, those with 1 or 2 children have the highest poverty rate, with 123 households (29.1%) falling below the poverty line.
| Children | Single Father | Single Mother |
| No Children | 8 (4.4%) | 22 (8.2%) |
| 1 or 2 Children | 22 (12.6%) | 123 (29.1%) |
| 3 or 4 Children | 0 (0.0%) | 27 (21.8%) |
| 5 or more Children | 0 (0.0%) | 0 (0.0%) |
| Total | 30 (7.2%) | 172 (20.6%) |
Income Below Poverty Among Married-Couple vs Single-Parent Households in Springville
The poverty data for Springville shows that 209 of the married-couple family households (3.0%) and 202 of the single-parent households (16.2%) are living below the poverty level. Within the married-couple family households, those with 3 or 4 children have the highest poverty rate, with 132 households (8.9%) falling below the poverty line. Among the single-parent households, those with 1 or 2 children have the highest poverty rate, with 145 household (24.3%) living below poverty.
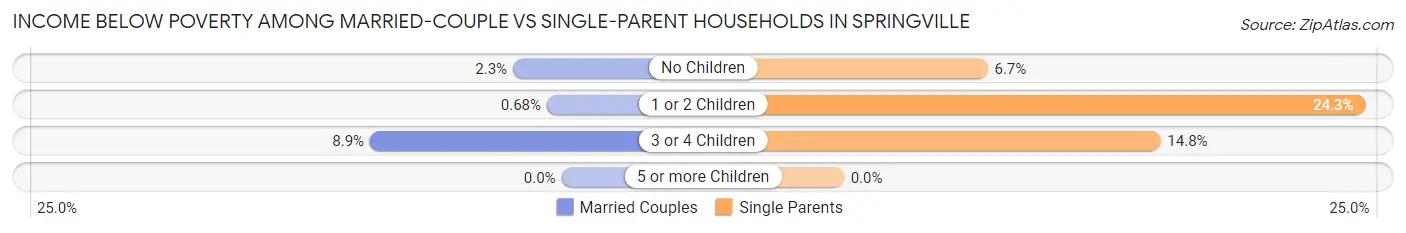
| Children | Married-Couple Families | Single-Parent Households |
| No Children | 60 (2.3%) | 30 (6.7%) |
| 1 or 2 Children | 17 (0.7%) | 145 (24.3%) |
| 3 or 4 Children | 132 (8.9%) | 27 (14.7%) |
| 5 or more Children | 0 (0.0%) | 0 (0.0%) |
| Total | 209 (3.0%) | 202 (16.2%) |
Race in Springville
The most populous races in Springville are White / Caucasian (30,772 | 87.4%), Hispanic or Latino (5,599 | 15.9%), and Two or more Races (1,969 | 5.6%).
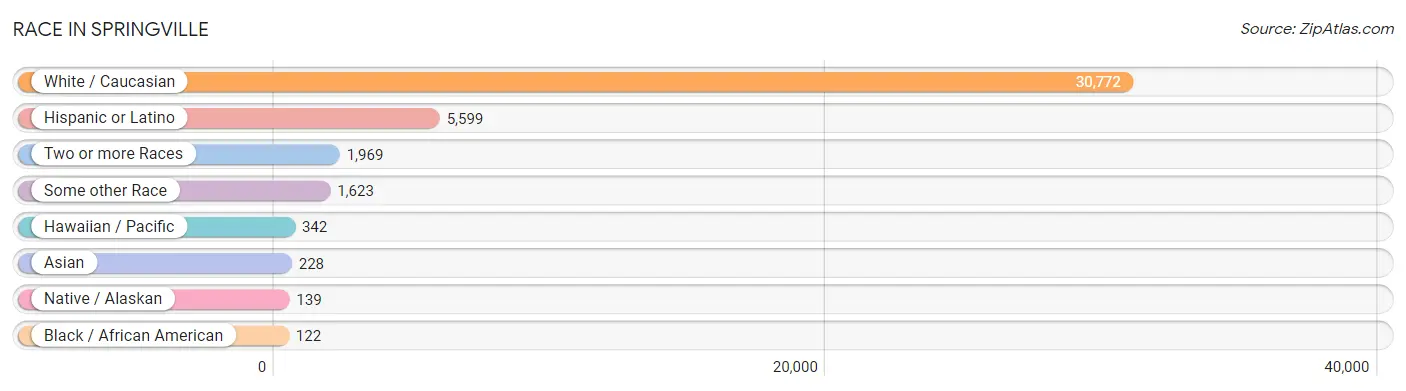
| Race | # Population | % Population |
| Asian | 228 | 0.6% |
| Black / African American | 122 | 0.4% |
| Hawaiian / Pacific | 342 | 1.0% |
| Hispanic or Latino | 5,599 | 15.9% |
| Native / Alaskan | 139 | 0.4% |
| White / Caucasian | 30,772 | 87.4% |
| Two or more Races | 1,969 | 5.6% |
| Some other Race | 1,623 | 4.6% |
| Total | 35,195 | 100.0% |
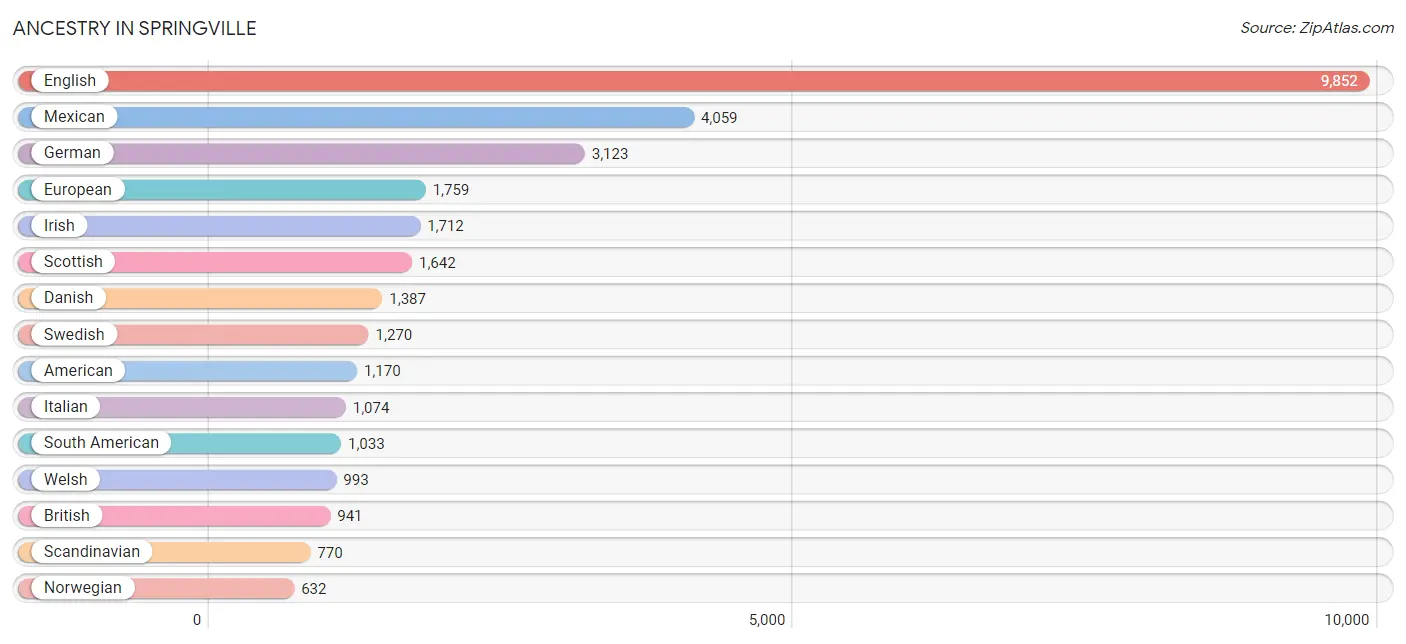
Ancestry in Springville
The most populous ancestries reported in Springville are English (9,852 | 28.0%), Mexican (4,059 | 11.5%), German (3,123 | 8.9%), European (1,759 | 5.0%), and Irish (1,712 | 4.9%), together accounting for 58.3% of all Springville residents.
| Ancestry | # Population | % Population |
| American | 1,170 | 3.3% |
| Apache | 74 | 0.2% |
| Arab | 3 | 0.0% |
| Argentinean | 102 | 0.3% |
| Armenian | 19 | 0.1% |
| Australian | 17 | 0.1% |
| Austrian | 45 | 0.1% |
| Basque | 12 | 0.0% |
| Belgian | 213 | 0.6% |
| Bermudan | 15 | 0.0% |
| Bhutanese | 165 | 0.5% |
| Bolivian | 298 | 0.9% |
| Brazilian | 46 | 0.1% |
| British | 941 | 2.7% |
| Bulgarian | 3 | 0.0% |
| Burmese | 24 | 0.1% |
| Canadian | 80 | 0.2% |
| Celtic | 13 | 0.0% |
| Central American | 226 | 0.6% |
| Cherokee | 12 | 0.0% |
| Chilean | 18 | 0.1% |
| Colombian | 153 | 0.4% |
| Costa Rican | 6 | 0.0% |
| Croatian | 25 | 0.1% |
| Cuban | 20 | 0.1% |
| Czech | 179 | 0.5% |
| Czechoslovakian | 18 | 0.1% |
| Danish | 1,387 | 3.9% |
| Dutch | 533 | 1.5% |
| Ecuadorian | 149 | 0.4% |
| English | 9,852 | 28.0% |
| European | 1,759 | 5.0% |
| Filipino | 7 | 0.0% |
| Finnish | 85 | 0.2% |
| French | 512 | 1.5% |
| French Canadian | 71 | 0.2% |
| German | 3,123 | 8.9% |
| Greek | 77 | 0.2% |
| Guamanian / Chamorro | 6 | 0.0% |
| Guatemalan | 29 | 0.1% |
| Hungarian | 35 | 0.1% |
| Icelander | 109 | 0.3% |
| Indian (Asian) | 260 | 0.7% |
| Irish | 1,712 | 4.9% |
| Iroquois | 13 | 0.0% |
| Italian | 1,074 | 3.0% |
| Korean | 100 | 0.3% |
| Lithuanian | 35 | 0.1% |
| Malaysian | 1 | 0.0% |
| Mexican | 4,059 | 11.5% |
| Mexican American Indian | 34 | 0.1% |
| Native Hawaiian | 270 | 0.8% |
| Navajo | 126 | 0.4% |
| Northern European | 109 | 0.3% |
| Norwegian | 632 | 1.8% |
| Pakistani | 5 | 0.0% |
| Panamanian | 7 | 0.0% |
| Peruvian | 134 | 0.4% |
| Polish | 218 | 0.6% |
| Portuguese | 36 | 0.1% |
| Pueblo | 4 | 0.0% |
| Puerto Rican | 164 | 0.5% |
| Russian | 128 | 0.4% |
| Salvadoran | 184 | 0.5% |
| Samoan | 63 | 0.2% |
| Scandinavian | 770 | 2.2% |
| Scotch-Irish | 630 | 1.8% |
| Scottish | 1,642 | 4.7% |
| Slovak | 16 | 0.1% |
| South African | 31 | 0.1% |
| South American | 1,033 | 2.9% |
| South American Indian | 26 | 0.1% |
| Spaniard | 27 | 0.1% |
| Spanish | 20 | 0.1% |
| Sri Lankan | 10 | 0.0% |
| Subsaharan African | 44 | 0.1% |
| Swedish | 1,270 | 3.6% |
| Swiss | 508 | 1.4% |
| Thai | 28 | 0.1% |
| Tongan | 168 | 0.5% |
| Ukrainian | 36 | 0.1% |
| Venezuelan | 179 | 0.5% |
| Welsh | 993 | 2.8% |
| Yugoslavian | 16 | 0.1% | View All 84 Rows |
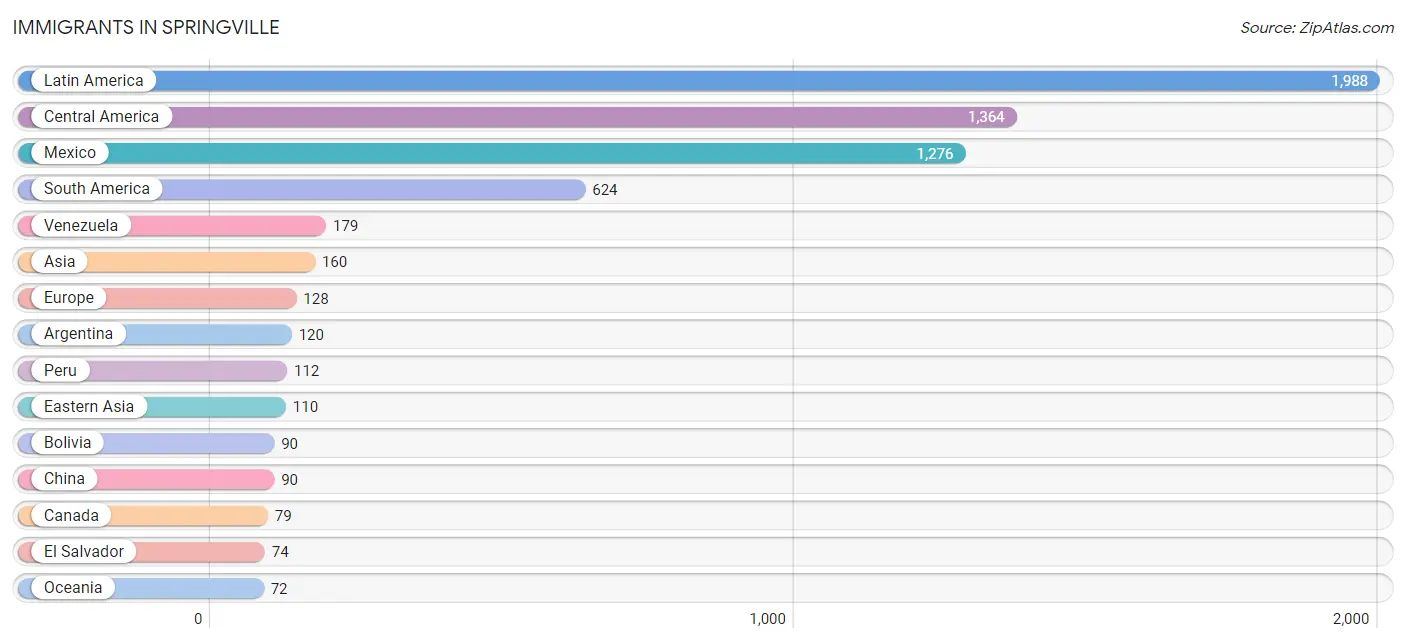
Immigrants in Springville
The most numerous immigrant groups reported in Springville came from Latin America (1,988 | 5.7%), Central America (1,364 | 3.9%), Mexico (1,276 | 3.6%), South America (624 | 1.8%), and Venezuela (179 | 0.5%), together accounting for 15.4% of all Springville residents.
| Immigration Origin | # Population | % Population |
| Africa | 14 | 0.0% |
| Argentina | 120 | 0.3% |
| Asia | 160 | 0.4% |
| Belgium | 20 | 0.1% |
| Bolivia | 90 | 0.3% |
| Brazil | 39 | 0.1% |
| Canada | 79 | 0.2% |
| Central America | 1,364 | 3.9% |
| Chile | 11 | 0.0% |
| China | 90 | 0.3% |
| Colombia | 38 | 0.1% |
| Costa Rica | 6 | 0.0% |
| Czechoslovakia | 9 | 0.0% |
| Eastern Asia | 110 | 0.3% |
| Eastern Europe | 22 | 0.1% |
| Ecuador | 35 | 0.1% |
| El Salvador | 74 | 0.2% |
| England | 27 | 0.1% |
| Europe | 128 | 0.4% |
| Guatemala | 8 | 0.0% |
| Hong Kong | 7 | 0.0% |
| Japan | 11 | 0.0% |
| Korea | 9 | 0.0% |
| Latin America | 1,988 | 5.7% |
| Mexico | 1,276 | 3.6% |
| Moldova | 6 | 0.0% |
| Netherlands | 12 | 0.0% |
| Northern Europe | 60 | 0.2% |
| Oceania | 72 | 0.2% |
| Peru | 112 | 0.3% |
| Philippines | 21 | 0.1% |
| Poland | 7 | 0.0% |
| Scotland | 19 | 0.1% |
| Singapore | 24 | 0.1% |
| South Africa | 14 | 0.0% |
| South America | 624 | 1.8% |
| South Eastern Asia | 50 | 0.1% |
| Southern Europe | 6 | 0.0% |
| Spain | 6 | 0.0% |
| Sweden | 7 | 0.0% |
| Switzerland | 8 | 0.0% |
| Taiwan | 7 | 0.0% |
| Thailand | 5 | 0.0% |
| Venezuela | 179 | 0.5% |
| Western Europe | 40 | 0.1% | View All 45 Rows |
Sex and Age in Springville
Sex and Age in Springville
The most populous age groups in Springville are 5 to 9 Years (2,112 | 12.0%) for men and Under 5 Years (1,807 | 10.3%) for women.
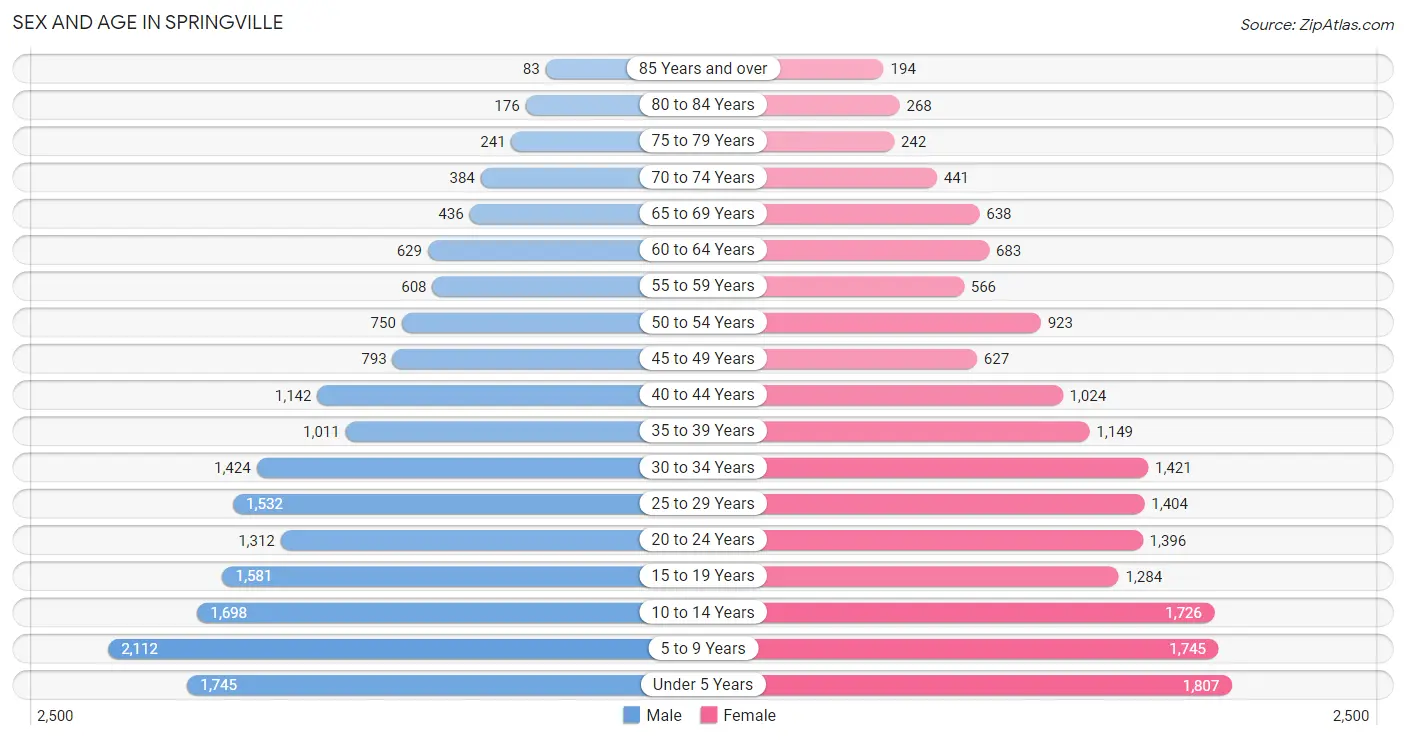
| Age Bracket | Male | Female |
| Under 5 Years | 1,745 (9.9%) | 1,807 (10.3%) |
| 5 to 9 Years | 2,112 (12.0%) | 1,745 (10.0%) |
| 10 to 14 Years | 1,698 (9.6%) | 1,726 (9.8%) |
| 15 to 19 Years | 1,581 (8.9%) | 1,284 (7.3%) |
| 20 to 24 Years | 1,312 (7.4%) | 1,396 (8.0%) |
| 25 to 29 Years | 1,532 (8.7%) | 1,404 (8.0%) |
| 30 to 34 Years | 1,424 (8.1%) | 1,421 (8.1%) |
| 35 to 39 Years | 1,011 (5.7%) | 1,149 (6.6%) |
| 40 to 44 Years | 1,142 (6.5%) | 1,024 (5.8%) |
| 45 to 49 Years | 793 (4.5%) | 627 (3.6%) |
| 50 to 54 Years | 750 (4.3%) | 923 (5.3%) |
| 55 to 59 Years | 608 (3.4%) | 566 (3.2%) |
| 60 to 64 Years | 629 (3.6%) | 683 (3.9%) |
| 65 to 69 Years | 436 (2.5%) | 638 (3.6%) |
| 70 to 74 Years | 384 (2.2%) | 441 (2.5%) |
| 75 to 79 Years | 241 (1.4%) | 242 (1.4%) |
| 80 to 84 Years | 176 (1.0%) | 268 (1.5%) |
| 85 Years and over | 83 (0.5%) | 194 (1.1%) |
| Total | 17,657 (100.0%) | 17,538 (100.0%) |
Families and Households in Springville
Median Family Size in Springville
The median family size in Springville is 3.89 persons per family, with married-couple families (6,946 | 84.8%) accounting for the largest median family size of 3.96 persons per family. On the other hand, single male/father families (414 | 5.1%) represent the smallest median family size with 3.03 persons per family.
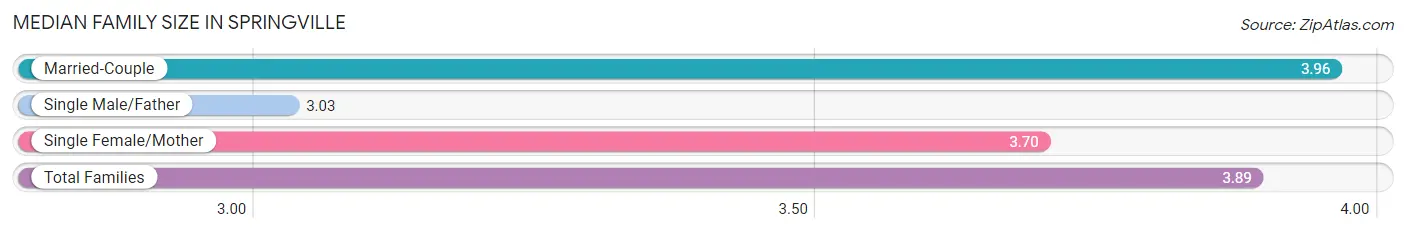
| Family Type | # Families | Family Size |
| Married-Couple | 6,946 (84.8%) | 3.96 |
| Single Male/Father | 414 (5.1%) | 3.03 |
| Single Female/Mother | 833 (10.2%) | 3.70 |
| Total Families | 8,193 (100.0%) | 3.89 |
Median Household Size in Springville
The median household size in Springville is 3.42 persons per household, with married-couple households (6,946 | 67.7%) accounting for the largest median household size of 3.99 persons per household. non-family households (2,065 | 20.1%) represent the smallest median household size with 1.26 persons per household.
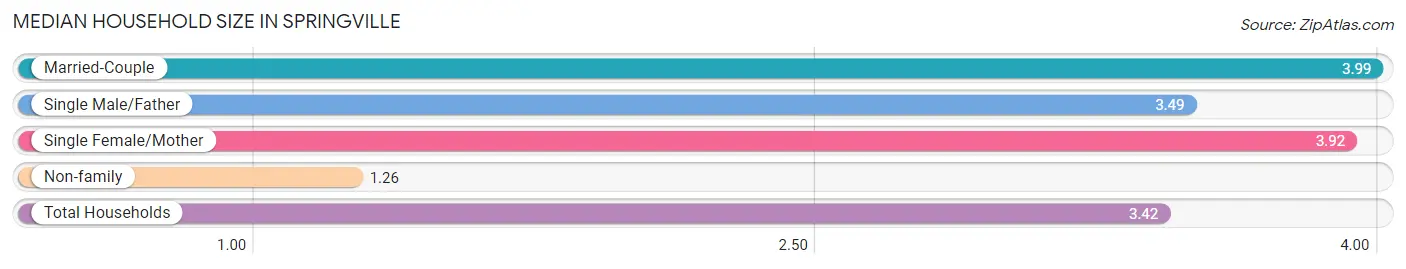
| Household Type | # Households | Household Size |
| Married-Couple | 6,946 (67.7%) | 3.99 |
| Single Male/Father | 414 (4.0%) | 3.49 |
| Single Female/Mother | 833 (8.1%) | 3.92 |
| Non-family | 2,065 (20.1%) | 1.26 |
| Total Households | 10,258 (100.0%) | 3.42 |
Household Size by Marriage Status in Springville
Out of a total of 10,258 households in Springville, 8,193 (79.9%) are family households, while 2,065 (20.1%) are nonfamily households. The most numerous type of family households are 2-person households, comprising 2,287, and the most common type of nonfamily households are 1-person households, comprising 1,737.
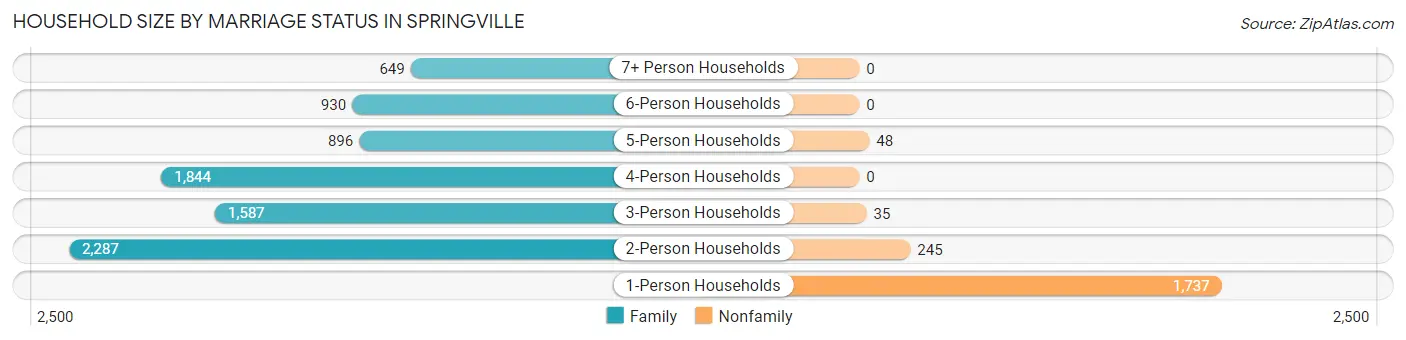
| Household Size | Family Households | Nonfamily Households |
| 1-Person Households | - | 1,737 (16.9%) |
| 2-Person Households | 2,287 (22.3%) | 245 (2.4%) |
| 3-Person Households | 1,587 (15.5%) | 35 (0.3%) |
| 4-Person Households | 1,844 (18.0%) | 0 (0.0%) |
| 5-Person Households | 896 (8.7%) | 48 (0.5%) |
| 6-Person Households | 930 (9.1%) | 0 (0.0%) |
| 7+ Person Households | 649 (6.3%) | 0 (0.0%) |
| Total | 8,193 (79.9%) | 2,065 (20.1%) |
Female Fertility in Springville
Fertility by Age in Springville
Average fertility rate in Springville is 92.0 births per 1,000 women. Women in the age bracket of 20 to 34 years have the highest fertility rate with 159.0 births per 1,000 women. Women in the age bracket of 20 to 34 years acount for 85.3% of all women with births.
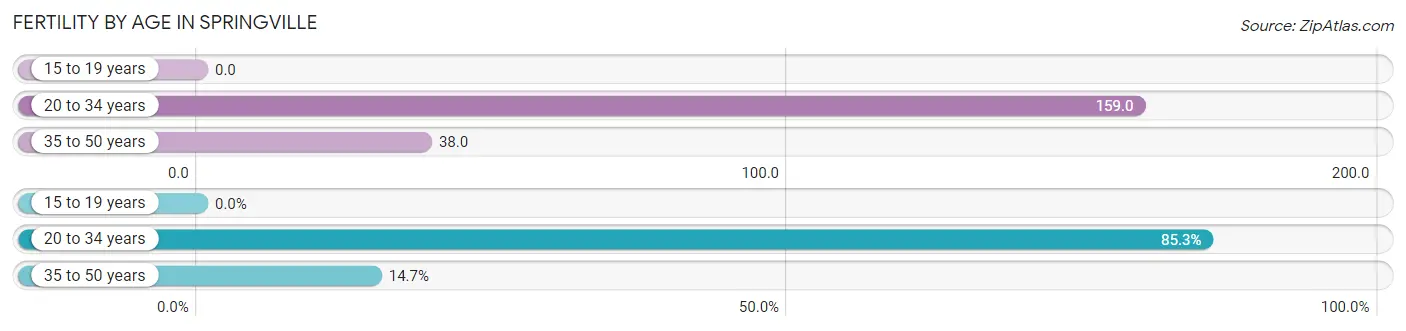
| Age Bracket | Women with Births | Births / 1,000 Women |
| 15 to 19 years | 0 (0.0%) | 0.0 |
| 20 to 34 years | 671 (85.3%) | 159.0 |
| 35 to 50 years | 116 (14.7%) | 38.0 |
| Total | 787 (100.0%) | 92.0 |
Fertility by Age by Marriage Status in Springville
98.1% of women with births (787) in Springville are married. The highest percentage of unmarried women with births falls into 20 to 34 years age bracket with 2.2% of them unmarried at the time of birth, while the lowest percentage of unmarried women with births belong to 35 to 50 years age bracket with 0.0% of them unmarried.
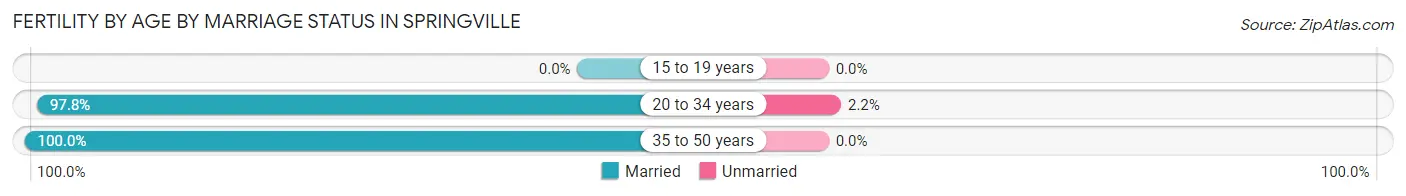
| Age Bracket | Married | Unmarried |
| 15 to 19 years | 0 (0.0%) | 0 (0.0%) |
| 20 to 34 years | 656 (97.8%) | 15 (2.2%) |
| 35 to 50 years | 116 (100.0%) | 0 (0.0%) |
| Total | 772 (98.1%) | 15 (1.9%) |
Fertility by Education in Springville
Average fertility rate in Springville is 92.0 births per 1,000 women. Women with the education attainment of graduate degree have the highest fertility rate of 201.0 births per 1,000 women, while women with the education attainment of less than high school have the lowest fertility at 13.0 births per 1,000 women. Women with the education attainment of bachelor's degree represent 45.9% of all women with births.
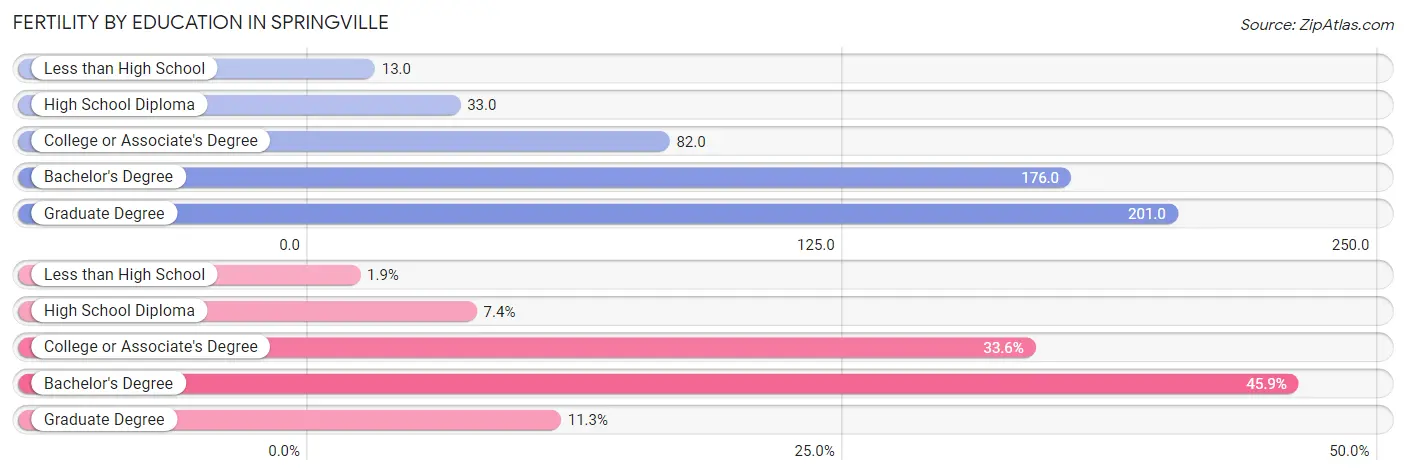
| Educational Attainment | Women with Births | Births / 1,000 Women |
| Less than High School | 15 (1.9%) | 13.0 |
| High School Diploma | 58 (7.4%) | 33.0 |
| College or Associate's Degree | 264 (33.6%) | 82.0 |
| Bachelor's Degree | 361 (45.9%) | 176.0 |
| Graduate Degree | 89 (11.3%) | 201.0 |
| Total | 787 (100.0%) | 92.0 |
Fertility by Education by Marriage Status in Springville
1.9% of women with births in Springville are unmarried. Women with the educational attainment of less than high school are most likely to be married with 100.0% of them married at childbirth, while women with the educational attainment of college or associate's degree are least likely to be married with 5.7% of them unmarried at childbirth.
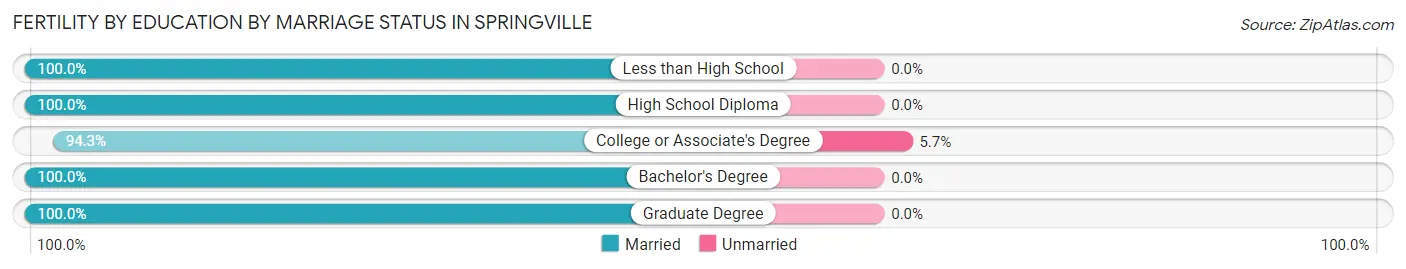
| Educational Attainment | Married | Unmarried |
| Less than High School | 15 (100.0%) | 0 (0.0%) |
| High School Diploma | 58 (100.0%) | 0 (0.0%) |
| College or Associate's Degree | 249 (94.3%) | 15 (5.7%) |
| Bachelor's Degree | 361 (100.0%) | 0 (0.0%) |
| Graduate Degree | 89 (100.0%) | 0 (0.0%) |
| Total | 772 (98.1%) | 15 (1.9%) |
Employment Characteristics in Springville
Employment by Class of Employer in Springville
Among the 15,817 employed individuals in Springville, private company employees (10,993 | 69.5%), not-for-profit organizations (1,380 | 8.7%), and local government employees (923 | 5.8%) make up the most common classes of employment.
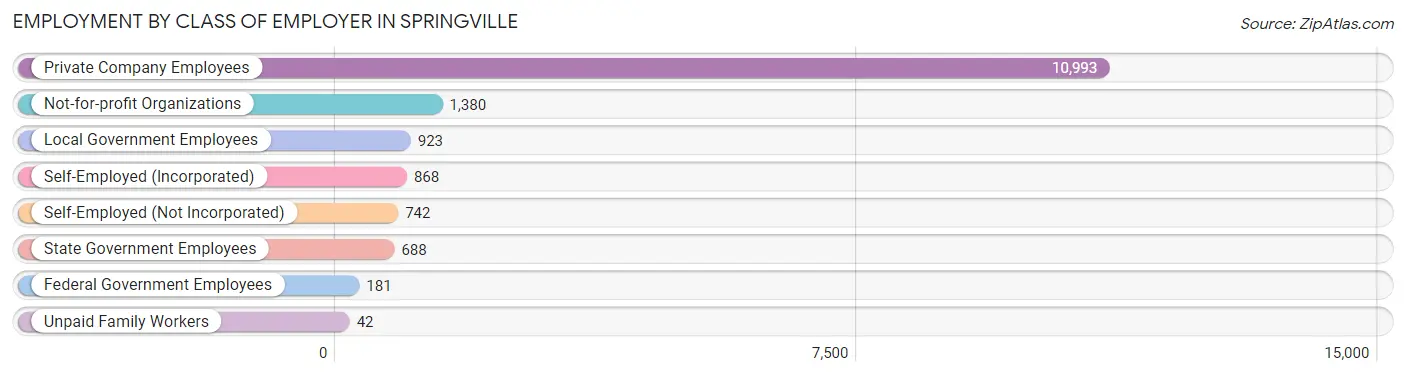
| Employer Class | # Employees | % Employees |
| Private Company Employees | 10,993 | 69.5% |
| Self-Employed (Incorporated) | 868 | 5.5% |
| Self-Employed (Not Incorporated) | 742 | 4.7% |
| Not-for-profit Organizations | 1,380 | 8.7% |
| Local Government Employees | 923 | 5.8% |
| State Government Employees | 688 | 4.3% |
| Federal Government Employees | 181 | 1.1% |
| Unpaid Family Workers | 42 | 0.3% |
| Total | 15,817 | 100.0% |
Employment Status by Age in Springville
According to the labor force statistics for Springville, out of the total population over 16 years of age (23,588), 69.8% or 16,464 individuals are in the labor force, with 2.7% or 445 of them unemployed. The age group with the highest labor force participation rate is 20 to 24 years, with 86.6% or 2,345 individuals in the labor force. Within the labor force, the 16 to 19 years age range has the highest percentage of unemployed individuals, with 6.0% or 66 of them being unemployed.
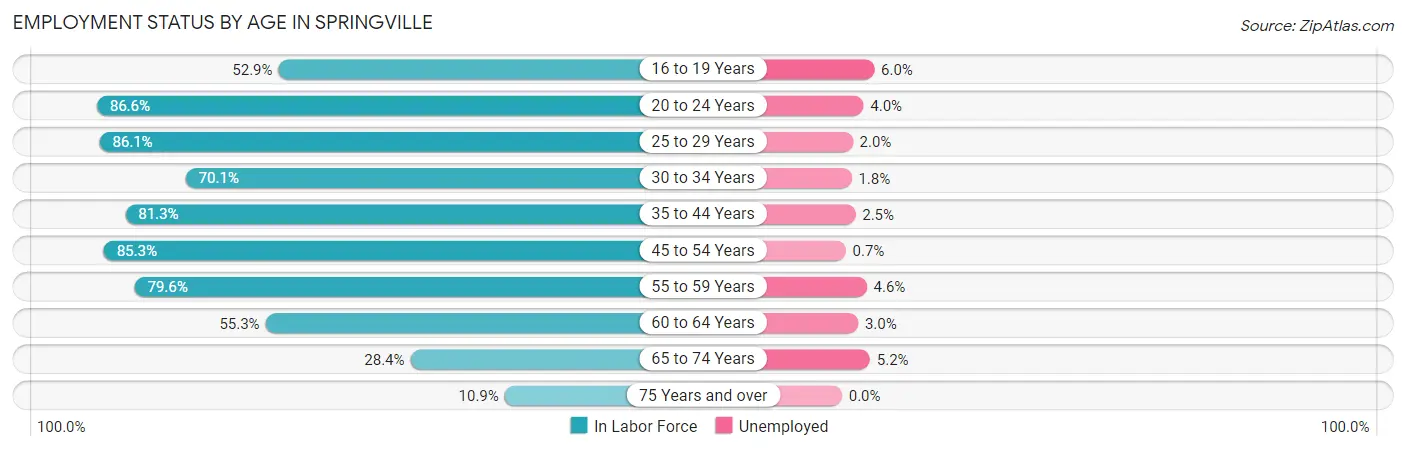
| Age Bracket | In Labor Force | Unemployed |
| 16 to 19 Years | 1,106 (52.9%) | 66 (6.0%) |
| 20 to 24 Years | 2,345 (86.6%) | 94 (4.0%) |
| 25 to 29 Years | 2,528 (86.1%) | 51 (2.0%) |
| 30 to 34 Years | 1,994 (70.1%) | 36 (1.8%) |
| 35 to 44 Years | 3,517 (81.3%) | 88 (2.5%) |
| 45 to 54 Years | 2,638 (85.3%) | 18 (0.7%) |
| 55 to 59 Years | 935 (79.6%) | 43 (4.6%) |
| 60 to 64 Years | 726 (55.3%) | 22 (3.0%) |
| 65 to 74 Years | 539 (28.4%) | 28 (5.2%) |
| 75 Years and over | 131 (10.9%) | 0 (0.0%) |
| Total | 16,464 (69.8%) | 445 (2.7%) |
Employment Status by Educational Attainment in Springville
According to labor force statistics for Springville, 78.6% of individuals (12,329) out of the total population between 25 and 64 years of age (15,686) are in the labor force, with 2.1% or 259 of them being unemployed. The group with the highest labor force participation rate are those with the educational attainment of bachelor's degree or higher, with 80.8% or 5,004 individuals in the labor force. Within the labor force, individuals with less than high school education have the highest percentage of unemployment, with 7.1% or 38 of them being unemployed.
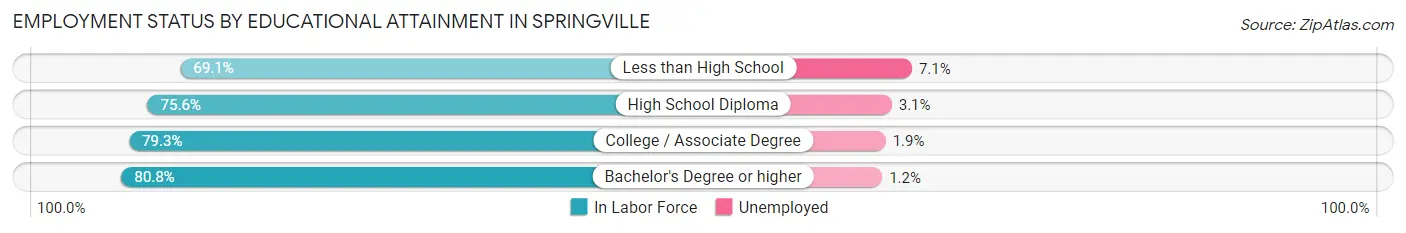
| Educational Attainment | In Labor Force | Unemployed |
| Less than High School | 535 (69.1%) | 55 (7.1%) |
| High School Diploma | 2,414 (75.6%) | 99 (3.1%) |
| College / Associate Degree | 4,382 (79.3%) | 105 (1.9%) |
| Bachelor's Degree or higher | 5,004 (80.8%) | 74 (1.2%) |
| Total | 12,329 (78.6%) | 329 (2.1%) |
Employment Occupations by Sex in Springville
Management, Business, Science and Arts Occupations
The most common Management, Business, Science and Arts occupations in Springville are Management (1,968 | 12.3%), Community & Social Service (1,581 | 9.9%), Computers, Engineering & Science (1,243 | 7.8%), Health Diagnosing & Treating (955 | 6.0%), and Education Instruction & Library (935 | 5.8%).
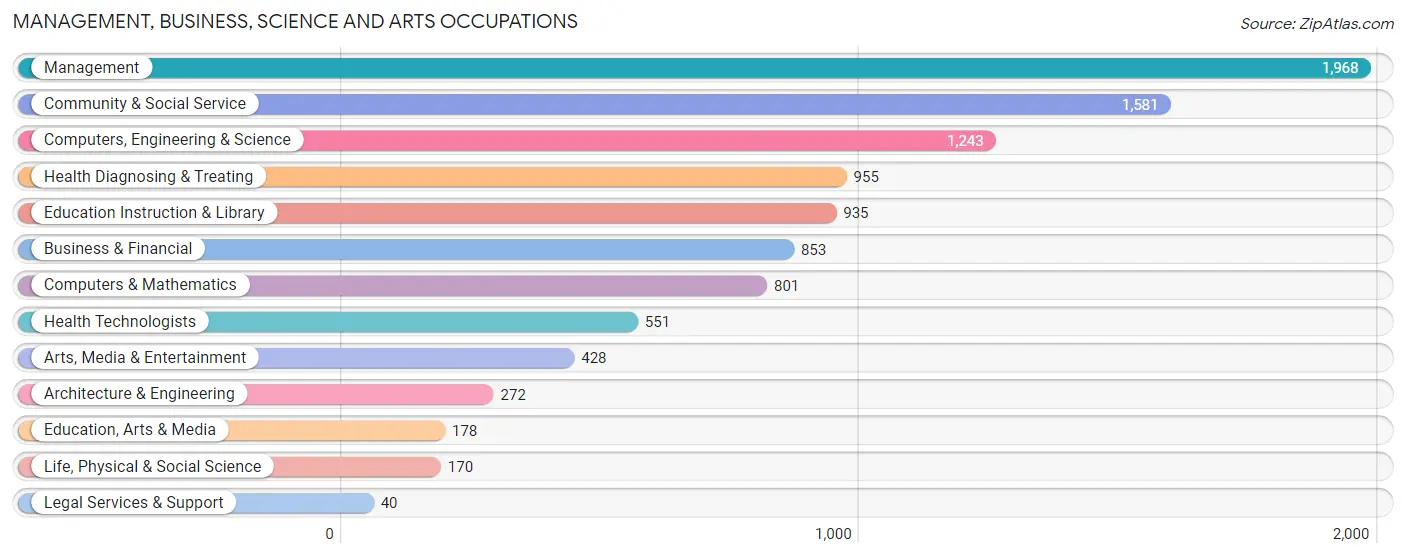
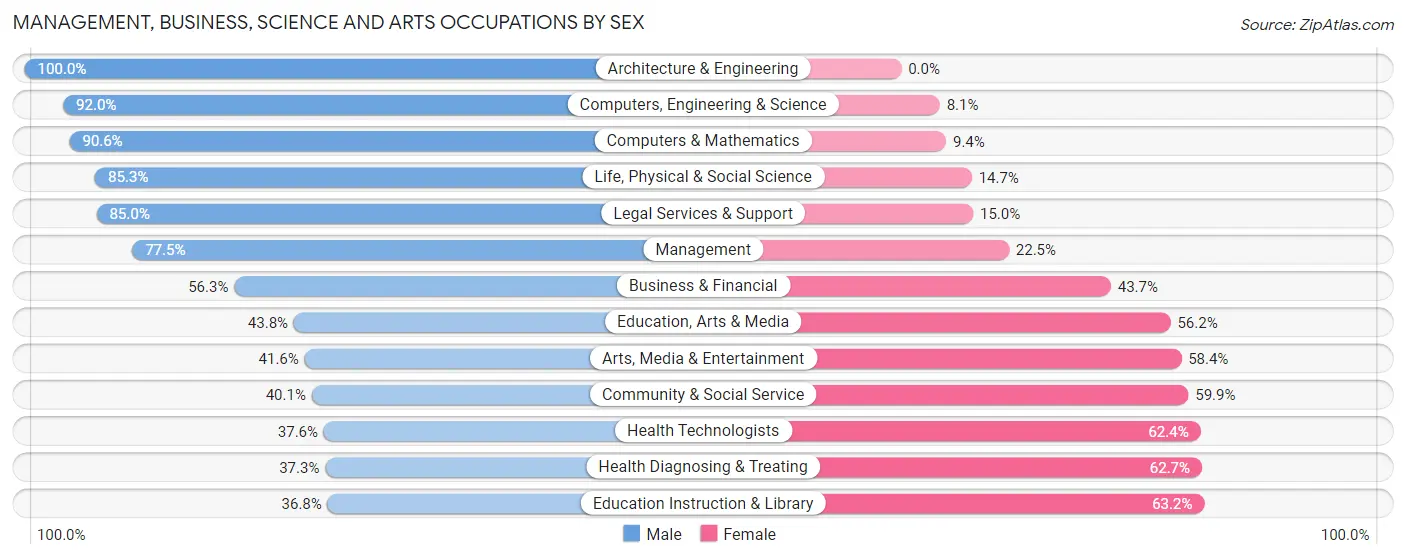
Management, Business, Science and Arts Occupations by Sex
Within the Management, Business, Science and Arts occupations in Springville, the most male-oriented occupations are Architecture & Engineering (100.0%), Computers, Engineering & Science (91.9%), and Computers & Mathematics (90.6%), while the most female-oriented occupations are Education Instruction & Library (63.2%), Health Diagnosing & Treating (62.7%), and Health Technologists (62.4%).
| Occupation | Male | Female |
| Management | 1,526 (77.5%) | 442 (22.5%) |
| Business & Financial | 480 (56.3%) | 373 (43.7%) |
| Computers, Engineering & Science | 1,143 (91.9%) | 100 (8.1%) |
| Computers & Mathematics | 726 (90.6%) | 75 (9.4%) |
| Architecture & Engineering | 272 (100.0%) | 0 (0.0%) |
| Life, Physical & Social Science | 145 (85.3%) | 25 (14.7%) |
| Community & Social Service | 634 (40.1%) | 947 (59.9%) |
| Education, Arts & Media | 78 (43.8%) | 100 (56.2%) |
| Legal Services & Support | 34 (85.0%) | 6 (15.0%) |
| Education Instruction & Library | 344 (36.8%) | 591 (63.2%) |
| Arts, Media & Entertainment | 178 (41.6%) | 250 (58.4%) |
| Health Diagnosing & Treating | 356 (37.3%) | 599 (62.7%) |
| Health Technologists | 207 (37.6%) | 344 (62.4%) |
| Total (Category) | 4,139 (62.7%) | 2,461 (37.3%) |
| Total (Overall) | 9,216 (57.6%) | 6,781 (42.4%) |
Services Occupations
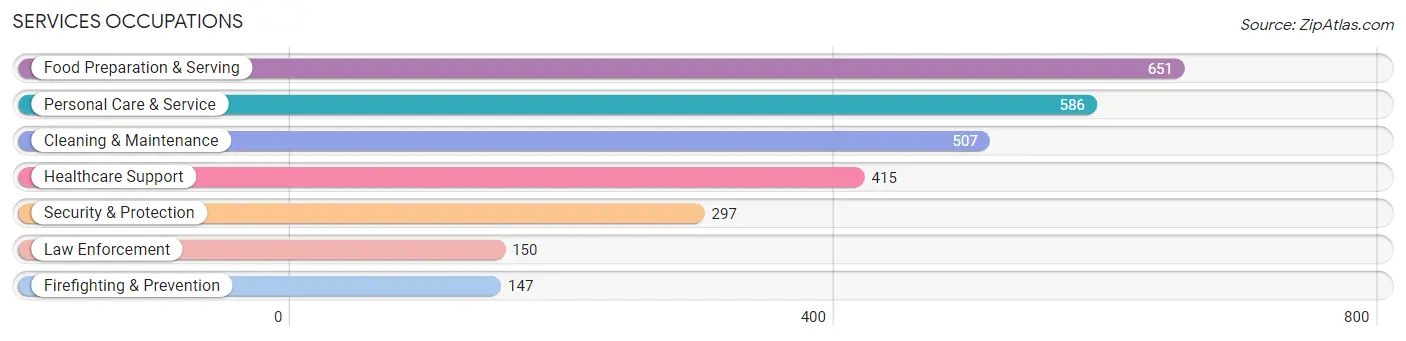
The most common Services occupations in Springville are Food Preparation & Serving (651 | 4.1%), Personal Care & Service (586 | 3.7%), Cleaning & Maintenance (507 | 3.2%), Healthcare Support (415 | 2.6%), and Security & Protection (297 | 1.9%).
Services Occupations by Sex
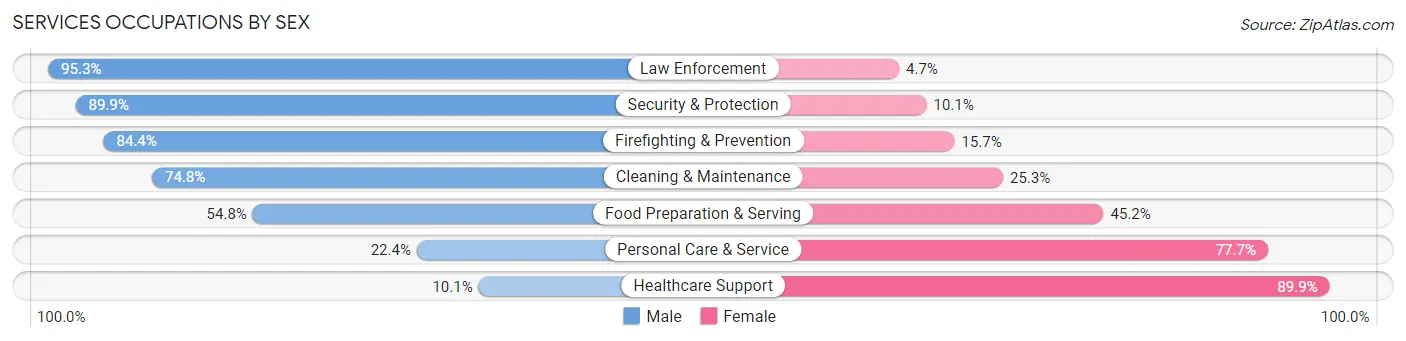
Within the Services occupations in Springville, the most male-oriented occupations are Law Enforcement (95.3%), Security & Protection (89.9%), and Firefighting & Prevention (84.4%), while the most female-oriented occupations are Healthcare Support (89.9%), Personal Care & Service (77.6%), and Food Preparation & Serving (45.2%).
| Occupation | Male | Female |
| Healthcare Support | 42 (10.1%) | 373 (89.9%) |
| Security & Protection | 267 (89.9%) | 30 (10.1%) |
| Firefighting & Prevention | 124 (84.4%) | 23 (15.7%) |
| Law Enforcement | 143 (95.3%) | 7 (4.7%) |
| Food Preparation & Serving | 357 (54.8%) | 294 (45.2%) |
| Cleaning & Maintenance | 379 (74.8%) | 128 (25.3%) |
| Personal Care & Service | 131 (22.4%) | 455 (77.6%) |
| Total (Category) | 1,176 (47.9%) | 1,280 (52.1%) |
| Total (Overall) | 9,216 (57.6%) | 6,781 (42.4%) |
Sales and Office Occupations
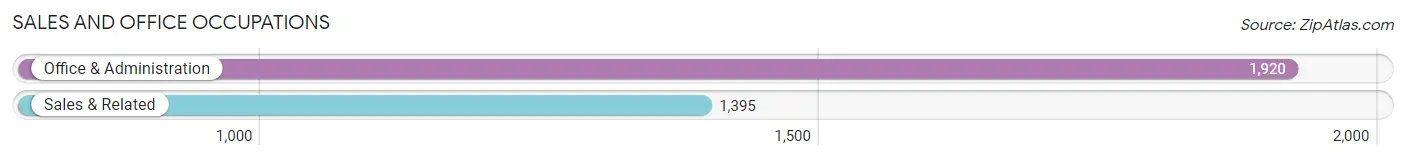
The most common Sales and Office occupations in Springville are Office & Administration (1,920 | 12.0%), and Sales & Related (1,395 | 8.7%).
Sales and Office Occupations by Sex
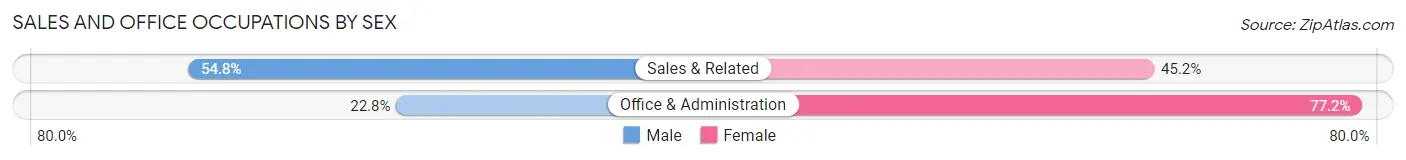
| Occupation | Male | Female |
| Sales & Related | 765 (54.8%) | 630 (45.2%) |
| Office & Administration | 438 (22.8%) | 1,482 (77.2%) |
| Total (Category) | 1,203 (36.3%) | 2,112 (63.7%) |
| Total (Overall) | 9,216 (57.6%) | 6,781 (42.4%) |
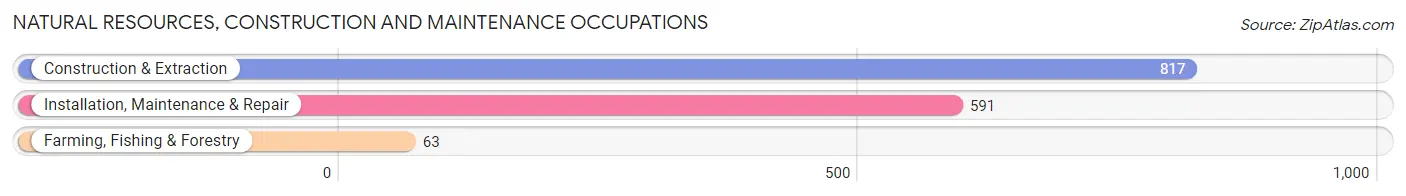
Natural Resources, Construction and Maintenance Occupations
The most common Natural Resources, Construction and Maintenance occupations in Springville are Construction & Extraction (817 | 5.1%), Installation, Maintenance & Repair (591 | 3.7%), and Farming, Fishing & Forestry (63 | 0.4%).
Natural Resources, Construction and Maintenance Occupations by Sex
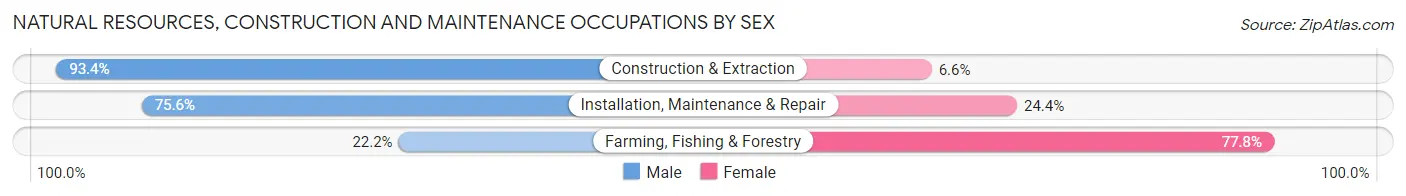
| Occupation | Male | Female |
| Farming, Fishing & Forestry | 14 (22.2%) | 49 (77.8%) |
| Construction & Extraction | 763 (93.4%) | 54 (6.6%) |
| Installation, Maintenance & Repair | 447 (75.6%) | 144 (24.4%) |
| Total (Category) | 1,224 (83.2%) | 247 (16.8%) |
| Total (Overall) | 9,216 (57.6%) | 6,781 (42.4%) |
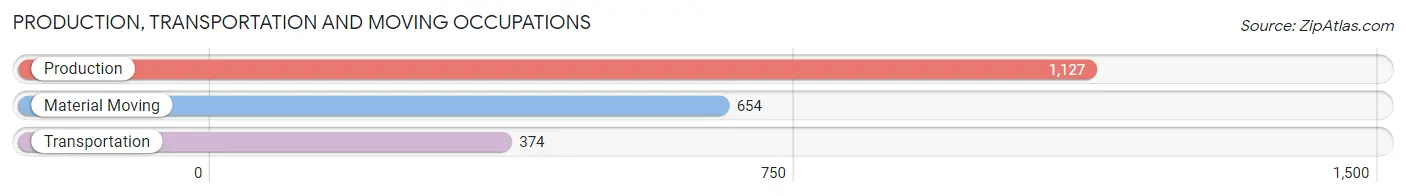
Production, Transportation and Moving Occupations
The most common Production, Transportation and Moving occupations in Springville are Production (1,127 | 7.0%), Material Moving (654 | 4.1%), and Transportation (374 | 2.3%).
Production, Transportation and Moving Occupations by Sex
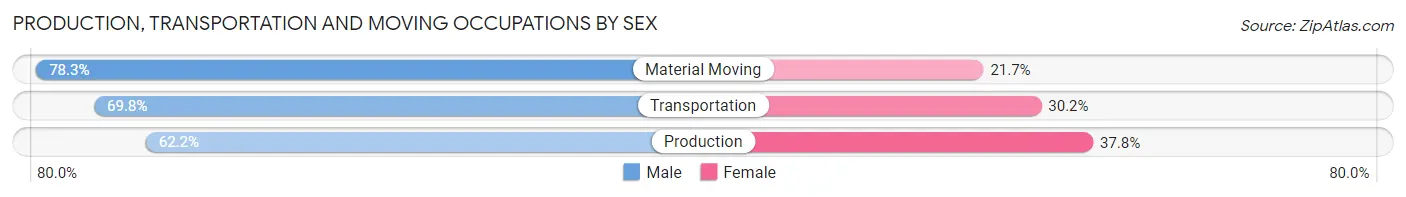
| Occupation | Male | Female |
| Production | 701 (62.2%) | 426 (37.8%) |
| Transportation | 261 (69.8%) | 113 (30.2%) |
| Material Moving | 512 (78.3%) | 142 (21.7%) |
| Total (Category) | 1,474 (68.4%) | 681 (31.6%) |
| Total (Overall) | 9,216 (57.6%) | 6,781 (42.4%) |
Employment Industries by Sex in Springville
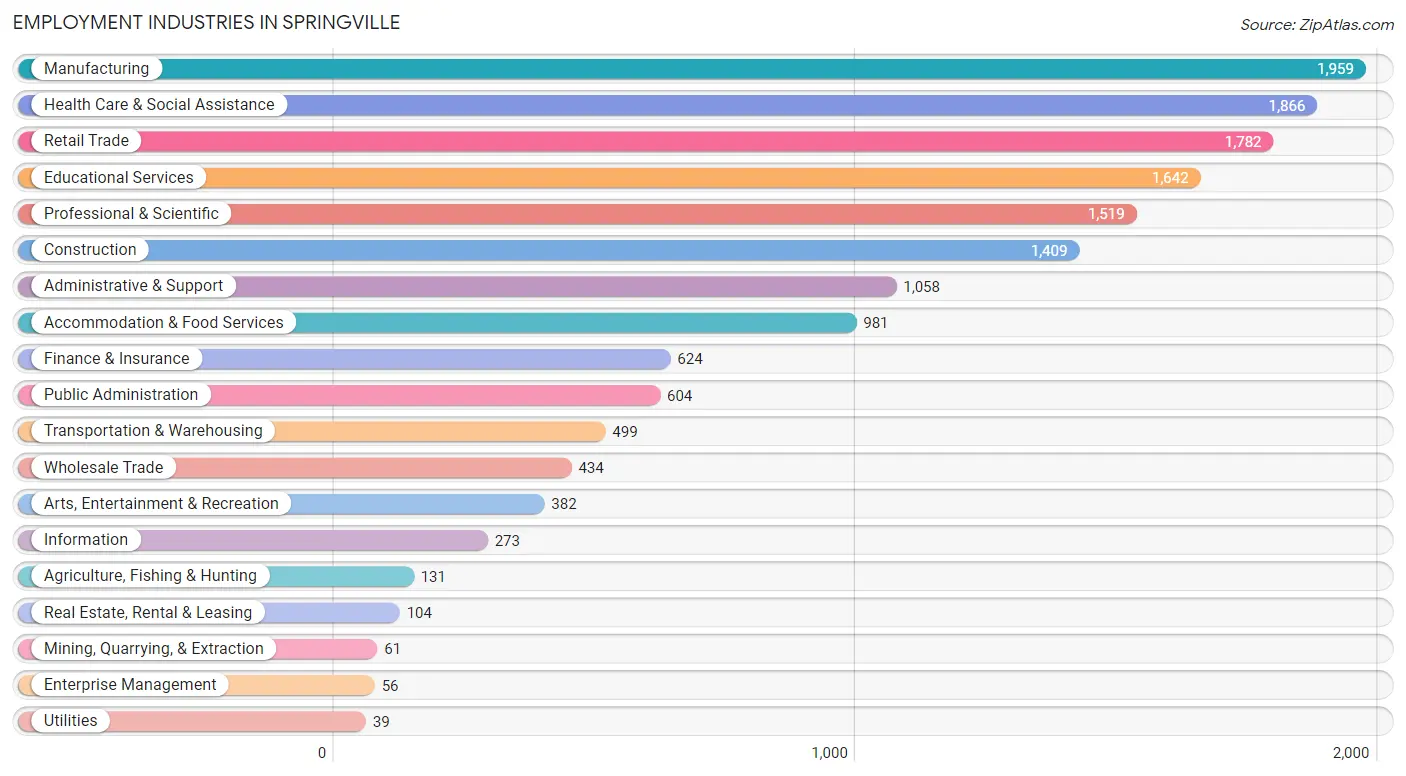
Employment Industries in Springville
The major employment industries in Springville include Manufacturing (1,959 | 12.2%), Health Care & Social Assistance (1,866 | 11.7%), Retail Trade (1,782 | 11.1%), Educational Services (1,642 | 10.3%), and Professional & Scientific (1,519 | 9.5%).
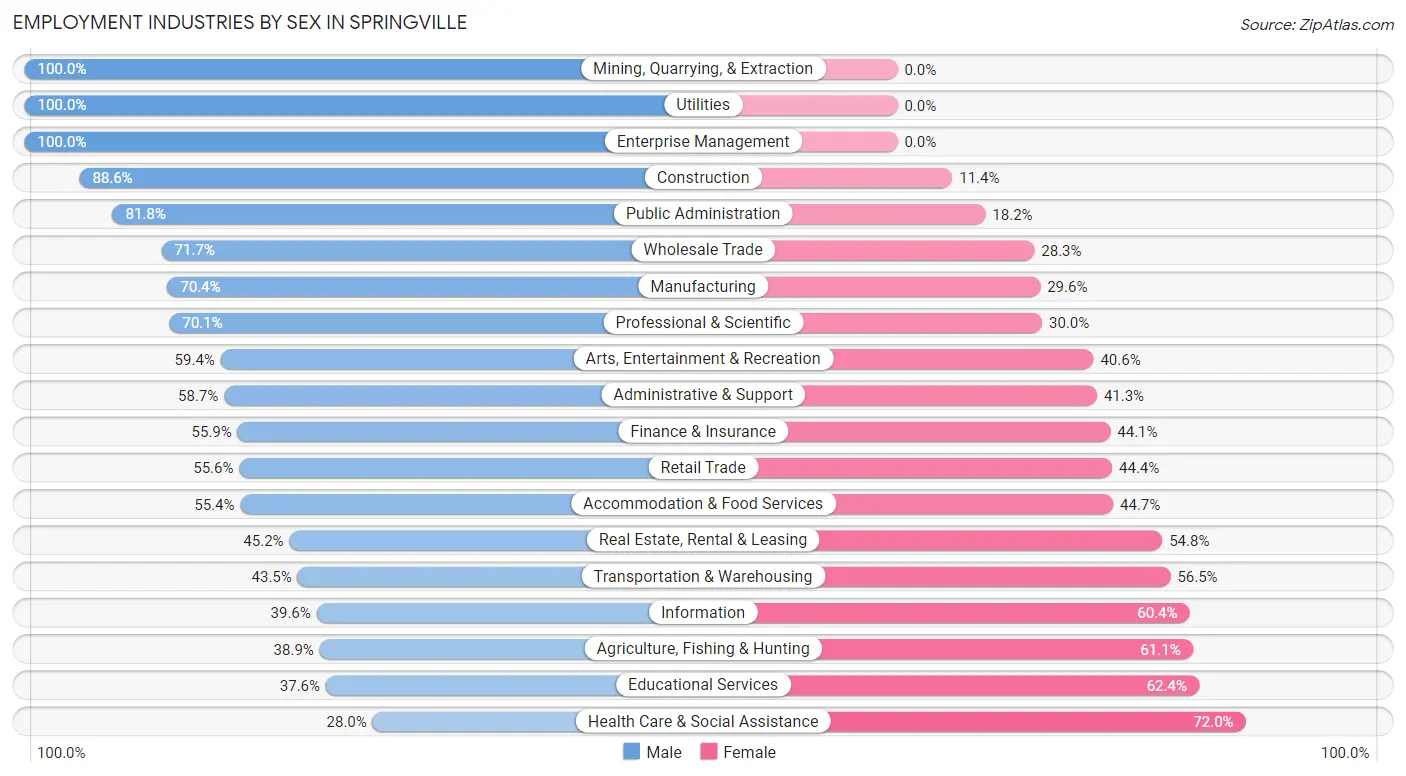
Employment Industries by Sex in Springville
The Springville industries that see more men than women are Mining, Quarrying, & Extraction (100.0%), Utilities (100.0%), and Enterprise Management (100.0%), whereas the industries that tend to have a higher number of women are Health Care & Social Assistance (72.0%), Educational Services (62.4%), and Agriculture, Fishing & Hunting (61.1%).
| Industry | Male | Female |
| Agriculture, Fishing & Hunting | 51 (38.9%) | 80 (61.1%) |
| Mining, Quarrying, & Extraction | 61 (100.0%) | 0 (0.0%) |
| Construction | 1,249 (88.6%) | 160 (11.4%) |
| Manufacturing | 1,380 (70.4%) | 579 (29.6%) |
| Wholesale Trade | 311 (71.7%) | 123 (28.3%) |
| Retail Trade | 990 (55.6%) | 792 (44.4%) |
| Transportation & Warehousing | 217 (43.5%) | 282 (56.5%) |
| Utilities | 39 (100.0%) | 0 (0.0%) |
| Information | 108 (39.6%) | 165 (60.4%) |
| Finance & Insurance | 349 (55.9%) | 275 (44.1%) |
| Real Estate, Rental & Leasing | 47 (45.2%) | 57 (54.8%) |
| Professional & Scientific | 1,064 (70.1%) | 455 (29.9%) |
| Enterprise Management | 56 (100.0%) | 0 (0.0%) |
| Administrative & Support | 621 (58.7%) | 437 (41.3%) |
| Educational Services | 618 (37.6%) | 1,024 (62.4%) |
| Health Care & Social Assistance | 522 (28.0%) | 1,344 (72.0%) |
| Arts, Entertainment & Recreation | 227 (59.4%) | 155 (40.6%) |
| Accommodation & Food Services | 543 (55.3%) | 438 (44.7%) |
| Public Administration | 494 (81.8%) | 110 (18.2%) |
| Total | 9,216 (57.6%) | 6,781 (42.4%) |
Education in Springville
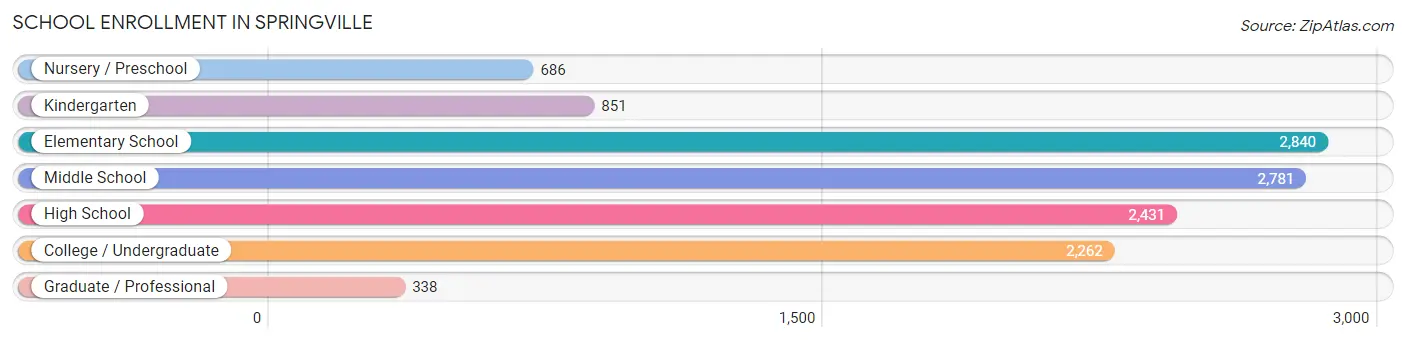
School Enrollment in Springville
The most common levels of schooling among the 12,189 students in Springville are elementary school (2,840 | 23.3%), middle school (2,781 | 22.8%), and high school (2,431 | 19.9%).
| School Level | # Students | % Students |
| Nursery / Preschool | 686 | 5.6% |
| Kindergarten | 851 | 7.0% |
| Elementary School | 2,840 | 23.3% |
| Middle School | 2,781 | 22.8% |
| High School | 2,431 | 19.9% |
| College / Undergraduate | 2,262 | 18.6% |
| Graduate / Professional | 338 | 2.8% |
| Total | 12,189 | 100.0% |
School Enrollment by Age by Funding Source in Springville
Out of a total of 12,189 students who are enrolled in schools in Springville, 1,743 (14.3%) attend a private institution, while the remaining 10,446 (85.7%) are enrolled in public schools. The age group of 20 to 24 year olds has the highest likelihood of being enrolled in private schools, with 537 (46.4% in the age bracket) enrolled. Conversely, the age group of 10 to 14 year olds has the lowest likelihood of being enrolled in a private school, with 3,200 (96.1% in the age bracket) attending a public institution.
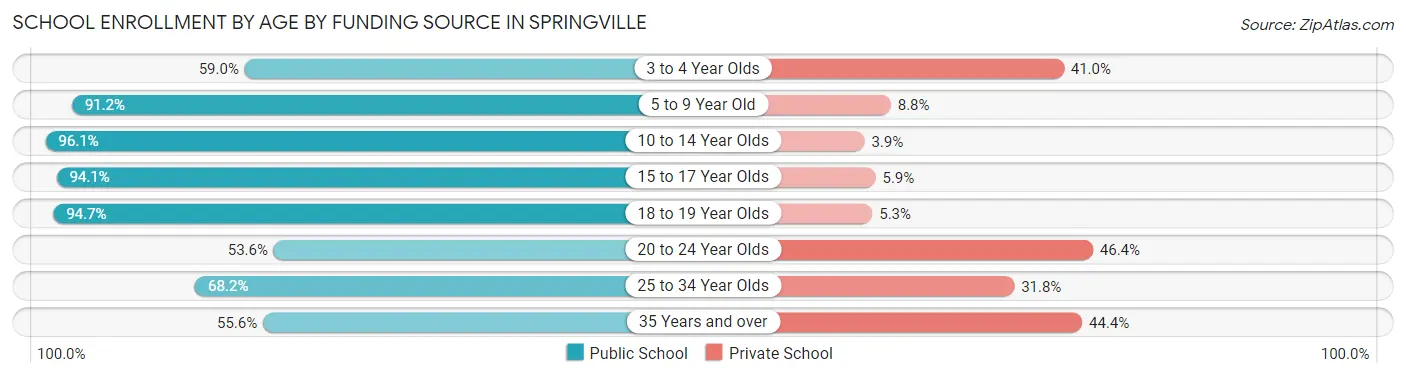
| Age Bracket | Public School | Private School |
| 3 to 4 Year Olds | 236 (59.0%) | 164 (41.0%) |
| 5 to 9 Year Old | 3,326 (91.2%) | 320 (8.8%) |
| 10 to 14 Year Olds | 3,200 (96.1%) | 129 (3.9%) |
| 15 to 17 Year Olds | 1,775 (94.1%) | 112 (5.9%) |
| 18 to 19 Year Olds | 462 (94.7%) | 26 (5.3%) |
| 20 to 24 Year Olds | 620 (53.6%) | 537 (46.4%) |
| 25 to 34 Year Olds | 649 (68.2%) | 302 (31.8%) |
| 35 Years and over | 184 (55.6%) | 147 (44.4%) |
| Total | 10,446 (85.7%) | 1,743 (14.3%) |
Educational Attainment by Field of Study in Springville
Business (1,153 | 14.5%), education (962 | 12.1%), science & technology (890 | 11.2%), arts & humanities (775 | 9.7%), and literature & languages (682 | 8.6%) are the most common fields of study among 7,958 individuals in Springville who have obtained a bachelor's degree or higher.
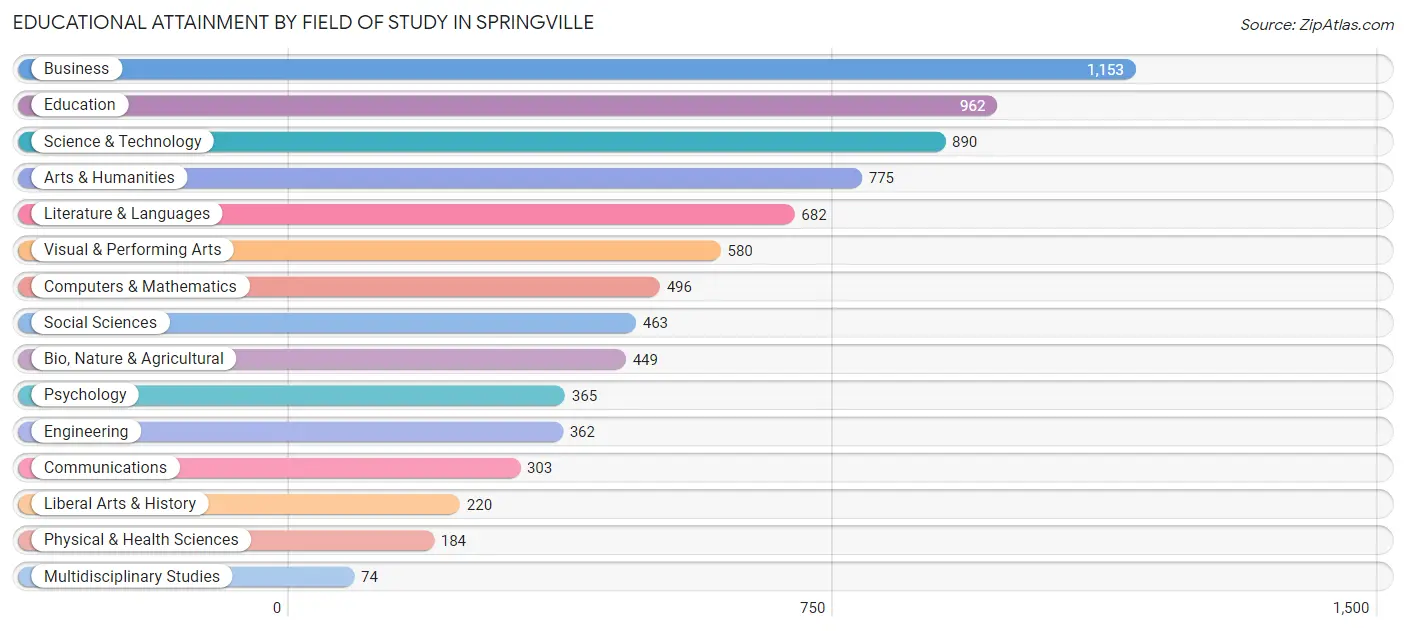
| Field of Study | # Graduates | % Graduates |
| Computers & Mathematics | 496 | 6.2% |
| Bio, Nature & Agricultural | 449 | 5.6% |
| Physical & Health Sciences | 184 | 2.3% |
| Psychology | 365 | 4.6% |
| Social Sciences | 463 | 5.8% |
| Engineering | 362 | 4.5% |
| Multidisciplinary Studies | 74 | 0.9% |
| Science & Technology | 890 | 11.2% |
| Business | 1,153 | 14.5% |
| Education | 962 | 12.1% |
| Literature & Languages | 682 | 8.6% |
| Liberal Arts & History | 220 | 2.8% |
| Visual & Performing Arts | 580 | 7.3% |
| Communications | 303 | 3.8% |
| Arts & Humanities | 775 | 9.7% |
| Total | 7,958 | 100.0% |
Transportation & Commute in Springville
Vehicle Availability by Sex in Springville
The most prevalent vehicle ownership categories in Springville are males with 2 vehicles (3,914, accounting for 42.8%) and females with 2 vehicles (2,848, making up 58.7%).
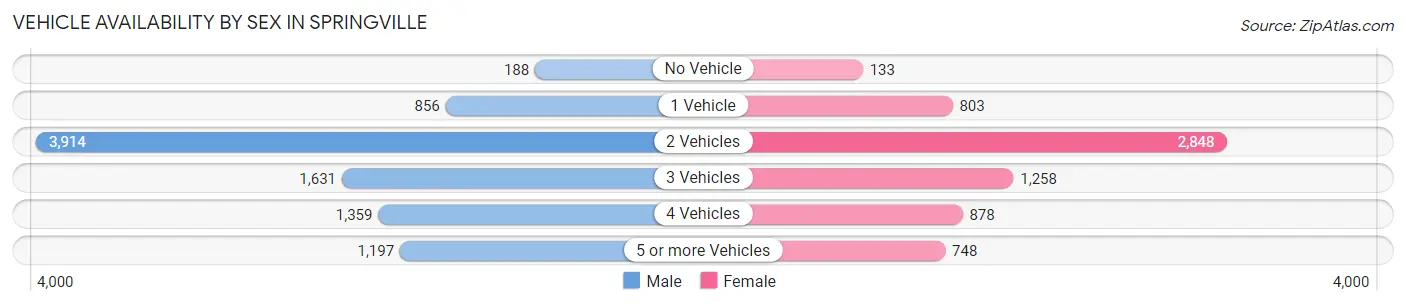
| Vehicles Available | Male | Female |
| No Vehicle | 188 (2.1%) | 133 (2.0%) |
| 1 Vehicle | 856 (9.4%) | 803 (12.0%) |
| 2 Vehicles | 3,914 (42.8%) | 2,848 (42.7%) |
| 3 Vehicles | 1,631 (17.8%) | 1,258 (18.9%) |
| 4 Vehicles | 1,359 (14.9%) | 878 (13.2%) |
| 5 or more Vehicles | 1,197 (13.1%) | 748 (11.2%) |
| Total | 9,145 (100.0%) | 6,668 (100.0%) |
Commute Time in Springville
The most frequently occuring commute durations in Springville are 15 to 19 minutes (2,734 commuters, 20.0%), 20 to 24 minutes (2,376 commuters, 17.4%), and 10 to 14 minutes (2,233 commuters, 16.4%).
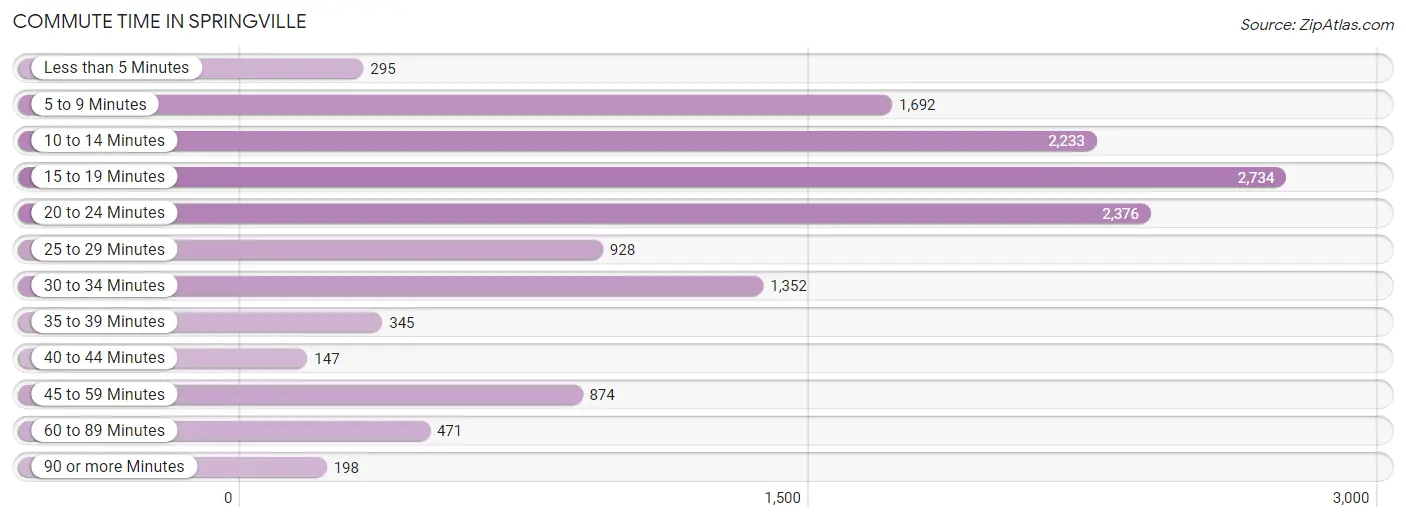
| Commute Time | # Commuters | % Commuters |
| Less than 5 Minutes | 295 | 2.2% |
| 5 to 9 Minutes | 1,692 | 12.4% |
| 10 to 14 Minutes | 2,233 | 16.4% |
| 15 to 19 Minutes | 2,734 | 20.0% |
| 20 to 24 Minutes | 2,376 | 17.4% |
| 25 to 29 Minutes | 928 | 6.8% |
| 30 to 34 Minutes | 1,352 | 9.9% |
| 35 to 39 Minutes | 345 | 2.5% |
| 40 to 44 Minutes | 147 | 1.1% |
| 45 to 59 Minutes | 874 | 6.4% |
| 60 to 89 Minutes | 471 | 3.5% |
| 90 or more Minutes | 198 | 1.5% |
Commute Time by Sex in Springville
The most common commute times in Springville are 15 to 19 minutes (1,523 commuters, 18.9%) for males and 15 to 19 minutes (1,211 commuters, 21.6%) for females.
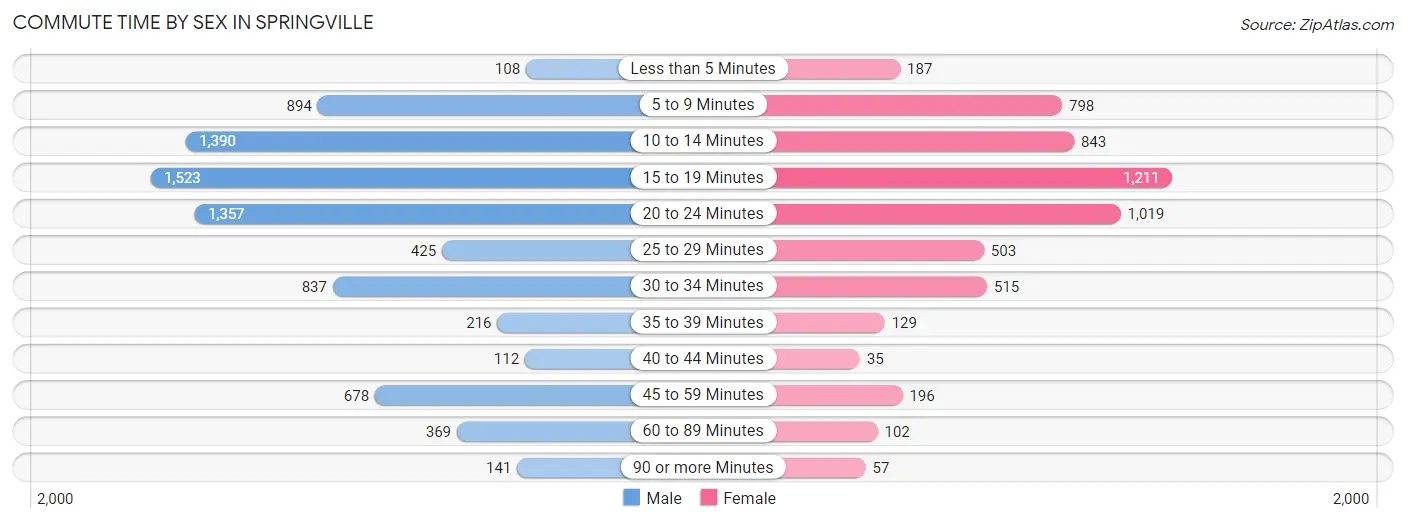
| Commute Time | Male | Female |
| Less than 5 Minutes | 108 (1.3%) | 187 (3.3%) |
| 5 to 9 Minutes | 894 (11.1%) | 798 (14.3%) |
| 10 to 14 Minutes | 1,390 (17.3%) | 843 (15.1%) |
| 15 to 19 Minutes | 1,523 (18.9%) | 1,211 (21.6%) |
| 20 to 24 Minutes | 1,357 (16.9%) | 1,019 (18.2%) |
| 25 to 29 Minutes | 425 (5.3%) | 503 (9.0%) |
| 30 to 34 Minutes | 837 (10.4%) | 515 (9.2%) |
| 35 to 39 Minutes | 216 (2.7%) | 129 (2.3%) |
| 40 to 44 Minutes | 112 (1.4%) | 35 (0.6%) |
| 45 to 59 Minutes | 678 (8.4%) | 196 (3.5%) |
| 60 to 89 Minutes | 369 (4.6%) | 102 (1.8%) |
| 90 or more Minutes | 141 (1.8%) | 57 (1.0%) |
Time of Departure to Work by Sex in Springville
The most frequent times of departure to work in Springville are 7:30 AM to 7:59 AM (1,073, 13.3%) for males and 7:30 AM to 7:59 AM (788, 14.1%) for females.
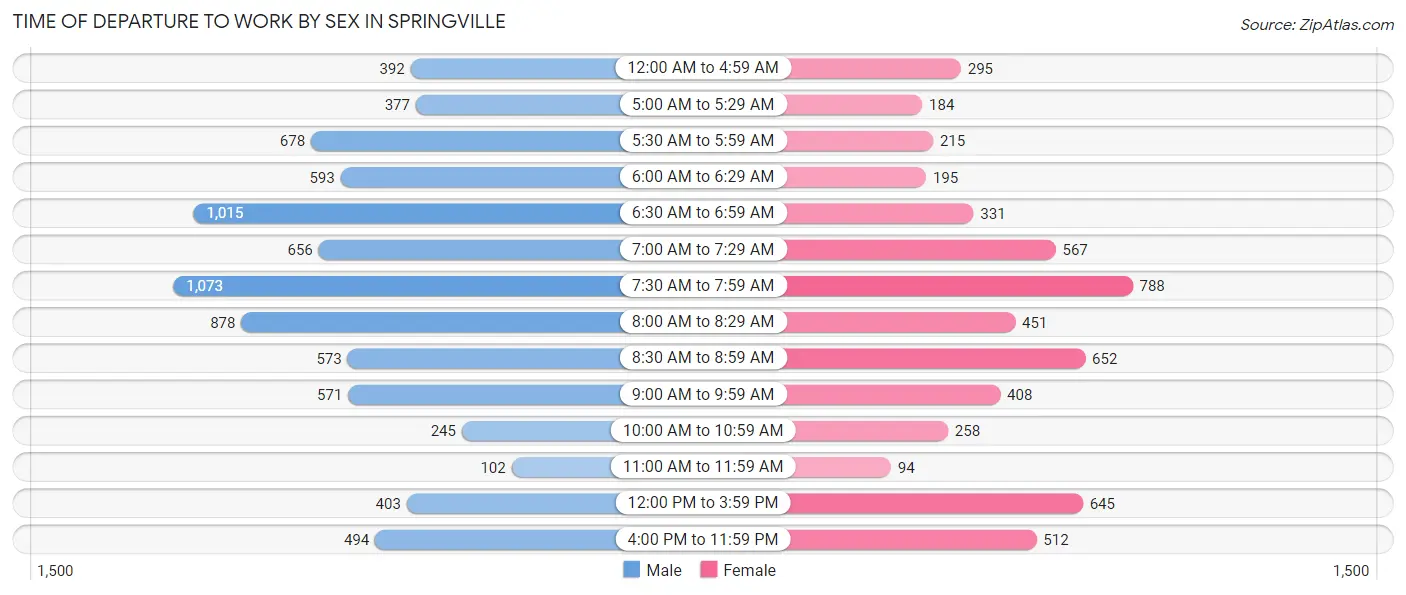
| Time of Departure | Male | Female |
| 12:00 AM to 4:59 AM | 392 (4.9%) | 295 (5.3%) |
| 5:00 AM to 5:29 AM | 377 (4.7%) | 184 (3.3%) |
| 5:30 AM to 5:59 AM | 678 (8.4%) | 215 (3.8%) |
| 6:00 AM to 6:29 AM | 593 (7.4%) | 195 (3.5%) |
| 6:30 AM to 6:59 AM | 1,015 (12.6%) | 331 (5.9%) |
| 7:00 AM to 7:29 AM | 656 (8.2%) | 567 (10.1%) |
| 7:30 AM to 7:59 AM | 1,073 (13.3%) | 788 (14.1%) |
| 8:00 AM to 8:29 AM | 878 (10.9%) | 451 (8.1%) |
| 8:30 AM to 8:59 AM | 573 (7.1%) | 652 (11.7%) |
| 9:00 AM to 9:59 AM | 571 (7.1%) | 408 (7.3%) |
| 10:00 AM to 10:59 AM | 245 (3.0%) | 258 (4.6%) |
| 11:00 AM to 11:59 AM | 102 (1.3%) | 94 (1.7%) |
| 12:00 PM to 3:59 PM | 403 (5.0%) | 645 (11.5%) |
| 4:00 PM to 11:59 PM | 494 (6.1%) | 512 (9.1%) |
| Total | 8,050 (100.0%) | 5,595 (100.0%) |
Housing Occupancy in Springville
Occupancy by Ownership in Springville
Of the total 10,258 dwellings in Springville, owner-occupied units account for 7,212 (70.3%), while renter-occupied units make up 3,046 (29.7%).
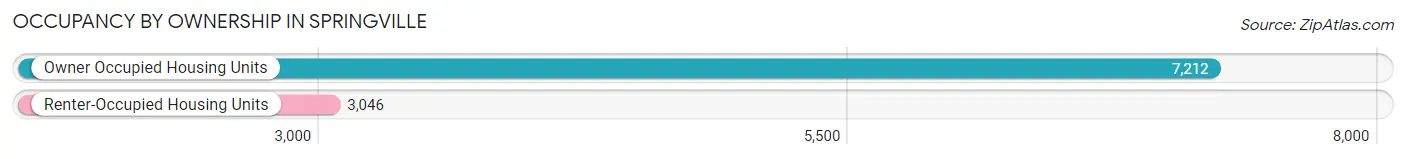
| Occupancy | # Housing Units | % Housing Units |
| Owner Occupied Housing Units | 7,212 | 70.3% |
| Renter-Occupied Housing Units | 3,046 | 29.7% |
| Total Occupied Housing Units | 10,258 | 100.0% |
Occupancy by Household Size in Springville
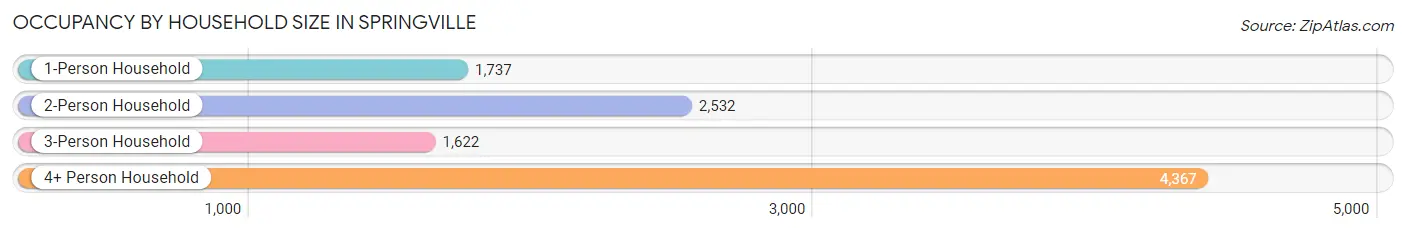
| Household Size | # Housing Units | % Housing Units |
| 1-Person Household | 1,737 | 16.9% |
| 2-Person Household | 2,532 | 24.7% |
| 3-Person Household | 1,622 | 15.8% |
| 4+ Person Household | 4,367 | 42.6% |
| Total Housing Units | 10,258 | 100.0% |
Occupancy by Ownership by Household Size in Springville
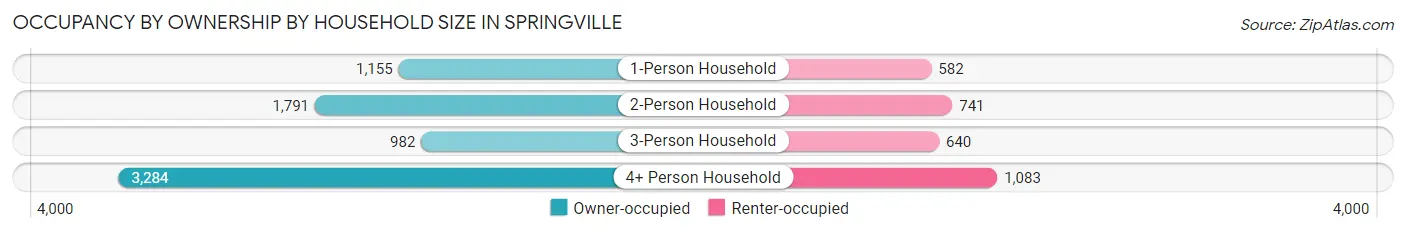
| Household Size | Owner-occupied | Renter-occupied |
| 1-Person Household | 1,155 (66.5%) | 582 (33.5%) |
| 2-Person Household | 1,791 (70.7%) | 741 (29.3%) |
| 3-Person Household | 982 (60.5%) | 640 (39.5%) |
| 4+ Person Household | 3,284 (75.2%) | 1,083 (24.8%) |
| Total Housing Units | 7,212 (70.3%) | 3,046 (29.7%) |
Occupancy by Educational Attainment in Springville
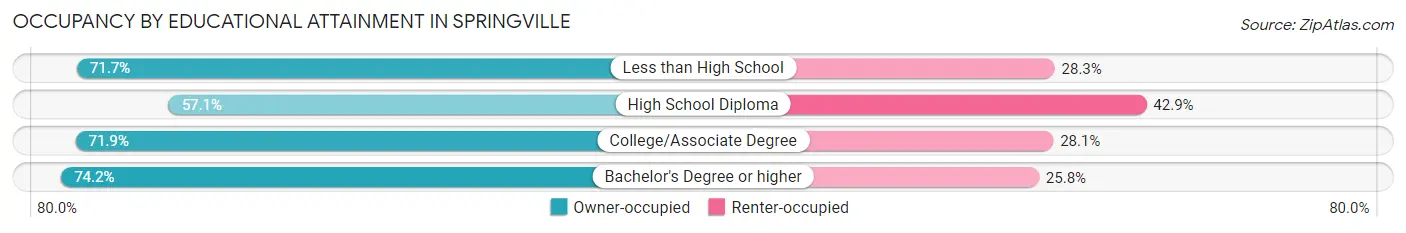
| Household Size | Owner-occupied | Renter-occupied |
| Less than High School | 304 (71.7%) | 120 (28.3%) |
| High School Diploma | 1,012 (57.1%) | 759 (42.9%) |
| College/Associate Degree | 2,722 (71.9%) | 1,063 (28.1%) |
| Bachelor's Degree or higher | 3,174 (74.2%) | 1,104 (25.8%) |
Occupancy by Age of Householder in Springville
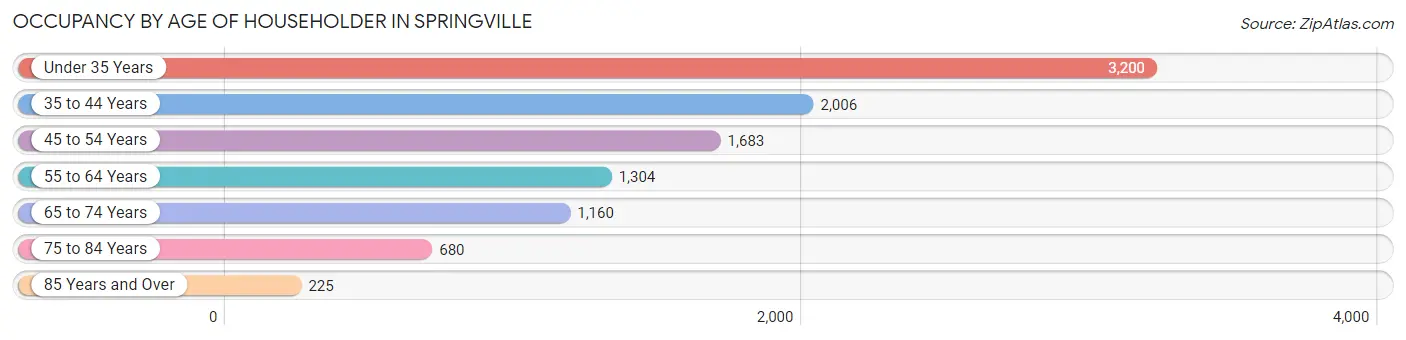
| Age Bracket | # Households | % Households |
| Under 35 Years | 3,200 | 31.2% |
| 35 to 44 Years | 2,006 | 19.6% |
| 45 to 54 Years | 1,683 | 16.4% |
| 55 to 64 Years | 1,304 | 12.7% |
| 65 to 74 Years | 1,160 | 11.3% |
| 75 to 84 Years | 680 | 6.6% |
| 85 Years and Over | 225 | 2.2% |
| Total | 10,258 | 100.0% |
Housing Finances in Springville
Median Income by Occupancy in Springville
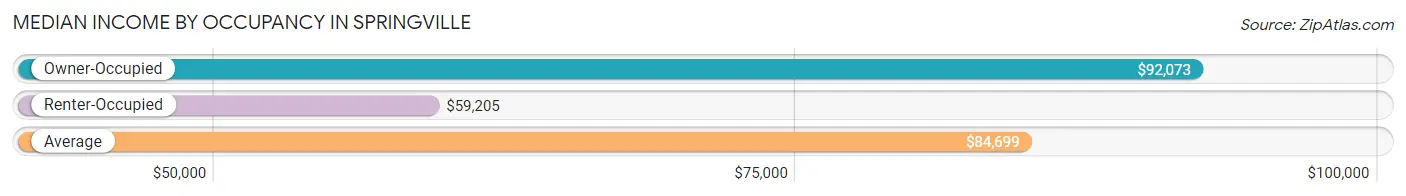
| Occupancy Type | # Households | Median Income |
| Owner-Occupied | 7,212 (70.3%) | $92,073 |
| Renter-Occupied | 3,046 (29.7%) | $59,205 |
| Average | 10,258 (100.0%) | $84,699 |
Occupancy by Householder Income Bracket in Springville
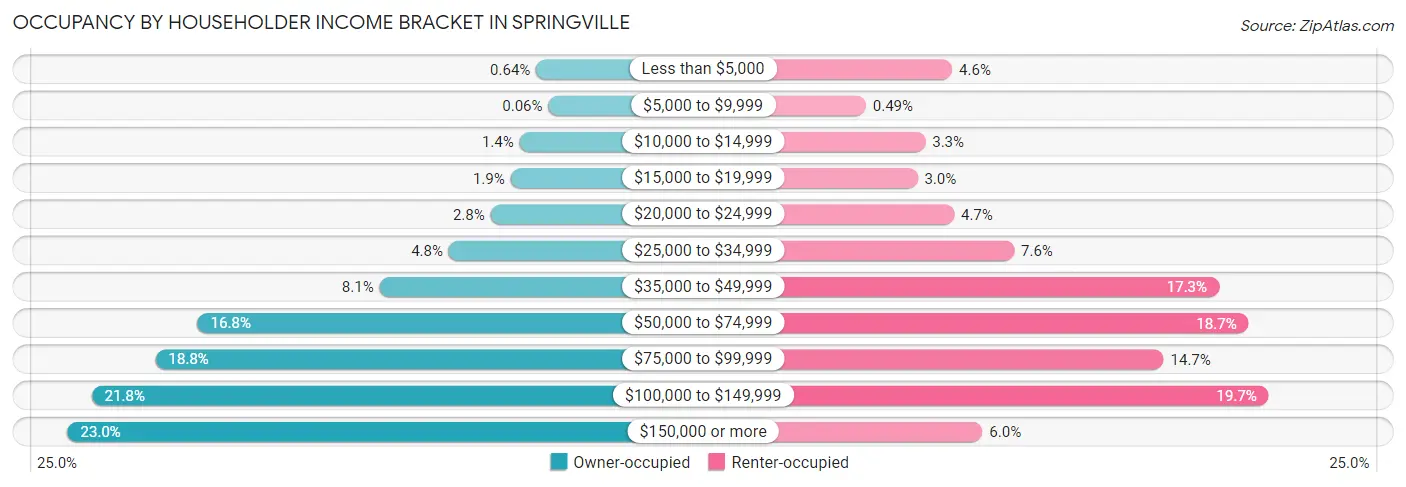
| Income Bracket | Owner-occupied | Renter-occupied |
| Less than $5,000 | 46 (0.6%) | 140 (4.6%) |
| $5,000 to $9,999 | 4 (0.1%) | 15 (0.5%) |
| $10,000 to $14,999 | 103 (1.4%) | 101 (3.3%) |
| $15,000 to $19,999 | 134 (1.9%) | 90 (2.9%) |
| $20,000 to $24,999 | 203 (2.8%) | 143 (4.7%) |
| $25,000 to $34,999 | 346 (4.8%) | 230 (7.5%) |
| $35,000 to $49,999 | 584 (8.1%) | 527 (17.3%) |
| $50,000 to $74,999 | 1,209 (16.8%) | 570 (18.7%) |
| $75,000 to $99,999 | 1,354 (18.8%) | 447 (14.7%) |
| $100,000 to $149,999 | 1,573 (21.8%) | 599 (19.7%) |
| $150,000 or more | 1,656 (23.0%) | 184 (6.0%) |
| Total | 7,212 (100.0%) | 3,046 (100.0%) |
Monthly Housing Cost Tiers in Springville
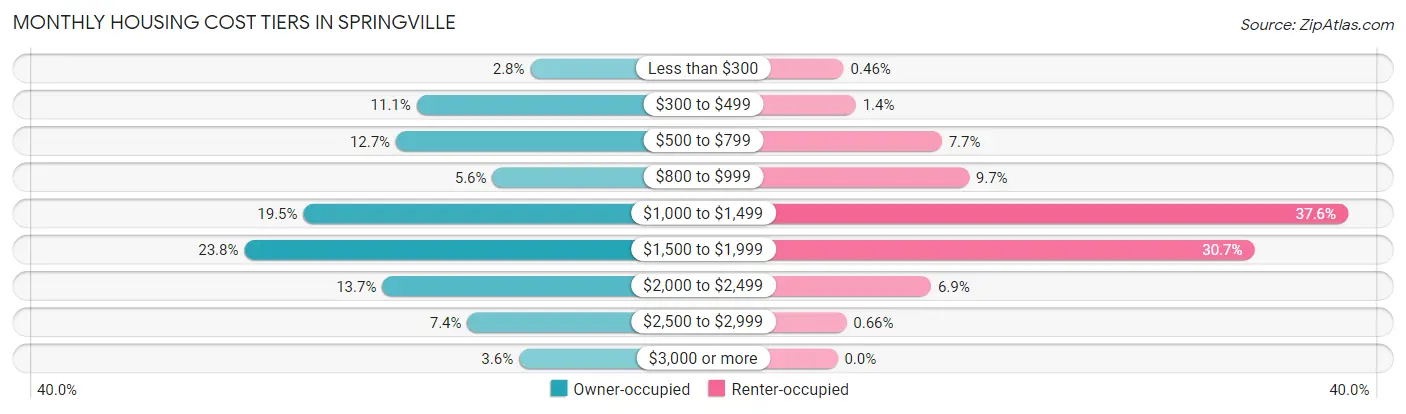
| Monthly Cost | Owner-occupied | Renter-occupied |
| Less than $300 | 198 (2.8%) | 14 (0.5%) |
| $300 to $499 | 803 (11.1%) | 41 (1.3%) |
| $500 to $799 | 912 (12.7%) | 234 (7.7%) |
| $800 to $999 | 400 (5.6%) | 295 (9.7%) |
| $1,000 to $1,499 | 1,404 (19.5%) | 1,145 (37.6%) |
| $1,500 to $1,999 | 1,718 (23.8%) | 935 (30.7%) |
| $2,000 to $2,499 | 985 (13.7%) | 210 (6.9%) |
| $2,500 to $2,999 | 533 (7.4%) | 20 (0.7%) |
| $3,000 or more | 259 (3.6%) | 0 (0.0%) |
| Total | 7,212 (100.0%) | 3,046 (100.0%) |
Physical Housing Characteristics in Springville
Housing Structures in Springville
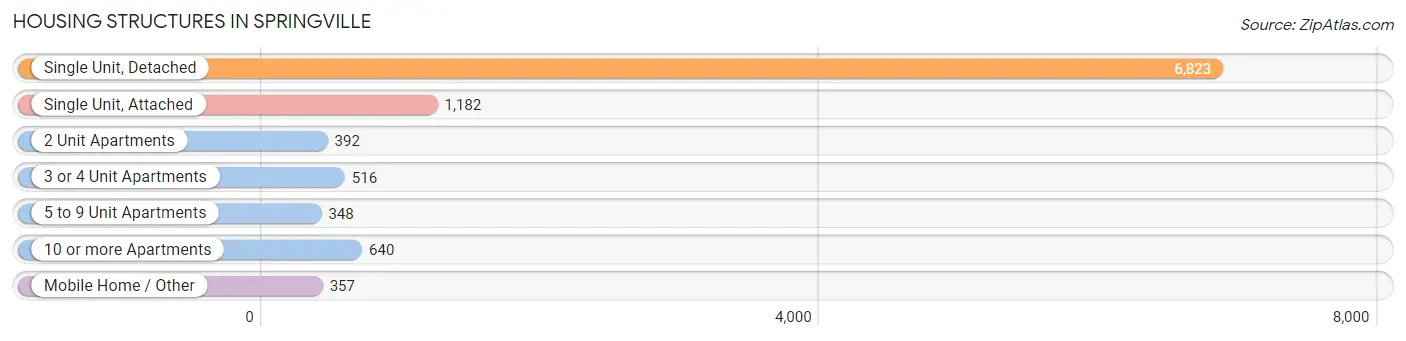
| Structure Type | # Housing Units | % Housing Units |
| Single Unit, Detached | 6,823 | 66.5% |
| Single Unit, Attached | 1,182 | 11.5% |
| 2 Unit Apartments | 392 | 3.8% |
| 3 or 4 Unit Apartments | 516 | 5.0% |
| 5 to 9 Unit Apartments | 348 | 3.4% |
| 10 or more Apartments | 640 | 6.2% |
| Mobile Home / Other | 357 | 3.5% |
| Total | 10,258 | 100.0% |
Housing Structures by Occupancy in Springville
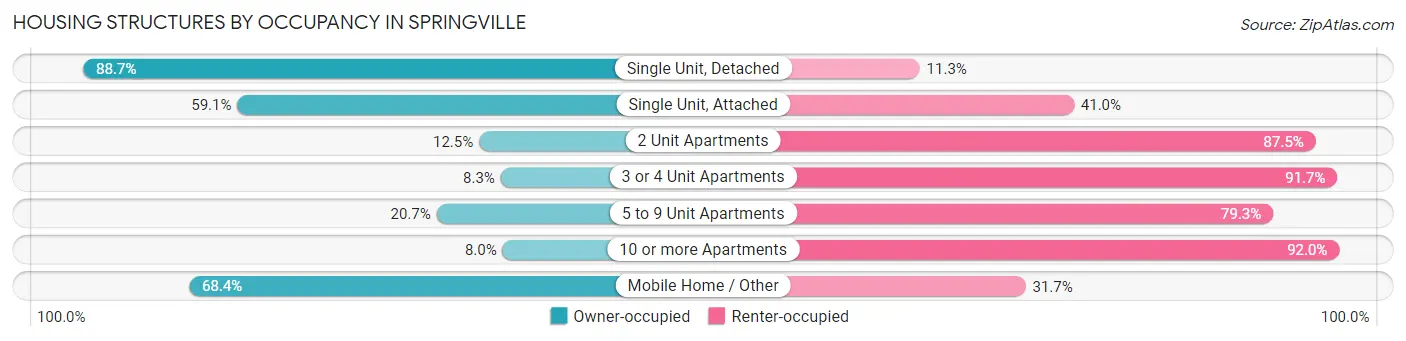
| Structure Type | Owner-occupied | Renter-occupied |
| Single Unit, Detached | 6,055 (88.7%) | 768 (11.3%) |
| Single Unit, Attached | 698 (59.1%) | 484 (40.9%) |
| 2 Unit Apartments | 49 (12.5%) | 343 (87.5%) |
| 3 or 4 Unit Apartments | 43 (8.3%) | 473 (91.7%) |
| 5 to 9 Unit Apartments | 72 (20.7%) | 276 (79.3%) |
| 10 or more Apartments | 51 (8.0%) | 589 (92.0%) |
| Mobile Home / Other | 244 (68.3%) | 113 (31.7%) |
| Total | 7,212 (70.3%) | 3,046 (29.7%) |
Housing Structures by Number of Rooms in Springville
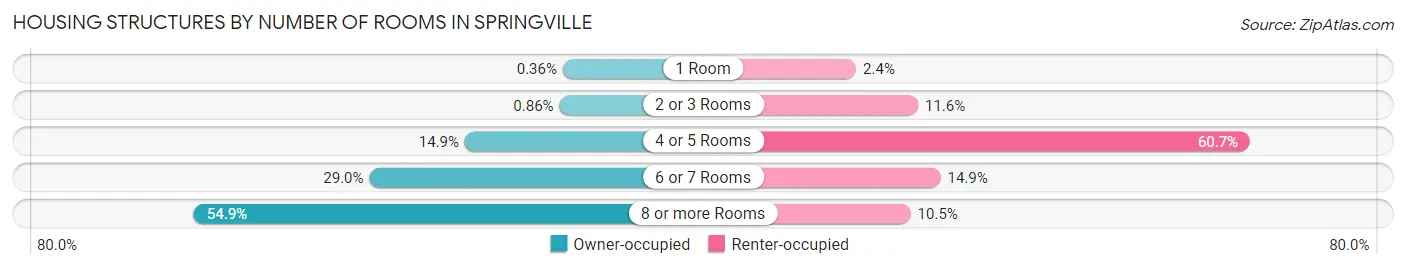
| Number of Rooms | Owner-occupied | Renter-occupied |
| 1 Room | 26 (0.4%) | 73 (2.4%) |
| 2 or 3 Rooms | 62 (0.9%) | 352 (11.6%) |
| 4 or 5 Rooms | 1,072 (14.9%) | 1,848 (60.7%) |
| 6 or 7 Rooms | 2,090 (29.0%) | 454 (14.9%) |
| 8 or more Rooms | 3,962 (54.9%) | 319 (10.5%) |
| Total | 7,212 (100.0%) | 3,046 (100.0%) |
Housing Structure by Heating Type in Springville
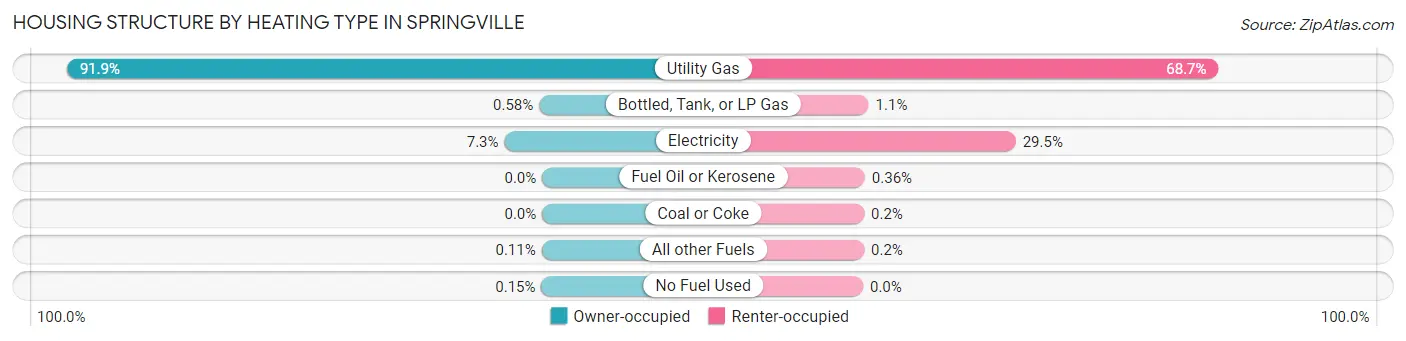
| Heating Type | Owner-occupied | Renter-occupied |
| Utility Gas | 6,625 (91.9%) | 2,091 (68.6%) |
| Bottled, Tank, or LP Gas | 42 (0.6%) | 33 (1.1%) |
| Electricity | 526 (7.3%) | 899 (29.5%) |
| Fuel Oil or Kerosene | 0 (0.0%) | 11 (0.4%) |
| Coal or Coke | 0 (0.0%) | 6 (0.2%) |
| All other Fuels | 8 (0.1%) | 6 (0.2%) |
| No Fuel Used | 11 (0.2%) | 0 (0.0%) |
| Total | 7,212 (100.0%) | 3,046 (100.0%) |
Household Vehicle Usage in Springville
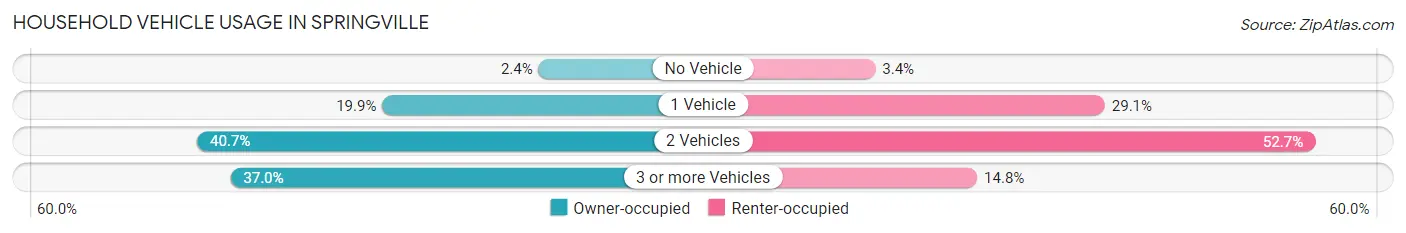
| Vehicles per Household | Owner-occupied | Renter-occupied |
| No Vehicle | 175 (2.4%) | 104 (3.4%) |
| 1 Vehicle | 1,438 (19.9%) | 887 (29.1%) |
| 2 Vehicles | 2,934 (40.7%) | 1,604 (52.7%) |
| 3 or more Vehicles | 2,665 (36.9%) | 451 (14.8%) |
| Total | 7,212 (100.0%) | 3,046 (100.0%) |
Real Estate & Mortgages in Springville
Real Estate and Mortgage Overview in Springville
| Characteristic | Without Mortgage | With Mortgage |
| Housing Units | 1,994 | 5,218 |
| Median Property Value | $387,700 | $391,500 |
| Median Household Income | $75,603 | $1,290 |
| Monthly Housing Costs | $504 | $259 |
| Real Estate Taxes | $2,243 | $113 |
Property Value by Mortgage Status in Springville
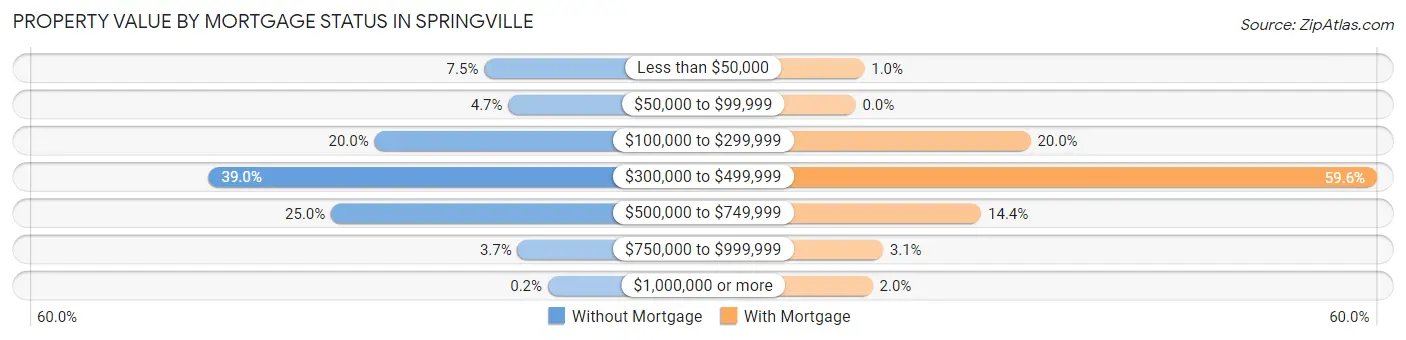
| Property Value | Without Mortgage | With Mortgage |
| Less than $50,000 | 149 (7.5%) | 52 (1.0%) |
| $50,000 to $99,999 | 94 (4.7%) | 0 (0.0%) |
| $100,000 to $299,999 | 399 (20.0%) | 1,043 (20.0%) |
| $300,000 to $499,999 | 777 (39.0%) | 3,109 (59.6%) |
| $500,000 to $749,999 | 498 (25.0%) | 749 (14.3%) |
| $750,000 to $999,999 | 73 (3.7%) | 163 (3.1%) |
| $1,000,000 or more | 4 (0.2%) | 102 (1.9%) |
| Total | 1,994 (100.0%) | 5,218 (100.0%) |
Household Income by Mortgage Status in Springville
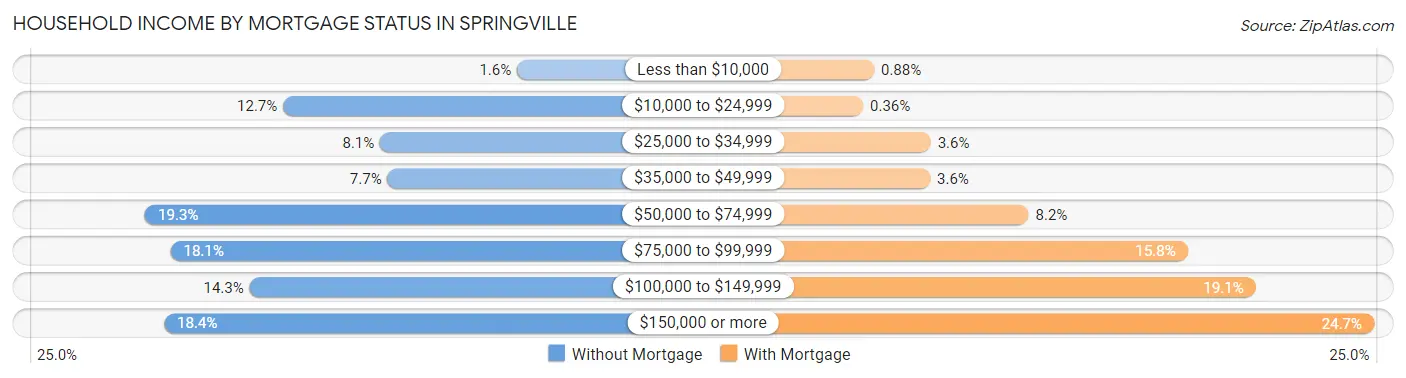
| Household Income | Without Mortgage | With Mortgage |
| Less than $10,000 | 31 (1.5%) | 46 (0.9%) |
| $10,000 to $24,999 | 253 (12.7%) | 19 (0.4%) |
| $25,000 to $34,999 | 161 (8.1%) | 187 (3.6%) |
| $35,000 to $49,999 | 154 (7.7%) | 185 (3.5%) |
| $50,000 to $74,999 | 384 (19.3%) | 430 (8.2%) |
| $75,000 to $99,999 | 360 (18.0%) | 825 (15.8%) |
| $100,000 to $149,999 | 285 (14.3%) | 994 (19.1%) |
| $150,000 or more | 366 (18.4%) | 1,288 (24.7%) |
| Total | 1,994 (100.0%) | 5,218 (100.0%) |
Property Value to Household Income Ratio in Springville
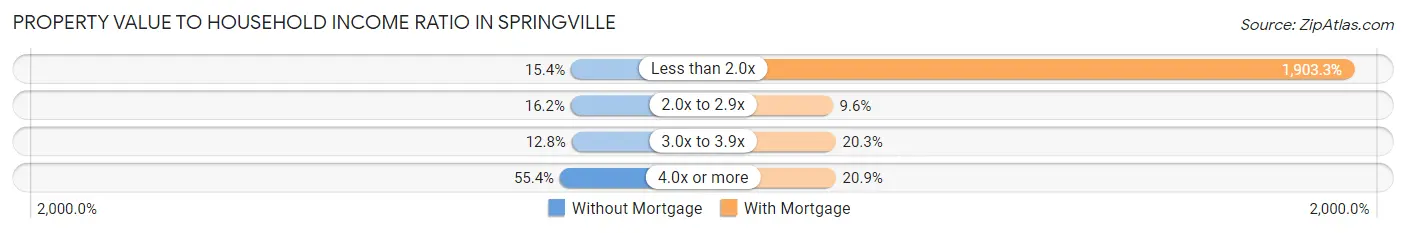
| Value-to-Income Ratio | Without Mortgage | With Mortgage |
| Less than 2.0x | 307 (15.4%) | 99,314 (1,903.3%) |
| 2.0x to 2.9x | 323 (16.2%) | 501 (9.6%) |
| 3.0x to 3.9x | 255 (12.8%) | 1,060 (20.3%) |
| 4.0x or more | 1,105 (55.4%) | 1,090 (20.9%) |
| Total | 1,994 (100.0%) | 5,218 (100.0%) |
Real Estate Taxes by Mortgage Status in Springville
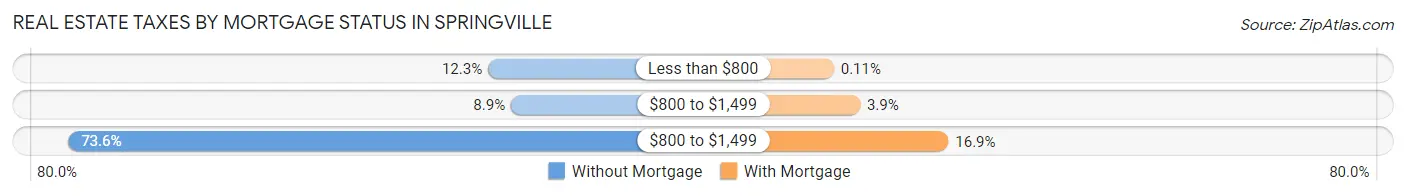
| Property Taxes | Without Mortgage | With Mortgage |
| Less than $800 | 245 (12.3%) | 6 (0.1%) |
| $800 to $1,499 | 178 (8.9%) | 205 (3.9%) |
| $800 to $1,499 | 1,468 (73.6%) | 879 (16.9%) |
| Total | 1,994 (100.0%) | 5,218 (100.0%) |
Health & Disability in Springville
Health Insurance Coverage by Age in Springville
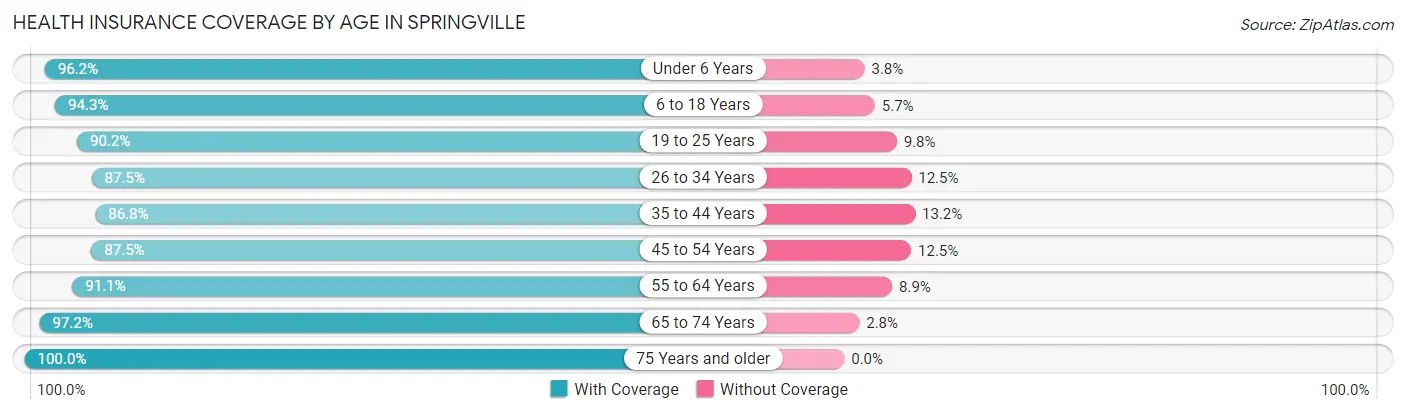
| Age Bracket | With Coverage | Without Coverage |
| Under 6 Years | 4,275 (96.2%) | 168 (3.8%) |
| 6 to 18 Years | 8,205 (94.3%) | 496 (5.7%) |
| 19 to 25 Years | 3,366 (90.2%) | 365 (9.8%) |
| 26 to 34 Years | 4,561 (87.5%) | 651 (12.5%) |
| 35 to 44 Years | 3,736 (86.8%) | 568 (13.2%) |
| 45 to 54 Years | 2,698 (87.5%) | 384 (12.5%) |
| 55 to 64 Years | 2,259 (91.1%) | 221 (8.9%) |
| 65 to 74 Years | 1,837 (97.2%) | 53 (2.8%) |
| 75 Years and older | 1,204 (100.0%) | 0 (0.0%) |
| Total | 32,141 (91.7%) | 2,906 (8.3%) |
Health Insurance Coverage by Citizenship Status in Springville
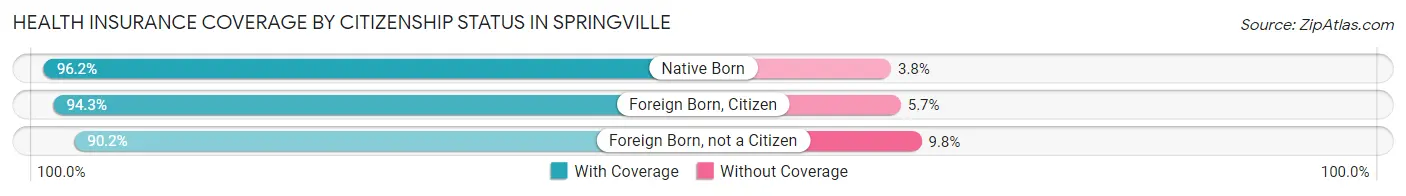
| Citizenship Status | With Coverage | Without Coverage |
| Native Born | 4,275 (96.2%) | 168 (3.8%) |
| Foreign Born, Citizen | 8,205 (94.3%) | 496 (5.7%) |
| Foreign Born, not a Citizen | 3,366 (90.2%) | 365 (9.8%) |
Health Insurance Coverage by Household Income in Springville
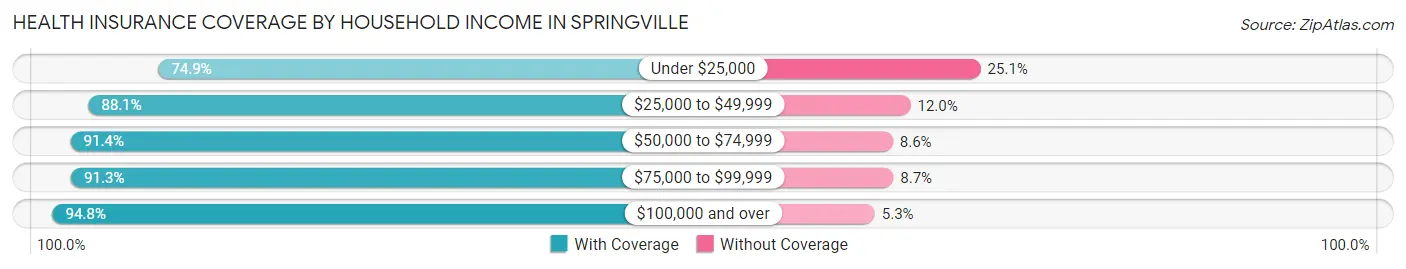
| Household Income | With Coverage | Without Coverage |
| Under $25,000 | 1,377 (74.9%) | 461 (25.1%) |
| $25,000 to $49,999 | 3,979 (88.0%) | 540 (11.9%) |
| $50,000 to $74,999 | 4,841 (91.4%) | 457 (8.6%) |
| $75,000 to $99,999 | 5,798 (91.3%) | 554 (8.7%) |
| $100,000 and over | 16,128 (94.8%) | 894 (5.2%) |
Public vs Private Health Insurance Coverage by Age in Springville
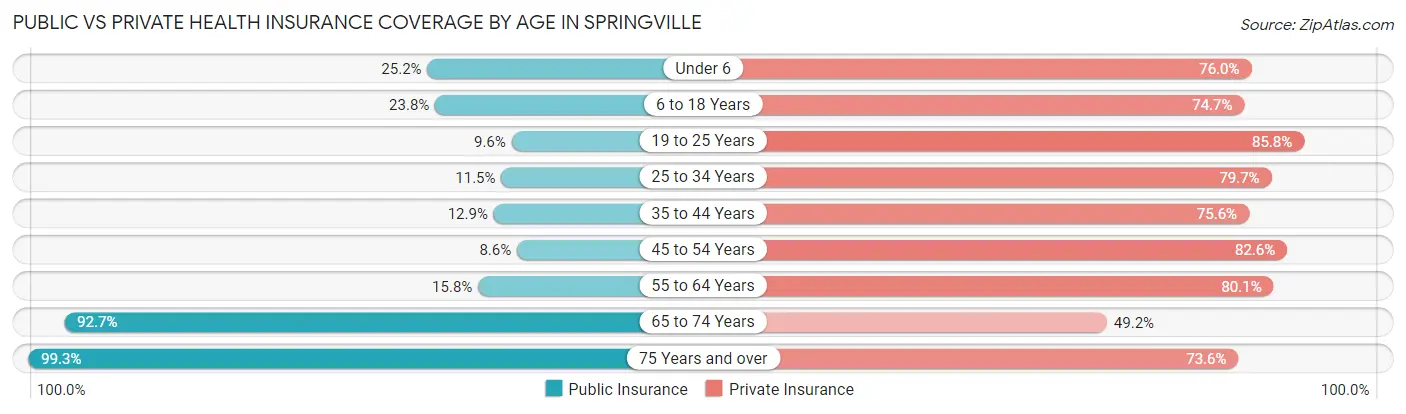
| Age Bracket | Public Insurance | Private Insurance |
| Under 6 | 1,121 (25.2%) | 3,377 (76.0%) |
| 6 to 18 Years | 2,071 (23.8%) | 6,501 (74.7%) |
| 19 to 25 Years | 358 (9.6%) | 3,201 (85.8%) |
| 25 to 34 Years | 600 (11.5%) | 4,156 (79.7%) |
| 35 to 44 Years | 556 (12.9%) | 3,252 (75.6%) |
| 45 to 54 Years | 265 (8.6%) | 2,547 (82.6%) |
| 55 to 64 Years | 392 (15.8%) | 1,987 (80.1%) |
| 65 to 74 Years | 1,751 (92.6%) | 930 (49.2%) |
| 75 Years and over | 1,196 (99.3%) | 886 (73.6%) |
| Total | 8,310 (23.7%) | 26,837 (76.6%) |
Disability Status by Sex by Age in Springville
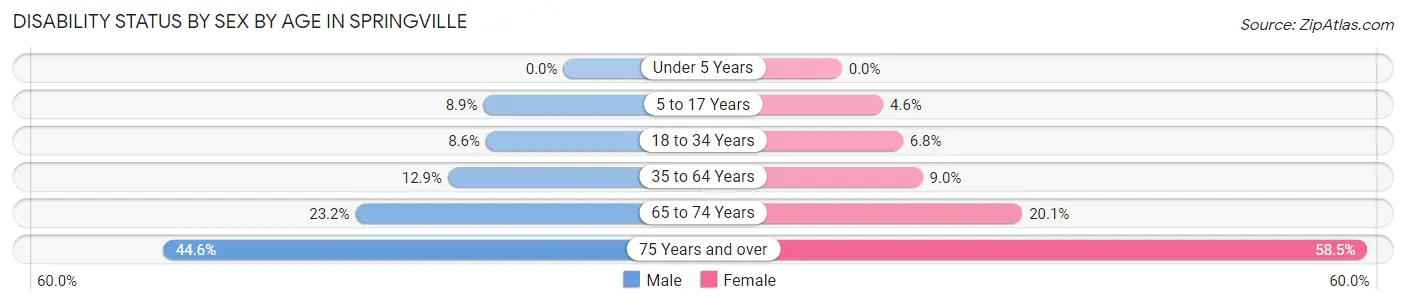
| Age Bracket | Male | Female |
| Under 5 Years | 0 (0.0%) | 0 (0.0%) |
| 5 to 17 Years | 440 (8.9%) | 192 (4.6%) |
| 18 to 34 Years | 405 (8.6%) | 322 (6.8%) |
| 35 to 64 Years | 632 (12.9%) | 446 (9.0%) |
| 65 to 74 Years | 190 (23.2%) | 215 (20.1%) |
| 75 Years and over | 223 (44.6%) | 412 (58.5%) |
Disability Class by Sex by Age in Springville
Disability Class: Hearing Difficulty
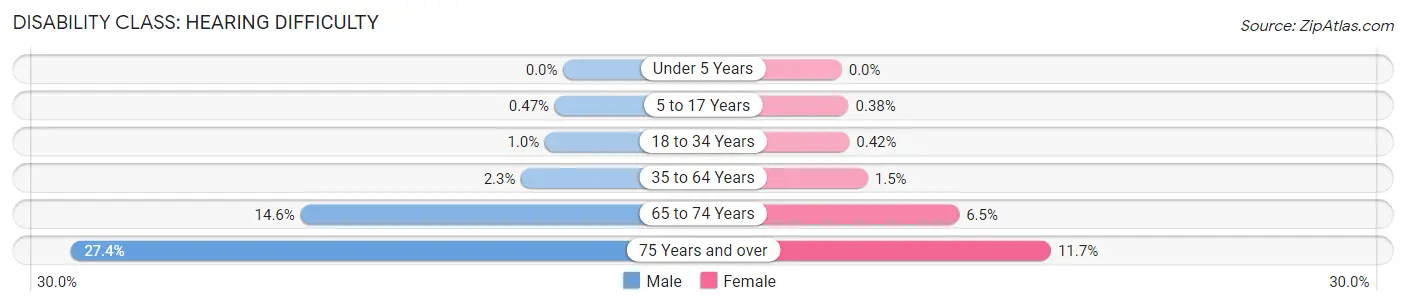
| Age Bracket | Male | Female |
| Under 5 Years | 0 (0.0%) | 0 (0.0%) |
| 5 to 17 Years | 23 (0.5%) | 16 (0.4%) |
| 18 to 34 Years | 48 (1.0%) | 20 (0.4%) |
| 35 to 64 Years | 115 (2.3%) | 72 (1.5%) |
| 65 to 74 Years | 120 (14.6%) | 70 (6.5%) |
| 75 Years and over | 137 (27.4%) | 82 (11.7%) |
Disability Class: Vision Difficulty
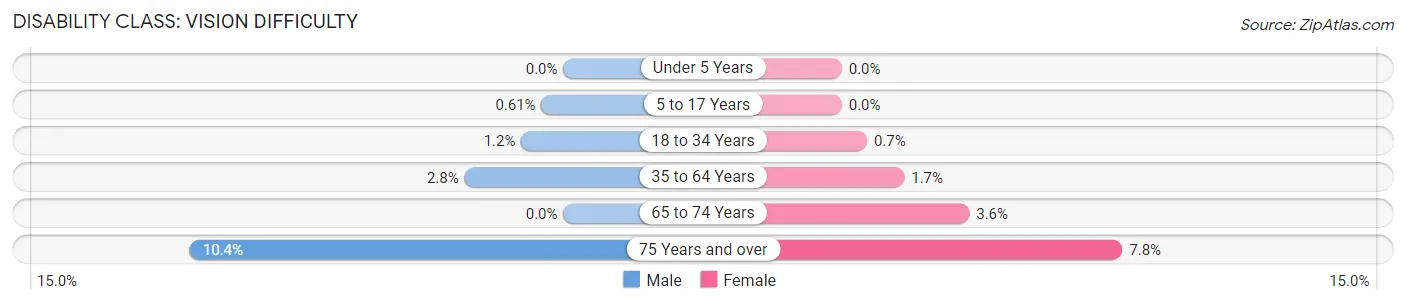
| Age Bracket | Male | Female |
| Under 5 Years | 0 (0.0%) | 0 (0.0%) |
| 5 to 17 Years | 30 (0.6%) | 0 (0.0%) |
| 18 to 34 Years | 55 (1.2%) | 33 (0.7%) |
| 35 to 64 Years | 135 (2.8%) | 86 (1.7%) |
| 65 to 74 Years | 0 (0.0%) | 38 (3.5%) |
| 75 Years and over | 52 (10.4%) | 55 (7.8%) |
Disability Class: Cognitive Difficulty
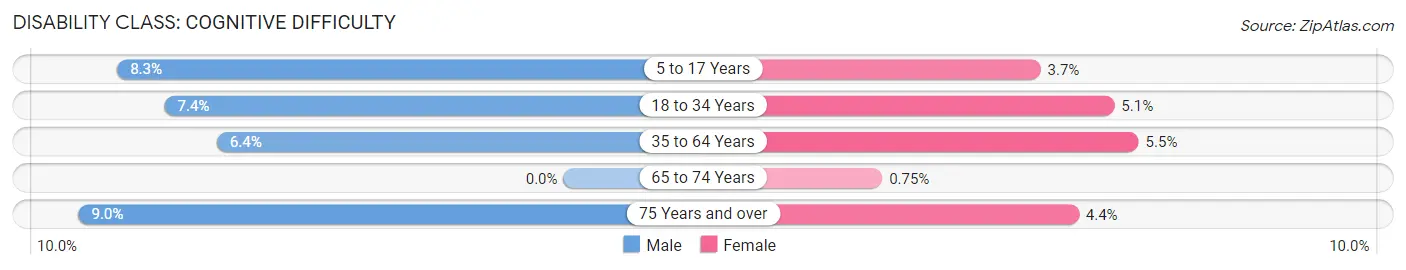
| Age Bracket | Male | Female |
| 5 to 17 Years | 408 (8.3%) | 154 (3.7%) |
| 18 to 34 Years | 347 (7.4%) | 240 (5.1%) |
| 35 to 64 Years | 316 (6.4%) | 273 (5.5%) |
| 65 to 74 Years | 0 (0.0%) | 8 (0.7%) |
| 75 Years and over | 45 (9.0%) | 31 (4.4%) |
Disability Class: Ambulatory Difficulty
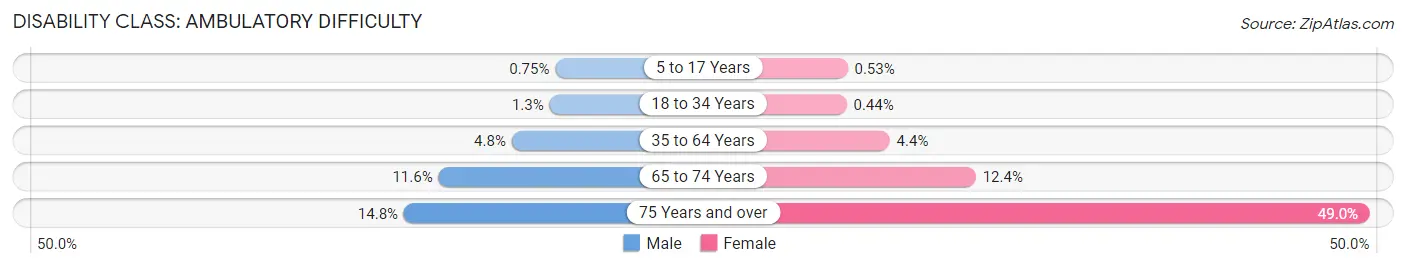
| Age Bracket | Male | Female |
| 5 to 17 Years | 37 (0.7%) | 22 (0.5%) |
| 18 to 34 Years | 60 (1.3%) | 21 (0.4%) |
| 35 to 64 Years | 235 (4.8%) | 220 (4.4%) |
| 65 to 74 Years | 95 (11.6%) | 133 (12.4%) |
| 75 Years and over | 74 (14.8%) | 345 (49.0%) |
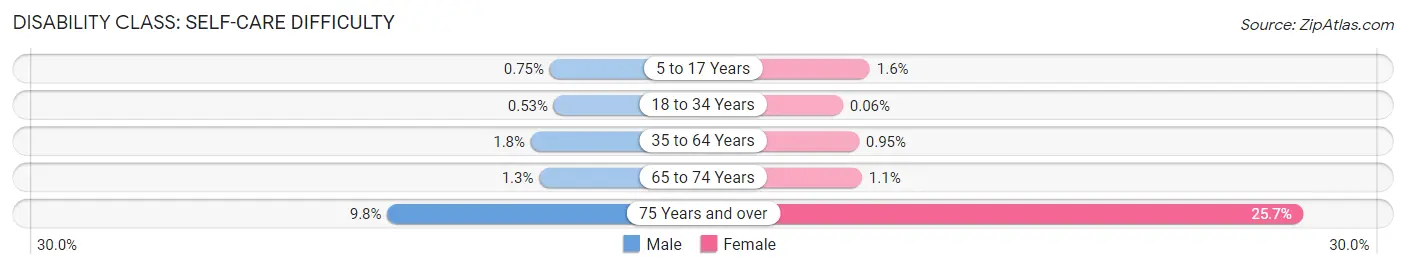
Disability Class: Self-Care Difficulty
| Age Bracket | Male | Female |
| 5 to 17 Years | 37 (0.7%) | 65 (1.6%) |
| 18 to 34 Years | 25 (0.5%) | 3 (0.1%) |
| 35 to 64 Years | 89 (1.8%) | 47 (0.9%) |
| 65 to 74 Years | 11 (1.3%) | 12 (1.1%) |
| 75 Years and over | 49 (9.8%) | 181 (25.7%) |
Technology Access in Springville
Computing Device Access in Springville
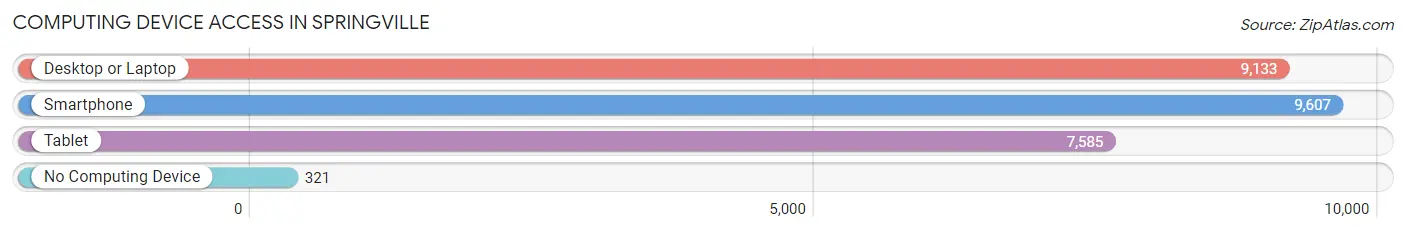
| Device Type | # Households | % Households |
| Desktop or Laptop | 9,133 | 89.0% |
| Smartphone | 9,607 | 93.6% |
| Tablet | 7,585 | 73.9% |
| No Computing Device | 321 | 3.1% |
| Total | 10,258 | 100.0% |
Internet Access in Springville
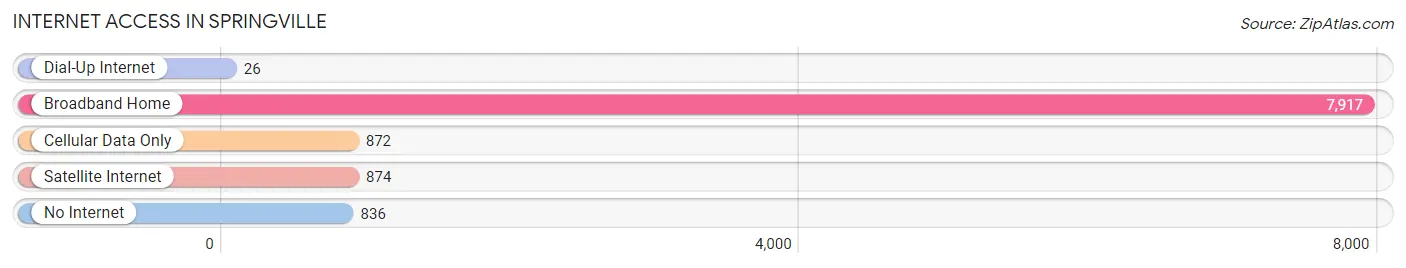
| Internet Type | # Households | % Households |
| Dial-Up Internet | 26 | 0.3% |
| Broadband Home | 7,917 | 77.2% |
| Cellular Data Only | 872 | 8.5% |
| Satellite Internet | 874 | 8.5% |
| No Internet | 836 | 8.2% |
| Total | 10,258 | 100.0% |
Springville Summary
History
The area now known as Springville, Utah was first settled in 1849 by a group of Mormon pioneers led by William Pace. The pioneers named the area Hobble Creek, after the creek that ran through the area. The first settlers built a fort and a sawmill, and the area quickly grew. In 1853, the town was renamed Springville, after the many natural springs in the area.
In the late 1800s, Springville became a major center for the lumber industry. The town was home to several sawmills, and the lumber industry provided jobs for many of the town’s residents. The town also became a center for the railroad industry, with the Utah and Salt Lake Railroad running through the town.
In the early 1900s, Springville began to grow and develop. The town was incorporated in 1909, and the first mayor was elected in 1910. The town continued to grow, and by the 1950s, it had become a thriving community.
Geography
Springville is located in Utah County, in the central part of the state. The town is situated in a valley between the Wasatch Mountains and the Uinta Mountains. The town is located at an elevation of 4,719 feet above sea level.
The town is bordered by Hobble Creek to the north, Spanish Fork to the east, Mapleton to the south, and Provo to the west. The town covers an area of 8.3 square miles, and has a population of approximately 33,000 people.
Economy
The economy of Springville is largely based on the service industry. The town is home to several retail stores, restaurants, and other businesses. The town is also home to several manufacturing companies, including a paper mill and a plastics factory.
The town is also home to several educational institutions, including Brigham Young University, Utah Valley University, and Utah Valley State College. These institutions provide jobs for many of the town’s residents.
Demographics
As of the 2010 census, the population of Springville was 33,039. The racial makeup of the town was 91.3% White, 0.7% African American, 0.5% Native American, 1.2% Asian, 0.2% Pacific Islander, 4.2% from other races, and 2.1% from two or more races. Hispanic or Latino of any race were 8.7% of the population.
The median income for a household in the town was $50,945, and the median income for a family was $58,945. The per capita income for the town was $21,945. About 6.2% of families and 8.3% of the population were below the poverty line, including 10.2% of those under age 18 and 5.2% of those age 65 or over.
Common Questions
What is Per Capita Income in Springville?
Per Capita income in Springville is $29,444.
What is the Median Family Income in Springville?
Median Family Income in Springville is $94,450.
What is the Median Household income in Springville?
Median Household Income in Springville is $84,699.
What is Income or Wage Gap in Springville?
Income or Wage Gap in Springville is 49.1%.
Women in Springville earn 50.9 cents for every dollar earned by a man.
What is Inequality or Gini Index in Springville?
Inequality or Gini Index in Springville is 0.38.
What is the Total Population of Springville?
Total Population of Springville is 35,195.
What is the Total Male Population of Springville?
Total Male Population of Springville is 17,657.
What is the Total Female Population of Springville?
Total Female Population of Springville is 17,538.
What is the Ratio of Males per 100 Females in Springville?
There are 100.68 Males per 100 Females in Springville.
What is the Ratio of Females per 100 Males in Springville?
There are 99.33 Females per 100 Males in Springville.
What is the Median Population Age in Springville?
Median Population Age in Springville is 26.9 Years.
What is the Average Family Size in Springville
Average Family Size in Springville is 3.9 People.
What is the Average Household Size in Springville
Average Household Size in Springville is 3.4 People.
How Large is the Labor Force in Springville?
There are 16,464 People in the Labor Forcein in Springville.
What is the Percentage of People in the Labor Force in Springville?
69.8% of People are in the Labor Force in Springville.
What is the Unemployment Rate in Springville?
Unemployment Rate in Springville is 2.7%.