American Fork, UT Map & Demographics
American Fork Map
American Fork Overview
$35,322
PER CAPITA INCOME
$98,868
AVG FAMILY INCOME
$90,490
AVG HOUSEHOLD INCOME
52.8%
WAGE / INCOME GAP [ % ]
47.2¢/ $1
WAGE / INCOME GAP [ $ ]
0.42
INEQUALITY / GINI INDEX
33,986
TOTAL POPULATION
17,444
MALE POPULATION
16,542
FEMALE POPULATION
105.45
MALES / 100 FEMALES
94.83
FEMALES / 100 MALES
28.0
MEDIAN AGE
3.6
AVG FAMILY SIZE
3.3
AVG HOUSEHOLD SIZE
17,431
LABOR FORCE [ PEOPLE ]
70.3%
PERCENT IN LABOR FORCE
3.3%
UNEMPLOYMENT RATE
American Fork Zip Codes
Income in American Fork
Income Overview in American Fork
Per Capita Income in American Fork is $35,322, while median incomes of families and households are $98,868 and $90,490 respectively.
| Characteristic | Number | Measure |
| Per Capita Income | 33,986 | $35,322 |
| Median Family Income | 8,443 | $98,868 |
| Mean Family Income | 8,443 | $121,124 |
| Median Household Income | 10,240 | $90,490 |
| Mean Household Income | 10,240 | $117,078 |
| Income Deficit | 8,443 | $0 |
| Wage / Income Gap (%) | 33,986 | 52.78% |
| Wage / Income Gap ($) | 33,986 | 47.22¢ per $1 |
| Gini / Inequality Index | 33,986 | 0.42 |
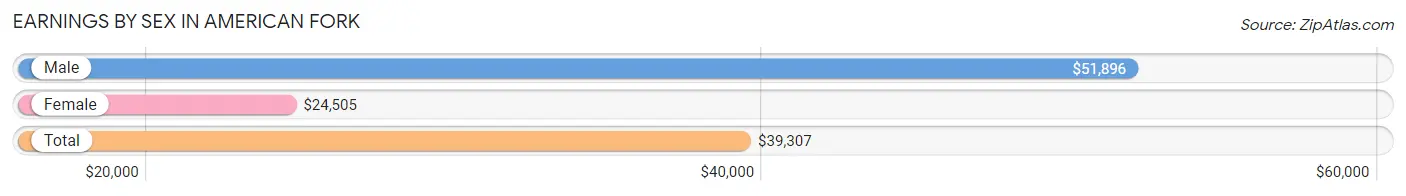
Earnings by Sex in American Fork
Average Earnings in American Fork are $39,307, $51,896 for men and $24,505 for women, a difference of 52.8%.
| Sex | Number | Average Earnings |
| Male | 10,267 (55.8%) | $51,896 |
| Female | 8,132 (44.2%) | $24,505 |
| Total | 18,399 (100.0%) | $39,307 |
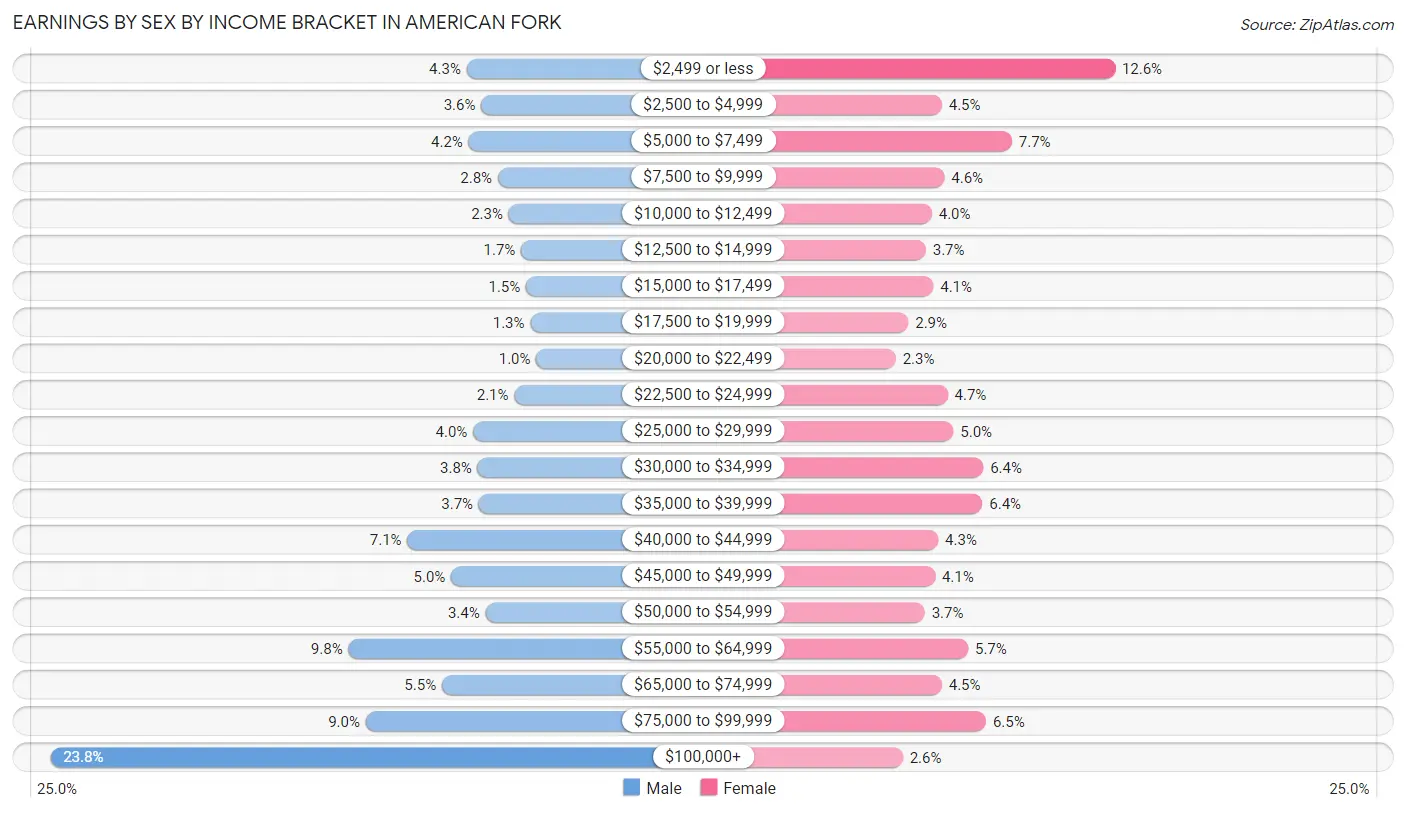
Earnings by Sex by Income Bracket in American Fork
The most common earnings brackets in American Fork are $100,000+ for men (2,444 | 23.8%) and $2,499 or less for women (1,021 | 12.6%).
| Income | Male | Female |
| $2,499 or less | 440 (4.3%) | 1,021 (12.6%) |
| $2,500 to $4,999 | 371 (3.6%) | 362 (4.4%) |
| $5,000 to $7,499 | 431 (4.2%) | 629 (7.7%) |
| $7,500 to $9,999 | 291 (2.8%) | 372 (4.6%) |
| $10,000 to $12,499 | 238 (2.3%) | 324 (4.0%) |
| $12,500 to $14,999 | 179 (1.7%) | 301 (3.7%) |
| $15,000 to $17,499 | 155 (1.5%) | 329 (4.1%) |
| $17,500 to $19,999 | 135 (1.3%) | 234 (2.9%) |
| $20,000 to $22,499 | 106 (1.0%) | 186 (2.3%) |
| $22,500 to $24,999 | 211 (2.1%) | 384 (4.7%) |
| $25,000 to $29,999 | 410 (4.0%) | 406 (5.0%) |
| $30,000 to $34,999 | 388 (3.8%) | 520 (6.4%) |
| $35,000 to $39,999 | 382 (3.7%) | 516 (6.4%) |
| $40,000 to $44,999 | 726 (7.1%) | 348 (4.3%) |
| $45,000 to $49,999 | 515 (5.0%) | 336 (4.1%) |
| $50,000 to $54,999 | 350 (3.4%) | 297 (3.6%) |
| $55,000 to $64,999 | 1,009 (9.8%) | 462 (5.7%) |
| $65,000 to $74,999 | 560 (5.4%) | 362 (4.4%) |
| $75,000 to $99,999 | 926 (9.0%) | 530 (6.5%) |
| $100,000+ | 2,444 (23.8%) | 213 (2.6%) |
| Total | 10,267 (100.0%) | 8,132 (100.0%) |
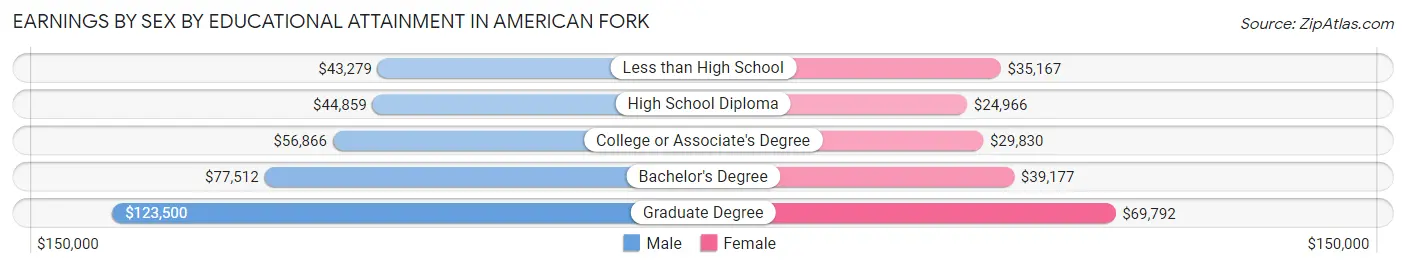
Earnings by Sex by Educational Attainment in American Fork
Average earnings in American Fork are $60,675 for men and $34,002 for women, a difference of 44.0%. Men with an educational attainment of graduate degree enjoy the highest average annual earnings of $123,500, while those with less than high school education earn the least with $43,279. Women with an educational attainment of graduate degree earn the most with the average annual earnings of $69,792, while those with high school diploma education have the smallest earnings of $24,966.
| Educational Attainment | Male Income | Female Income |
| Less than High School | $43,279 | $35,167 |
| High School Diploma | $44,859 | $24,966 |
| College or Associate's Degree | $56,866 | $29,830 |
| Bachelor's Degree | $77,512 | $39,177 |
| Graduate Degree | $123,500 | $69,792 |
| Total | $60,675 | $34,002 |
Family Income in American Fork
Family Income Brackets in American Fork
According to the American Fork family income data, there are 2,043 families falling into the $100,000 to $149,999 income range, which is the most common income bracket and makes up 24.2% of all families. Conversely, the $10,000 to $14,999 income bracket is the least frequent group with only 59 families (0.7%) belonging to this category.
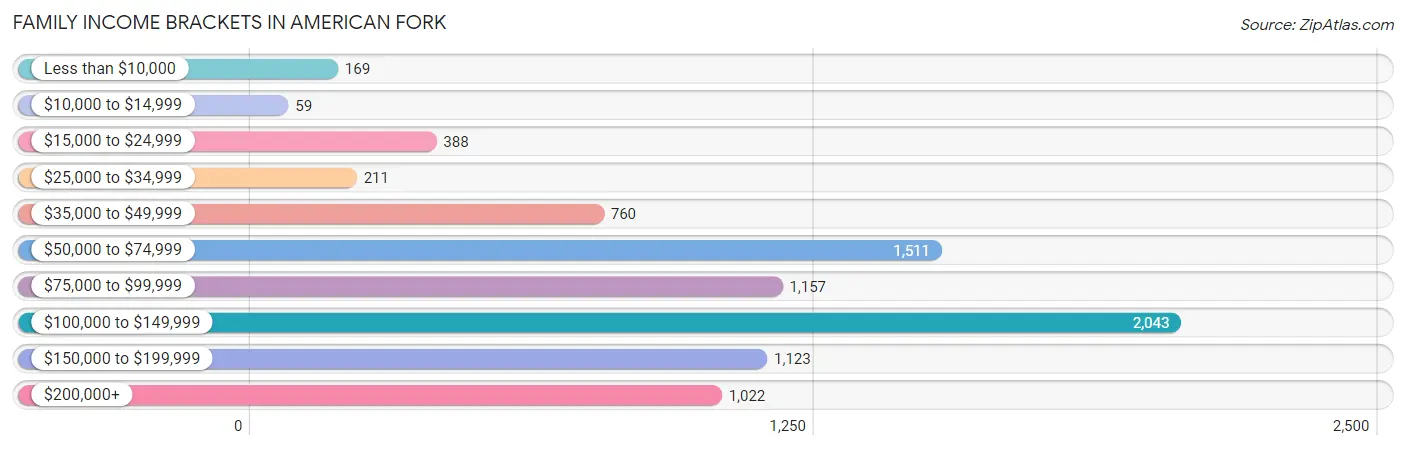
| Income Bracket | # Families | % Families |
| Less than $10,000 | 169 | 2.0% |
| $10,000 to $14,999 | 59 | 0.7% |
| $15,000 to $24,999 | 388 | 4.6% |
| $25,000 to $34,999 | 211 | 2.5% |
| $35,000 to $49,999 | 760 | 9.0% |
| $50,000 to $74,999 | 1,511 | 17.9% |
| $75,000 to $99,999 | 1,157 | 13.7% |
| $100,000 to $149,999 | 2,043 | 24.2% |
| $150,000 to $199,999 | 1,123 | 13.3% |
| $200,000+ | 1,022 | 12.1% |
Family Income by Famaliy Size in American Fork
7+ person families (397 | 4.7%) account for the highest median family income in American Fork with $158,802 per family, while 2-person families (3,216 | 38.1%) have the highest median income of $39,785 per family member.
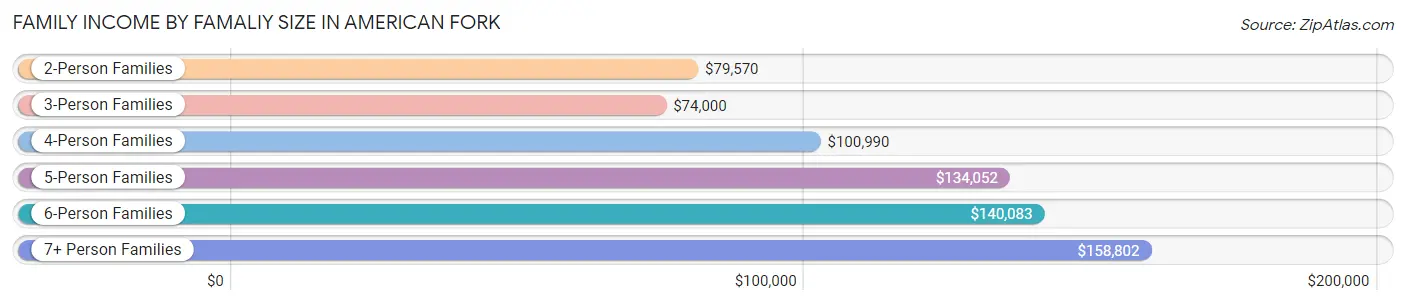
| Income Bracket | # Families | Median Income |
| 2-Person Families | 3,216 (38.1%) | $79,570 |
| 3-Person Families | 1,552 (18.4%) | $74,000 |
| 4-Person Families | 1,589 (18.8%) | $100,990 |
| 5-Person Families | 1,020 (12.1%) | $134,052 |
| 6-Person Families | 669 (7.9%) | $140,083 |
| 7+ Person Families | 397 (4.7%) | $158,802 |
| Total | 8,443 (100.0%) | $98,868 |
Family Income by Number of Earners in American Fork
The median family income in American Fork is $98,868, with families comprising 3+ earners (1,451) having the highest median family income of $154,619, while families with no earners (814) have the lowest median family income of $60,500, accounting for 17.2% and 9.6% of families, respectively.
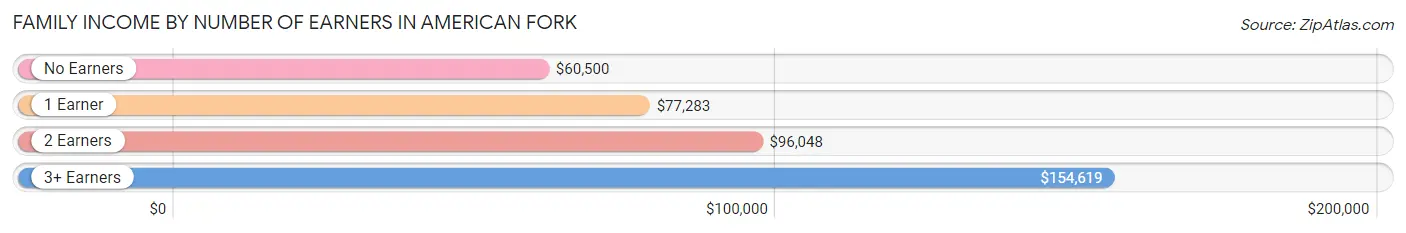
| Number of Earners | # Families | Median Income |
| No Earners | 814 (9.6%) | $60,500 |
| 1 Earner | 2,124 (25.2%) | $77,283 |
| 2 Earners | 4,054 (48.0%) | $96,048 |
| 3+ Earners | 1,451 (17.2%) | $154,619 |
| Total | 8,443 (100.0%) | $98,868 |
Household Income in American Fork
Household Income Brackets in American Fork
With 2,243 households falling in the category, the $100,000 to $149,999 income range is the most frequent in American Fork, accounting for 21.9% of all households. In contrast, only 102 households (1.0%) fall into the $10,000 to $14,999 income bracket, making it the least populous group.
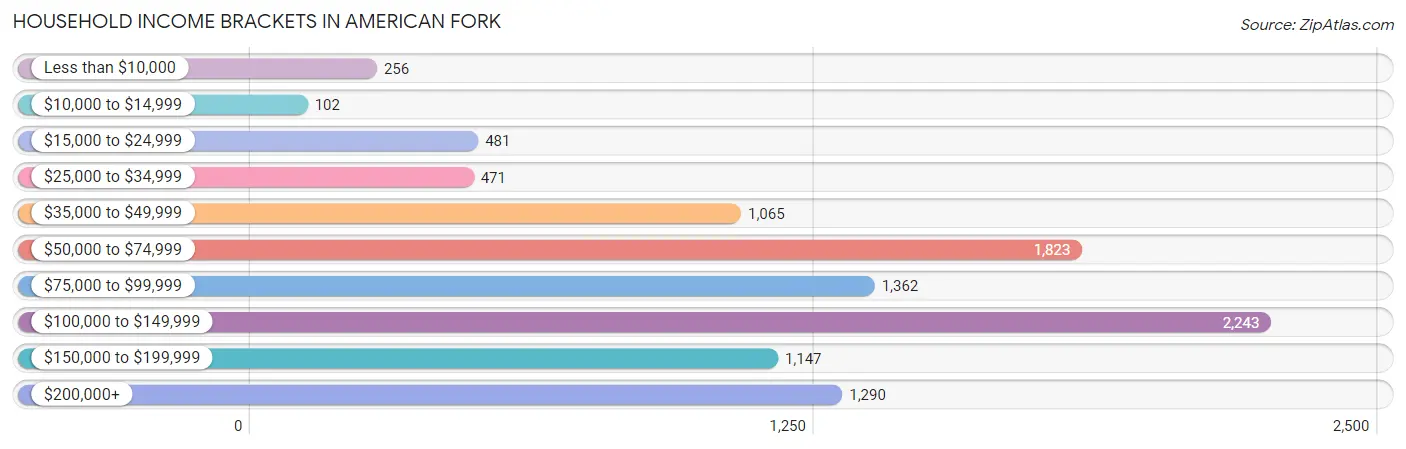
| Income Bracket | # Households | % Households |
| Less than $10,000 | 256 | 2.5% |
| $10,000 to $14,999 | 102 | 1.0% |
| $15,000 to $24,999 | 481 | 4.7% |
| $25,000 to $34,999 | 471 | 4.6% |
| $35,000 to $49,999 | 1,065 | 10.4% |
| $50,000 to $74,999 | 1,823 | 17.8% |
| $75,000 to $99,999 | 1,362 | 13.3% |
| $100,000 to $149,999 | 2,243 | 21.9% |
| $150,000 to $199,999 | 1,147 | 11.2% |
| $200,000+ | 1,290 | 12.6% |
Household Income by Householder Age in American Fork
The median household income in American Fork is $90,490, with the highest median household income of $110,871 found in the 45 to 64 years age bracket for the primary householder. A total of 3,005 households (29.3%) fall into this category. Meanwhile, the 15 to 24 years age bracket for the primary householder has the lowest median household income of $59,800, with 682 households (6.7%) in this group.
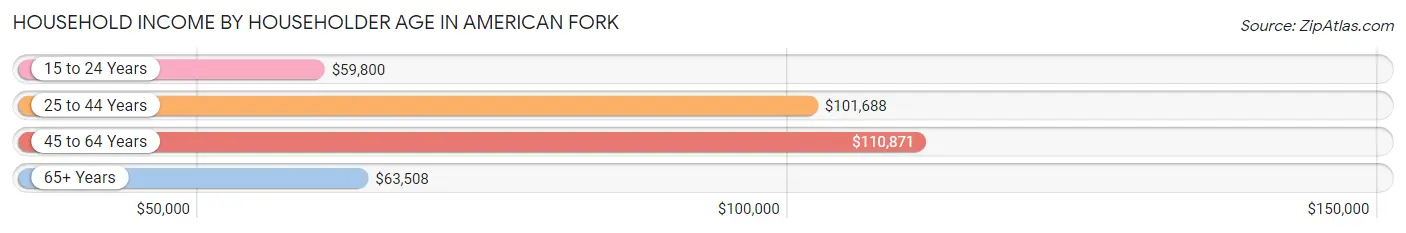
| Income Bracket | # Households | Median Income |
| 15 to 24 Years | 682 (6.7%) | $59,800 |
| 25 to 44 Years | 4,587 (44.8%) | $101,688 |
| 45 to 64 Years | 3,005 (29.3%) | $110,871 |
| 65+ Years | 1,966 (19.2%) | $63,508 |
| Total | 10,240 (100.0%) | $90,490 |
Poverty in American Fork
Income Below Poverty by Sex and Age in American Fork
With 6.1% poverty level for males and 7.6% for females among the residents of American Fork, 5 year old males and 18 to 24 year old females are the most vulnerable to poverty, with 58 males (15.3%) and 415 females (18.3%) in their respective age groups living below the poverty level.
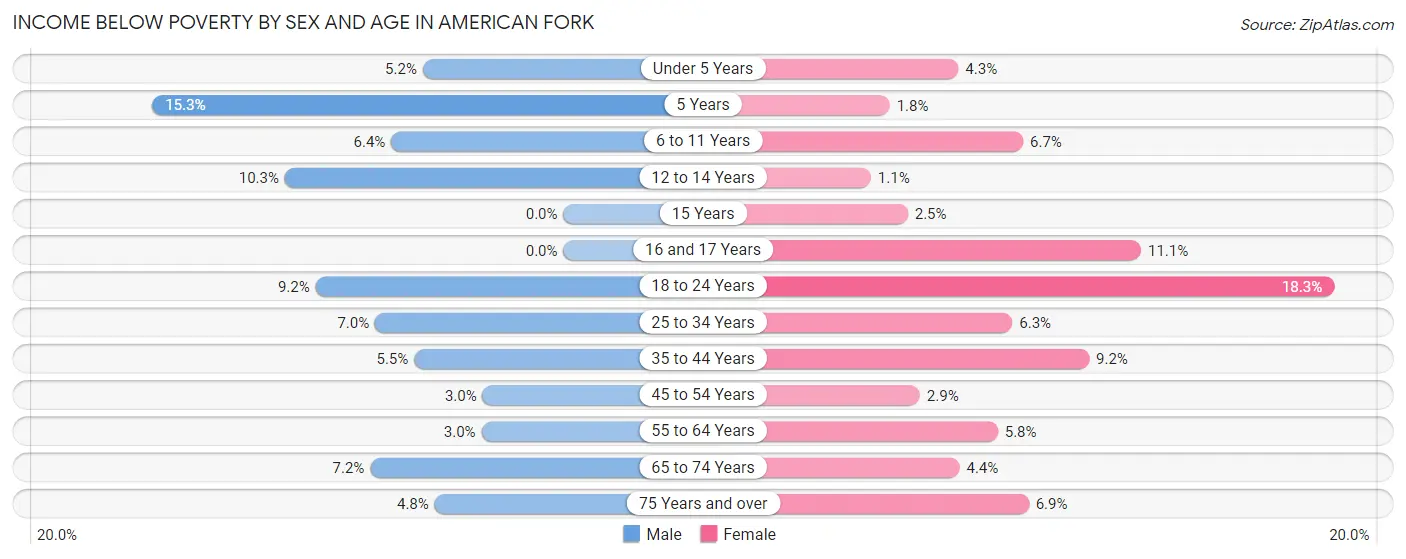
| Age Bracket | Male | Female |
| Under 5 Years | 73 (5.2%) | 57 (4.3%) |
| 5 Years | 58 (15.3%) | 4 (1.8%) |
| 6 to 11 Years | 107 (6.4%) | 110 (6.7%) |
| 12 to 14 Years | 114 (10.3%) | 7 (1.1%) |
| 15 Years | 0 (0.0%) | 9 (2.5%) |
| 16 and 17 Years | 0 (0.0%) | 64 (11.1%) |
| 18 to 24 Years | 186 (9.2%) | 415 (18.3%) |
| 25 to 34 Years | 213 (7.0%) | 163 (6.3%) |
| 35 to 44 Years | 124 (5.5%) | 201 (9.2%) |
| 45 to 54 Years | 52 (3.0%) | 44 (2.9%) |
| 55 to 64 Years | 38 (3.0%) | 75 (5.8%) |
| 65 to 74 Years | 59 (7.2%) | 45 (4.4%) |
| 75 Years and over | 29 (4.8%) | 55 (6.9%) |
| Total | 1,053 (6.1%) | 1,249 (7.6%) |
Income Above Poverty by Sex and Age in American Fork
According to the poverty statistics in American Fork, males aged 15 years and females aged 12 to 14 years are the age groups that are most secure financially, with 100.0% of males and 98.9% of females in these age groups living above the poverty line.
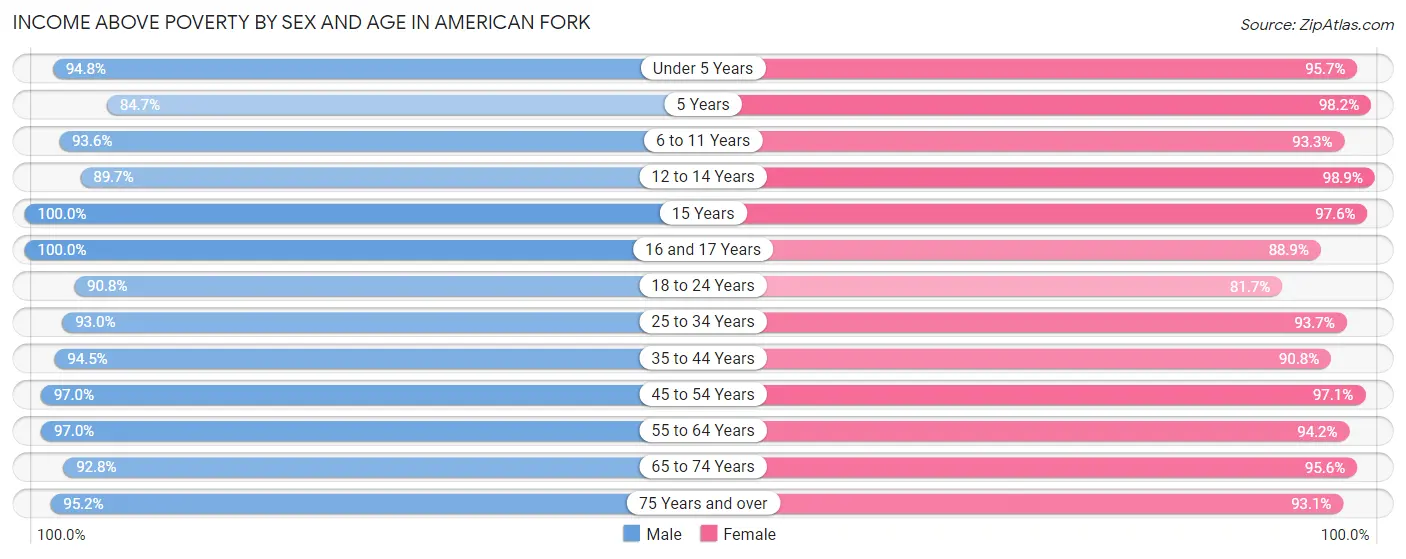
| Age Bracket | Male | Female |
| Under 5 Years | 1,326 (94.8%) | 1,258 (95.7%) |
| 5 Years | 322 (84.7%) | 221 (98.2%) |
| 6 to 11 Years | 1,567 (93.6%) | 1,524 (93.3%) |
| 12 to 14 Years | 988 (89.7%) | 641 (98.9%) |
| 15 Years | 376 (100.0%) | 359 (97.6%) |
| 16 and 17 Years | 537 (100.0%) | 512 (88.9%) |
| 18 to 24 Years | 1,835 (90.8%) | 1,857 (81.7%) |
| 25 to 34 Years | 2,834 (93.0%) | 2,413 (93.7%) |
| 35 to 44 Years | 2,116 (94.5%) | 1,988 (90.8%) |
| 45 to 54 Years | 1,682 (97.0%) | 1,471 (97.1%) |
| 55 to 64 Years | 1,214 (97.0%) | 1,220 (94.2%) |
| 65 to 74 Years | 764 (92.8%) | 984 (95.6%) |
| 75 Years and over | 578 (95.2%) | 738 (93.1%) |
| Total | 16,139 (93.9%) | 15,186 (92.4%) |
Income Below Poverty Among Married-Couple Families in American Fork
The poverty statistics for married-couple families in American Fork show that 2.3% or 168 of the total 7,221 families live below the poverty line. Families with 5 or more children have the highest poverty rate of 5.0%, comprising of 13 families. On the other hand, families with 3 or 4 children have the lowest poverty rate of 0.3%, which includes 4 families.
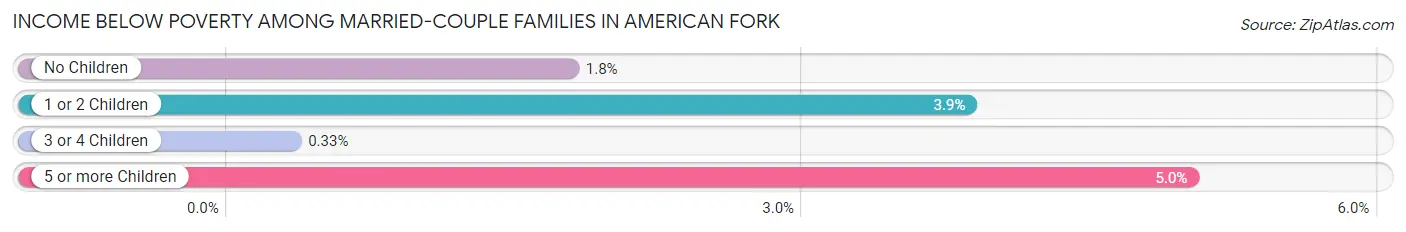
| Children | Above Poverty | Below Poverty |
| No Children | 3,361 (98.2%) | 61 (1.8%) |
| 1 or 2 Children | 2,243 (96.1%) | 90 (3.9%) |
| 3 or 4 Children | 1,203 (99.7%) | 4 (0.3%) |
| 5 or more Children | 246 (95.0%) | 13 (5.0%) |
| Total | 7,053 (97.7%) | 168 (2.3%) |
Income Below Poverty Among Single-Parent Households in American Fork
According to the poverty data in American Fork, 9.9% or 31 single-father households and 24.0% or 218 single-mother households are living below the poverty line. Among single-father households, those with 1 or 2 children have the highest poverty rate, with 31 households (18.9%) experiencing poverty. Likewise, among single-mother households, those with 3 or 4 children have the highest poverty rate, with 36 households (37.5%) falling below the poverty line.
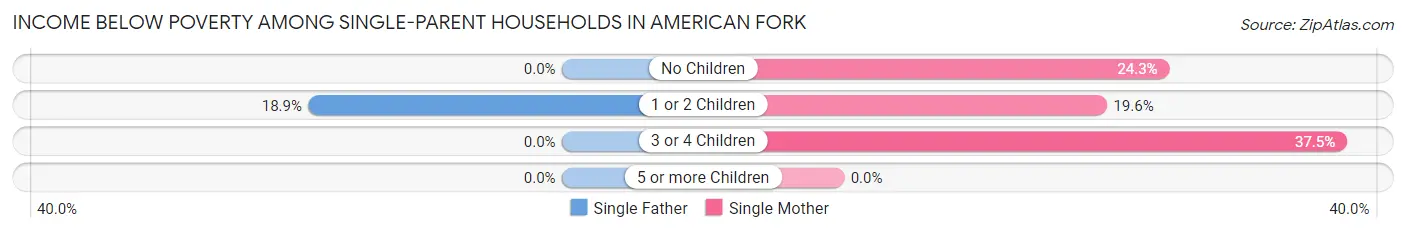
| Children | Single Father | Single Mother |
| No Children | 0 (0.0%) | 117 (24.3%) |
| 1 or 2 Children | 31 (18.9%) | 65 (19.6%) |
| 3 or 4 Children | 0 (0.0%) | 36 (37.5%) |
| 5 or more Children | 0 (0.0%) | 0 (0.0%) |
| Total | 31 (9.9%) | 218 (24.0%) |
Income Below Poverty Among Married-Couple vs Single-Parent Households in American Fork
The poverty data for American Fork shows that 168 of the married-couple family households (2.3%) and 249 of the single-parent households (20.4%) are living below the poverty level. Within the married-couple family households, those with 5 or more children have the highest poverty rate, with 13 households (5.0%) falling below the poverty line. Among the single-parent households, those with 3 or 4 children have the highest poverty rate, with 36 household (34.9%) living below poverty.
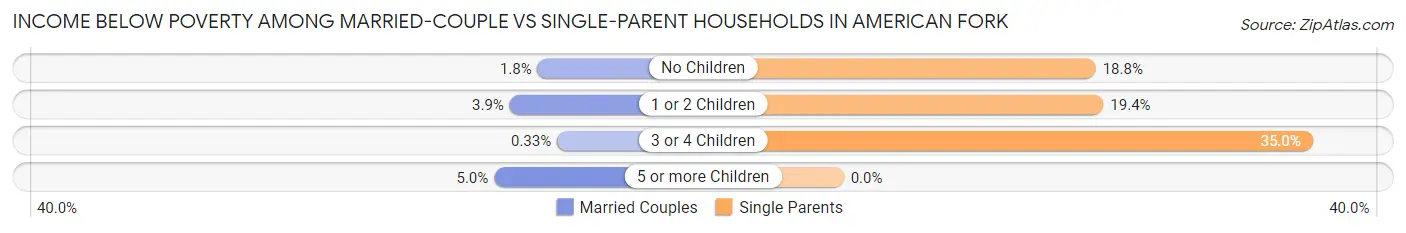
| Children | Married-Couple Families | Single-Parent Households |
| No Children | 61 (1.8%) | 117 (18.8%) |
| 1 or 2 Children | 90 (3.9%) | 96 (19.4%) |
| 3 or 4 Children | 4 (0.3%) | 36 (34.9%) |
| 5 or more Children | 13 (5.0%) | 0 (0.0%) |
| Total | 168 (2.3%) | 249 (20.4%) |
Race in American Fork
The most populous races in American Fork are White / Caucasian (28,953 | 85.2%), Hispanic or Latino (3,365 | 9.9%), and Two or more Races (2,371 | 7.0%).
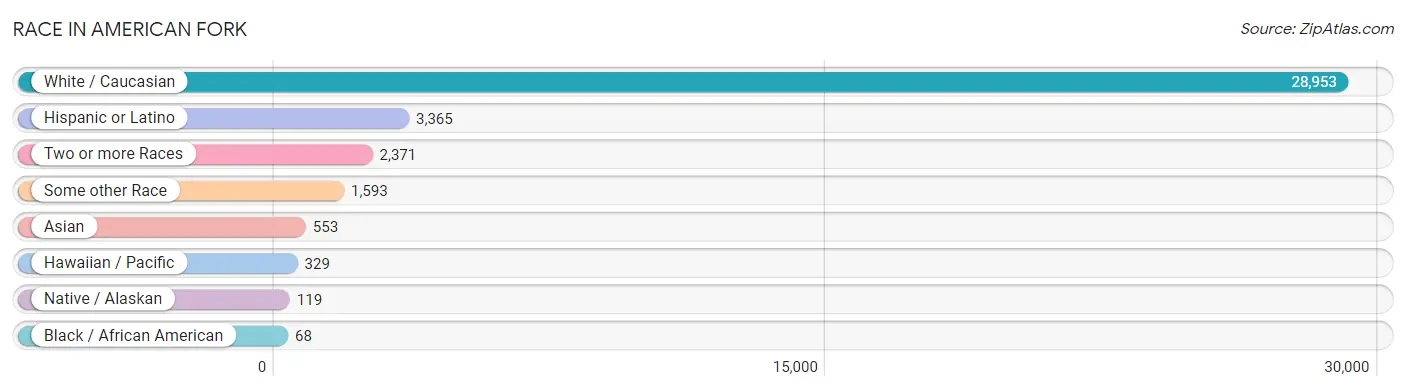
| Race | # Population | % Population |
| Asian | 553 | 1.6% |
| Black / African American | 68 | 0.2% |
| Hawaiian / Pacific | 329 | 1.0% |
| Hispanic or Latino | 3,365 | 9.9% |
| Native / Alaskan | 119 | 0.4% |
| White / Caucasian | 28,953 | 85.2% |
| Two or more Races | 2,371 | 7.0% |
| Some other Race | 1,593 | 4.7% |
| Total | 33,986 | 100.0% |
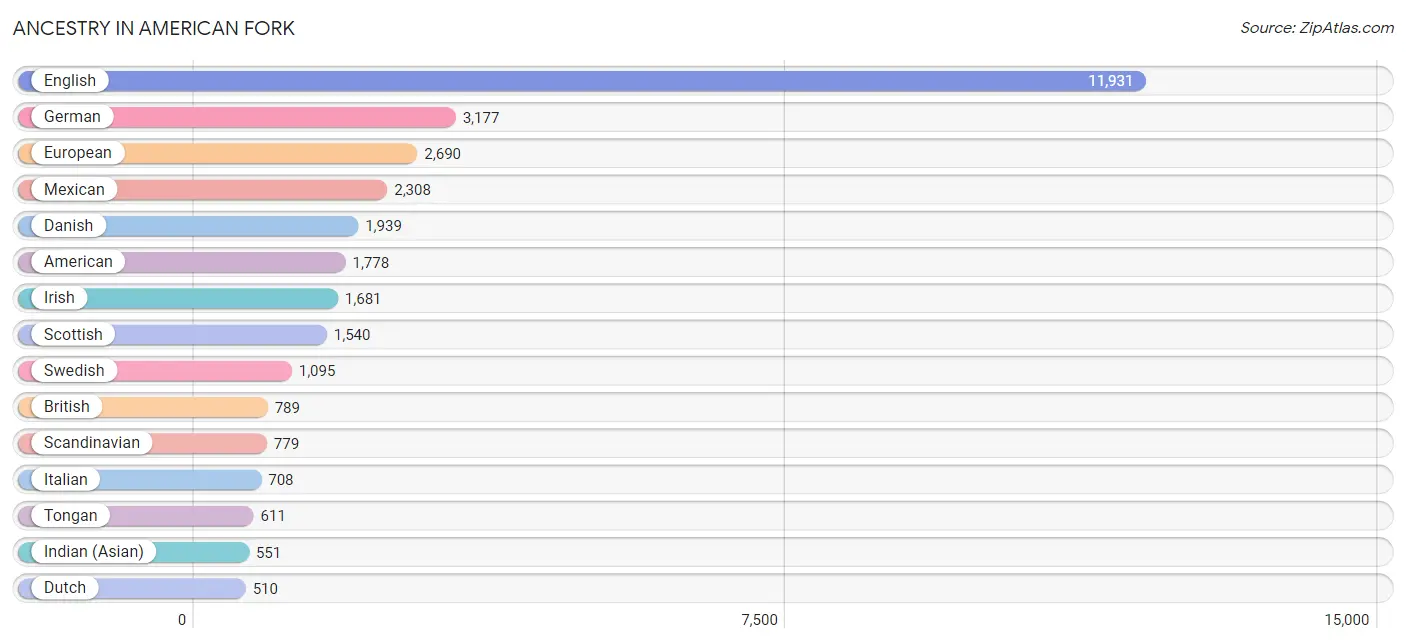
Ancestry in American Fork
The most populous ancestries reported in American Fork are English (11,931 | 35.1%), German (3,177 | 9.3%), European (2,690 | 7.9%), Mexican (2,308 | 6.8%), and Danish (1,939 | 5.7%), together accounting for 64.9% of all American Fork residents.
| Ancestry | # Population | % Population |
| African | 38 | 0.1% |
| American | 1,778 | 5.2% |
| Argentinean | 10 | 0.0% |
| Armenian | 2 | 0.0% |
| Austrian | 22 | 0.1% |
| Bangladeshi | 14 | 0.0% |
| Basque | 21 | 0.1% |
| Belgian | 14 | 0.0% |
| Bhutanese | 334 | 1.0% |
| Bolivian | 8 | 0.0% |
| Brazilian | 97 | 0.3% |
| British | 789 | 2.3% |
| Burmese | 115 | 0.3% |
| Canadian | 123 | 0.4% |
| Central American | 446 | 1.3% |
| Central American Indian | 72 | 0.2% |
| Cherokee | 11 | 0.0% |
| Chilean | 161 | 0.5% |
| Chippewa | 12 | 0.0% |
| Colombian | 99 | 0.3% |
| Croatian | 12 | 0.0% |
| Czech | 9 | 0.0% |
| Danish | 1,939 | 5.7% |
| Dutch | 510 | 1.5% |
| Eastern European | 190 | 0.6% |
| Ecuadorian | 59 | 0.2% |
| English | 11,931 | 35.1% |
| European | 2,690 | 7.9% |
| Filipino | 8 | 0.0% |
| Finnish | 51 | 0.2% |
| French | 383 | 1.1% |
| French Canadian | 175 | 0.5% |
| German | 3,177 | 9.3% |
| Greek | 118 | 0.4% |
| Guatemalan | 368 | 1.1% |
| Honduran | 18 | 0.1% |
| Hopi | 1 | 0.0% |
| Hungarian | 157 | 0.5% |
| Icelander | 102 | 0.3% |
| Indian (Asian) | 551 | 1.6% |
| Irish | 1,681 | 5.0% |
| Italian | 708 | 2.1% |
| Korean | 379 | 1.1% |
| Malaysian | 69 | 0.2% |
| Mexican | 2,308 | 6.8% |
| Mexican American Indian | 39 | 0.1% |
| Mongolian | 27 | 0.1% |
| Native Hawaiian | 401 | 1.2% |
| Navajo | 44 | 0.1% |
| New Zealander | 26 | 0.1% |
| Northern European | 300 | 0.9% |
| Norwegian | 446 | 1.3% |
| Pakistani | 44 | 0.1% |
| Peruvian | 64 | 0.2% |
| Polish | 105 | 0.3% |
| Portuguese | 244 | 0.7% |
| Potawatomi | 7 | 0.0% |
| Puerto Rican | 37 | 0.1% |
| Russian | 8 | 0.0% |
| Salvadoran | 60 | 0.2% |
| Samoan | 114 | 0.3% |
| Scandinavian | 779 | 2.3% |
| Scotch-Irish | 293 | 0.9% |
| Scottish | 1,540 | 4.5% |
| Slavic | 32 | 0.1% |
| South American | 439 | 1.3% |
| South American Indian | 46 | 0.1% |
| Spaniard | 81 | 0.2% |
| Spanish | 11 | 0.0% |
| Subsaharan African | 38 | 0.1% |
| Swedish | 1,095 | 3.2% |
| Swiss | 168 | 0.5% |
| Thai | 344 | 1.0% |
| Tongan | 611 | 1.8% |
| Ute | 1 | 0.0% |
| Venezuelan | 38 | 0.1% |
| Welsh | 489 | 1.4% |
| Yugoslavian | 10 | 0.0% | View All 78 Rows |
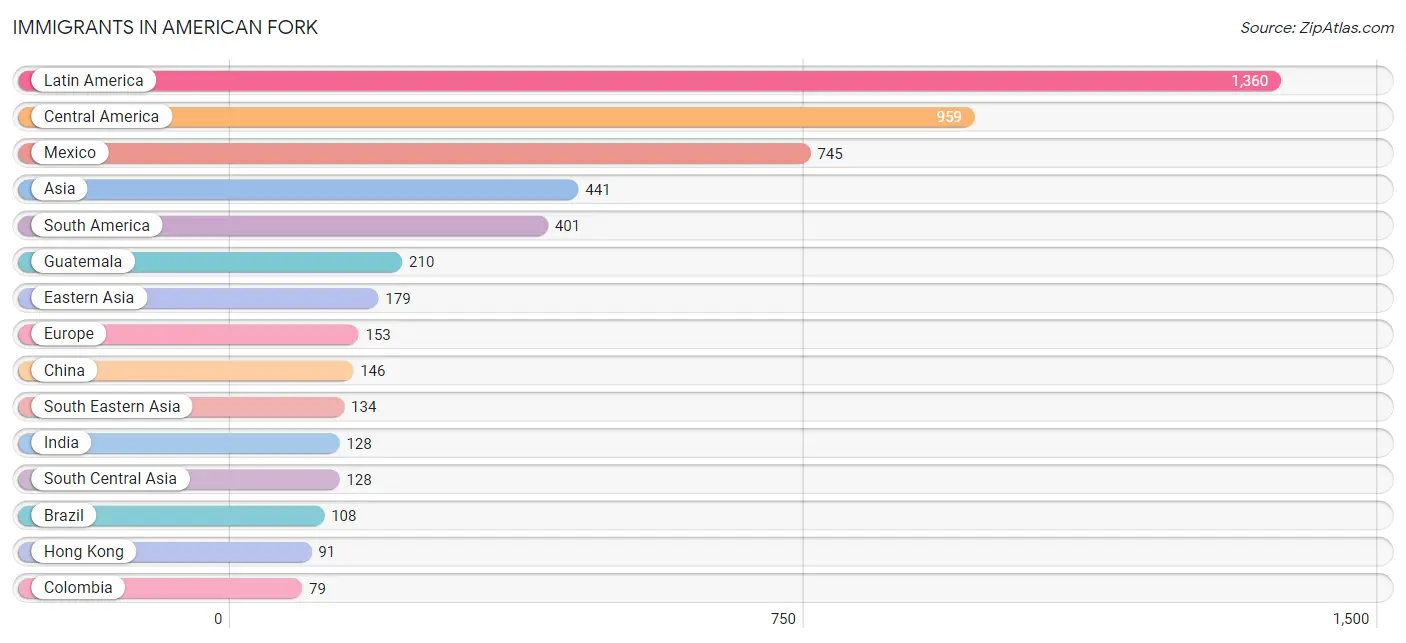
Immigrants in American Fork
The most numerous immigrant groups reported in American Fork came from Latin America (1,360 | 4.0%), Central America (959 | 2.8%), Mexico (745 | 2.2%), Asia (441 | 1.3%), and South America (401 | 1.2%), together accounting for 11.5% of all American Fork residents.
| Immigration Origin | # Population | % Population |
| Africa | 25 | 0.1% |
| Argentina | 23 | 0.1% |
| Asia | 441 | 1.3% |
| Belgium | 7 | 0.0% |
| Brazil | 108 | 0.3% |
| Canada | 73 | 0.2% |
| Central America | 959 | 2.8% |
| Chile | 75 | 0.2% |
| China | 146 | 0.4% |
| Colombia | 79 | 0.2% |
| Eastern Africa | 19 | 0.1% |
| Eastern Asia | 179 | 0.5% |
| Eastern Europe | 7 | 0.0% |
| Ecuador | 43 | 0.1% |
| El Salvador | 4 | 0.0% |
| England | 8 | 0.0% |
| Europe | 153 | 0.4% |
| Guatemala | 210 | 0.6% |
| Hong Kong | 91 | 0.3% |
| Hungary | 4 | 0.0% |
| India | 128 | 0.4% |
| Japan | 15 | 0.0% |
| Korea | 18 | 0.1% |
| Laos | 30 | 0.1% |
| Latin America | 1,360 | 4.0% |
| Malaysia | 32 | 0.1% |
| Mexico | 745 | 2.2% |
| Netherlands | 16 | 0.1% |
| Northern Europe | 44 | 0.1% |
| Oceania | 12 | 0.0% |
| Peru | 50 | 0.2% |
| Philippines | 23 | 0.1% |
| Portugal | 11 | 0.0% |
| Russia | 3 | 0.0% |
| Singapore | 41 | 0.1% |
| South Africa | 6 | 0.0% |
| South America | 401 | 1.2% |
| South Central Asia | 128 | 0.4% |
| South Eastern Asia | 134 | 0.4% |
| Southern Europe | 79 | 0.2% |
| Spain | 68 | 0.2% |
| Thailand | 8 | 0.0% |
| Venezuela | 23 | 0.1% |
| Western Europe | 23 | 0.1% |
| Zimbabwe | 19 | 0.1% | View All 45 Rows |
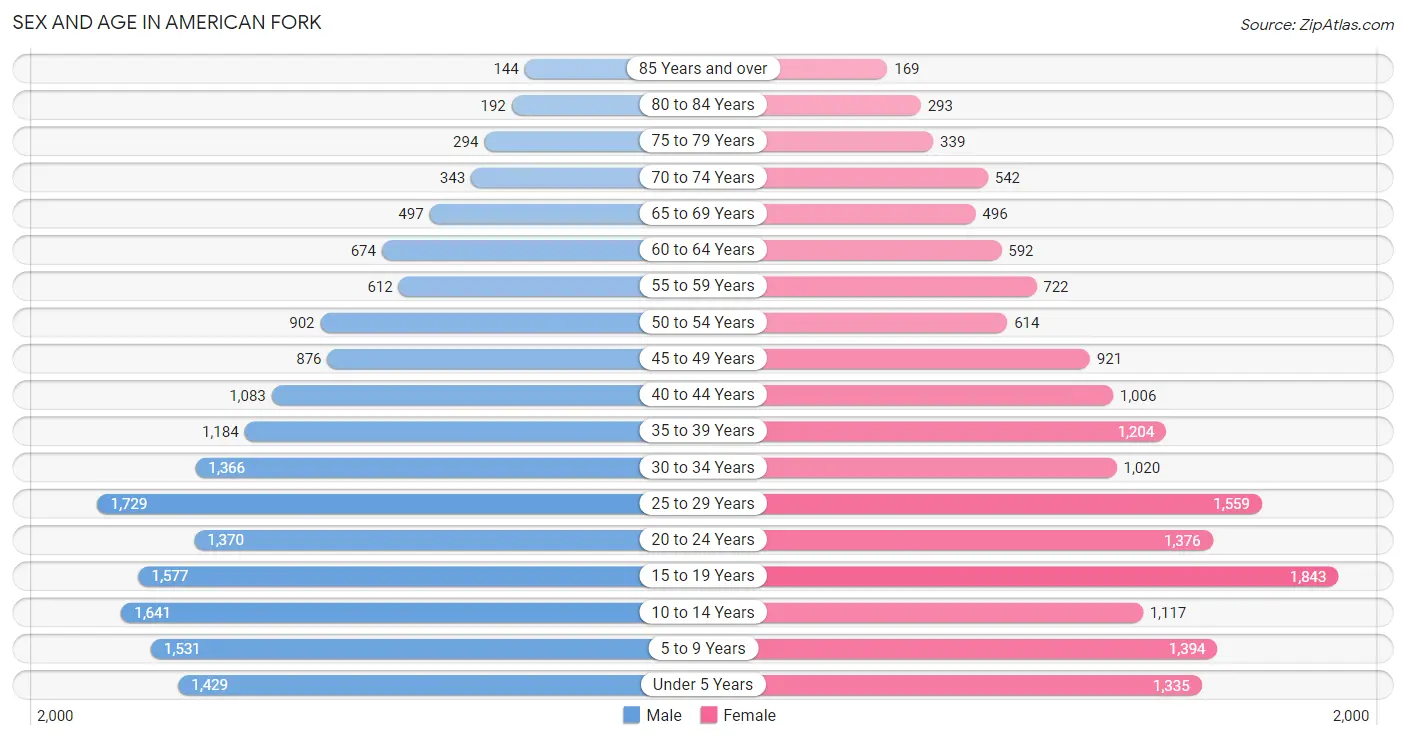
Sex and Age in American Fork
Sex and Age in American Fork
The most populous age groups in American Fork are 25 to 29 Years (1,729 | 9.9%) for men and 15 to 19 Years (1,843 | 11.1%) for women.
| Age Bracket | Male | Female |
| Under 5 Years | 1,429 (8.2%) | 1,335 (8.1%) |
| 5 to 9 Years | 1,531 (8.8%) | 1,394 (8.4%) |
| 10 to 14 Years | 1,641 (9.4%) | 1,117 (6.8%) |
| 15 to 19 Years | 1,577 (9.0%) | 1,843 (11.1%) |
| 20 to 24 Years | 1,370 (7.9%) | 1,376 (8.3%) |
| 25 to 29 Years | 1,729 (9.9%) | 1,559 (9.4%) |
| 30 to 34 Years | 1,366 (7.8%) | 1,020 (6.2%) |
| 35 to 39 Years | 1,184 (6.8%) | 1,204 (7.3%) |
| 40 to 44 Years | 1,083 (6.2%) | 1,006 (6.1%) |
| 45 to 49 Years | 876 (5.0%) | 921 (5.6%) |
| 50 to 54 Years | 902 (5.2%) | 614 (3.7%) |
| 55 to 59 Years | 612 (3.5%) | 722 (4.4%) |
| 60 to 64 Years | 674 (3.9%) | 592 (3.6%) |
| 65 to 69 Years | 497 (2.9%) | 496 (3.0%) |
| 70 to 74 Years | 343 (2.0%) | 542 (3.3%) |
| 75 to 79 Years | 294 (1.7%) | 339 (2.1%) |
| 80 to 84 Years | 192 (1.1%) | 293 (1.8%) |
| 85 Years and over | 144 (0.8%) | 169 (1.0%) |
| Total | 17,444 (100.0%) | 16,542 (100.0%) |
Families and Households in American Fork
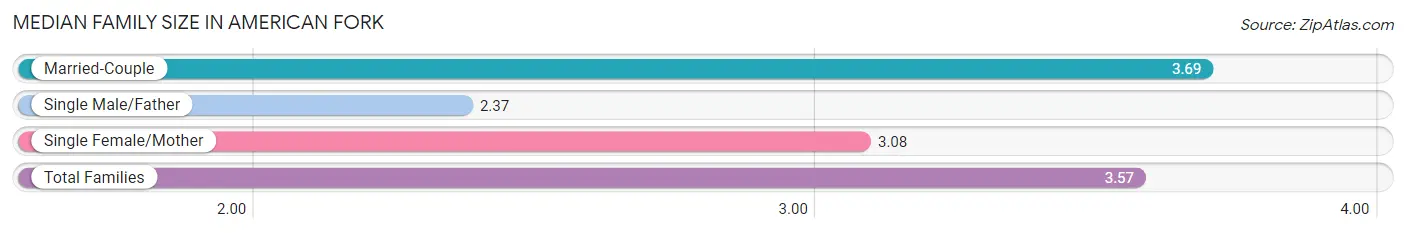
Median Family Size in American Fork
The median family size in American Fork is 3.57 persons per family, with married-couple families (7,221 | 85.5%) accounting for the largest median family size of 3.69 persons per family. On the other hand, single male/father families (312 | 3.7%) represent the smallest median family size with 2.37 persons per family.
| Family Type | # Families | Family Size |
| Married-Couple | 7,221 (85.5%) | 3.69 |
| Single Male/Father | 312 (3.7%) | 2.37 |
| Single Female/Mother | 910 (10.8%) | 3.08 |
| Total Families | 8,443 (100.0%) | 3.57 |
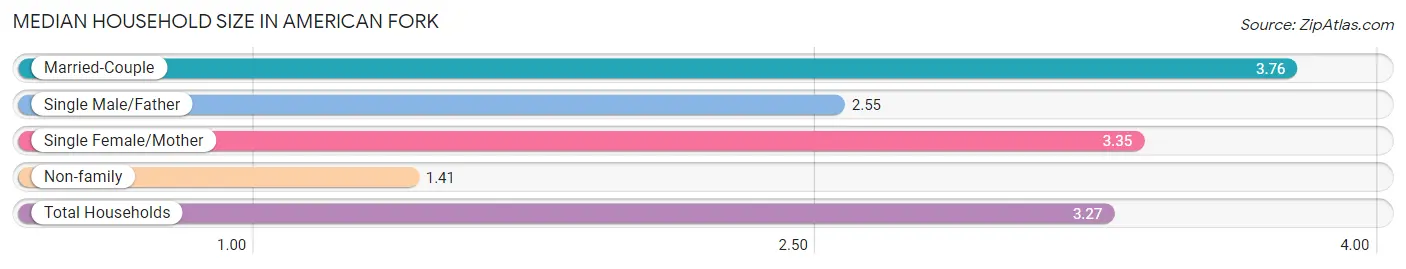
Median Household Size in American Fork
The median household size in American Fork is 3.27 persons per household, with married-couple households (7,221 | 70.5%) accounting for the largest median household size of 3.76 persons per household. non-family households (1,797 | 17.5%) represent the smallest median household size with 1.41 persons per household.
| Household Type | # Households | Household Size |
| Married-Couple | 7,221 (70.5%) | 3.76 |
| Single Male/Father | 312 (3.0%) | 2.55 |
| Single Female/Mother | 910 (8.9%) | 3.35 |
| Non-family | 1,797 (17.5%) | 1.41 |
| Total Households | 10,240 (100.0%) | 3.27 |
Household Size by Marriage Status in American Fork
Out of a total of 10,240 households in American Fork, 8,443 (82.5%) are family households, while 1,797 (17.5%) are nonfamily households. The most numerous type of family households are 2-person households, comprising 3,043, and the most common type of nonfamily households are 1-person households, comprising 1,377.
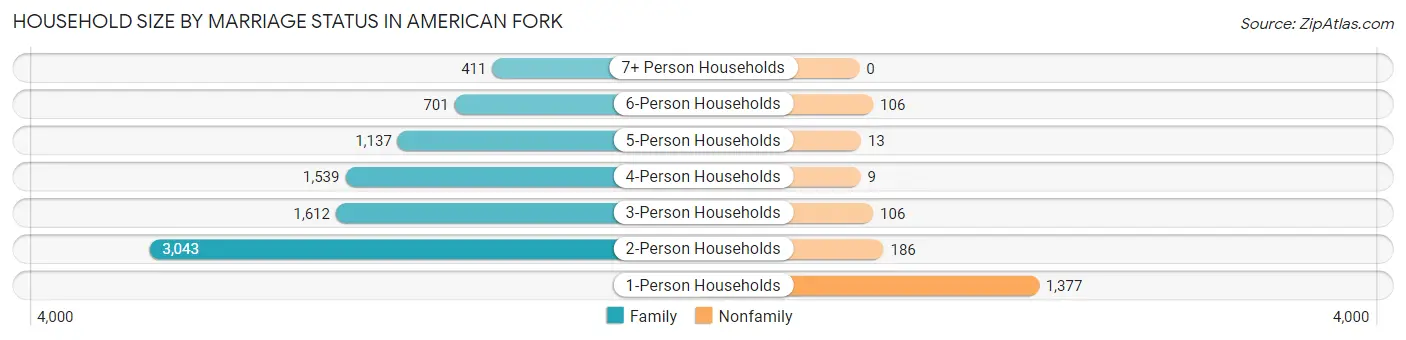
| Household Size | Family Households | Nonfamily Households |
| 1-Person Households | - | 1,377 (13.5%) |
| 2-Person Households | 3,043 (29.7%) | 186 (1.8%) |
| 3-Person Households | 1,612 (15.7%) | 106 (1.0%) |
| 4-Person Households | 1,539 (15.0%) | 9 (0.1%) |
| 5-Person Households | 1,137 (11.1%) | 13 (0.1%) |
| 6-Person Households | 701 (6.9%) | 106 (1.0%) |
| 7+ Person Households | 411 (4.0%) | 0 (0.0%) |
| Total | 8,443 (82.5%) | 1,797 (17.5%) |
Female Fertility in American Fork
Fertility by Age in American Fork
Average fertility rate in American Fork is 75.0 births per 1,000 women. Women in the age bracket of 20 to 34 years have the highest fertility rate with 134.0 births per 1,000 women. Women in the age bracket of 20 to 34 years acount for 77.9% of all women with births.
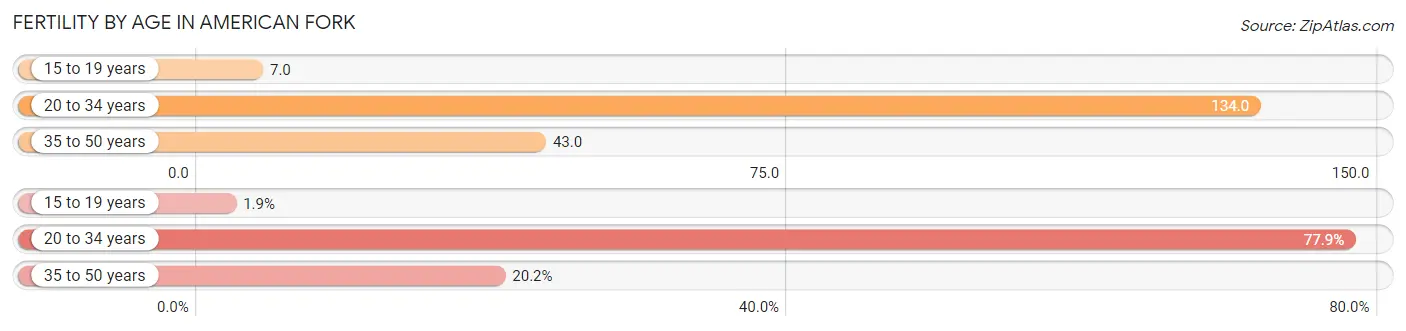
| Age Bracket | Women with Births | Births / 1,000 Women |
| 15 to 19 years | 13 (1.9%) | 7.0 |
| 20 to 34 years | 529 (77.9%) | 134.0 |
| 35 to 50 years | 137 (20.2%) | 43.0 |
| Total | 679 (100.0%) | 75.0 |
Fertility by Age by Marriage Status in American Fork
97.6% of women with births (679) in American Fork are married. The highest percentage of unmarried women with births falls into 15 to 19 years age bracket with 100.0% of them unmarried at the time of birth, while the lowest percentage of unmarried women with births belong to 20 to 34 years age bracket with 0.0% of them unmarried.
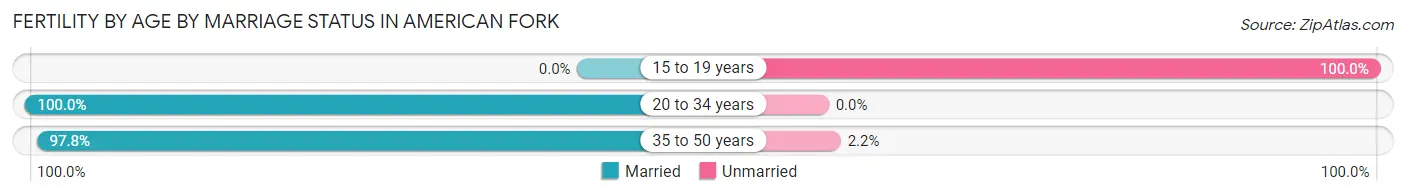
| Age Bracket | Married | Unmarried |
| 15 to 19 years | 0 (0.0%) | 13 (100.0%) |
| 20 to 34 years | 529 (100.0%) | 0 (0.0%) |
| 35 to 50 years | 134 (97.8%) | 3 (2.2%) |
| Total | 663 (97.6%) | 16 (2.4%) |
Fertility by Education in American Fork
Average fertility rate in American Fork is 75.0 births per 1,000 women. Women with the education attainment of bachelor's degree have the highest fertility rate of 138.0 births per 1,000 women, while women with the education attainment of less than high school have the lowest fertility at 10.0 births per 1,000 women. Women with the education attainment of bachelor's degree represent 53.8% of all women with births.
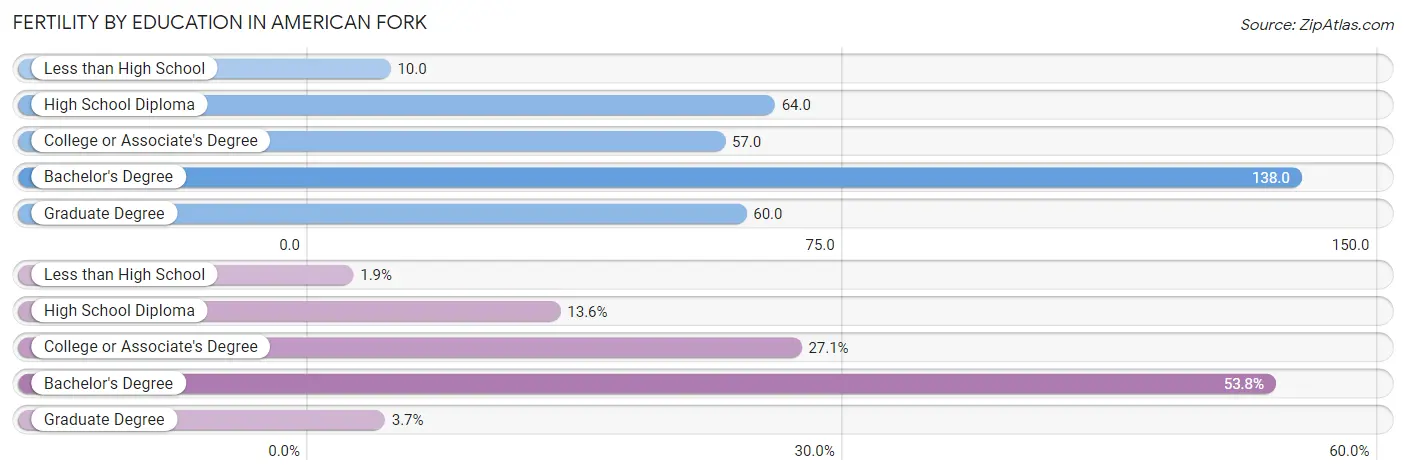
| Educational Attainment | Women with Births | Births / 1,000 Women |
| Less than High School | 13 (1.9%) | 10.0 |
| High School Diploma | 92 (13.6%) | 64.0 |
| College or Associate's Degree | 184 (27.1%) | 57.0 |
| Bachelor's Degree | 365 (53.8%) | 138.0 |
| Graduate Degree | 25 (3.7%) | 60.0 |
| Total | 679 (100.0%) | 75.0 |
Fertility by Education by Marriage Status in American Fork
2.4% of women with births in American Fork are unmarried. Women with the educational attainment of college or associate's degree are most likely to be married with 100.0% of them married at childbirth, while women with the educational attainment of less than high school are least likely to be married with 100.0% of them unmarried at childbirth.
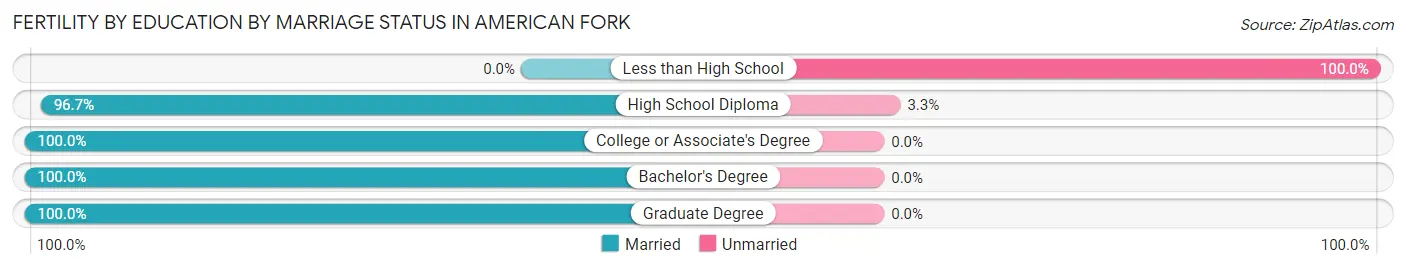
| Educational Attainment | Married | Unmarried |
| Less than High School | 0 (0.0%) | 13 (100.0%) |
| High School Diploma | 89 (96.7%) | 3 (3.3%) |
| College or Associate's Degree | 184 (100.0%) | 0 (0.0%) |
| Bachelor's Degree | 365 (100.0%) | 0 (0.0%) |
| Graduate Degree | 25 (100.0%) | 0 (0.0%) |
| Total | 663 (97.6%) | 16 (2.4%) |
Employment Characteristics in American Fork
Employment by Class of Employer in American Fork
Among the 16,505 employed individuals in American Fork, private company employees (11,711 | 71.0%), not-for-profit organizations (1,199 | 7.3%), and local government employees (1,082 | 6.6%) make up the most common classes of employment.
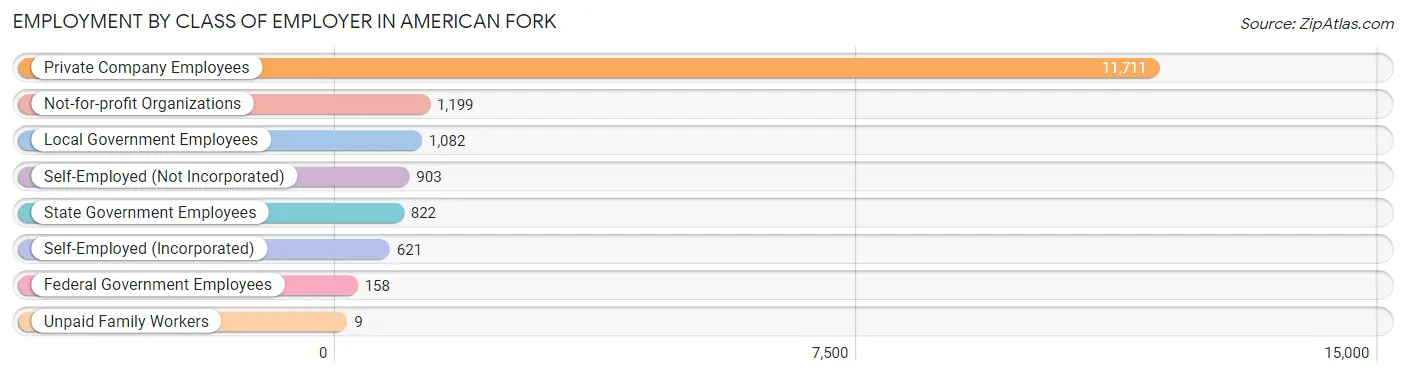
| Employer Class | # Employees | % Employees |
| Private Company Employees | 11,711 | 71.0% |
| Self-Employed (Incorporated) | 621 | 3.8% |
| Self-Employed (Not Incorporated) | 903 | 5.5% |
| Not-for-profit Organizations | 1,199 | 7.3% |
| Local Government Employees | 1,082 | 6.6% |
| State Government Employees | 822 | 5.0% |
| Federal Government Employees | 158 | 1.0% |
| Unpaid Family Workers | 9 | 0.1% |
| Total | 16,505 | 100.0% |
Employment Status by Age in American Fork
According to the labor force statistics for American Fork, out of the total population over 16 years of age (24,795), 70.3% or 17,431 individuals are in the labor force, with 3.3% or 575 of them unemployed. The age group with the highest labor force participation rate is 25 to 29 years, with 87.5% or 2,877 individuals in the labor force. Within the labor force, the 16 to 19 years age range has the highest percentage of unemployed individuals, with 6.7% or 122 of them being unemployed.
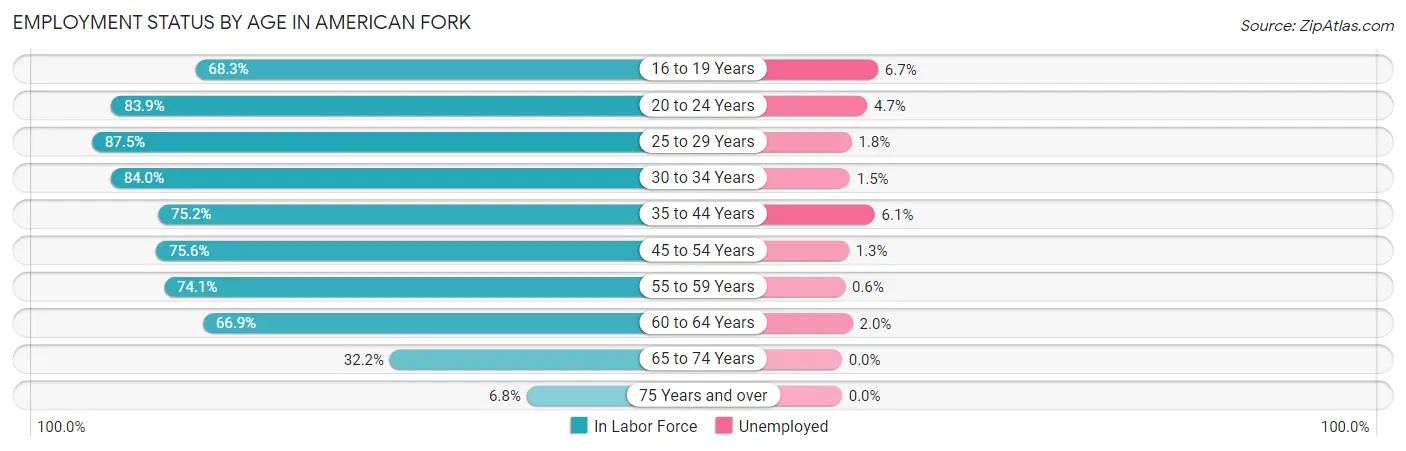
| Age Bracket | In Labor Force | Unemployed |
| 16 to 19 Years | 1,828 (68.3%) | 122 (6.7%) |
| 20 to 24 Years | 2,304 (83.9%) | 108 (4.7%) |
| 25 to 29 Years | 2,877 (87.5%) | 52 (1.8%) |
| 30 to 34 Years | 2,004 (84.0%) | 30 (1.5%) |
| 35 to 44 Years | 3,367 (75.2%) | 205 (6.1%) |
| 45 to 54 Years | 2,505 (75.6%) | 33 (1.3%) |
| 55 to 59 Years | 988 (74.1%) | 6 (0.6%) |
| 60 to 64 Years | 847 (66.9%) | 17 (2.0%) |
| 65 to 74 Years | 605 (32.2%) | 0 (0.0%) |
| 75 Years and over | 97 (6.8%) | 0 (0.0%) |
| Total | 17,431 (70.3%) | 575 (3.3%) |
Employment Status by Educational Attainment in American Fork
According to labor force statistics for American Fork, 78.4% of individuals (12,594) out of the total population between 25 and 64 years of age (16,064) are in the labor force, with 2.7% or 340 of them being unemployed. The group with the highest labor force participation rate are those with the educational attainment of bachelor's degree or higher, with 83.5% or 5,733 individuals in the labor force. Within the labor force, individuals with less than high school education have the highest percentage of unemployment, with 4.6% or 30 of them being unemployed.
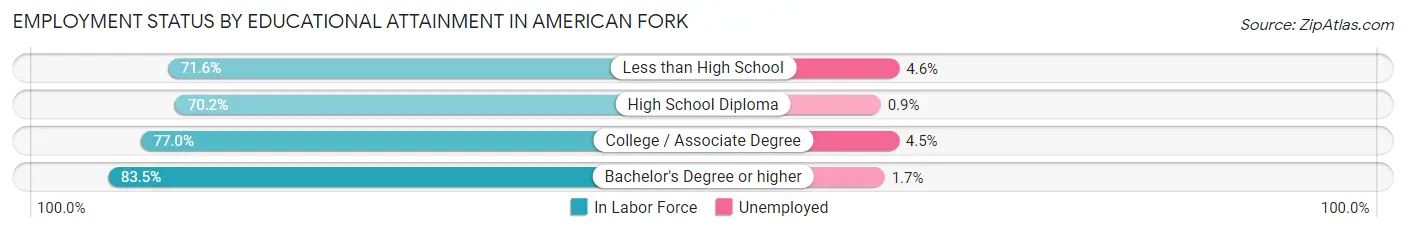
| Educational Attainment | In Labor Force | Unemployed |
| Less than High School | 646 (71.6%) | 41 (4.6%) |
| High School Diploma | 1,819 (70.2%) | 23 (0.9%) |
| College / Associate Degree | 4,393 (77.0%) | 257 (4.5%) |
| Bachelor's Degree or higher | 5,733 (83.5%) | 117 (1.7%) |
| Total | 12,594 (78.4%) | 434 (2.7%) |
Employment Occupations by Sex in American Fork
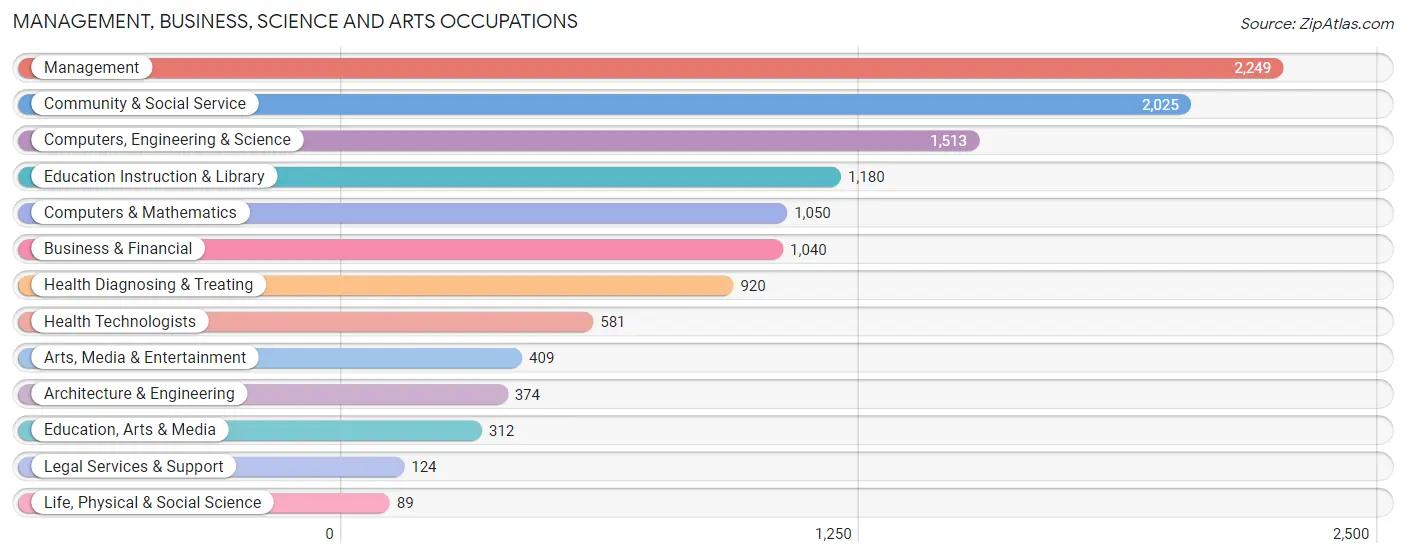
Management, Business, Science and Arts Occupations
The most common Management, Business, Science and Arts occupations in American Fork are Management (2,249 | 13.4%), Community & Social Service (2,025 | 12.0%), Computers, Engineering & Science (1,513 | 9.0%), Education Instruction & Library (1,180 | 7.0%), and Computers & Mathematics (1,050 | 6.2%).
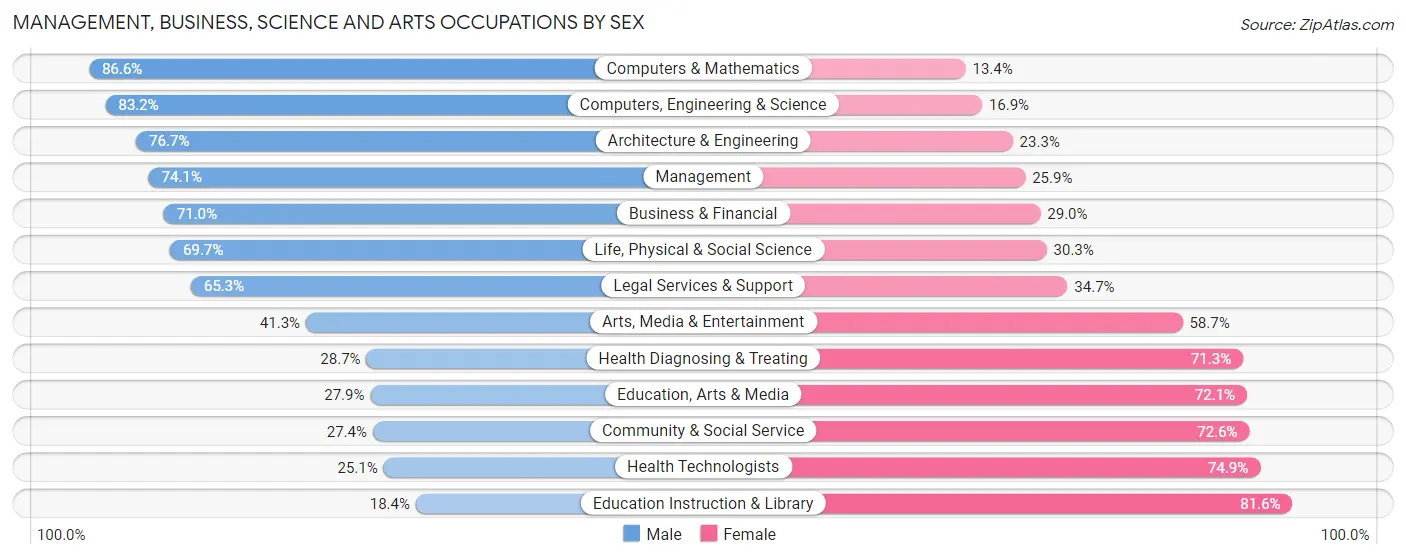
Management, Business, Science and Arts Occupations by Sex
Within the Management, Business, Science and Arts occupations in American Fork, the most male-oriented occupations are Computers & Mathematics (86.6%), Computers, Engineering & Science (83.2%), and Architecture & Engineering (76.7%), while the most female-oriented occupations are Education Instruction & Library (81.6%), Health Technologists (74.9%), and Community & Social Service (72.6%).
| Occupation | Male | Female |
| Management | 1,667 (74.1%) | 582 (25.9%) |
| Business & Financial | 738 (71.0%) | 302 (29.0%) |
| Computers, Engineering & Science | 1,258 (83.2%) | 255 (16.9%) |
| Computers & Mathematics | 909 (86.6%) | 141 (13.4%) |
| Architecture & Engineering | 287 (76.7%) | 87 (23.3%) |
| Life, Physical & Social Science | 62 (69.7%) | 27 (30.3%) |
| Community & Social Service | 554 (27.4%) | 1,471 (72.6%) |
| Education, Arts & Media | 87 (27.9%) | 225 (72.1%) |
| Legal Services & Support | 81 (65.3%) | 43 (34.7%) |
| Education Instruction & Library | 217 (18.4%) | 963 (81.6%) |
| Arts, Media & Entertainment | 169 (41.3%) | 240 (58.7%) |
| Health Diagnosing & Treating | 264 (28.7%) | 656 (71.3%) |
| Health Technologists | 146 (25.1%) | 435 (74.9%) |
| Total (Category) | 4,481 (57.8%) | 3,266 (42.2%) |
| Total (Overall) | 9,549 (56.8%) | 7,260 (43.2%) |
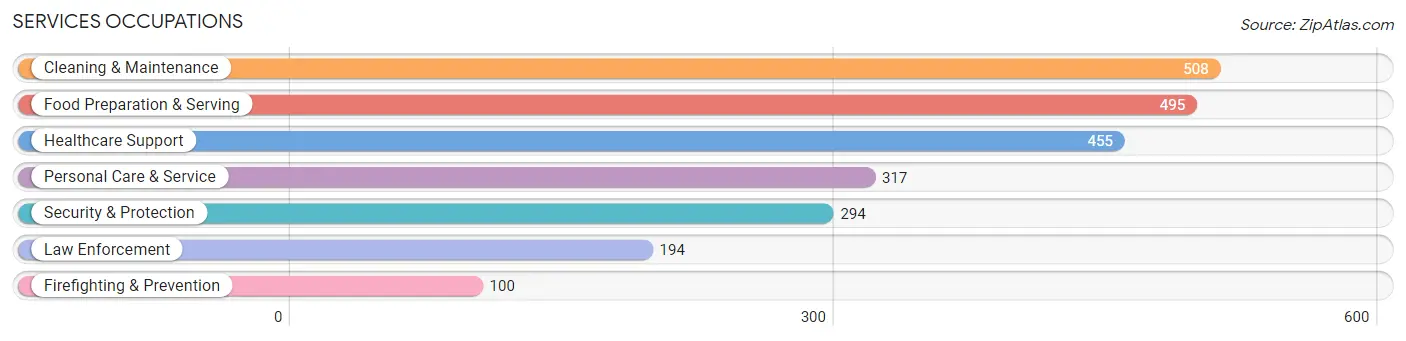
Services Occupations
The most common Services occupations in American Fork are Cleaning & Maintenance (508 | 3.0%), Food Preparation & Serving (495 | 2.9%), Healthcare Support (455 | 2.7%), Personal Care & Service (317 | 1.9%), and Security & Protection (294 | 1.8%).
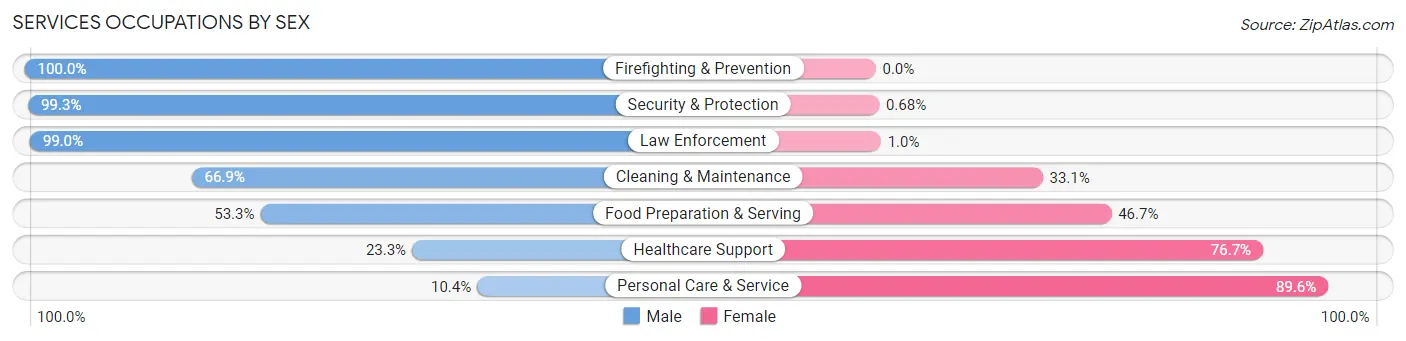
Services Occupations by Sex
Within the Services occupations in American Fork, the most male-oriented occupations are Firefighting & Prevention (100.0%), Security & Protection (99.3%), and Law Enforcement (99.0%), while the most female-oriented occupations are Personal Care & Service (89.6%), Healthcare Support (76.7%), and Food Preparation & Serving (46.7%).
| Occupation | Male | Female |
| Healthcare Support | 106 (23.3%) | 349 (76.7%) |
| Security & Protection | 292 (99.3%) | 2 (0.7%) |
| Firefighting & Prevention | 100 (100.0%) | 0 (0.0%) |
| Law Enforcement | 192 (99.0%) | 2 (1.0%) |
| Food Preparation & Serving | 264 (53.3%) | 231 (46.7%) |
| Cleaning & Maintenance | 340 (66.9%) | 168 (33.1%) |
| Personal Care & Service | 33 (10.4%) | 284 (89.6%) |
| Total (Category) | 1,035 (50.0%) | 1,034 (50.0%) |
| Total (Overall) | 9,549 (56.8%) | 7,260 (43.2%) |
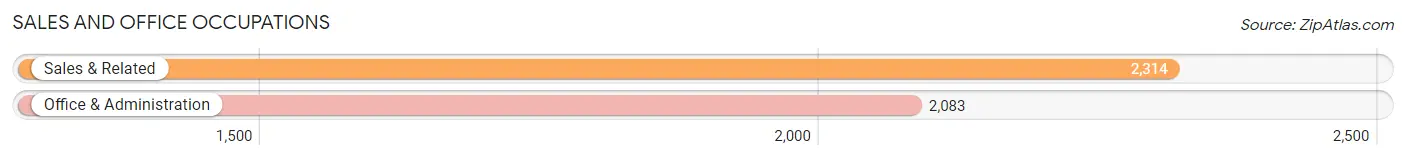
Sales and Office Occupations
The most common Sales and Office occupations in American Fork are Sales & Related (2,314 | 13.8%), and Office & Administration (2,083 | 12.4%).
Sales and Office Occupations by Sex
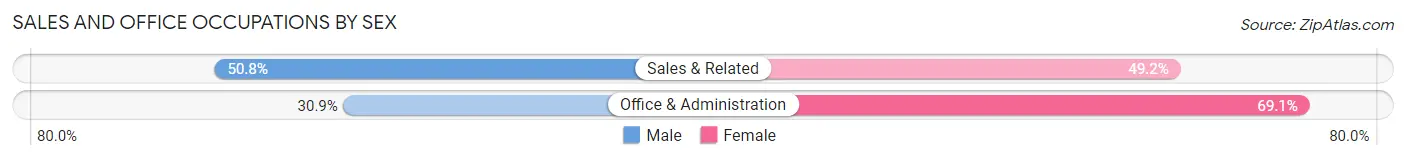
| Occupation | Male | Female |
| Sales & Related | 1,175 (50.8%) | 1,139 (49.2%) |
| Office & Administration | 644 (30.9%) | 1,439 (69.1%) |
| Total (Category) | 1,819 (41.4%) | 2,578 (58.6%) |
| Total (Overall) | 9,549 (56.8%) | 7,260 (43.2%) |
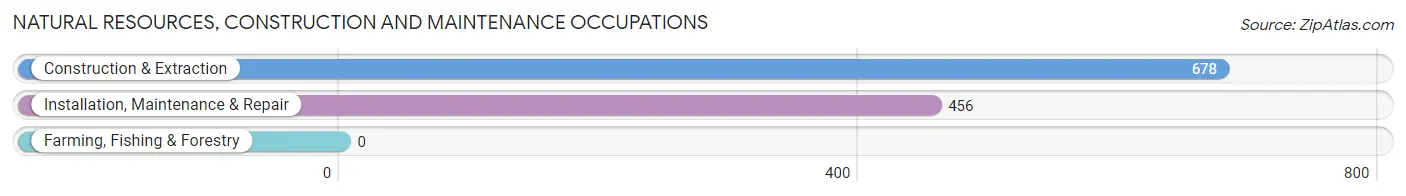
Natural Resources, Construction and Maintenance Occupations
The most common Natural Resources, Construction and Maintenance occupations in American Fork are Construction & Extraction (678 | 4.0%), and Installation, Maintenance & Repair (456 | 2.7%).
Natural Resources, Construction and Maintenance Occupations by Sex
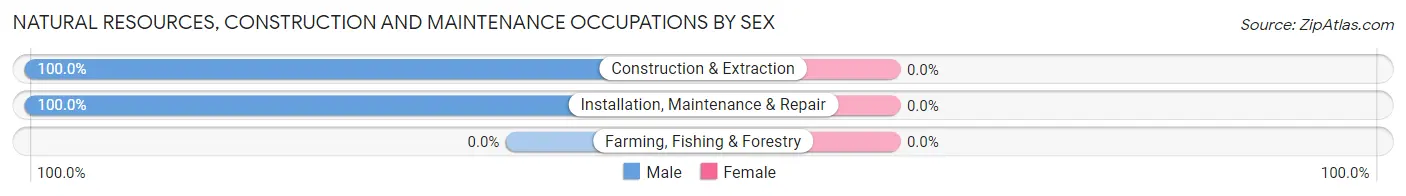
| Occupation | Male | Female |
| Farming, Fishing & Forestry | 0 (0.0%) | 0 (0.0%) |
| Construction & Extraction | 678 (100.0%) | 0 (0.0%) |
| Installation, Maintenance & Repair | 456 (100.0%) | 0 (0.0%) |
| Total (Category) | 1,134 (100.0%) | 0 (0.0%) |
| Total (Overall) | 9,549 (56.8%) | 7,260 (43.2%) |
Production, Transportation and Moving Occupations
The most common Production, Transportation and Moving occupations in American Fork are Production (755 | 4.5%), Material Moving (451 | 2.7%), and Transportation (256 | 1.5%).
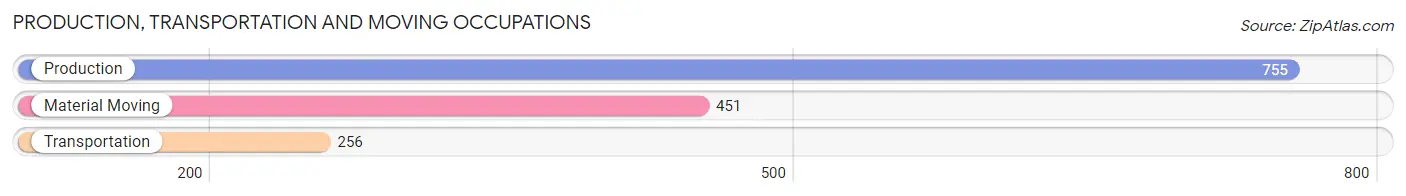
Production, Transportation and Moving Occupations by Sex
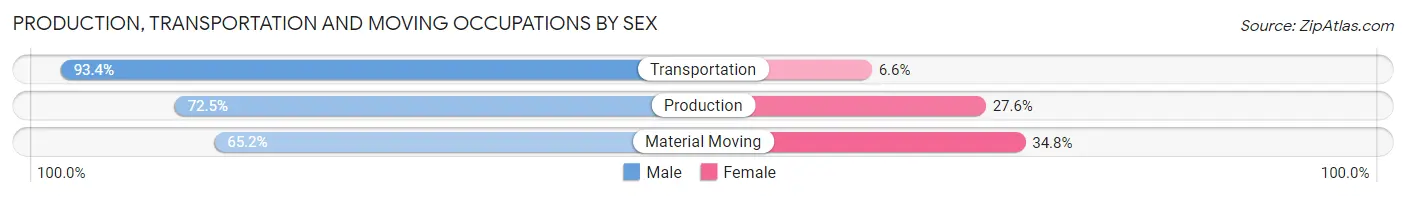
| Occupation | Male | Female |
| Production | 547 (72.5%) | 208 (27.6%) |
| Transportation | 239 (93.4%) | 17 (6.6%) |
| Material Moving | 294 (65.2%) | 157 (34.8%) |
| Total (Category) | 1,080 (73.9%) | 382 (26.1%) |
| Total (Overall) | 9,549 (56.8%) | 7,260 (43.2%) |
Employment Industries by Sex in American Fork
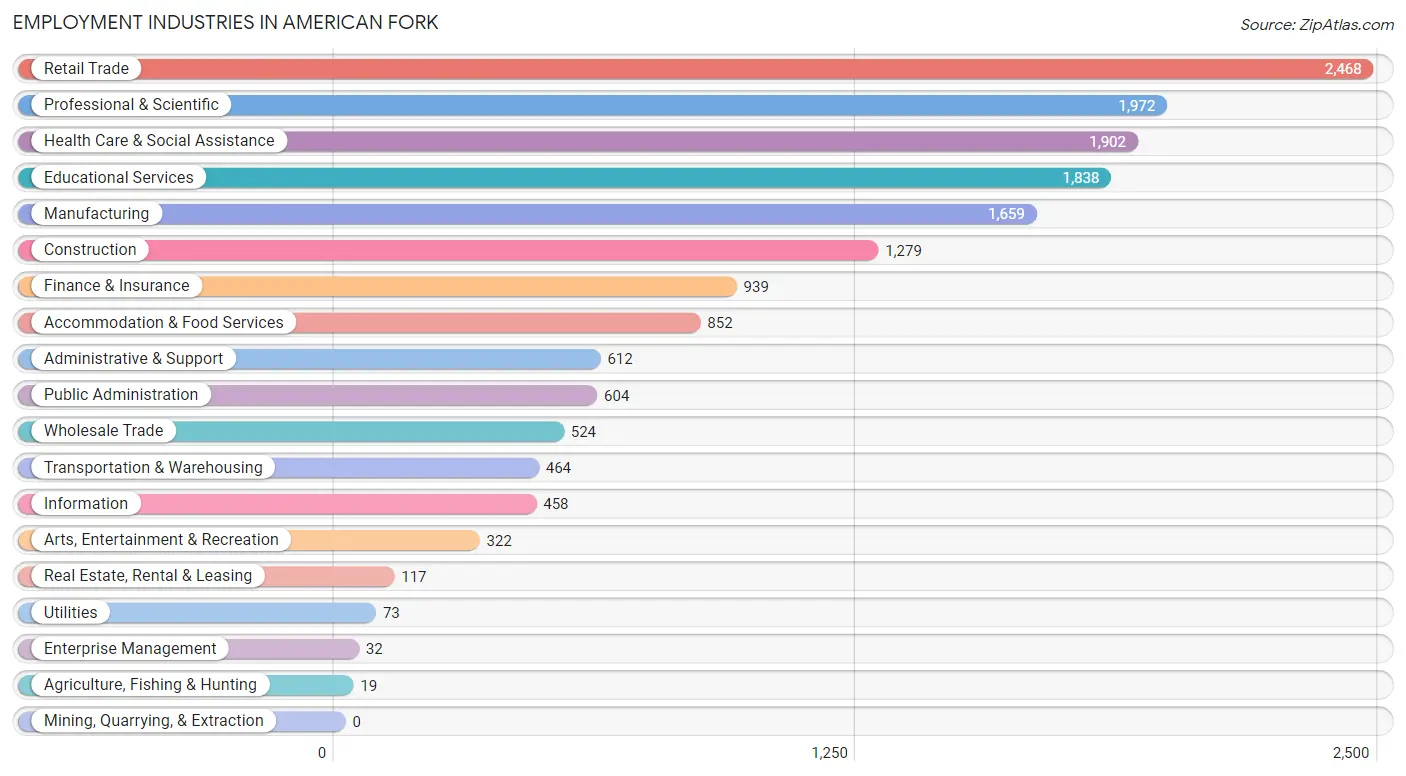
Employment Industries in American Fork
The major employment industries in American Fork include Retail Trade (2,468 | 14.7%), Professional & Scientific (1,972 | 11.7%), Health Care & Social Assistance (1,902 | 11.3%), Educational Services (1,838 | 10.9%), and Manufacturing (1,659 | 9.9%).
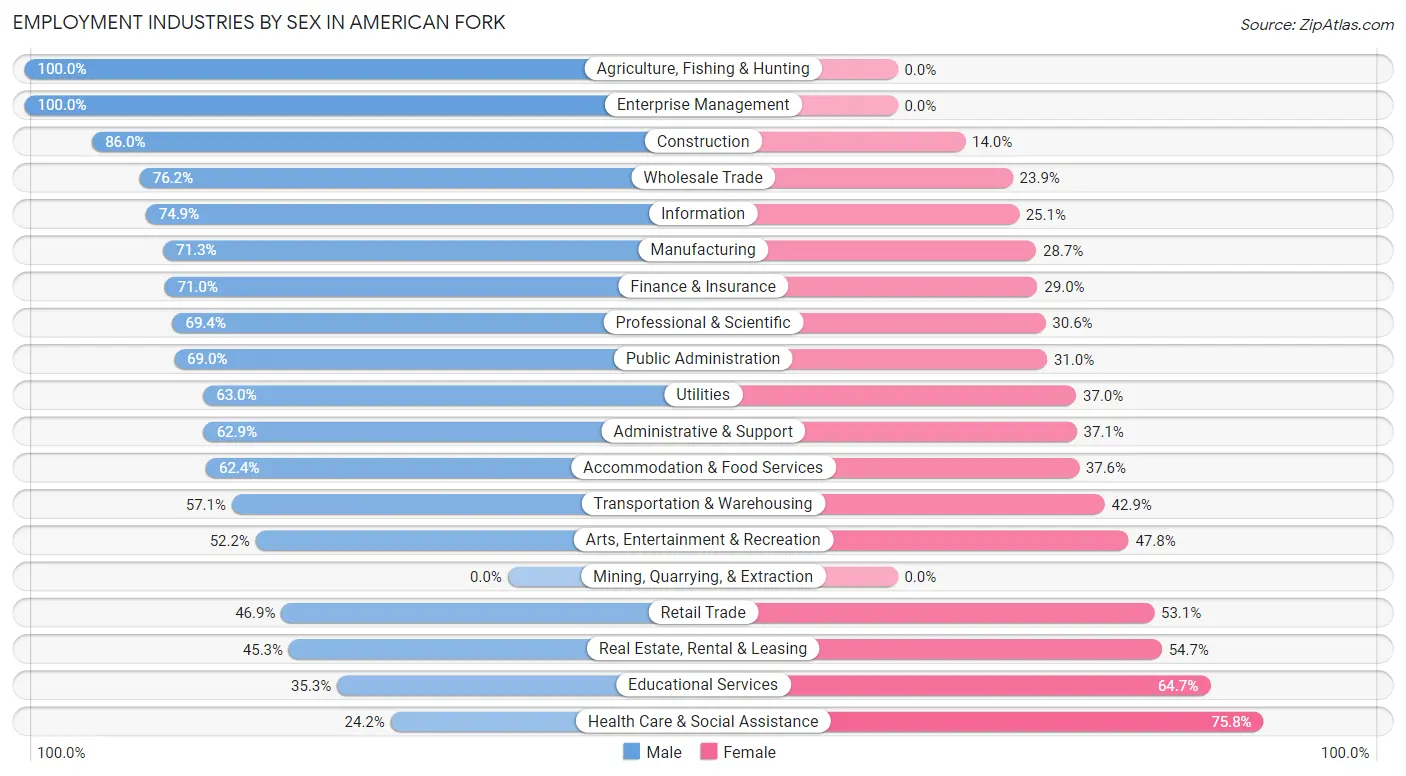
Employment Industries by Sex in American Fork
The American Fork industries that see more men than women are Agriculture, Fishing & Hunting (100.0%), Enterprise Management (100.0%), and Construction (86.0%), whereas the industries that tend to have a higher number of women are Health Care & Social Assistance (75.8%), Educational Services (64.7%), and Real Estate, Rental & Leasing (54.7%).
| Industry | Male | Female |
| Agriculture, Fishing & Hunting | 19 (100.0%) | 0 (0.0%) |
| Mining, Quarrying, & Extraction | 0 (0.0%) | 0 (0.0%) |
| Construction | 1,100 (86.0%) | 179 (14.0%) |
| Manufacturing | 1,183 (71.3%) | 476 (28.7%) |
| Wholesale Trade | 399 (76.1%) | 125 (23.8%) |
| Retail Trade | 1,157 (46.9%) | 1,311 (53.1%) |
| Transportation & Warehousing | 265 (57.1%) | 199 (42.9%) |
| Utilities | 46 (63.0%) | 27 (37.0%) |
| Information | 343 (74.9%) | 115 (25.1%) |
| Finance & Insurance | 667 (71.0%) | 272 (29.0%) |
| Real Estate, Rental & Leasing | 53 (45.3%) | 64 (54.7%) |
| Professional & Scientific | 1,368 (69.4%) | 604 (30.6%) |
| Enterprise Management | 32 (100.0%) | 0 (0.0%) |
| Administrative & Support | 385 (62.9%) | 227 (37.1%) |
| Educational Services | 649 (35.3%) | 1,189 (64.7%) |
| Health Care & Social Assistance | 461 (24.2%) | 1,441 (75.8%) |
| Arts, Entertainment & Recreation | 168 (52.2%) | 154 (47.8%) |
| Accommodation & Food Services | 532 (62.4%) | 320 (37.6%) |
| Public Administration | 417 (69.0%) | 187 (31.0%) |
| Total | 9,549 (56.8%) | 7,260 (43.2%) |
Education in American Fork
School Enrollment in American Fork
The most common levels of schooling among the 11,123 students in American Fork are high school (2,669 | 24.0%), college / undergraduate (2,645 | 23.8%), and elementary school (2,276 | 20.5%).
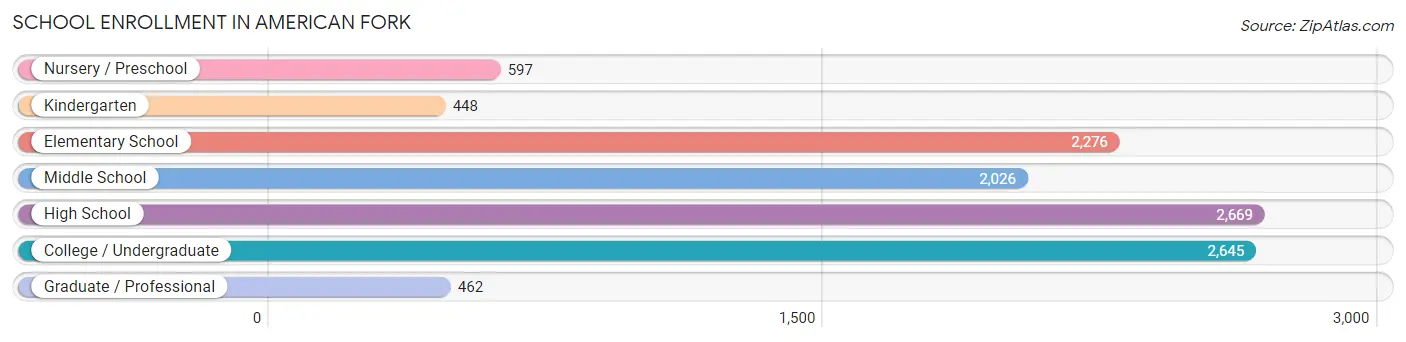
| School Level | # Students | % Students |
| Nursery / Preschool | 597 | 5.4% |
| Kindergarten | 448 | 4.0% |
| Elementary School | 2,276 | 20.5% |
| Middle School | 2,026 | 18.2% |
| High School | 2,669 | 24.0% |
| College / Undergraduate | 2,645 | 23.8% |
| Graduate / Professional | 462 | 4.2% |
| Total | 11,123 | 100.0% |
School Enrollment by Age by Funding Source in American Fork
Out of a total of 11,123 students who are enrolled in schools in American Fork, 1,735 (15.6%) attend a private institution, while the remaining 9,388 (84.4%) are enrolled in public schools. The age group of 35 years and over has the highest likelihood of being enrolled in private schools, with 233 (49.8% in the age bracket) enrolled. Conversely, the age group of 18 to 19 year olds has the lowest likelihood of being enrolled in a private school, with 1,013 (94.0% in the age bracket) attending a public institution.
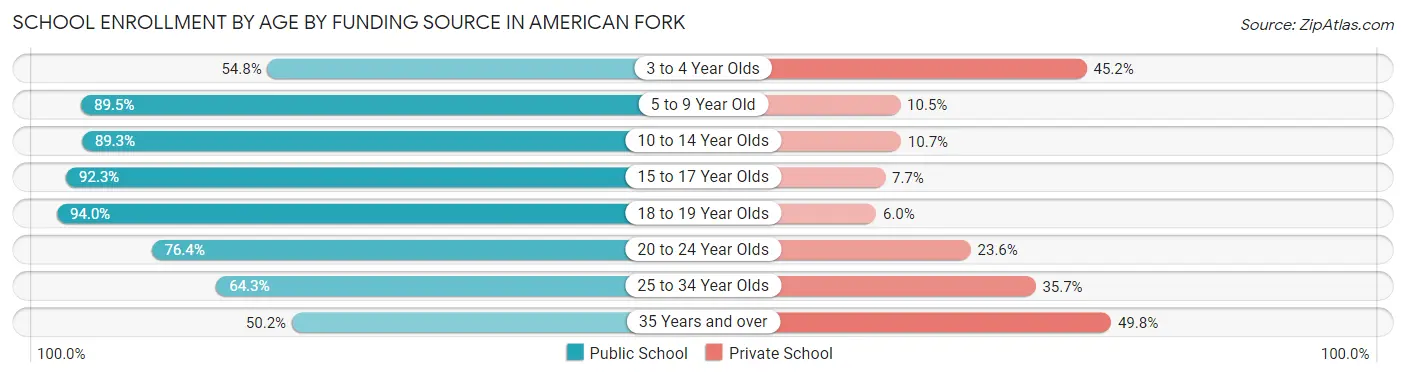
| Age Bracket | Public School | Private School |
| 3 to 4 Year Olds | 190 (54.8%) | 157 (45.2%) |
| 5 to 9 Year Old | 2,466 (89.5%) | 290 (10.5%) |
| 10 to 14 Year Olds | 2,440 (89.3%) | 291 (10.7%) |
| 15 to 17 Year Olds | 1,691 (92.3%) | 141 (7.7%) |
| 18 to 19 Year Olds | 1,013 (94.0%) | 65 (6.0%) |
| 20 to 24 Year Olds | 756 (76.4%) | 234 (23.6%) |
| 25 to 34 Year Olds | 592 (64.3%) | 329 (35.7%) |
| 35 Years and over | 235 (50.2%) | 233 (49.8%) |
| Total | 9,388 (84.4%) | 1,735 (15.6%) |
Educational Attainment by Field of Study in American Fork
Business (1,498 | 17.8%), education (1,148 | 13.7%), science & technology (839 | 10.0%), arts & humanities (785 | 9.3%), and computers & mathematics (601 | 7.2%) are the most common fields of study among 8,394 individuals in American Fork who have obtained a bachelor's degree or higher.
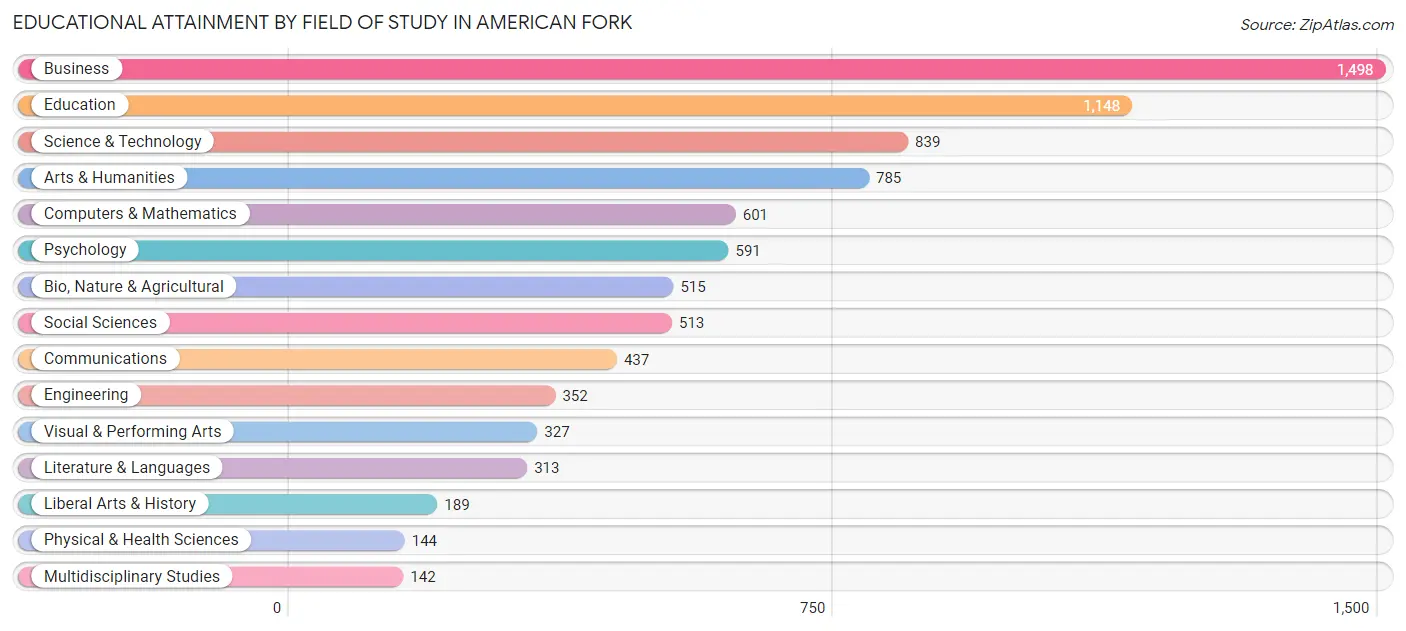
| Field of Study | # Graduates | % Graduates |
| Computers & Mathematics | 601 | 7.2% |
| Bio, Nature & Agricultural | 515 | 6.1% |
| Physical & Health Sciences | 144 | 1.7% |
| Psychology | 591 | 7.0% |
| Social Sciences | 513 | 6.1% |
| Engineering | 352 | 4.2% |
| Multidisciplinary Studies | 142 | 1.7% |
| Science & Technology | 839 | 10.0% |
| Business | 1,498 | 17.8% |
| Education | 1,148 | 13.7% |
| Literature & Languages | 313 | 3.7% |
| Liberal Arts & History | 189 | 2.2% |
| Visual & Performing Arts | 327 | 3.9% |
| Communications | 437 | 5.2% |
| Arts & Humanities | 785 | 9.3% |
| Total | 8,394 | 100.0% |
Transportation & Commute in American Fork
Vehicle Availability by Sex in American Fork
The most prevalent vehicle ownership categories in American Fork are males with 2 vehicles (3,560, accounting for 37.9%) and females with 2 vehicles (2,658, making up 50.1%).
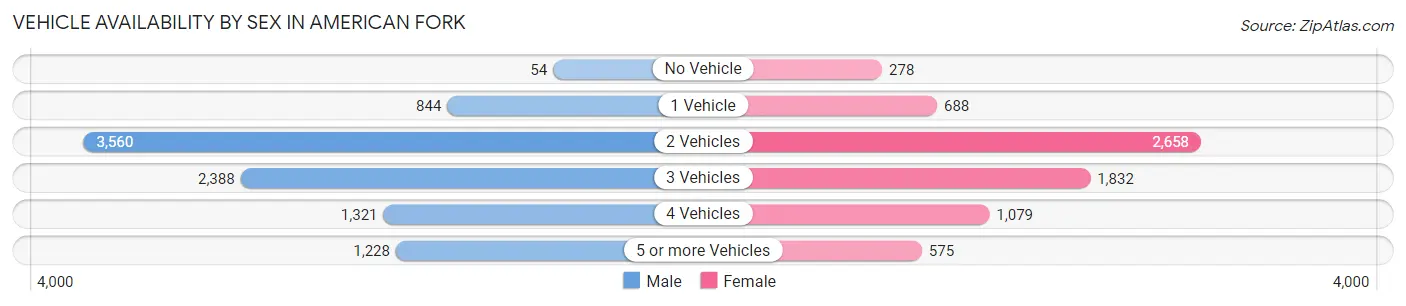
| Vehicles Available | Male | Female |
| No Vehicle | 54 (0.6%) | 278 (3.9%) |
| 1 Vehicle | 844 (9.0%) | 688 (9.7%) |
| 2 Vehicles | 3,560 (37.9%) | 2,658 (37.4%) |
| 3 Vehicles | 2,388 (25.4%) | 1,832 (25.8%) |
| 4 Vehicles | 1,321 (14.1%) | 1,079 (15.2%) |
| 5 or more Vehicles | 1,228 (13.1%) | 575 (8.1%) |
| Total | 9,395 (100.0%) | 7,110 (100.0%) |
Commute Time in American Fork
The most frequently occuring commute durations in American Fork are 10 to 14 minutes (2,636 commuters, 19.0%), 15 to 19 minutes (2,421 commuters, 17.5%), and 5 to 9 minutes (2,013 commuters, 14.5%).
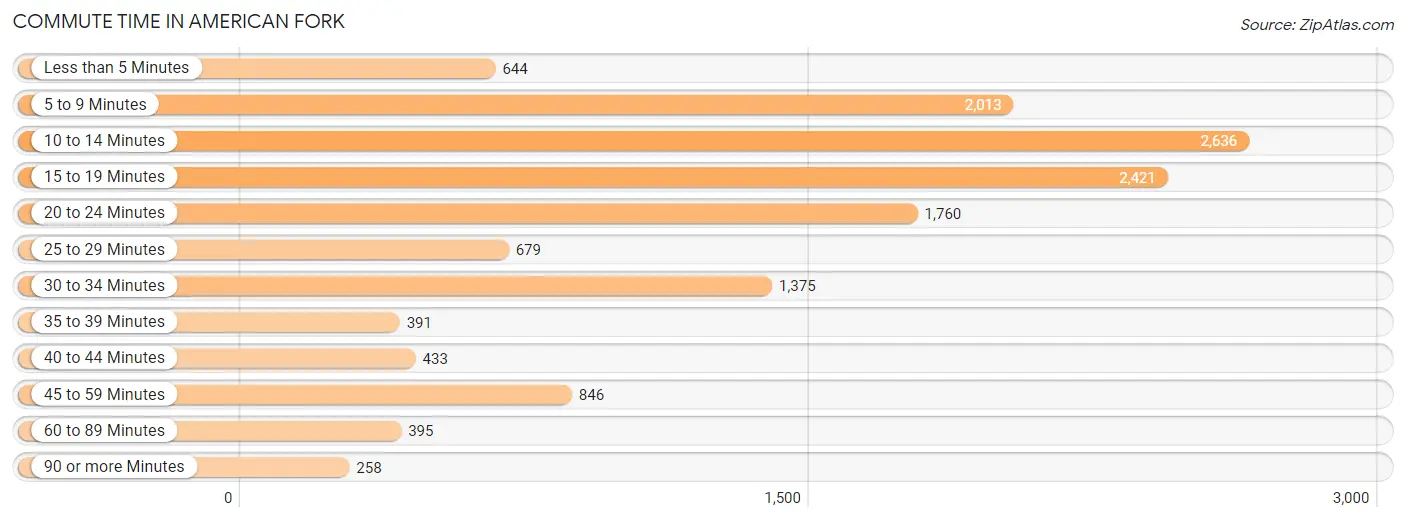
| Commute Time | # Commuters | % Commuters |
| Less than 5 Minutes | 644 | 4.6% |
| 5 to 9 Minutes | 2,013 | 14.5% |
| 10 to 14 Minutes | 2,636 | 19.0% |
| 15 to 19 Minutes | 2,421 | 17.5% |
| 20 to 24 Minutes | 1,760 | 12.7% |
| 25 to 29 Minutes | 679 | 4.9% |
| 30 to 34 Minutes | 1,375 | 9.9% |
| 35 to 39 Minutes | 391 | 2.8% |
| 40 to 44 Minutes | 433 | 3.1% |
| 45 to 59 Minutes | 846 | 6.1% |
| 60 to 89 Minutes | 395 | 2.9% |
| 90 or more Minutes | 258 | 1.9% |
Commute Time by Sex in American Fork
The most common commute times in American Fork are 10 to 14 minutes (1,533 commuters, 18.9%) for males and 5 to 9 minutes (1,192 commuters, 20.7%) for females.
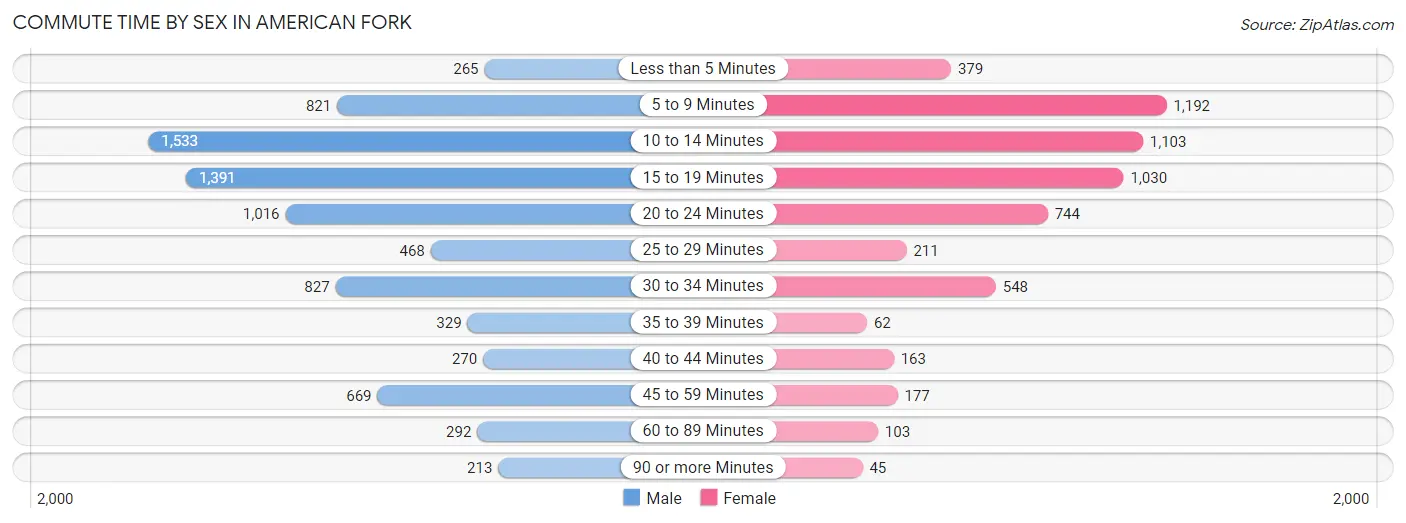
| Commute Time | Male | Female |
| Less than 5 Minutes | 265 (3.3%) | 379 (6.6%) |
| 5 to 9 Minutes | 821 (10.1%) | 1,192 (20.7%) |
| 10 to 14 Minutes | 1,533 (18.9%) | 1,103 (19.2%) |
| 15 to 19 Minutes | 1,391 (17.2%) | 1,030 (17.9%) |
| 20 to 24 Minutes | 1,016 (12.6%) | 744 (12.9%) |
| 25 to 29 Minutes | 468 (5.8%) | 211 (3.7%) |
| 30 to 34 Minutes | 827 (10.2%) | 548 (9.5%) |
| 35 to 39 Minutes | 329 (4.1%) | 62 (1.1%) |
| 40 to 44 Minutes | 270 (3.3%) | 163 (2.8%) |
| 45 to 59 Minutes | 669 (8.3%) | 177 (3.1%) |
| 60 to 89 Minutes | 292 (3.6%) | 103 (1.8%) |
| 90 or more Minutes | 213 (2.6%) | 45 (0.8%) |
Time of Departure to Work by Sex in American Fork
The most frequent times of departure to work in American Fork are 8:00 AM to 8:29 AM (1,296, 16.0%) for males and 7:30 AM to 7:59 AM (1,184, 20.6%) for females.
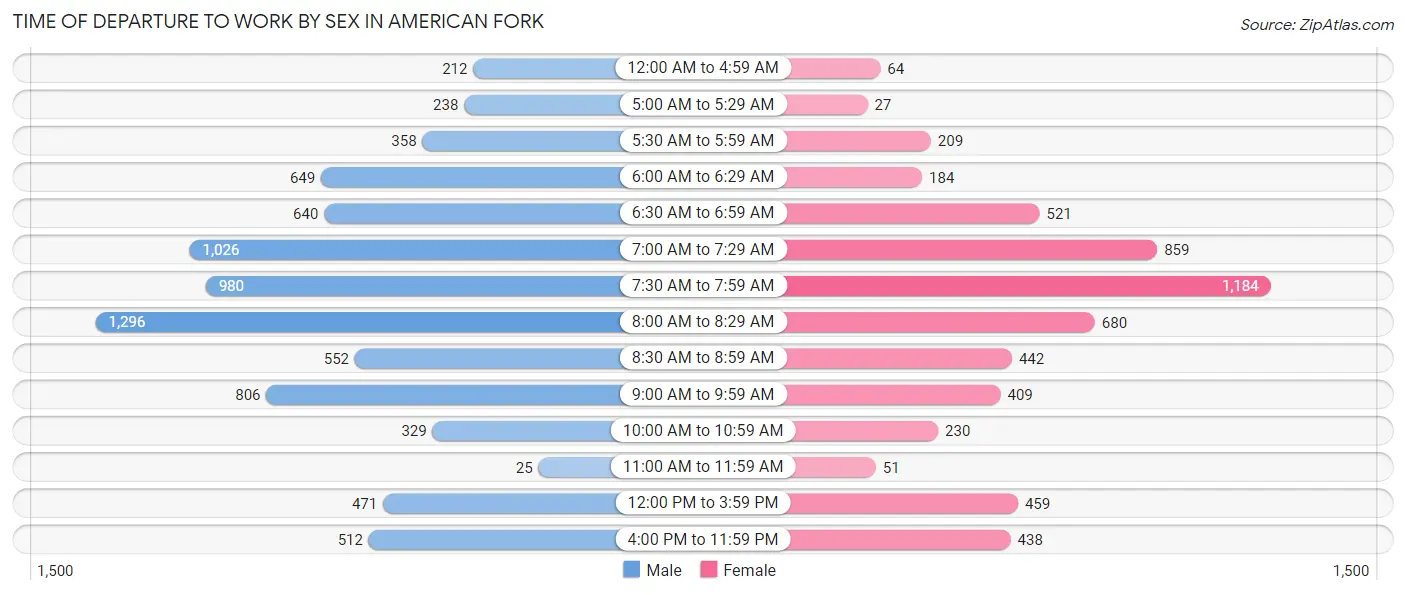
| Time of Departure | Male | Female |
| 12:00 AM to 4:59 AM | 212 (2.6%) | 64 (1.1%) |
| 5:00 AM to 5:29 AM | 238 (2.9%) | 27 (0.5%) |
| 5:30 AM to 5:59 AM | 358 (4.4%) | 209 (3.6%) |
| 6:00 AM to 6:29 AM | 649 (8.0%) | 184 (3.2%) |
| 6:30 AM to 6:59 AM | 640 (7.9%) | 521 (9.0%) |
| 7:00 AM to 7:29 AM | 1,026 (12.7%) | 859 (14.9%) |
| 7:30 AM to 7:59 AM | 980 (12.1%) | 1,184 (20.6%) |
| 8:00 AM to 8:29 AM | 1,296 (16.0%) | 680 (11.8%) |
| 8:30 AM to 8:59 AM | 552 (6.8%) | 442 (7.7%) |
| 9:00 AM to 9:59 AM | 806 (10.0%) | 409 (7.1%) |
| 10:00 AM to 10:59 AM | 329 (4.1%) | 230 (4.0%) |
| 11:00 AM to 11:59 AM | 25 (0.3%) | 51 (0.9%) |
| 12:00 PM to 3:59 PM | 471 (5.8%) | 459 (8.0%) |
| 4:00 PM to 11:59 PM | 512 (6.3%) | 438 (7.6%) |
| Total | 8,094 (100.0%) | 5,757 (100.0%) |
Housing Occupancy in American Fork
Occupancy by Ownership in American Fork
Of the total 10,240 dwellings in American Fork, owner-occupied units account for 7,297 (71.3%), while renter-occupied units make up 2,943 (28.7%).
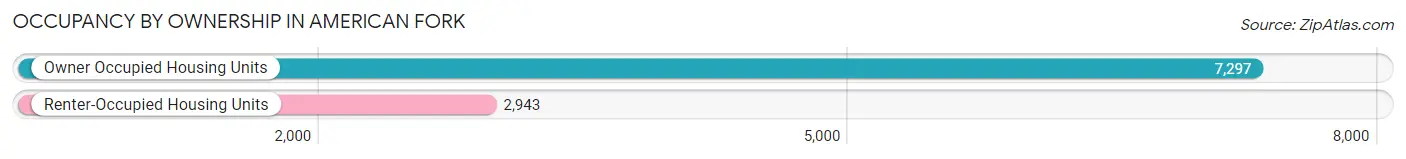
| Occupancy | # Housing Units | % Housing Units |
| Owner Occupied Housing Units | 7,297 | 71.3% |
| Renter-Occupied Housing Units | 2,943 | 28.7% |
| Total Occupied Housing Units | 10,240 | 100.0% |
Occupancy by Household Size in American Fork
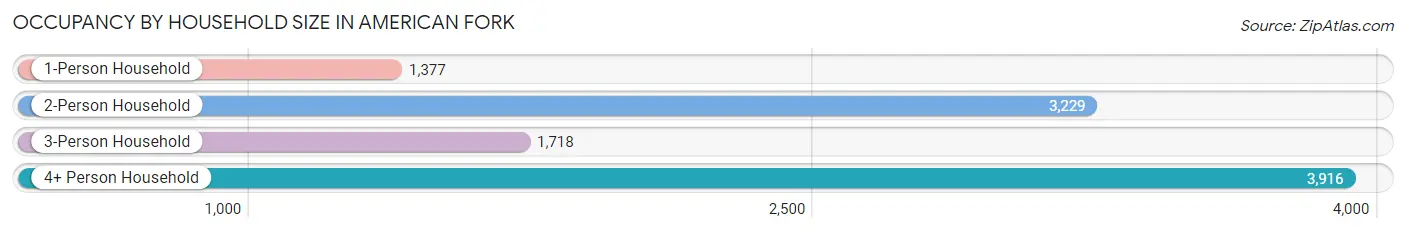
| Household Size | # Housing Units | % Housing Units |
| 1-Person Household | 1,377 | 13.5% |
| 2-Person Household | 3,229 | 31.5% |
| 3-Person Household | 1,718 | 16.8% |
| 4+ Person Household | 3,916 | 38.2% |
| Total Housing Units | 10,240 | 100.0% |
Occupancy by Ownership by Household Size in American Fork
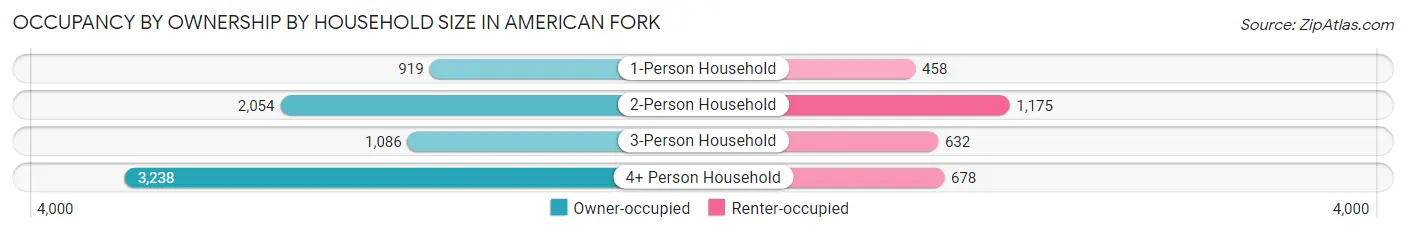
| Household Size | Owner-occupied | Renter-occupied |
| 1-Person Household | 919 (66.7%) | 458 (33.3%) |
| 2-Person Household | 2,054 (63.6%) | 1,175 (36.4%) |
| 3-Person Household | 1,086 (63.2%) | 632 (36.8%) |
| 4+ Person Household | 3,238 (82.7%) | 678 (17.3%) |
| Total Housing Units | 7,297 (71.3%) | 2,943 (28.7%) |
Occupancy by Educational Attainment in American Fork
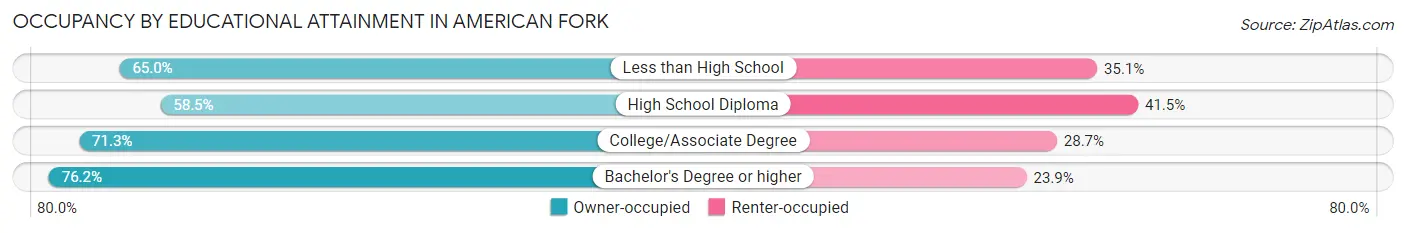
| Household Size | Owner-occupied | Renter-occupied |
| Less than High School | 252 (64.9%) | 136 (35.0%) |
| High School Diploma | 919 (58.5%) | 653 (41.5%) |
| College/Associate Degree | 2,664 (71.3%) | 1,070 (28.7%) |
| Bachelor's Degree or higher | 3,462 (76.1%) | 1,084 (23.8%) |
Occupancy by Age of Householder in American Fork
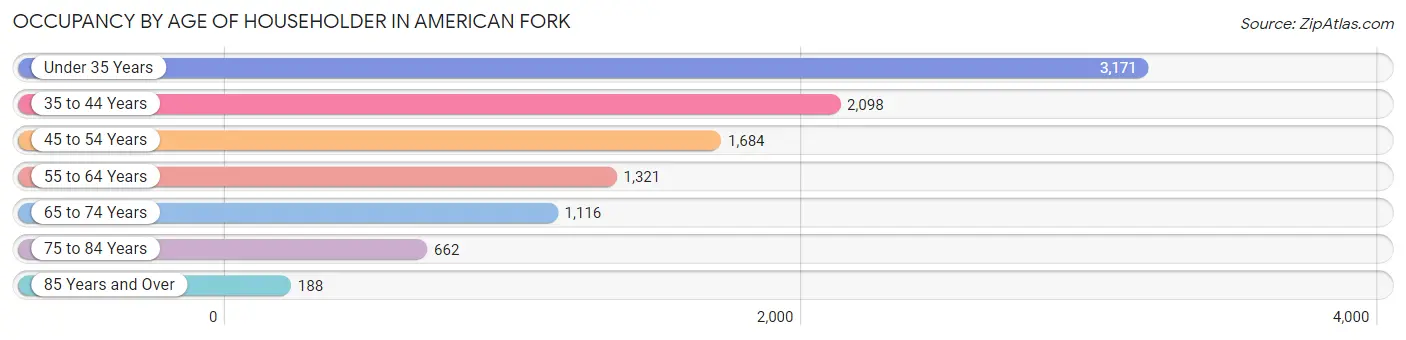
| Age Bracket | # Households | % Households |
| Under 35 Years | 3,171 | 31.0% |
| 35 to 44 Years | 2,098 | 20.5% |
| 45 to 54 Years | 1,684 | 16.5% |
| 55 to 64 Years | 1,321 | 12.9% |
| 65 to 74 Years | 1,116 | 10.9% |
| 75 to 84 Years | 662 | 6.5% |
| 85 Years and Over | 188 | 1.8% |
| Total | 10,240 | 100.0% |
Housing Finances in American Fork
Median Income by Occupancy in American Fork
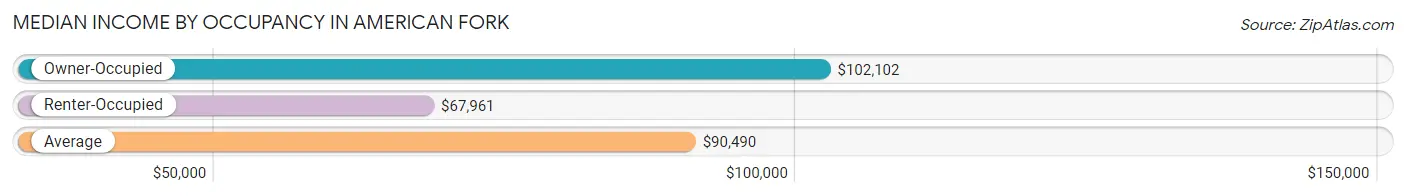
| Occupancy Type | # Households | Median Income |
| Owner-Occupied | 7,297 (71.3%) | $102,102 |
| Renter-Occupied | 2,943 (28.7%) | $67,961 |
| Average | 10,240 (100.0%) | $90,490 |
Occupancy by Householder Income Bracket in American Fork
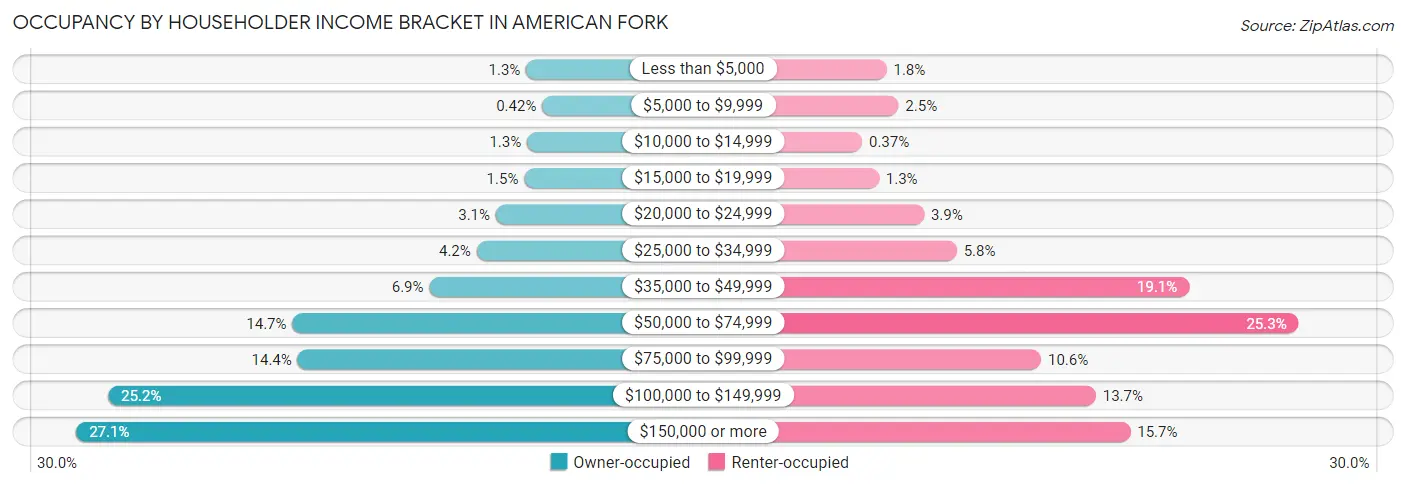
| Income Bracket | Owner-occupied | Renter-occupied |
| Less than $5,000 | 98 (1.3%) | 52 (1.8%) |
| $5,000 to $9,999 | 31 (0.4%) | 72 (2.5%) |
| $10,000 to $14,999 | 94 (1.3%) | 11 (0.4%) |
| $15,000 to $19,999 | 106 (1.5%) | 39 (1.3%) |
| $20,000 to $24,999 | 224 (3.1%) | 115 (3.9%) |
| $25,000 to $34,999 | 304 (4.2%) | 170 (5.8%) |
| $35,000 to $49,999 | 501 (6.9%) | 561 (19.1%) |
| $50,000 to $74,999 | 1,073 (14.7%) | 745 (25.3%) |
| $75,000 to $99,999 | 1,051 (14.4%) | 312 (10.6%) |
| $100,000 to $149,999 | 1,841 (25.2%) | 404 (13.7%) |
| $150,000 or more | 1,974 (27.1%) | 462 (15.7%) |
| Total | 7,297 (100.0%) | 2,943 (100.0%) |
Monthly Housing Cost Tiers in American Fork
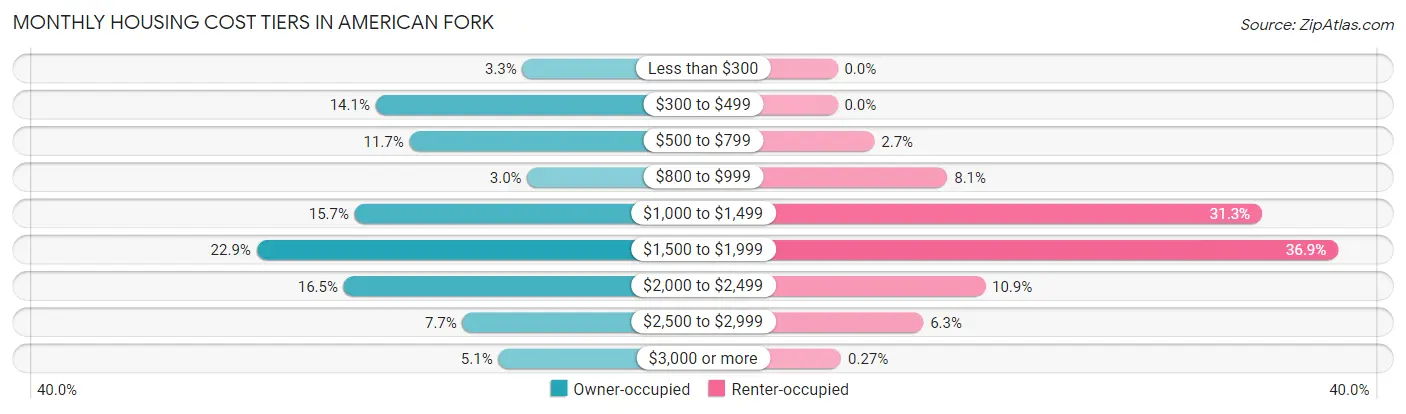
| Monthly Cost | Owner-occupied | Renter-occupied |
| Less than $300 | 242 (3.3%) | 0 (0.0%) |
| $300 to $499 | 1,032 (14.1%) | 0 (0.0%) |
| $500 to $799 | 850 (11.7%) | 80 (2.7%) |
| $800 to $999 | 217 (3.0%) | 238 (8.1%) |
| $1,000 to $1,499 | 1,144 (15.7%) | 920 (31.3%) |
| $1,500 to $1,999 | 1,672 (22.9%) | 1,085 (36.9%) |
| $2,000 to $2,499 | 1,203 (16.5%) | 320 (10.9%) |
| $2,500 to $2,999 | 565 (7.7%) | 186 (6.3%) |
| $3,000 or more | 372 (5.1%) | 8 (0.3%) |
| Total | 7,297 (100.0%) | 2,943 (100.0%) |
Physical Housing Characteristics in American Fork
Housing Structures in American Fork
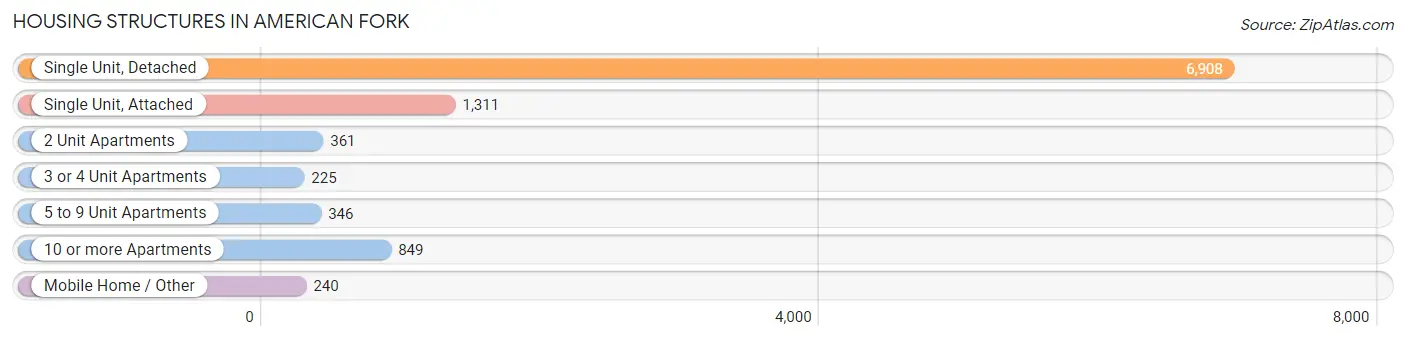
| Structure Type | # Housing Units | % Housing Units |
| Single Unit, Detached | 6,908 | 67.5% |
| Single Unit, Attached | 1,311 | 12.8% |
| 2 Unit Apartments | 361 | 3.5% |
| 3 or 4 Unit Apartments | 225 | 2.2% |
| 5 to 9 Unit Apartments | 346 | 3.4% |
| 10 or more Apartments | 849 | 8.3% |
| Mobile Home / Other | 240 | 2.3% |
| Total | 10,240 | 100.0% |
Housing Structures by Occupancy in American Fork
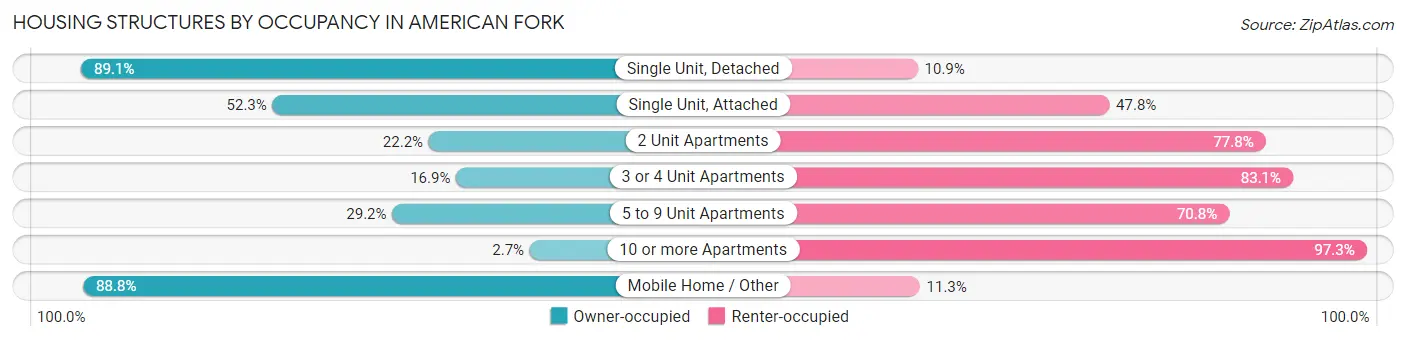
| Structure Type | Owner-occupied | Renter-occupied |
| Single Unit, Detached | 6,157 (89.1%) | 751 (10.9%) |
| Single Unit, Attached | 685 (52.2%) | 626 (47.7%) |
| 2 Unit Apartments | 80 (22.2%) | 281 (77.8%) |
| 3 or 4 Unit Apartments | 38 (16.9%) | 187 (83.1%) |
| 5 to 9 Unit Apartments | 101 (29.2%) | 245 (70.8%) |
| 10 or more Apartments | 23 (2.7%) | 826 (97.3%) |
| Mobile Home / Other | 213 (88.7%) | 27 (11.3%) |
| Total | 7,297 (71.3%) | 2,943 (28.7%) |
Housing Structures by Number of Rooms in American Fork
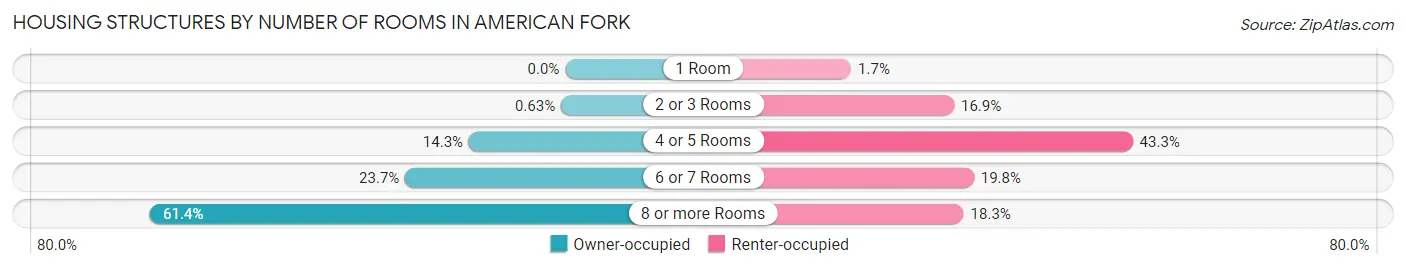
| Number of Rooms | Owner-occupied | Renter-occupied |
| 1 Room | 0 (0.0%) | 49 (1.7%) |
| 2 or 3 Rooms | 46 (0.6%) | 497 (16.9%) |
| 4 or 5 Rooms | 1,040 (14.2%) | 1,275 (43.3%) |
| 6 or 7 Rooms | 1,729 (23.7%) | 583 (19.8%) |
| 8 or more Rooms | 4,482 (61.4%) | 539 (18.3%) |
| Total | 7,297 (100.0%) | 2,943 (100.0%) |
Housing Structure by Heating Type in American Fork
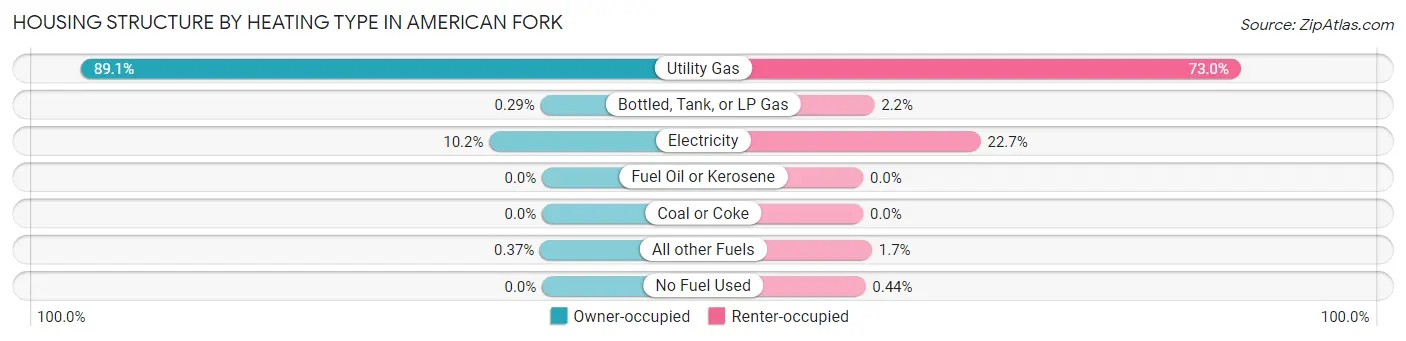
| Heating Type | Owner-occupied | Renter-occupied |
| Utility Gas | 6,504 (89.1%) | 2,148 (73.0%) |
| Bottled, Tank, or LP Gas | 21 (0.3%) | 64 (2.2%) |
| Electricity | 745 (10.2%) | 668 (22.7%) |
| Fuel Oil or Kerosene | 0 (0.0%) | 0 (0.0%) |
| Coal or Coke | 0 (0.0%) | 0 (0.0%) |
| All other Fuels | 27 (0.4%) | 50 (1.7%) |
| No Fuel Used | 0 (0.0%) | 13 (0.4%) |
| Total | 7,297 (100.0%) | 2,943 (100.0%) |
Household Vehicle Usage in American Fork
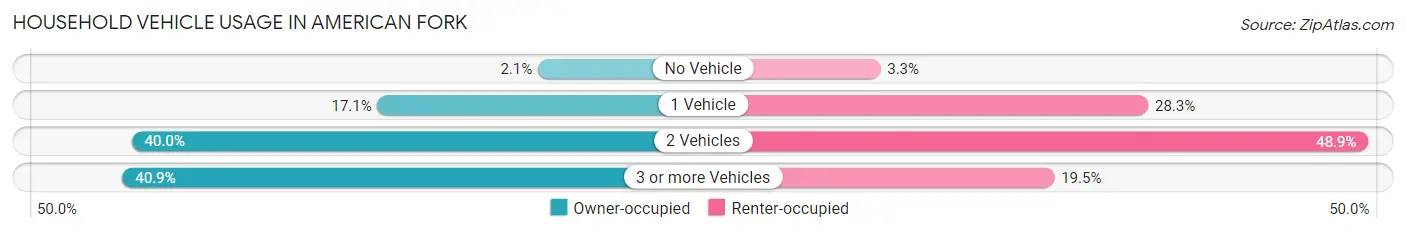
| Vehicles per Household | Owner-occupied | Renter-occupied |
| No Vehicle | 151 (2.1%) | 97 (3.3%) |
| 1 Vehicle | 1,244 (17.1%) | 833 (28.3%) |
| 2 Vehicles | 2,920 (40.0%) | 1,438 (48.9%) |
| 3 or more Vehicles | 2,982 (40.9%) | 575 (19.5%) |
| Total | 7,297 (100.0%) | 2,943 (100.0%) |
Real Estate & Mortgages in American Fork
Real Estate and Mortgage Overview in American Fork
| Characteristic | Without Mortgage | With Mortgage |
| Housing Units | 2,168 | 5,129 |
| Median Property Value | $381,900 | $419,200 |
| Median Household Income | $74,457 | $1,605 |
| Monthly Housing Costs | $475 | $372 |
| Real Estate Taxes | $1,774 | $149 |
Property Value by Mortgage Status in American Fork
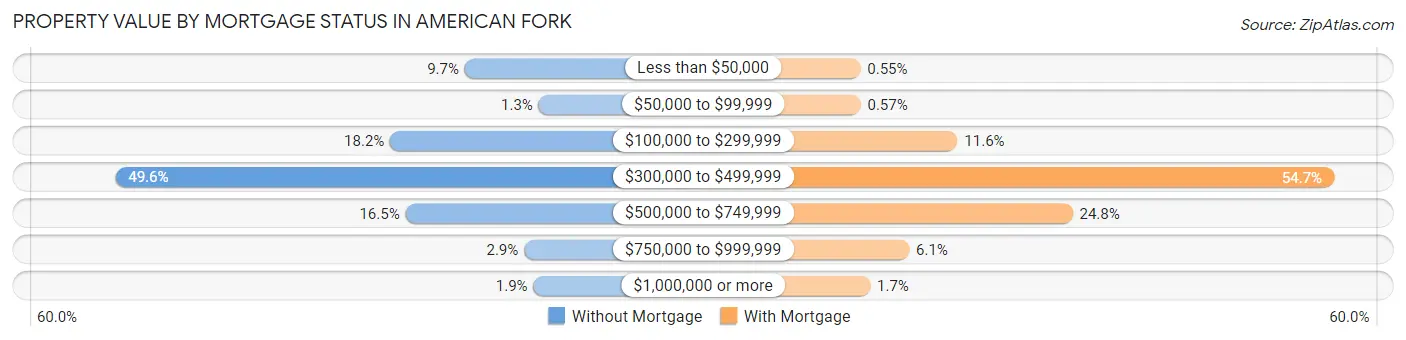
| Property Value | Without Mortgage | With Mortgage |
| Less than $50,000 | 210 (9.7%) | 28 (0.5%) |
| $50,000 to $99,999 | 27 (1.3%) | 29 (0.6%) |
| $100,000 to $299,999 | 395 (18.2%) | 597 (11.6%) |
| $300,000 to $499,999 | 1,076 (49.6%) | 2,804 (54.7%) |
| $500,000 to $749,999 | 357 (16.5%) | 1,272 (24.8%) |
| $750,000 to $999,999 | 63 (2.9%) | 314 (6.1%) |
| $1,000,000 or more | 40 (1.8%) | 85 (1.7%) |
| Total | 2,168 (100.0%) | 5,129 (100.0%) |
Household Income by Mortgage Status in American Fork
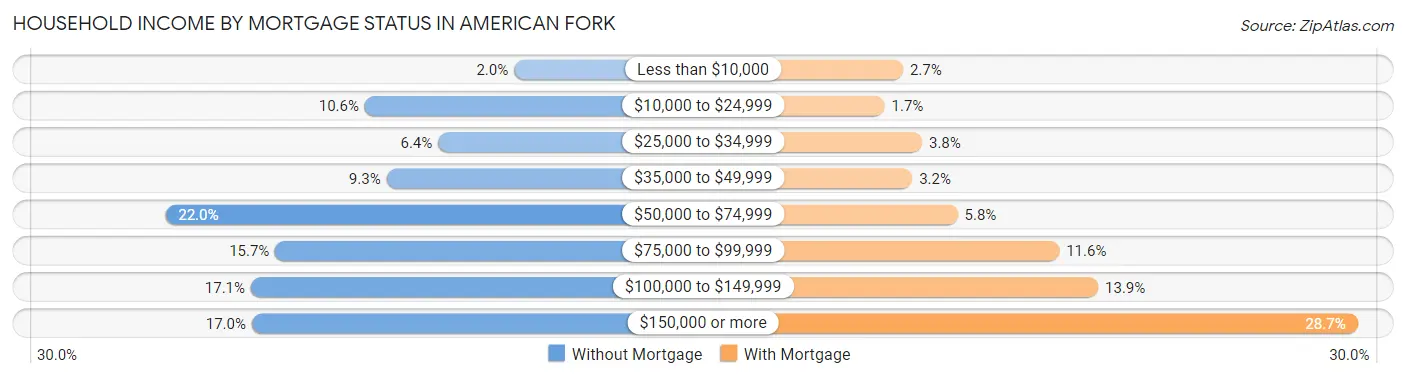
| Household Income | Without Mortgage | With Mortgage |
| Less than $10,000 | 44 (2.0%) | 139 (2.7%) |
| $10,000 to $24,999 | 229 (10.6%) | 85 (1.7%) |
| $25,000 to $34,999 | 138 (6.4%) | 195 (3.8%) |
| $35,000 to $49,999 | 202 (9.3%) | 166 (3.2%) |
| $50,000 to $74,999 | 476 (22.0%) | 299 (5.8%) |
| $75,000 to $99,999 | 340 (15.7%) | 597 (11.6%) |
| $100,000 to $149,999 | 370 (17.1%) | 711 (13.9%) |
| $150,000 or more | 369 (17.0%) | 1,471 (28.7%) |
| Total | 2,168 (100.0%) | 5,129 (100.0%) |
Property Value to Household Income Ratio in American Fork
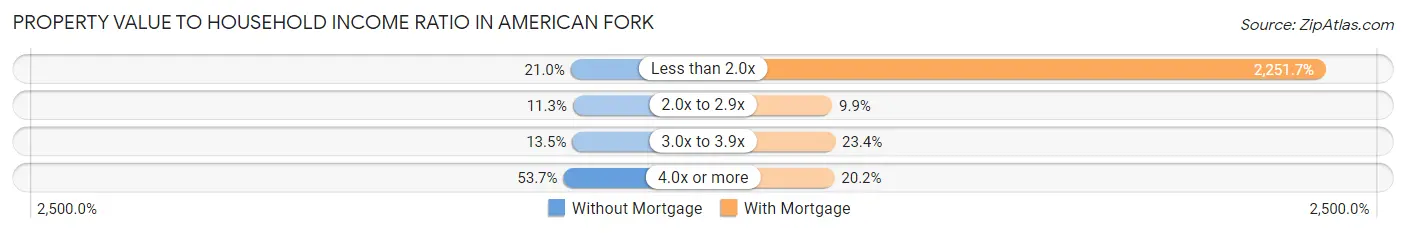
| Value-to-Income Ratio | Without Mortgage | With Mortgage |
| Less than 2.0x | 456 (21.0%) | 115,491 (2,251.7%) |
| 2.0x to 2.9x | 245 (11.3%) | 509 (9.9%) |
| 3.0x to 3.9x | 293 (13.5%) | 1,198 (23.4%) |
| 4.0x or more | 1,165 (53.7%) | 1,038 (20.2%) |
| Total | 2,168 (100.0%) | 5,129 (100.0%) |
Real Estate Taxes by Mortgage Status in American Fork
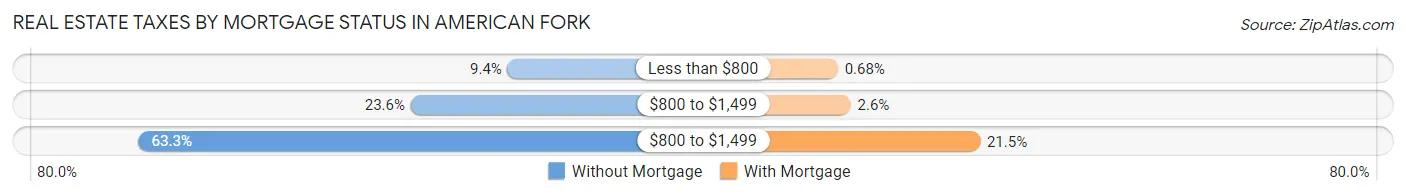
| Property Taxes | Without Mortgage | With Mortgage |
| Less than $800 | 204 (9.4%) | 35 (0.7%) |
| $800 to $1,499 | 511 (23.6%) | 132 (2.6%) |
| $800 to $1,499 | 1,373 (63.3%) | 1,101 (21.5%) |
| Total | 2,168 (100.0%) | 5,129 (100.0%) |
Health & Disability in American Fork
Health Insurance Coverage by Age in American Fork
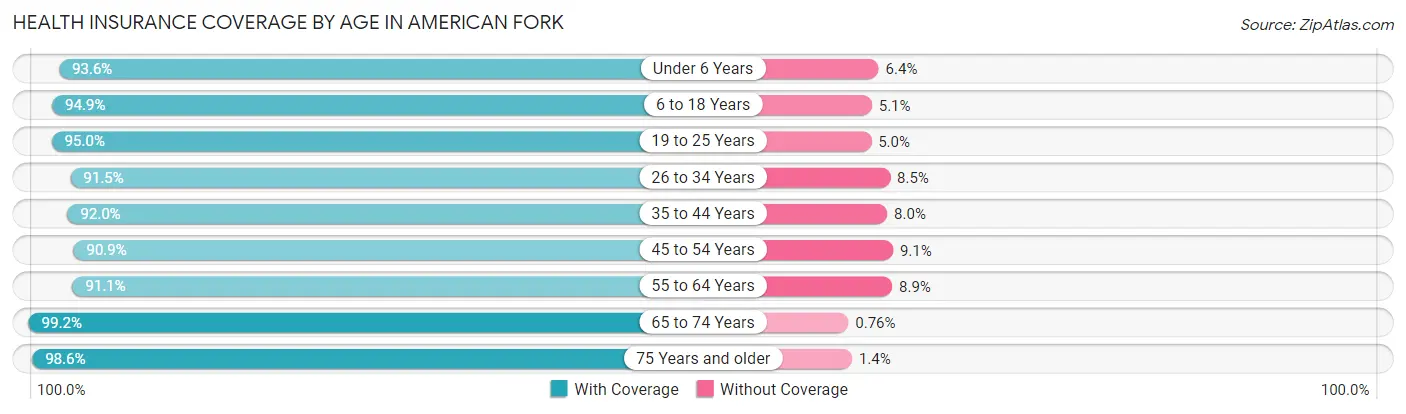
| Age Bracket | With Coverage | Without Coverage |
| Under 6 Years | 3,155 (93.6%) | 216 (6.4%) |
| 6 to 18 Years | 7,396 (94.9%) | 400 (5.1%) |
| 19 to 25 Years | 4,255 (95.0%) | 225 (5.0%) |
| 26 to 34 Years | 4,165 (91.5%) | 389 (8.5%) |
| 35 to 44 Years | 4,075 (92.0%) | 354 (8.0%) |
| 45 to 54 Years | 2,934 (90.9%) | 293 (9.1%) |
| 55 to 64 Years | 2,320 (91.1%) | 227 (8.9%) |
| 65 to 74 Years | 1,838 (99.2%) | 14 (0.8%) |
| 75 Years and older | 1,380 (98.6%) | 20 (1.4%) |
| Total | 31,518 (93.6%) | 2,138 (6.4%) |
Health Insurance Coverage by Citizenship Status in American Fork
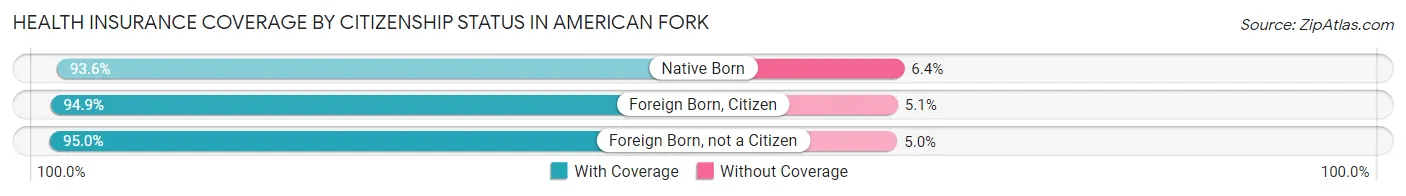
| Citizenship Status | With Coverage | Without Coverage |
| Native Born | 3,155 (93.6%) | 216 (6.4%) |
| Foreign Born, Citizen | 7,396 (94.9%) | 400 (5.1%) |
| Foreign Born, not a Citizen | 4,255 (95.0%) | 225 (5.0%) |
Health Insurance Coverage by Household Income in American Fork
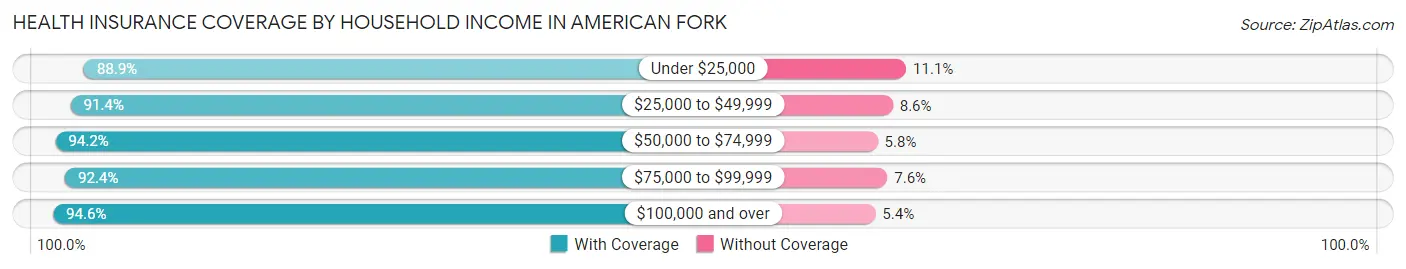
| Household Income | With Coverage | Without Coverage |
| Under $25,000 | 1,535 (88.9%) | 192 (11.1%) |
| $25,000 to $49,999 | 3,712 (91.4%) | 350 (8.6%) |
| $50,000 to $74,999 | 4,235 (94.2%) | 260 (5.8%) |
| $75,000 to $99,999 | 3,876 (92.4%) | 319 (7.6%) |
| $100,000 and over | 17,973 (94.6%) | 1,017 (5.4%) |
Public vs Private Health Insurance Coverage by Age in American Fork
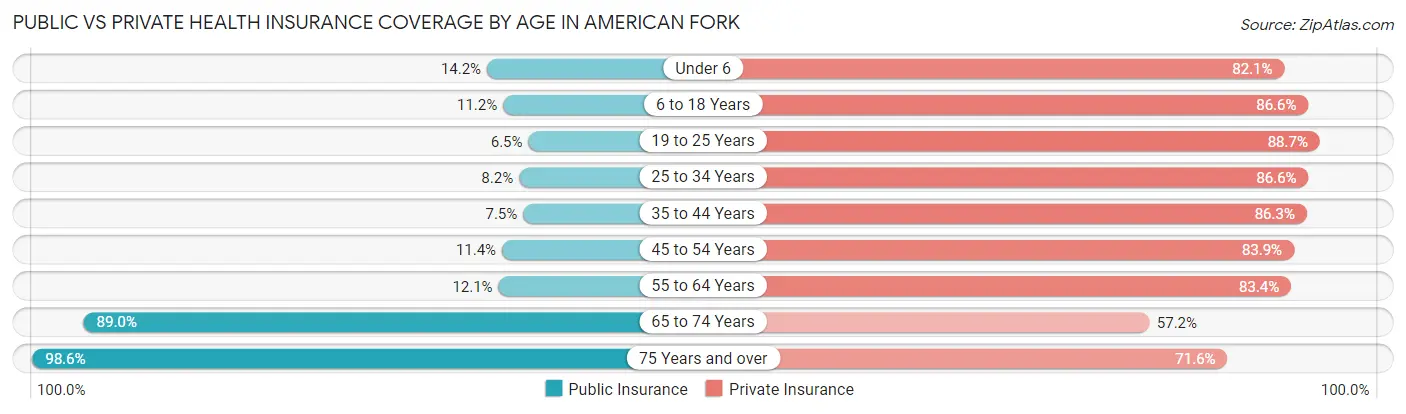
| Age Bracket | Public Insurance | Private Insurance |
| Under 6 | 478 (14.2%) | 2,769 (82.1%) |
| 6 to 18 Years | 872 (11.2%) | 6,750 (86.6%) |
| 19 to 25 Years | 291 (6.5%) | 3,974 (88.7%) |
| 25 to 34 Years | 375 (8.2%) | 3,944 (86.6%) |
| 35 to 44 Years | 331 (7.5%) | 3,822 (86.3%) |
| 45 to 54 Years | 368 (11.4%) | 2,708 (83.9%) |
| 55 to 64 Years | 307 (12.0%) | 2,124 (83.4%) |
| 65 to 74 Years | 1,649 (89.0%) | 1,059 (57.2%) |
| 75 Years and over | 1,380 (98.6%) | 1,002 (71.6%) |
| Total | 6,051 (18.0%) | 28,152 (83.7%) |
Disability Status by Sex by Age in American Fork
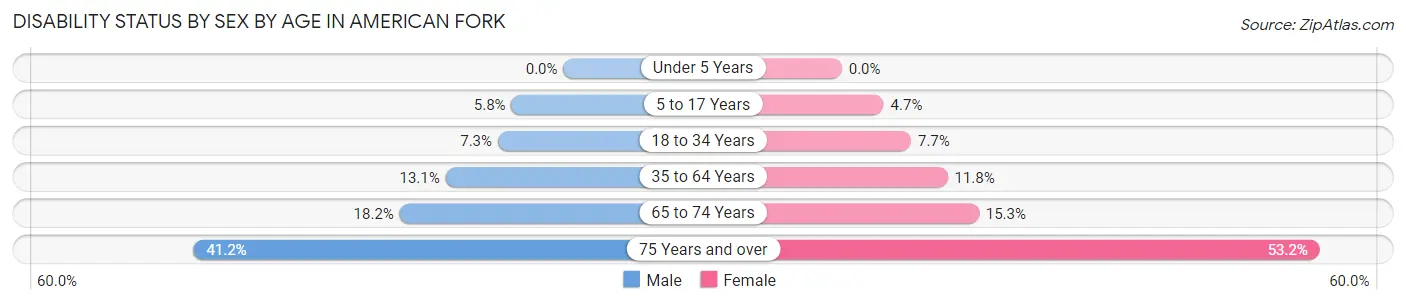
| Age Bracket | Male | Female |
| Under 5 Years | 0 (0.0%) | 0 (0.0%) |
| 5 to 17 Years | 236 (5.8%) | 161 (4.7%) |
| 18 to 34 Years | 368 (7.3%) | 374 (7.7%) |
| 35 to 64 Years | 683 (13.1%) | 589 (11.8%) |
| 65 to 74 Years | 150 (18.2%) | 157 (15.3%) |
| 75 Years and over | 250 (41.2%) | 422 (53.2%) |
Disability Class by Sex by Age in American Fork
Disability Class: Hearing Difficulty
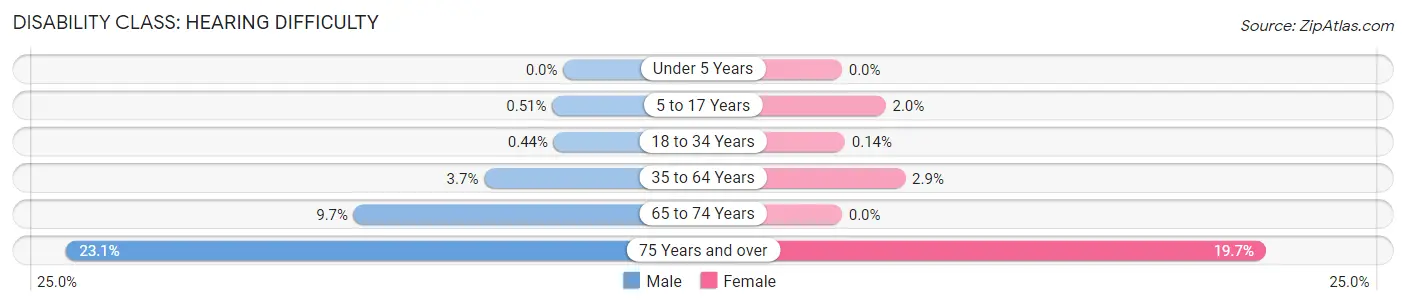
| Age Bracket | Male | Female |
| Under 5 Years | 0 (0.0%) | 0 (0.0%) |
| 5 to 17 Years | 21 (0.5%) | 70 (2.0%) |
| 18 to 34 Years | 22 (0.4%) | 7 (0.1%) |
| 35 to 64 Years | 191 (3.7%) | 147 (2.9%) |
| 65 to 74 Years | 80 (9.7%) | 0 (0.0%) |
| 75 Years and over | 140 (23.1%) | 156 (19.7%) |
Disability Class: Vision Difficulty
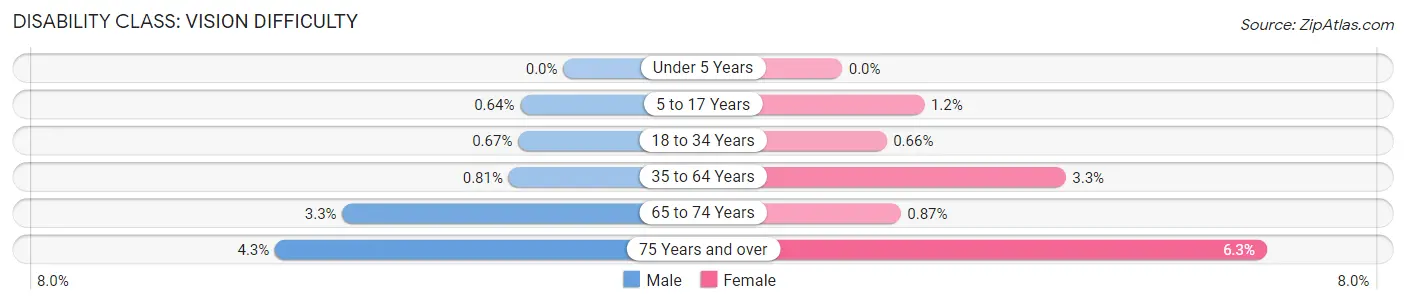
| Age Bracket | Male | Female |
| Under 5 Years | 0 (0.0%) | 0 (0.0%) |
| 5 to 17 Years | 26 (0.6%) | 42 (1.2%) |
| 18 to 34 Years | 34 (0.7%) | 32 (0.7%) |
| 35 to 64 Years | 42 (0.8%) | 166 (3.3%) |
| 65 to 74 Years | 27 (3.3%) | 9 (0.9%) |
| 75 Years and over | 26 (4.3%) | 50 (6.3%) |
Disability Class: Cognitive Difficulty
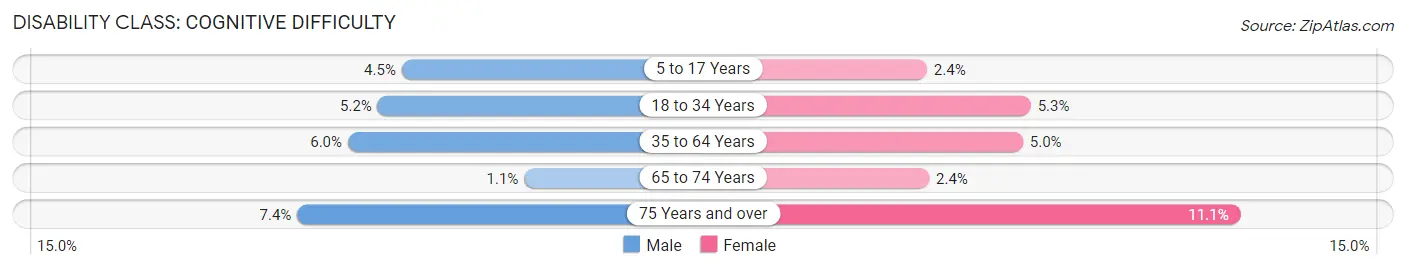
| Age Bracket | Male | Female |
| 5 to 17 Years | 184 (4.5%) | 82 (2.4%) |
| 18 to 34 Years | 261 (5.2%) | 255 (5.3%) |
| 35 to 64 Years | 312 (6.0%) | 252 (5.0%) |
| 65 to 74 Years | 9 (1.1%) | 25 (2.4%) |
| 75 Years and over | 45 (7.4%) | 88 (11.1%) |
Disability Class: Ambulatory Difficulty
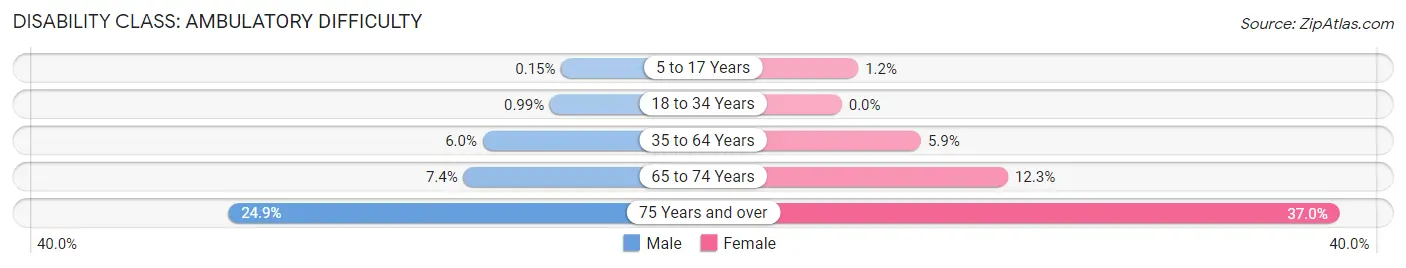
| Age Bracket | Male | Female |
| 5 to 17 Years | 6 (0.2%) | 42 (1.2%) |
| 18 to 34 Years | 50 (1.0%) | 0 (0.0%) |
| 35 to 64 Years | 311 (6.0%) | 294 (5.9%) |
| 65 to 74 Years | 61 (7.4%) | 127 (12.3%) |
| 75 Years and over | 151 (24.9%) | 293 (36.9%) |
Disability Class: Self-Care Difficulty
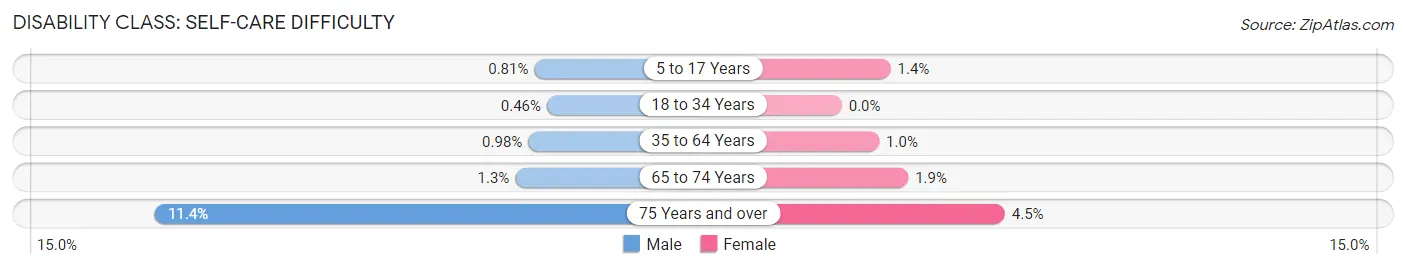
| Age Bracket | Male | Female |
| 5 to 17 Years | 33 (0.8%) | 47 (1.4%) |
| 18 to 34 Years | 23 (0.5%) | 0 (0.0%) |
| 35 to 64 Years | 51 (1.0%) | 52 (1.0%) |
| 65 to 74 Years | 11 (1.3%) | 19 (1.8%) |
| 75 Years and over | 69 (11.4%) | 36 (4.5%) |
Technology Access in American Fork
Computing Device Access in American Fork
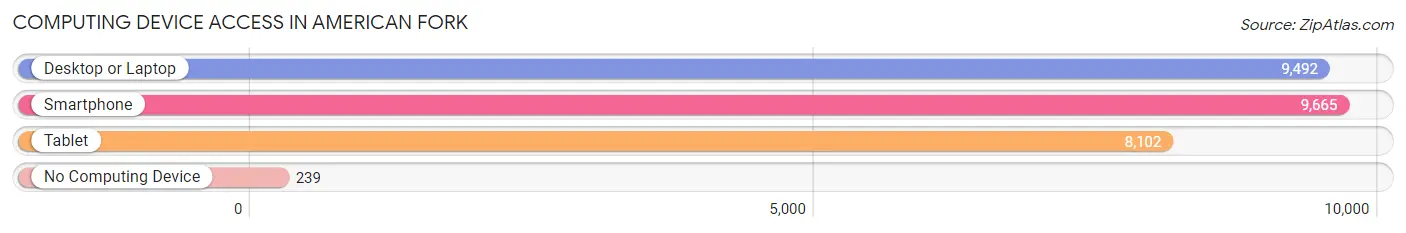
| Device Type | # Households | % Households |
| Desktop or Laptop | 9,492 | 92.7% |
| Smartphone | 9,665 | 94.4% |
| Tablet | 8,102 | 79.1% |
| No Computing Device | 239 | 2.3% |
| Total | 10,240 | 100.0% |
Internet Access in American Fork
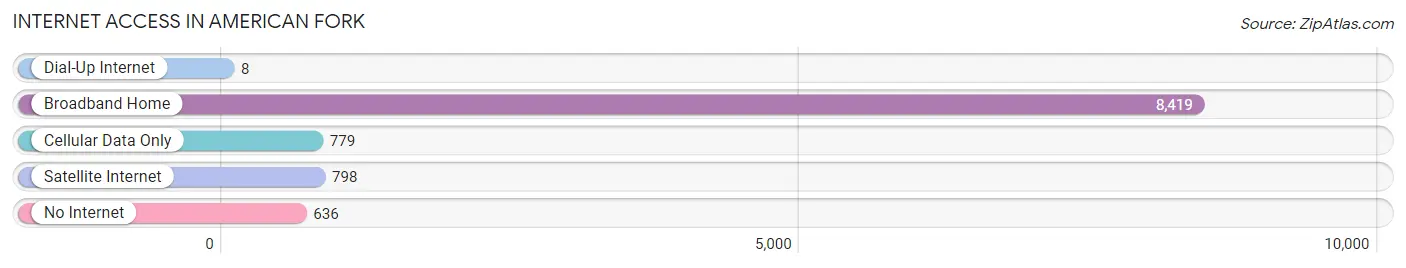
| Internet Type | # Households | % Households |
| Dial-Up Internet | 8 | 0.1% |
| Broadband Home | 8,419 | 82.2% |
| Cellular Data Only | 779 | 7.6% |
| Satellite Internet | 798 | 7.8% |
| No Internet | 636 | 6.2% |
| Total | 10,240 | 100.0% |
American Fork Summary
History
American Fork, Utah is a city located in Utah County, Utah. It is part of the Provo-Orem Metropolitan Statistical Area. The city was founded in 1850 by Mormon pioneers and was originally known as Lake City. The city was renamed American Fork in 1860 after the American Fork River, which runs through the city.
American Fork has a rich history that dates back to the early days of the Mormon pioneers. The first settlers in the area were members of the Church of Jesus Christ of Latter-day Saints, who were sent to the area to establish a settlement. The settlers built a fort and a sawmill, and the area quickly grew into a thriving community.
In 1853, the first school in American Fork was established. The school was called the American Fork Academy and was the first school in the area. The school was later renamed the American Fork High School and is still in operation today.
In 1869, the first railroad line was built in American Fork. This line connected the city to Salt Lake City and allowed for the transportation of goods and people. This line was later extended to Ogden and Provo.
In 1877, the first telephone line was installed in American Fork. This allowed for the first telephone conversations to take place in the city.
In 1882, the first electric lights were installed in American Fork. This allowed for the first electric lights to be used in the city.
In 1887, the first water system was installed in American Fork. This allowed for the first water to be piped into the city.
In 1895, the first public library was established in American Fork. This library is still in operation today and is the oldest public library in Utah.
In 1901, the first bank was established in American Fork. This bank is still in operation today and is the oldest bank in Utah.
In 1906, the first movie theater was established in American Fork. This theater is still in operation today and is the oldest movie theater in Utah.
In 1910, the first hospital was established in American Fork. This hospital is still in operation today and is the oldest hospital in Utah.
Geography
American Fork is located in Utah County, Utah. It is part of the Provo-Orem Metropolitan Statistical Area. The city is situated at the base of the Wasatch Mountains and is bordered by the cities of Pleasant Grove, Lehi, and Alpine. The city has a total area of 8.7 square miles and an elevation of 4,521 feet.
The climate in American Fork is classified as a humid continental climate. The summers are hot and dry, while the winters are cold and snowy. The average annual temperature is 46 degrees Fahrenheit. The average annual precipitation is 17.5 inches.
Economy
American Fork has a strong and diverse economy. The city is home to several large employers, including the American Fork Hospital, the American Fork Steel Company, and the American Fork City School District. The city is also home to several small businesses, including restaurants, retail stores, and service providers.
The city is also home to several technology companies, including Adobe, Ancestry.com, and Vivint. These companies have helped to make American Fork a hub for technology and innovation.
Demographics
As of the 2010 census, the population of American Fork was 28,326. The racial makeup of the city was 90.2% White, 0.7% African American, 0.5% Native American, 2.2% Asian, 0.2% Pacific Islander, 4.2% from other races, and 2.0% from two or more races. Hispanic or Latino of any race were 8.7% of the population.
The median household income in American Fork was $63,945, and the median family income was $71,945. The per capita income for the city was $27,945. About 5.2% of families and 6.7% of the population were below the poverty line, including 8.2% of those under age 18 and 4.2% of those age 65 or over.
Common Questions
What is Per Capita Income in American Fork?
Per Capita income in American Fork is $35,322.
What is the Median Family Income in American Fork?
Median Family Income in American Fork is $98,868.
What is the Median Household income in American Fork?
Median Household Income in American Fork is $90,490.
What is Income or Wage Gap in American Fork?
Income or Wage Gap in American Fork is 52.8%.
Women in American Fork earn 47.2 cents for every dollar earned by a man.
What is Inequality or Gini Index in American Fork?
Inequality or Gini Index in American Fork is 0.42.
What is the Total Population of American Fork?
Total Population of American Fork is 33,986.
What is the Total Male Population of American Fork?
Total Male Population of American Fork is 17,444.
What is the Total Female Population of American Fork?
Total Female Population of American Fork is 16,542.
What is the Ratio of Males per 100 Females in American Fork?
There are 105.45 Males per 100 Females in American Fork.
What is the Ratio of Females per 100 Males in American Fork?
There are 94.83 Females per 100 Males in American Fork.
What is the Median Population Age in American Fork?
Median Population Age in American Fork is 28.0 Years.
What is the Average Family Size in American Fork
Average Family Size in American Fork is 3.6 People.
What is the Average Household Size in American Fork
Average Household Size in American Fork is 3.3 People.
How Large is the Labor Force in American Fork?
There are 17,431 People in the Labor Forcein in American Fork.
What is the Percentage of People in the Labor Force in American Fork?
70.3% of People are in the Labor Force in American Fork.
What is the Unemployment Rate in American Fork?
Unemployment Rate in American Fork is 3.3%.