Lehi, UT Map & Demographics
Lehi Map
Lehi Overview
$39,183
PER CAPITA INCOME
$125,448
AVG FAMILY INCOME
$117,243
AVG HOUSEHOLD INCOME
60.1%
WAGE / INCOME GAP [ % ]
39.9¢/ $1
WAGE / INCOME GAP [ $ ]
0.37
INEQUALITY / GINI INDEX
77,110
TOTAL POPULATION
39,130
MALE POPULATION
37,980
FEMALE POPULATION
103.03
MALES / 100 FEMALES
97.06
FEMALES / 100 MALES
26.6
MEDIAN AGE
4.0
AVG FAMILY SIZE
3.6
AVG HOUSEHOLD SIZE
38,138
LABOR FORCE [ PEOPLE ]
74.4%
PERCENT IN LABOR FORCE
4.4%
UNEMPLOYMENT RATE
Lehi Zip Codes
Income in Lehi
Income Overview in Lehi
Per Capita Income in Lehi is $39,183, while median incomes of families and households are $125,448 and $117,243 respectively.
| Characteristic | Number | Measure |
| Per Capita Income | 77,110 | $39,183 |
| Median Family Income | 17,918 | $125,448 |
| Mean Family Income | 17,918 | $149,566 |
| Median Household Income | 21,250 | $117,243 |
| Mean Household Income | 21,250 | $141,228 |
| Income Deficit | 17,918 | $0 |
| Wage / Income Gap (%) | 77,110 | 60.07% |
| Wage / Income Gap ($) | 77,110 | 39.93¢ per $1 |
| Gini / Inequality Index | 77,110 | 0.37 |
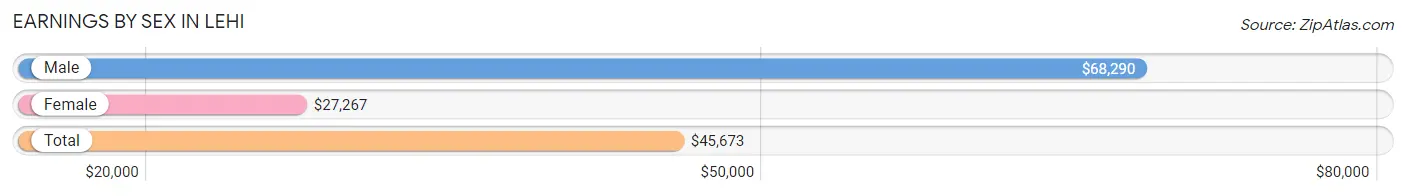
Earnings by Sex in Lehi
Average Earnings in Lehi are $45,673, $68,290 for men and $27,267 for women, a difference of 60.1%.
| Sex | Number | Average Earnings |
| Male | 22,800 (56.5%) | $68,290 |
| Female | 17,590 (43.5%) | $27,267 |
| Total | 40,390 (100.0%) | $45,673 |
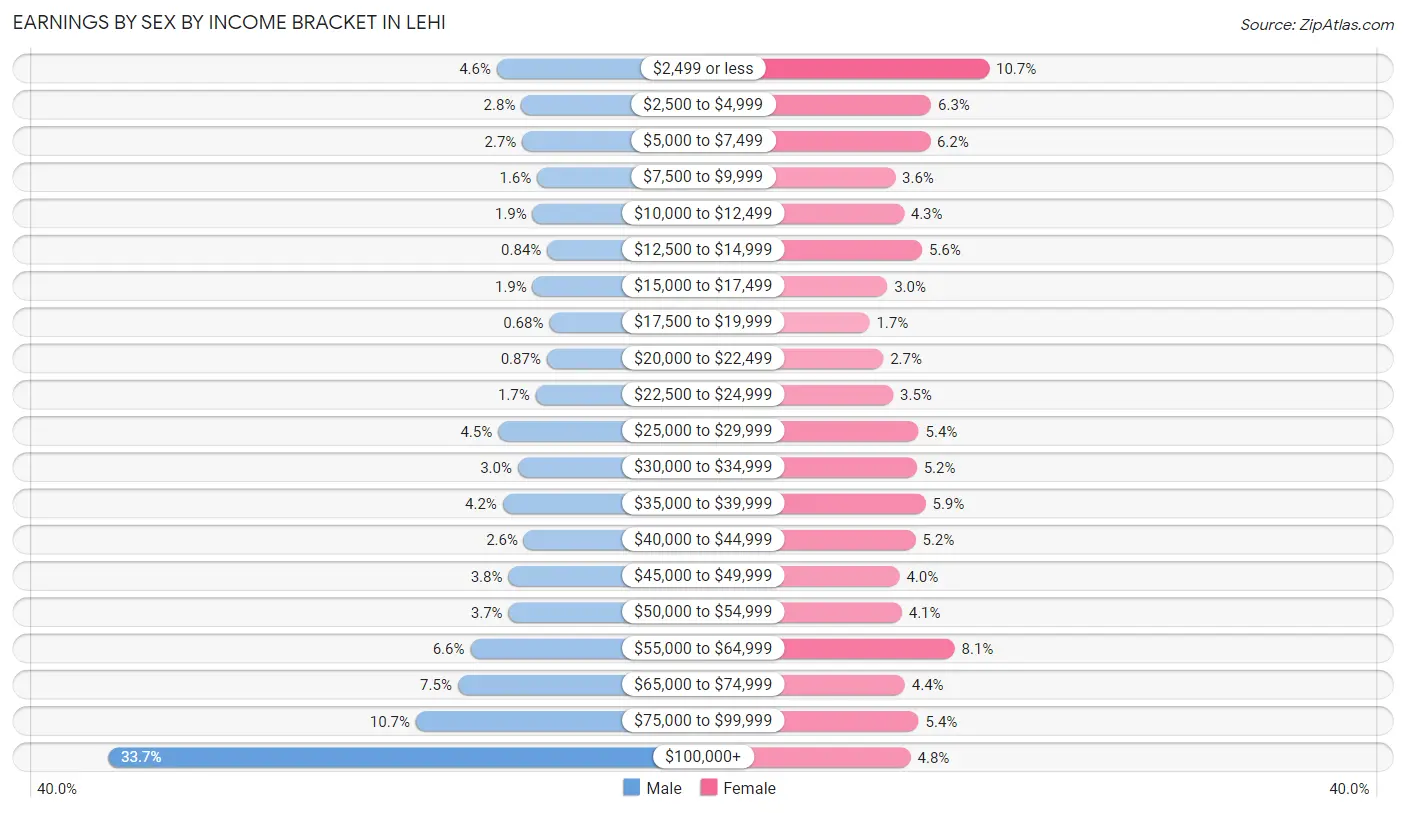
Earnings by Sex by Income Bracket in Lehi
The most common earnings brackets in Lehi are $100,000+ for men (7,693 | 33.7%) and $2,499 or less for women (1,875 | 10.7%).
| Income | Male | Female |
| $2,499 or less | 1,052 (4.6%) | 1,875 (10.7%) |
| $2,500 to $4,999 | 634 (2.8%) | 1,112 (6.3%) |
| $5,000 to $7,499 | 617 (2.7%) | 1,096 (6.2%) |
| $7,500 to $9,999 | 363 (1.6%) | 637 (3.6%) |
| $10,000 to $12,499 | 439 (1.9%) | 751 (4.3%) |
| $12,500 to $14,999 | 191 (0.8%) | 992 (5.6%) |
| $15,000 to $17,499 | 439 (1.9%) | 533 (3.0%) |
| $17,500 to $19,999 | 156 (0.7%) | 299 (1.7%) |
| $20,000 to $22,499 | 198 (0.9%) | 481 (2.7%) |
| $22,500 to $24,999 | 389 (1.7%) | 611 (3.5%) |
| $25,000 to $29,999 | 1,031 (4.5%) | 947 (5.4%) |
| $30,000 to $34,999 | 693 (3.0%) | 921 (5.2%) |
| $35,000 to $39,999 | 950 (4.2%) | 1,038 (5.9%) |
| $40,000 to $44,999 | 590 (2.6%) | 906 (5.1%) |
| $45,000 to $49,999 | 854 (3.7%) | 695 (4.0%) |
| $50,000 to $54,999 | 853 (3.7%) | 724 (4.1%) |
| $55,000 to $64,999 | 1,505 (6.6%) | 1,421 (8.1%) |
| $65,000 to $74,999 | 1,718 (7.5%) | 765 (4.3%) |
| $75,000 to $99,999 | 2,435 (10.7%) | 946 (5.4%) |
| $100,000+ | 7,693 (33.7%) | 840 (4.8%) |
| Total | 22,800 (100.0%) | 17,590 (100.0%) |
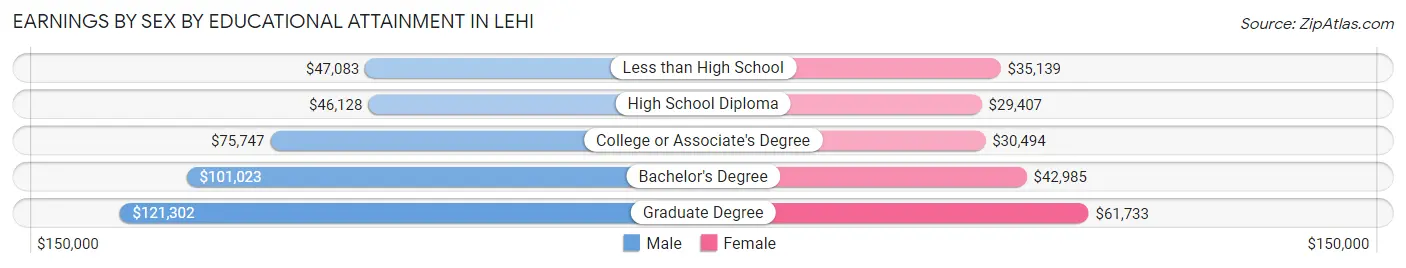
Earnings by Sex by Educational Attainment in Lehi
Average earnings in Lehi are $87,379 for men and $35,684 for women, a difference of 59.2%. Men with an educational attainment of graduate degree enjoy the highest average annual earnings of $121,302, while those with high school diploma education earn the least with $46,128. Women with an educational attainment of graduate degree earn the most with the average annual earnings of $61,733, while those with high school diploma education have the smallest earnings of $29,407.
| Educational Attainment | Male Income | Female Income |
| Less than High School | $47,083 | $35,139 |
| High School Diploma | $46,128 | $29,407 |
| College or Associate's Degree | $75,747 | $30,494 |
| Bachelor's Degree | $101,023 | $42,985 |
| Graduate Degree | $121,302 | $61,733 |
| Total | $87,379 | $35,684 |
Family Income in Lehi
Family Income Brackets in Lehi
According to the Lehi family income data, there are 4,910 families falling into the $100,000 to $149,999 income range, which is the most common income bracket and makes up 27.4% of all families. Conversely, the $10,000 to $14,999 income bracket is the least frequent group with only 36 families (0.2%) belonging to this category.
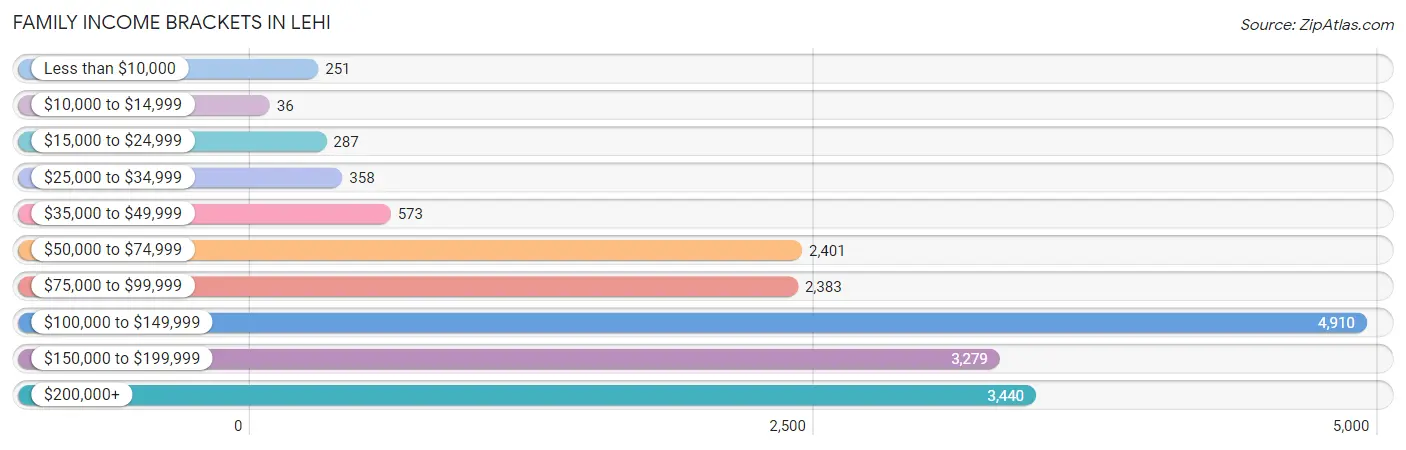
| Income Bracket | # Families | % Families |
| Less than $10,000 | 251 | 1.4% |
| $10,000 to $14,999 | 36 | 0.2% |
| $15,000 to $24,999 | 287 | 1.6% |
| $25,000 to $34,999 | 358 | 2.0% |
| $35,000 to $49,999 | 573 | 3.2% |
| $50,000 to $74,999 | 2,401 | 13.4% |
| $75,000 to $99,999 | 2,383 | 13.3% |
| $100,000 to $149,999 | 4,910 | 27.4% |
| $150,000 to $199,999 | 3,279 | 18.3% |
| $200,000+ | 3,440 | 19.2% |
Family Income by Famaliy Size in Lehi
5-person families (3,212 | 17.9%) account for the highest median family income in Lehi with $148,850 per family, while 2-person families (5,112 | 28.5%) have the highest median income of $51,620 per family member.
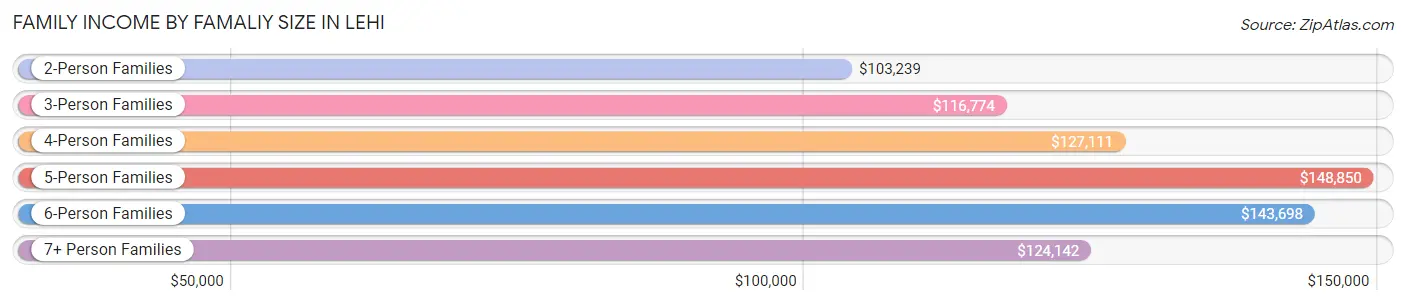
| Income Bracket | # Families | Median Income |
| 2-Person Families | 5,112 (28.5%) | $103,239 |
| 3-Person Families | 2,342 (13.1%) | $116,774 |
| 4-Person Families | 4,148 (23.2%) | $127,111 |
| 5-Person Families | 3,212 (17.9%) | $148,850 |
| 6-Person Families | 1,875 (10.5%) | $143,698 |
| 7+ Person Families | 1,229 (6.9%) | $124,142 |
| Total | 17,918 (100.0%) | $125,448 |
Family Income by Number of Earners in Lehi
The median family income in Lehi is $125,448, with families comprising 3+ earners (3,621) having the highest median family income of $161,143, while families with no earners (1,100) have the lowest median family income of $70,284, accounting for 20.2% and 6.1% of families, respectively.
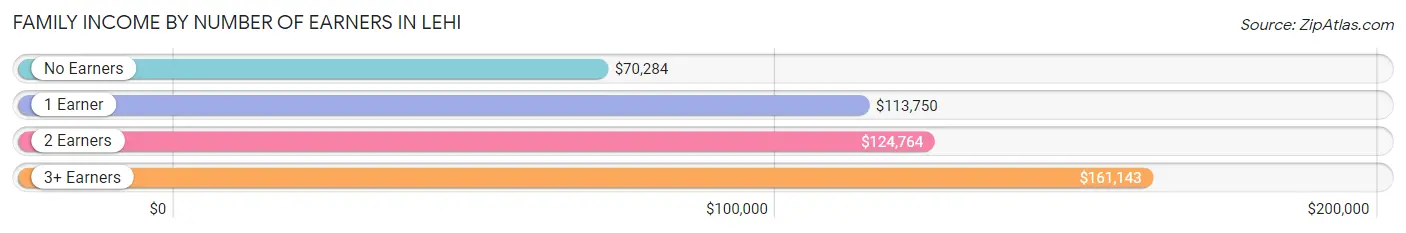
| Number of Earners | # Families | Median Income |
| No Earners | 1,100 (6.1%) | $70,284 |
| 1 Earner | 4,713 (26.3%) | $113,750 |
| 2 Earners | 8,484 (47.3%) | $124,764 |
| 3+ Earners | 3,621 (20.2%) | $161,143 |
| Total | 17,918 (100.0%) | $125,448 |
Household Income in Lehi
Household Income Brackets in Lehi
With 5,440 households falling in the category, the $100,000 to $149,999 income range is the most frequent in Lehi, accounting for 25.6% of all households. In contrast, only 64 households (0.3%) fall into the $10,000 to $14,999 income bracket, making it the least populous group.
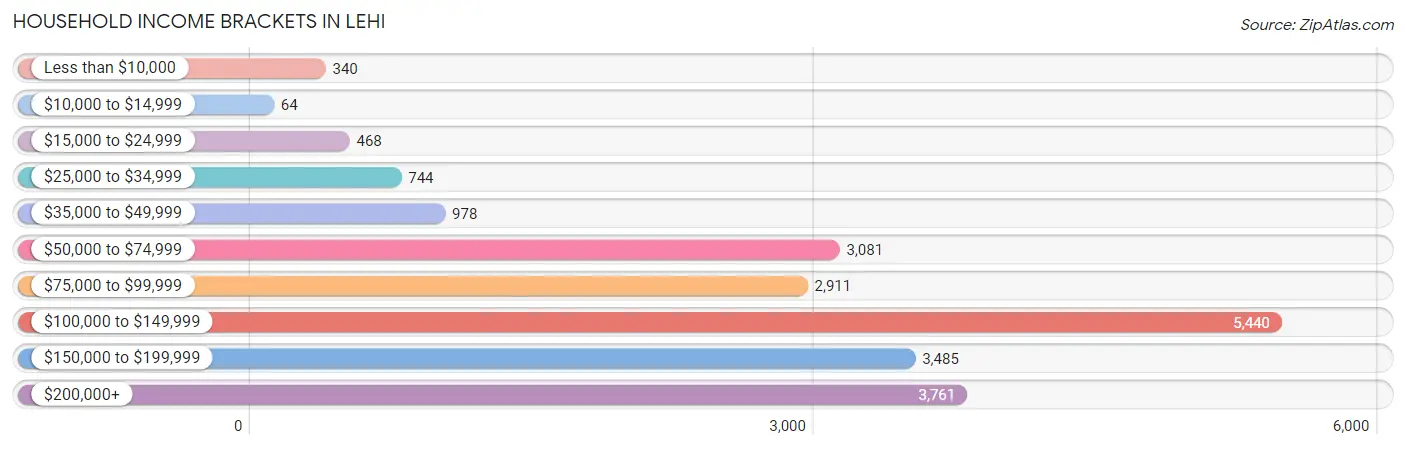
| Income Bracket | # Households | % Households |
| Less than $10,000 | 340 | 1.6% |
| $10,000 to $14,999 | 64 | 0.3% |
| $15,000 to $24,999 | 468 | 2.2% |
| $25,000 to $34,999 | 744 | 3.5% |
| $35,000 to $49,999 | 978 | 4.6% |
| $50,000 to $74,999 | 3,081 | 14.5% |
| $75,000 to $99,999 | 2,911 | 13.7% |
| $100,000 to $149,999 | 5,440 | 25.6% |
| $150,000 to $199,999 | 3,485 | 16.4% |
| $200,000+ | 3,761 | 17.7% |
Household Income by Householder Age in Lehi
The median household income in Lehi is $117,243, with the highest median household income of $141,110 found in the 45 to 64 years age bracket for the primary householder. A total of 6,283 households (29.6%) fall into this category. Meanwhile, the 65+ years age bracket for the primary householder has the lowest median household income of $72,917, with 2,482 households (11.7%) in this group.
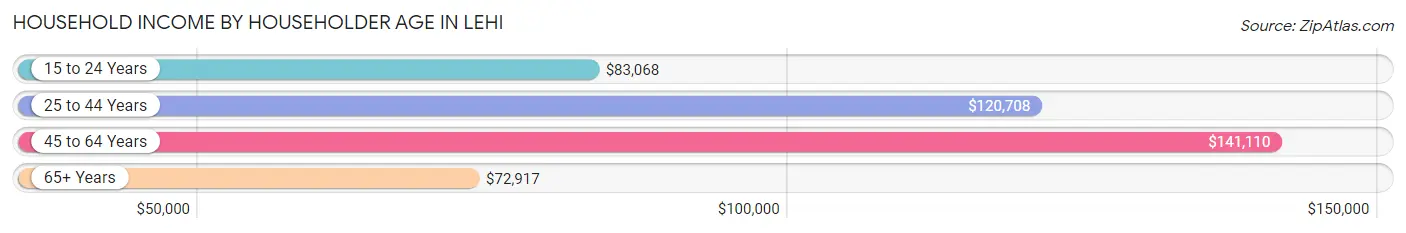
| Income Bracket | # Households | Median Income |
| 15 to 24 Years | 932 (4.4%) | $83,068 |
| 25 to 44 Years | 11,553 (54.4%) | $120,708 |
| 45 to 64 Years | 6,283 (29.6%) | $141,110 |
| 65+ Years | 2,482 (11.7%) | $72,917 |
| Total | 21,250 (100.0%) | $117,243 |
Poverty in Lehi
Income Below Poverty by Sex and Age in Lehi
With 3.9% poverty level for males and 5.7% for females among the residents of Lehi, 75 year old and over males and under 5 year old females are the most vulnerable to poverty, with 43 males (5.9%) and 348 females (9.6%) in their respective age groups living below the poverty level.
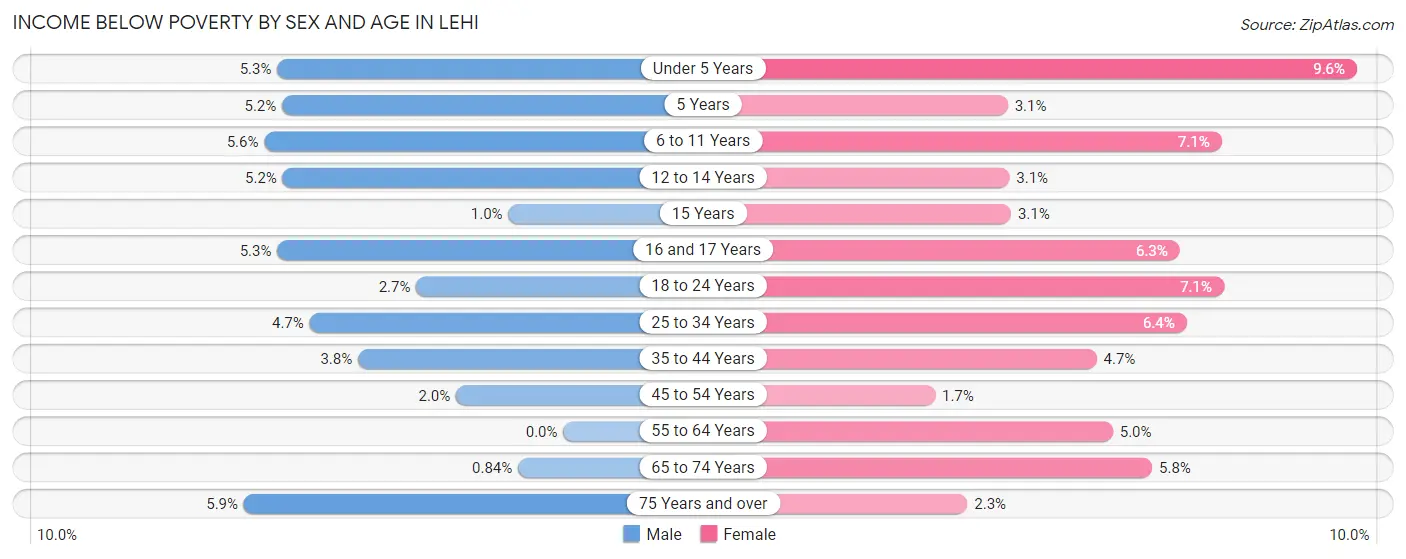
| Age Bracket | Male | Female |
| Under 5 Years | 199 (5.3%) | 348 (9.6%) |
| 5 Years | 39 (5.2%) | 28 (3.1%) |
| 6 to 11 Years | 293 (5.6%) | 368 (7.0%) |
| 12 to 14 Years | 134 (5.2%) | 71 (3.1%) |
| 15 Years | 7 (1.0%) | 20 (3.1%) |
| 16 and 17 Years | 89 (5.3%) | 85 (6.3%) |
| 18 to 24 Years | 110 (2.7%) | 289 (7.1%) |
| 25 to 34 Years | 272 (4.7%) | 376 (6.4%) |
| 35 to 44 Years | 249 (3.8%) | 287 (4.7%) |
| 45 to 54 Years | 71 (2.0%) | 58 (1.7%) |
| 55 to 64 Years | 0 (0.0%) | 110 (5.0%) |
| 65 to 74 Years | 11 (0.8%) | 79 (5.8%) |
| 75 Years and over | 43 (5.9%) | 22 (2.3%) |
| Total | 1,517 (3.9%) | 2,141 (5.7%) |
Income Above Poverty by Sex and Age in Lehi
According to the poverty statistics in Lehi, males aged 55 to 64 years and females aged 45 to 54 years are the age groups that are most secure financially, with 100.0% of males and 98.3% of females in these age groups living above the poverty line.
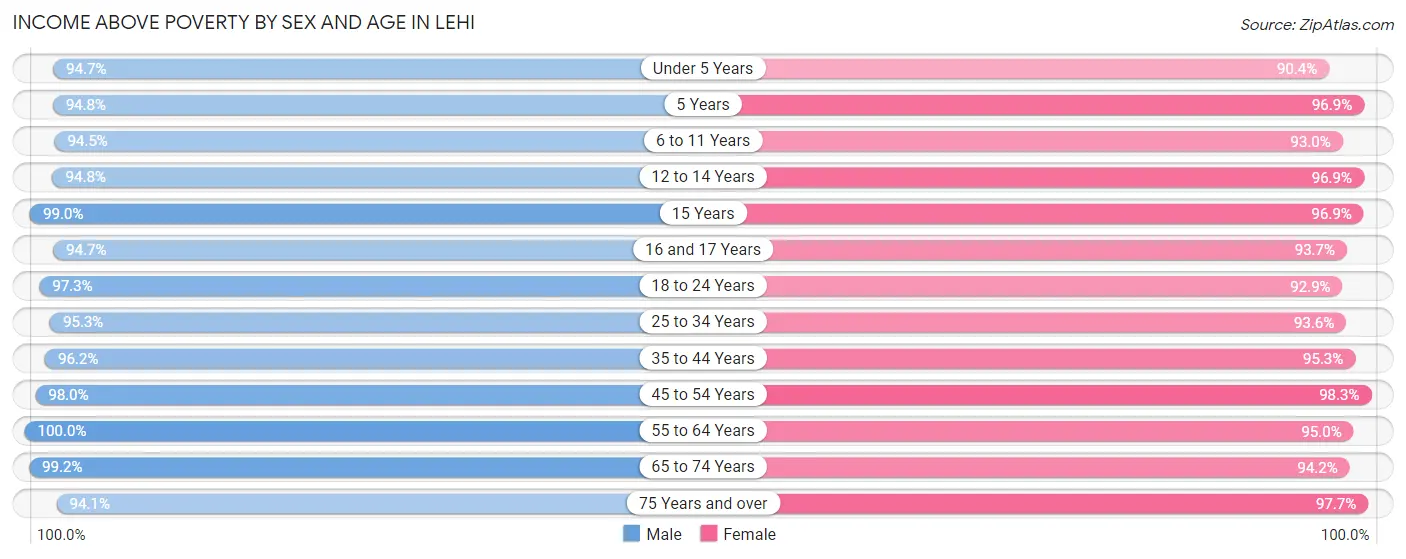
| Age Bracket | Male | Female |
| Under 5 Years | 3,551 (94.7%) | 3,292 (90.4%) |
| 5 Years | 708 (94.8%) | 880 (96.9%) |
| 6 to 11 Years | 4,989 (94.5%) | 4,855 (92.9%) |
| 12 to 14 Years | 2,436 (94.8%) | 2,212 (96.9%) |
| 15 Years | 682 (99.0%) | 616 (96.9%) |
| 16 and 17 Years | 1,588 (94.7%) | 1,271 (93.7%) |
| 18 to 24 Years | 3,916 (97.3%) | 3,785 (92.9%) |
| 25 to 34 Years | 5,504 (95.3%) | 5,497 (93.6%) |
| 35 to 44 Years | 6,291 (96.2%) | 5,784 (95.3%) |
| 45 to 54 Years | 3,500 (98.0%) | 3,289 (98.3%) |
| 55 to 64 Years | 2,381 (100.0%) | 2,079 (95.0%) |
| 65 to 74 Years | 1,294 (99.2%) | 1,293 (94.2%) |
| 75 Years and over | 682 (94.1%) | 921 (97.7%) |
| Total | 37,522 (96.1%) | 35,774 (94.4%) |
Income Below Poverty Among Married-Couple Families in Lehi
The poverty statistics for married-couple families in Lehi show that 2.5% or 399 of the total 16,314 families live below the poverty line. Families with 5 or more children have the highest poverty rate of 16.0%, comprising of 136 families. On the other hand, families with 3 or 4 children have the lowest poverty rate of 0.6%, which includes 24 families.
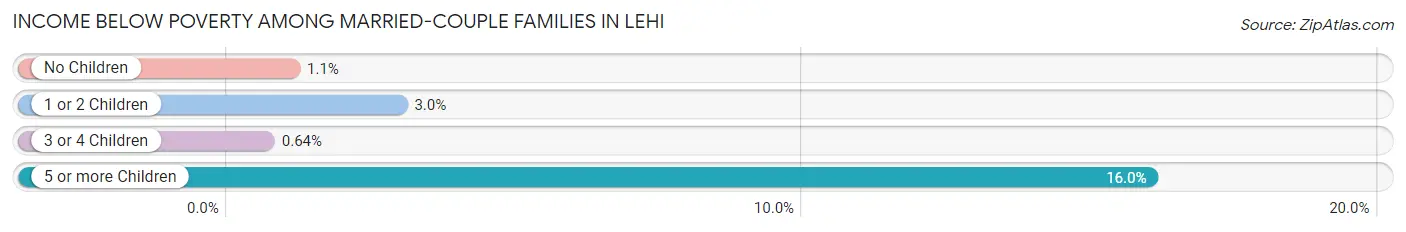
| Children | Above Poverty | Below Poverty |
| No Children | 5,597 (98.9%) | 61 (1.1%) |
| 1 or 2 Children | 5,851 (97.1%) | 178 (2.9%) |
| 3 or 4 Children | 3,754 (99.4%) | 24 (0.6%) |
| 5 or more Children | 713 (84.0%) | 136 (16.0%) |
| Total | 15,915 (97.6%) | 399 (2.5%) |
Income Below Poverty Among Single-Parent Households in Lehi
According to the poverty data in Lehi, 5.6% or 27 single-father households and 20.0% or 224 single-mother households are living below the poverty line. Among single-father households, those with no children have the highest poverty rate, with 27 households (11.8%) experiencing poverty. Likewise, among single-mother households, those with 5 or more children have the highest poverty rate, with 25 households (100.0%) falling below the poverty line.
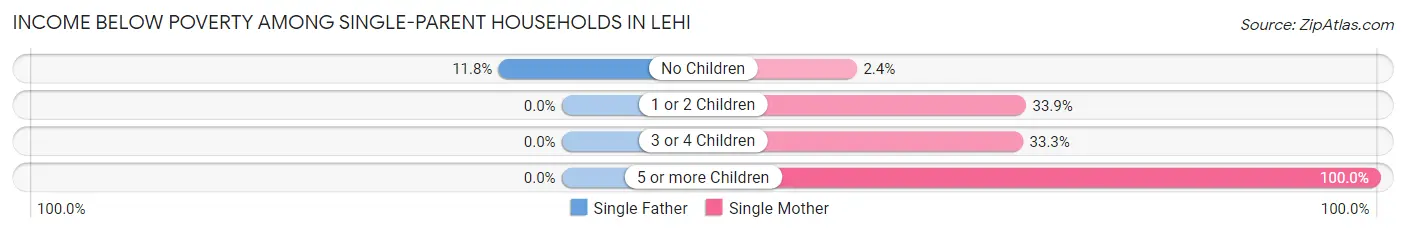
| Children | Single Father | Single Mother |
| No Children | 27 (11.8%) | 13 (2.4%) |
| 1 or 2 Children | 0 (0.0%) | 124 (33.9%) |
| 3 or 4 Children | 0 (0.0%) | 62 (33.3%) |
| 5 or more Children | 0 (0.0%) | 25 (100.0%) |
| Total | 27 (5.6%) | 224 (20.0%) |
Income Below Poverty Among Married-Couple vs Single-Parent Households in Lehi
The poverty data for Lehi shows that 399 of the married-couple family households (2.5%) and 251 of the single-parent households (15.7%) are living below the poverty level. Within the married-couple family households, those with 5 or more children have the highest poverty rate, with 136 households (16.0%) falling below the poverty line. Among the single-parent households, those with 5 or more children have the highest poverty rate, with 25 household (71.4%) living below poverty.
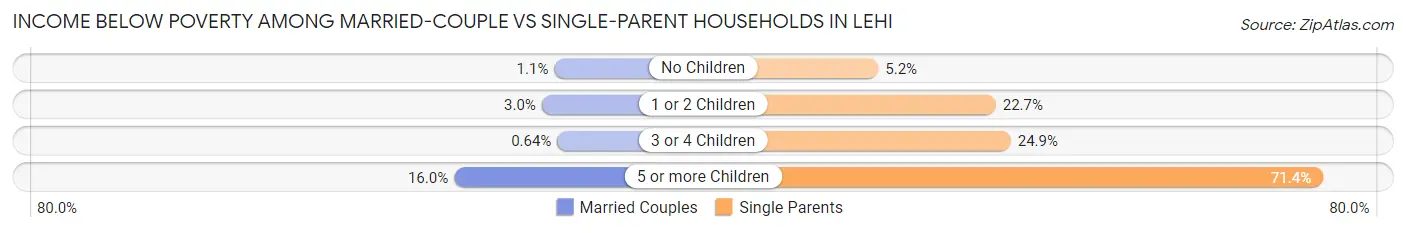
| Children | Married-Couple Families | Single-Parent Households |
| No Children | 61 (1.1%) | 40 (5.2%) |
| 1 or 2 Children | 178 (2.9%) | 124 (22.7%) |
| 3 or 4 Children | 24 (0.6%) | 62 (24.9%) |
| 5 or more Children | 136 (16.0%) | 25 (71.4%) |
| Total | 399 (2.5%) | 251 (15.7%) |
Race in Lehi
The most populous races in Lehi are White / Caucasian (69,020 | 89.5%), Hispanic or Latino (5,925 | 7.7%), and Two or more Races (4,104 | 5.3%).
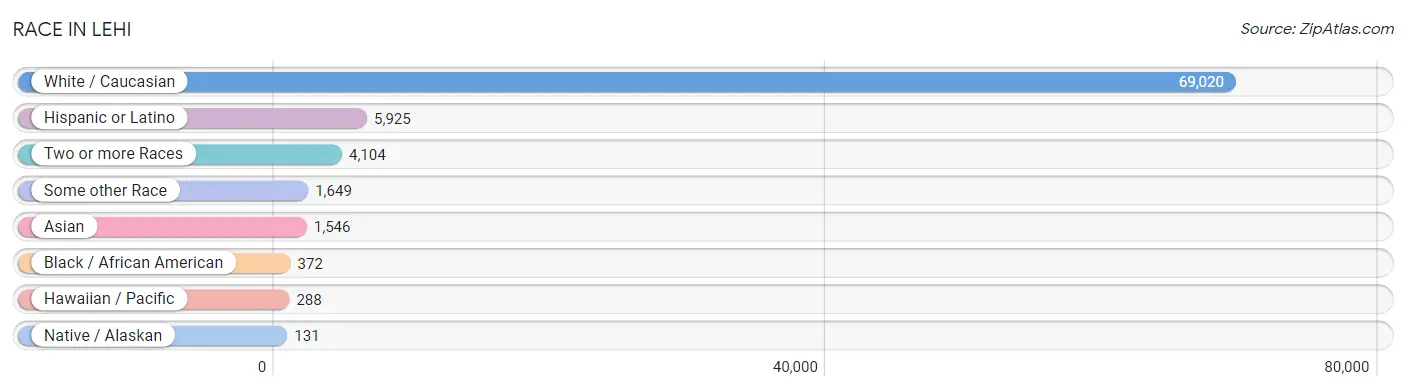
| Race | # Population | % Population |
| Asian | 1,546 | 2.0% |
| Black / African American | 372 | 0.5% |
| Hawaiian / Pacific | 288 | 0.4% |
| Hispanic or Latino | 5,925 | 7.7% |
| Native / Alaskan | 131 | 0.2% |
| White / Caucasian | 69,020 | 89.5% |
| Two or more Races | 4,104 | 5.3% |
| Some other Race | 1,649 | 2.1% |
| Total | 77,110 | 100.0% |
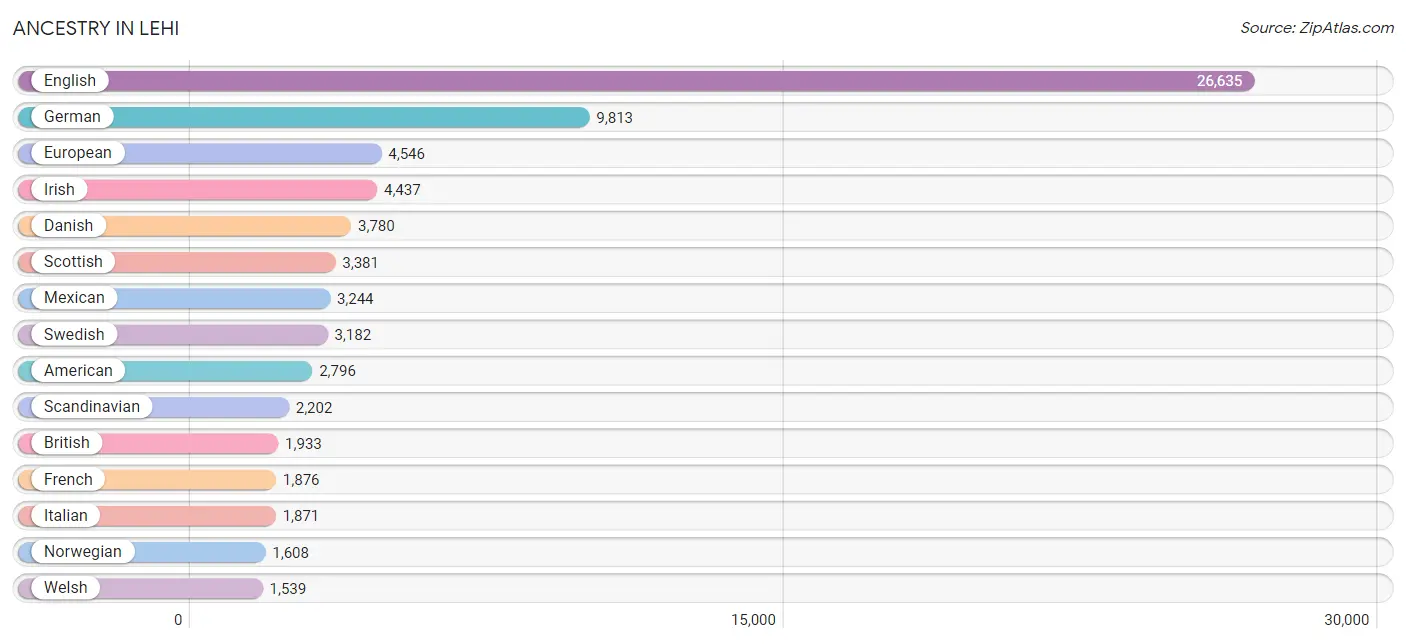
Ancestry in Lehi
The most populous ancestries reported in Lehi are English (26,635 | 34.5%), German (9,813 | 12.7%), European (4,546 | 5.9%), Irish (4,437 | 5.8%), and Danish (3,780 | 4.9%), together accounting for 63.8% of all Lehi residents.
| Ancestry | # Population | % Population |
| African | 17 | 0.0% |
| Albanian | 63 | 0.1% |
| Aleut | 21 | 0.0% |
| American | 2,796 | 3.6% |
| Apache | 20 | 0.0% |
| Arab | 293 | 0.4% |
| Argentinean | 193 | 0.3% |
| Armenian | 16 | 0.0% |
| Australian | 22 | 0.0% |
| Austrian | 49 | 0.1% |
| Basque | 39 | 0.1% |
| Belgian | 93 | 0.1% |
| Bhutanese | 861 | 1.1% |
| Bolivian | 111 | 0.1% |
| Brazilian | 334 | 0.4% |
| British | 1,933 | 2.5% |
| Burmese | 341 | 0.4% |
| Cajun | 21 | 0.0% |
| Canadian | 197 | 0.3% |
| Central American | 254 | 0.3% |
| Cherokee | 42 | 0.1% |
| Cheyenne | 10 | 0.0% |
| Chilean | 155 | 0.2% |
| Choctaw | 43 | 0.1% |
| Colombian | 23 | 0.0% |
| Croatian | 64 | 0.1% |
| Cuban | 13 | 0.0% |
| Czech | 21 | 0.0% |
| Danish | 3,780 | 4.9% |
| Dominican | 18 | 0.0% |
| Dutch | 984 | 1.3% |
| Eastern European | 56 | 0.1% |
| Ecuadorian | 351 | 0.5% |
| Egyptian | 70 | 0.1% |
| English | 26,635 | 34.5% |
| European | 4,546 | 5.9% |
| Filipino | 29 | 0.0% |
| Finnish | 132 | 0.2% |
| French | 1,876 | 2.4% |
| French Canadian | 242 | 0.3% |
| German | 9,813 | 12.7% |
| Greek | 336 | 0.4% |
| Guamanian / Chamorro | 140 | 0.2% |
| Guatemalan | 106 | 0.1% |
| Haitian | 3 | 0.0% |
| Hungarian | 84 | 0.1% |
| Icelander | 61 | 0.1% |
| Indian (Asian) | 855 | 1.1% |
| Iranian | 14 | 0.0% |
| Iraqi | 49 | 0.1% |
| Irish | 4,437 | 5.8% |
| Iroquois | 15 | 0.0% |
| Italian | 1,871 | 2.4% |
| Jamaican | 10 | 0.0% |
| Korean | 364 | 0.5% |
| Laotian | 41 | 0.1% |
| Lebanese | 15 | 0.0% |
| Lithuanian | 8 | 0.0% |
| Macedonian | 12 | 0.0% |
| Mexican | 3,244 | 4.2% |
| Mexican American Indian | 36 | 0.1% |
| Native Hawaiian | 415 | 0.5% |
| Navajo | 69 | 0.1% |
| New Zealander | 13 | 0.0% |
| Nicaraguan | 10 | 0.0% |
| Nigerian | 31 | 0.0% |
| Northern European | 214 | 0.3% |
| Norwegian | 1,608 | 2.1% |
| Pakistani | 63 | 0.1% |
| Palestinian | 6 | 0.0% |
| Peruvian | 153 | 0.2% |
| Polish | 308 | 0.4% |
| Portuguese | 106 | 0.1% |
| Puerto Rican | 239 | 0.3% |
| Romanian | 34 | 0.0% |
| Russian | 206 | 0.3% |
| Salvadoran | 133 | 0.2% |
| Samoan | 410 | 0.5% |
| Scandinavian | 2,202 | 2.9% |
| Scotch-Irish | 837 | 1.1% |
| Scottish | 3,381 | 4.4% |
| Sioux | 24 | 0.0% |
| Slavic | 22 | 0.0% |
| Slovak | 151 | 0.2% |
| South American | 1,265 | 1.6% |
| Spaniard | 245 | 0.3% |
| Spanish | 473 | 0.6% |
| Spanish American | 4 | 0.0% |
| Spanish American Indian | 10 | 0.0% |
| Sri Lankan | 438 | 0.6% |
| Subsaharan African | 56 | 0.1% |
| Swedish | 3,182 | 4.1% |
| Swiss | 902 | 1.2% |
| Thai | 583 | 0.8% |
| Tongan | 173 | 0.2% |
| Ukrainian | 115 | 0.2% |
| Venezuelan | 279 | 0.4% |
| Welsh | 1,539 | 2.0% |
| Yugoslavian | 28 | 0.0% | View All 99 Rows |
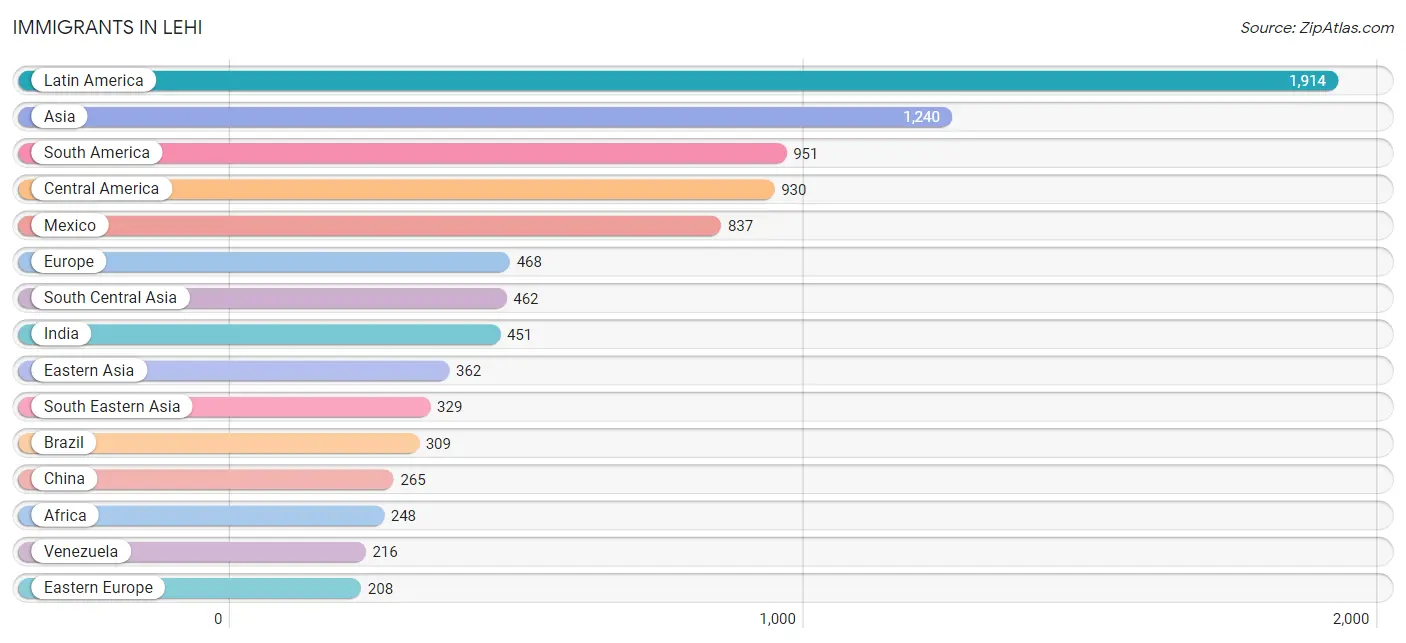
Immigrants in Lehi
The most numerous immigrant groups reported in Lehi came from Latin America (1,914 | 2.5%), Asia (1,240 | 1.6%), South America (951 | 1.2%), Central America (930 | 1.2%), and Mexico (837 | 1.1%), together accounting for 7.6% of all Lehi residents.
| Immigration Origin | # Population | % Population |
| Africa | 248 | 0.3% |
| Argentina | 99 | 0.1% |
| Asia | 1,240 | 1.6% |
| Australia | 132 | 0.2% |
| Belarus | 24 | 0.0% |
| Belgium | 11 | 0.0% |
| Bolivia | 99 | 0.1% |
| Brazil | 309 | 0.4% |
| Canada | 195 | 0.3% |
| Caribbean | 33 | 0.0% |
| Central America | 930 | 1.2% |
| Chile | 104 | 0.1% |
| China | 265 | 0.3% |
| Colombia | 38 | 0.1% |
| Denmark | 7 | 0.0% |
| Dominican Republic | 33 | 0.0% |
| Eastern Asia | 362 | 0.5% |
| Eastern Europe | 208 | 0.3% |
| Ecuador | 65 | 0.1% |
| Egypt | 160 | 0.2% |
| El Salvador | 53 | 0.1% |
| England | 47 | 0.1% |
| Europe | 468 | 0.6% |
| France | 71 | 0.1% |
| Germany | 50 | 0.1% |
| Guatemala | 31 | 0.0% |
| Hong Kong | 47 | 0.1% |
| India | 451 | 0.6% |
| Iraq | 37 | 0.1% |
| Japan | 52 | 0.1% |
| Kazakhstan | 11 | 0.0% |
| Korea | 45 | 0.1% |
| Latin America | 1,914 | 2.5% |
| Lithuania | 8 | 0.0% |
| Mexico | 837 | 1.1% |
| Micronesia | 5 | 0.0% |
| Moldova | 2 | 0.0% |
| Netherlands | 35 | 0.1% |
| Nigeria | 11 | 0.0% |
| Northern Africa | 160 | 0.2% |
| Northern Europe | 68 | 0.1% |
| Oceania | 176 | 0.2% |
| Panama | 9 | 0.0% |
| Peru | 21 | 0.0% |
| Philippines | 134 | 0.2% |
| Poland | 43 | 0.1% |
| Romania | 50 | 0.1% |
| Russia | 38 | 0.1% |
| Saudi Arabia | 50 | 0.1% |
| Scotland | 14 | 0.0% |
| South Africa | 77 | 0.1% |
| South America | 951 | 1.2% |
| South Central Asia | 462 | 0.6% |
| South Eastern Asia | 329 | 0.4% |
| Southern Europe | 24 | 0.0% |
| Spain | 24 | 0.0% |
| Switzerland | 1 | 0.0% |
| Thailand | 12 | 0.0% |
| Ukraine | 43 | 0.1% |
| Venezuela | 216 | 0.3% |
| Vietnam | 183 | 0.2% |
| Western Africa | 11 | 0.0% |
| Western Asia | 87 | 0.1% |
| Western Europe | 168 | 0.2% | View All 64 Rows |
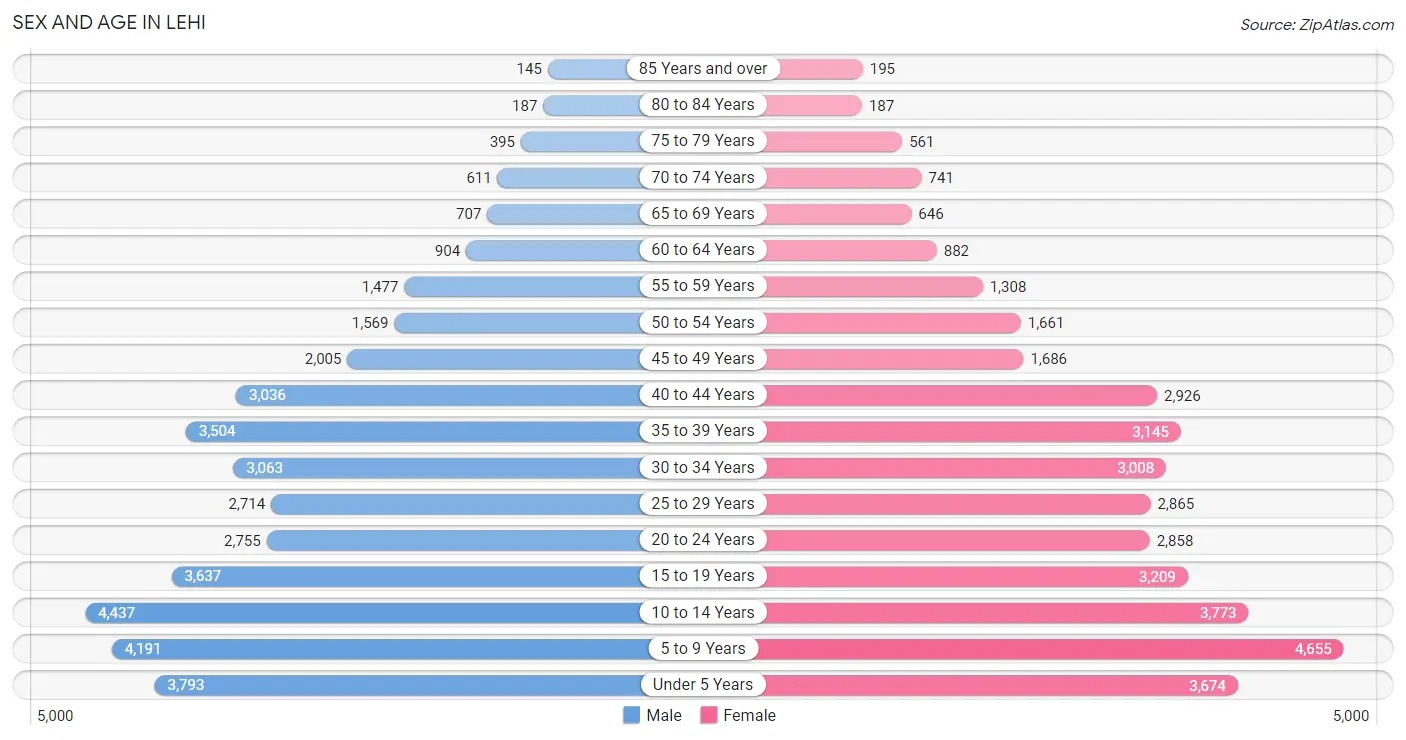
Sex and Age in Lehi
Sex and Age in Lehi
The most populous age groups in Lehi are 10 to 14 Years (4,437 | 11.3%) for men and 5 to 9 Years (4,655 | 12.3%) for women.
| Age Bracket | Male | Female |
| Under 5 Years | 3,793 (9.7%) | 3,674 (9.7%) |
| 5 to 9 Years | 4,191 (10.7%) | 4,655 (12.3%) |
| 10 to 14 Years | 4,437 (11.3%) | 3,773 (9.9%) |
| 15 to 19 Years | 3,637 (9.3%) | 3,209 (8.5%) |
| 20 to 24 Years | 2,755 (7.0%) | 2,858 (7.5%) |
| 25 to 29 Years | 2,714 (6.9%) | 2,865 (7.5%) |
| 30 to 34 Years | 3,063 (7.8%) | 3,008 (7.9%) |
| 35 to 39 Years | 3,504 (8.9%) | 3,145 (8.3%) |
| 40 to 44 Years | 3,036 (7.8%) | 2,926 (7.7%) |
| 45 to 49 Years | 2,005 (5.1%) | 1,686 (4.4%) |
| 50 to 54 Years | 1,569 (4.0%) | 1,661 (4.4%) |
| 55 to 59 Years | 1,477 (3.8%) | 1,308 (3.4%) |
| 60 to 64 Years | 904 (2.3%) | 882 (2.3%) |
| 65 to 69 Years | 707 (1.8%) | 646 (1.7%) |
| 70 to 74 Years | 611 (1.6%) | 741 (1.9%) |
| 75 to 79 Years | 395 (1.0%) | 561 (1.5%) |
| 80 to 84 Years | 187 (0.5%) | 187 (0.5%) |
| 85 Years and over | 145 (0.4%) | 195 (0.5%) |
| Total | 39,130 (100.0%) | 37,980 (100.0%) |
Families and Households in Lehi
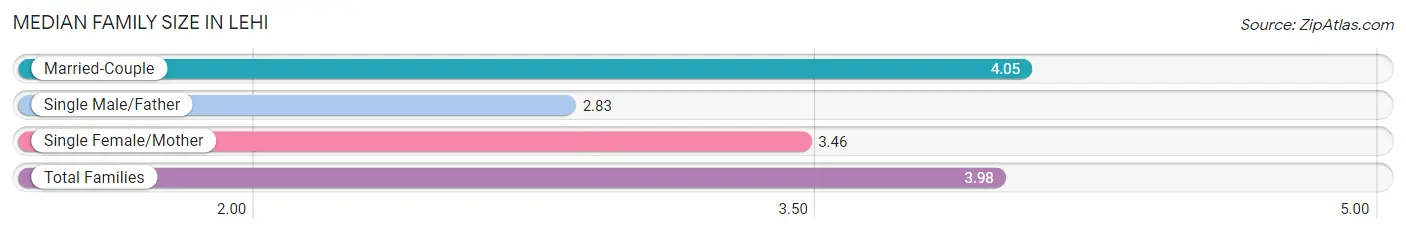
Median Family Size in Lehi
The median family size in Lehi is 3.98 persons per family, with married-couple families (16,314 | 91.0%) accounting for the largest median family size of 4.05 persons per family. On the other hand, single male/father families (483 | 2.7%) represent the smallest median family size with 2.83 persons per family.
| Family Type | # Families | Family Size |
| Married-Couple | 16,314 (91.0%) | 4.05 |
| Single Male/Father | 483 (2.7%) | 2.83 |
| Single Female/Mother | 1,121 (6.3%) | 3.46 |
| Total Families | 17,918 (100.0%) | 3.98 |
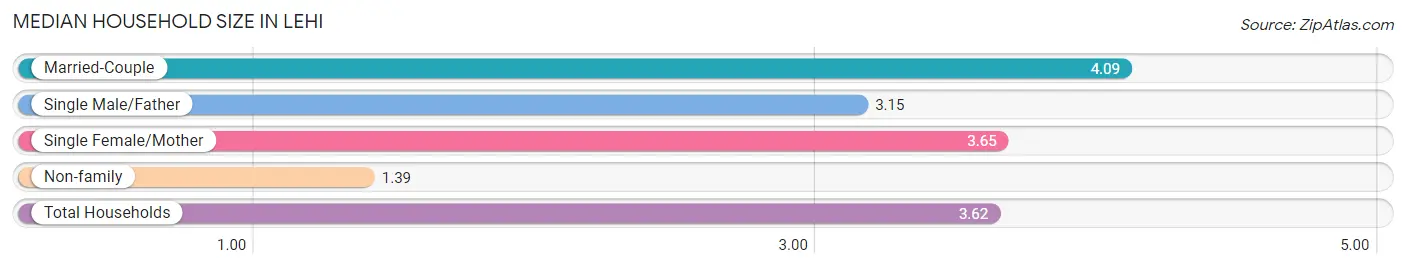
Median Household Size in Lehi
The median household size in Lehi is 3.62 persons per household, with married-couple households (16,314 | 76.8%) accounting for the largest median household size of 4.09 persons per household. non-family households (3,332 | 15.7%) represent the smallest median household size with 1.39 persons per household.
| Household Type | # Households | Household Size |
| Married-Couple | 16,314 (76.8%) | 4.09 |
| Single Male/Father | 483 (2.3%) | 3.15 |
| Single Female/Mother | 1,121 (5.3%) | 3.65 |
| Non-family | 3,332 (15.7%) | 1.39 |
| Total Households | 21,250 (100.0%) | 3.62 |
Household Size by Marriage Status in Lehi
Out of a total of 21,250 households in Lehi, 17,918 (84.3%) are family households, while 3,332 (15.7%) are nonfamily households. The most numerous type of family households are 2-person households, comprising 4,770, and the most common type of nonfamily households are 1-person households, comprising 2,336.
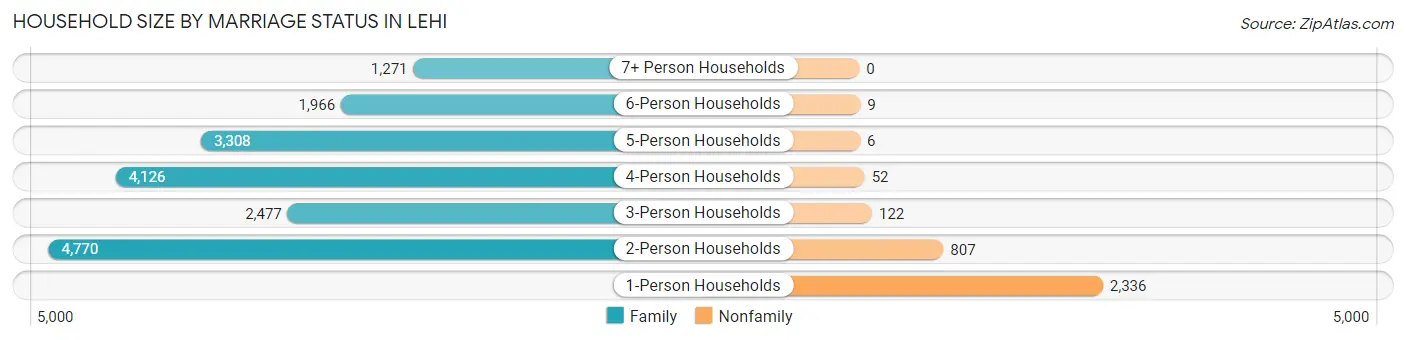
| Household Size | Family Households | Nonfamily Households |
| 1-Person Households | - | 2,336 (11.0%) |
| 2-Person Households | 4,770 (22.5%) | 807 (3.8%) |
| 3-Person Households | 2,477 (11.7%) | 122 (0.6%) |
| 4-Person Households | 4,126 (19.4%) | 52 (0.2%) |
| 5-Person Households | 3,308 (15.6%) | 6 (0.0%) |
| 6-Person Households | 1,966 (9.2%) | 9 (0.0%) |
| 7+ Person Households | 1,271 (6.0%) | 0 (0.0%) |
| Total | 17,918 (84.3%) | 3,332 (15.7%) |
Female Fertility in Lehi
Fertility by Age in Lehi
Average fertility rate in Lehi is 66.0 births per 1,000 women. Women in the age bracket of 20 to 34 years have the highest fertility rate with 126.0 births per 1,000 women. Women in the age bracket of 20 to 34 years acount for 83.5% of all women with births.
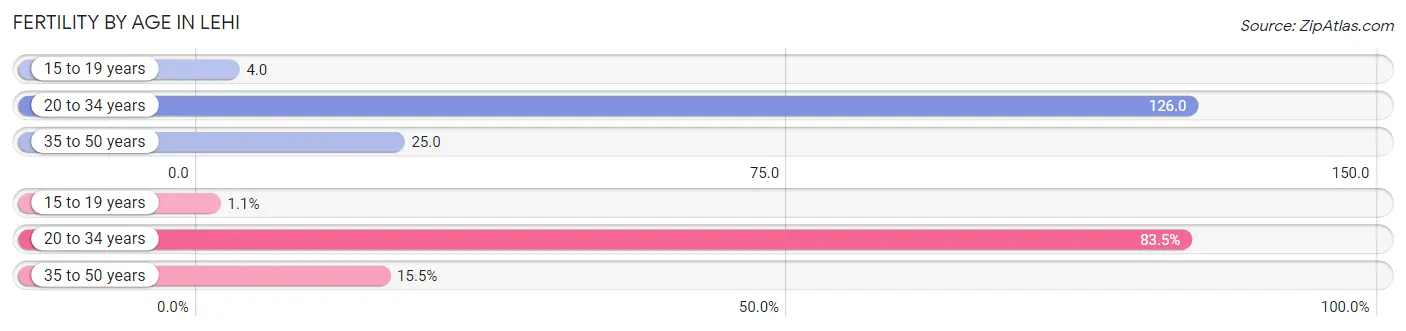
| Age Bracket | Women with Births | Births / 1,000 Women |
| 15 to 19 years | 14 (1.1%) | 4.0 |
| 20 to 34 years | 1,097 (83.5%) | 126.0 |
| 35 to 50 years | 203 (15.4%) | 25.0 |
| Total | 1,314 (100.0%) | 66.0 |
Fertility by Age by Marriage Status in Lehi
95.4% of women with births (1,314) in Lehi are married. The highest percentage of unmarried women with births falls into 20 to 34 years age bracket with 5.5% of them unmarried at the time of birth, while the lowest percentage of unmarried women with births belong to 15 to 19 years age bracket with 0.0% of them unmarried.
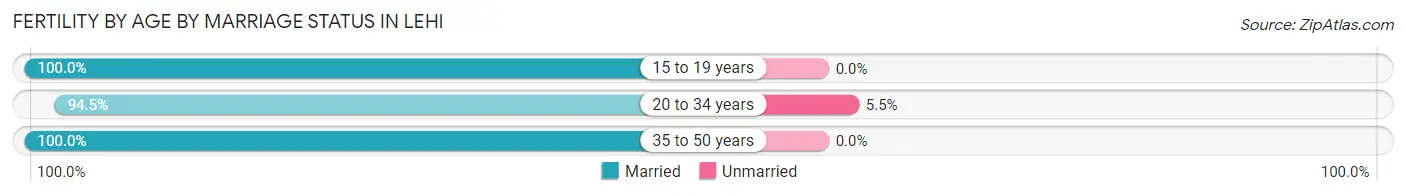
| Age Bracket | Married | Unmarried |
| 15 to 19 years | 14 (100.0%) | 0 (0.0%) |
| 20 to 34 years | 1,037 (94.5%) | 60 (5.5%) |
| 35 to 50 years | 203 (100.0%) | 0 (0.0%) |
| Total | 1,254 (95.4%) | 60 (4.6%) |
Fertility by Education in Lehi
Average fertility rate in Lehi is 66.0 births per 1,000 women. Women with the education attainment of bachelor's degree have the highest fertility rate of 104.0 births per 1,000 women, while women with the education attainment of less than high school have the lowest fertility at 14.0 births per 1,000 women. Women with the education attainment of bachelor's degree represent 46.0% of all women with births.
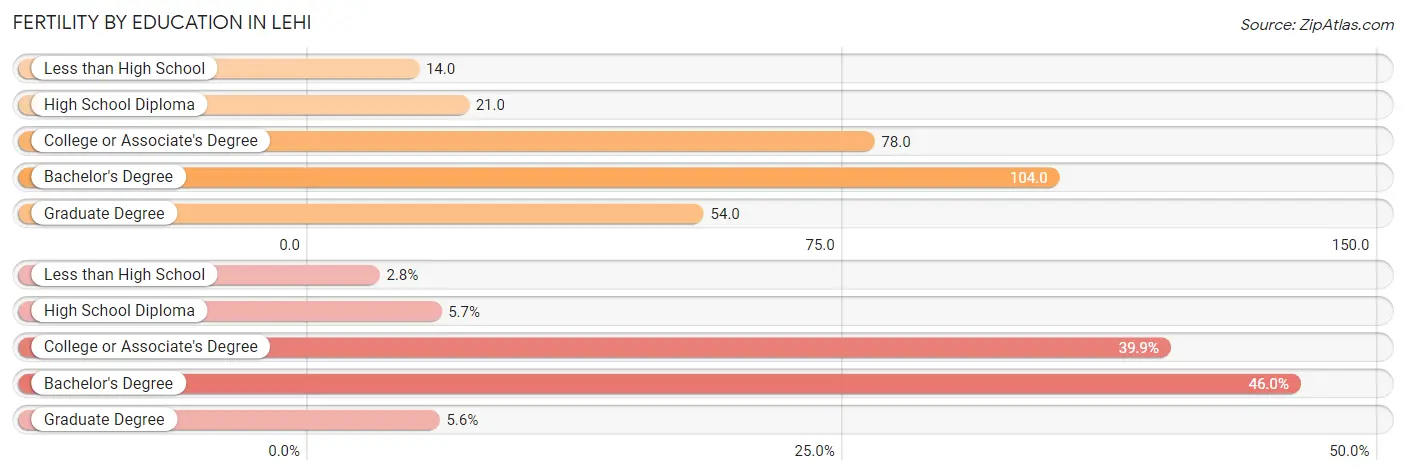
| Educational Attainment | Women with Births | Births / 1,000 Women |
| Less than High School | 37 (2.8%) | 14.0 |
| High School Diploma | 75 (5.7%) | 21.0 |
| College or Associate's Degree | 524 (39.9%) | 78.0 |
| Bachelor's Degree | 604 (46.0%) | 104.0 |
| Graduate Degree | 74 (5.6%) | 54.0 |
| Total | 1,314 (100.0%) | 66.0 |
Fertility by Education by Marriage Status in Lehi
4.6% of women with births in Lehi are unmarried. Women with the educational attainment of bachelor's degree are most likely to be married with 100.0% of them married at childbirth, while women with the educational attainment of less than high school are least likely to be married with 18.9% of them unmarried at childbirth.
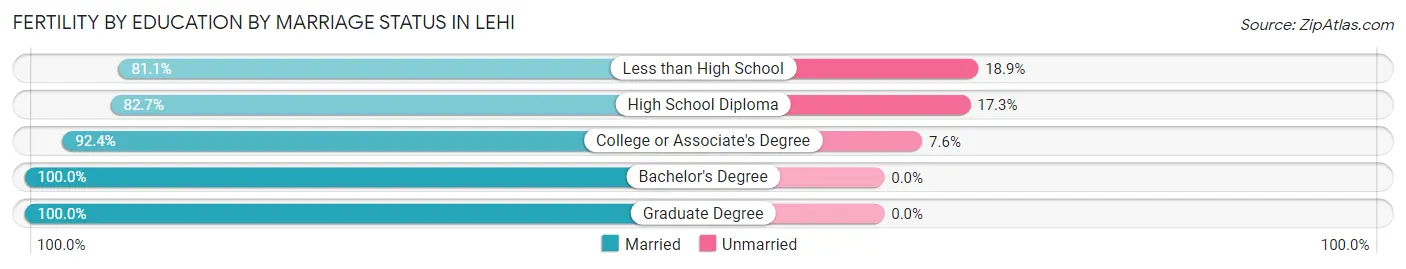
| Educational Attainment | Married | Unmarried |
| Less than High School | 30 (81.1%) | 7 (18.9%) |
| High School Diploma | 62 (82.7%) | 13 (17.3%) |
| College or Associate's Degree | 484 (92.4%) | 40 (7.6%) |
| Bachelor's Degree | 604 (100.0%) | 0 (0.0%) |
| Graduate Degree | 74 (100.0%) | 0 (0.0%) |
| Total | 1,254 (95.4%) | 60 (4.6%) |
Employment Characteristics in Lehi
Employment by Class of Employer in Lehi
Among the 35,884 employed individuals in Lehi, private company employees (25,307 | 70.5%), local government employees (2,562 | 7.1%), and not-for-profit organizations (2,181 | 6.1%) make up the most common classes of employment.
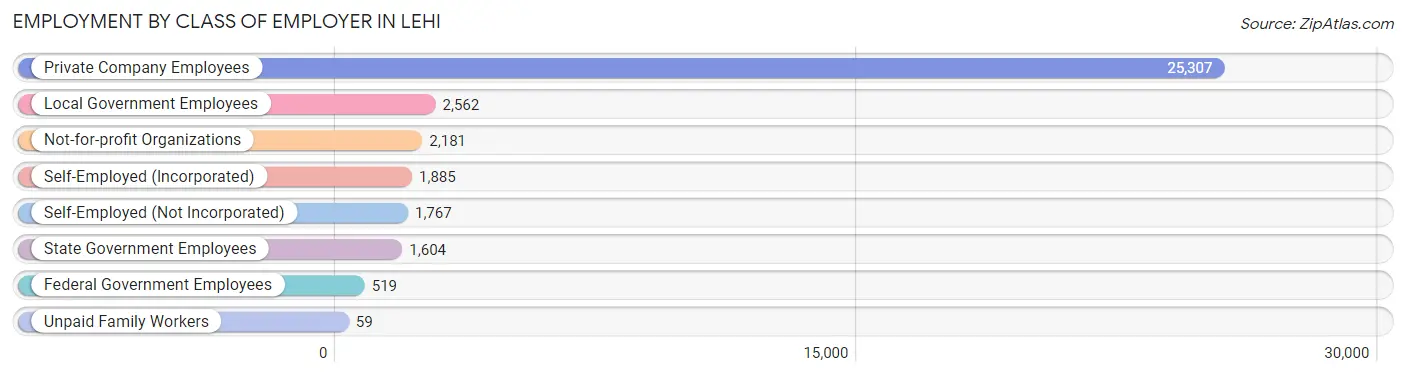
| Employer Class | # Employees | % Employees |
| Private Company Employees | 25,307 | 70.5% |
| Self-Employed (Incorporated) | 1,885 | 5.2% |
| Self-Employed (Not Incorporated) | 1,767 | 4.9% |
| Not-for-profit Organizations | 2,181 | 6.1% |
| Local Government Employees | 2,562 | 7.1% |
| State Government Employees | 1,604 | 4.5% |
| Federal Government Employees | 519 | 1.5% |
| Unpaid Family Workers | 59 | 0.2% |
| Total | 35,884 | 100.0% |
Employment Status by Age in Lehi
According to the labor force statistics for Lehi, out of the total population over 16 years of age (51,261), 74.4% or 38,138 individuals are in the labor force, with 4.4% or 1,678 of them unemployed. The age group with the highest labor force participation rate is 45 to 54 years, with 89.0% or 6,160 individuals in the labor force. Within the labor force, the 20 to 24 years age range has the highest percentage of unemployed individuals, with 11.7% or 581 of them being unemployed.
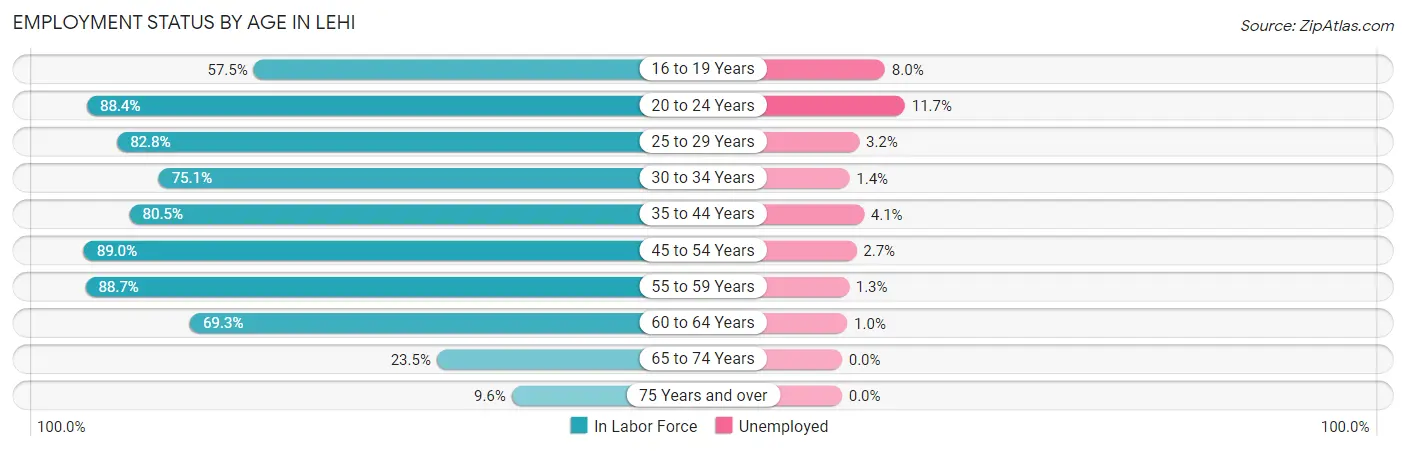
| Age Bracket | In Labor Force | Unemployed |
| 16 to 19 Years | 3,174 (57.5%) | 254 (8.0%) |
| 20 to 24 Years | 4,962 (88.4%) | 581 (11.7%) |
| 25 to 29 Years | 4,619 (82.8%) | 148 (3.2%) |
| 30 to 34 Years | 4,559 (75.1%) | 64 (1.4%) |
| 35 to 44 Years | 10,152 (80.5%) | 416 (4.1%) |
| 45 to 54 Years | 6,160 (89.0%) | 166 (2.7%) |
| 55 to 59 Years | 2,470 (88.7%) | 32 (1.3%) |
| 60 to 64 Years | 1,238 (69.3%) | 12 (1.0%) |
| 65 to 74 Years | 636 (23.5%) | 0 (0.0%) |
| 75 Years and over | 160 (9.6%) | 0 (0.0%) |
| Total | 38,138 (74.4%) | 1,678 (4.4%) |
Employment Status by Educational Attainment in Lehi
According to labor force statistics for Lehi, 81.7% of individuals (29,210) out of the total population between 25 and 64 years of age (35,753) are in the labor force, with 2.9% or 847 of them being unemployed. The group with the highest labor force participation rate are those with the educational attainment of bachelor's degree or higher, with 84.3% or 15,017 individuals in the labor force. Within the labor force, individuals with high school diploma education have the highest percentage of unemployment, with 5.3% or 213 of them being unemployed.
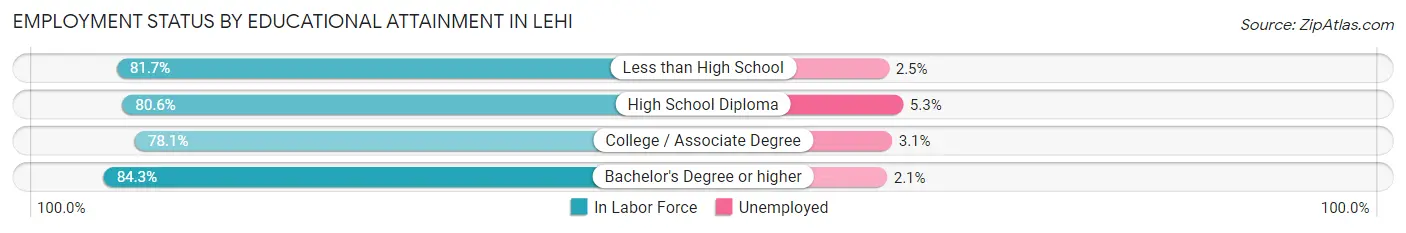
| Educational Attainment | In Labor Force | Unemployed |
| Less than High School | 829 (81.7%) | 25 (2.5%) |
| High School Diploma | 4,015 (80.6%) | 264 (5.3%) |
| College / Associate Degree | 9,327 (78.1%) | 370 (3.1%) |
| Bachelor's Degree or higher | 15,017 (84.3%) | 374 (2.1%) |
| Total | 29,210 (81.7%) | 1,037 (2.9%) |
Employment Occupations by Sex in Lehi
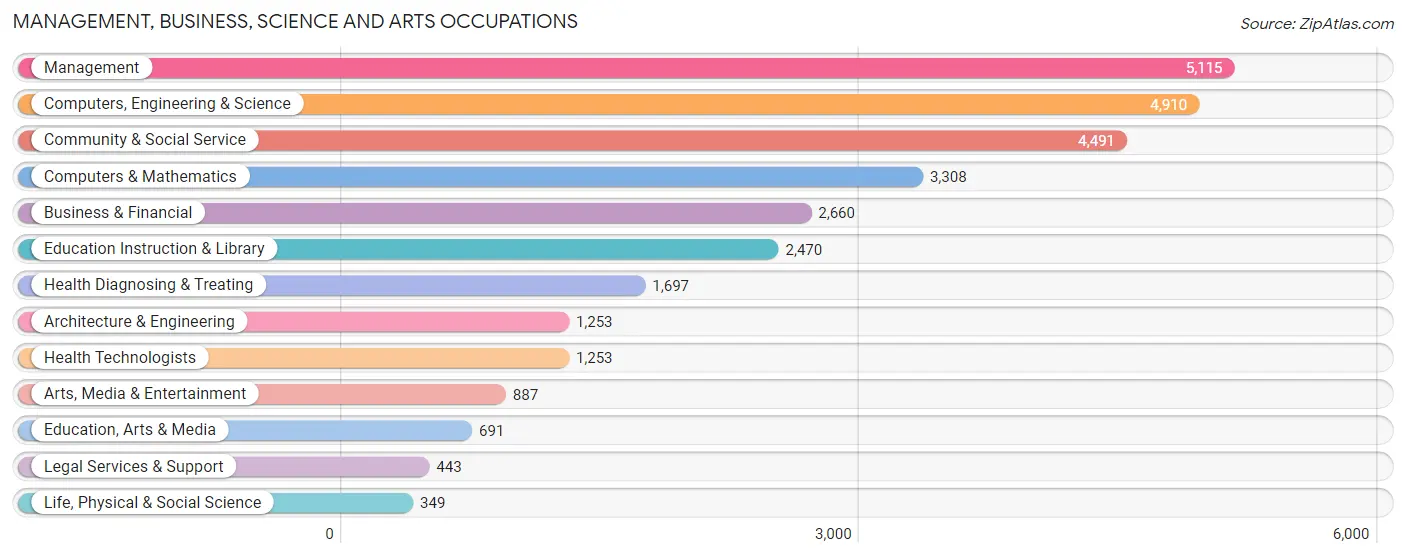
Management, Business, Science and Arts Occupations
The most common Management, Business, Science and Arts occupations in Lehi are Management (5,115 | 14.1%), Computers, Engineering & Science (4,910 | 13.5%), Community & Social Service (4,491 | 12.4%), Computers & Mathematics (3,308 | 9.1%), and Business & Financial (2,660 | 7.3%).
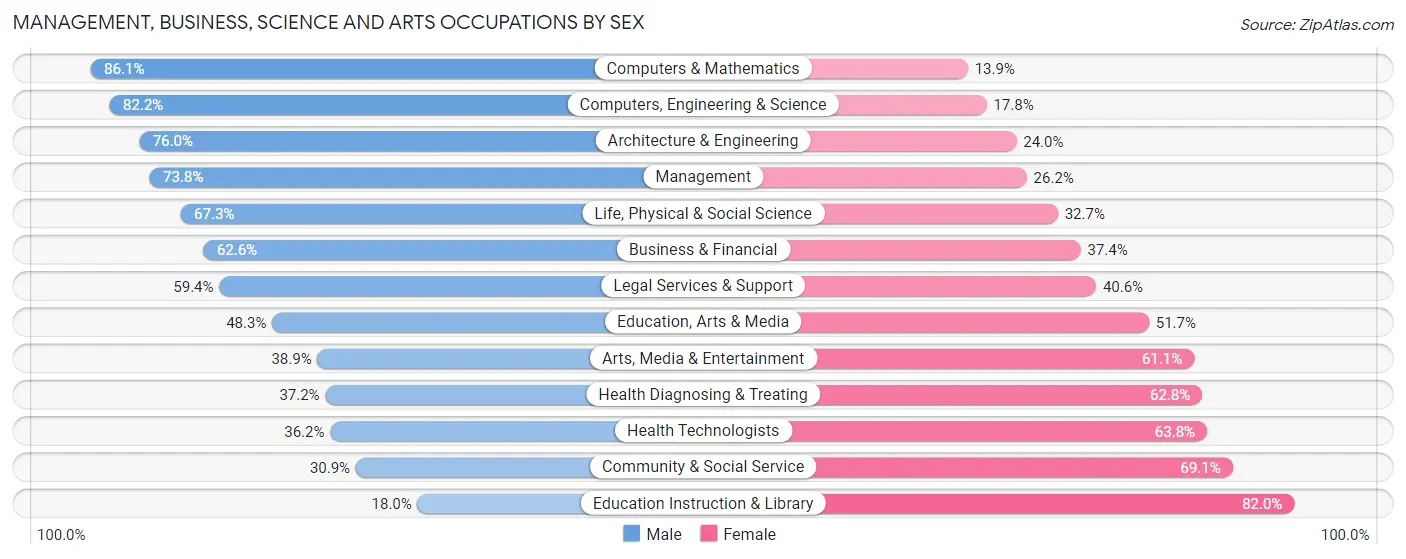
Management, Business, Science and Arts Occupations by Sex
Within the Management, Business, Science and Arts occupations in Lehi, the most male-oriented occupations are Computers & Mathematics (86.1%), Computers, Engineering & Science (82.2%), and Architecture & Engineering (76.0%), while the most female-oriented occupations are Education Instruction & Library (82.0%), Community & Social Service (69.1%), and Health Technologists (63.8%).
| Occupation | Male | Female |
| Management | 3,776 (73.8%) | 1,339 (26.2%) |
| Business & Financial | 1,665 (62.6%) | 995 (37.4%) |
| Computers, Engineering & Science | 4,036 (82.2%) | 874 (17.8%) |
| Computers & Mathematics | 2,849 (86.1%) | 459 (13.9%) |
| Architecture & Engineering | 952 (76.0%) | 301 (24.0%) |
| Life, Physical & Social Science | 235 (67.3%) | 114 (32.7%) |
| Community & Social Service | 1,387 (30.9%) | 3,104 (69.1%) |
| Education, Arts & Media | 334 (48.3%) | 357 (51.7%) |
| Legal Services & Support | 263 (59.4%) | 180 (40.6%) |
| Education Instruction & Library | 445 (18.0%) | 2,025 (82.0%) |
| Arts, Media & Entertainment | 345 (38.9%) | 542 (61.1%) |
| Health Diagnosing & Treating | 632 (37.2%) | 1,065 (62.8%) |
| Health Technologists | 454 (36.2%) | 799 (63.8%) |
| Total (Category) | 11,496 (60.9%) | 7,377 (39.1%) |
| Total (Overall) | 21,195 (58.4%) | 15,087 (41.6%) |
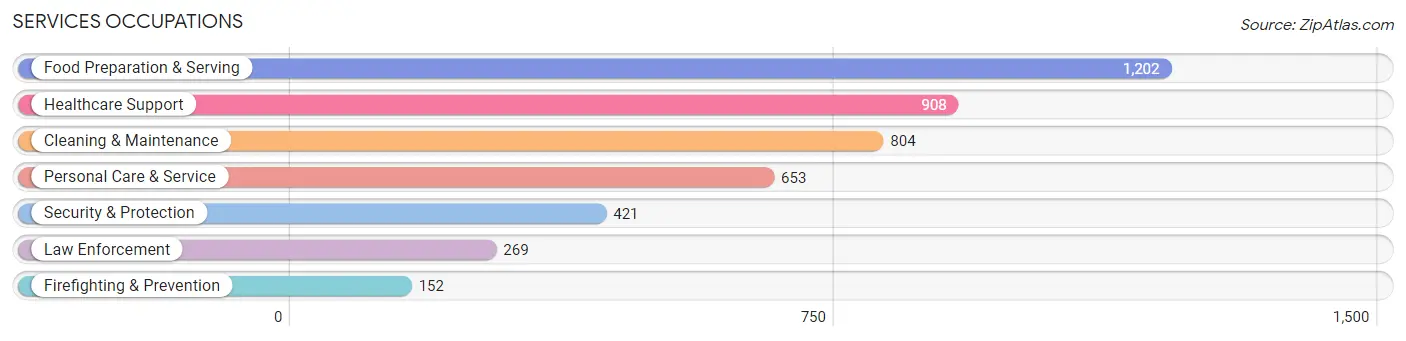
Services Occupations
The most common Services occupations in Lehi are Food Preparation & Serving (1,202 | 3.3%), Healthcare Support (908 | 2.5%), Cleaning & Maintenance (804 | 2.2%), Personal Care & Service (653 | 1.8%), and Security & Protection (421 | 1.2%).
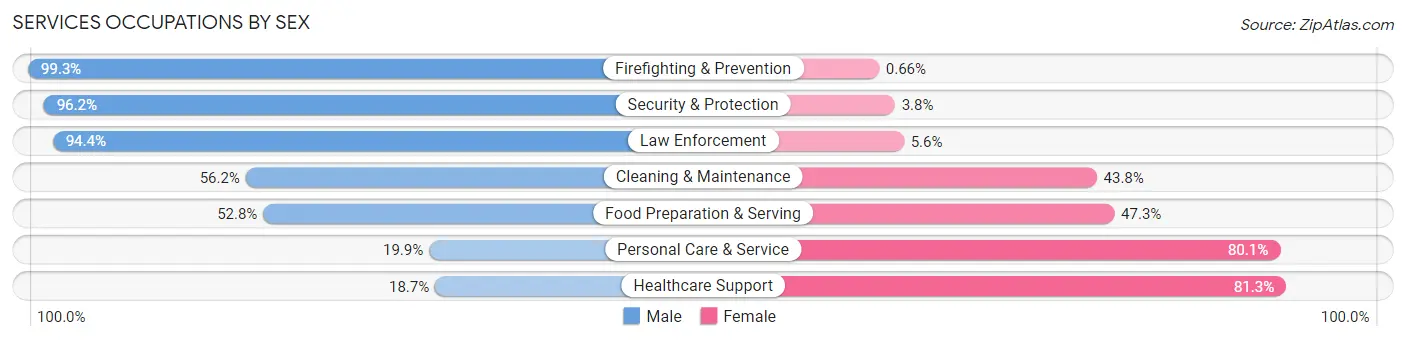
Services Occupations by Sex
Within the Services occupations in Lehi, the most male-oriented occupations are Firefighting & Prevention (99.3%), Security & Protection (96.2%), and Law Enforcement (94.4%), while the most female-oriented occupations are Healthcare Support (81.3%), Personal Care & Service (80.1%), and Food Preparation & Serving (47.2%).
| Occupation | Male | Female |
| Healthcare Support | 170 (18.7%) | 738 (81.3%) |
| Security & Protection | 405 (96.2%) | 16 (3.8%) |
| Firefighting & Prevention | 151 (99.3%) | 1 (0.7%) |
| Law Enforcement | 254 (94.4%) | 15 (5.6%) |
| Food Preparation & Serving | 634 (52.7%) | 568 (47.2%) |
| Cleaning & Maintenance | 452 (56.2%) | 352 (43.8%) |
| Personal Care & Service | 130 (19.9%) | 523 (80.1%) |
| Total (Category) | 1,791 (44.9%) | 2,197 (55.1%) |
| Total (Overall) | 21,195 (58.4%) | 15,087 (41.6%) |
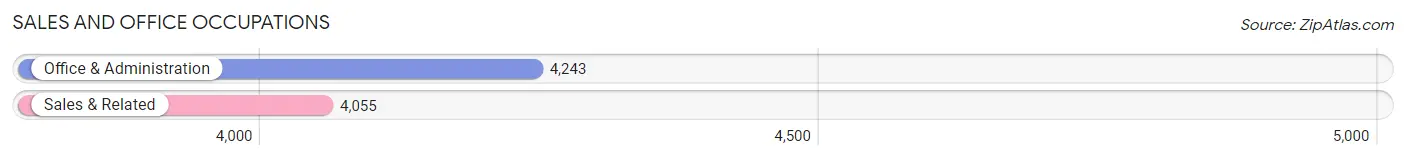
Sales and Office Occupations
The most common Sales and Office occupations in Lehi are Office & Administration (4,243 | 11.7%), and Sales & Related (4,055 | 11.2%).
Sales and Office Occupations by Sex
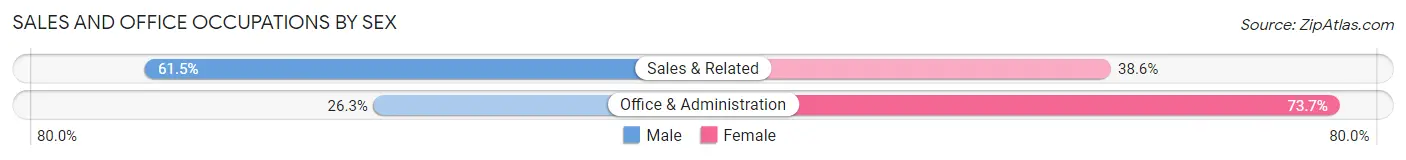
| Occupation | Male | Female |
| Sales & Related | 2,492 (61.5%) | 1,563 (38.6%) |
| Office & Administration | 1,116 (26.3%) | 3,127 (73.7%) |
| Total (Category) | 3,608 (43.5%) | 4,690 (56.5%) |
| Total (Overall) | 21,195 (58.4%) | 15,087 (41.6%) |
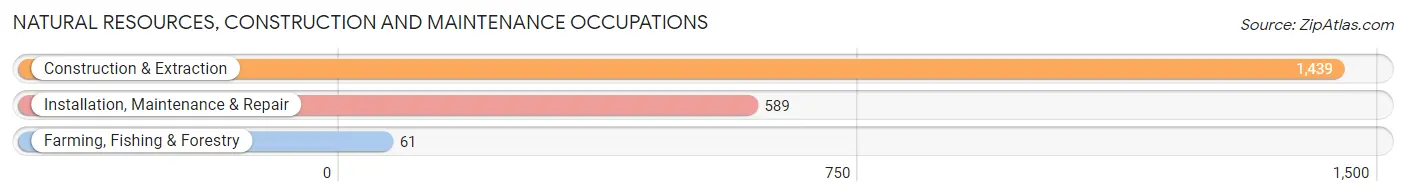
Natural Resources, Construction and Maintenance Occupations
The most common Natural Resources, Construction and Maintenance occupations in Lehi are Construction & Extraction (1,439 | 4.0%), Installation, Maintenance & Repair (589 | 1.6%), and Farming, Fishing & Forestry (61 | 0.2%).
Natural Resources, Construction and Maintenance Occupations by Sex
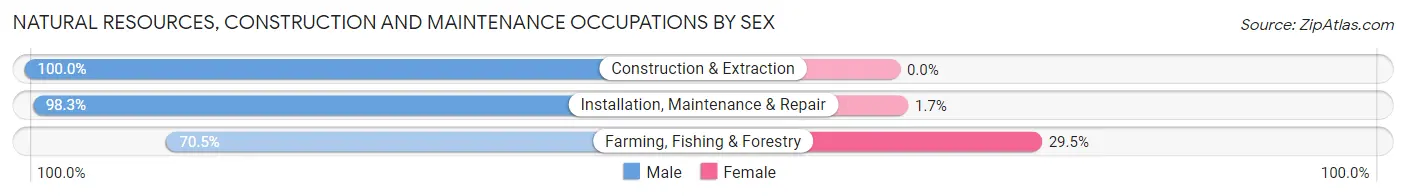
| Occupation | Male | Female |
| Farming, Fishing & Forestry | 43 (70.5%) | 18 (29.5%) |
| Construction & Extraction | 1,439 (100.0%) | 0 (0.0%) |
| Installation, Maintenance & Repair | 579 (98.3%) | 10 (1.7%) |
| Total (Category) | 2,061 (98.7%) | 28 (1.3%) |
| Total (Overall) | 21,195 (58.4%) | 15,087 (41.6%) |
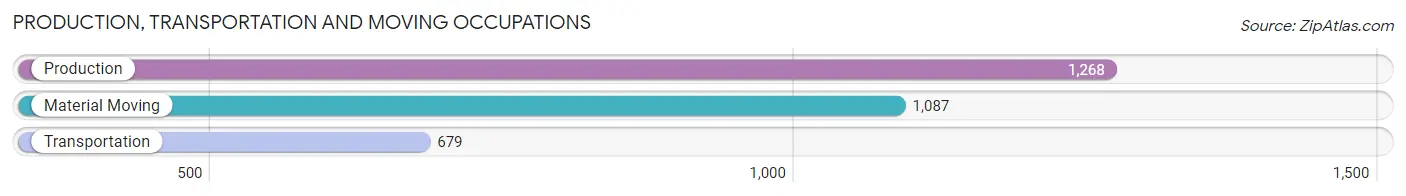
Production, Transportation and Moving Occupations
The most common Production, Transportation and Moving occupations in Lehi are Production (1,268 | 3.5%), Material Moving (1,087 | 3.0%), and Transportation (679 | 1.9%).
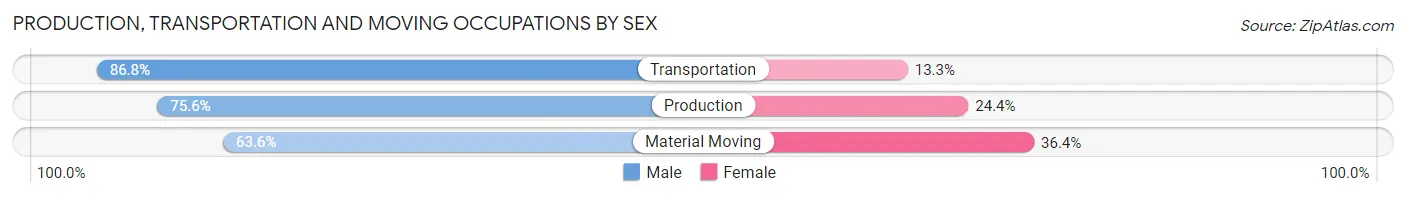
Production, Transportation and Moving Occupations by Sex
| Occupation | Male | Female |
| Production | 959 (75.6%) | 309 (24.4%) |
| Transportation | 589 (86.8%) | 90 (13.3%) |
| Material Moving | 691 (63.6%) | 396 (36.4%) |
| Total (Category) | 2,239 (73.8%) | 795 (26.2%) |
| Total (Overall) | 21,195 (58.4%) | 15,087 (41.6%) |
Employment Industries by Sex in Lehi
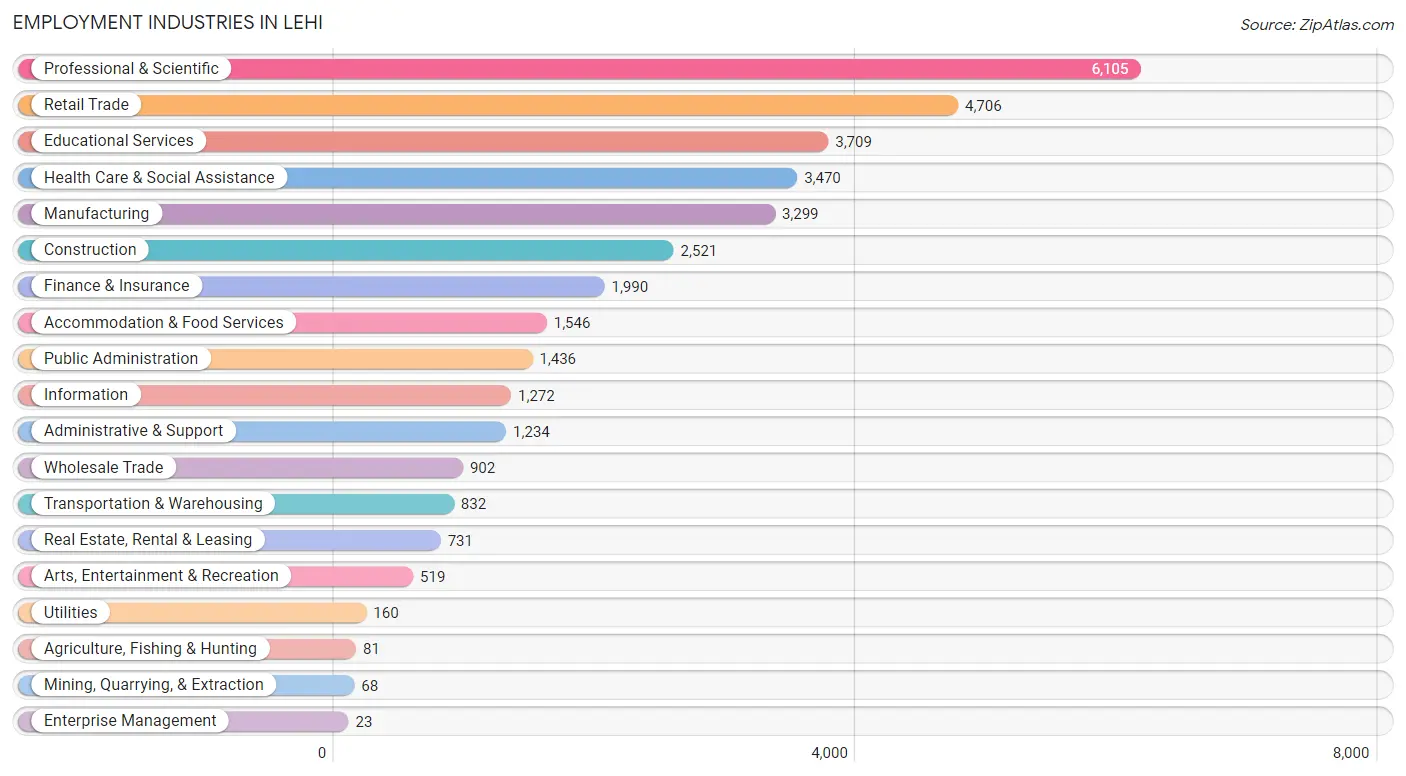
Employment Industries in Lehi
The major employment industries in Lehi include Professional & Scientific (6,105 | 16.8%), Retail Trade (4,706 | 13.0%), Educational Services (3,709 | 10.2%), Health Care & Social Assistance (3,470 | 9.6%), and Manufacturing (3,299 | 9.1%).
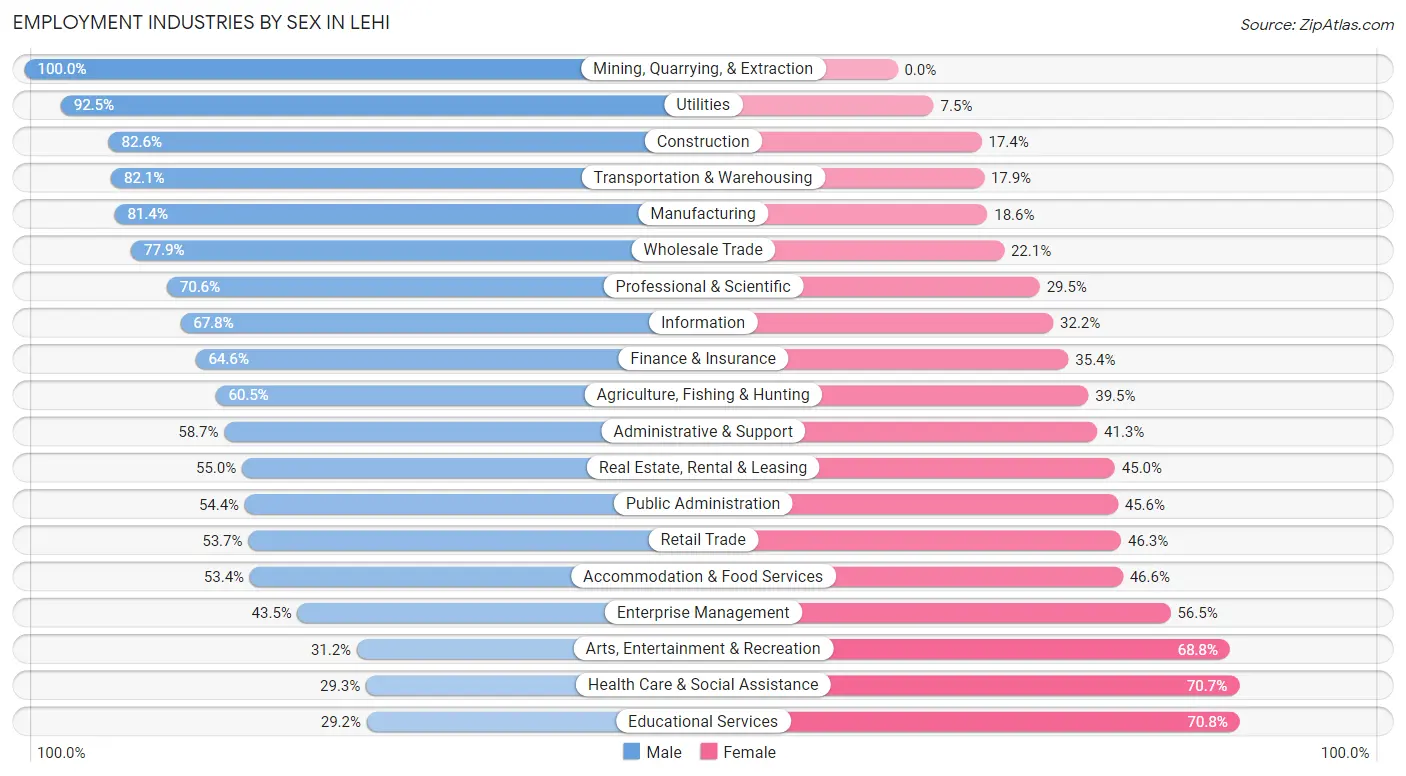
Employment Industries by Sex in Lehi
The Lehi industries that see more men than women are Mining, Quarrying, & Extraction (100.0%), Utilities (92.5%), and Construction (82.6%), whereas the industries that tend to have a higher number of women are Educational Services (70.8%), Health Care & Social Assistance (70.7%), and Arts, Entertainment & Recreation (68.8%).
| Industry | Male | Female |
| Agriculture, Fishing & Hunting | 49 (60.5%) | 32 (39.5%) |
| Mining, Quarrying, & Extraction | 68 (100.0%) | 0 (0.0%) |
| Construction | 2,082 (82.6%) | 439 (17.4%) |
| Manufacturing | 2,685 (81.4%) | 614 (18.6%) |
| Wholesale Trade | 703 (77.9%) | 199 (22.1%) |
| Retail Trade | 2,527 (53.7%) | 2,179 (46.3%) |
| Transportation & Warehousing | 683 (82.1%) | 149 (17.9%) |
| Utilities | 148 (92.5%) | 12 (7.5%) |
| Information | 862 (67.8%) | 410 (32.2%) |
| Finance & Insurance | 1,286 (64.6%) | 704 (35.4%) |
| Real Estate, Rental & Leasing | 402 (55.0%) | 329 (45.0%) |
| Professional & Scientific | 4,307 (70.6%) | 1,798 (29.4%) |
| Enterprise Management | 10 (43.5%) | 13 (56.5%) |
| Administrative & Support | 724 (58.7%) | 510 (41.3%) |
| Educational Services | 1,082 (29.2%) | 2,627 (70.8%) |
| Health Care & Social Assistance | 1,017 (29.3%) | 2,453 (70.7%) |
| Arts, Entertainment & Recreation | 162 (31.2%) | 357 (68.8%) |
| Accommodation & Food Services | 825 (53.4%) | 721 (46.6%) |
| Public Administration | 781 (54.4%) | 655 (45.6%) |
| Total | 21,195 (58.4%) | 15,087 (41.6%) |
Education in Lehi
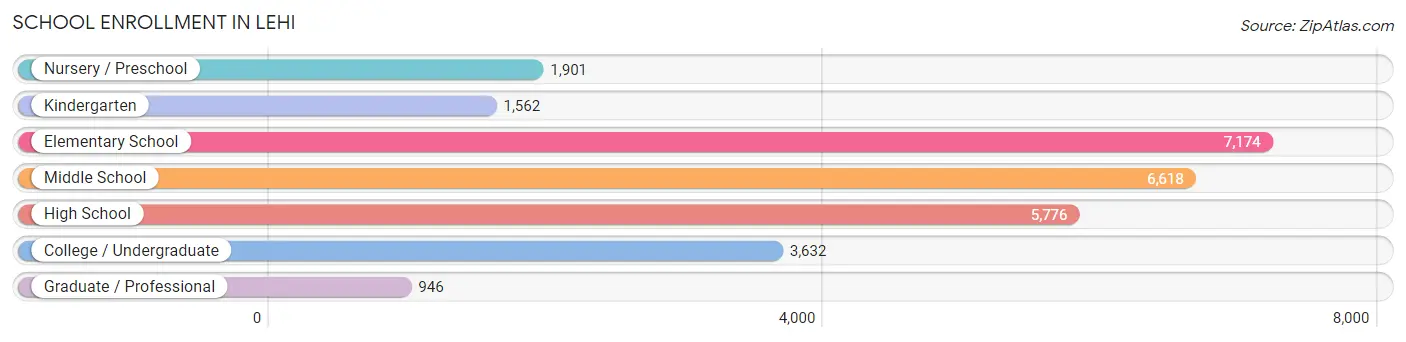
School Enrollment in Lehi
The most common levels of schooling among the 27,609 students in Lehi are elementary school (7,174 | 26.0%), middle school (6,618 | 24.0%), and high school (5,776 | 20.9%).
| School Level | # Students | % Students |
| Nursery / Preschool | 1,901 | 6.9% |
| Kindergarten | 1,562 | 5.7% |
| Elementary School | 7,174 | 26.0% |
| Middle School | 6,618 | 24.0% |
| High School | 5,776 | 20.9% |
| College / Undergraduate | 3,632 | 13.2% |
| Graduate / Professional | 946 | 3.4% |
| Total | 27,609 | 100.0% |
School Enrollment by Age by Funding Source in Lehi
Out of a total of 27,609 students who are enrolled in schools in Lehi, 3,285 (11.9%) attend a private institution, while the remaining 24,324 (88.1%) are enrolled in public schools. The age group of 35 years and over has the highest likelihood of being enrolled in private schools, with 510 (48.0% in the age bracket) enrolled. Conversely, the age group of 10 to 14 year olds has the lowest likelihood of being enrolled in a private school, with 7,828 (96.4% in the age bracket) attending a public institution.

| Age Bracket | Public School | Private School |
| 3 to 4 Year Olds | 825 (57.9%) | 599 (42.1%) |
| 5 to 9 Year Old | 7,814 (93.4%) | 556 (6.6%) |
| 10 to 14 Year Olds | 7,828 (96.4%) | 294 (3.6%) |
| 15 to 17 Year Olds | 4,069 (95.6%) | 187 (4.4%) |
| 18 to 19 Year Olds | 1,280 (87.4%) | 185 (12.6%) |
| 20 to 24 Year Olds | 924 (66.6%) | 463 (33.4%) |
| 25 to 34 Year Olds | 1,042 (68.5%) | 480 (31.5%) |
| 35 Years and over | 553 (52.0%) | 510 (48.0%) |
| Total | 24,324 (88.1%) | 3,285 (11.9%) |
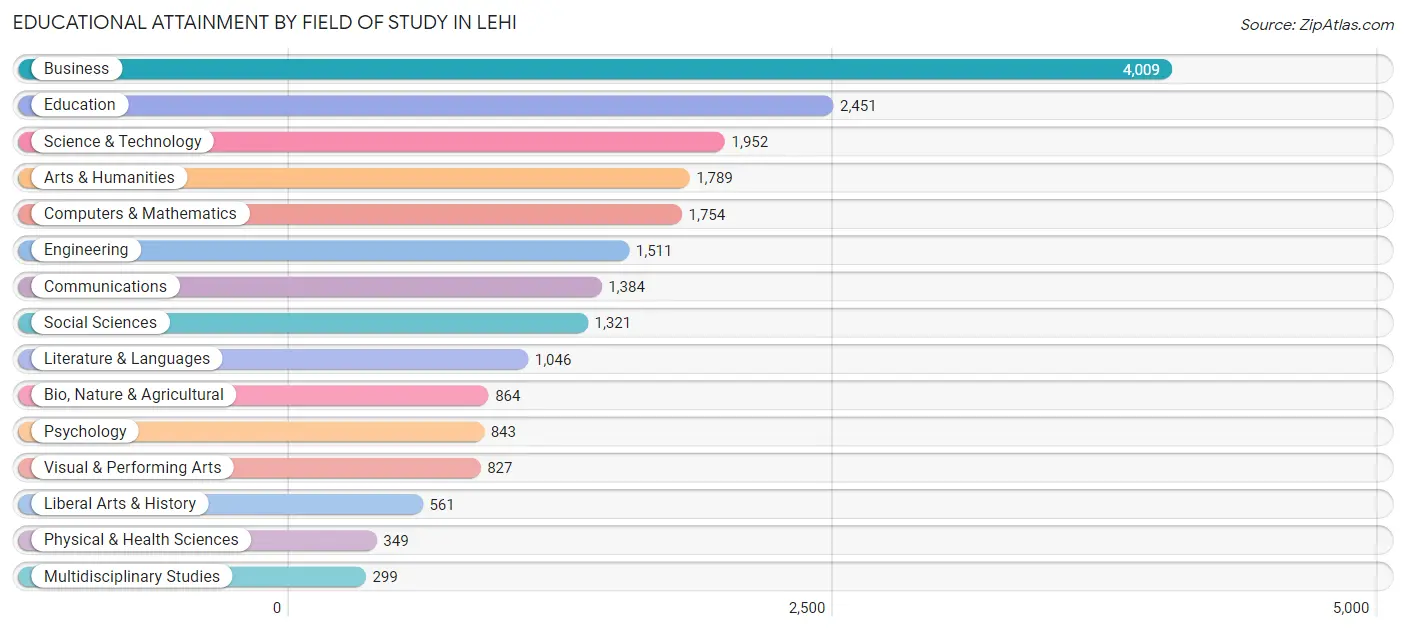
Educational Attainment by Field of Study in Lehi
Business (4,009 | 19.1%), education (2,451 | 11.7%), science & technology (1,952 | 9.3%), arts & humanities (1,789 | 8.5%), and computers & mathematics (1,754 | 8.4%) are the most common fields of study among 20,960 individuals in Lehi who have obtained a bachelor's degree or higher.
| Field of Study | # Graduates | % Graduates |
| Computers & Mathematics | 1,754 | 8.4% |
| Bio, Nature & Agricultural | 864 | 4.1% |
| Physical & Health Sciences | 349 | 1.7% |
| Psychology | 843 | 4.0% |
| Social Sciences | 1,321 | 6.3% |
| Engineering | 1,511 | 7.2% |
| Multidisciplinary Studies | 299 | 1.4% |
| Science & Technology | 1,952 | 9.3% |
| Business | 4,009 | 19.1% |
| Education | 2,451 | 11.7% |
| Literature & Languages | 1,046 | 5.0% |
| Liberal Arts & History | 561 | 2.7% |
| Visual & Performing Arts | 827 | 4.0% |
| Communications | 1,384 | 6.6% |
| Arts & Humanities | 1,789 | 8.5% |
| Total | 20,960 | 100.0% |
Transportation & Commute in Lehi
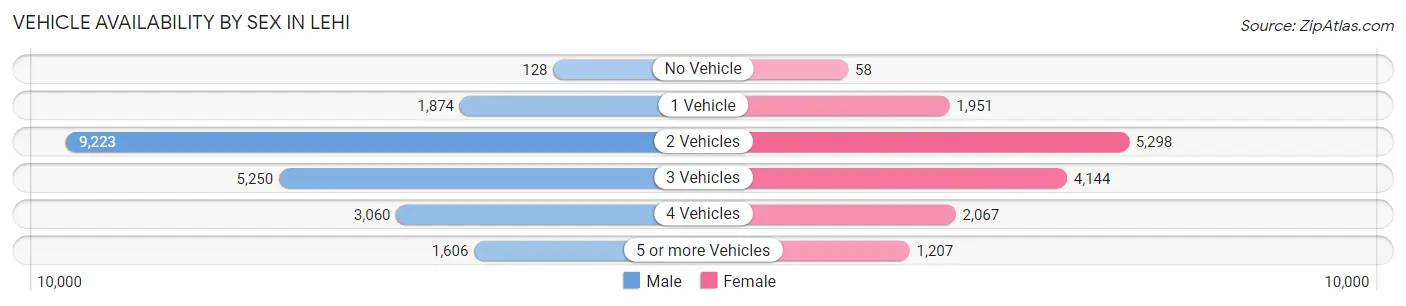
Vehicle Availability by Sex in Lehi
The most prevalent vehicle ownership categories in Lehi are males with 2 vehicles (9,223, accounting for 43.6%) and females with 2 vehicles (5,298, making up 62.6%).
| Vehicles Available | Male | Female |
| No Vehicle | 128 (0.6%) | 58 (0.4%) |
| 1 Vehicle | 1,874 (8.9%) | 1,951 (13.3%) |
| 2 Vehicles | 9,223 (43.6%) | 5,298 (36.0%) |
| 3 Vehicles | 5,250 (24.8%) | 4,144 (28.1%) |
| 4 Vehicles | 3,060 (14.5%) | 2,067 (14.0%) |
| 5 or more Vehicles | 1,606 (7.6%) | 1,207 (8.2%) |
| Total | 21,141 (100.0%) | 14,725 (100.0%) |
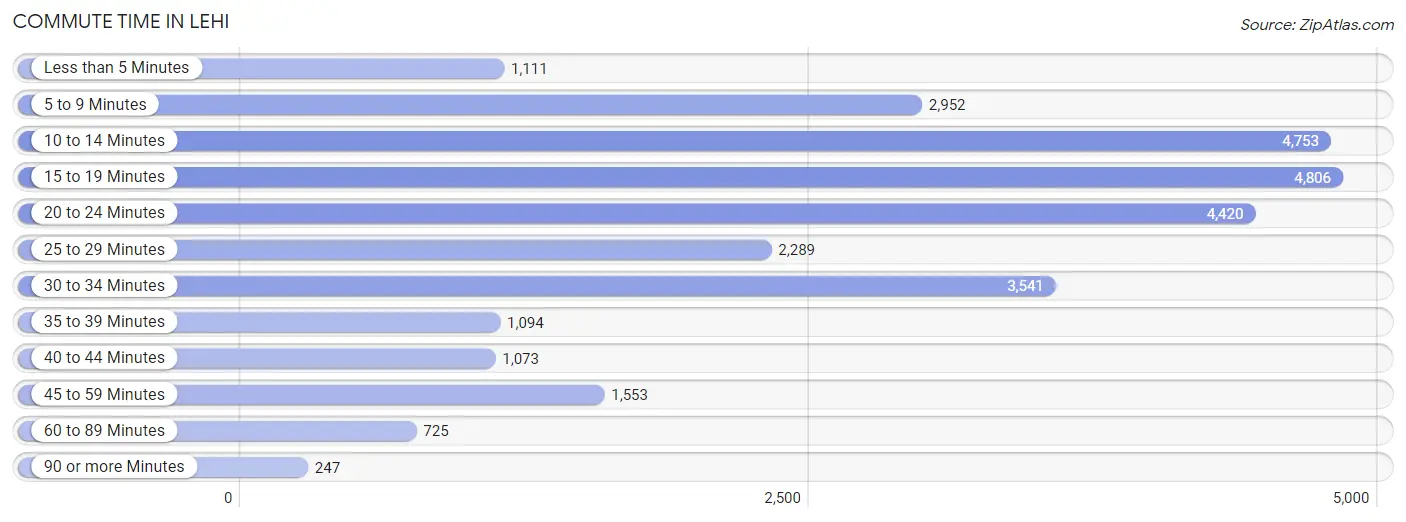
Commute Time in Lehi
The most frequently occuring commute durations in Lehi are 15 to 19 minutes (4,806 commuters, 16.8%), 10 to 14 minutes (4,753 commuters, 16.6%), and 20 to 24 minutes (4,420 commuters, 15.5%).
| Commute Time | # Commuters | % Commuters |
| Less than 5 Minutes | 1,111 | 3.9% |
| 5 to 9 Minutes | 2,952 | 10.3% |
| 10 to 14 Minutes | 4,753 | 16.6% |
| 15 to 19 Minutes | 4,806 | 16.8% |
| 20 to 24 Minutes | 4,420 | 15.5% |
| 25 to 29 Minutes | 2,289 | 8.0% |
| 30 to 34 Minutes | 3,541 | 12.4% |
| 35 to 39 Minutes | 1,094 | 3.8% |
| 40 to 44 Minutes | 1,073 | 3.8% |
| 45 to 59 Minutes | 1,553 | 5.4% |
| 60 to 89 Minutes | 725 | 2.5% |
| 90 or more Minutes | 247 | 0.9% |
Commute Time by Sex in Lehi
The most common commute times in Lehi are 15 to 19 minutes (2,908 commuters, 17.0%) for males and 20 to 24 minutes (2,077 commuters, 18.1%) for females.
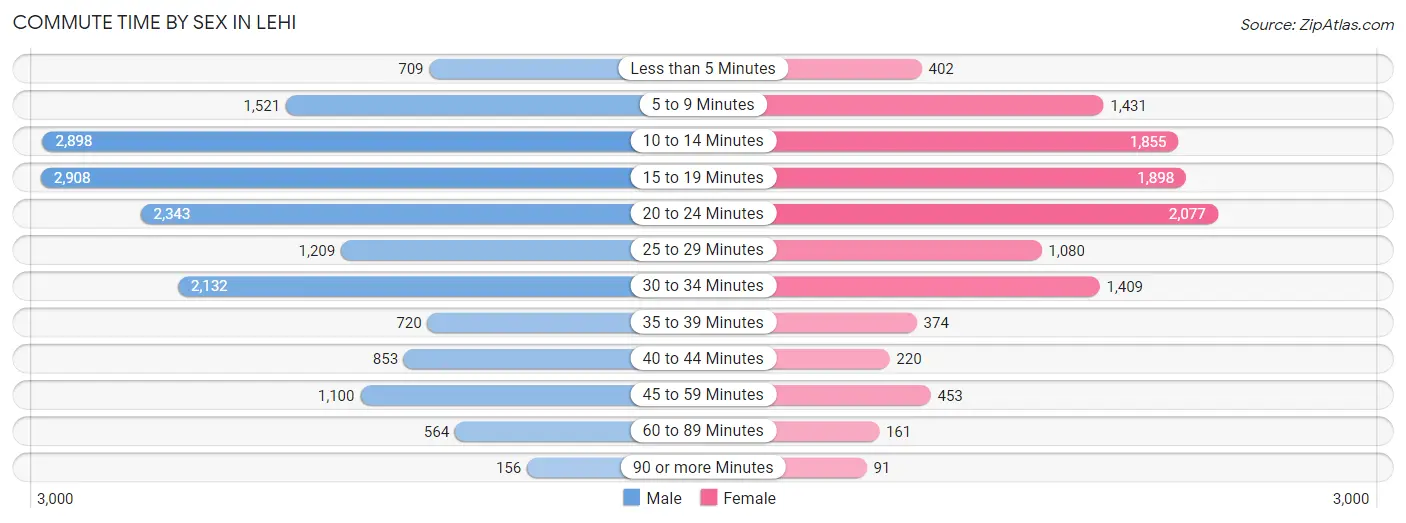
| Commute Time | Male | Female |
| Less than 5 Minutes | 709 (4.1%) | 402 (3.5%) |
| 5 to 9 Minutes | 1,521 (8.9%) | 1,431 (12.5%) |
| 10 to 14 Minutes | 2,898 (16.9%) | 1,855 (16.2%) |
| 15 to 19 Minutes | 2,908 (17.0%) | 1,898 (16.6%) |
| 20 to 24 Minutes | 2,343 (13.7%) | 2,077 (18.1%) |
| 25 to 29 Minutes | 1,209 (7.1%) | 1,080 (9.4%) |
| 30 to 34 Minutes | 2,132 (12.5%) | 1,409 (12.3%) |
| 35 to 39 Minutes | 720 (4.2%) | 374 (3.3%) |
| 40 to 44 Minutes | 853 (5.0%) | 220 (1.9%) |
| 45 to 59 Minutes | 1,100 (6.4%) | 453 (4.0%) |
| 60 to 89 Minutes | 564 (3.3%) | 161 (1.4%) |
| 90 or more Minutes | 156 (0.9%) | 91 (0.8%) |
Time of Departure to Work by Sex in Lehi
The most frequent times of departure to work in Lehi are 7:30 AM to 7:59 AM (2,398, 14.0%) for males and 7:30 AM to 7:59 AM (1,925, 16.8%) for females.
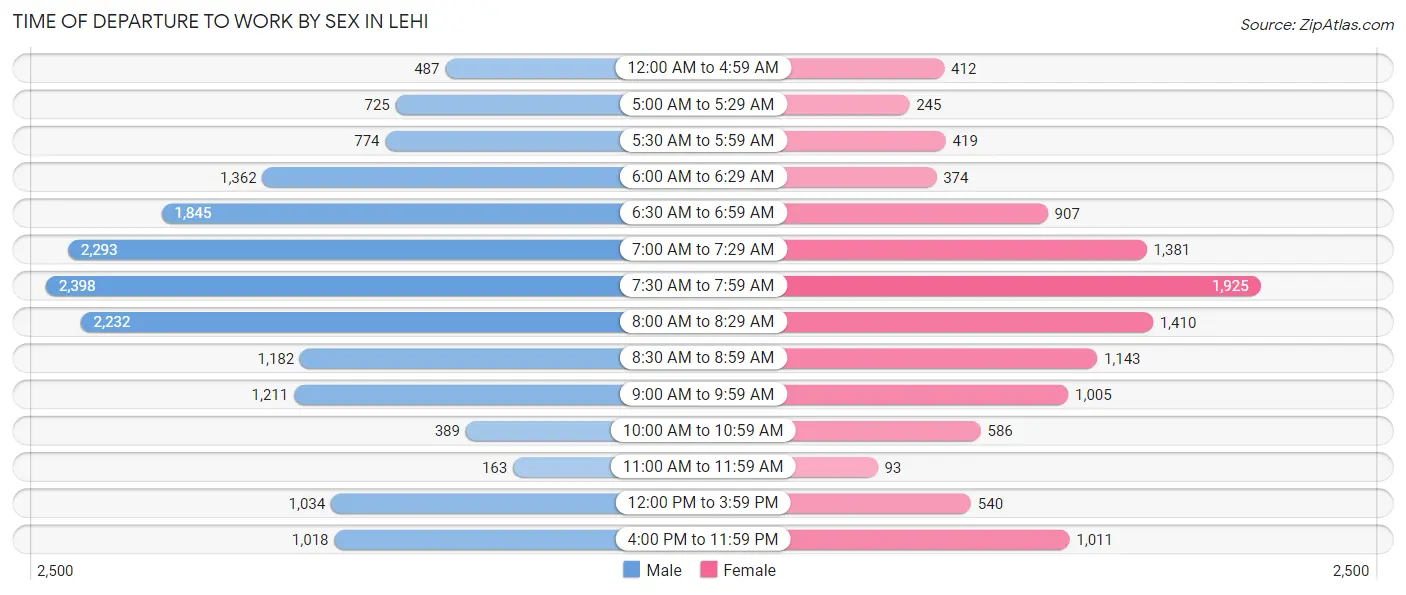
| Time of Departure | Male | Female |
| 12:00 AM to 4:59 AM | 487 (2.9%) | 412 (3.6%) |
| 5:00 AM to 5:29 AM | 725 (4.2%) | 245 (2.1%) |
| 5:30 AM to 5:59 AM | 774 (4.5%) | 419 (3.7%) |
| 6:00 AM to 6:29 AM | 1,362 (8.0%) | 374 (3.3%) |
| 6:30 AM to 6:59 AM | 1,845 (10.8%) | 907 (7.9%) |
| 7:00 AM to 7:29 AM | 2,293 (13.4%) | 1,381 (12.1%) |
| 7:30 AM to 7:59 AM | 2,398 (14.0%) | 1,925 (16.8%) |
| 8:00 AM to 8:29 AM | 2,232 (13.0%) | 1,410 (12.3%) |
| 8:30 AM to 8:59 AM | 1,182 (6.9%) | 1,143 (10.0%) |
| 9:00 AM to 9:59 AM | 1,211 (7.1%) | 1,005 (8.8%) |
| 10:00 AM to 10:59 AM | 389 (2.3%) | 586 (5.1%) |
| 11:00 AM to 11:59 AM | 163 (0.9%) | 93 (0.8%) |
| 12:00 PM to 3:59 PM | 1,034 (6.0%) | 540 (4.7%) |
| 4:00 PM to 11:59 PM | 1,018 (5.9%) | 1,011 (8.8%) |
| Total | 17,113 (100.0%) | 11,451 (100.0%) |
Housing Occupancy in Lehi
Occupancy by Ownership in Lehi
Of the total 21,250 dwellings in Lehi, owner-occupied units account for 16,663 (78.4%), while renter-occupied units make up 4,587 (21.6%).
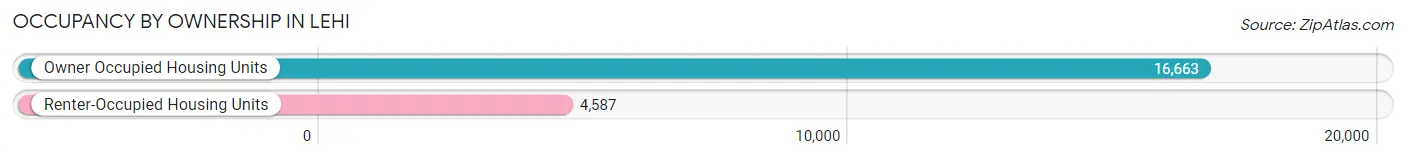
| Occupancy | # Housing Units | % Housing Units |
| Owner Occupied Housing Units | 16,663 | 78.4% |
| Renter-Occupied Housing Units | 4,587 | 21.6% |
| Total Occupied Housing Units | 21,250 | 100.0% |
Occupancy by Household Size in Lehi
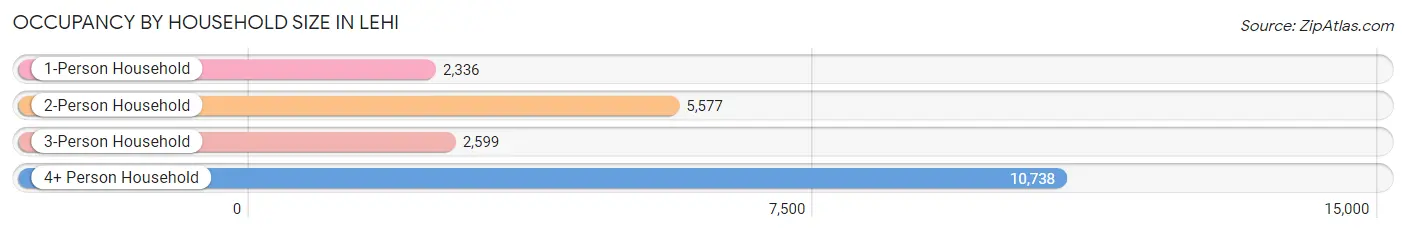
| Household Size | # Housing Units | % Housing Units |
| 1-Person Household | 2,336 | 11.0% |
| 2-Person Household | 5,577 | 26.2% |
| 3-Person Household | 2,599 | 12.2% |
| 4+ Person Household | 10,738 | 50.5% |
| Total Housing Units | 21,250 | 100.0% |
Occupancy by Ownership by Household Size in Lehi
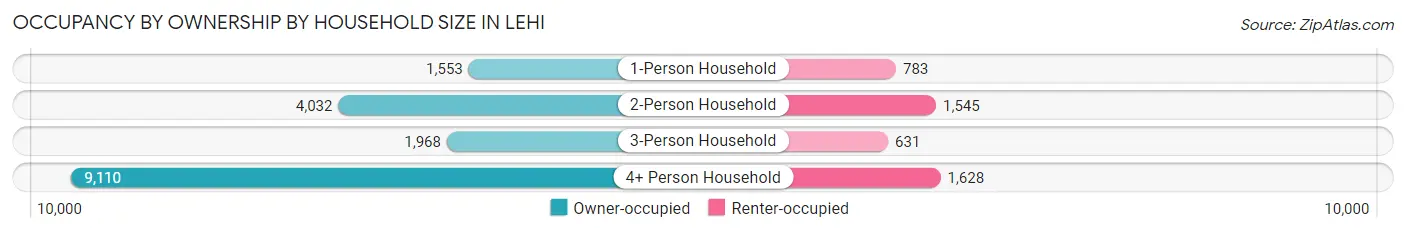
| Household Size | Owner-occupied | Renter-occupied |
| 1-Person Household | 1,553 (66.5%) | 783 (33.5%) |
| 2-Person Household | 4,032 (72.3%) | 1,545 (27.7%) |
| 3-Person Household | 1,968 (75.7%) | 631 (24.3%) |
| 4+ Person Household | 9,110 (84.8%) | 1,628 (15.2%) |
| Total Housing Units | 16,663 (78.4%) | 4,587 (21.6%) |
Occupancy by Educational Attainment in Lehi
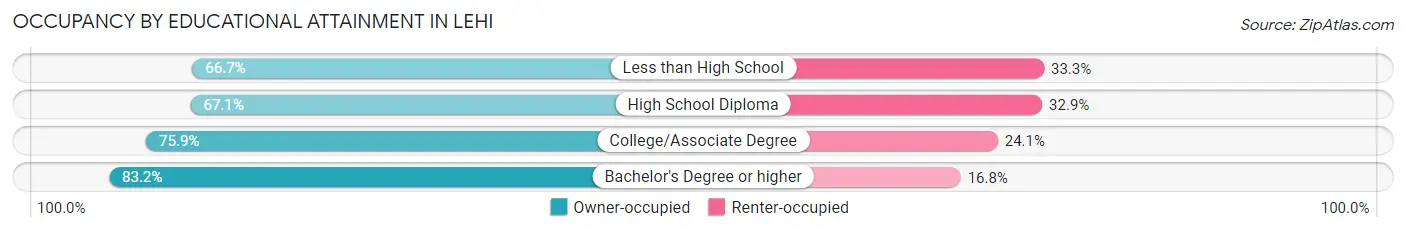
| Household Size | Owner-occupied | Renter-occupied |
| Less than High School | 391 (66.7%) | 195 (33.3%) |
| High School Diploma | 1,692 (67.1%) | 830 (32.9%) |
| College/Associate Degree | 5,385 (75.9%) | 1,711 (24.1%) |
| Bachelor's Degree or higher | 9,195 (83.2%) | 1,851 (16.8%) |
Occupancy by Age of Householder in Lehi
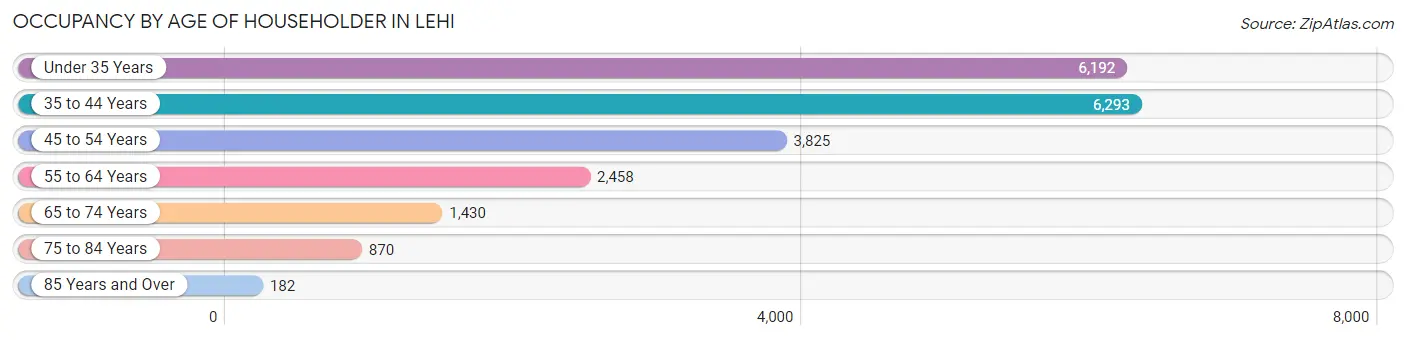
| Age Bracket | # Households | % Households |
| Under 35 Years | 6,192 | 29.1% |
| 35 to 44 Years | 6,293 | 29.6% |
| 45 to 54 Years | 3,825 | 18.0% |
| 55 to 64 Years | 2,458 | 11.6% |
| 65 to 74 Years | 1,430 | 6.7% |
| 75 to 84 Years | 870 | 4.1% |
| 85 Years and Over | 182 | 0.9% |
| Total | 21,250 | 100.0% |
Housing Finances in Lehi
Median Income by Occupancy in Lehi
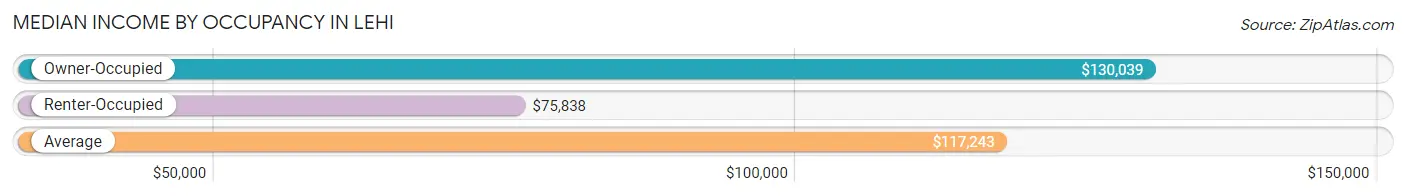
| Occupancy Type | # Households | Median Income |
| Owner-Occupied | 16,663 (78.4%) | $130,039 |
| Renter-Occupied | 4,587 (21.6%) | $75,838 |
| Average | 21,250 (100.0%) | $117,243 |
Occupancy by Householder Income Bracket in Lehi
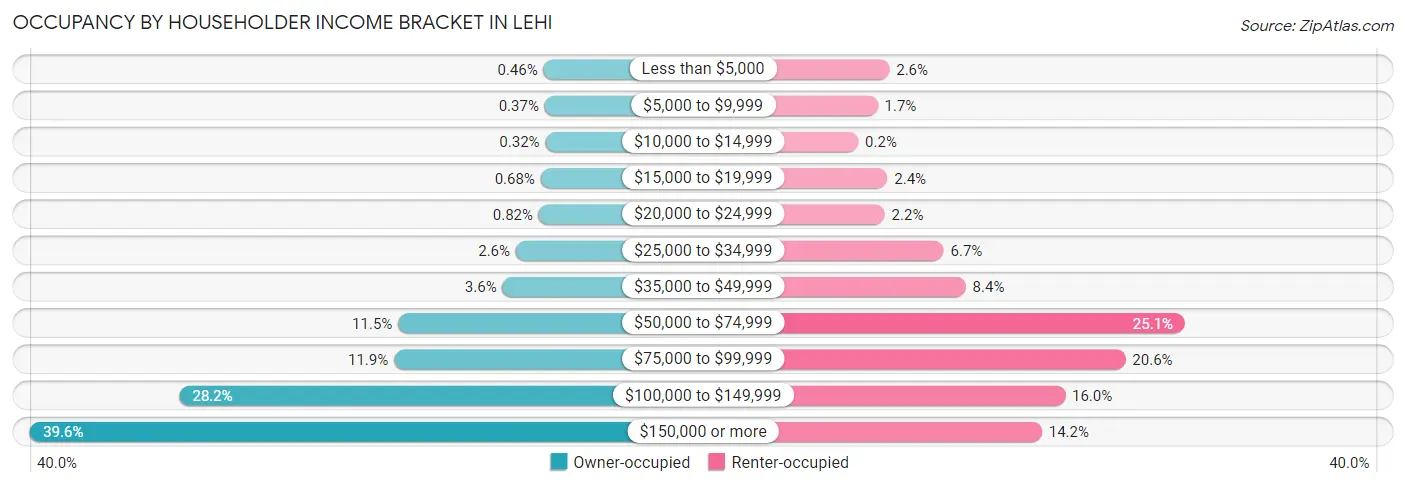
| Income Bracket | Owner-occupied | Renter-occupied |
| Less than $5,000 | 76 (0.5%) | 118 (2.6%) |
| $5,000 to $9,999 | 61 (0.4%) | 77 (1.7%) |
| $10,000 to $14,999 | 54 (0.3%) | 9 (0.2%) |
| $15,000 to $19,999 | 114 (0.7%) | 111 (2.4%) |
| $20,000 to $24,999 | 137 (0.8%) | 102 (2.2%) |
| $25,000 to $34,999 | 428 (2.6%) | 308 (6.7%) |
| $35,000 to $49,999 | 599 (3.6%) | 385 (8.4%) |
| $50,000 to $74,999 | 1,923 (11.5%) | 1,151 (25.1%) |
| $75,000 to $99,999 | 1,975 (11.8%) | 943 (20.6%) |
| $100,000 to $149,999 | 4,700 (28.2%) | 732 (16.0%) |
| $150,000 or more | 6,596 (39.6%) | 651 (14.2%) |
| Total | 16,663 (100.0%) | 4,587 (100.0%) |
Monthly Housing Cost Tiers in Lehi
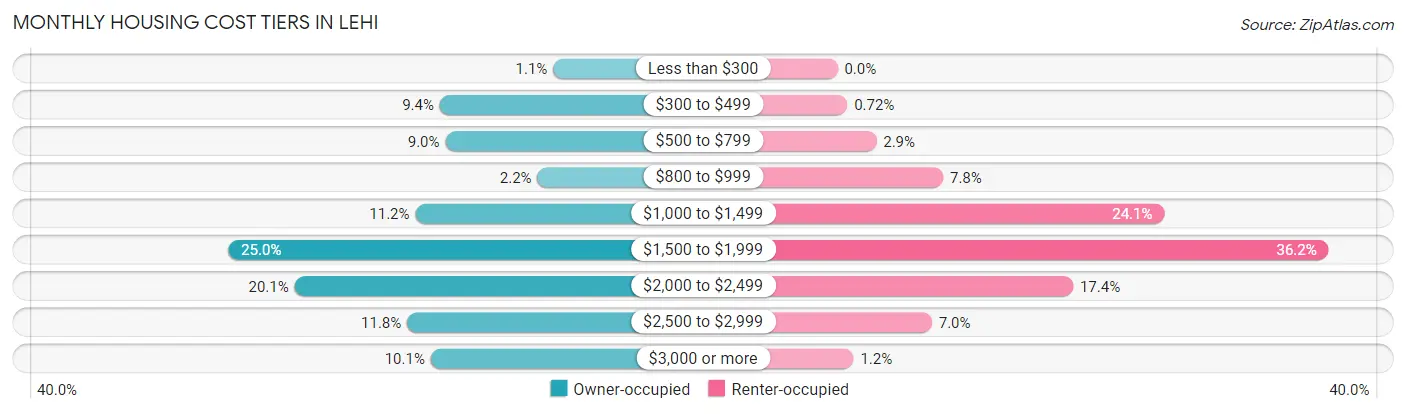
| Monthly Cost | Owner-occupied | Renter-occupied |
| Less than $300 | 179 (1.1%) | 0 (0.0%) |
| $300 to $499 | 1,569 (9.4%) | 33 (0.7%) |
| $500 to $799 | 1,501 (9.0%) | 131 (2.9%) |
| $800 to $999 | 372 (2.2%) | 357 (7.8%) |
| $1,000 to $1,499 | 1,869 (11.2%) | 1,104 (24.1%) |
| $1,500 to $1,999 | 4,167 (25.0%) | 1,659 (36.2%) |
| $2,000 to $2,499 | 3,353 (20.1%) | 796 (17.3%) |
| $2,500 to $2,999 | 1,971 (11.8%) | 319 (7.0%) |
| $3,000 or more | 1,682 (10.1%) | 54 (1.2%) |
| Total | 16,663 (100.0%) | 4,587 (100.0%) |
Physical Housing Characteristics in Lehi
Housing Structures in Lehi
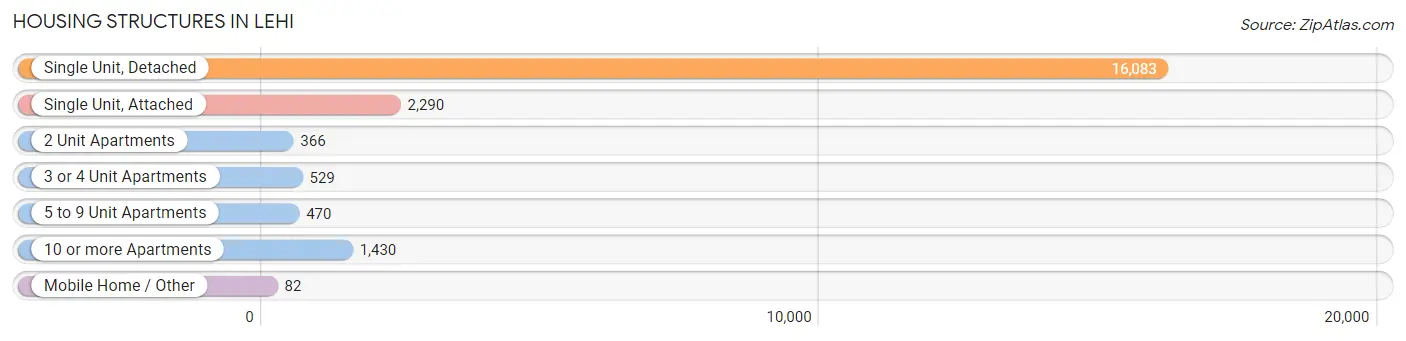
| Structure Type | # Housing Units | % Housing Units |
| Single Unit, Detached | 16,083 | 75.7% |
| Single Unit, Attached | 2,290 | 10.8% |
| 2 Unit Apartments | 366 | 1.7% |
| 3 or 4 Unit Apartments | 529 | 2.5% |
| 5 to 9 Unit Apartments | 470 | 2.2% |
| 10 or more Apartments | 1,430 | 6.7% |
| Mobile Home / Other | 82 | 0.4% |
| Total | 21,250 | 100.0% |
Housing Structures by Occupancy in Lehi
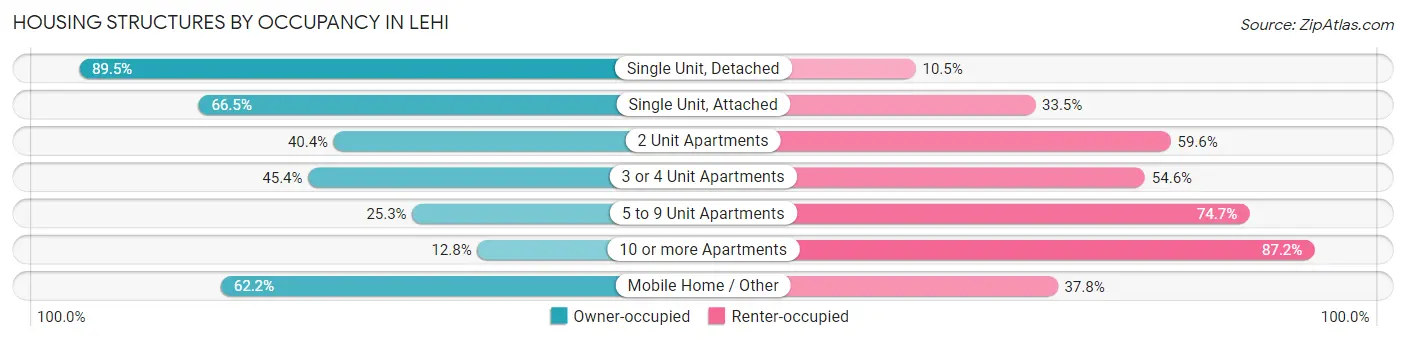
| Structure Type | Owner-occupied | Renter-occupied |
| Single Unit, Detached | 14,399 (89.5%) | 1,684 (10.5%) |
| Single Unit, Attached | 1,523 (66.5%) | 767 (33.5%) |
| 2 Unit Apartments | 148 (40.4%) | 218 (59.6%) |
| 3 or 4 Unit Apartments | 240 (45.4%) | 289 (54.6%) |
| 5 to 9 Unit Apartments | 119 (25.3%) | 351 (74.7%) |
| 10 or more Apartments | 183 (12.8%) | 1,247 (87.2%) |
| Mobile Home / Other | 51 (62.2%) | 31 (37.8%) |
| Total | 16,663 (78.4%) | 4,587 (21.6%) |
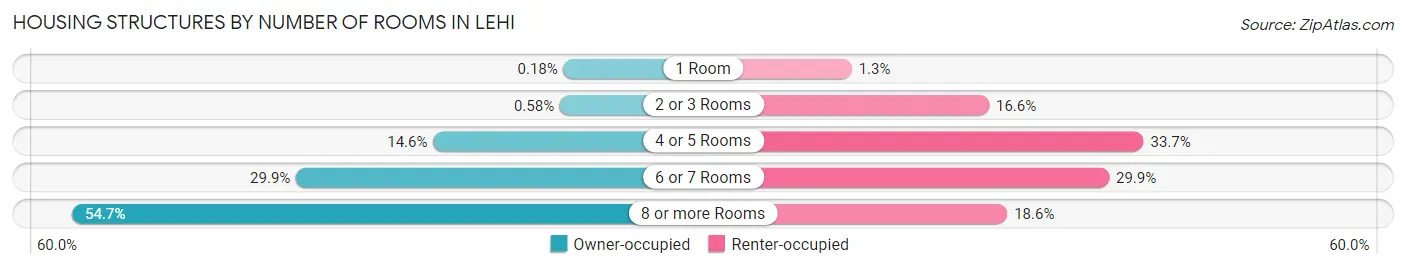
Housing Structures by Number of Rooms in Lehi
| Number of Rooms | Owner-occupied | Renter-occupied |
| 1 Room | 30 (0.2%) | 60 (1.3%) |
| 2 or 3 Rooms | 97 (0.6%) | 759 (16.6%) |
| 4 or 5 Rooms | 2,440 (14.6%) | 1,546 (33.7%) |
| 6 or 7 Rooms | 4,976 (29.9%) | 1,370 (29.9%) |
| 8 or more Rooms | 9,120 (54.7%) | 852 (18.6%) |
| Total | 16,663 (100.0%) | 4,587 (100.0%) |
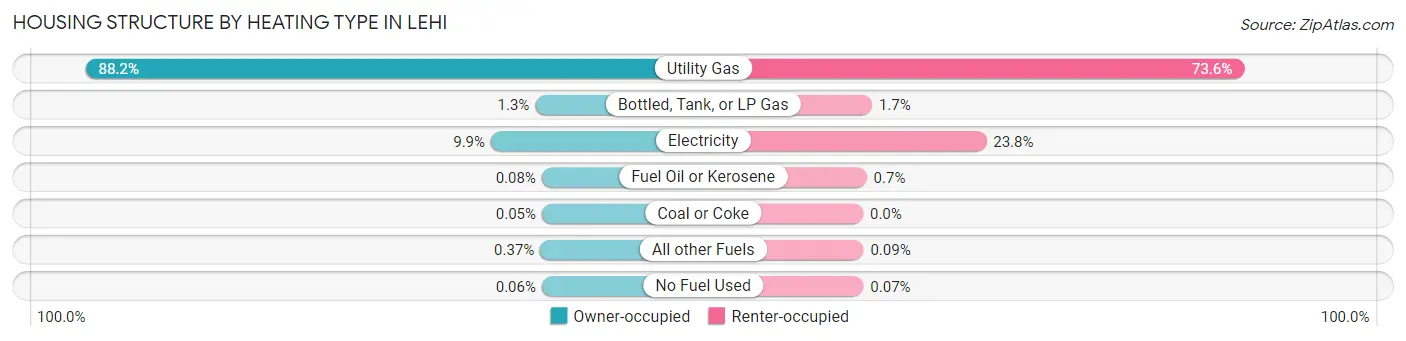
Housing Structure by Heating Type in Lehi
| Heating Type | Owner-occupied | Renter-occupied |
| Utility Gas | 14,698 (88.2%) | 3,377 (73.6%) |
| Bottled, Tank, or LP Gas | 222 (1.3%) | 79 (1.7%) |
| Electricity | 1,650 (9.9%) | 1,092 (23.8%) |
| Fuel Oil or Kerosene | 14 (0.1%) | 32 (0.7%) |
| Coal or Coke | 8 (0.1%) | 0 (0.0%) |
| All other Fuels | 61 (0.4%) | 4 (0.1%) |
| No Fuel Used | 10 (0.1%) | 3 (0.1%) |
| Total | 16,663 (100.0%) | 4,587 (100.0%) |
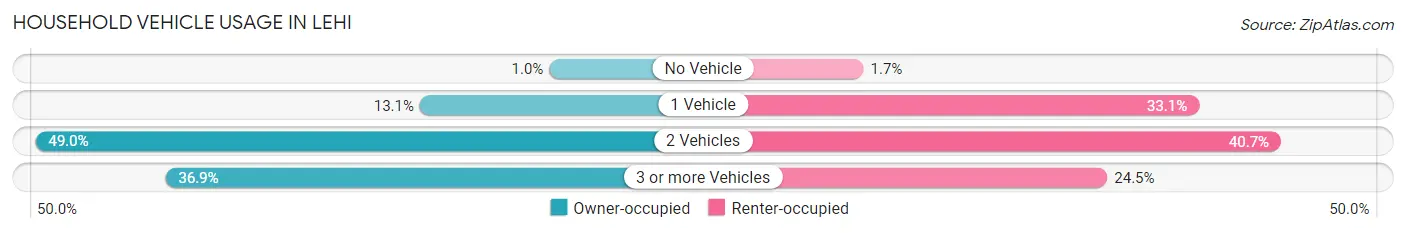
Household Vehicle Usage in Lehi
| Vehicles per Household | Owner-occupied | Renter-occupied |
| No Vehicle | 171 (1.0%) | 80 (1.7%) |
| 1 Vehicle | 2,185 (13.1%) | 1,516 (33.1%) |
| 2 Vehicles | 8,165 (49.0%) | 1,867 (40.7%) |
| 3 or more Vehicles | 6,142 (36.9%) | 1,124 (24.5%) |
| Total | 16,663 (100.0%) | 4,587 (100.0%) |
Real Estate & Mortgages in Lehi
Real Estate and Mortgage Overview in Lehi
| Characteristic | Without Mortgage | With Mortgage |
| Housing Units | 3,116 | 13,547 |
| Median Property Value | $489,400 | $504,000 |
| Median Household Income | $103,227 | $5,588 |
| Monthly Housing Costs | $496 | $1,682 |
| Real Estate Taxes | $2,184 | $231 |
Property Value by Mortgage Status in Lehi
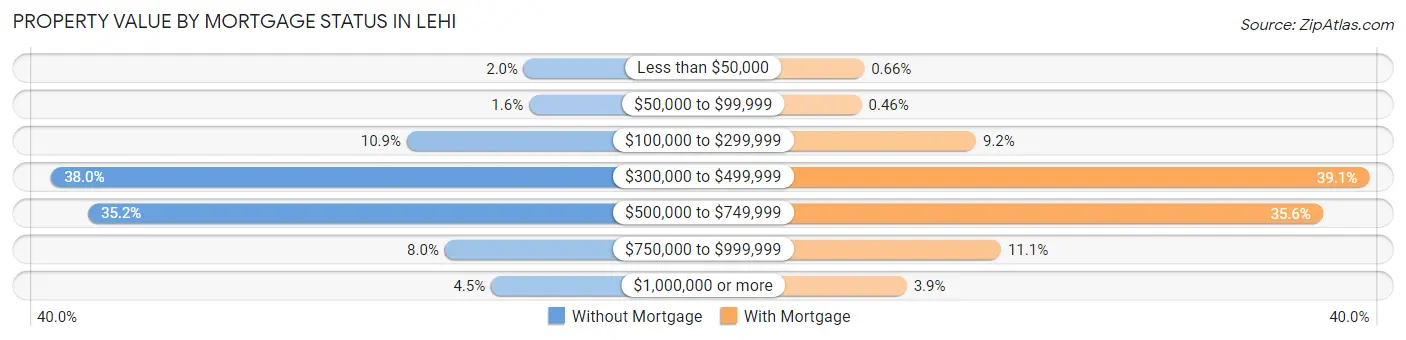
| Property Value | Without Mortgage | With Mortgage |
| Less than $50,000 | 61 (2.0%) | 90 (0.7%) |
| $50,000 to $99,999 | 49 (1.6%) | 62 (0.5%) |
| $100,000 to $299,999 | 339 (10.9%) | 1,243 (9.2%) |
| $300,000 to $499,999 | 1,183 (38.0%) | 5,301 (39.1%) |
| $500,000 to $749,999 | 1,096 (35.2%) | 4,821 (35.6%) |
| $750,000 to $999,999 | 249 (8.0%) | 1,501 (11.1%) |
| $1,000,000 or more | 139 (4.5%) | 529 (3.9%) |
| Total | 3,116 (100.0%) | 13,547 (100.0%) |
Household Income by Mortgage Status in Lehi
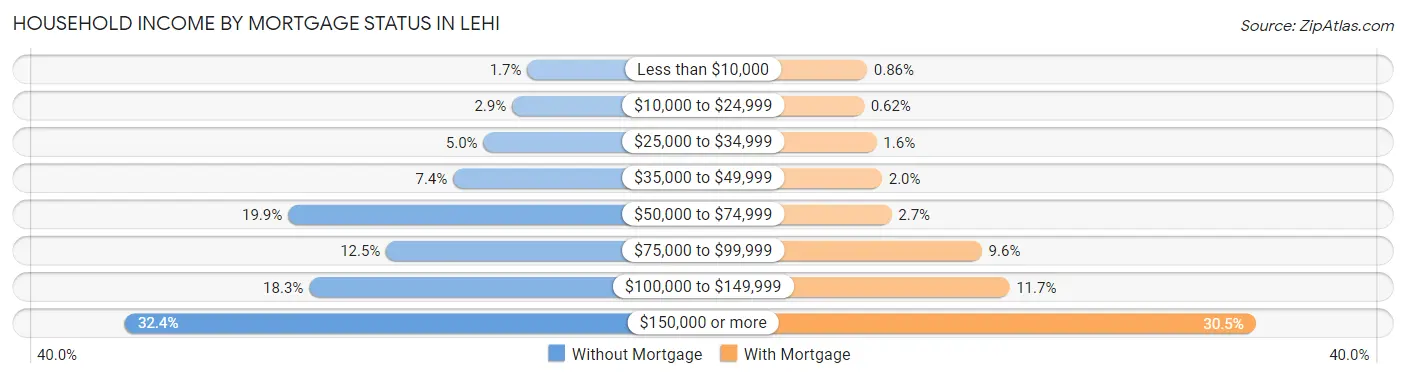
| Household Income | Without Mortgage | With Mortgage |
| Less than $10,000 | 53 (1.7%) | 117 (0.9%) |
| $10,000 to $24,999 | 89 (2.9%) | 84 (0.6%) |
| $25,000 to $34,999 | 157 (5.0%) | 216 (1.6%) |
| $35,000 to $49,999 | 229 (7.3%) | 271 (2.0%) |
| $50,000 to $74,999 | 621 (19.9%) | 370 (2.7%) |
| $75,000 to $99,999 | 388 (12.4%) | 1,302 (9.6%) |
| $100,000 to $149,999 | 571 (18.3%) | 1,587 (11.7%) |
| $150,000 or more | 1,008 (32.4%) | 4,129 (30.5%) |
| Total | 3,116 (100.0%) | 13,547 (100.0%) |
Property Value to Household Income Ratio in Lehi
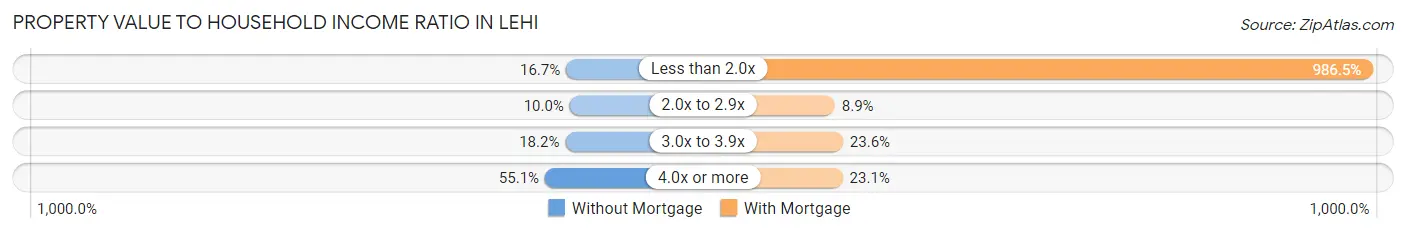
| Value-to-Income Ratio | Without Mortgage | With Mortgage |
| Less than 2.0x | 521 (16.7%) | 133,647 (986.5%) |
| 2.0x to 2.9x | 313 (10.0%) | 1,206 (8.9%) |
| 3.0x to 3.9x | 566 (18.2%) | 3,195 (23.6%) |
| 4.0x or more | 1,716 (55.1%) | 3,131 (23.1%) |
| Total | 3,116 (100.0%) | 13,547 (100.0%) |
Real Estate Taxes by Mortgage Status in Lehi
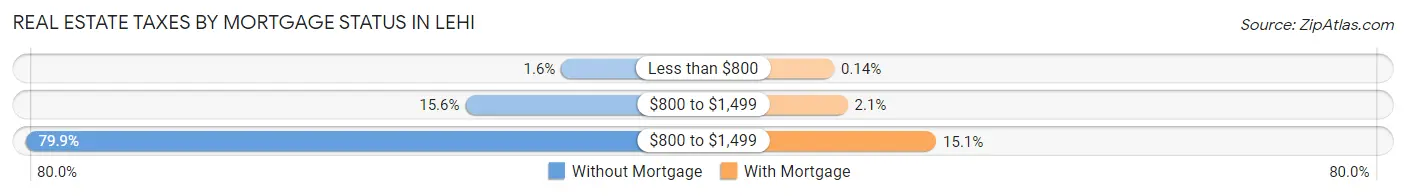
| Property Taxes | Without Mortgage | With Mortgage |
| Less than $800 | 50 (1.6%) | 19 (0.1%) |
| $800 to $1,499 | 486 (15.6%) | 288 (2.1%) |
| $800 to $1,499 | 2,488 (79.8%) | 2,040 (15.1%) |
| Total | 3,116 (100.0%) | 13,547 (100.0%) |
Health & Disability in Lehi
Health Insurance Coverage by Age in Lehi
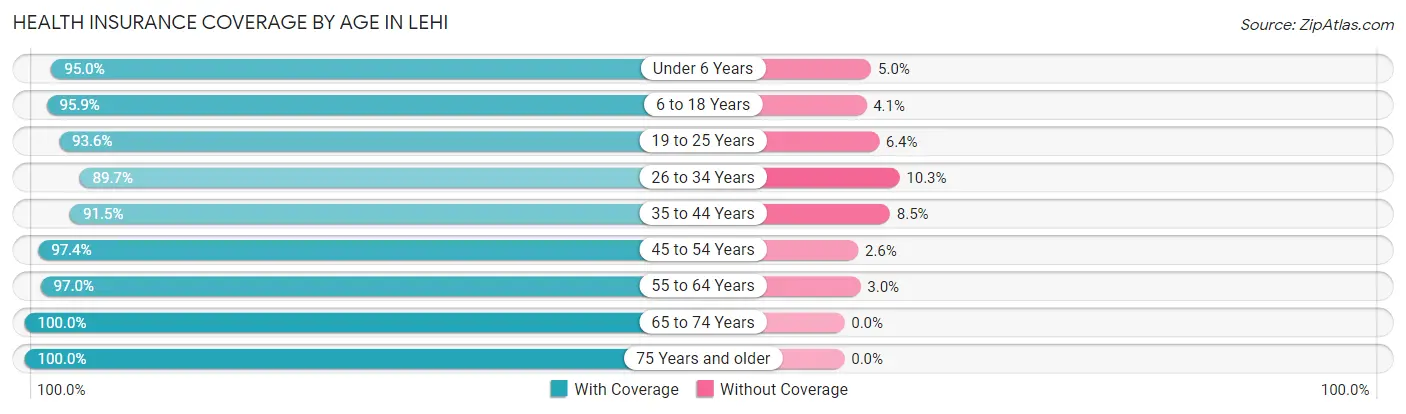
| Age Bracket | With Coverage | Without Coverage |
| Under 6 Years | 8,667 (95.0%) | 455 (5.0%) |
| 6 to 18 Years | 20,456 (95.9%) | 870 (4.1%) |
| 19 to 25 Years | 7,024 (93.6%) | 483 (6.4%) |
| 26 to 34 Years | 9,571 (89.7%) | 1,095 (10.3%) |
| 35 to 44 Years | 11,387 (91.5%) | 1,056 (8.5%) |
| 45 to 54 Years | 6,741 (97.4%) | 177 (2.6%) |
| 55 to 64 Years | 4,433 (97.0%) | 137 (3.0%) |
| 65 to 74 Years | 2,677 (100.0%) | 0 (0.0%) |
| 75 Years and older | 1,668 (100.0%) | 0 (0.0%) |
| Total | 72,624 (94.4%) | 4,273 (5.6%) |
Health Insurance Coverage by Citizenship Status in Lehi
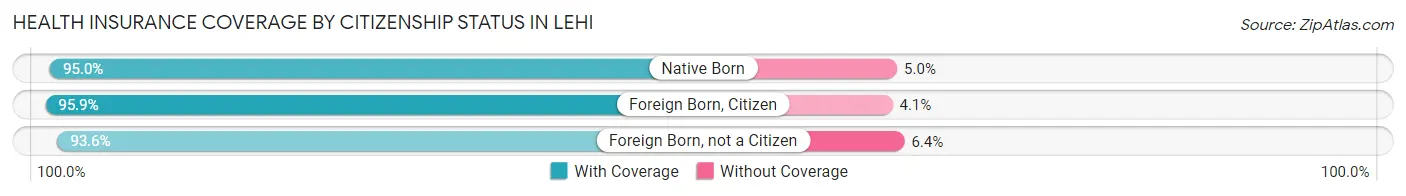
| Citizenship Status | With Coverage | Without Coverage |
| Native Born | 8,667 (95.0%) | 455 (5.0%) |
| Foreign Born, Citizen | 20,456 (95.9%) | 870 (4.1%) |
| Foreign Born, not a Citizen | 7,024 (93.6%) | 483 (6.4%) |
Health Insurance Coverage by Household Income in Lehi
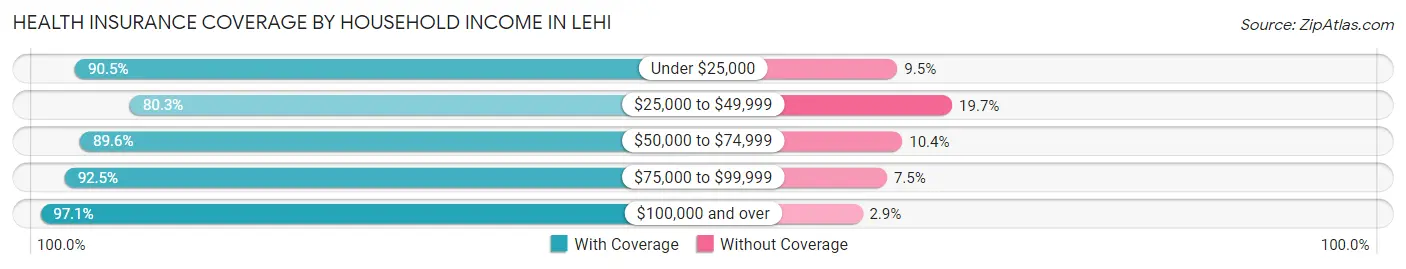
| Household Income | With Coverage | Without Coverage |
| Under $25,000 | 1,900 (90.5%) | 199 (9.5%) |
| $25,000 to $49,999 | 3,525 (80.3%) | 867 (19.7%) |
| $50,000 to $74,999 | 8,257 (89.6%) | 958 (10.4%) |
| $75,000 to $99,999 | 8,941 (92.5%) | 727 (7.5%) |
| $100,000 and over | 49,941 (97.1%) | 1,512 (2.9%) |
Public vs Private Health Insurance Coverage by Age in Lehi
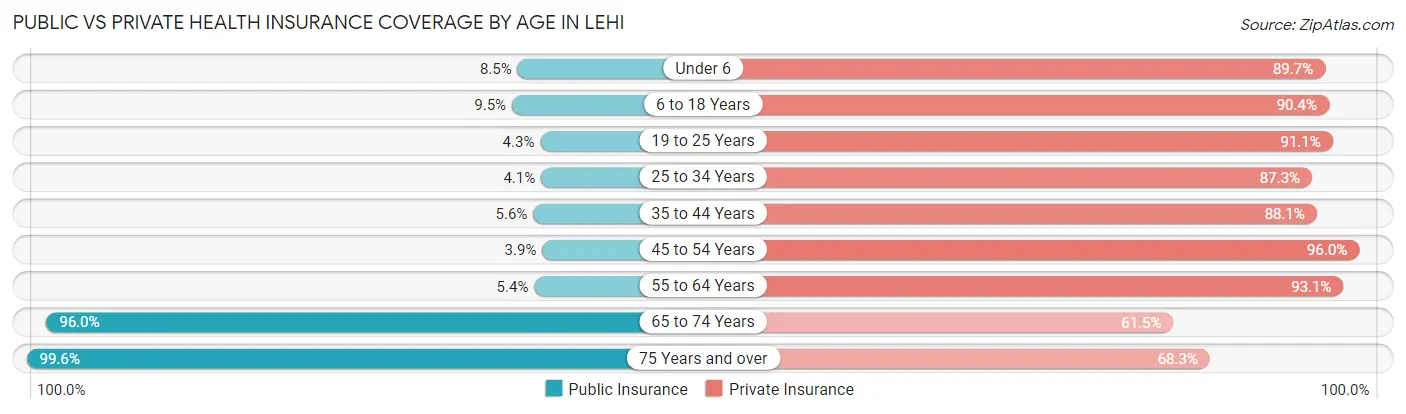
| Age Bracket | Public Insurance | Private Insurance |
| Under 6 | 775 (8.5%) | 8,181 (89.7%) |
| 6 to 18 Years | 2,035 (9.5%) | 19,274 (90.4%) |
| 19 to 25 Years | 322 (4.3%) | 6,838 (91.1%) |
| 25 to 34 Years | 442 (4.1%) | 9,306 (87.3%) |
| 35 to 44 Years | 697 (5.6%) | 10,967 (88.1%) |
| 45 to 54 Years | 271 (3.9%) | 6,643 (96.0%) |
| 55 to 64 Years | 247 (5.4%) | 4,254 (93.1%) |
| 65 to 74 Years | 2,569 (96.0%) | 1,647 (61.5%) |
| 75 Years and over | 1,662 (99.6%) | 1,139 (68.3%) |
| Total | 9,020 (11.7%) | 68,249 (88.7%) |
Disability Status by Sex by Age in Lehi
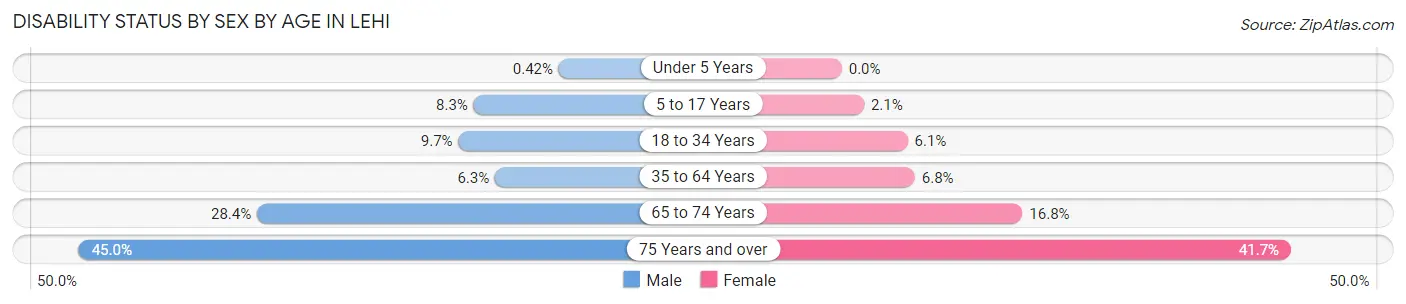
| Age Bracket | Male | Female |
| Under 5 Years | 16 (0.4%) | 0 (0.0%) |
| 5 to 17 Years | 915 (8.3%) | 215 (2.1%) |
| 18 to 34 Years | 954 (9.7%) | 608 (6.1%) |
| 35 to 64 Years | 784 (6.3%) | 784 (6.8%) |
| 65 to 74 Years | 371 (28.4%) | 230 (16.8%) |
| 75 Years and over | 326 (45.0%) | 393 (41.7%) |
Disability Class by Sex by Age in Lehi
Disability Class: Hearing Difficulty
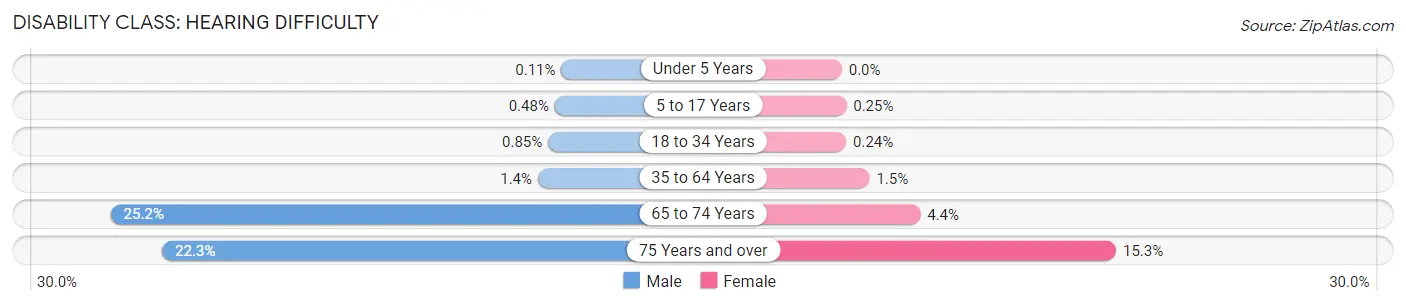
| Age Bracket | Male | Female |
| Under 5 Years | 4 (0.1%) | 0 (0.0%) |
| 5 to 17 Years | 53 (0.5%) | 26 (0.3%) |
| 18 to 34 Years | 83 (0.9%) | 24 (0.2%) |
| 35 to 64 Years | 176 (1.4%) | 178 (1.5%) |
| 65 to 74 Years | 329 (25.2%) | 60 (4.4%) |
| 75 Years and over | 162 (22.3%) | 144 (15.3%) |
Disability Class: Vision Difficulty
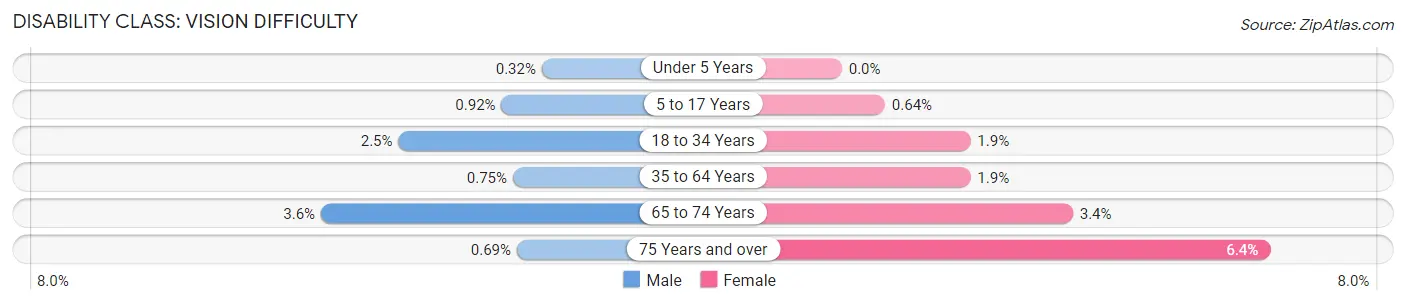
| Age Bracket | Male | Female |
| Under 5 Years | 12 (0.3%) | 0 (0.0%) |
| 5 to 17 Years | 101 (0.9%) | 67 (0.6%) |
| 18 to 34 Years | 240 (2.5%) | 190 (1.9%) |
| 35 to 64 Years | 93 (0.7%) | 221 (1.9%) |
| 65 to 74 Years | 47 (3.6%) | 47 (3.4%) |
| 75 Years and over | 5 (0.7%) | 60 (6.4%) |
Disability Class: Cognitive Difficulty
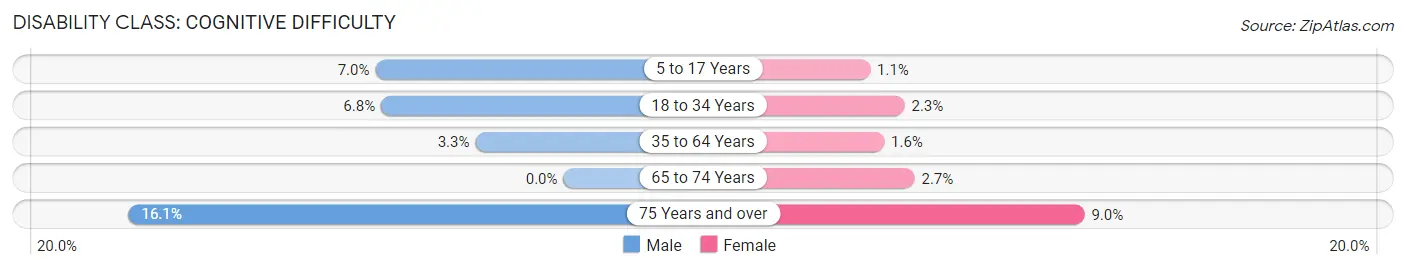
| Age Bracket | Male | Female |
| 5 to 17 Years | 767 (7.0%) | 109 (1.1%) |
| 18 to 34 Years | 663 (6.8%) | 232 (2.3%) |
| 35 to 64 Years | 404 (3.3%) | 182 (1.6%) |
| 65 to 74 Years | 0 (0.0%) | 37 (2.7%) |
| 75 Years and over | 117 (16.1%) | 85 (9.0%) |
Disability Class: Ambulatory Difficulty
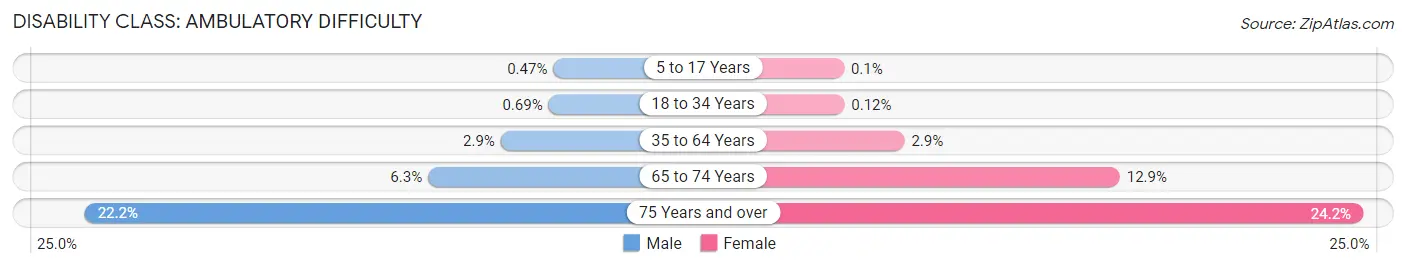
| Age Bracket | Male | Female |
| 5 to 17 Years | 52 (0.5%) | 10 (0.1%) |
| 18 to 34 Years | 68 (0.7%) | 12 (0.1%) |
| 35 to 64 Years | 360 (2.9%) | 336 (2.9%) |
| 65 to 74 Years | 82 (6.3%) | 177 (12.9%) |
| 75 Years and over | 161 (22.2%) | 228 (24.2%) |
Disability Class: Self-Care Difficulty
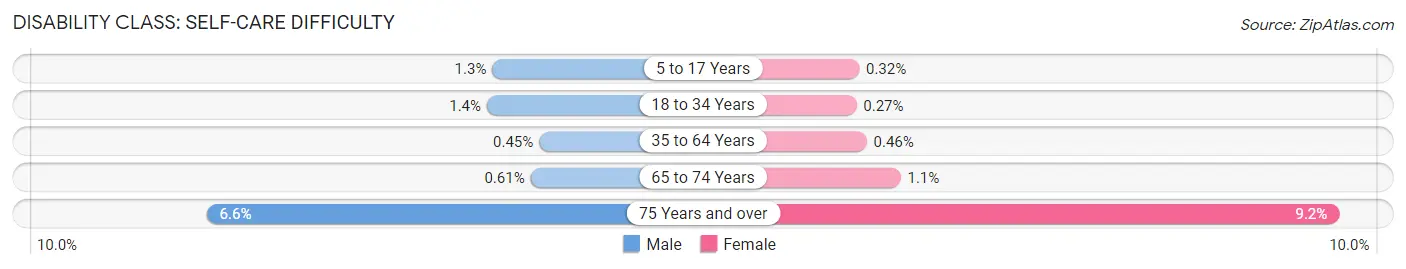
| Age Bracket | Male | Female |
| 5 to 17 Years | 145 (1.3%) | 33 (0.3%) |
| 18 to 34 Years | 139 (1.4%) | 27 (0.3%) |
| 35 to 64 Years | 56 (0.4%) | 53 (0.5%) |
| 65 to 74 Years | 8 (0.6%) | 15 (1.1%) |
| 75 Years and over | 48 (6.6%) | 87 (9.2%) |
Technology Access in Lehi
Computing Device Access in Lehi
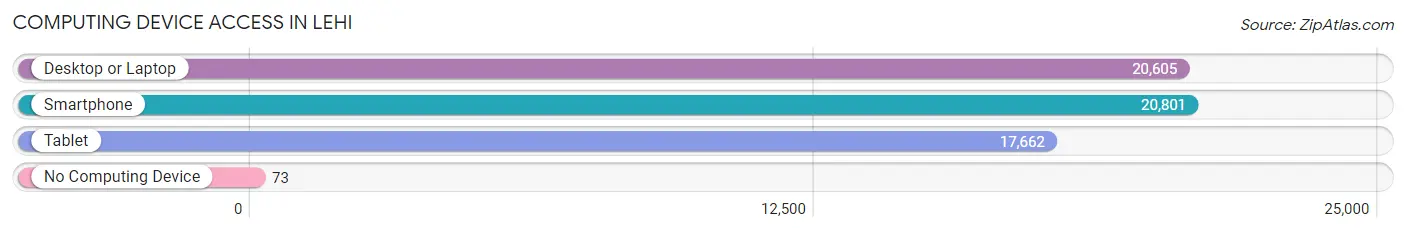
| Device Type | # Households | % Households |
| Desktop or Laptop | 20,605 | 97.0% |
| Smartphone | 20,801 | 97.9% |
| Tablet | 17,662 | 83.1% |
| No Computing Device | 73 | 0.3% |
| Total | 21,250 | 100.0% |
Internet Access in Lehi
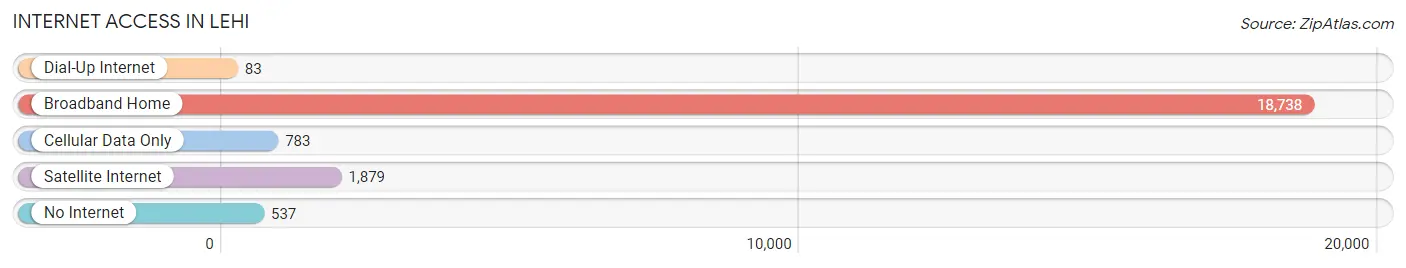
| Internet Type | # Households | % Households |
| Dial-Up Internet | 83 | 0.4% |
| Broadband Home | 18,738 | 88.2% |
| Cellular Data Only | 783 | 3.7% |
| Satellite Internet | 1,879 | 8.8% |
| No Internet | 537 | 2.5% |
| Total | 21,250 | 100.0% |
Lehi Summary
Lehi, Utah is a city located in the northern part of Utah County, Utah. It is part of the Provo-Orem Metropolitan Statistical Area. The city is situated on the western shore of Utah Lake and is bordered by the cities of American Fork, Pleasant Grove, and Alpine. As of the 2010 census, the population of Lehi was 47,407, making it the sixth-largest city in Utah.
History
Lehi was first settled in the 1850s by Mormon pioneers. The city was named after Lehi, a prophet in the Book of Mormon. The city was incorporated in 1852 and was the first city in Utah to be incorporated by the Utah Territorial Legislature.
In the late 19th century, Lehi was a major agricultural center, producing sugar beets, wheat, and other crops. The city was also home to several large sugar beet processing plants. In the early 20th century, Lehi began to experience rapid growth due to the construction of the Utah and Salt Lake Canal, which provided irrigation water to the area.
Geography
Lehi is located in northern Utah County, Utah, at the western edge of Utah Lake. The city is situated at an elevation of 4,567 feet (1,392 m). The city covers an area of 24.2 square miles (62.6 km2).
The climate in Lehi is semi-arid, with hot summers and cold winters. The average annual precipitation is 15.7 inches (400 mm).
Economy
Lehi is home to several major employers, including Adobe, Ancestry.com, Vivint, and Xactware. The city is also home to several technology companies, including Qualtrics, Domo, and InsideSales.com.
Lehi is also home to several retail and dining establishments, including the Outlets at Traverse Mountain, the Lehi Roller Mills, and the Thanksgiving Point Golf Course.
Demographics
As of the 2010 census, the population of Lehi was 47,407. The racial makeup of the city was 87.2% White, 0.7% African American, 0.7% Native American, 2.2% Asian, 0.2% Pacific Islander, 6.3% from other races, and 2.7% from two or more races. Hispanic or Latino of any race were 11.3% of the population.
The median income for a household in Lehi was $71,837, and the median income for a family was $80,837. The per capita income for the city was $30,945. About 4.3% of families and 5.7% of the population were below the poverty line, including 6.7% of those under age 18 and 4.2% of those age 65 or over.
Common Questions
What is Per Capita Income in Lehi?
Per Capita income in Lehi is $39,183.
What is the Median Family Income in Lehi?
Median Family Income in Lehi is $125,448.
What is the Median Household income in Lehi?
Median Household Income in Lehi is $117,243.
What is Income or Wage Gap in Lehi?
Income or Wage Gap in Lehi is 60.1%.
Women in Lehi earn 39.9 cents for every dollar earned by a man.
What is Inequality or Gini Index in Lehi?
Inequality or Gini Index in Lehi is 0.37.
What is the Total Population of Lehi?
Total Population of Lehi is 77,110.
What is the Total Male Population of Lehi?
Total Male Population of Lehi is 39,130.
What is the Total Female Population of Lehi?
Total Female Population of Lehi is 37,980.
What is the Ratio of Males per 100 Females in Lehi?
There are 103.03 Males per 100 Females in Lehi.
What is the Ratio of Females per 100 Males in Lehi?
There are 97.06 Females per 100 Males in Lehi.
What is the Median Population Age in Lehi?
Median Population Age in Lehi is 26.6 Years.
What is the Average Family Size in Lehi
Average Family Size in Lehi is 4.0 People.
What is the Average Household Size in Lehi
Average Household Size in Lehi is 3.6 People.
How Large is the Labor Force in Lehi?
There are 38,138 People in the Labor Forcein in Lehi.
What is the Percentage of People in the Labor Force in Lehi?
74.4% of People are in the Labor Force in Lehi.
What is the Unemployment Rate in Lehi?
Unemployment Rate in Lehi is 4.4%.