Uintah County, UT Map & Demographics
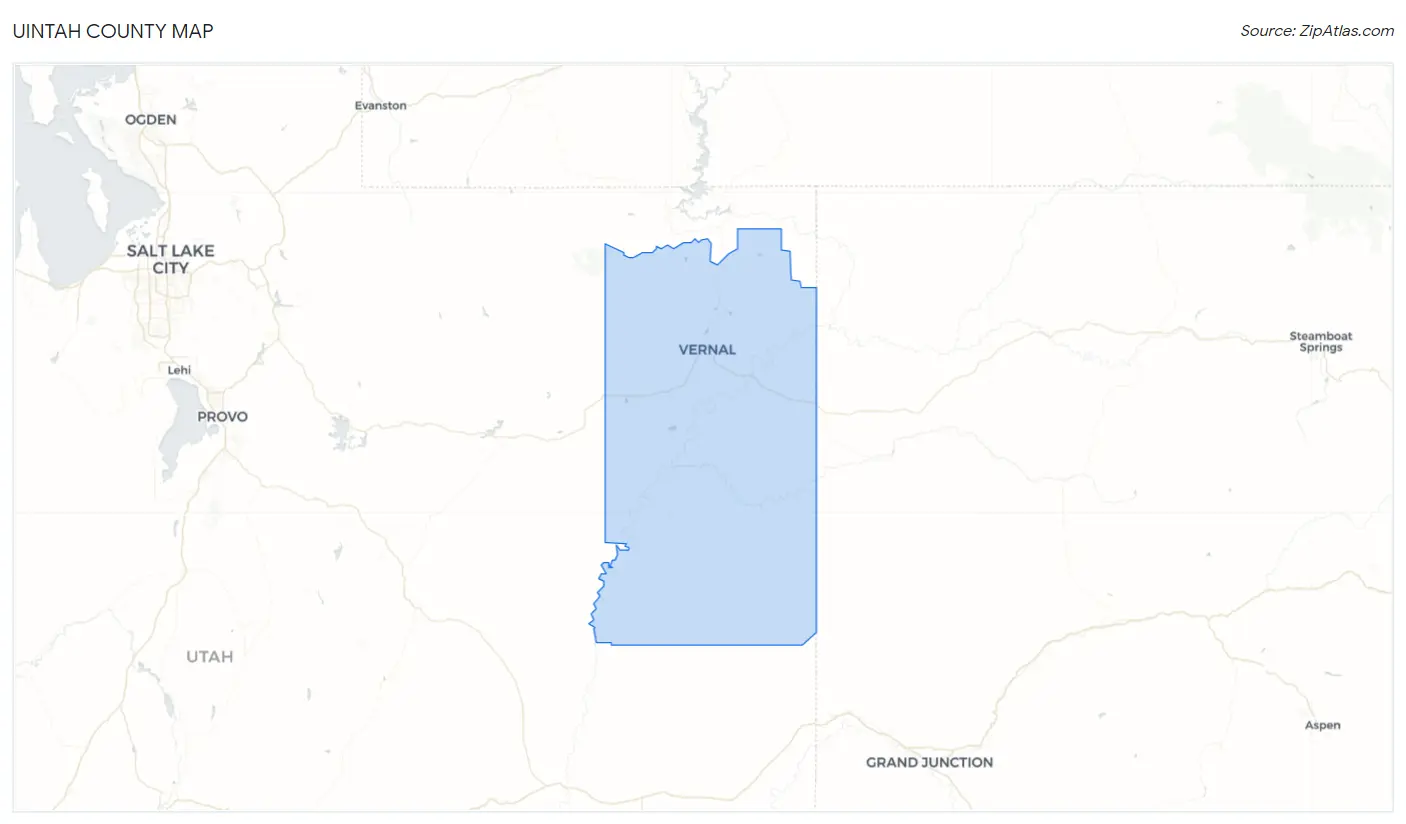
Uintah County Map
Uintah County Overview
$27,977
PER CAPITA INCOME
$84,065
AVG FAMILY INCOME
$67,983
AVG HOUSEHOLD INCOME
64.6%
WAGE / INCOME GAP [ % ]
35.4¢/ $1
WAGE / INCOME GAP [ $ ]
$12,488
FAMILY INCOME DEFICIT
0.42
INEQUALITY / GINI INDEX
35,951
TOTAL POPULATION
18,211
MALE POPULATION
17,740
FEMALE POPULATION
102.66
MALES / 100 FEMALES
97.41
FEMALES / 100 MALES
32.4
MEDIAN AGE
3.7
AVG FAMILY SIZE
3.1
AVG HOUSEHOLD SIZE
15,572
LABOR FORCE [ PEOPLE ]
60.4%
PERCENT IN LABOR FORCE
6.3%
UNEMPLOYMENT RATE
Uintah County Area Codes
Income in Uintah County
Income Overview in Uintah County
Per Capita Income in Uintah County is $27,977, while median incomes of families and households are $84,065 and $67,983 respectively.
| Characteristic | Number | Measure |
| Per Capita Income | 35,951 | $27,977 |
| Median Family Income | 8,372 | $84,065 |
| Mean Family Income | 8,372 | $97,845 |
| Median Household Income | 11,547 | $67,983 |
| Mean Household Income | 11,547 | $84,449 |
| Income Deficit | 8,372 | $12,488 |
| Wage / Income Gap (%) | 35,951 | 64.63% |
| Wage / Income Gap ($) | 35,951 | 35.37¢ per $1 |
| Gini / Inequality Index | 35,951 | 0.42 |
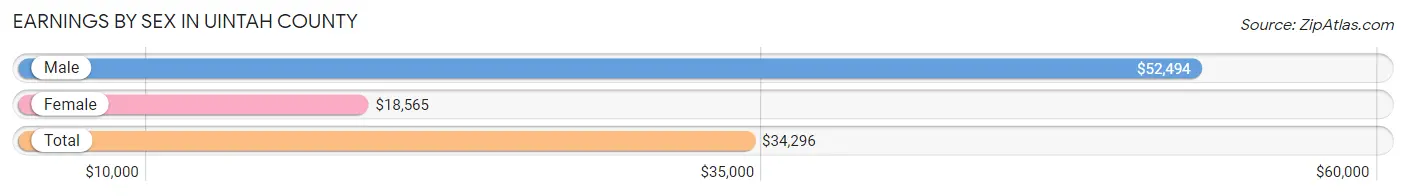
Earnings by Sex in Uintah County
Average Earnings in Uintah County are $34,296, $52,494 for men and $18,565 for women, a difference of 64.6%.
| Sex | Number | Average Earnings |
| Male | 9,069 (55.6%) | $52,494 |
| Female | 7,241 (44.4%) | $18,565 |
| Total | 16,310 (100.0%) | $34,296 |
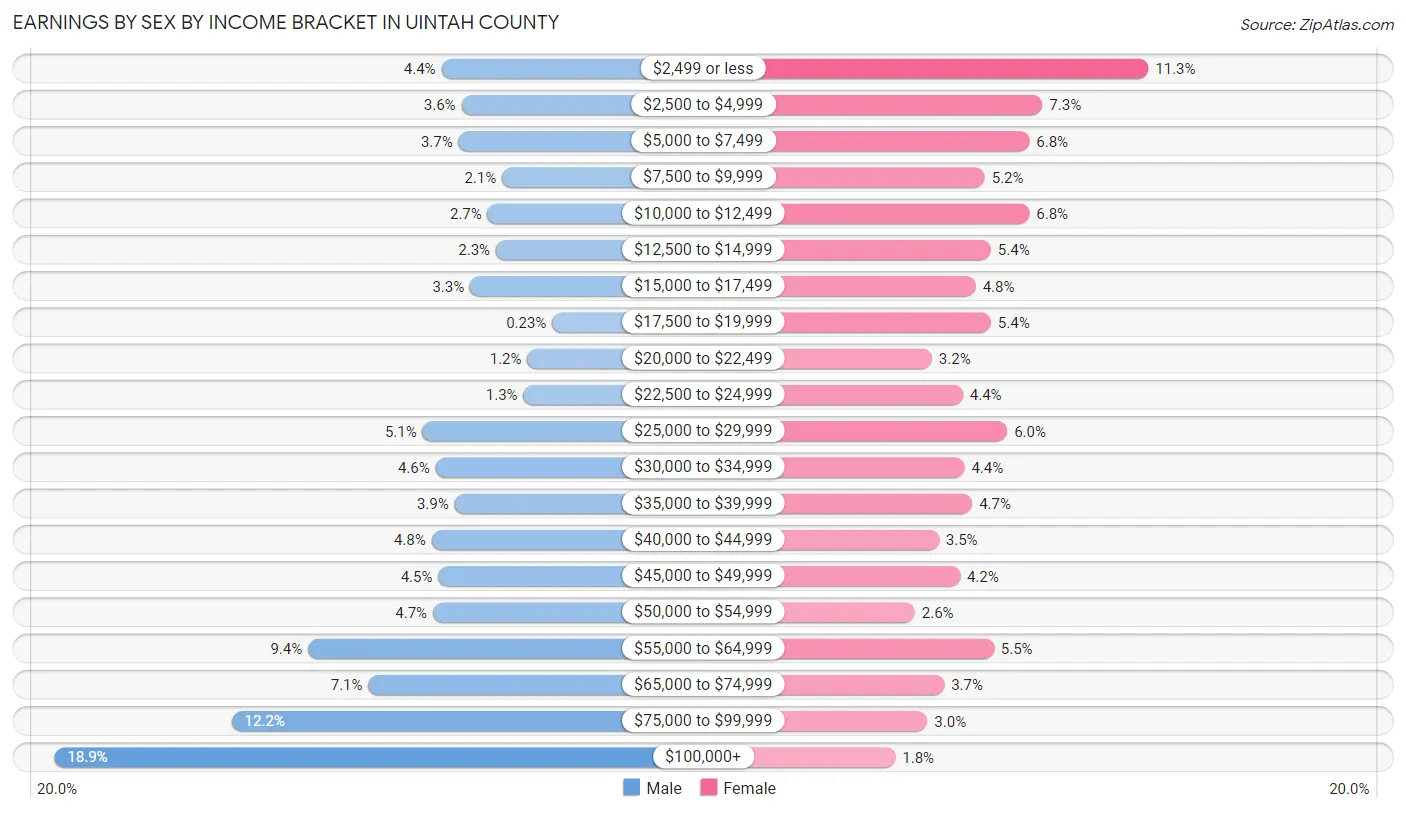
Earnings by Sex by Income Bracket in Uintah County
The most common earnings brackets in Uintah County are $100,000+ for men (1,712 | 18.9%) and $2,499 or less for women (818 | 11.3%).
| Income | Male | Female |
| $2,499 or less | 397 (4.4%) | 818 (11.3%) |
| $2,500 to $4,999 | 329 (3.6%) | 531 (7.3%) |
| $5,000 to $7,499 | 339 (3.7%) | 495 (6.8%) |
| $7,500 to $9,999 | 191 (2.1%) | 374 (5.2%) |
| $10,000 to $12,499 | 240 (2.6%) | 495 (6.8%) |
| $12,500 to $14,999 | 212 (2.3%) | 391 (5.4%) |
| $15,000 to $17,499 | 300 (3.3%) | 350 (4.8%) |
| $17,500 to $19,999 | 21 (0.2%) | 391 (5.4%) |
| $20,000 to $22,499 | 105 (1.2%) | 231 (3.2%) |
| $22,500 to $24,999 | 119 (1.3%) | 315 (4.3%) |
| $25,000 to $29,999 | 462 (5.1%) | 435 (6.0%) |
| $30,000 to $34,999 | 417 (4.6%) | 319 (4.4%) |
| $35,000 to $39,999 | 353 (3.9%) | 340 (4.7%) |
| $40,000 to $44,999 | 431 (4.8%) | 250 (3.5%) |
| $45,000 to $49,999 | 408 (4.5%) | 307 (4.2%) |
| $50,000 to $54,999 | 426 (4.7%) | 185 (2.5%) |
| $55,000 to $64,999 | 851 (9.4%) | 399 (5.5%) |
| $65,000 to $74,999 | 646 (7.1%) | 264 (3.6%) |
| $75,000 to $99,999 | 1,110 (12.2%) | 219 (3.0%) |
| $100,000+ | 1,712 (18.9%) | 132 (1.8%) |
| Total | 9,069 (100.0%) | 7,241 (100.0%) |
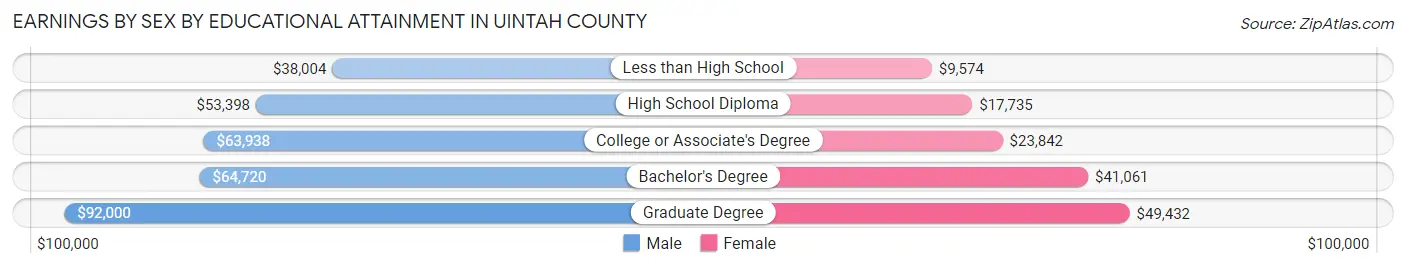
Earnings by Sex by Educational Attainment in Uintah County
Average earnings in Uintah County are $60,261 for men and $20,761 for women, a difference of 65.5%. Men with an educational attainment of graduate degree enjoy the highest average annual earnings of $92,000, while those with less than high school education earn the least with $38,004. Women with an educational attainment of graduate degree earn the most with the average annual earnings of $49,432, while those with less than high school education have the smallest earnings of $9,574.
| Educational Attainment | Male Income | Female Income |
| Less than High School | $38,004 | $9,574 |
| High School Diploma | $53,398 | $17,735 |
| College or Associate's Degree | $63,938 | $23,842 |
| Bachelor's Degree | $64,720 | $41,061 |
| Graduate Degree | $92,000 | $49,432 |
| Total | $60,261 | $20,761 |
Family Income in Uintah County
Family Income Brackets in Uintah County
According to the Uintah County family income data, there are 1,959 families falling into the $100,000 to $149,999 income range, which is the most common income bracket and makes up 23.4% of all families. Conversely, the $10,000 to $14,999 income bracket is the least frequent group with only 92 families (1.1%) belonging to this category.
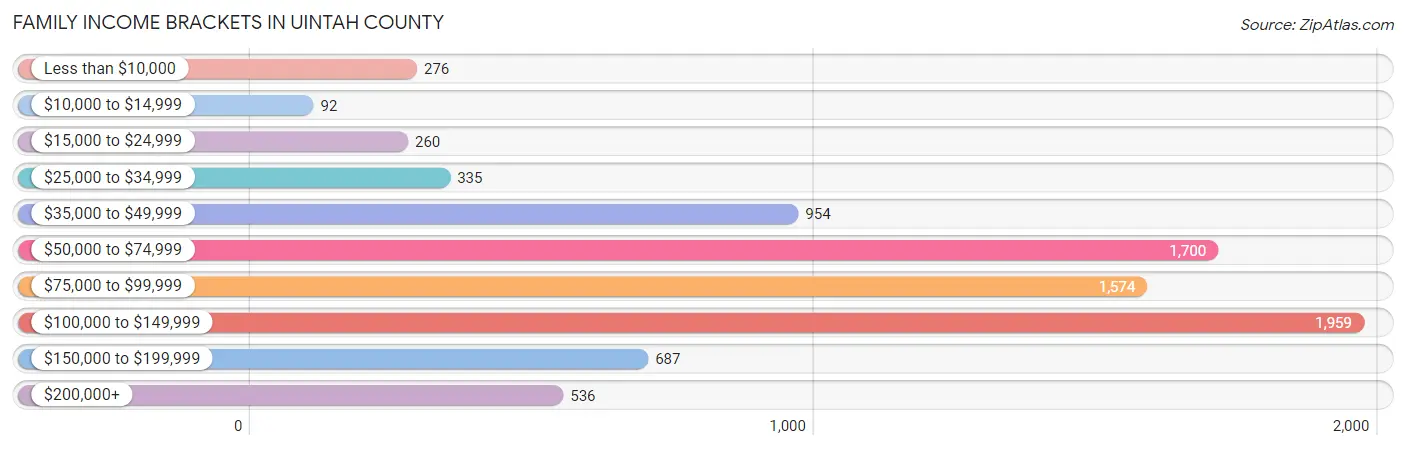
| Income Bracket | # Families | % Families |
| Less than $10,000 | 276 | 3.3% |
| $10,000 to $14,999 | 92 | 1.1% |
| $15,000 to $24,999 | 260 | 3.1% |
| $25,000 to $34,999 | 335 | 4.0% |
| $35,000 to $49,999 | 954 | 11.4% |
| $50,000 to $74,999 | 1,700 | 20.3% |
| $75,000 to $99,999 | 1,574 | 18.8% |
| $100,000 to $149,999 | 1,959 | 23.4% |
| $150,000 to $199,999 | 687 | 8.2% |
| $200,000+ | 536 | 6.4% |
Family Income by Famaliy Size in Uintah County
7+ person families (459 | 5.5%) account for the highest median family income in Uintah County with $105,938 per family, while 2-person families (3,205 | 38.3%) have the highest median income of $39,711 per family member.
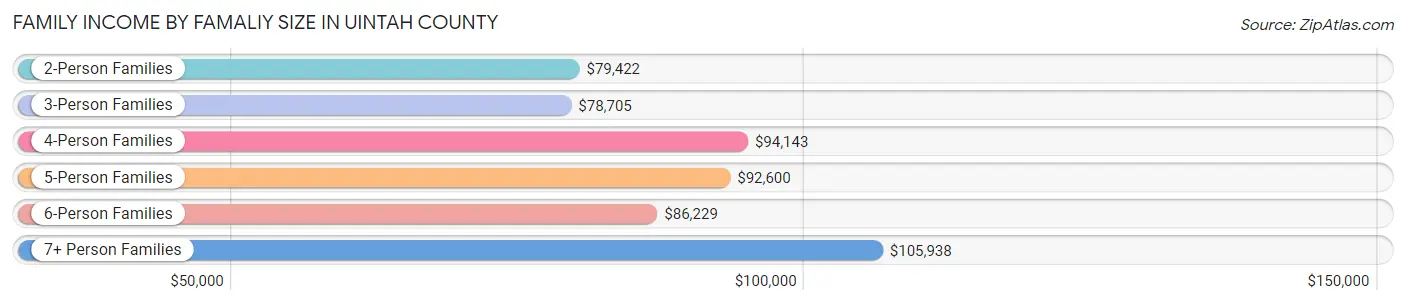
| Income Bracket | # Families | Median Income |
| 2-Person Families | 3,205 (38.3%) | $79,422 |
| 3-Person Families | 1,667 (19.9%) | $78,705 |
| 4-Person Families | 1,633 (19.5%) | $94,143 |
| 5-Person Families | 786 (9.4%) | $92,600 |
| 6-Person Families | 622 (7.4%) | $86,229 |
| 7+ Person Families | 459 (5.5%) | $105,938 |
| Total | 8,372 (100.0%) | $84,065 |
Family Income by Number of Earners in Uintah County
The median family income in Uintah County is $84,065, with families comprising 3+ earners (1,085) having the highest median family income of $128,566, while families with no earners (1,371) have the lowest median family income of $52,734, accounting for 13.0% and 16.4% of families, respectively.
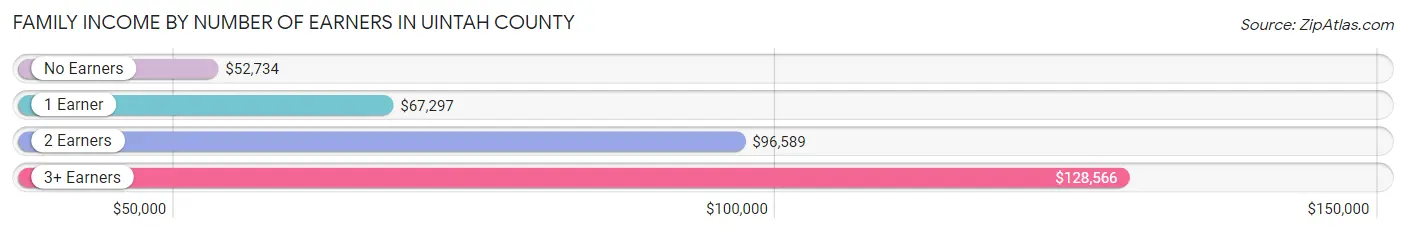
| Number of Earners | # Families | Median Income |
| No Earners | 1,371 (16.4%) | $52,734 |
| 1 Earner | 2,773 (33.1%) | $67,297 |
| 2 Earners | 3,143 (37.5%) | $96,589 |
| 3+ Earners | 1,085 (13.0%) | $128,566 |
| Total | 8,372 (100.0%) | $84,065 |
Household Income in Uintah County
Household Income Brackets in Uintah County
With 2,240 households falling in the category, the $50,000 to $74,999 income range is the most frequent in Uintah County, accounting for 19.4% of all households. In contrast, only 254 households (2.2%) fall into the $10,000 to $14,999 income bracket, making it the least populous group.
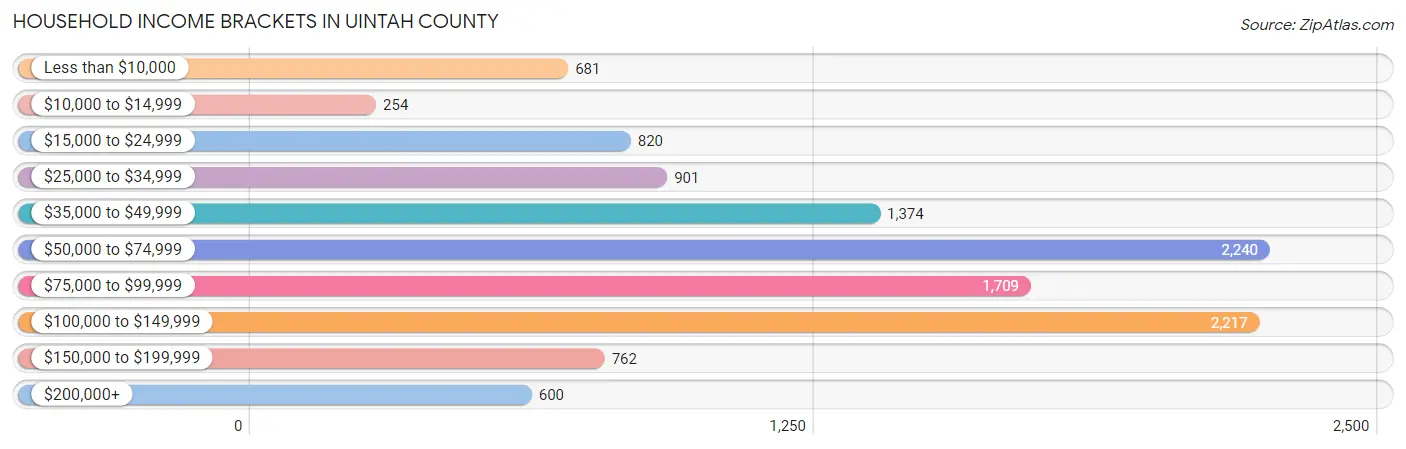
| Income Bracket | # Households | % Households |
| Less than $10,000 | 681 | 5.9% |
| $10,000 to $14,999 | 254 | 2.2% |
| $15,000 to $24,999 | 820 | 7.1% |
| $25,000 to $34,999 | 901 | 7.8% |
| $35,000 to $49,999 | 1,374 | 11.9% |
| $50,000 to $74,999 | 2,240 | 19.4% |
| $75,000 to $99,999 | 1,709 | 14.8% |
| $100,000 to $149,999 | 2,217 | 19.2% |
| $150,000 to $199,999 | 762 | 6.6% |
| $200,000+ | 600 | 5.2% |
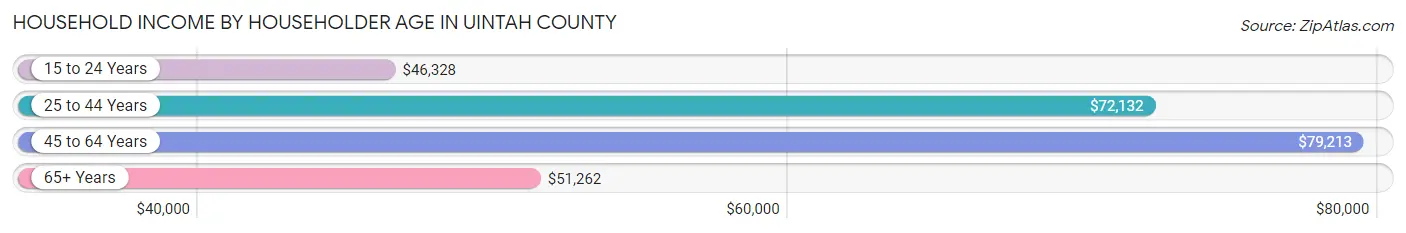
Household Income by Householder Age in Uintah County
The median household income in Uintah County is $67,983, with the highest median household income of $79,213 found in the 45 to 64 years age bracket for the primary householder. A total of 3,901 households (33.8%) fall into this category. Meanwhile, the 15 to 24 years age bracket for the primary householder has the lowest median household income of $46,328, with 571 households (5.0%) in this group.
| Income Bracket | # Households | Median Income |
| 15 to 24 Years | 571 (5.0%) | $46,328 |
| 25 to 44 Years | 4,556 (39.5%) | $72,132 |
| 45 to 64 Years | 3,901 (33.8%) | $79,213 |
| 65+ Years | 2,519 (21.8%) | $51,262 |
| Total | 11,547 (100.0%) | $67,983 |
Poverty in Uintah County
Income Below Poverty by Sex and Age in Uintah County
With 10.4% poverty level for males and 12.8% for females among the residents of Uintah County, under 5 year old males and 15 year old females are the most vulnerable to poverty, with 287 males (20.7%) and 83 females (31.0%) in their respective age groups living below the poverty level.
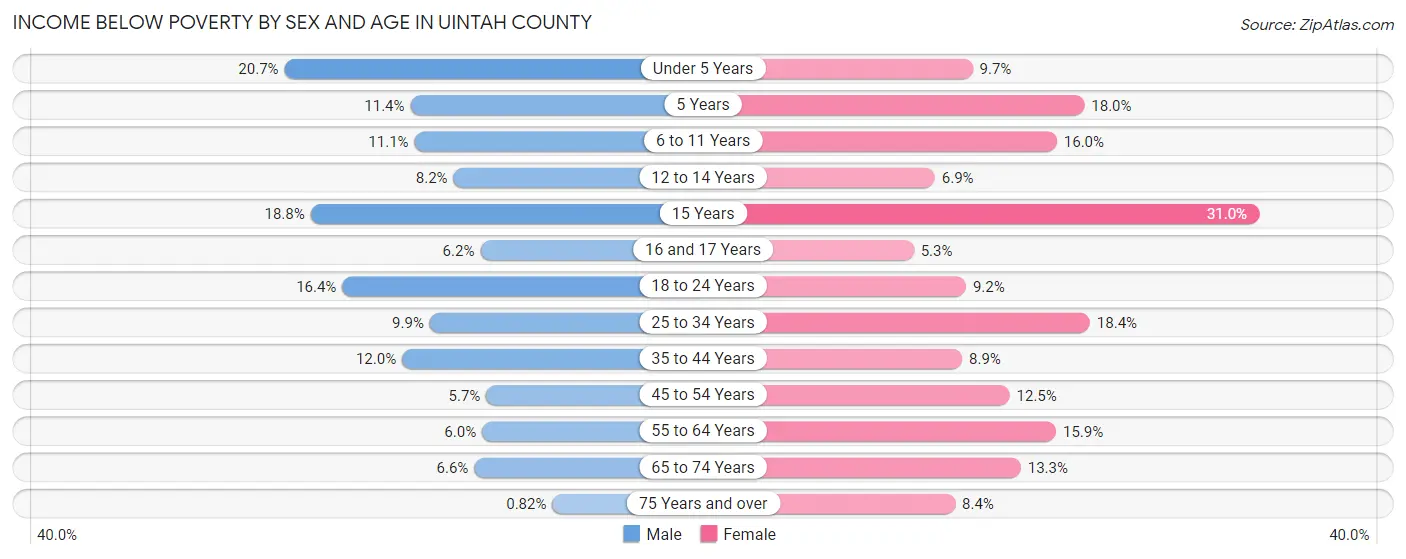
| Age Bracket | Male | Female |
| Under 5 Years | 287 (20.7%) | 136 (9.7%) |
| 5 Years | 51 (11.4%) | 65 (18.0%) |
| 6 to 11 Years | 221 (11.1%) | 320 (16.0%) |
| 12 to 14 Years | 81 (8.2%) | 53 (6.9%) |
| 15 Years | 67 (18.8%) | 83 (31.0%) |
| 16 and 17 Years | 41 (6.2%) | 37 (5.3%) |
| 18 to 24 Years | 280 (16.4%) | 132 (9.2%) |
| 25 to 34 Years | 214 (9.9%) | 451 (18.4%) |
| 35 to 44 Years | 302 (12.0%) | 229 (8.9%) |
| 45 to 54 Years | 116 (5.7%) | 214 (12.5%) |
| 55 to 64 Years | 104 (6.0%) | 294 (15.9%) |
| 65 to 74 Years | 89 (6.6%) | 167 (13.3%) |
| 75 Years and over | 5 (0.8%) | 66 (8.4%) |
| Total | 1,858 (10.4%) | 2,247 (12.8%) |
Income Above Poverty by Sex and Age in Uintah County
According to the poverty statistics in Uintah County, males aged 75 years and over and females aged 16 and 17 years are the age groups that are most secure financially, with 99.2% of males and 94.7% of females in these age groups living above the poverty line.
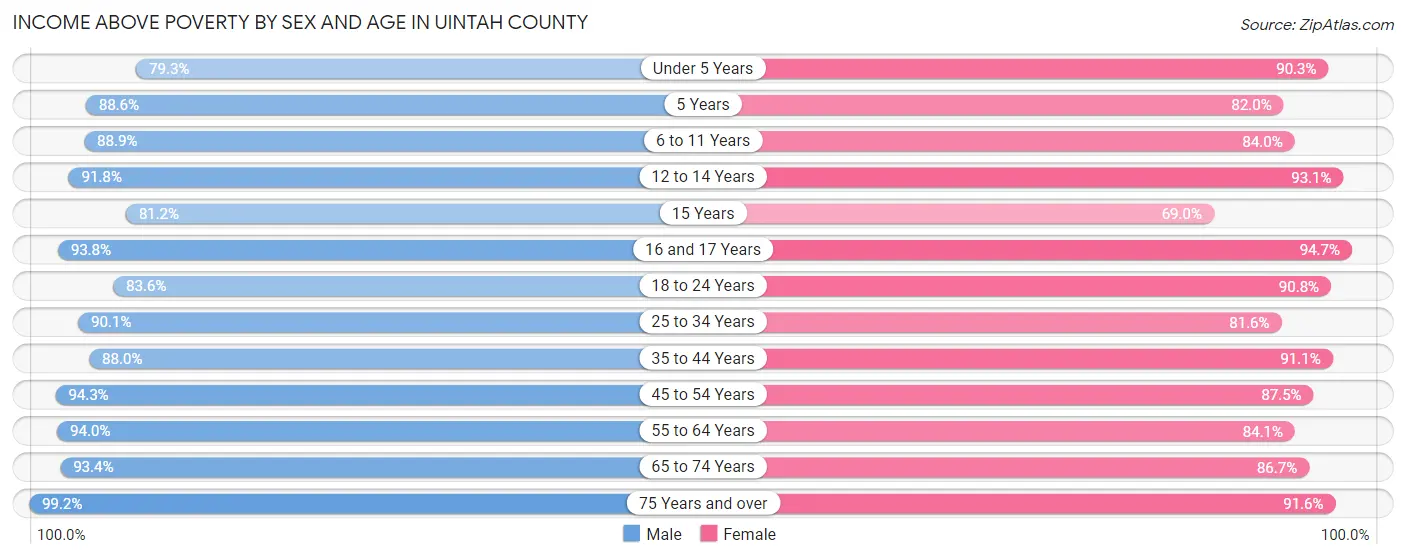
| Age Bracket | Male | Female |
| Under 5 Years | 1,099 (79.3%) | 1,264 (90.3%) |
| 5 Years | 398 (88.6%) | 296 (82.0%) |
| 6 to 11 Years | 1,778 (88.9%) | 1,684 (84.0%) |
| 12 to 14 Years | 912 (91.8%) | 714 (93.1%) |
| 15 Years | 290 (81.2%) | 185 (69.0%) |
| 16 and 17 Years | 623 (93.8%) | 656 (94.7%) |
| 18 to 24 Years | 1,425 (83.6%) | 1,299 (90.8%) |
| 25 to 34 Years | 1,944 (90.1%) | 1,998 (81.6%) |
| 35 to 44 Years | 2,219 (88.0%) | 2,334 (91.1%) |
| 45 to 54 Years | 1,910 (94.3%) | 1,503 (87.5%) |
| 55 to 64 Years | 1,617 (94.0%) | 1,554 (84.1%) |
| 65 to 74 Years | 1,255 (93.4%) | 1,090 (86.7%) |
| 75 Years and over | 602 (99.2%) | 719 (91.6%) |
| Total | 16,072 (89.6%) | 15,296 (87.2%) |
Income Below Poverty Among Married-Couple Families in Uintah County
The poverty statistics for married-couple families in Uintah County show that 4.9% or 336 of the total 6,828 families live below the poverty line. Families with 5 or more children have the highest poverty rate of 11.6%, comprising of 32 families. On the other hand, families with no children have the lowest poverty rate of 3.5%, which includes 103 families.
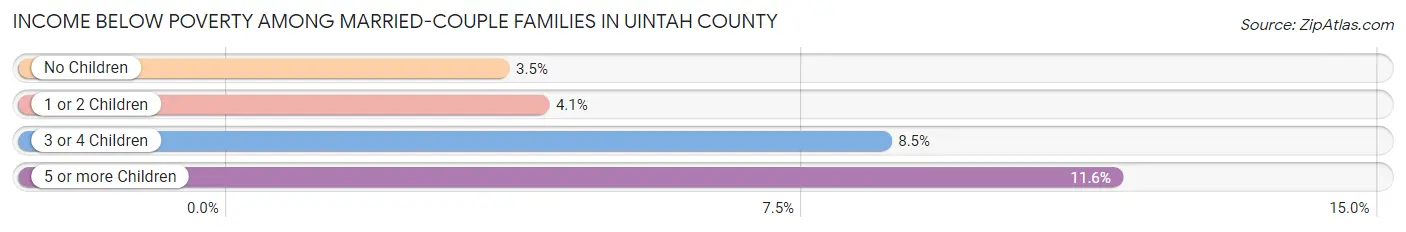
| Children | Above Poverty | Below Poverty |
| No Children | 2,803 (96.5%) | 103 (3.5%) |
| 1 or 2 Children | 2,361 (95.9%) | 100 (4.1%) |
| 3 or 4 Children | 1,083 (91.5%) | 101 (8.5%) |
| 5 or more Children | 245 (88.4%) | 32 (11.6%) |
| Total | 6,492 (95.1%) | 336 (4.9%) |
Income Below Poverty Among Single-Parent Households in Uintah County
According to the poverty data in Uintah County, 16.1% or 86 single-father households and 27.3% or 276 single-mother households are living below the poverty line. Among single-father households, those with 1 or 2 children have the highest poverty rate, with 79 households (22.9%) experiencing poverty. Likewise, among single-mother households, those with 3 or 4 children have the highest poverty rate, with 93 households (78.1%) falling below the poverty line.
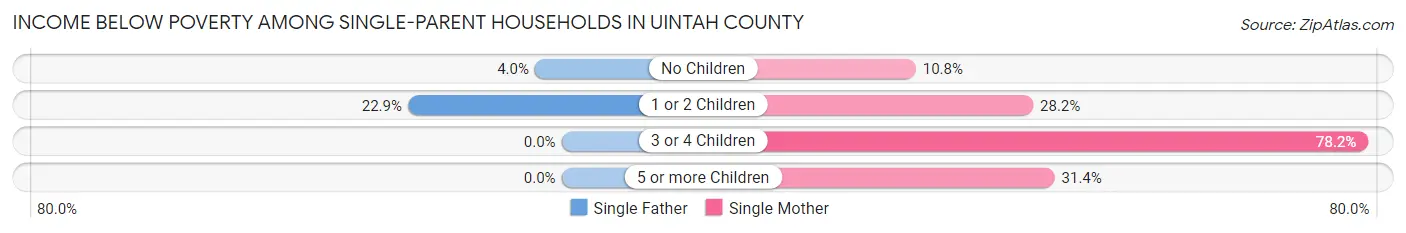
| Children | Single Father | Single Mother |
| No Children | 7 (4.0%) | 43 (10.7%) |
| 1 or 2 Children | 79 (22.9%) | 129 (28.2%) |
| 3 or 4 Children | 0 (0.0%) | 93 (78.1%) |
| 5 or more Children | 0 (0.0%) | 11 (31.4%) |
| Total | 86 (16.1%) | 276 (27.3%) |
Income Below Poverty Among Married-Couple vs Single-Parent Households in Uintah County
The poverty data for Uintah County shows that 336 of the married-couple family households (4.9%) and 362 of the single-parent households (23.4%) are living below the poverty level. Within the married-couple family households, those with 5 or more children have the highest poverty rate, with 32 households (11.6%) falling below the poverty line. Among the single-parent households, those with 3 or 4 children have the highest poverty rate, with 93 household (71.0%) living below poverty.
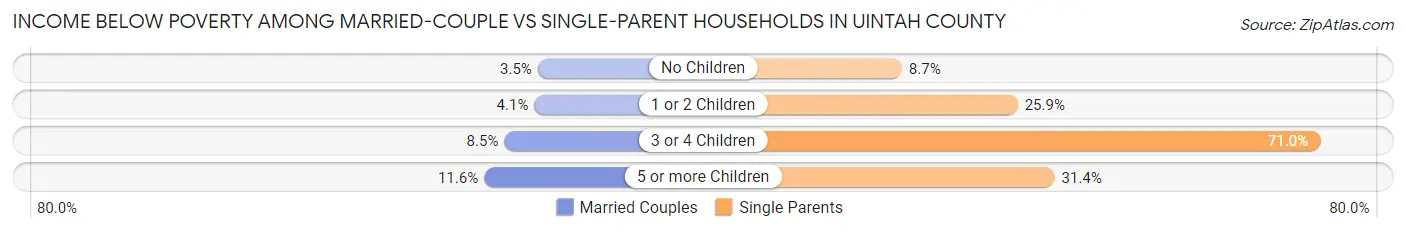
| Children | Married-Couple Families | Single-Parent Households |
| No Children | 103 (3.5%) | 50 (8.7%) |
| 1 or 2 Children | 100 (4.1%) | 208 (25.9%) |
| 3 or 4 Children | 101 (8.5%) | 93 (71.0%) |
| 5 or more Children | 32 (11.6%) | 11 (31.4%) |
| Total | 336 (4.9%) | 362 (23.4%) |
Race in Uintah County
The most populous races in Uintah County are White / Caucasian (29,844 | 83.0%), Hispanic or Latino (3,147 | 8.7%), and Two or more Races (2,802 | 7.8%).
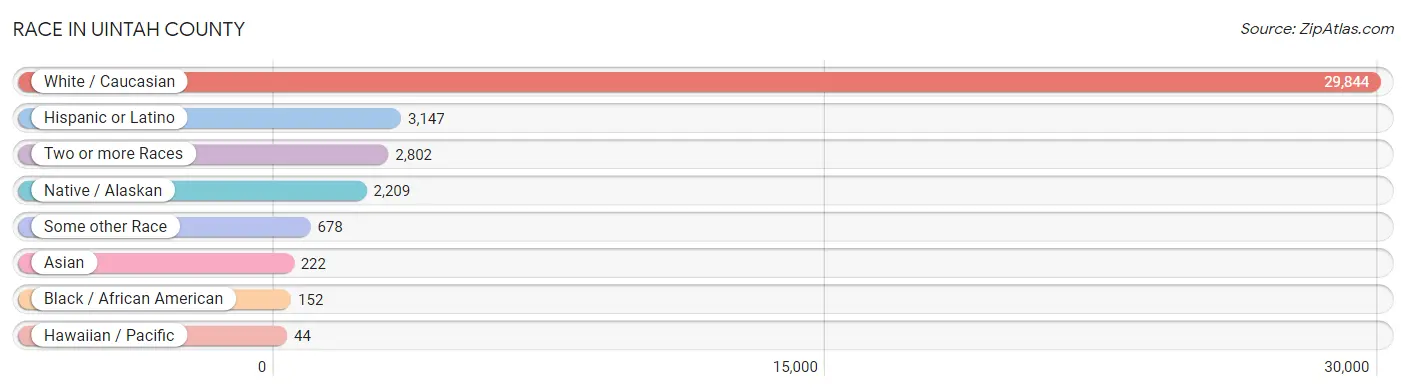
| Race | # Population | % Population |
| Asian | 222 | 0.6% |
| Black / African American | 152 | 0.4% |
| Hawaiian / Pacific | 44 | 0.1% |
| Hispanic or Latino | 3,147 | 8.7% |
| Native / Alaskan | 2,209 | 6.1% |
| White / Caucasian | 29,844 | 83.0% |
| Two or more Races | 2,802 | 7.8% |
| Some other Race | 678 | 1.9% |
| Total | 35,951 | 100.0% |
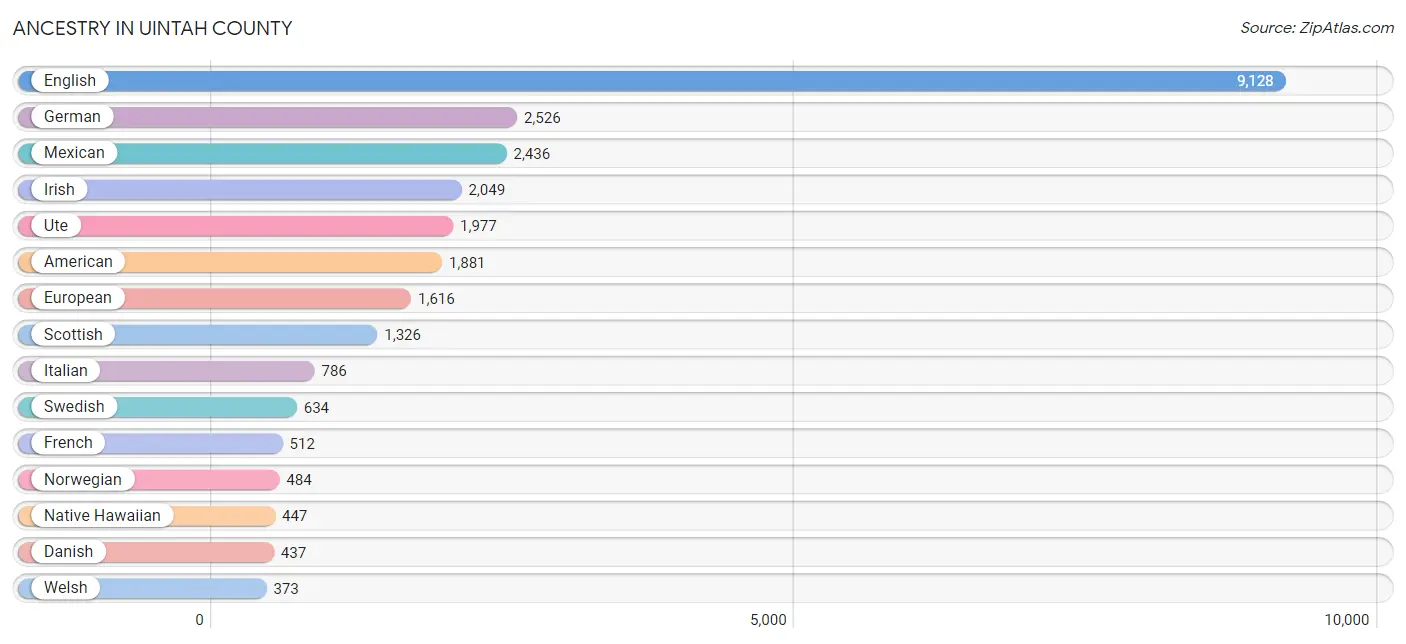
Ancestry in Uintah County
The most populous ancestries reported in Uintah County are English (9,128 | 25.4%), German (2,526 | 7.0%), Mexican (2,436 | 6.8%), Irish (2,049 | 5.7%), and Ute (1,977 | 5.5%), together accounting for 50.4% of all Uintah County residents.
| Ancestry | # Population | % Population |
| African | 8 | 0.0% |
| Alaska Native | 42 | 0.1% |
| Alaskan Athabascan | 34 | 0.1% |
| American | 1,881 | 5.2% |
| Apache | 96 | 0.3% |
| Armenian | 49 | 0.1% |
| Basque | 11 | 0.0% |
| Belgian | 2 | 0.0% |
| Bhutanese | 41 | 0.1% |
| Blackfeet | 26 | 0.1% |
| British | 160 | 0.4% |
| Burmese | 141 | 0.4% |
| Canadian | 149 | 0.4% |
| Central American | 73 | 0.2% |
| Cherokee | 113 | 0.3% |
| Colombian | 152 | 0.4% |
| Czech | 78 | 0.2% |
| Czechoslovakian | 4 | 0.0% |
| Danish | 437 | 1.2% |
| Dutch | 342 | 0.9% |
| Eastern European | 76 | 0.2% |
| English | 9,128 | 25.4% |
| European | 1,616 | 4.5% |
| Finnish | 42 | 0.1% |
| French | 512 | 1.4% |
| French Canadian | 11 | 0.0% |
| German | 2,526 | 7.0% |
| Greek | 23 | 0.1% |
| Guamanian / Chamorro | 25 | 0.1% |
| Guatemalan | 25 | 0.1% |
| Indian (Asian) | 31 | 0.1% |
| Irish | 2,049 | 5.7% |
| Italian | 786 | 2.2% |
| Korean | 86 | 0.2% |
| Lithuanian | 16 | 0.0% |
| Mexican | 2,436 | 6.8% |
| Mexican American Indian | 16 | 0.0% |
| Native Hawaiian | 447 | 1.2% |
| Navajo | 35 | 0.1% |
| Nicaraguan | 17 | 0.1% |
| Northern European | 24 | 0.1% |
| Norwegian | 484 | 1.3% |
| Paiute | 30 | 0.1% |
| Peruvian | 17 | 0.1% |
| Polish | 187 | 0.5% |
| Portuguese | 29 | 0.1% |
| Potawatomi | 8 | 0.0% |
| Puerto Rican | 21 | 0.1% |
| Russian | 54 | 0.2% |
| Salvadoran | 31 | 0.1% |
| Samoan | 31 | 0.1% |
| Scandinavian | 163 | 0.4% |
| Scotch-Irish | 204 | 0.6% |
| Scottish | 1,326 | 3.7% |
| Shoshone | 71 | 0.2% |
| Sioux | 68 | 0.2% |
| Slovak | 4 | 0.0% |
| South American | 169 | 0.5% |
| Spaniard | 202 | 0.6% |
| Spanish | 156 | 0.4% |
| Subsaharan African | 8 | 0.0% |
| Swedish | 634 | 1.8% |
| Swiss | 200 | 0.6% |
| Thai | 158 | 0.4% |
| Tongan | 43 | 0.1% |
| Turkish | 125 | 0.4% |
| Ukrainian | 4 | 0.0% |
| Ute | 1,977 | 5.5% |
| Welsh | 373 | 1.0% |
| Yaqui | 80 | 0.2% | View All 70 Rows |
Immigrants in Uintah County
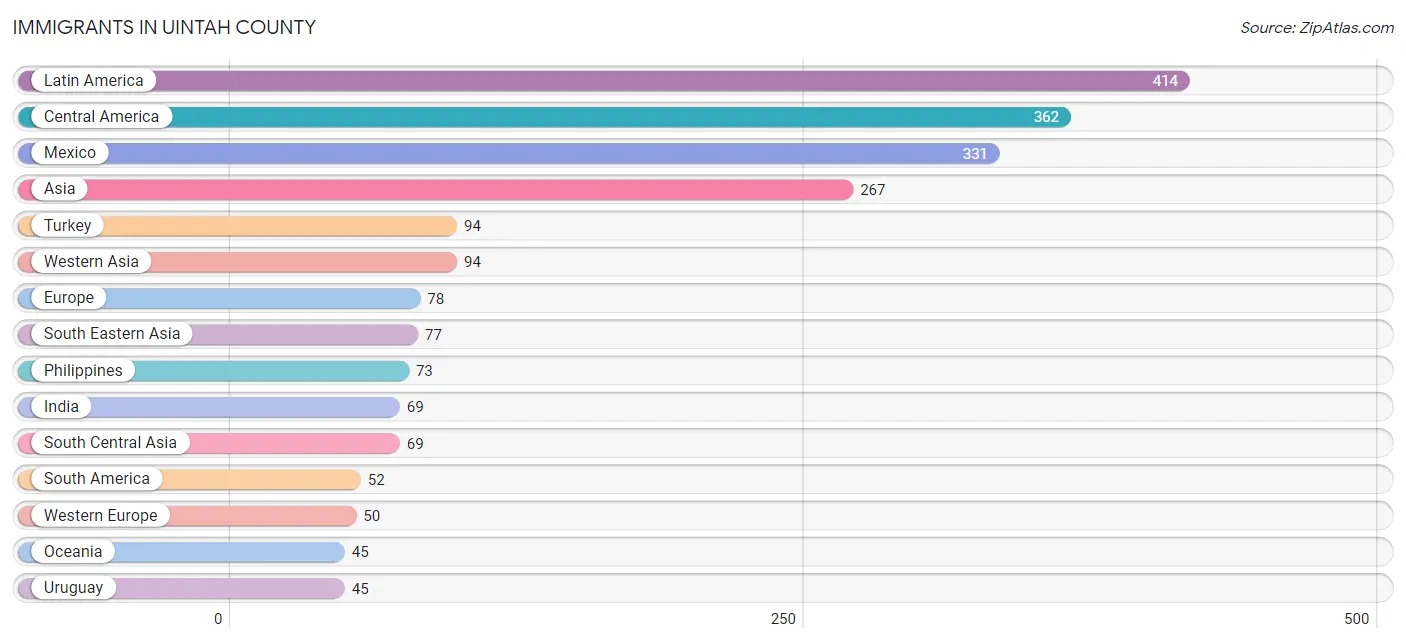
The most numerous immigrant groups reported in Uintah County came from Latin America (414 | 1.1%), Central America (362 | 1.0%), Mexico (331 | 0.9%), Asia (267 | 0.7%), and Turkey (94 | 0.3%), together accounting for 4.1% of all Uintah County residents.
| Immigration Origin | # Population | % Population |
| Asia | 267 | 0.7% |
| Central America | 362 | 1.0% |
| China | 9 | 0.0% |
| Eastern Asia | 27 | 0.1% |
| Eastern Europe | 4 | 0.0% |
| El Salvador | 31 | 0.1% |
| Europe | 78 | 0.2% |
| Germany | 18 | 0.1% |
| India | 69 | 0.2% |
| Japan | 2 | 0.0% |
| Korea | 16 | 0.0% |
| Latin America | 414 | 1.1% |
| Mexico | 331 | 0.9% |
| Netherlands | 32 | 0.1% |
| Northern Europe | 16 | 0.0% |
| Oceania | 45 | 0.1% |
| Peru | 7 | 0.0% |
| Philippines | 73 | 0.2% |
| Portugal | 8 | 0.0% |
| Scotland | 16 | 0.0% |
| South America | 52 | 0.1% |
| South Central Asia | 69 | 0.2% |
| South Eastern Asia | 77 | 0.2% |
| Southern Europe | 8 | 0.0% |
| Turkey | 94 | 0.3% |
| Ukraine | 4 | 0.0% |
| Uruguay | 45 | 0.1% |
| Vietnam | 4 | 0.0% |
| Western Asia | 94 | 0.3% |
| Western Europe | 50 | 0.1% | View All 30 Rows |
Sex and Age in Uintah County
Sex and Age in Uintah County
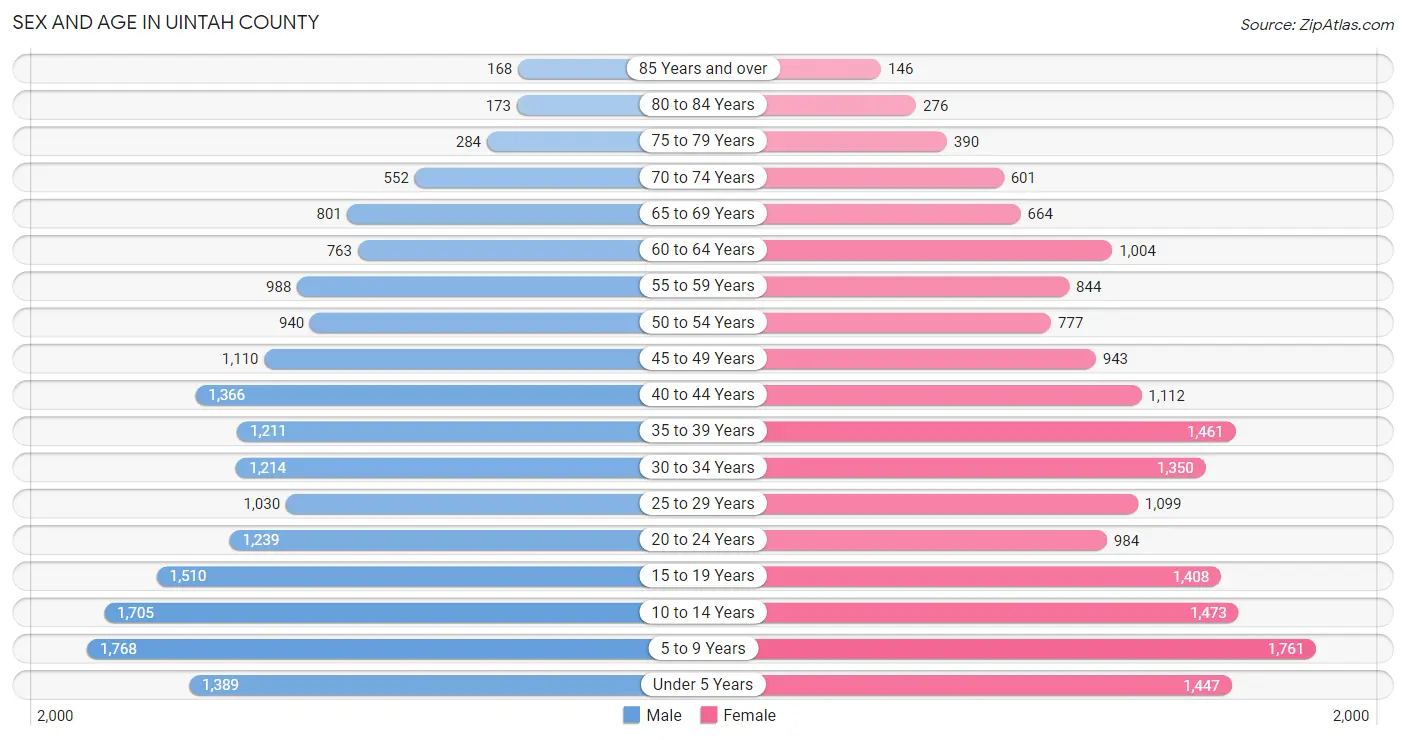
The most populous age groups in Uintah County are 5 to 9 Years (1,768 | 9.7%) for men and 5 to 9 Years (1,761 | 9.9%) for women.
| Age Bracket | Male | Female |
| Under 5 Years | 1,389 (7.6%) | 1,447 (8.2%) |
| 5 to 9 Years | 1,768 (9.7%) | 1,761 (9.9%) |
| 10 to 14 Years | 1,705 (9.4%) | 1,473 (8.3%) |
| 15 to 19 Years | 1,510 (8.3%) | 1,408 (7.9%) |
| 20 to 24 Years | 1,239 (6.8%) | 984 (5.6%) |
| 25 to 29 Years | 1,030 (5.7%) | 1,099 (6.2%) |
| 30 to 34 Years | 1,214 (6.7%) | 1,350 (7.6%) |
| 35 to 39 Years | 1,211 (6.7%) | 1,461 (8.2%) |
| 40 to 44 Years | 1,366 (7.5%) | 1,112 (6.3%) |
| 45 to 49 Years | 1,110 (6.1%) | 943 (5.3%) |
| 50 to 54 Years | 940 (5.2%) | 777 (4.4%) |
| 55 to 59 Years | 988 (5.4%) | 844 (4.8%) |
| 60 to 64 Years | 763 (4.2%) | 1,004 (5.7%) |
| 65 to 69 Years | 801 (4.4%) | 664 (3.7%) |
| 70 to 74 Years | 552 (3.0%) | 601 (3.4%) |
| 75 to 79 Years | 284 (1.6%) | 390 (2.2%) |
| 80 to 84 Years | 173 (0.9%) | 276 (1.6%) |
| 85 Years and over | 168 (0.9%) | 146 (0.8%) |
| Total | 18,211 (100.0%) | 17,740 (100.0%) |
Families and Households in Uintah County
Median Family Size in Uintah County
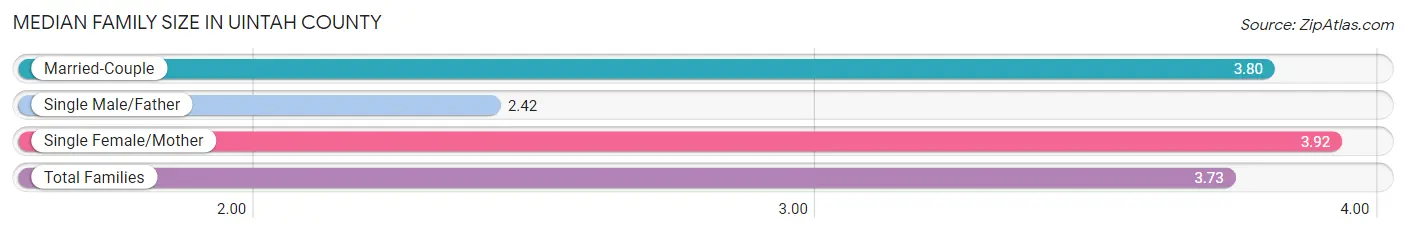
The median family size in Uintah County is 3.73 persons per family, with single female/mother families (1,011 | 12.1%) accounting for the largest median family size of 3.92 persons per family. On the other hand, single male/father families (533 | 6.4%) represent the smallest median family size with 2.42 persons per family.
| Family Type | # Families | Family Size |
| Married-Couple | 6,828 (81.6%) | 3.80 |
| Single Male/Father | 533 (6.4%) | 2.42 |
| Single Female/Mother | 1,011 (12.1%) | 3.92 |
| Total Families | 8,372 (100.0%) | 3.73 |
Median Household Size in Uintah County
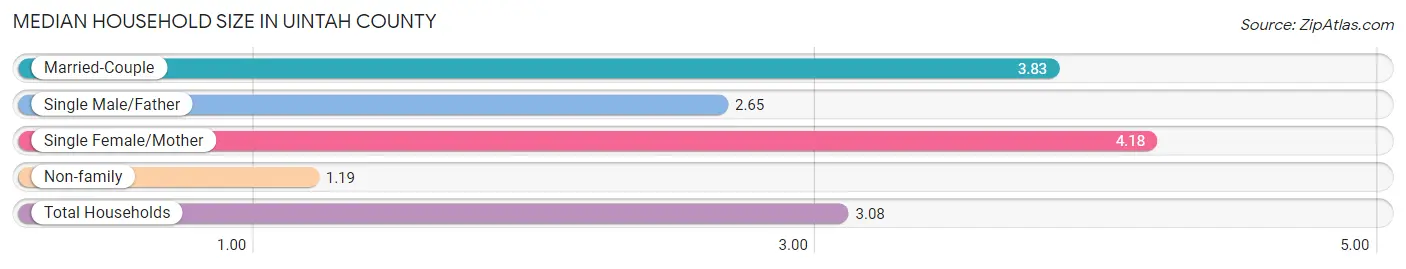
The median household size in Uintah County is 3.08 persons per household, with single female/mother households (1,011 | 8.8%) accounting for the largest median household size of 4.18 persons per household. non-family households (3,175 | 27.5%) represent the smallest median household size with 1.19 persons per household.
| Household Type | # Households | Household Size |
| Married-Couple | 6,828 (59.1%) | 3.83 |
| Single Male/Father | 533 (4.6%) | 2.65 |
| Single Female/Mother | 1,011 (8.8%) | 4.18 |
| Non-family | 3,175 (27.5%) | 1.19 |
| Total Households | 11,547 (100.0%) | 3.08 |
Household Size by Marriage Status in Uintah County
Out of a total of 11,547 households in Uintah County, 8,372 (72.5%) are family households, while 3,175 (27.5%) are nonfamily households. The most numerous type of family households are 2-person households, comprising 3,053, and the most common type of nonfamily households are 1-person households, comprising 2,757.
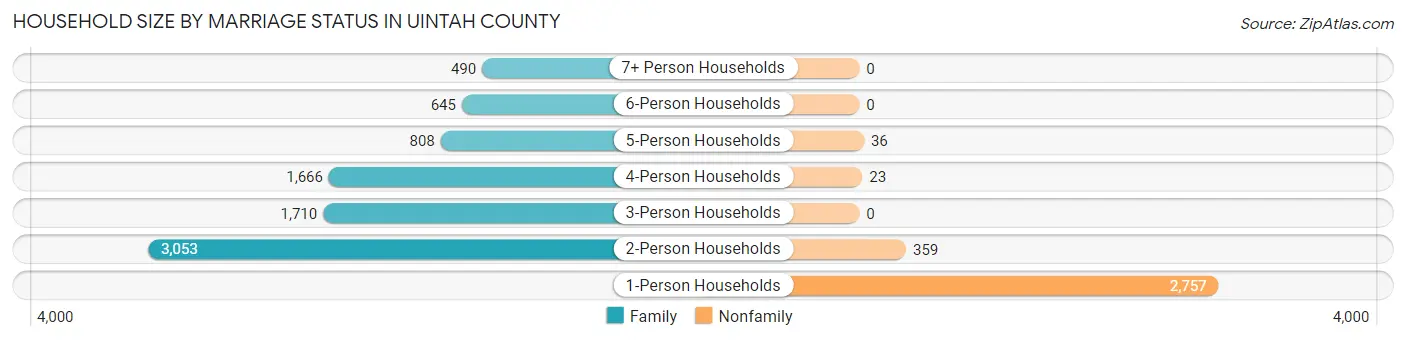
| Household Size | Family Households | Nonfamily Households |
| 1-Person Households | - | 2,757 (23.9%) |
| 2-Person Households | 3,053 (26.4%) | 359 (3.1%) |
| 3-Person Households | 1,710 (14.8%) | 0 (0.0%) |
| 4-Person Households | 1,666 (14.4%) | 23 (0.2%) |
| 5-Person Households | 808 (7.0%) | 36 (0.3%) |
| 6-Person Households | 645 (5.6%) | 0 (0.0%) |
| 7+ Person Households | 490 (4.2%) | 0 (0.0%) |
| Total | 8,372 (72.5%) | 3,175 (27.5%) |
Female Fertility in Uintah County
Fertility by Age in Uintah County
Average fertility rate in Uintah County is 86.0 births per 1,000 women. Women in the age bracket of 20 to 34 years have the highest fertility rate with 183.0 births per 1,000 women. Women in the age bracket of 20 to 34 years acount for 85.5% of all women with births.
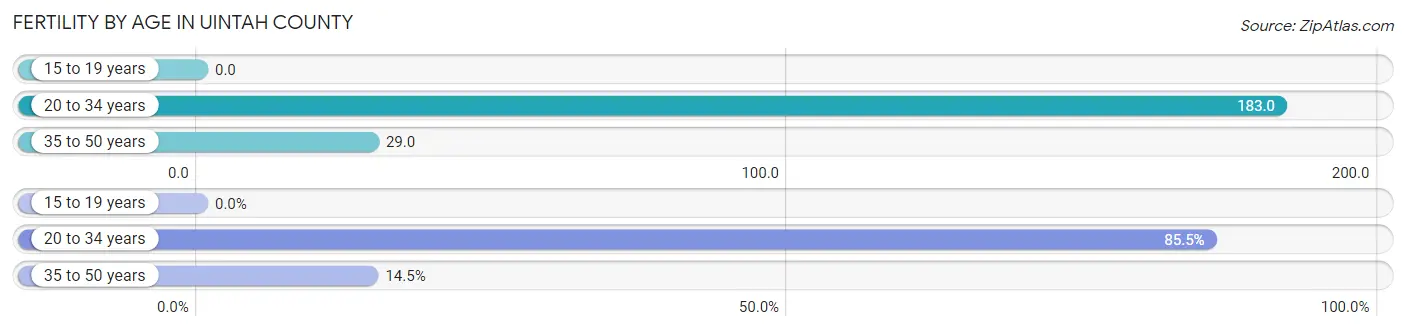
| Age Bracket | Women with Births | Births / 1,000 Women |
| 15 to 19 years | 0 (0.0%) | 0.0 |
| 20 to 34 years | 627 (85.5%) | 183.0 |
| 35 to 50 years | 106 (14.5%) | 29.0 |
| Total | 733 (100.0%) | 86.0 |
Fertility by Age by Marriage Status in Uintah County
90.9% of women with births (733) in Uintah County are married. The highest percentage of unmarried women with births falls into 35 to 50 years age bracket with 10.4% of them unmarried at the time of birth, while the lowest percentage of unmarried women with births belong to 20 to 34 years age bracket with 8.9% of them unmarried.
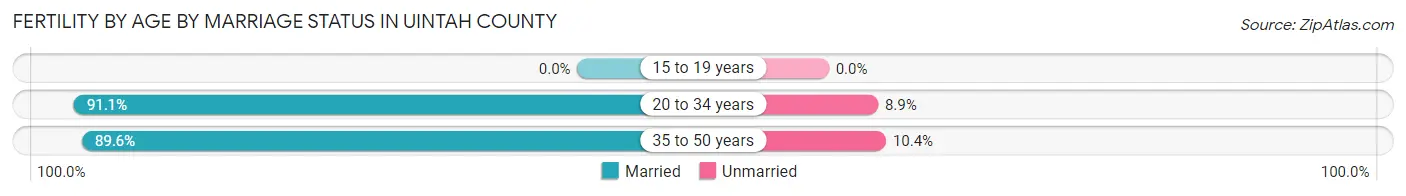
| Age Bracket | Married | Unmarried |
| 15 to 19 years | 0 (0.0%) | 0 (0.0%) |
| 20 to 34 years | 571 (91.1%) | 56 (8.9%) |
| 35 to 50 years | 95 (89.6%) | 11 (10.4%) |
| Total | 666 (90.9%) | 67 (9.1%) |
Fertility by Education in Uintah County
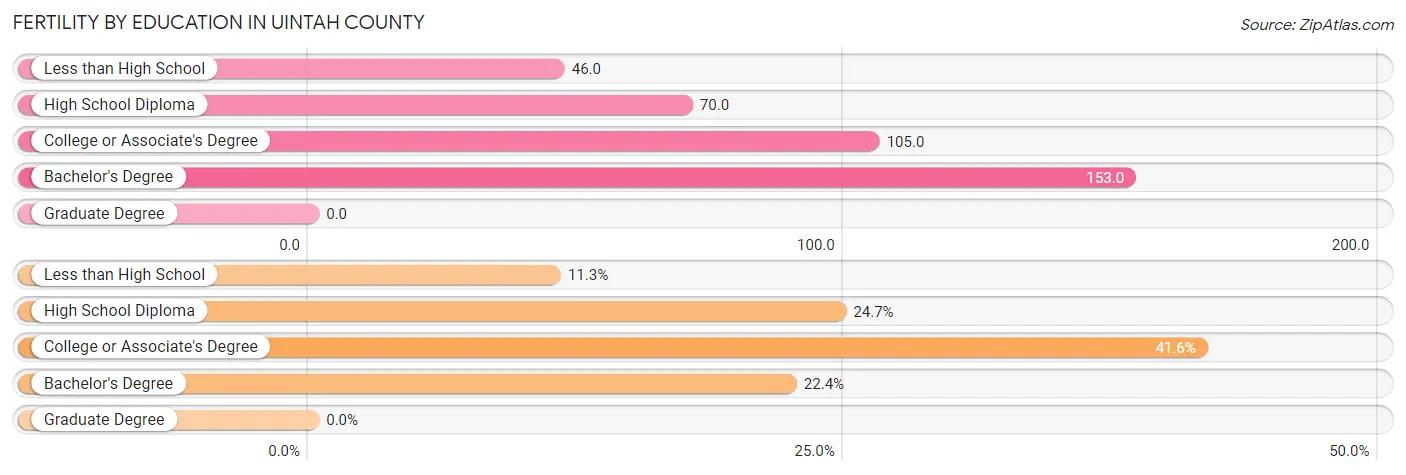
| Educational Attainment | Women with Births | Births / 1,000 Women |
| Less than High School | 83 (11.3%) | 46.0 |
| High School Diploma | 181 (24.7%) | 70.0 |
| College or Associate's Degree | 305 (41.6%) | 105.0 |
| Bachelor's Degree | 164 (22.4%) | 153.0 |
| Graduate Degree | 0 (0.0%) | 0.0 |
| Total | 733 (100.0%) | 86.0 |
Fertility by Education by Marriage Status in Uintah County
9.1% of women with births in Uintah County are unmarried. Women with the educational attainment of less than high school are most likely to be married with 100.0% of them married at childbirth, while women with the educational attainment of high school diploma are least likely to be married with 28.7% of them unmarried at childbirth.
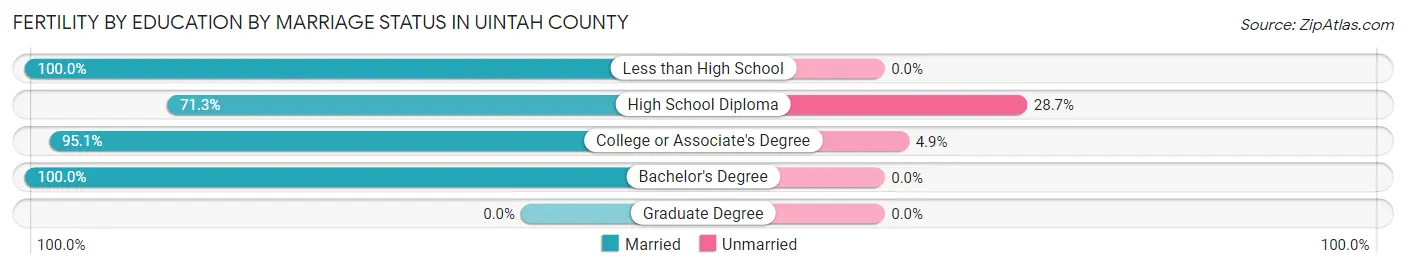
| Educational Attainment | Married | Unmarried |
| Less than High School | 83 (100.0%) | 0 (0.0%) |
| High School Diploma | 129 (71.3%) | 52 (28.7%) |
| College or Associate's Degree | 290 (95.1%) | 15 (4.9%) |
| Bachelor's Degree | 164 (100.0%) | 0 (0.0%) |
| Graduate Degree | 0 (0.0%) | 0 (0.0%) |
| Total | 666 (90.9%) | 67 (9.1%) |
Employment Characteristics in Uintah County
Employment by Class of Employer in Uintah County
Among the 14,316 employed individuals in Uintah County, private company employees (9,626 | 67.2%), local government employees (1,531 | 10.7%), and self-employed (incorporated) (861 | 6.0%) make up the most common classes of employment.
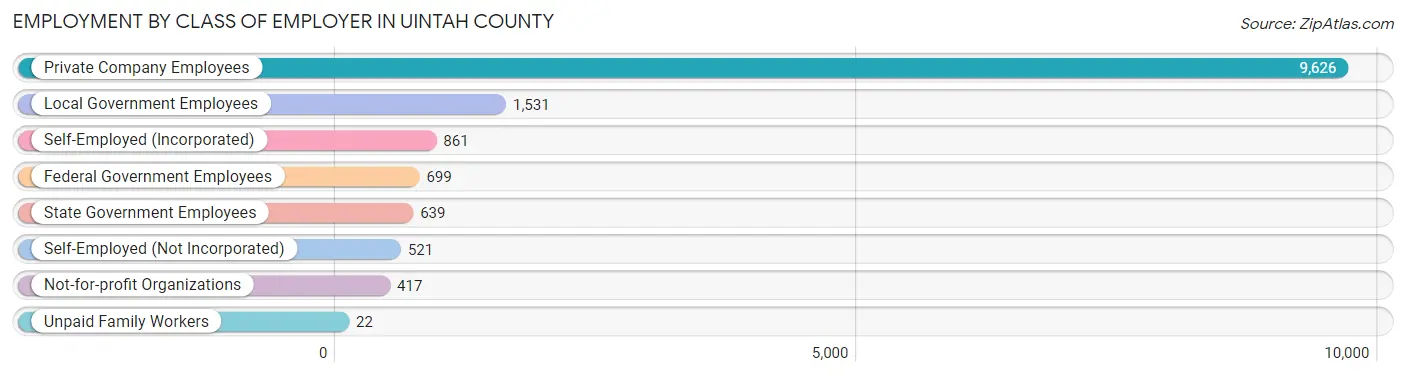
| Employer Class | # Employees | % Employees |
| Private Company Employees | 9,626 | 67.2% |
| Self-Employed (Incorporated) | 861 | 6.0% |
| Self-Employed (Not Incorporated) | 521 | 3.6% |
| Not-for-profit Organizations | 417 | 2.9% |
| Local Government Employees | 1,531 | 10.7% |
| State Government Employees | 639 | 4.5% |
| Federal Government Employees | 699 | 4.9% |
| Unpaid Family Workers | 22 | 0.2% |
| Total | 14,316 | 100.0% |
Employment Status by Age in Uintah County
According to the labor force statistics for Uintah County, out of the total population over 16 years of age (25,782), 60.4% or 15,572 individuals are in the labor force, with 6.3% or 981 of them unemployed. The age group with the highest labor force participation rate is 45 to 54 years, with 79.2% or 2,986 individuals in the labor force. Within the labor force, the 16 to 19 years age range has the highest percentage of unemployed individuals, with 17.2% or 220 of them being unemployed.
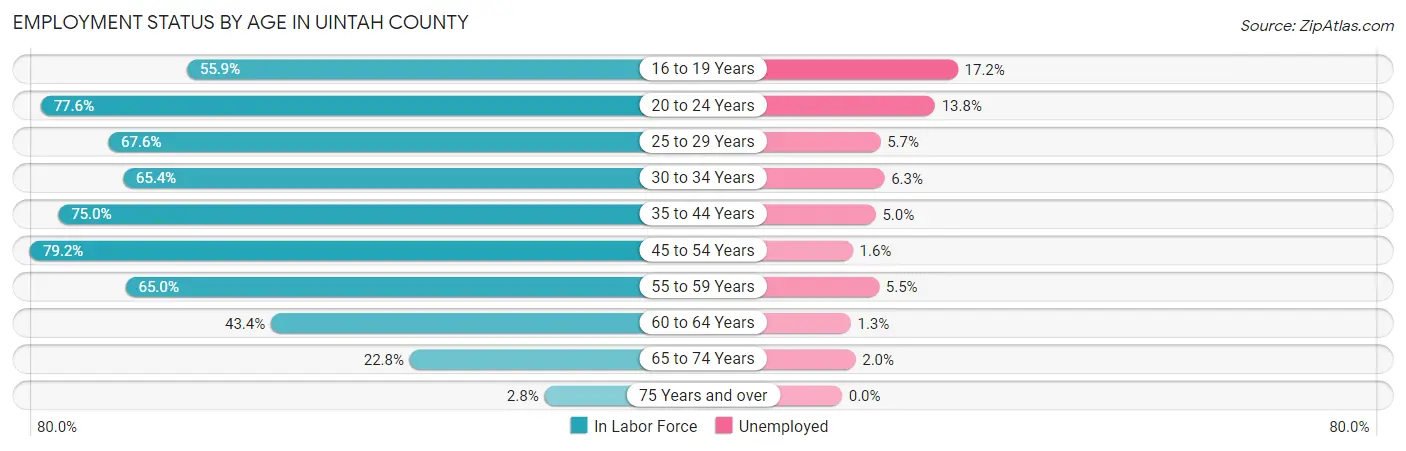
| Age Bracket | In Labor Force | Unemployed |
| 16 to 19 Years | 1,281 (55.9%) | 220 (17.2%) |
| 20 to 24 Years | 1,725 (77.6%) | 238 (13.8%) |
| 25 to 29 Years | 1,439 (67.6%) | 82 (5.7%) |
| 30 to 34 Years | 1,677 (65.4%) | 106 (6.3%) |
| 35 to 44 Years | 3,862 (75.0%) | 193 (5.0%) |
| 45 to 54 Years | 2,986 (79.2%) | 48 (1.6%) |
| 55 to 59 Years | 1,191 (65.0%) | 66 (5.5%) |
| 60 to 64 Years | 767 (43.4%) | 10 (1.3%) |
| 65 to 74 Years | 597 (22.8%) | 12 (2.0%) |
| 75 Years and over | 40 (2.8%) | 0 (0.0%) |
| Total | 15,572 (60.4%) | 981 (6.3%) |
Employment Status by Educational Attainment in Uintah County
According to labor force statistics for Uintah County, 69.3% of individuals (11,928) out of the total population between 25 and 64 years of age (17,212) are in the labor force, with 4.2% or 501 of them being unemployed. The group with the highest labor force participation rate are those with the educational attainment of bachelor's degree or higher, with 80.2% or 2,453 individuals in the labor force. Within the labor force, individuals with less than high school education have the highest percentage of unemployment, with 8.8% or 97 of them being unemployed.
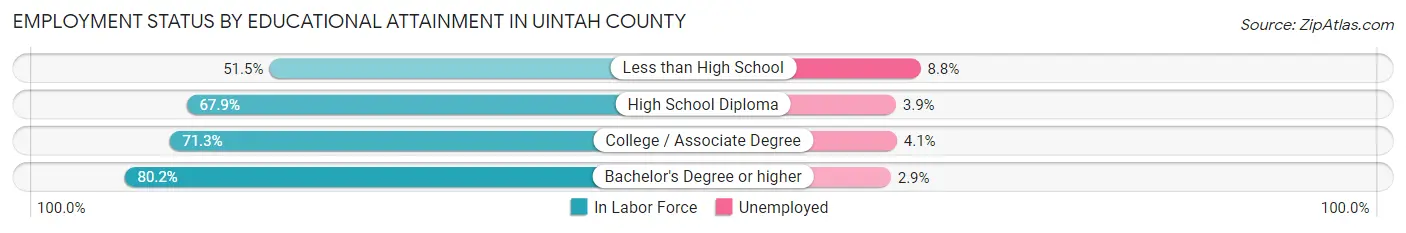
| Educational Attainment | In Labor Force | Unemployed |
| Less than High School | 1,102 (51.5%) | 188 (8.8%) |
| High School Diploma | 3,908 (67.9%) | 224 (3.9%) |
| College / Associate Degree | 4,463 (71.3%) | 257 (4.1%) |
| Bachelor's Degree or higher | 2,453 (80.2%) | 89 (2.9%) |
| Total | 11,928 (69.3%) | 723 (4.2%) |
Employment Occupations by Sex in Uintah County
Management, Business, Science and Arts Occupations
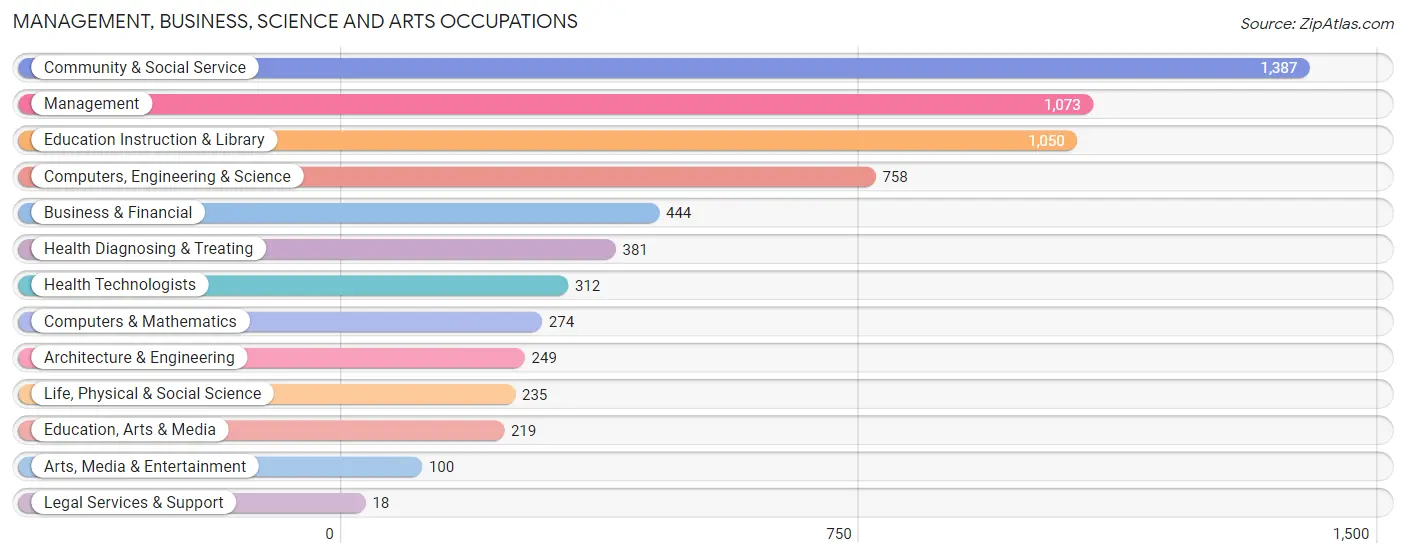
The most common Management, Business, Science and Arts occupations in Uintah County are Community & Social Service (1,387 | 9.5%), Management (1,073 | 7.3%), Education Instruction & Library (1,050 | 7.2%), Computers, Engineering & Science (758 | 5.2%), and Business & Financial (444 | 3.0%).
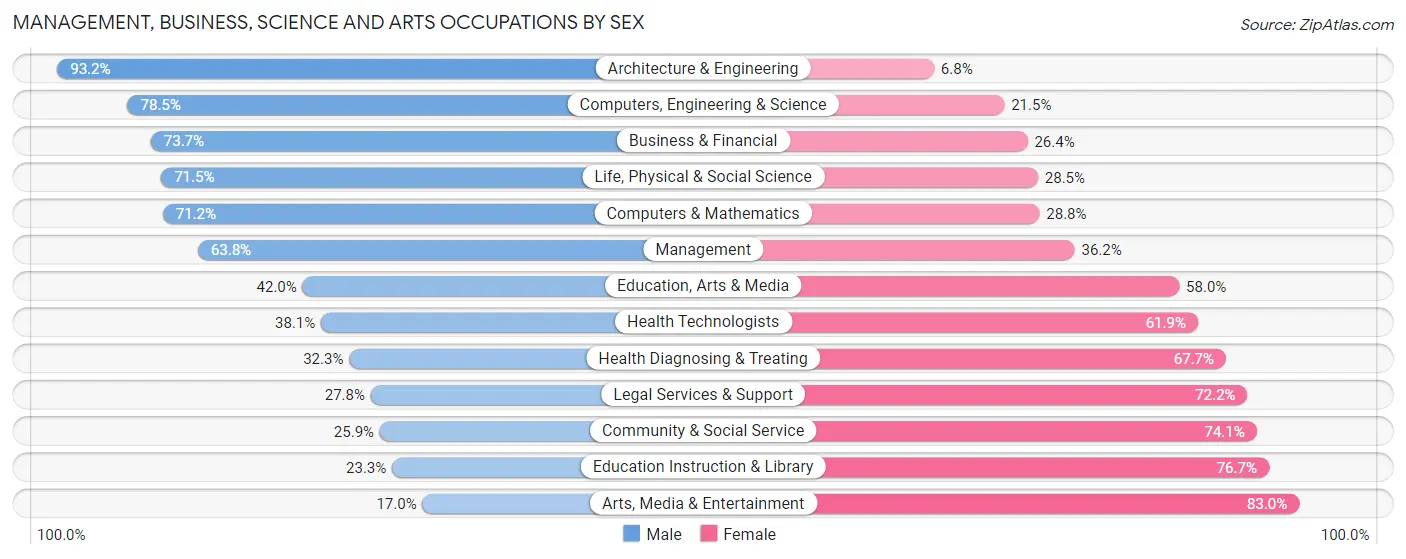
Management, Business, Science and Arts Occupations by Sex
Within the Management, Business, Science and Arts occupations in Uintah County, the most male-oriented occupations are Architecture & Engineering (93.2%), Computers, Engineering & Science (78.5%), and Business & Financial (73.7%), while the most female-oriented occupations are Arts, Media & Entertainment (83.0%), Education Instruction & Library (76.7%), and Community & Social Service (74.1%).
| Occupation | Male | Female |
| Management | 685 (63.8%) | 388 (36.2%) |
| Business & Financial | 327 (73.7%) | 117 (26.4%) |
| Computers, Engineering & Science | 595 (78.5%) | 163 (21.5%) |
| Computers & Mathematics | 195 (71.2%) | 79 (28.8%) |
| Architecture & Engineering | 232 (93.2%) | 17 (6.8%) |
| Life, Physical & Social Science | 168 (71.5%) | 67 (28.5%) |
| Community & Social Service | 359 (25.9%) | 1,028 (74.1%) |
| Education, Arts & Media | 92 (42.0%) | 127 (58.0%) |
| Legal Services & Support | 5 (27.8%) | 13 (72.2%) |
| Education Instruction & Library | 245 (23.3%) | 805 (76.7%) |
| Arts, Media & Entertainment | 17 (17.0%) | 83 (83.0%) |
| Health Diagnosing & Treating | 123 (32.3%) | 258 (67.7%) |
| Health Technologists | 119 (38.1%) | 193 (61.9%) |
| Total (Category) | 2,089 (51.7%) | 1,954 (48.3%) |
| Total (Overall) | 8,178 (56.0%) | 6,413 (44.0%) |
Services Occupations
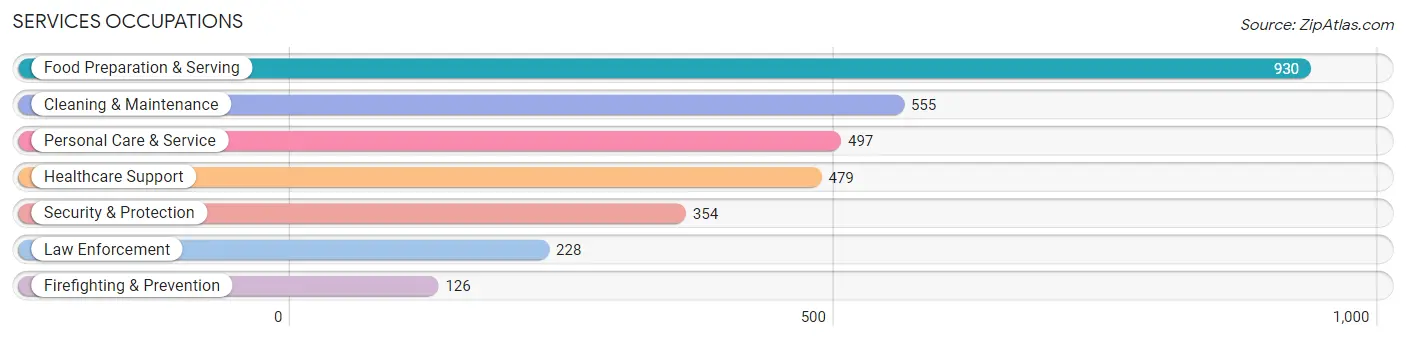
The most common Services occupations in Uintah County are Food Preparation & Serving (930 | 6.4%), Cleaning & Maintenance (555 | 3.8%), Personal Care & Service (497 | 3.4%), Healthcare Support (479 | 3.3%), and Security & Protection (354 | 2.4%).
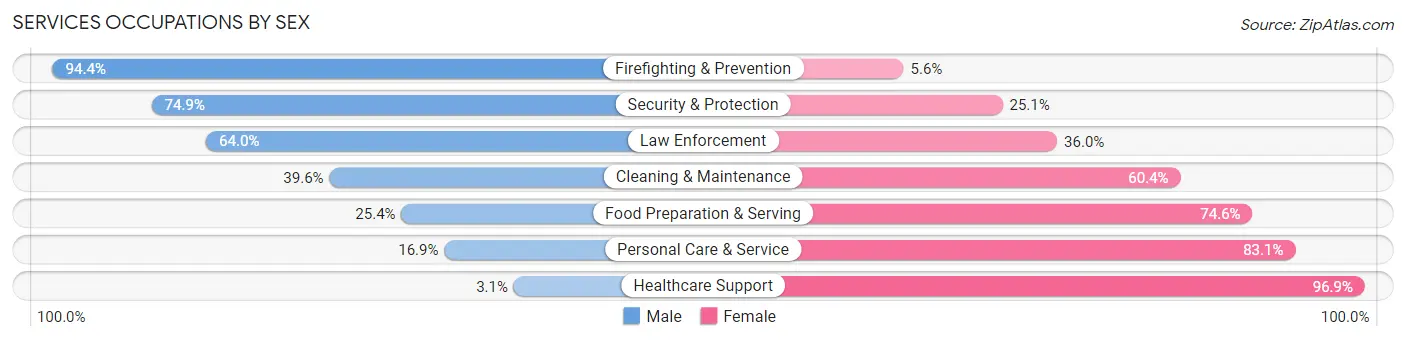
Services Occupations by Sex
Within the Services occupations in Uintah County, the most male-oriented occupations are Firefighting & Prevention (94.4%), Security & Protection (74.9%), and Law Enforcement (64.0%), while the most female-oriented occupations are Healthcare Support (96.9%), Personal Care & Service (83.1%), and Food Preparation & Serving (74.6%).
| Occupation | Male | Female |
| Healthcare Support | 15 (3.1%) | 464 (96.9%) |
| Security & Protection | 265 (74.9%) | 89 (25.1%) |
| Firefighting & Prevention | 119 (94.4%) | 7 (5.6%) |
| Law Enforcement | 146 (64.0%) | 82 (36.0%) |
| Food Preparation & Serving | 236 (25.4%) | 694 (74.6%) |
| Cleaning & Maintenance | 220 (39.6%) | 335 (60.4%) |
| Personal Care & Service | 84 (16.9%) | 413 (83.1%) |
| Total (Category) | 820 (29.1%) | 1,995 (70.9%) |
| Total (Overall) | 8,178 (56.0%) | 6,413 (44.0%) |
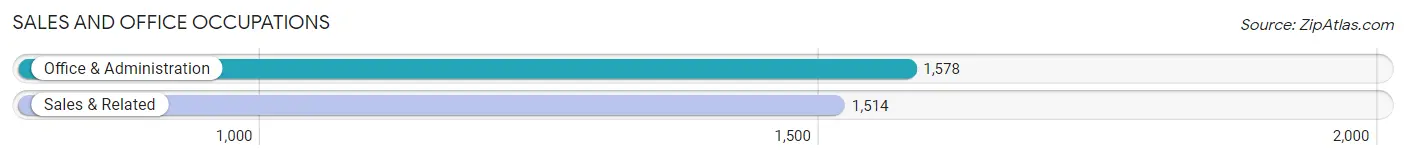
Sales and Office Occupations
The most common Sales and Office occupations in Uintah County are Office & Administration (1,578 | 10.8%), and Sales & Related (1,514 | 10.4%).
Sales and Office Occupations by Sex
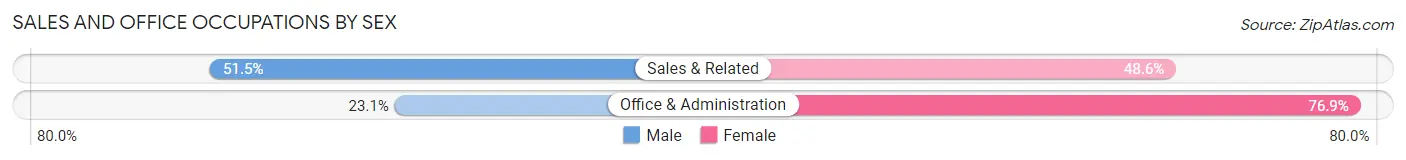
| Occupation | Male | Female |
| Sales & Related | 779 (51.4%) | 735 (48.5%) |
| Office & Administration | 364 (23.1%) | 1,214 (76.9%) |
| Total (Category) | 1,143 (37.0%) | 1,949 (63.0%) |
| Total (Overall) | 8,178 (56.0%) | 6,413 (44.0%) |
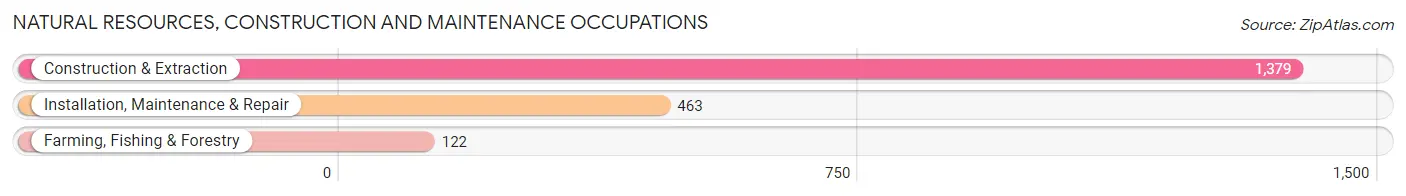
Natural Resources, Construction and Maintenance Occupations
The most common Natural Resources, Construction and Maintenance occupations in Uintah County are Construction & Extraction (1,379 | 9.5%), Installation, Maintenance & Repair (463 | 3.2%), and Farming, Fishing & Forestry (122 | 0.8%).
Natural Resources, Construction and Maintenance Occupations by Sex
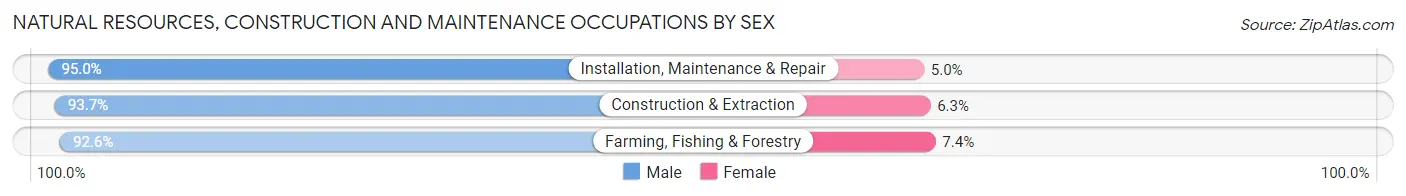
| Occupation | Male | Female |
| Farming, Fishing & Forestry | 113 (92.6%) | 9 (7.4%) |
| Construction & Extraction | 1,292 (93.7%) | 87 (6.3%) |
| Installation, Maintenance & Repair | 440 (95.0%) | 23 (5.0%) |
| Total (Category) | 1,845 (93.9%) | 119 (6.1%) |
| Total (Overall) | 8,178 (56.0%) | 6,413 (44.0%) |
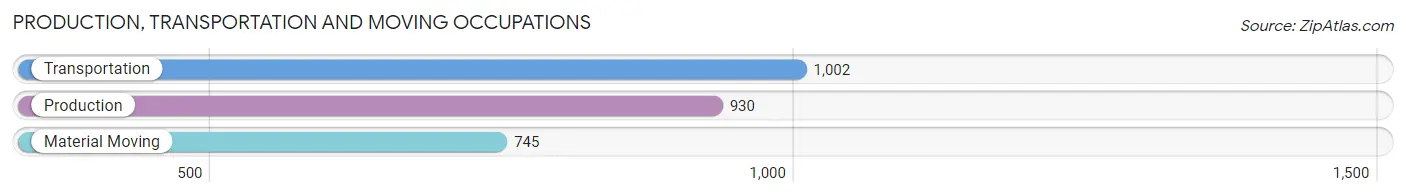
Production, Transportation and Moving Occupations
The most common Production, Transportation and Moving occupations in Uintah County are Transportation (1,002 | 6.9%), Production (930 | 6.4%), and Material Moving (745 | 5.1%).
Production, Transportation and Moving Occupations by Sex
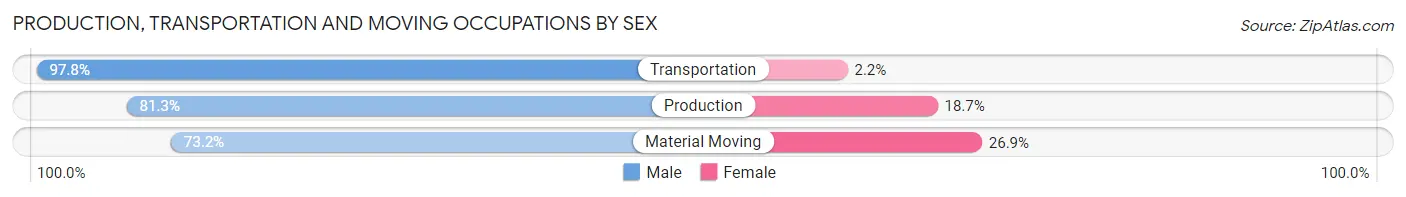
| Occupation | Male | Female |
| Production | 756 (81.3%) | 174 (18.7%) |
| Transportation | 980 (97.8%) | 22 (2.2%) |
| Material Moving | 545 (73.2%) | 200 (26.9%) |
| Total (Category) | 2,281 (85.2%) | 396 (14.8%) |
| Total (Overall) | 8,178 (56.0%) | 6,413 (44.0%) |
Employment Industries by Sex in Uintah County
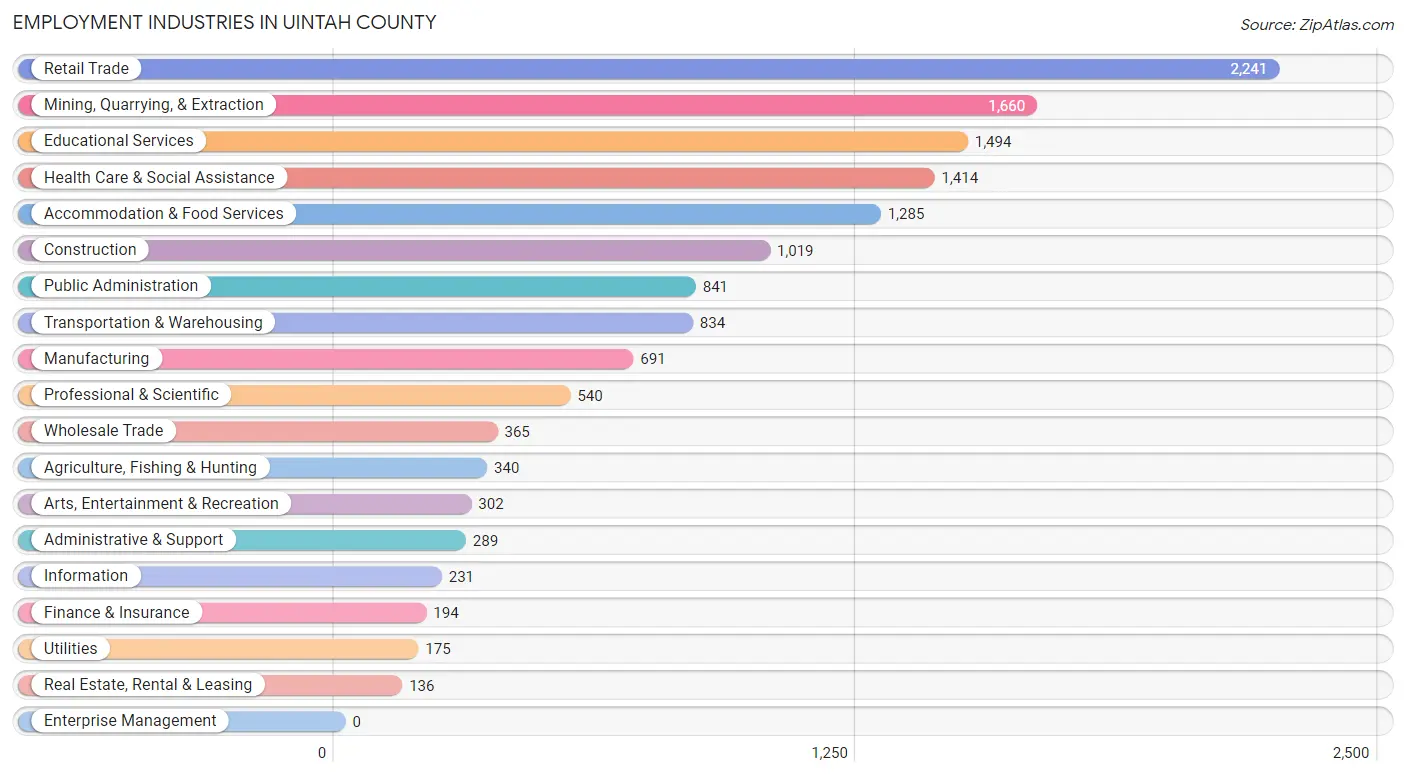
Employment Industries in Uintah County
The major employment industries in Uintah County include Retail Trade (2,241 | 15.4%), Mining, Quarrying, & Extraction (1,660 | 11.4%), Educational Services (1,494 | 10.2%), Health Care & Social Assistance (1,414 | 9.7%), and Accommodation & Food Services (1,285 | 8.8%).
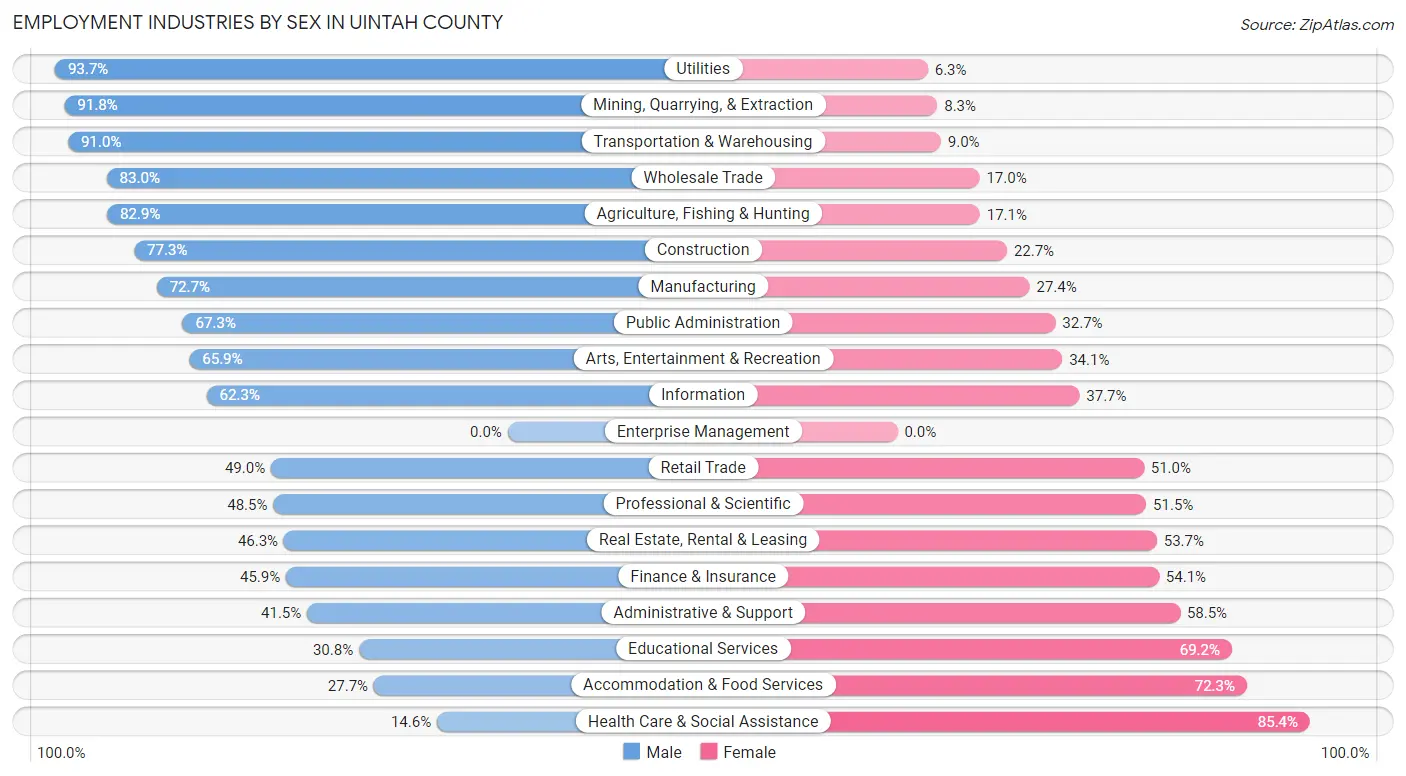
Employment Industries by Sex in Uintah County
The Uintah County industries that see more men than women are Utilities (93.7%), Mining, Quarrying, & Extraction (91.7%), and Transportation & Warehousing (91.0%), whereas the industries that tend to have a higher number of women are Health Care & Social Assistance (85.4%), Accommodation & Food Services (72.3%), and Educational Services (69.2%).
| Industry | Male | Female |
| Agriculture, Fishing & Hunting | 282 (82.9%) | 58 (17.1%) |
| Mining, Quarrying, & Extraction | 1,523 (91.7%) | 137 (8.3%) |
| Construction | 788 (77.3%) | 231 (22.7%) |
| Manufacturing | 502 (72.7%) | 189 (27.4%) |
| Wholesale Trade | 303 (83.0%) | 62 (17.0%) |
| Retail Trade | 1,098 (49.0%) | 1,143 (51.0%) |
| Transportation & Warehousing | 759 (91.0%) | 75 (9.0%) |
| Utilities | 164 (93.7%) | 11 (6.3%) |
| Information | 144 (62.3%) | 87 (37.7%) |
| Finance & Insurance | 89 (45.9%) | 105 (54.1%) |
| Real Estate, Rental & Leasing | 63 (46.3%) | 73 (53.7%) |
| Professional & Scientific | 262 (48.5%) | 278 (51.5%) |
| Enterprise Management | 0 (0.0%) | 0 (0.0%) |
| Administrative & Support | 120 (41.5%) | 169 (58.5%) |
| Educational Services | 460 (30.8%) | 1,034 (69.2%) |
| Health Care & Social Assistance | 207 (14.6%) | 1,207 (85.4%) |
| Arts, Entertainment & Recreation | 199 (65.9%) | 103 (34.1%) |
| Accommodation & Food Services | 356 (27.7%) | 929 (72.3%) |
| Public Administration | 566 (67.3%) | 275 (32.7%) |
| Total | 8,178 (56.0%) | 6,413 (44.0%) |
Education in Uintah County
School Enrollment in Uintah County
The most common levels of schooling among the 10,217 students in Uintah County are elementary school (2,802 | 27.4%), high school (2,596 | 25.4%), and middle school (2,474 | 24.2%).
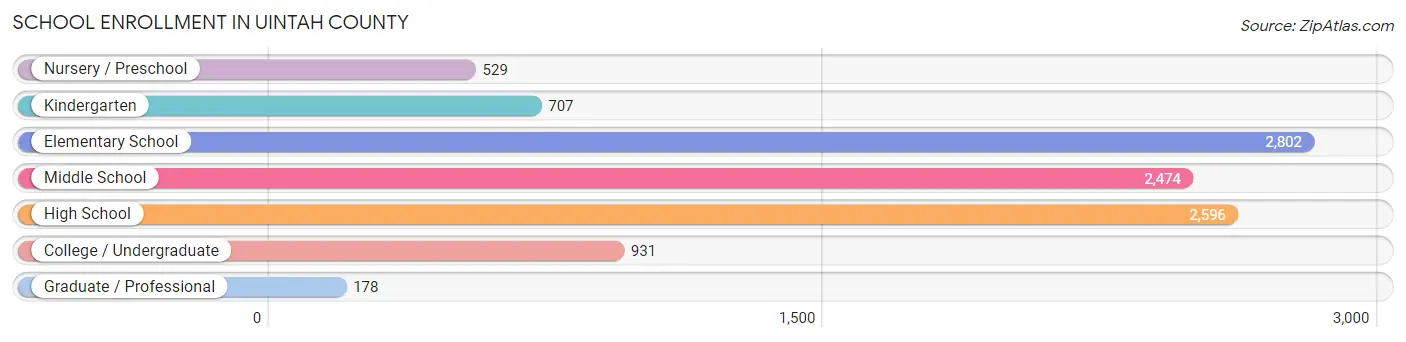
| School Level | # Students | % Students |
| Nursery / Preschool | 529 | 5.2% |
| Kindergarten | 707 | 6.9% |
| Elementary School | 2,802 | 27.4% |
| Middle School | 2,474 | 24.2% |
| High School | 2,596 | 25.4% |
| College / Undergraduate | 931 | 9.1% |
| Graduate / Professional | 178 | 1.7% |
| Total | 10,217 | 100.0% |
School Enrollment by Age by Funding Source in Uintah County
Out of a total of 10,217 students who are enrolled in schools in Uintah County, 1,573 (15.4%) attend a private institution, while the remaining 8,644 (84.6%) are enrolled in public schools. The age group of 35 years and over has the highest likelihood of being enrolled in private schools, with 185 (37.4% in the age bracket) enrolled. Conversely, the age group of 18 to 19 year olds has the lowest likelihood of being enrolled in a private school, with 513 (100.0% in the age bracket) attending a public institution.
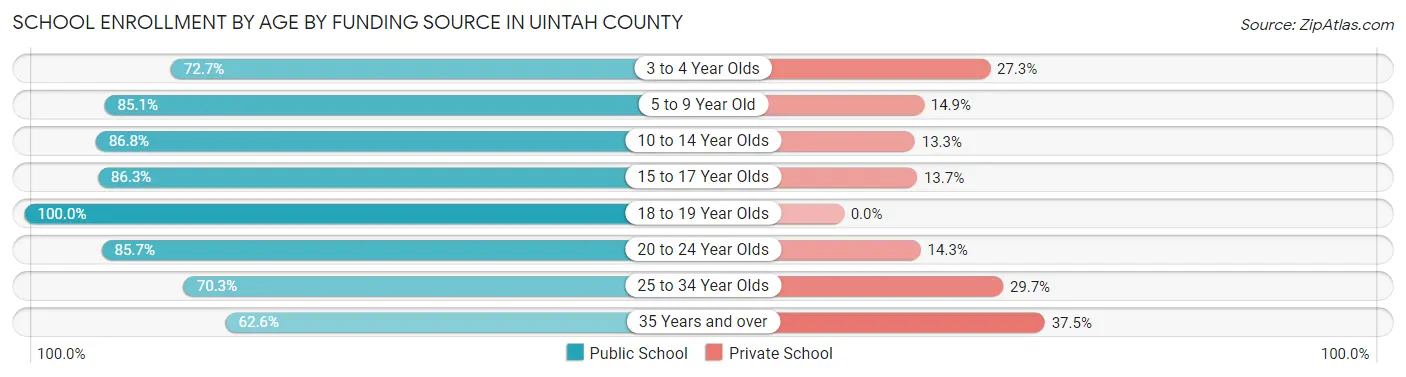
| Age Bracket | Public School | Private School |
| 3 to 4 Year Olds | 264 (72.7%) | 99 (27.3%) |
| 5 to 9 Year Old | 2,725 (85.1%) | 478 (14.9%) |
| 10 to 14 Year Olds | 2,723 (86.8%) | 416 (13.3%) |
| 15 to 17 Year Olds | 1,681 (86.3%) | 266 (13.7%) |
| 18 to 19 Year Olds | 513 (100.0%) | 0 (0.0%) |
| 20 to 24 Year Olds | 221 (85.7%) | 37 (14.3%) |
| 25 to 34 Year Olds | 211 (70.3%) | 89 (29.7%) |
| 35 Years and over | 309 (62.5%) | 185 (37.4%) |
| Total | 8,644 (84.6%) | 1,573 (15.4%) |
Educational Attainment by Field of Study in Uintah County
Education (753 | 18.7%), bio, nature & agricultural (538 | 13.4%), business (473 | 11.7%), science & technology (453 | 11.2%), and arts & humanities (279 | 6.9%) are the most common fields of study among 4,030 individuals in Uintah County who have obtained a bachelor's degree or higher.
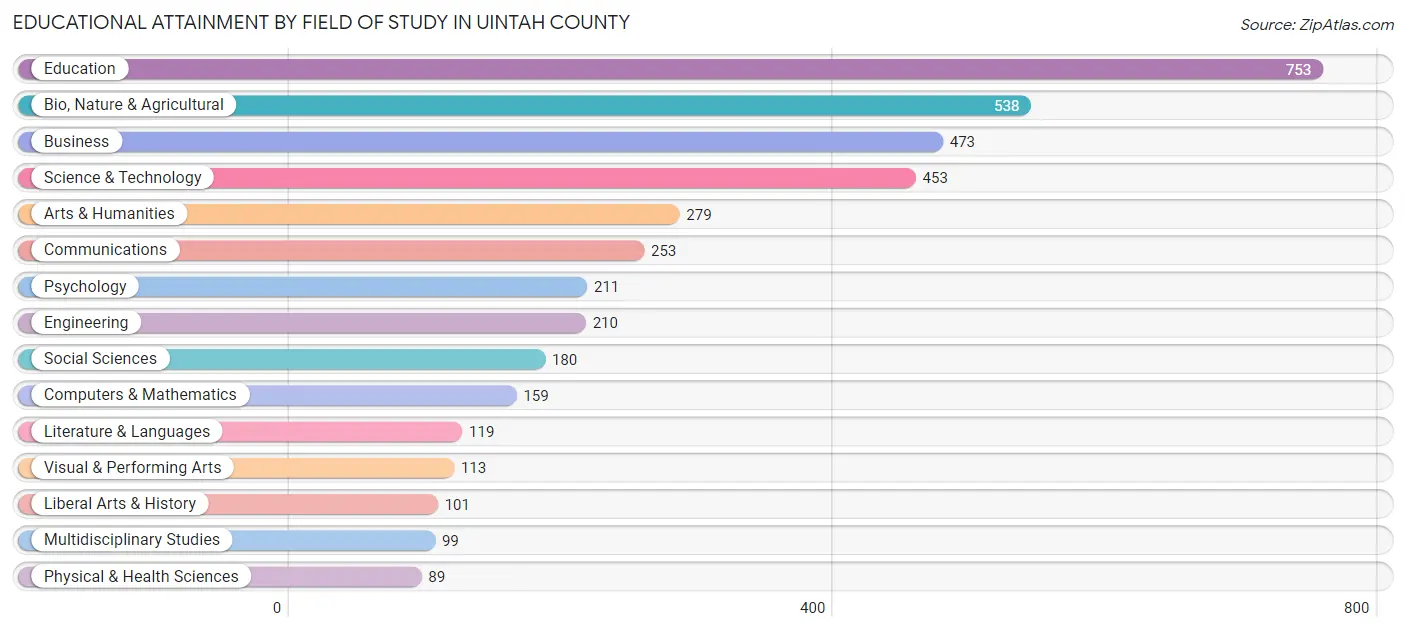
| Field of Study | # Graduates | % Graduates |
| Computers & Mathematics | 159 | 4.0% |
| Bio, Nature & Agricultural | 538 | 13.4% |
| Physical & Health Sciences | 89 | 2.2% |
| Psychology | 211 | 5.2% |
| Social Sciences | 180 | 4.5% |
| Engineering | 210 | 5.2% |
| Multidisciplinary Studies | 99 | 2.5% |
| Science & Technology | 453 | 11.2% |
| Business | 473 | 11.7% |
| Education | 753 | 18.7% |
| Literature & Languages | 119 | 2.9% |
| Liberal Arts & History | 101 | 2.5% |
| Visual & Performing Arts | 113 | 2.8% |
| Communications | 253 | 6.3% |
| Arts & Humanities | 279 | 6.9% |
| Total | 4,030 | 100.0% |
Transportation & Commute in Uintah County
Vehicle Availability by Sex in Uintah County
The most prevalent vehicle ownership categories in Uintah County are males with 2 vehicles (2,655, accounting for 33.2%) and females with 2 vehicles (2,013, making up 42.3%).
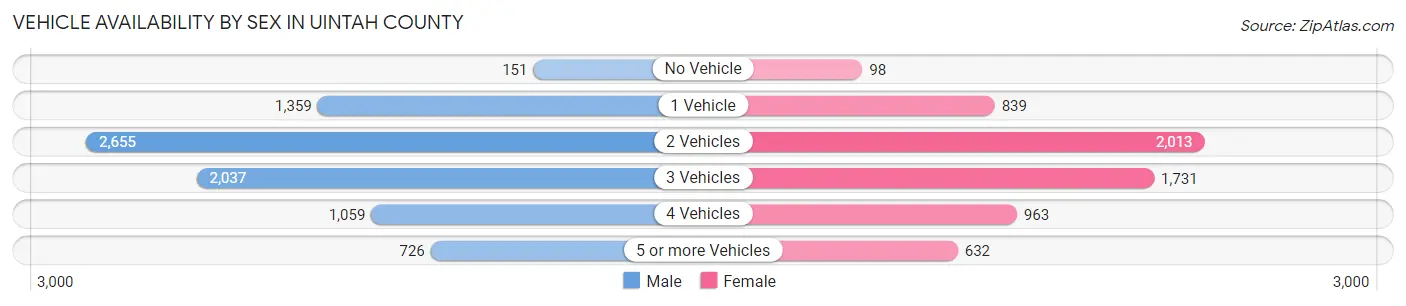
| Vehicles Available | Male | Female |
| No Vehicle | 151 (1.9%) | 98 (1.6%) |
| 1 Vehicle | 1,359 (17.0%) | 839 (13.4%) |
| 2 Vehicles | 2,655 (33.2%) | 2,013 (32.1%) |
| 3 Vehicles | 2,037 (25.5%) | 1,731 (27.6%) |
| 4 Vehicles | 1,059 (13.3%) | 963 (15.3%) |
| 5 or more Vehicles | 726 (9.1%) | 632 (10.1%) |
| Total | 7,987 (100.0%) | 6,276 (100.0%) |
Commute Time in Uintah County
The most frequently occuring commute durations in Uintah County are 5 to 9 minutes (4,168 commuters, 30.9%), 10 to 14 minutes (3,130 commuters, 23.2%), and 15 to 19 minutes (1,646 commuters, 12.2%).
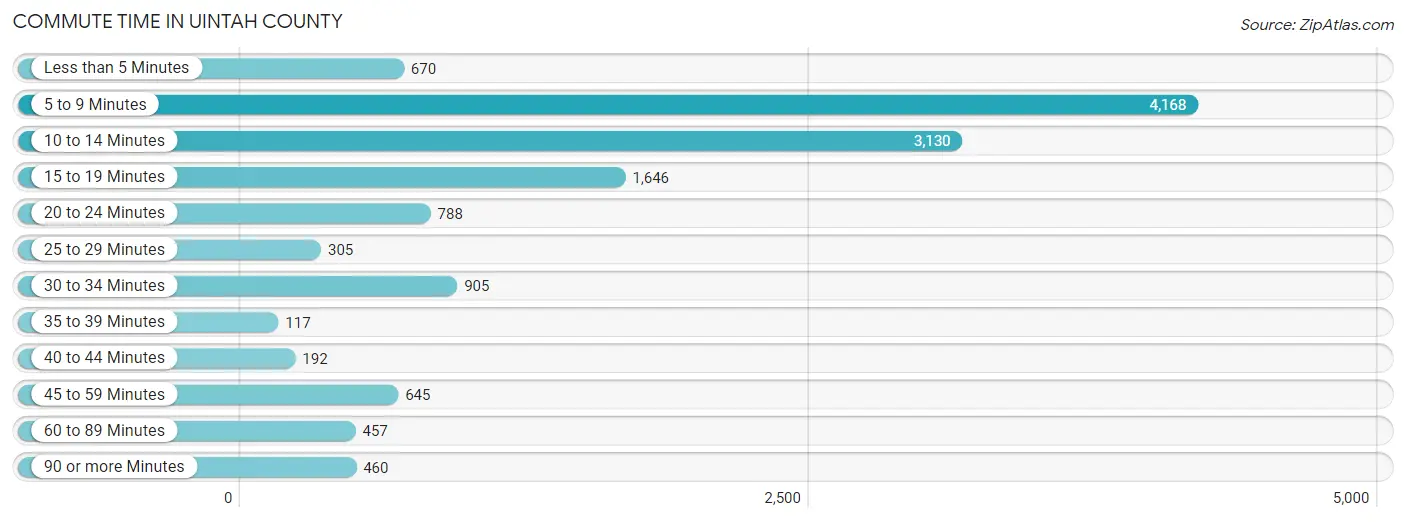
| Commute Time | # Commuters | % Commuters |
| Less than 5 Minutes | 670 | 5.0% |
| 5 to 9 Minutes | 4,168 | 30.9% |
| 10 to 14 Minutes | 3,130 | 23.2% |
| 15 to 19 Minutes | 1,646 | 12.2% |
| 20 to 24 Minutes | 788 | 5.8% |
| 25 to 29 Minutes | 305 | 2.3% |
| 30 to 34 Minutes | 905 | 6.7% |
| 35 to 39 Minutes | 117 | 0.9% |
| 40 to 44 Minutes | 192 | 1.4% |
| 45 to 59 Minutes | 645 | 4.8% |
| 60 to 89 Minutes | 457 | 3.4% |
| 90 or more Minutes | 460 | 3.4% |
Commute Time by Sex in Uintah County
The most common commute times in Uintah County are 5 to 9 minutes (1,976 commuters, 25.8%) for males and 5 to 9 minutes (2,192 commuters, 37.6%) for females.
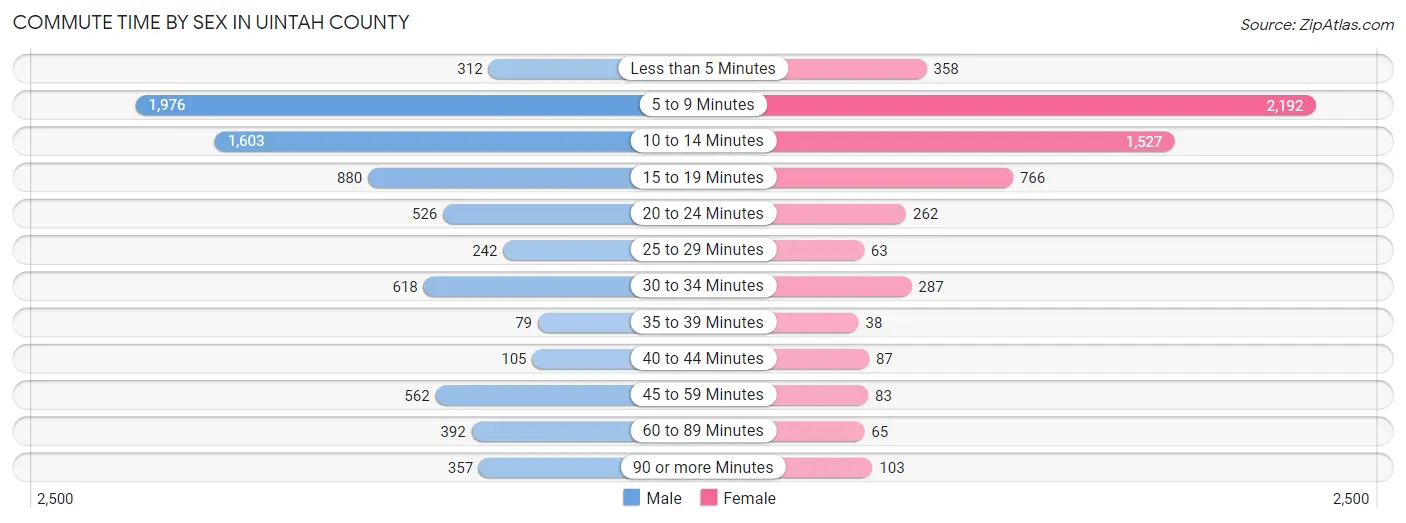
| Commute Time | Male | Female |
| Less than 5 Minutes | 312 (4.1%) | 358 (6.1%) |
| 5 to 9 Minutes | 1,976 (25.8%) | 2,192 (37.6%) |
| 10 to 14 Minutes | 1,603 (20.9%) | 1,527 (26.2%) |
| 15 to 19 Minutes | 880 (11.5%) | 766 (13.1%) |
| 20 to 24 Minutes | 526 (6.9%) | 262 (4.5%) |
| 25 to 29 Minutes | 242 (3.2%) | 63 (1.1%) |
| 30 to 34 Minutes | 618 (8.1%) | 287 (4.9%) |
| 35 to 39 Minutes | 79 (1.0%) | 38 (0.6%) |
| 40 to 44 Minutes | 105 (1.4%) | 87 (1.5%) |
| 45 to 59 Minutes | 562 (7.3%) | 83 (1.4%) |
| 60 to 89 Minutes | 392 (5.1%) | 65 (1.1%) |
| 90 or more Minutes | 357 (4.7%) | 103 (1.8%) |
Time of Departure to Work by Sex in Uintah County
The most frequent times of departure to work in Uintah County are 7:30 AM to 7:59 AM (1,078, 14.1%) for males and 7:30 AM to 7:59 AM (1,075, 18.4%) for females.
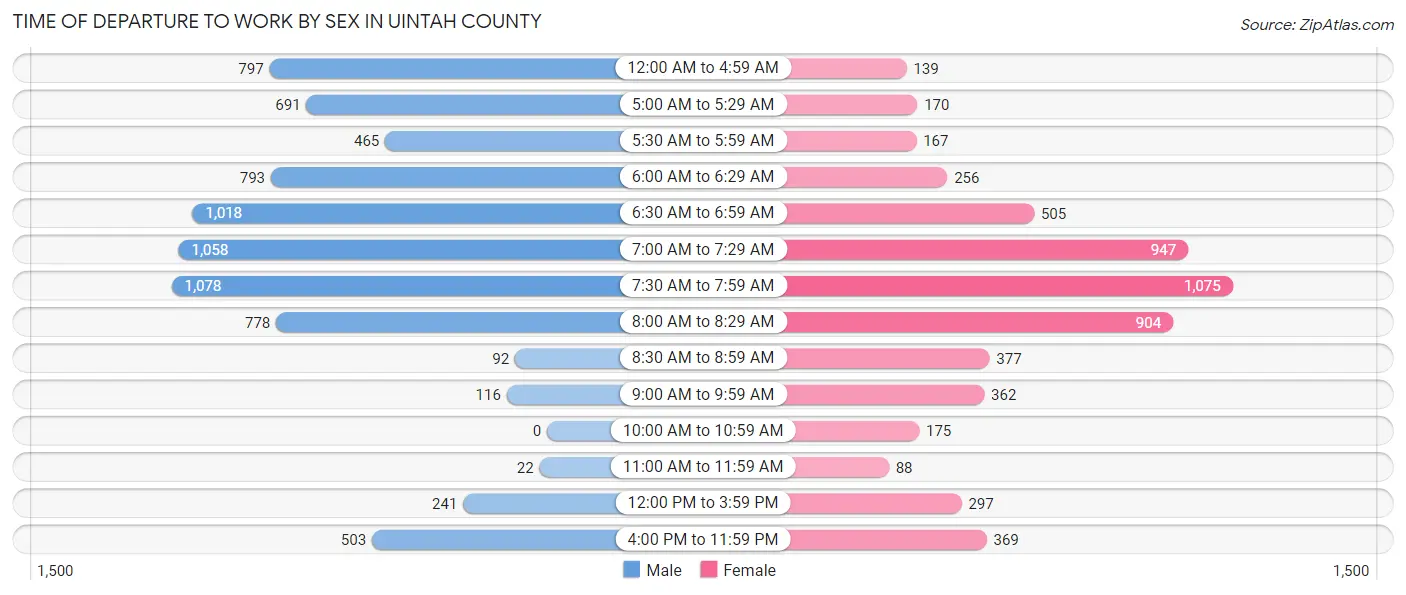
| Time of Departure | Male | Female |
| 12:00 AM to 4:59 AM | 797 (10.4%) | 139 (2.4%) |
| 5:00 AM to 5:29 AM | 691 (9.0%) | 170 (2.9%) |
| 5:30 AM to 5:59 AM | 465 (6.1%) | 167 (2.9%) |
| 6:00 AM to 6:29 AM | 793 (10.4%) | 256 (4.4%) |
| 6:30 AM to 6:59 AM | 1,018 (13.3%) | 505 (8.7%) |
| 7:00 AM to 7:29 AM | 1,058 (13.8%) | 947 (16.2%) |
| 7:30 AM to 7:59 AM | 1,078 (14.1%) | 1,075 (18.4%) |
| 8:00 AM to 8:29 AM | 778 (10.2%) | 904 (15.5%) |
| 8:30 AM to 8:59 AM | 92 (1.2%) | 377 (6.5%) |
| 9:00 AM to 9:59 AM | 116 (1.5%) | 362 (6.2%) |
| 10:00 AM to 10:59 AM | 0 (0.0%) | 175 (3.0%) |
| 11:00 AM to 11:59 AM | 22 (0.3%) | 88 (1.5%) |
| 12:00 PM to 3:59 PM | 241 (3.2%) | 297 (5.1%) |
| 4:00 PM to 11:59 PM | 503 (6.6%) | 369 (6.3%) |
| Total | 7,652 (100.0%) | 5,831 (100.0%) |
Housing Occupancy in Uintah County
Occupancy by Ownership in Uintah County
Of the total 11,547 dwellings in Uintah County, owner-occupied units account for 8,510 (73.7%), while renter-occupied units make up 3,037 (26.3%).
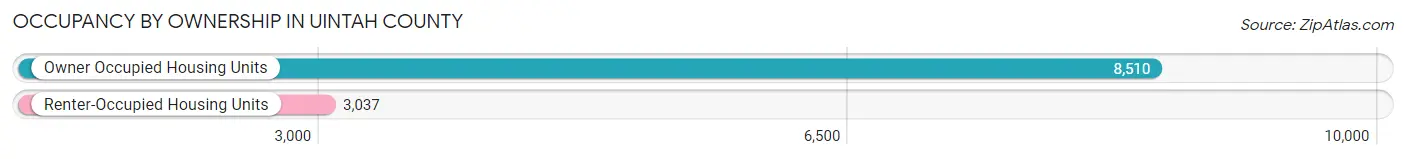
| Occupancy | # Housing Units | % Housing Units |
| Owner Occupied Housing Units | 8,510 | 73.7% |
| Renter-Occupied Housing Units | 3,037 | 26.3% |
| Total Occupied Housing Units | 11,547 | 100.0% |
Occupancy by Household Size in Uintah County
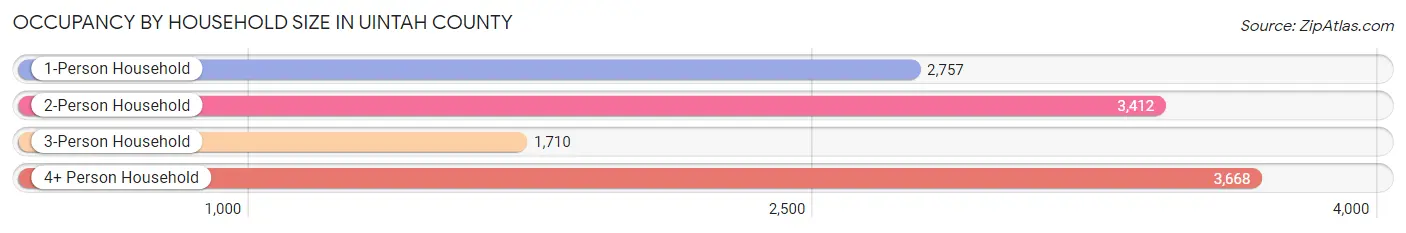
| Household Size | # Housing Units | % Housing Units |
| 1-Person Household | 2,757 | 23.9% |
| 2-Person Household | 3,412 | 29.5% |
| 3-Person Household | 1,710 | 14.8% |
| 4+ Person Household | 3,668 | 31.8% |
| Total Housing Units | 11,547 | 100.0% |
Occupancy by Ownership by Household Size in Uintah County
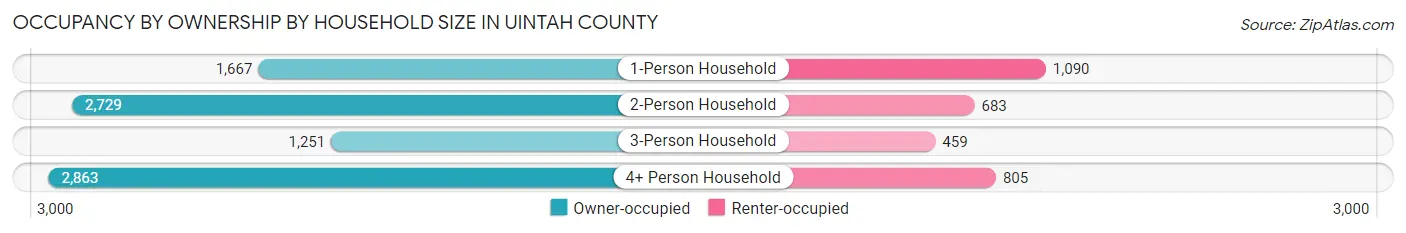
| Household Size | Owner-occupied | Renter-occupied |
| 1-Person Household | 1,667 (60.5%) | 1,090 (39.5%) |
| 2-Person Household | 2,729 (80.0%) | 683 (20.0%) |
| 3-Person Household | 1,251 (73.2%) | 459 (26.8%) |
| 4+ Person Household | 2,863 (78.0%) | 805 (22.0%) |
| Total Housing Units | 8,510 (73.7%) | 3,037 (26.3%) |
Occupancy by Educational Attainment in Uintah County
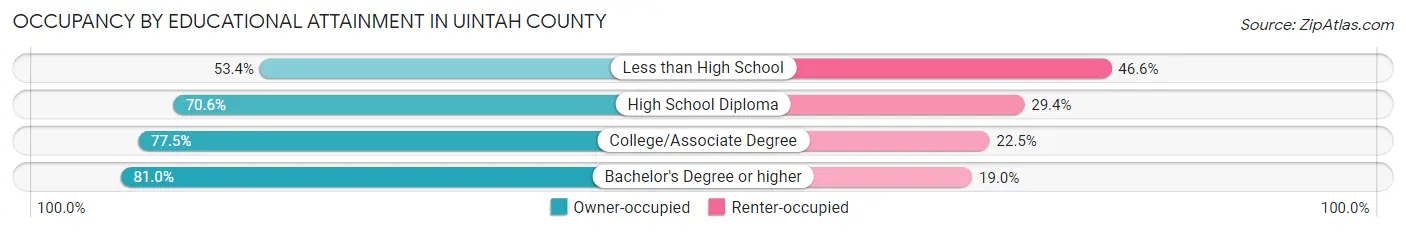
| Household Size | Owner-occupied | Renter-occupied |
| Less than High School | 586 (53.4%) | 512 (46.6%) |
| High School Diploma | 2,619 (70.6%) | 1,089 (29.4%) |
| College/Associate Degree | 3,427 (77.5%) | 995 (22.5%) |
| Bachelor's Degree or higher | 1,878 (81.0%) | 441 (19.0%) |
Occupancy by Age of Householder in Uintah County
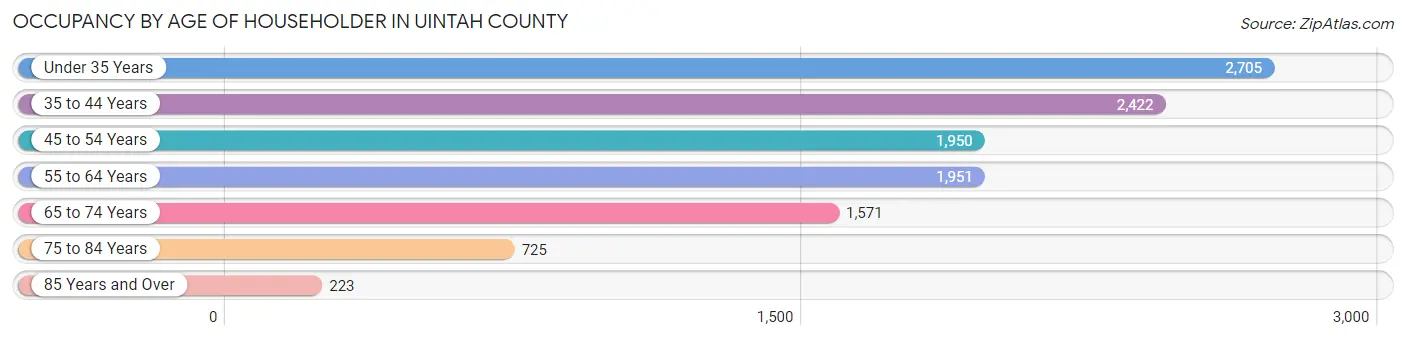
| Age Bracket | # Households | % Households |
| Under 35 Years | 2,705 | 23.4% |
| 35 to 44 Years | 2,422 | 21.0% |
| 45 to 54 Years | 1,950 | 16.9% |
| 55 to 64 Years | 1,951 | 16.9% |
| 65 to 74 Years | 1,571 | 13.6% |
| 75 to 84 Years | 725 | 6.3% |
| 85 Years and Over | 223 | 1.9% |
| Total | 11,547 | 100.0% |
Housing Finances in Uintah County
Median Income by Occupancy in Uintah County
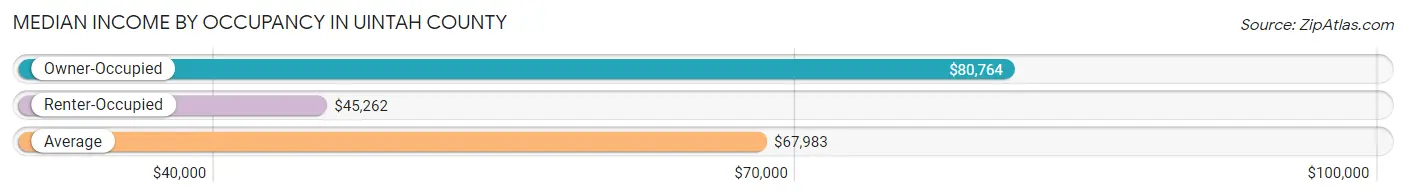
| Occupancy Type | # Households | Median Income |
| Owner-Occupied | 8,510 (73.7%) | $80,764 |
| Renter-Occupied | 3,037 (26.3%) | $45,262 |
| Average | 11,547 (100.0%) | $67,983 |
Occupancy by Householder Income Bracket in Uintah County
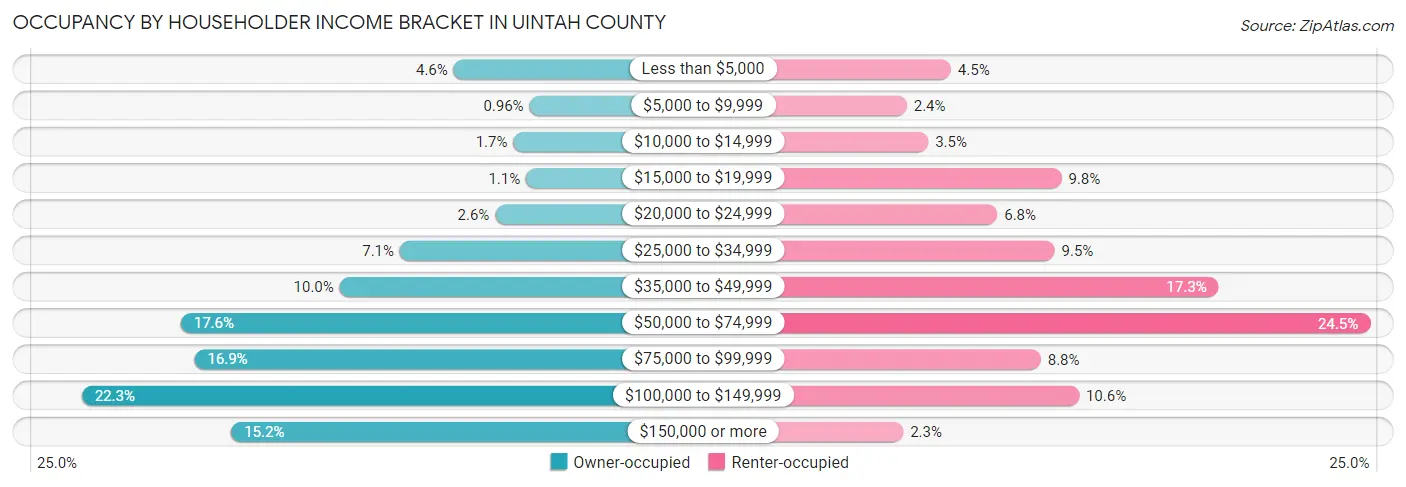
| Income Bracket | Owner-occupied | Renter-occupied |
| Less than $5,000 | 389 (4.6%) | 138 (4.5%) |
| $5,000 to $9,999 | 82 (1.0%) | 74 (2.4%) |
| $10,000 to $14,999 | 147 (1.7%) | 105 (3.5%) |
| $15,000 to $19,999 | 95 (1.1%) | 298 (9.8%) |
| $20,000 to $24,999 | 220 (2.6%) | 205 (6.8%) |
| $25,000 to $34,999 | 607 (7.1%) | 288 (9.5%) |
| $35,000 to $49,999 | 851 (10.0%) | 525 (17.3%) |
| $50,000 to $74,999 | 1,494 (17.6%) | 744 (24.5%) |
| $75,000 to $99,999 | 1,439 (16.9%) | 268 (8.8%) |
| $100,000 to $149,999 | 1,896 (22.3%) | 323 (10.6%) |
| $150,000 or more | 1,290 (15.2%) | 69 (2.3%) |
| Total | 8,510 (100.0%) | 3,037 (100.0%) |
Monthly Housing Cost Tiers in Uintah County
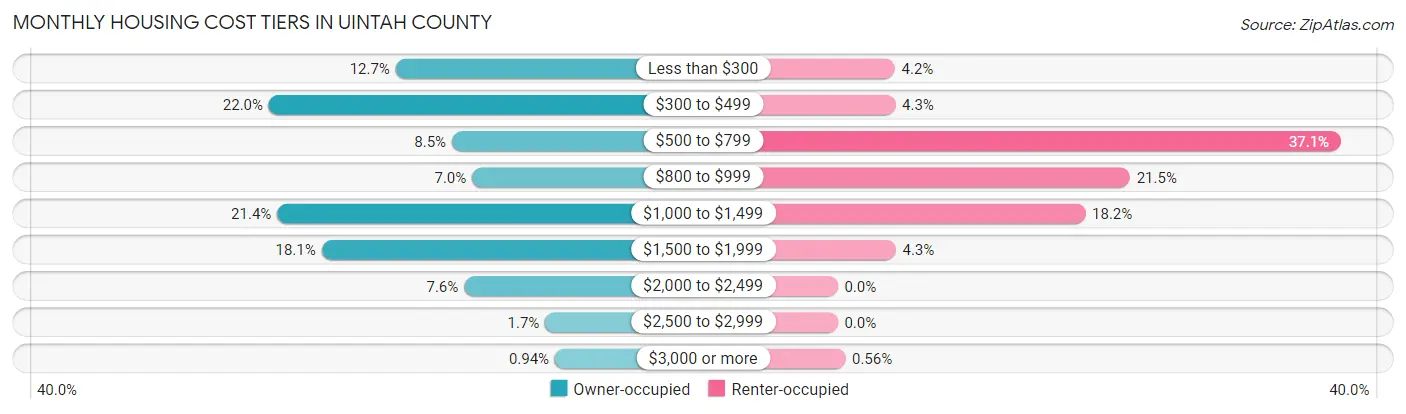
| Monthly Cost | Owner-occupied | Renter-occupied |
| Less than $300 | 1,078 (12.7%) | 128 (4.2%) |
| $300 to $499 | 1,873 (22.0%) | 129 (4.3%) |
| $500 to $799 | 726 (8.5%) | 1,126 (37.1%) |
| $800 to $999 | 599 (7.0%) | 654 (21.5%) |
| $1,000 to $1,499 | 1,821 (21.4%) | 554 (18.2%) |
| $1,500 to $1,999 | 1,543 (18.1%) | 130 (4.3%) |
| $2,000 to $2,499 | 649 (7.6%) | 0 (0.0%) |
| $2,500 to $2,999 | 141 (1.7%) | 0 (0.0%) |
| $3,000 or more | 80 (0.9%) | 17 (0.6%) |
| Total | 8,510 (100.0%) | 3,037 (100.0%) |
Physical Housing Characteristics in Uintah County
Housing Structures in Uintah County
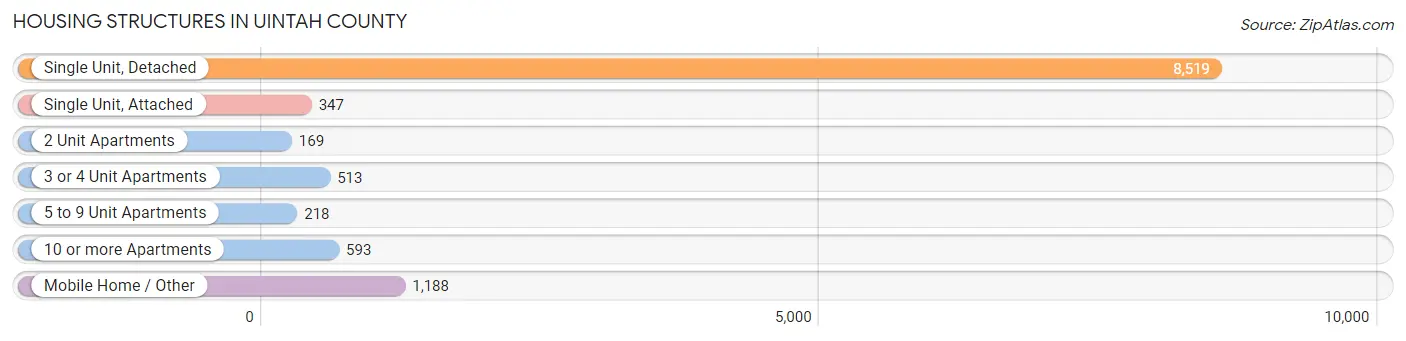
| Structure Type | # Housing Units | % Housing Units |
| Single Unit, Detached | 8,519 | 73.8% |
| Single Unit, Attached | 347 | 3.0% |
| 2 Unit Apartments | 169 | 1.5% |
| 3 or 4 Unit Apartments | 513 | 4.4% |
| 5 to 9 Unit Apartments | 218 | 1.9% |
| 10 or more Apartments | 593 | 5.1% |
| Mobile Home / Other | 1,188 | 10.3% |
| Total | 11,547 | 100.0% |
Housing Structures by Occupancy in Uintah County
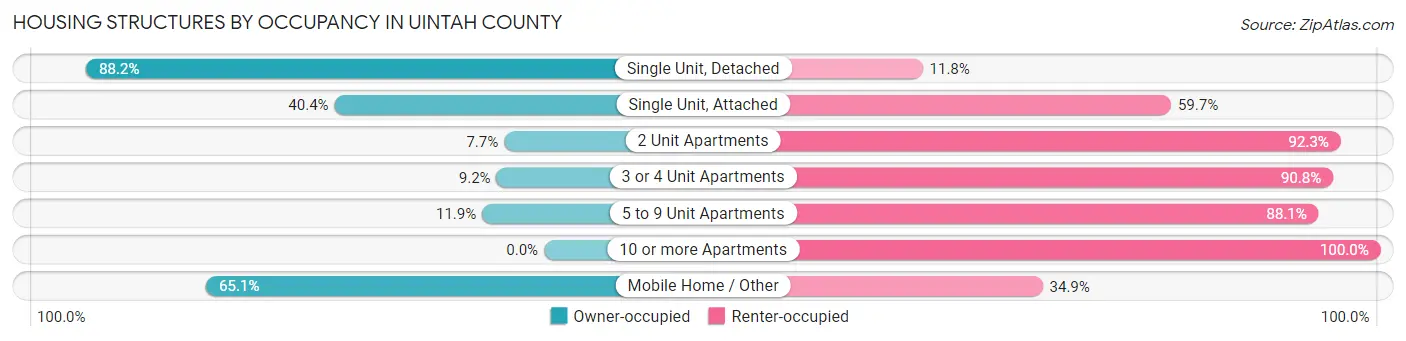
| Structure Type | Owner-occupied | Renter-occupied |
| Single Unit, Detached | 7,511 (88.2%) | 1,008 (11.8%) |
| Single Unit, Attached | 140 (40.4%) | 207 (59.7%) |
| 2 Unit Apartments | 13 (7.7%) | 156 (92.3%) |
| 3 or 4 Unit Apartments | 47 (9.2%) | 466 (90.8%) |
| 5 to 9 Unit Apartments | 26 (11.9%) | 192 (88.1%) |
| 10 or more Apartments | 0 (0.0%) | 593 (100.0%) |
| Mobile Home / Other | 773 (65.1%) | 415 (34.9%) |
| Total | 8,510 (73.7%) | 3,037 (26.3%) |
Housing Structures by Number of Rooms in Uintah County
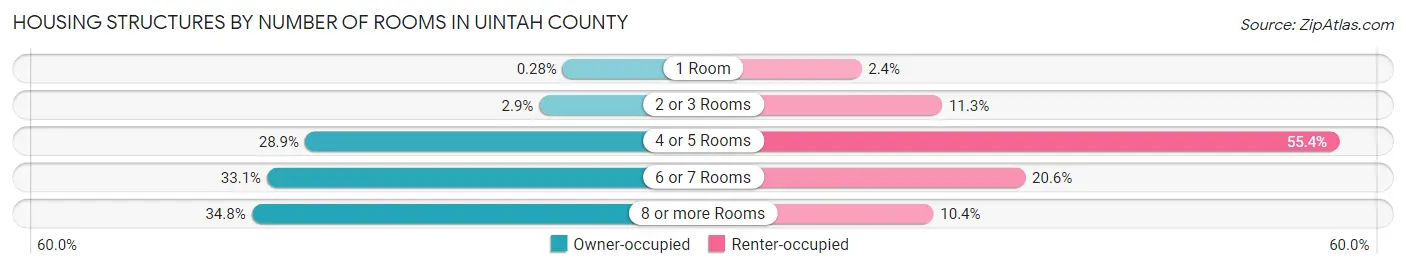
| Number of Rooms | Owner-occupied | Renter-occupied |
| 1 Room | 24 (0.3%) | 72 (2.4%) |
| 2 or 3 Rooms | 246 (2.9%) | 344 (11.3%) |
| 4 or 5 Rooms | 2,459 (28.9%) | 1,682 (55.4%) |
| 6 or 7 Rooms | 2,818 (33.1%) | 624 (20.5%) |
| 8 or more Rooms | 2,963 (34.8%) | 315 (10.4%) |
| Total | 8,510 (100.0%) | 3,037 (100.0%) |
Housing Structure by Heating Type in Uintah County
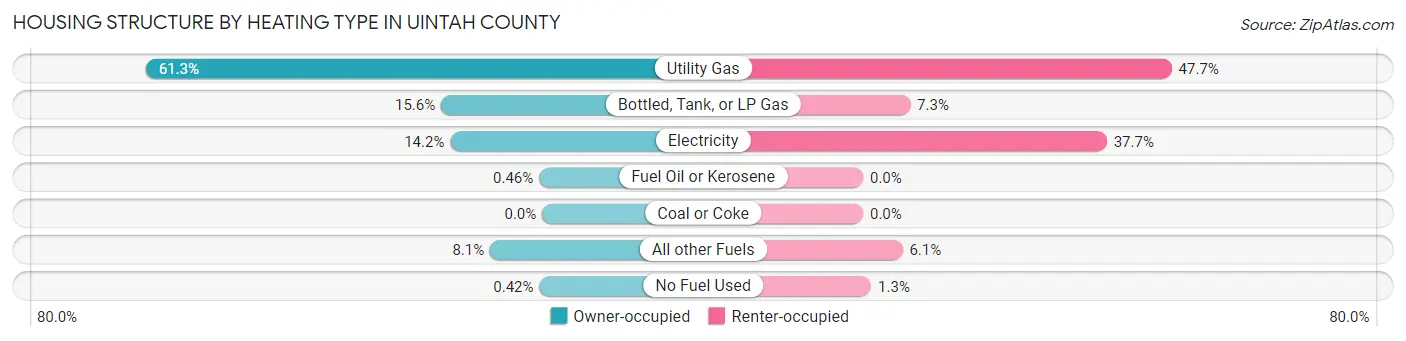
| Heating Type | Owner-occupied | Renter-occupied |
| Utility Gas | 5,213 (61.3%) | 1,449 (47.7%) |
| Bottled, Tank, or LP Gas | 1,329 (15.6%) | 221 (7.3%) |
| Electricity | 1,208 (14.2%) | 1,144 (37.7%) |
| Fuel Oil or Kerosene | 39 (0.5%) | 0 (0.0%) |
| Coal or Coke | 0 (0.0%) | 0 (0.0%) |
| All other Fuels | 685 (8.1%) | 185 (6.1%) |
| No Fuel Used | 36 (0.4%) | 38 (1.3%) |
| Total | 8,510 (100.0%) | 3,037 (100.0%) |
Household Vehicle Usage in Uintah County
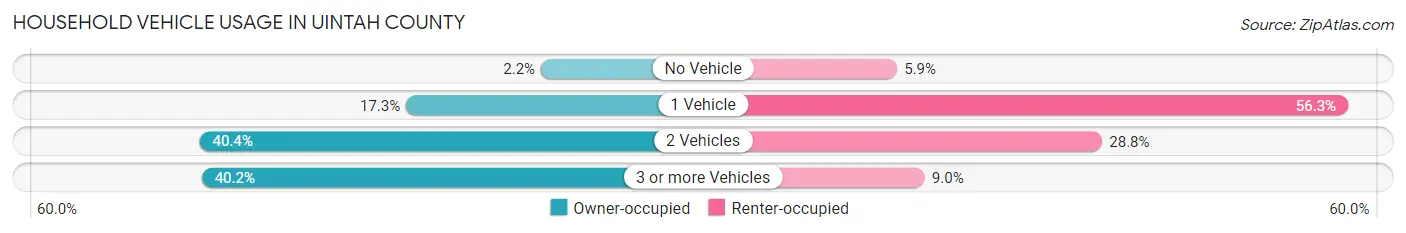
| Vehicles per Household | Owner-occupied | Renter-occupied |
| No Vehicle | 184 (2.2%) | 178 (5.9%) |
| 1 Vehicle | 1,470 (17.3%) | 1,711 (56.3%) |
| 2 Vehicles | 3,438 (40.4%) | 876 (28.8%) |
| 3 or more Vehicles | 3,418 (40.2%) | 272 (9.0%) |
| Total | 8,510 (100.0%) | 3,037 (100.0%) |
Real Estate & Mortgages in Uintah County
Real Estate and Mortgage Overview in Uintah County
| Characteristic | Without Mortgage | With Mortgage |
| Housing Units | 3,679 | 4,831 |
| Median Property Value | $244,900 | $257,800 |
| Median Household Income | $65,964 | $828 |
| Monthly Housing Costs | $391 | $73 |
| Real Estate Taxes | $1,331 | $253 |
Property Value by Mortgage Status in Uintah County
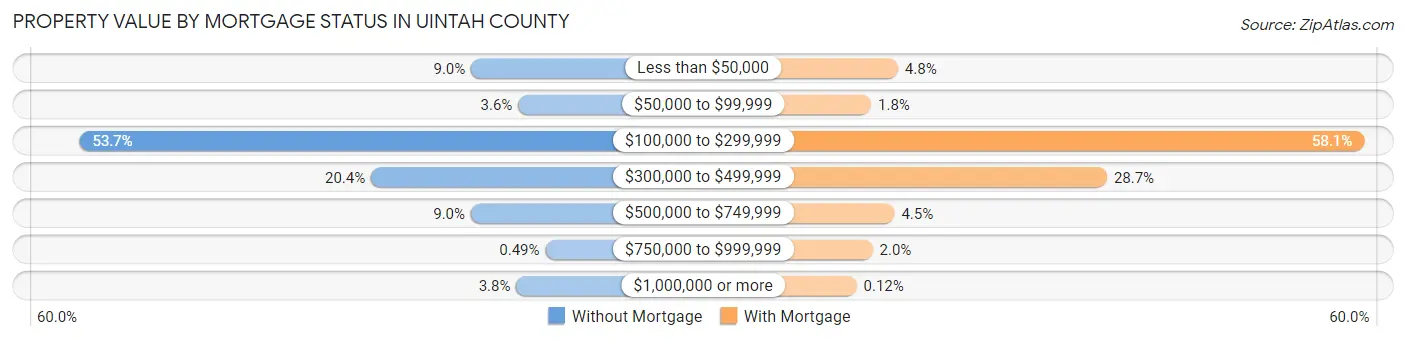
| Property Value | Without Mortgage | With Mortgage |
| Less than $50,000 | 330 (9.0%) | 234 (4.8%) |
| $50,000 to $99,999 | 132 (3.6%) | 86 (1.8%) |
| $100,000 to $299,999 | 1,977 (53.7%) | 2,808 (58.1%) |
| $300,000 to $499,999 | 751 (20.4%) | 1,388 (28.7%) |
| $500,000 to $749,999 | 331 (9.0%) | 215 (4.4%) |
| $750,000 to $999,999 | 18 (0.5%) | 94 (1.9%) |
| $1,000,000 or more | 140 (3.8%) | 6 (0.1%) |
| Total | 3,679 (100.0%) | 4,831 (100.0%) |
Household Income by Mortgage Status in Uintah County
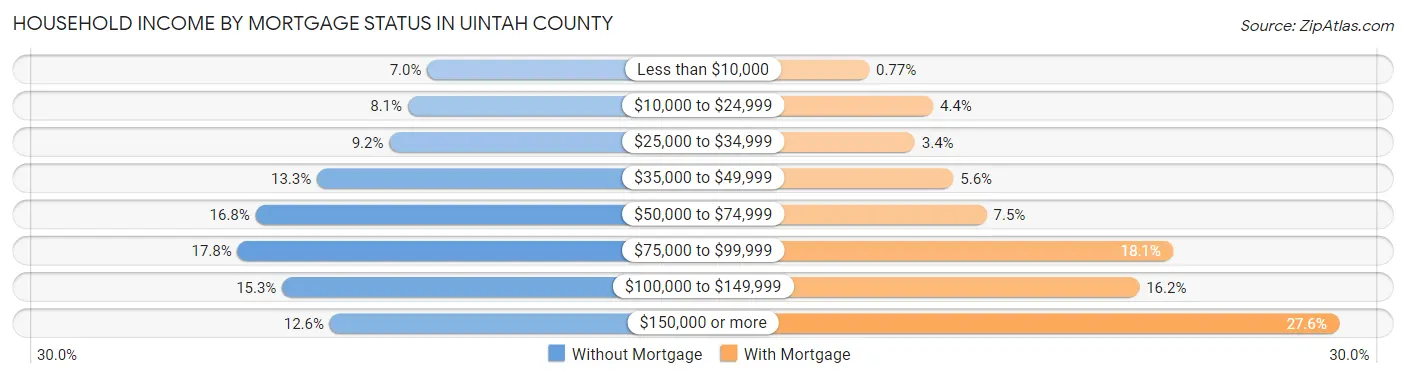
| Household Income | Without Mortgage | With Mortgage |
| Less than $10,000 | 257 (7.0%) | 37 (0.8%) |
| $10,000 to $24,999 | 298 (8.1%) | 214 (4.4%) |
| $25,000 to $34,999 | 337 (9.2%) | 164 (3.4%) |
| $35,000 to $49,999 | 489 (13.3%) | 270 (5.6%) |
| $50,000 to $74,999 | 618 (16.8%) | 362 (7.5%) |
| $75,000 to $99,999 | 656 (17.8%) | 876 (18.1%) |
| $100,000 to $149,999 | 562 (15.3%) | 783 (16.2%) |
| $150,000 or more | 462 (12.6%) | 1,334 (27.6%) |
| Total | 3,679 (100.0%) | 4,831 (100.0%) |
Property Value to Household Income Ratio in Uintah County
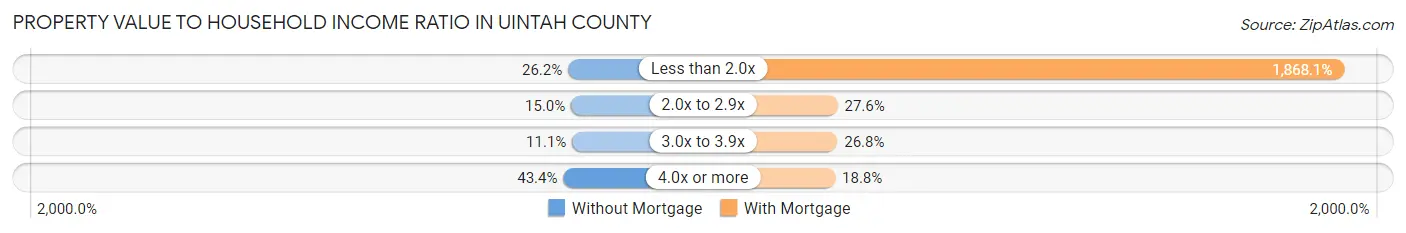
| Value-to-Income Ratio | Without Mortgage | With Mortgage |
| Less than 2.0x | 963 (26.2%) | 90,246 (1,868.1%) |
| 2.0x to 2.9x | 551 (15.0%) | 1,332 (27.6%) |
| 3.0x to 3.9x | 408 (11.1%) | 1,294 (26.8%) |
| 4.0x or more | 1,598 (43.4%) | 907 (18.8%) |
| Total | 3,679 (100.0%) | 4,831 (100.0%) |
Real Estate Taxes by Mortgage Status in Uintah County
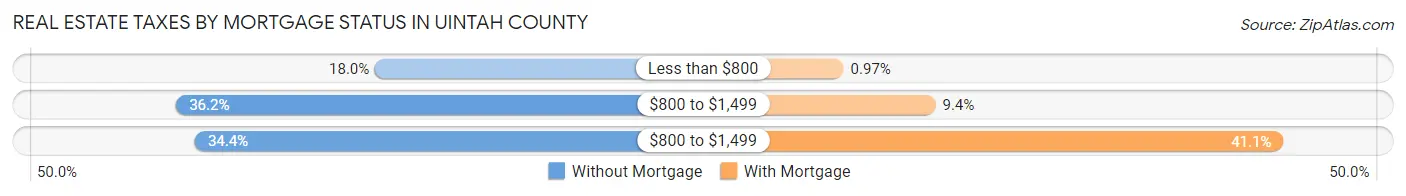
| Property Taxes | Without Mortgage | With Mortgage |
| Less than $800 | 662 (18.0%) | 47 (1.0%) |
| $800 to $1,499 | 1,330 (36.1%) | 452 (9.4%) |
| $800 to $1,499 | 1,267 (34.4%) | 1,987 (41.1%) |
| Total | 3,679 (100.0%) | 4,831 (100.0%) |
Health & Disability in Uintah County
Health Insurance Coverage by Age in Uintah County
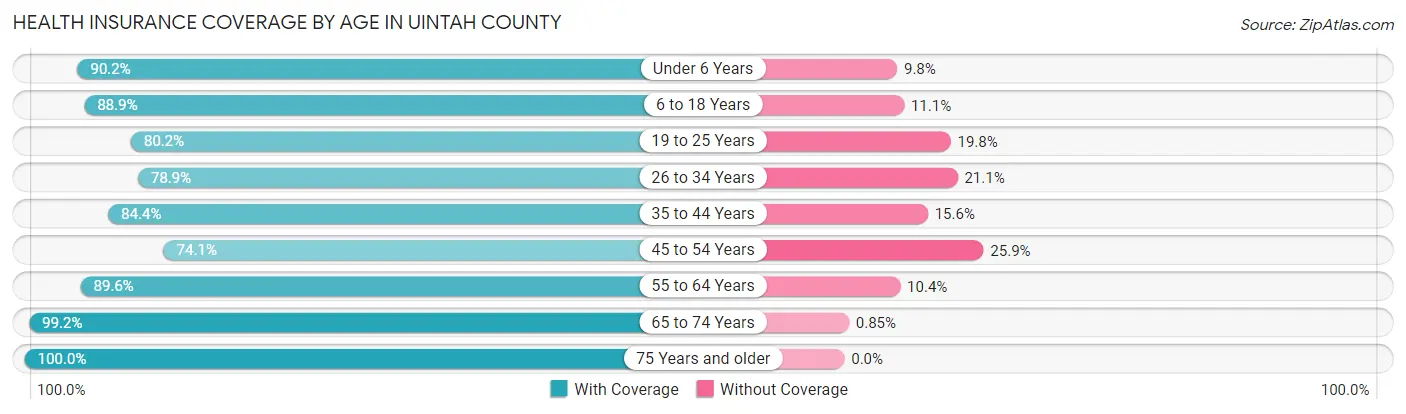
| Age Bracket | With Coverage | Without Coverage |
| Under 6 Years | 3,309 (90.2%) | 361 (9.8%) |
| 6 to 18 Years | 7,554 (88.9%) | 946 (11.1%) |
| 19 to 25 Years | 2,283 (80.2%) | 564 (19.8%) |
| 26 to 34 Years | 3,359 (78.9%) | 899 (21.1%) |
| 35 to 44 Years | 4,293 (84.4%) | 791 (15.6%) |
| 45 to 54 Years | 2,772 (74.1%) | 971 (25.9%) |
| 55 to 64 Years | 3,197 (89.6%) | 372 (10.4%) |
| 65 to 74 Years | 2,579 (99.2%) | 22 (0.9%) |
| 75 Years and older | 1,392 (100.0%) | 0 (0.0%) |
| Total | 30,738 (86.2%) | 4,926 (13.8%) |
Health Insurance Coverage by Citizenship Status in Uintah County
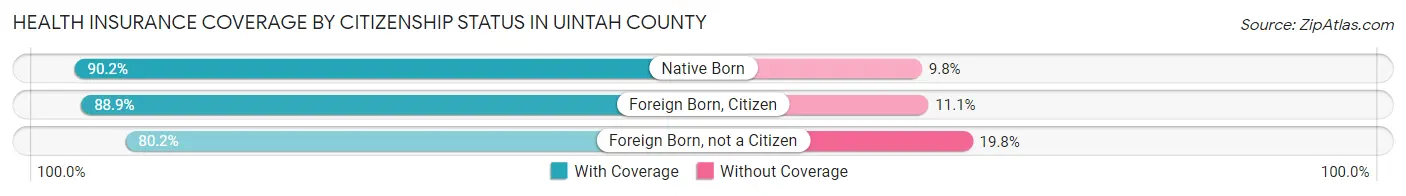
| Citizenship Status | With Coverage | Without Coverage |
| Native Born | 3,309 (90.2%) | 361 (9.8%) |
| Foreign Born, Citizen | 7,554 (88.9%) | 946 (11.1%) |
| Foreign Born, not a Citizen | 2,283 (80.2%) | 564 (19.8%) |
Health Insurance Coverage by Household Income in Uintah County
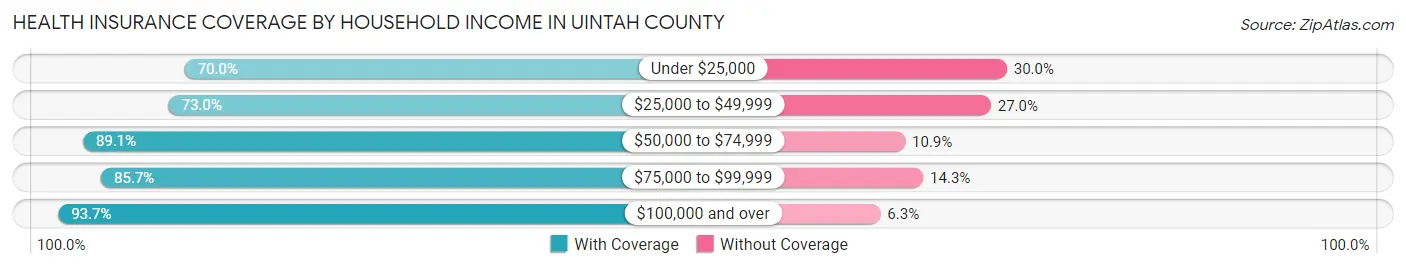
| Household Income | With Coverage | Without Coverage |
| Under $25,000 | 2,061 (70.0%) | 882 (30.0%) |
| $25,000 to $49,999 | 3,984 (73.0%) | 1,472 (27.0%) |
| $50,000 to $74,999 | 6,562 (89.1%) | 804 (10.9%) |
| $75,000 to $99,999 | 5,364 (85.7%) | 896 (14.3%) |
| $100,000 and over | 12,711 (93.7%) | 855 (6.3%) |
Public vs Private Health Insurance Coverage by Age in Uintah County
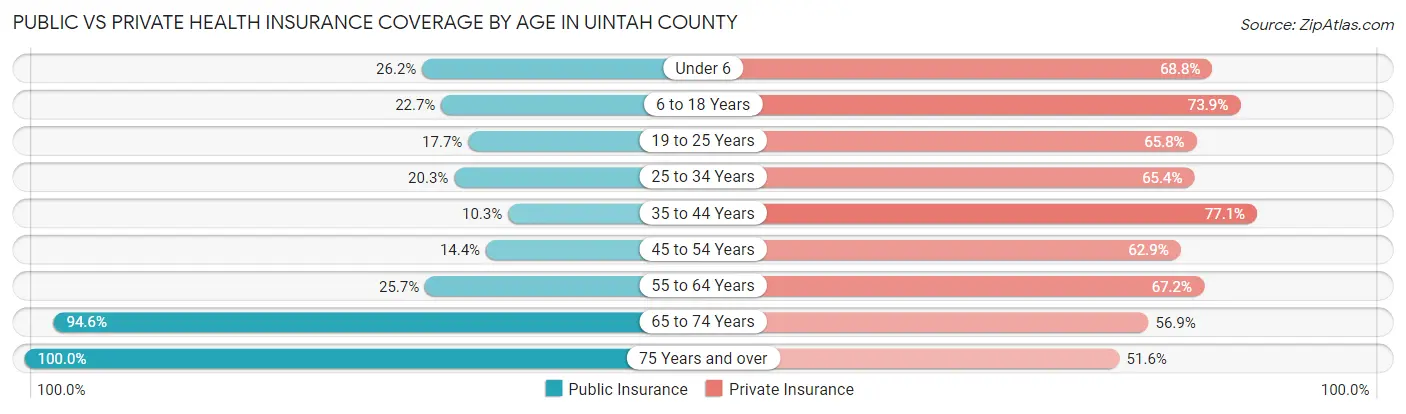
| Age Bracket | Public Insurance | Private Insurance |
| Under 6 | 962 (26.2%) | 2,523 (68.8%) |
| 6 to 18 Years | 1,927 (22.7%) | 6,282 (73.9%) |
| 19 to 25 Years | 503 (17.7%) | 1,874 (65.8%) |
| 25 to 34 Years | 863 (20.3%) | 2,785 (65.4%) |
| 35 to 44 Years | 522 (10.3%) | 3,917 (77.0%) |
| 45 to 54 Years | 538 (14.4%) | 2,353 (62.9%) |
| 55 to 64 Years | 916 (25.7%) | 2,398 (67.2%) |
| 65 to 74 Years | 2,461 (94.6%) | 1,481 (56.9%) |
| 75 Years and over | 1,392 (100.0%) | 718 (51.6%) |
| Total | 10,084 (28.3%) | 24,331 (68.2%) |
Disability Status by Sex by Age in Uintah County
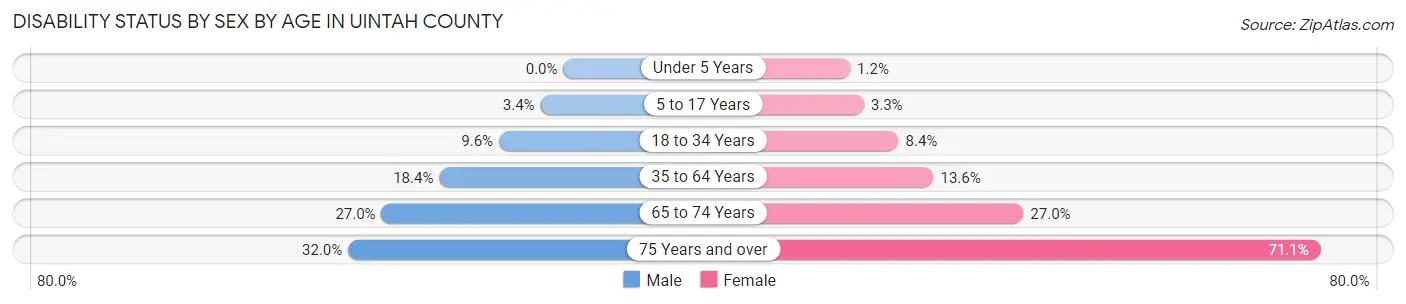
| Age Bracket | Male | Female |
| Under 5 Years | 0 (0.0%) | 18 (1.2%) |
| 5 to 17 Years | 153 (3.4%) | 137 (3.3%) |
| 18 to 34 Years | 370 (9.6%) | 327 (8.4%) |
| 35 to 64 Years | 1,155 (18.4%) | 835 (13.6%) |
| 65 to 74 Years | 363 (27.0%) | 339 (27.0%) |
| 75 Years and over | 194 (32.0%) | 558 (71.1%) |
Disability Class by Sex by Age in Uintah County
Disability Class: Hearing Difficulty
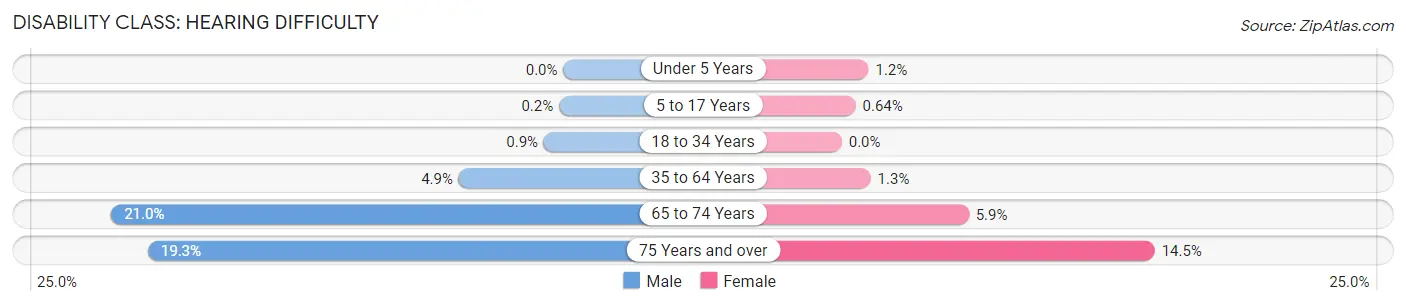
| Age Bracket | Male | Female |
| Under 5 Years | 0 (0.0%) | 18 (1.2%) |
| 5 to 17 Years | 9 (0.2%) | 27 (0.6%) |
| 18 to 34 Years | 35 (0.9%) | 0 (0.0%) |
| 35 to 64 Years | 304 (4.9%) | 82 (1.3%) |
| 65 to 74 Years | 282 (21.0%) | 74 (5.9%) |
| 75 Years and over | 117 (19.3%) | 114 (14.5%) |
Disability Class: Vision Difficulty
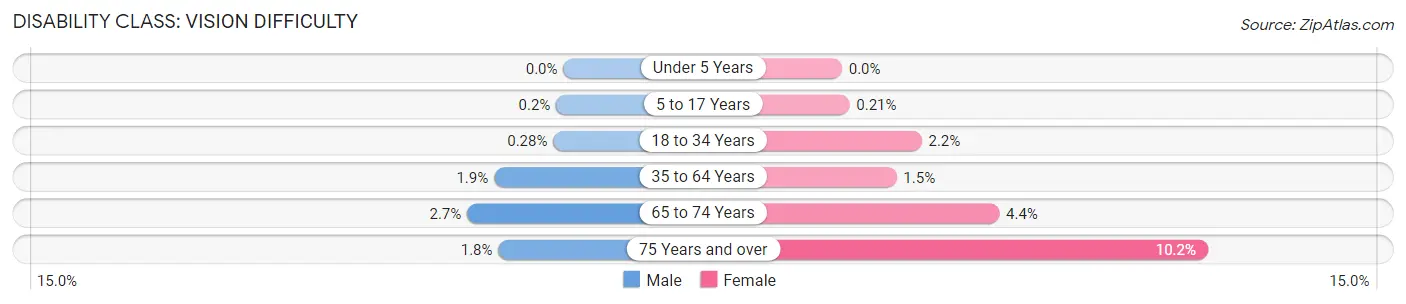
| Age Bracket | Male | Female |
| Under 5 Years | 0 (0.0%) | 0 (0.0%) |
| 5 to 17 Years | 9 (0.2%) | 9 (0.2%) |
| 18 to 34 Years | 11 (0.3%) | 86 (2.2%) |
| 35 to 64 Years | 121 (1.9%) | 93 (1.5%) |
| 65 to 74 Years | 36 (2.7%) | 55 (4.4%) |
| 75 Years and over | 11 (1.8%) | 80 (10.2%) |
Disability Class: Cognitive Difficulty
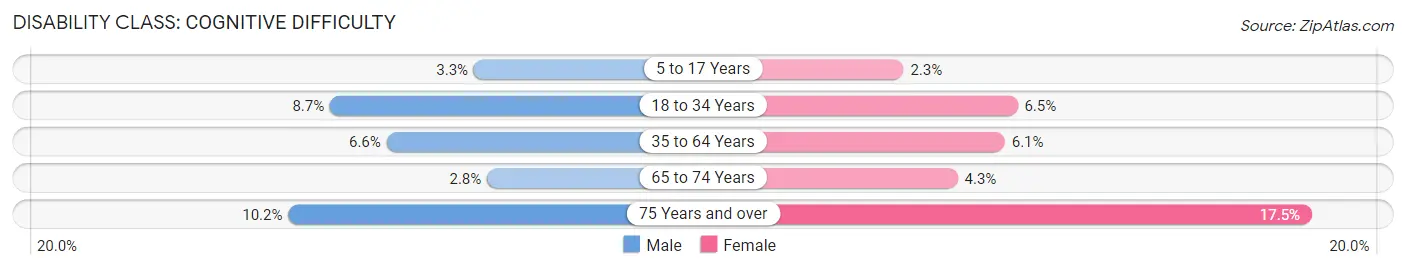
| Age Bracket | Male | Female |
| 5 to 17 Years | 149 (3.3%) | 96 (2.3%) |
| 18 to 34 Years | 335 (8.7%) | 253 (6.5%) |
| 35 to 64 Years | 411 (6.6%) | 371 (6.0%) |
| 65 to 74 Years | 38 (2.8%) | 54 (4.3%) |
| 75 Years and over | 62 (10.2%) | 137 (17.4%) |
Disability Class: Ambulatory Difficulty
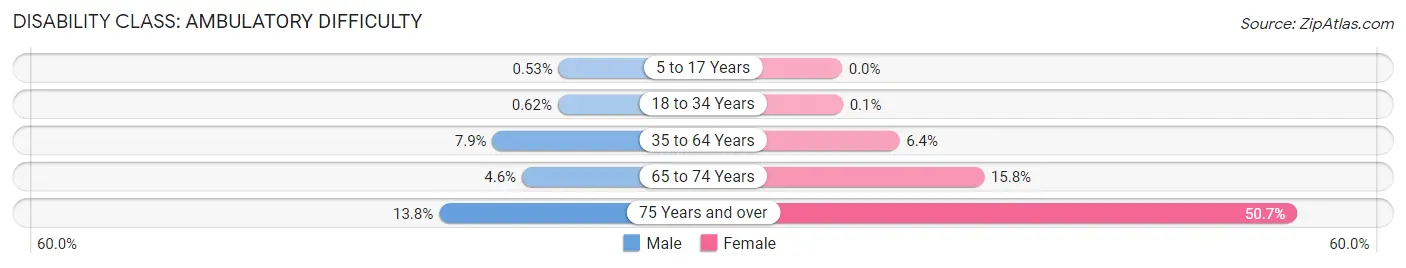
| Age Bracket | Male | Female |
| 5 to 17 Years | 24 (0.5%) | 0 (0.0%) |
| 18 to 34 Years | 24 (0.6%) | 4 (0.1%) |
| 35 to 64 Years | 495 (7.9%) | 392 (6.4%) |
| 65 to 74 Years | 62 (4.6%) | 199 (15.8%) |
| 75 Years and over | 84 (13.8%) | 398 (50.7%) |
Disability Class: Self-Care Difficulty
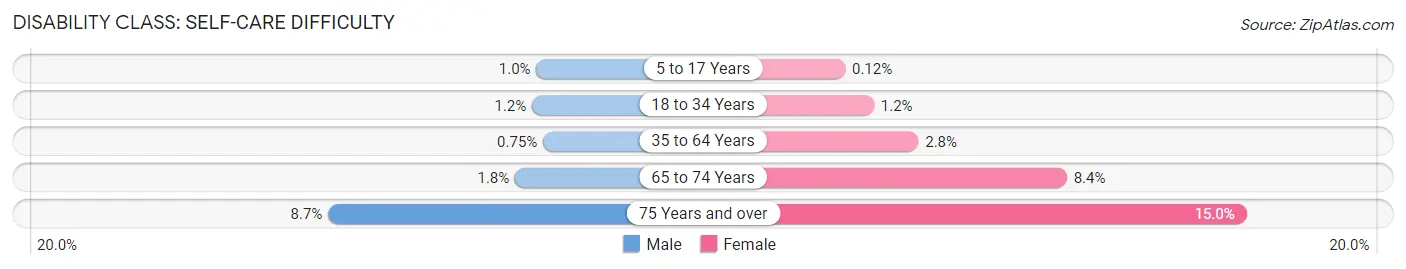
| Age Bracket | Male | Female |
| 5 to 17 Years | 45 (1.0%) | 5 (0.1%) |
| 18 to 34 Years | 45 (1.2%) | 46 (1.2%) |
| 35 to 64 Years | 47 (0.7%) | 174 (2.8%) |
| 65 to 74 Years | 24 (1.8%) | 105 (8.4%) |
| 75 Years and over | 53 (8.7%) | 118 (15.0%) |
Technology Access in Uintah County
Computing Device Access in Uintah County
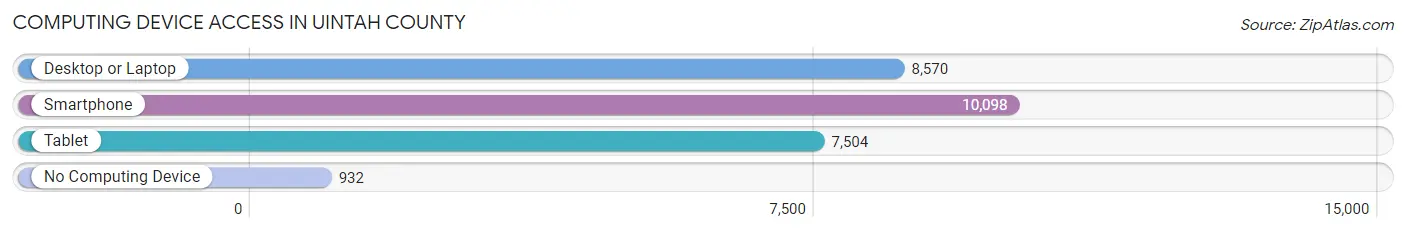
| Device Type | # Households | % Households |
| Desktop or Laptop | 8,570 | 74.2% |
| Smartphone | 10,098 | 87.5% |
| Tablet | 7,504 | 65.0% |
| No Computing Device | 932 | 8.1% |
| Total | 11,547 | 100.0% |
Internet Access in Uintah County
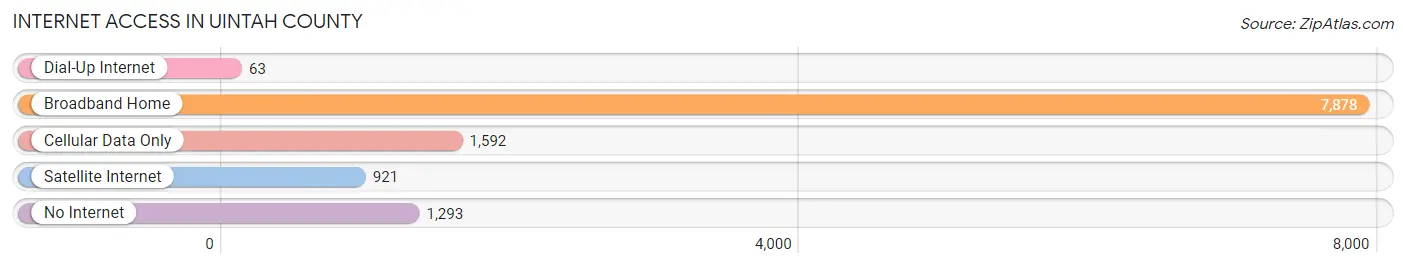
| Internet Type | # Households | % Households |
| Dial-Up Internet | 63 | 0.5% |
| Broadband Home | 7,878 | 68.2% |
| Cellular Data Only | 1,592 | 13.8% |
| Satellite Internet | 921 | 8.0% |
| No Internet | 1,293 | 11.2% |
| Total | 11,547 | 100.0% |
Uintah County Summary
Uintah County is located in the northeastern corner of Utah and is bordered by Wyoming to the north, Colorado to the east, and Duchesne and Daggett counties to the south and west, respectively. The county seat is Vernal, and the largest city is Roosevelt. Uintah County is part of the Uinta Basin, a region of the Colorado Plateau that is known for its oil and gas production.
History
Uintah County was established in 1880 and was named after the Uinta Indians, who were the original inhabitants of the area. The county was originally part of the Uintah and Ouray Indian Reservation, which was established in 1861. The reservation was later reduced in size and the remaining land was opened up to homesteaders in 1905.
The county experienced rapid growth in the early 20th century due to the discovery of oil and gas in the area. The Uintah Railway was built in 1912 to transport the oil and gas to market, and the town of Vernal was established in 1914. The county continued to grow throughout the 20th century, and today it is home to a diverse population of ranchers, farmers, oil and gas workers, and outdoor enthusiasts.
Geography
Uintah County covers an area of 4,541 square miles and is located in the Uinta Basin, a region of the Colorado Plateau. The county is bordered by Wyoming to the north, Colorado to the east, and Duchesne and Daggett counties to the south and west, respectively. The county is home to the Uinta Mountains, which are part of the Wasatch Range. The highest point in the county is Kings Peak, which has an elevation of 13,528 feet.
The county is home to several rivers and streams, including the Green River, the Duchesne River, and the White River. The county also contains several reservoirs, including Flaming Gorge Reservoir, Red Fleet Reservoir, and Steinaker Reservoir.
Economy
Uintah County’s economy is largely based on oil and gas production, agriculture, and tourism. The county is home to several oil and gas fields, including the Uintah Basin Oil Field, which is the largest oil field in Utah. The county is also home to several agricultural operations, including cattle ranches, dairy farms, and hay farms.
Tourism is also an important part of the county’s economy. The county is home to several state parks, including Red Fleet State Park, Steinaker State Park, and Flaming Gorge National Recreation Area. The county is also home to Dinosaur National Monument, which is a popular destination for outdoor enthusiasts.
Demographics
As of the 2010 census, Uintah County had a population of 32,588. The county’s population is largely white (86.3%), with smaller percentages of Hispanic (7.2%), Native American (3.2%), and Asian (1.2%) residents. The median household income in the county is $50,945, and the median home value is $179,400. The county’s unemployment rate is 4.2%.
Common Questions
What is Per Capita Income in Uintah County?
Per Capita income in Uintah County is $27,977.
What is the Median Family Income in Uintah County?
Median Family Income in Uintah County is $84,065.
What is the Median Household income in Uintah County?
Median Household Income in Uintah County is $67,983.
What is Income or Wage Gap in Uintah County?
Income or Wage Gap in Uintah County is 64.6%.
Women in Uintah County earn 35.4 cents for every dollar earned by a man.
What is Family Income Deficit in Uintah County?
Family Income Deficit in Uintah County is $12,488.
Families that are below poverty line in Uintah County earn $12,488 less on average than the poverty threshold level.
What is Inequality or Gini Index in Uintah County?
Inequality or Gini Index in Uintah County is 0.42.
What is the Total Population of Uintah County?
Total Population of Uintah County is 35,951.
What is the Total Male Population of Uintah County?
Total Male Population of Uintah County is 18,211.
What is the Total Female Population of Uintah County?
Total Female Population of Uintah County is 17,740.
What is the Ratio of Males per 100 Females in Uintah County?
There are 102.66 Males per 100 Females in Uintah County.
What is the Ratio of Females per 100 Males in Uintah County?
There are 97.41 Females per 100 Males in Uintah County.
What is the Median Population Age in Uintah County?
Median Population Age in Uintah County is 32.4 Years.
What is the Average Family Size in Uintah County
Average Family Size in Uintah County is 3.7 People.
What is the Average Household Size in Uintah County
Average Household Size in Uintah County is 3.1 People.
How Large is the Labor Force in Uintah County?
There are 15,572 People in the Labor Forcein in Uintah County.
What is the Percentage of People in the Labor Force in Uintah County?
60.4% of People are in the Labor Force in Uintah County.
What is the Unemployment Rate in Uintah County?
Unemployment Rate in Uintah County is 6.3%.