Orem, UT Map & Demographics
Orem Map
Orem Overview
$32,143
PER CAPITA INCOME
$84,323
AVG FAMILY INCOME
$77,568
AVG HOUSEHOLD INCOME
40.5%
WAGE / INCOME GAP [ % ]
59.5¢/ $1
WAGE / INCOME GAP [ $ ]
$10,128
FAMILY INCOME DEFICIT
0.43
INEQUALITY / GINI INDEX
97,100
TOTAL POPULATION
49,279
MALE POPULATION
47,821
FEMALE POPULATION
103.05
MALES / 100 FEMALES
97.04
FEMALES / 100 MALES
26.8
MEDIAN AGE
3.5
AVG FAMILY SIZE
3.1
AVG HOUSEHOLD SIZE
52,609
LABOR FORCE [ PEOPLE ]
71.3%
PERCENT IN LABOR FORCE
3.4%
UNEMPLOYMENT RATE
Orem Area Codes
Income in Orem
Income Overview in Orem
Per Capita Income in Orem is $32,143, while median incomes of families and households are $84,323 and $77,568 respectively.
| Characteristic | Number | Measure |
| Per Capita Income | 97,100 | $32,143 |
| Median Family Income | 22,885 | $84,323 |
| Mean Family Income | 22,885 | $110,326 |
| Median Household Income | 30,239 | $77,568 |
| Mean Household Income | 30,239 | $101,366 |
| Income Deficit | 22,885 | $10,128 |
| Wage / Income Gap (%) | 97,100 | 40.54% |
| Wage / Income Gap ($) | 97,100 | 59.46¢ per $1 |
| Gini / Inequality Index | 97,100 | 0.43 |
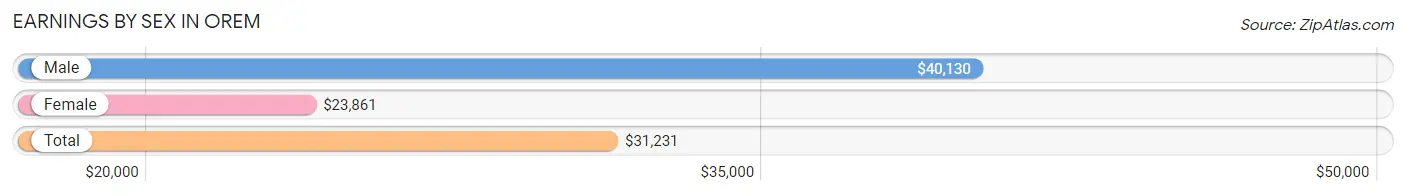
Earnings by Sex in Orem
Average Earnings in Orem are $31,231, $40,130 for men and $23,861 for women, a difference of 40.5%.
| Sex | Number | Average Earnings |
| Male | 30,670 (55.0%) | $40,130 |
| Female | 25,047 (45.0%) | $23,861 |
| Total | 55,717 (100.0%) | $31,231 |
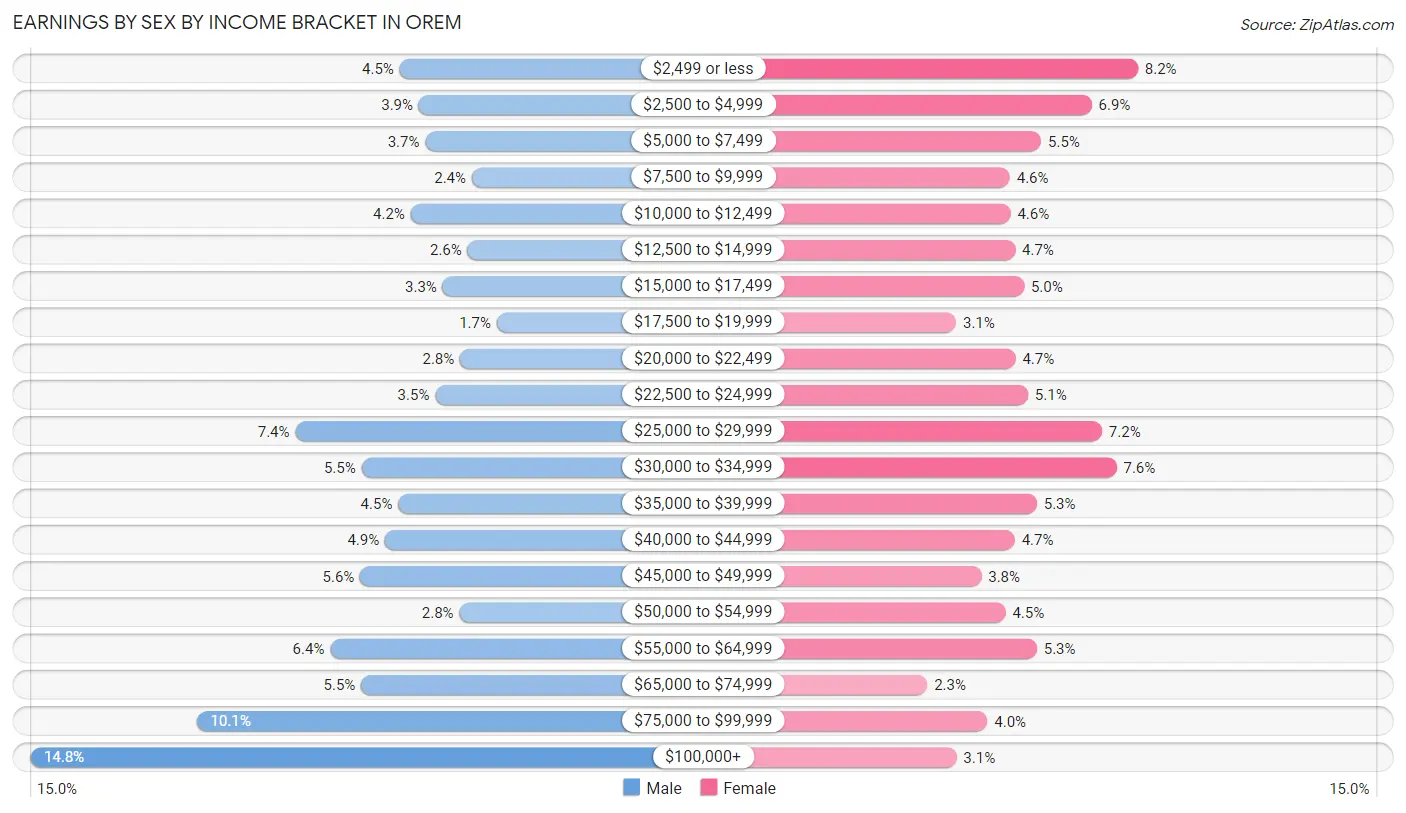
Earnings by Sex by Income Bracket in Orem
The most common earnings brackets in Orem are $100,000+ for men (4,545 | 14.8%) and $2,499 or less for women (2,049 | 8.2%).
| Income | Male | Female |
| $2,499 or less | 1,367 (4.5%) | 2,049 (8.2%) |
| $2,500 to $4,999 | 1,201 (3.9%) | 1,724 (6.9%) |
| $5,000 to $7,499 | 1,147 (3.7%) | 1,368 (5.5%) |
| $7,500 to $9,999 | 744 (2.4%) | 1,146 (4.6%) |
| $10,000 to $12,499 | 1,273 (4.2%) | 1,152 (4.6%) |
| $12,500 to $14,999 | 783 (2.5%) | 1,184 (4.7%) |
| $15,000 to $17,499 | 997 (3.3%) | 1,248 (5.0%) |
| $17,500 to $19,999 | 532 (1.7%) | 770 (3.1%) |
| $20,000 to $22,499 | 845 (2.8%) | 1,188 (4.7%) |
| $22,500 to $24,999 | 1,062 (3.5%) | 1,276 (5.1%) |
| $25,000 to $29,999 | 2,268 (7.4%) | 1,795 (7.2%) |
| $30,000 to $34,999 | 1,697 (5.5%) | 1,898 (7.6%) |
| $35,000 to $39,999 | 1,379 (4.5%) | 1,337 (5.3%) |
| $40,000 to $44,999 | 1,494 (4.9%) | 1,183 (4.7%) |
| $45,000 to $49,999 | 1,708 (5.6%) | 948 (3.8%) |
| $50,000 to $54,999 | 854 (2.8%) | 1,117 (4.5%) |
| $55,000 to $64,999 | 1,966 (6.4%) | 1,337 (5.3%) |
| $65,000 to $74,999 | 1,699 (5.5%) | 565 (2.3%) |
| $75,000 to $99,999 | 3,109 (10.1%) | 990 (4.0%) |
| $100,000+ | 4,545 (14.8%) | 772 (3.1%) |
| Total | 30,670 (100.0%) | 25,047 (100.0%) |
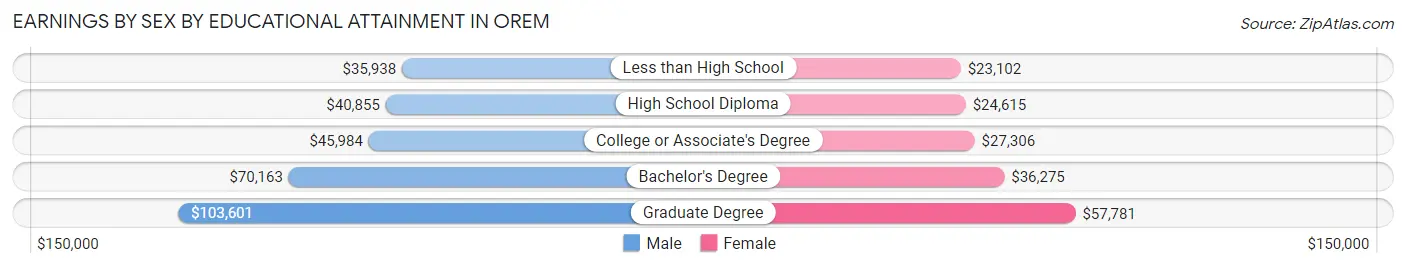
Earnings by Sex by Educational Attainment in Orem
Average earnings in Orem are $55,949 for men and $31,088 for women, a difference of 44.4%. Men with an educational attainment of graduate degree enjoy the highest average annual earnings of $103,601, while those with less than high school education earn the least with $35,938. Women with an educational attainment of graduate degree earn the most with the average annual earnings of $57,781, while those with less than high school education have the smallest earnings of $23,102.
| Educational Attainment | Male Income | Female Income |
| Less than High School | $35,938 | $23,102 |
| High School Diploma | $40,855 | $24,615 |
| College or Associate's Degree | $45,984 | $27,306 |
| Bachelor's Degree | $70,163 | $36,275 |
| Graduate Degree | $103,601 | $57,781 |
| Total | $55,949 | $31,088 |
Family Income in Orem
Family Income Brackets in Orem
According to the Orem family income data, there are 4,897 families falling into the $100,000 to $149,999 income range, which is the most common income bracket and makes up 21.4% of all families. Conversely, the $10,000 to $14,999 income bracket is the least frequent group with only 275 families (1.2%) belonging to this category.
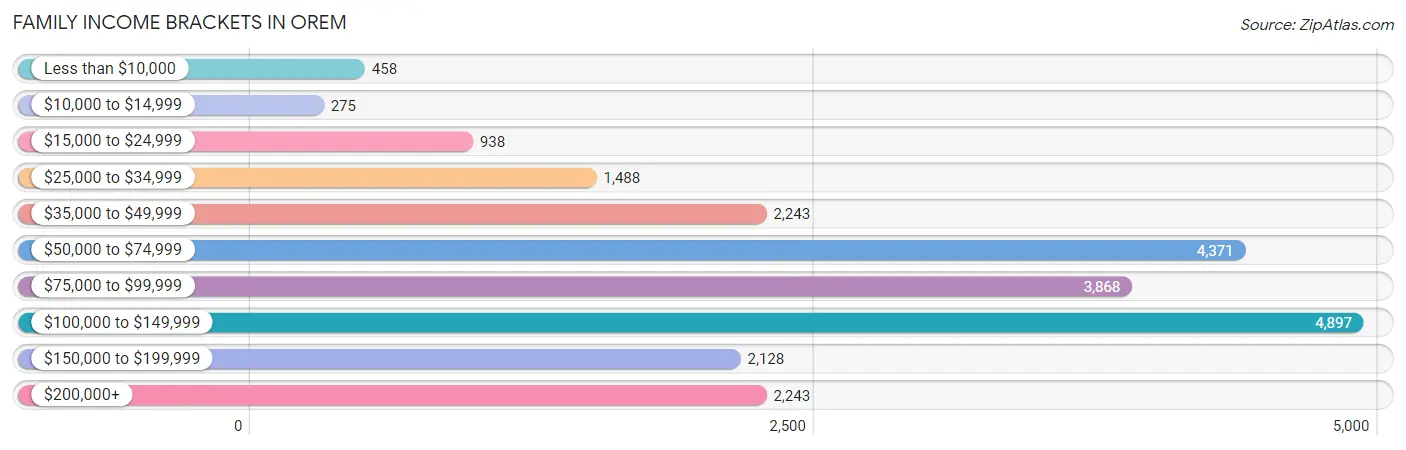
| Income Bracket | # Families | % Families |
| Less than $10,000 | 458 | 2.0% |
| $10,000 to $14,999 | 275 | 1.2% |
| $15,000 to $24,999 | 938 | 4.1% |
| $25,000 to $34,999 | 1,488 | 6.5% |
| $35,000 to $49,999 | 2,243 | 9.8% |
| $50,000 to $74,999 | 4,371 | 19.1% |
| $75,000 to $99,999 | 3,868 | 16.9% |
| $100,000 to $149,999 | 4,897 | 21.4% |
| $150,000 to $199,999 | 2,128 | 9.3% |
| $200,000+ | 2,243 | 9.8% |
Family Income by Famaliy Size in Orem
6-person families (1,610 | 7.0%) account for the highest median family income in Orem with $124,261 per family, while 2-person families (9,373 | 41.0%) have the highest median income of $35,610 per family member.
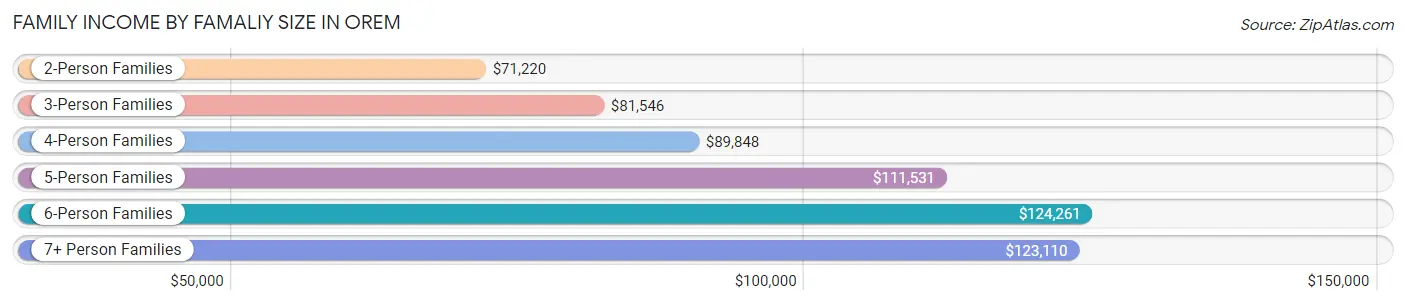
| Income Bracket | # Families | Median Income |
| 2-Person Families | 9,373 (41.0%) | $71,220 |
| 3-Person Families | 4,348 (19.0%) | $81,546 |
| 4-Person Families | 3,610 (15.8%) | $89,848 |
| 5-Person Families | 2,705 (11.8%) | $111,531 |
| 6-Person Families | 1,610 (7.0%) | $124,261 |
| 7+ Person Families | 1,239 (5.4%) | $123,110 |
| Total | 22,885 (100.0%) | $84,323 |
Family Income by Number of Earners in Orem
The median family income in Orem is $84,323, with families comprising 3+ earners (4,023) having the highest median family income of $134,826, while families with no earners (1,885) have the lowest median family income of $58,608, accounting for 17.6% and 8.2% of families, respectively.
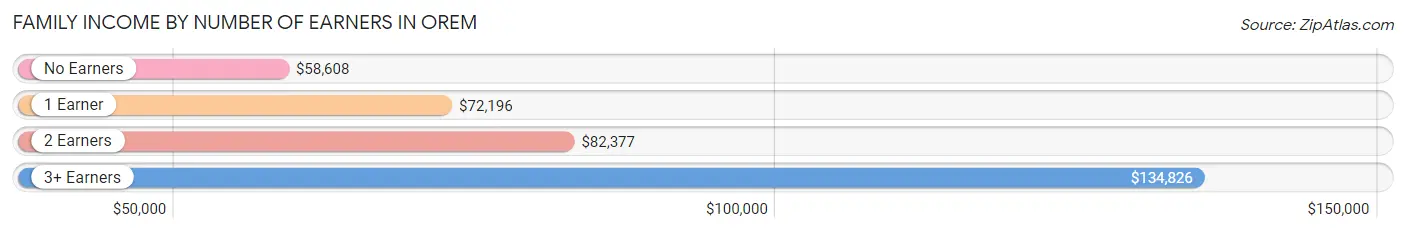
| Number of Earners | # Families | Median Income |
| No Earners | 1,885 (8.2%) | $58,608 |
| 1 Earner | 6,167 (27.0%) | $72,196 |
| 2 Earners | 10,810 (47.2%) | $82,377 |
| 3+ Earners | 4,023 (17.6%) | $134,826 |
| Total | 22,885 (100.0%) | $84,323 |
Household Income in Orem
Household Income Brackets in Orem
With 5,866 households falling in the category, the $50,000 to $74,999 income range is the most frequent in Orem, accounting for 19.4% of all households. In contrast, only 423 households (1.4%) fall into the $10,000 to $14,999 income bracket, making it the least populous group.
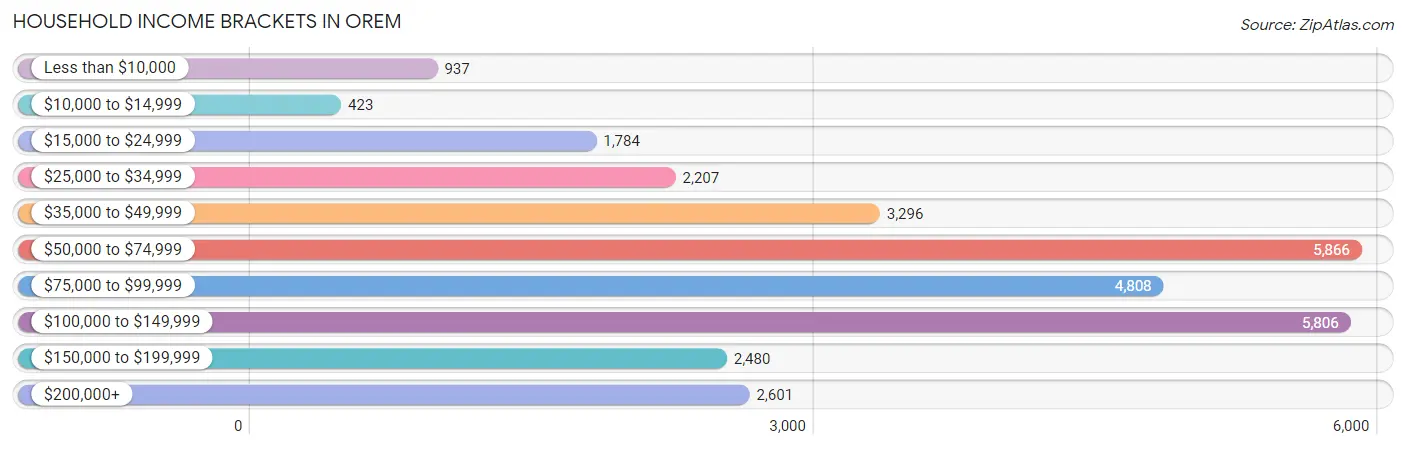
| Income Bracket | # Households | % Households |
| Less than $10,000 | 937 | 3.1% |
| $10,000 to $14,999 | 423 | 1.4% |
| $15,000 to $24,999 | 1,784 | 5.9% |
| $25,000 to $34,999 | 2,207 | 7.3% |
| $35,000 to $49,999 | 3,296 | 10.9% |
| $50,000 to $74,999 | 5,866 | 19.4% |
| $75,000 to $99,999 | 4,808 | 15.9% |
| $100,000 to $149,999 | 5,806 | 19.2% |
| $150,000 to $199,999 | 2,480 | 8.2% |
| $200,000+ | 2,601 | 8.6% |
Household Income by Householder Age in Orem
The median household income in Orem is $77,568, with the highest median household income of $109,626 found in the 45 to 64 years age bracket for the primary householder. A total of 8,167 households (27.0%) fall into this category. Meanwhile, the 15 to 24 years age bracket for the primary householder has the lowest median household income of $50,322, with 4,263 households (14.1%) in this group.
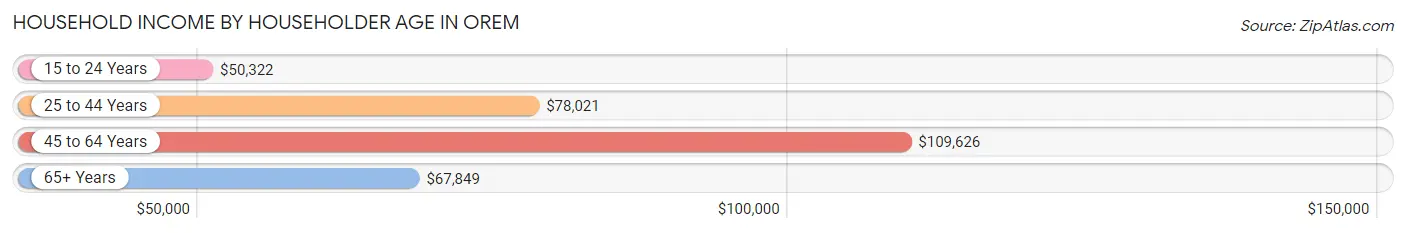
| Income Bracket | # Households | Median Income |
| 15 to 24 Years | 4,263 (14.1%) | $50,322 |
| 25 to 44 Years | 11,907 (39.4%) | $78,021 |
| 45 to 64 Years | 8,167 (27.0%) | $109,626 |
| 65+ Years | 5,902 (19.5%) | $67,849 |
| Total | 30,239 (100.0%) | $77,568 |
Poverty in Orem
Income Below Poverty by Sex and Age in Orem
With 9.7% poverty level for males and 10.0% for females among the residents of Orem, 18 to 24 year old males and 18 to 24 year old females are the most vulnerable to poverty, with 1,673 males (19.3%) and 1,783 females (21.3%) in their respective age groups living below the poverty level.
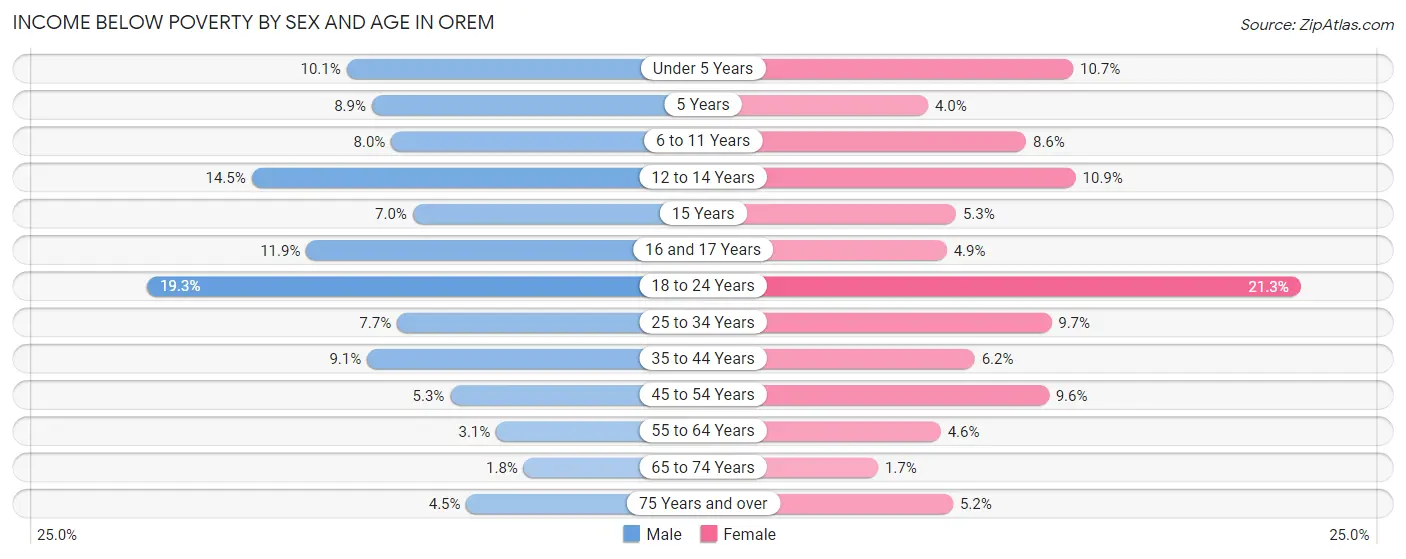
| Age Bracket | Male | Female |
| Under 5 Years | 404 (10.1%) | 366 (10.7%) |
| 5 Years | 53 (8.9%) | 24 (4.0%) |
| 6 to 11 Years | 344 (8.0%) | 346 (8.6%) |
| 12 to 14 Years | 336 (14.5%) | 242 (10.8%) |
| 15 Years | 55 (7.0%) | 44 (5.3%) |
| 16 and 17 Years | 202 (11.9%) | 66 (4.9%) |
| 18 to 24 Years | 1,673 (19.3%) | 1,783 (21.3%) |
| 25 to 34 Years | 644 (7.7%) | 705 (9.7%) |
| 35 to 44 Years | 505 (9.1%) | 330 (6.2%) |
| 45 to 54 Years | 224 (5.2%) | 406 (9.6%) |
| 55 to 64 Years | 100 (3.1%) | 179 (4.6%) |
| 65 to 74 Years | 48 (1.8%) | 49 (1.7%) |
| 75 Years and over | 89 (4.5%) | 119 (5.2%) |
| Total | 4,677 (9.7%) | 4,659 (10.0%) |
Income Above Poverty by Sex and Age in Orem
According to the poverty statistics in Orem, males aged 65 to 74 years and females aged 65 to 74 years are the age groups that are most secure financially, with 98.2% of males and 98.3% of females in these age groups living above the poverty line.
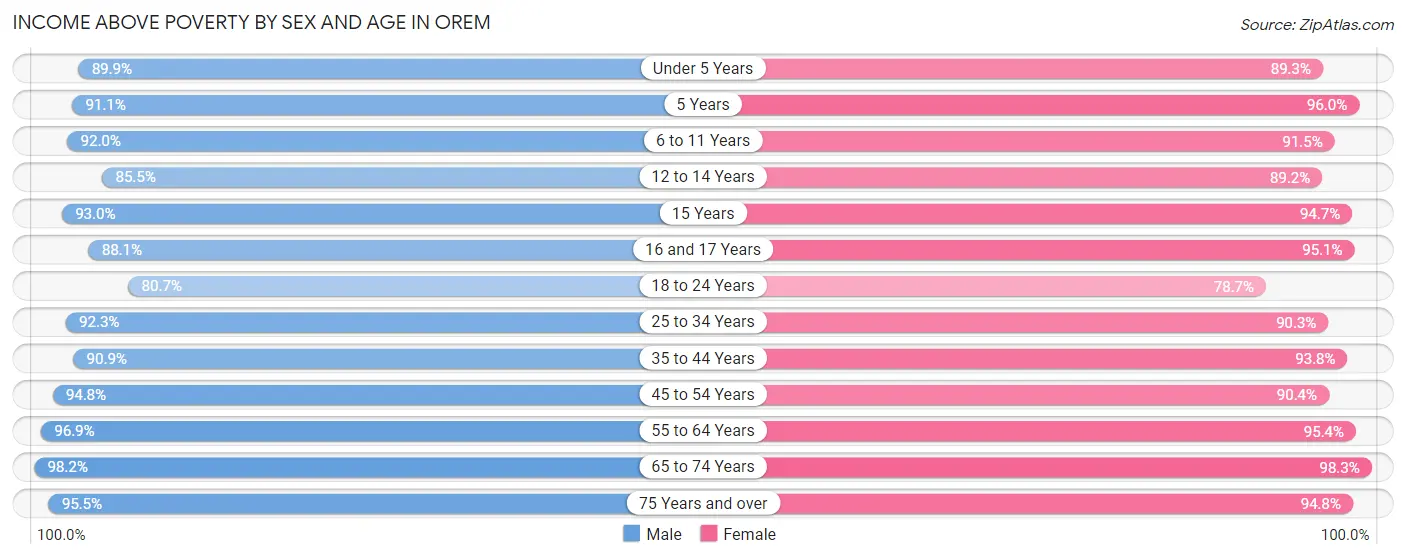
| Age Bracket | Male | Female |
| Under 5 Years | 3,613 (89.9%) | 3,044 (89.3%) |
| 5 Years | 543 (91.1%) | 576 (96.0%) |
| 6 to 11 Years | 3,962 (92.0%) | 3,701 (91.4%) |
| 12 to 14 Years | 1,986 (85.5%) | 1,988 (89.1%) |
| 15 Years | 732 (93.0%) | 786 (94.7%) |
| 16 and 17 Years | 1,491 (88.1%) | 1,289 (95.1%) |
| 18 to 24 Years | 6,986 (80.7%) | 6,593 (78.7%) |
| 25 to 34 Years | 7,702 (92.3%) | 6,547 (90.3%) |
| 35 to 44 Years | 5,036 (90.9%) | 5,015 (93.8%) |
| 45 to 54 Years | 4,039 (94.8%) | 3,821 (90.4%) |
| 55 to 64 Years | 3,106 (96.9%) | 3,723 (95.4%) |
| 65 to 74 Years | 2,560 (98.2%) | 2,861 (98.3%) |
| 75 Years and over | 1,889 (95.5%) | 2,186 (94.8%) |
| Total | 43,645 (90.3%) | 42,130 (90.0%) |
Income Below Poverty Among Married-Couple Families in Orem
The poverty statistics for married-couple families in Orem show that 5.4% or 1,011 of the total 18,747 families live below the poverty line. Families with 1 or 2 children have the highest poverty rate of 8.4%, comprising of 460 families. On the other hand, families with no children have the lowest poverty rate of 3.7%, which includes 363 families.
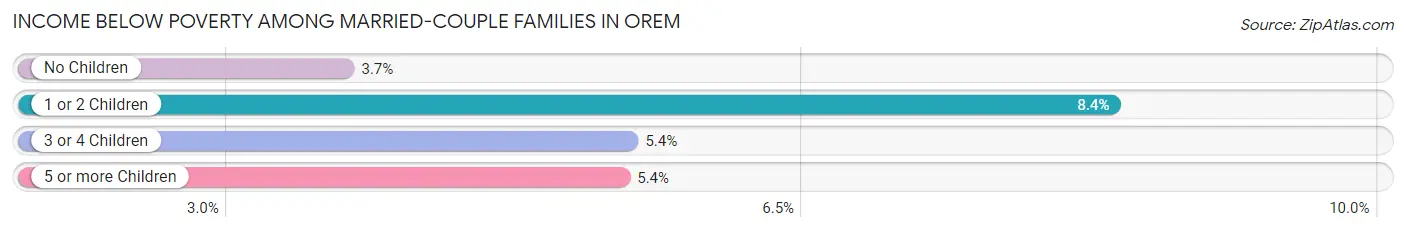
| Children | Above Poverty | Below Poverty |
| No Children | 9,433 (96.3%) | 363 (3.7%) |
| 1 or 2 Children | 5,029 (91.6%) | 460 (8.4%) |
| 3 or 4 Children | 2,607 (94.6%) | 150 (5.4%) |
| 5 or more Children | 667 (94.6%) | 38 (5.4%) |
| Total | 17,736 (94.6%) | 1,011 (5.4%) |
Income Below Poverty Among Single-Parent Households in Orem
According to the poverty data in Orem, 6.6% or 94 single-father households and 16.0% or 432 single-mother households are living below the poverty line. Among single-father households, those with 1 or 2 children have the highest poverty rate, with 67 households (11.7%) experiencing poverty. Likewise, among single-mother households, those with 5 or more children have the highest poverty rate, with 10 households (100.0%) falling below the poverty line.
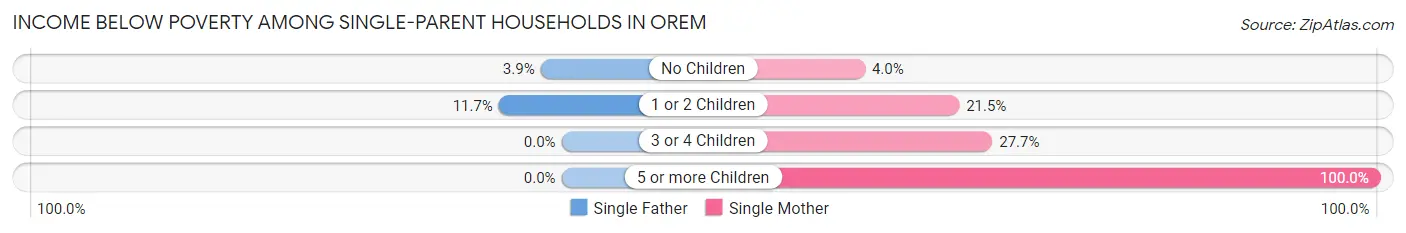
| Children | Single Father | Single Mother |
| No Children | 27 (3.9%) | 40 (4.0%) |
| 1 or 2 Children | 67 (11.7%) | 297 (21.5%) |
| 3 or 4 Children | 0 (0.0%) | 85 (27.7%) |
| 5 or more Children | 0 (0.0%) | 10 (100.0%) |
| Total | 94 (6.6%) | 432 (16.0%) |
Income Below Poverty Among Married-Couple vs Single-Parent Households in Orem
The poverty data for Orem shows that 1,011 of the married-couple family households (5.4%) and 526 of the single-parent households (12.7%) are living below the poverty level. Within the married-couple family households, those with 1 or 2 children have the highest poverty rate, with 460 households (8.4%) falling below the poverty line. Among the single-parent households, those with 5 or more children have the highest poverty rate, with 10 household (100.0%) living below poverty.
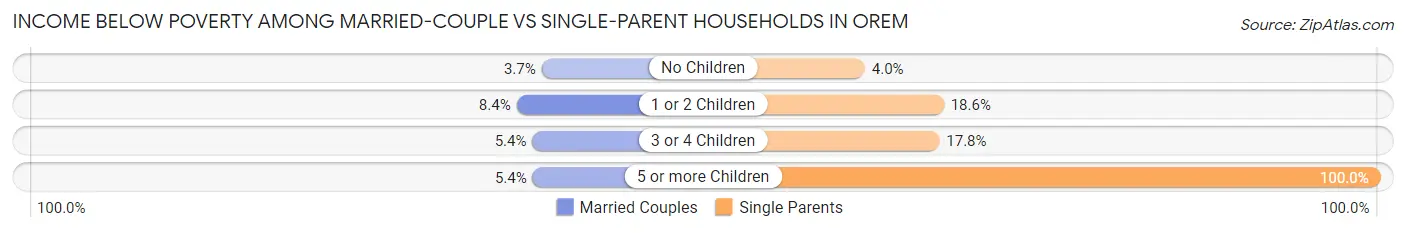
| Children | Married-Couple Families | Single-Parent Households |
| No Children | 363 (3.7%) | 67 (4.0%) |
| 1 or 2 Children | 460 (8.4%) | 364 (18.6%) |
| 3 or 4 Children | 150 (5.4%) | 85 (17.8%) |
| 5 or more Children | 38 (5.4%) | 10 (100.0%) |
| Total | 1,011 (5.4%) | 526 (12.7%) |
Race in Orem
The most populous races in Orem are White / Caucasian (80,704 | 83.1%), Hispanic or Latino (17,113 | 17.6%), and Two or more Races (8,669 | 8.9%).
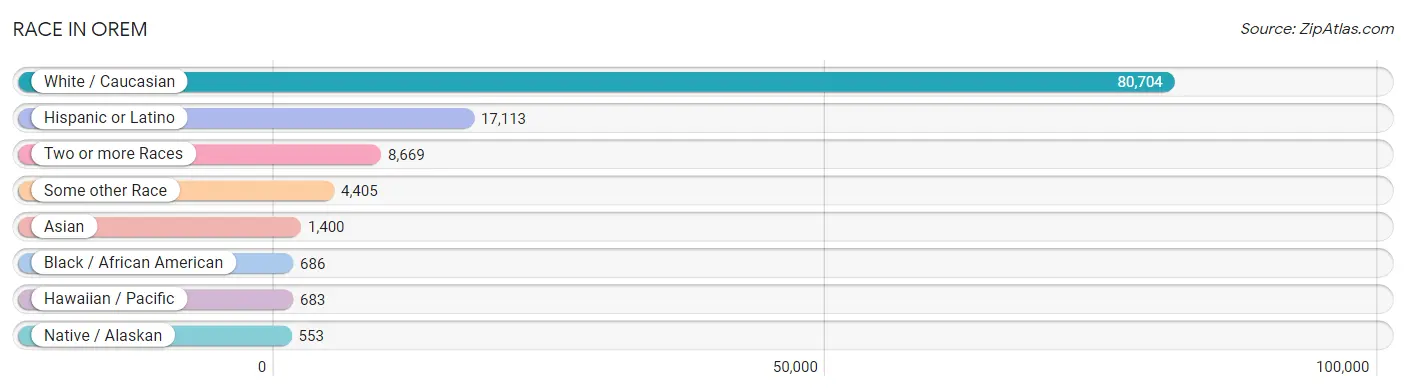
| Race | # Population | % Population |
| Asian | 1,400 | 1.4% |
| Black / African American | 686 | 0.7% |
| Hawaiian / Pacific | 683 | 0.7% |
| Hispanic or Latino | 17,113 | 17.6% |
| Native / Alaskan | 553 | 0.6% |
| White / Caucasian | 80,704 | 83.1% |
| Two or more Races | 8,669 | 8.9% |
| Some other Race | 4,405 | 4.5% |
| Total | 97,100 | 100.0% |
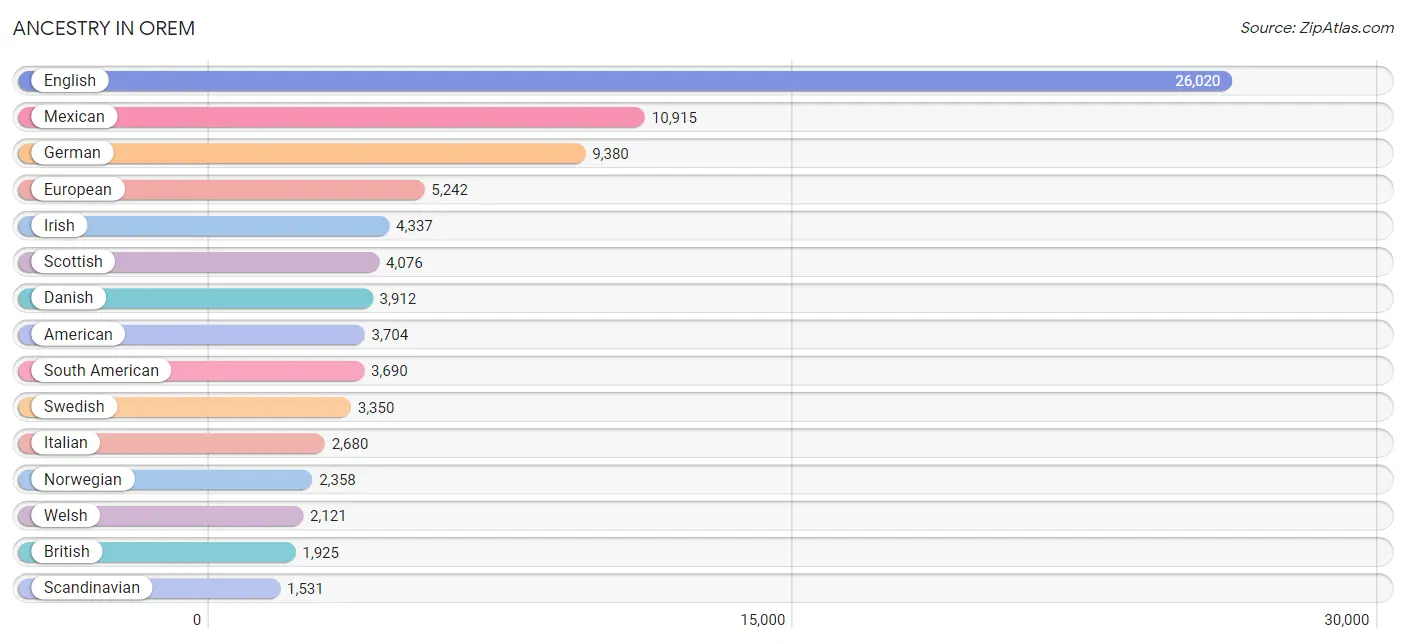
Ancestry in Orem
The most populous ancestries reported in Orem are English (26,020 | 26.8%), Mexican (10,915 | 11.2%), German (9,380 | 9.7%), European (5,242 | 5.4%), and Irish (4,337 | 4.5%), together accounting for 57.6% of all Orem residents.
| Ancestry | # Population | % Population |
| African | 304 | 0.3% |
| American | 3,704 | 3.8% |
| Apache | 5 | 0.0% |
| Arab | 355 | 0.4% |
| Argentinean | 410 | 0.4% |
| Armenian | 101 | 0.1% |
| Assyrian / Chaldean / Syriac | 19 | 0.0% |
| Australian | 66 | 0.1% |
| Austrian | 92 | 0.1% |
| Basque | 60 | 0.1% |
| Belgian | 32 | 0.0% |
| Belizean | 11 | 0.0% |
| Bhutanese | 778 | 0.8% |
| Blackfeet | 36 | 0.0% |
| Bolivian | 87 | 0.1% |
| Brazilian | 414 | 0.4% |
| British | 1,925 | 2.0% |
| British West Indian | 20 | 0.0% |
| Burmese | 563 | 0.6% |
| Cambodian | 19 | 0.0% |
| Canadian | 374 | 0.4% |
| Cape Verdean | 131 | 0.1% |
| Celtic | 14 | 0.0% |
| Central American | 917 | 0.9% |
| Central American Indian | 110 | 0.1% |
| Cherokee | 82 | 0.1% |
| Chickasaw | 6 | 0.0% |
| Chilean | 531 | 0.5% |
| Chippewa | 4 | 0.0% |
| Choctaw | 13 | 0.0% |
| Colombian | 271 | 0.3% |
| Costa Rican | 39 | 0.0% |
| Creek | 9 | 0.0% |
| Croatian | 54 | 0.1% |
| Cuban | 48 | 0.1% |
| Czech | 137 | 0.1% |
| Danish | 3,912 | 4.0% |
| Dominican | 346 | 0.4% |
| Dutch | 1,323 | 1.4% |
| Eastern European | 11 | 0.0% |
| Ecuadorian | 325 | 0.3% |
| English | 26,020 | 26.8% |
| Ethiopian | 16 | 0.0% |
| European | 5,242 | 5.4% |
| Filipino | 39 | 0.0% |
| Finnish | 297 | 0.3% |
| French | 1,442 | 1.5% |
| French Canadian | 298 | 0.3% |
| German | 9,380 | 9.7% |
| Ghanaian | 62 | 0.1% |
| Greek | 358 | 0.4% |
| Guatemalan | 311 | 0.3% |
| Haitian | 181 | 0.2% |
| Honduran | 198 | 0.2% |
| Hopi | 59 | 0.1% |
| Hungarian | 118 | 0.1% |
| Icelander | 64 | 0.1% |
| Indian (Asian) | 849 | 0.9% |
| Indonesian | 49 | 0.1% |
| Iranian | 126 | 0.1% |
| Irish | 4,337 | 4.5% |
| Italian | 2,680 | 2.8% |
| Jamaican | 11 | 0.0% |
| Japanese | 37 | 0.0% |
| Korean | 613 | 0.6% |
| Laotian | 41 | 0.0% |
| Latvian | 9 | 0.0% |
| Lebanese | 26 | 0.0% |
| Lithuanian | 74 | 0.1% |
| Malaysian | 216 | 0.2% |
| Mexican | 10,915 | 11.2% |
| Mexican American Indian | 106 | 0.1% |
| Native Hawaiian | 468 | 0.5% |
| Navajo | 571 | 0.6% |
| New Zealander | 21 | 0.0% |
| Nicaraguan | 48 | 0.1% |
| Nigerian | 185 | 0.2% |
| Northern European | 302 | 0.3% |
| Norwegian | 2,358 | 2.4% |
| Pakistani | 57 | 0.1% |
| Palestinian | 72 | 0.1% |
| Panamanian | 17 | 0.0% |
| Paraguayan | 14 | 0.0% |
| Peruvian | 1,357 | 1.4% |
| Polish | 760 | 0.8% |
| Portuguese | 194 | 0.2% |
| Pueblo | 25 | 0.0% |
| Puerto Rican | 114 | 0.1% |
| Romanian | 2 | 0.0% |
| Russian | 355 | 0.4% |
| Salvadoran | 304 | 0.3% |
| Samoan | 550 | 0.6% |
| Scandinavian | 1,531 | 1.6% |
| Scotch-Irish | 654 | 0.7% |
| Scottish | 4,076 | 4.2% |
| Serbian | 9 | 0.0% |
| Sioux | 108 | 0.1% |
| Slovak | 43 | 0.0% |
| South African | 60 | 0.1% |
| South American | 3,690 | 3.8% |
| South American Indian | 93 | 0.1% |
| Spaniard | 285 | 0.3% |
| Spanish | 550 | 0.6% |
| Sri Lankan | 198 | 0.2% |
| Subsaharan African | 882 | 0.9% |
| Swedish | 3,350 | 3.5% |
| Swiss | 977 | 1.0% |
| Thai | 193 | 0.2% |
| Tlingit-Haida | 136 | 0.1% |
| Tongan | 570 | 0.6% |
| Turkish | 52 | 0.1% |
| Ukrainian | 121 | 0.1% |
| Ute | 62 | 0.1% |
| Venezuelan | 695 | 0.7% |
| Vietnamese | 69 | 0.1% |
| Welsh | 2,121 | 2.2% |
| Yugoslavian | 4 | 0.0% | View All 117 Rows |
Immigrants in Orem
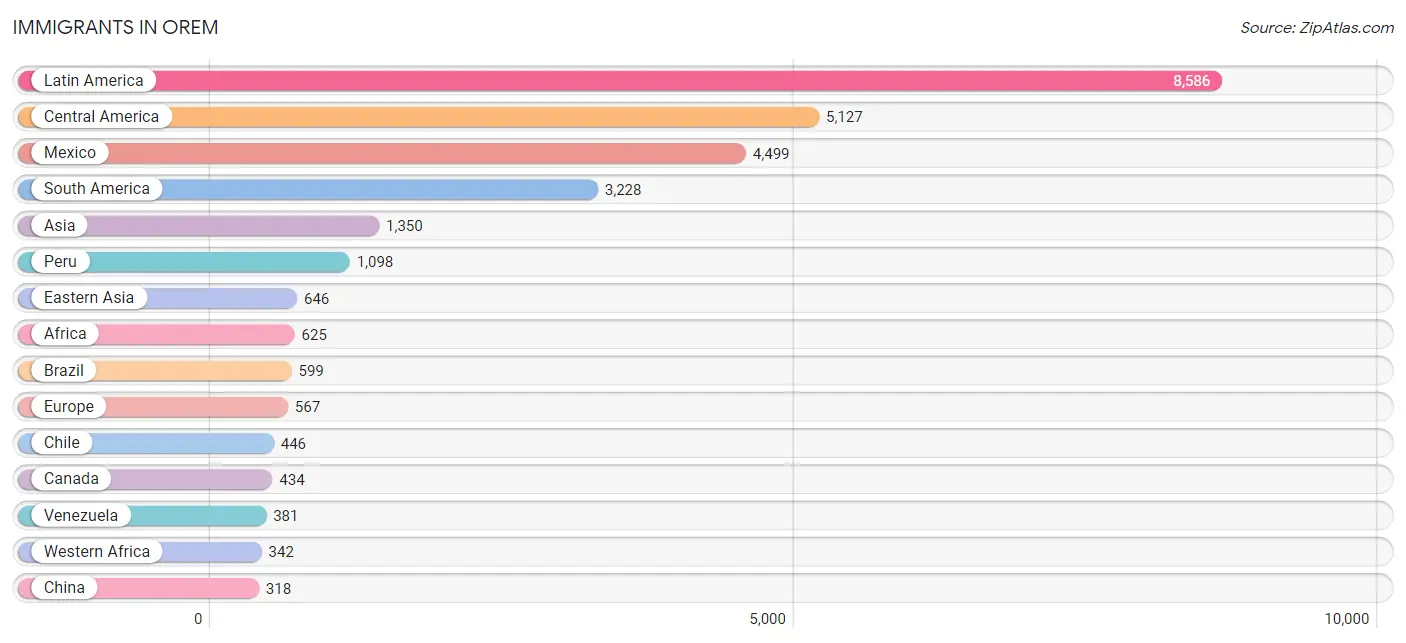
The most numerous immigrant groups reported in Orem came from Latin America (8,586 | 8.8%), Central America (5,127 | 5.3%), Mexico (4,499 | 4.6%), South America (3,228 | 3.3%), and Asia (1,350 | 1.4%), together accounting for 23.5% of all Orem residents.
| Immigration Origin | # Population | % Population |
| Africa | 625 | 0.6% |
| Argentina | 200 | 0.2% |
| Armenia | 33 | 0.0% |
| Asia | 1,350 | 1.4% |
| Australia | 28 | 0.0% |
| Austria | 15 | 0.0% |
| Bangladesh | 34 | 0.0% |
| Bolivia | 72 | 0.1% |
| Brazil | 599 | 0.6% |
| Cabo Verde | 206 | 0.2% |
| Cambodia | 13 | 0.0% |
| Cameroon | 35 | 0.0% |
| Canada | 434 | 0.4% |
| Caribbean | 231 | 0.2% |
| Central America | 5,127 | 5.3% |
| Chile | 446 | 0.5% |
| China | 318 | 0.3% |
| Colombia | 177 | 0.2% |
| Congo | 4 | 0.0% |
| Costa Rica | 39 | 0.0% |
| Cuba | 20 | 0.0% |
| Czechoslovakia | 16 | 0.0% |
| Denmark | 14 | 0.0% |
| Dominican Republic | 151 | 0.2% |
| Eastern Africa | 21 | 0.0% |
| Eastern Asia | 646 | 0.7% |
| Eastern Europe | 115 | 0.1% |
| Ecuador | 227 | 0.2% |
| El Salvador | 94 | 0.1% |
| England | 23 | 0.0% |
| Europe | 567 | 0.6% |
| France | 38 | 0.0% |
| Germany | 80 | 0.1% |
| Ghana | 24 | 0.0% |
| Guatemala | 194 | 0.2% |
| Haiti | 60 | 0.1% |
| Honduras | 250 | 0.3% |
| Hong Kong | 83 | 0.1% |
| India | 99 | 0.1% |
| Indonesia | 19 | 0.0% |
| Iran | 90 | 0.1% |
| Israel | 9 | 0.0% |
| Italy | 22 | 0.0% |
| Japan | 108 | 0.1% |
| Jordan | 43 | 0.0% |
| Kazakhstan | 4 | 0.0% |
| Kenya | 7 | 0.0% |
| Korea | 213 | 0.2% |
| Kuwait | 20 | 0.0% |
| Laos | 73 | 0.1% |
| Latin America | 8,586 | 8.8% |
| Latvia | 4 | 0.0% |
| Malaysia | 5 | 0.0% |
| Mexico | 4,499 | 4.6% |
| Micronesia | 1 | 0.0% |
| Middle Africa | 159 | 0.2% |
| Morocco | 12 | 0.0% |
| Netherlands | 27 | 0.0% |
| Nicaragua | 34 | 0.0% |
| Nigeria | 112 | 0.1% |
| Northern Africa | 15 | 0.0% |
| Northern Europe | 166 | 0.2% |
| Oceania | 133 | 0.1% |
| Panama | 17 | 0.0% |
| Peru | 1,098 | 1.1% |
| Philippines | 84 | 0.1% |
| Poland | 8 | 0.0% |
| Portugal | 20 | 0.0% |
| Russia | 21 | 0.0% |
| Saudi Arabia | 57 | 0.1% |
| Scotland | 6 | 0.0% |
| Singapore | 3 | 0.0% |
| South Africa | 58 | 0.1% |
| South America | 3,228 | 3.3% |
| South Central Asia | 227 | 0.2% |
| South Eastern Asia | 314 | 0.3% |
| Southern Europe | 100 | 0.1% |
| Spain | 58 | 0.1% |
| Sweden | 11 | 0.0% |
| Switzerland | 18 | 0.0% |
| Taiwan | 74 | 0.1% |
| Turkey | 1 | 0.0% |
| Ukraine | 58 | 0.1% |
| Uruguay | 8 | 0.0% |
| Venezuela | 381 | 0.4% |
| Vietnam | 82 | 0.1% |
| Western Africa | 342 | 0.4% |
| Western Asia | 163 | 0.2% |
| Western Europe | 178 | 0.2% |
| Zaire | 120 | 0.1% |
| Zimbabwe | 14 | 0.0% | View All 91 Rows |
Sex and Age in Orem
Sex and Age in Orem
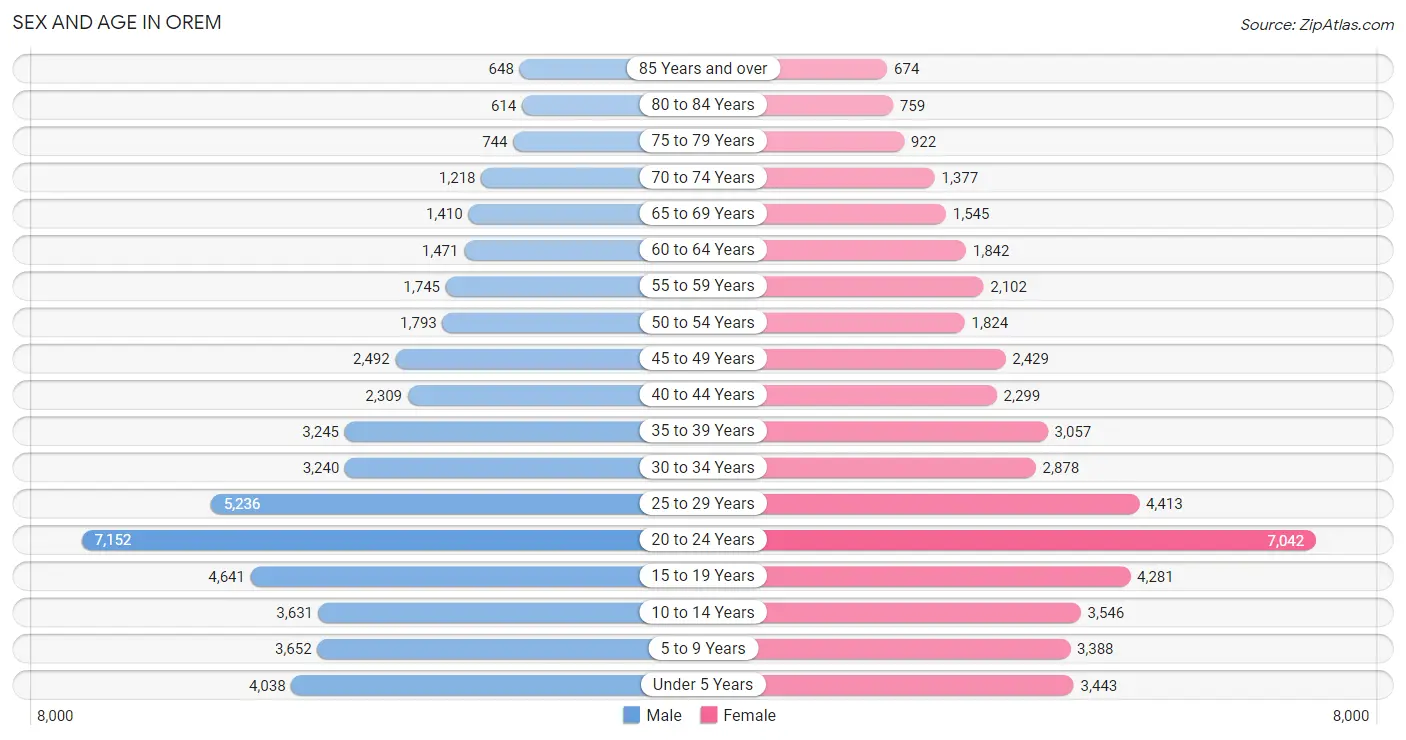
The most populous age groups in Orem are 20 to 24 Years (7,152 | 14.5%) for men and 20 to 24 Years (7,042 | 14.7%) for women.
| Age Bracket | Male | Female |
| Under 5 Years | 4,038 (8.2%) | 3,443 (7.2%) |
| 5 to 9 Years | 3,652 (7.4%) | 3,388 (7.1%) |
| 10 to 14 Years | 3,631 (7.4%) | 3,546 (7.4%) |
| 15 to 19 Years | 4,641 (9.4%) | 4,281 (8.9%) |
| 20 to 24 Years | 7,152 (14.5%) | 7,042 (14.7%) |
| 25 to 29 Years | 5,236 (10.6%) | 4,413 (9.2%) |
| 30 to 34 Years | 3,240 (6.6%) | 2,878 (6.0%) |
| 35 to 39 Years | 3,245 (6.6%) | 3,057 (6.4%) |
| 40 to 44 Years | 2,309 (4.7%) | 2,299 (4.8%) |
| 45 to 49 Years | 2,492 (5.1%) | 2,429 (5.1%) |
| 50 to 54 Years | 1,793 (3.6%) | 1,824 (3.8%) |
| 55 to 59 Years | 1,745 (3.5%) | 2,102 (4.4%) |
| 60 to 64 Years | 1,471 (3.0%) | 1,842 (3.8%) |
| 65 to 69 Years | 1,410 (2.9%) | 1,545 (3.2%) |
| 70 to 74 Years | 1,218 (2.5%) | 1,377 (2.9%) |
| 75 to 79 Years | 744 (1.5%) | 922 (1.9%) |
| 80 to 84 Years | 614 (1.3%) | 759 (1.6%) |
| 85 Years and over | 648 (1.3%) | 674 (1.4%) |
| Total | 49,279 (100.0%) | 47,821 (100.0%) |
Families and Households in Orem
Median Family Size in Orem
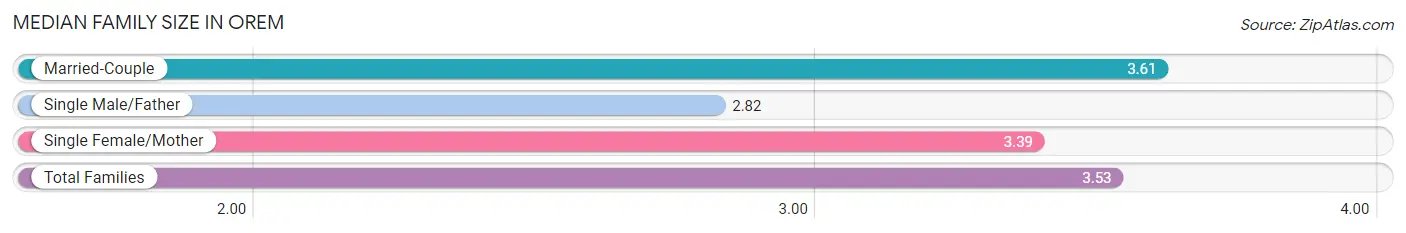
The median family size in Orem is 3.53 persons per family, with married-couple families (18,747 | 81.9%) accounting for the largest median family size of 3.61 persons per family. On the other hand, single male/father families (1,433 | 6.3%) represent the smallest median family size with 2.82 persons per family.
| Family Type | # Families | Family Size |
| Married-Couple | 18,747 (81.9%) | 3.61 |
| Single Male/Father | 1,433 (6.3%) | 2.82 |
| Single Female/Mother | 2,705 (11.8%) | 3.39 |
| Total Families | 22,885 (100.0%) | 3.53 |
Median Household Size in Orem
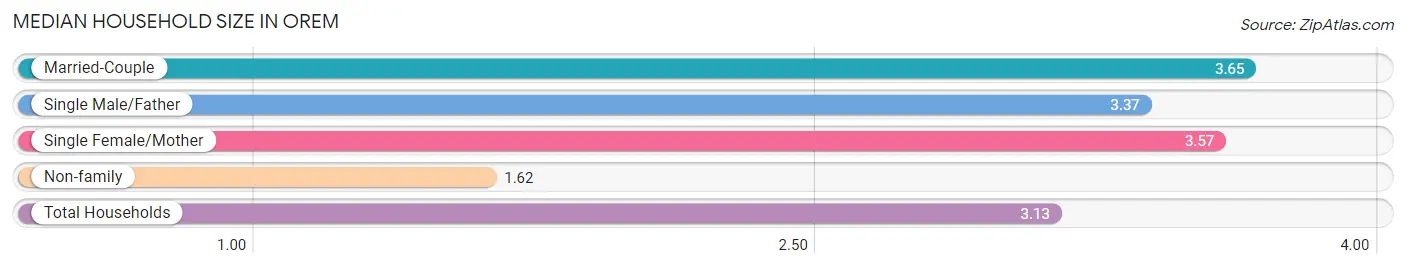
The median household size in Orem is 3.13 persons per household, with married-couple households (18,747 | 62.0%) accounting for the largest median household size of 3.65 persons per household. non-family households (7,354 | 24.3%) represent the smallest median household size with 1.62 persons per household.
| Household Type | # Households | Household Size |
| Married-Couple | 18,747 (62.0%) | 3.65 |
| Single Male/Father | 1,433 (4.7%) | 3.37 |
| Single Female/Mother | 2,705 (8.9%) | 3.57 |
| Non-family | 7,354 (24.3%) | 1.62 |
| Total Households | 30,239 (100.0%) | 3.13 |
Household Size by Marriage Status in Orem
Out of a total of 30,239 households in Orem, 22,885 (75.7%) are family households, while 7,354 (24.3%) are nonfamily households. The most numerous type of family households are 2-person households, comprising 8,662, and the most common type of nonfamily households are 1-person households, comprising 4,770.
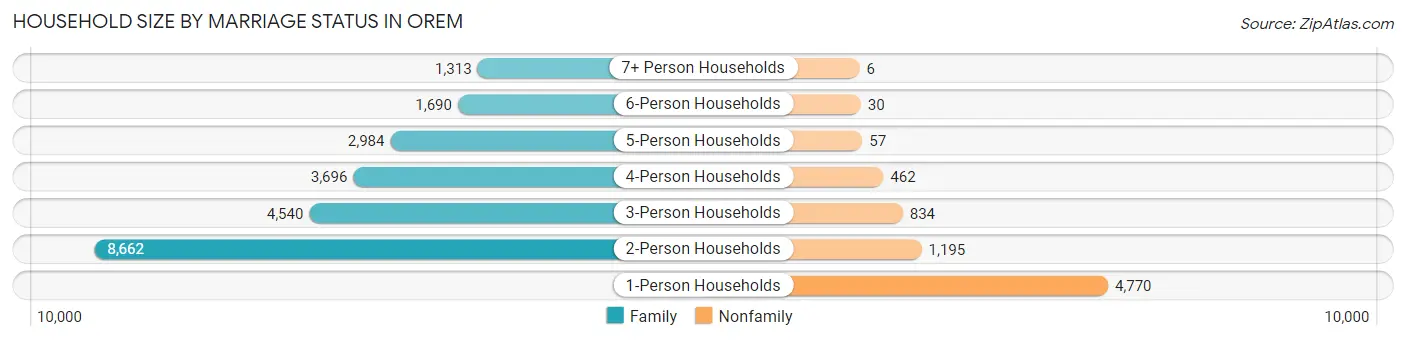
| Household Size | Family Households | Nonfamily Households |
| 1-Person Households | - | 4,770 (15.8%) |
| 2-Person Households | 8,662 (28.6%) | 1,195 (4.0%) |
| 3-Person Households | 4,540 (15.0%) | 834 (2.8%) |
| 4-Person Households | 3,696 (12.2%) | 462 (1.5%) |
| 5-Person Households | 2,984 (9.9%) | 57 (0.2%) |
| 6-Person Households | 1,690 (5.6%) | 30 (0.1%) |
| 7+ Person Households | 1,313 (4.3%) | 6 (0.0%) |
| Total | 22,885 (75.7%) | 7,354 (24.3%) |
Female Fertility in Orem
Fertility by Age in Orem
Average fertility rate in Orem is 71.0 births per 1,000 women. Women in the age bracket of 20 to 34 years have the highest fertility rate with 106.0 births per 1,000 women. Women in the age bracket of 20 to 34 years acount for 80.1% of all women with births.
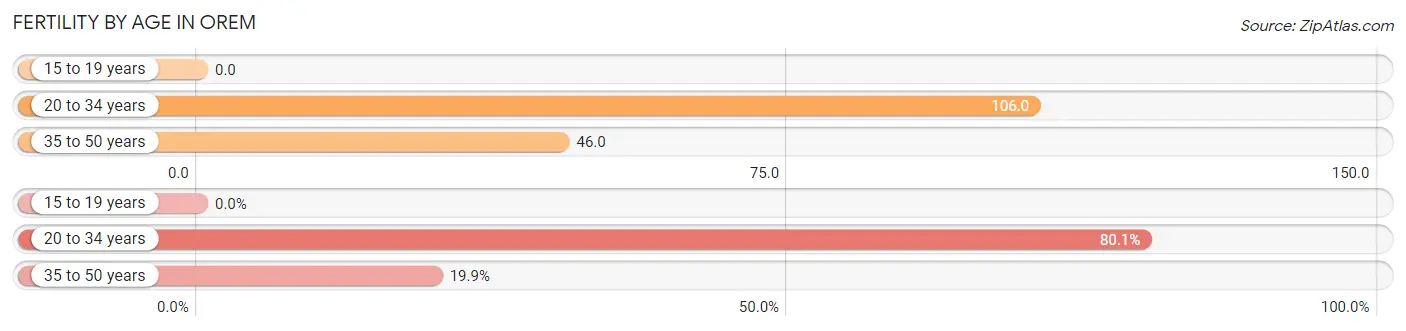
| Age Bracket | Women with Births | Births / 1,000 Women |
| 15 to 19 years | 0 (0.0%) | 0.0 |
| 20 to 34 years | 1,521 (80.1%) | 106.0 |
| 35 to 50 years | 378 (19.9%) | 46.0 |
| Total | 1,899 (100.0%) | 71.0 |
Fertility by Age by Marriage Status in Orem
88.5% of women with births (1,899) in Orem are married. The highest percentage of unmarried women with births falls into 20 to 34 years age bracket with 13.8% of them unmarried at the time of birth, while the lowest percentage of unmarried women with births belong to 35 to 50 years age bracket with 2.4% of them unmarried.
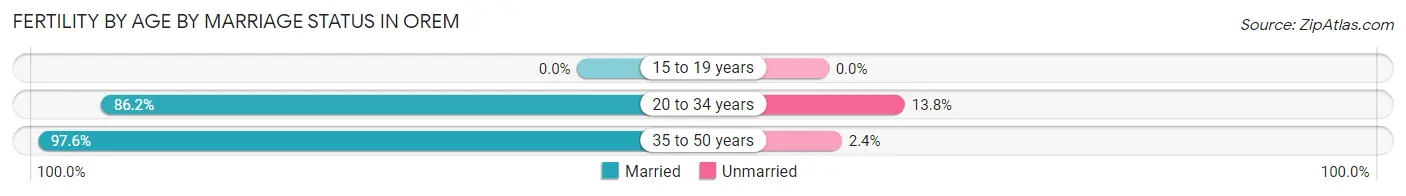
| Age Bracket | Married | Unmarried |
| 15 to 19 years | 0 (0.0%) | 0 (0.0%) |
| 20 to 34 years | 1,311 (86.2%) | 210 (13.8%) |
| 35 to 50 years | 369 (97.6%) | 9 (2.4%) |
| Total | 1,681 (88.5%) | 218 (11.5%) |
Fertility by Education in Orem
Average fertility rate in Orem is 71.0 births per 1,000 women. Women with the education attainment of graduate degree have the highest fertility rate of 131.0 births per 1,000 women, while women with the education attainment of less than high school have the lowest fertility at 20.0 births per 1,000 women. Women with the education attainment of college or associate's degree represent 34.7% of all women with births.
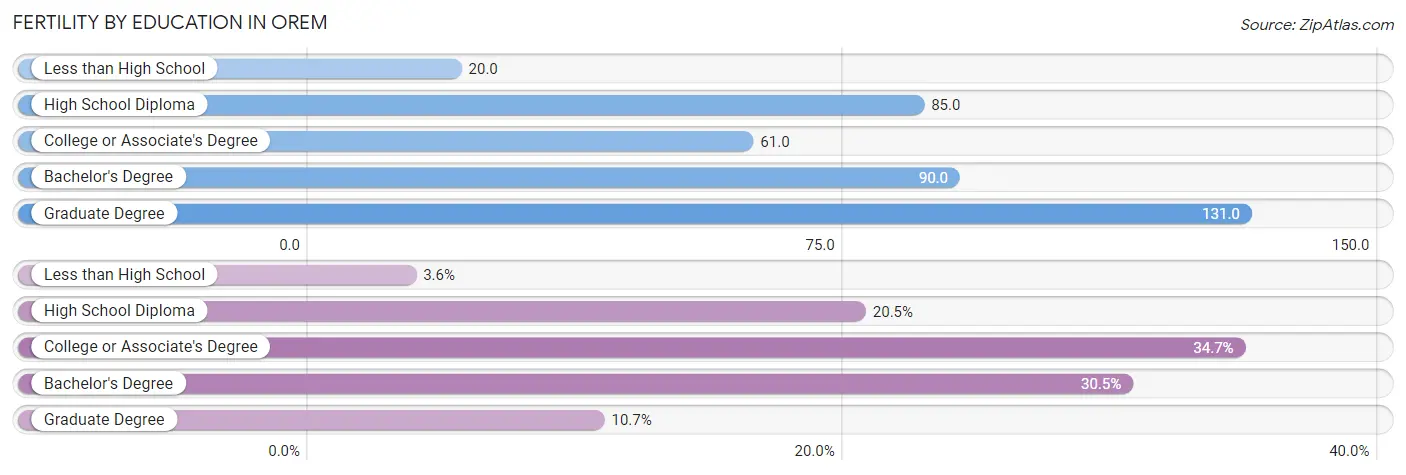
| Educational Attainment | Women with Births | Births / 1,000 Women |
| Less than High School | 69 (3.6%) | 20.0 |
| High School Diploma | 389 (20.5%) | 85.0 |
| College or Associate's Degree | 659 (34.7%) | 61.0 |
| Bachelor's Degree | 579 (30.5%) | 90.0 |
| Graduate Degree | 203 (10.7%) | 131.0 |
| Total | 1,899 (100.0%) | 71.0 |
Fertility by Education by Marriage Status in Orem
11.5% of women with births in Orem are unmarried. Women with the educational attainment of bachelor's degree are most likely to be married with 100.0% of them married at childbirth, while women with the educational attainment of less than high school are least likely to be married with 50.7% of them unmarried at childbirth.
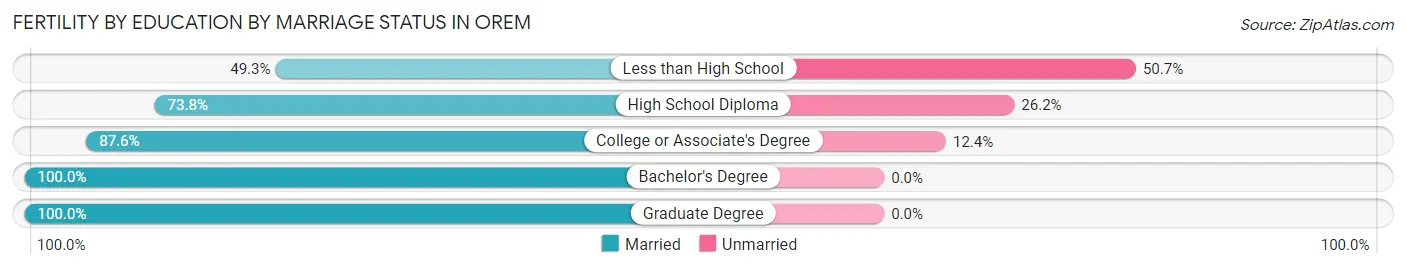
| Educational Attainment | Married | Unmarried |
| Less than High School | 34 (49.3%) | 35 (50.7%) |
| High School Diploma | 287 (73.8%) | 102 (26.2%) |
| College or Associate's Degree | 577 (87.6%) | 82 (12.4%) |
| Bachelor's Degree | 579 (100.0%) | 0 (0.0%) |
| Graduate Degree | 203 (100.0%) | 0 (0.0%) |
| Total | 1,681 (88.5%) | 218 (11.5%) |
Employment Characteristics in Orem
Employment by Class of Employer in Orem
Among the 49,825 employed individuals in Orem, private company employees (35,931 | 72.1%), not-for-profit organizations (4,322 | 8.7%), and self-employed (not incorporated) (2,556 | 5.1%) make up the most common classes of employment.
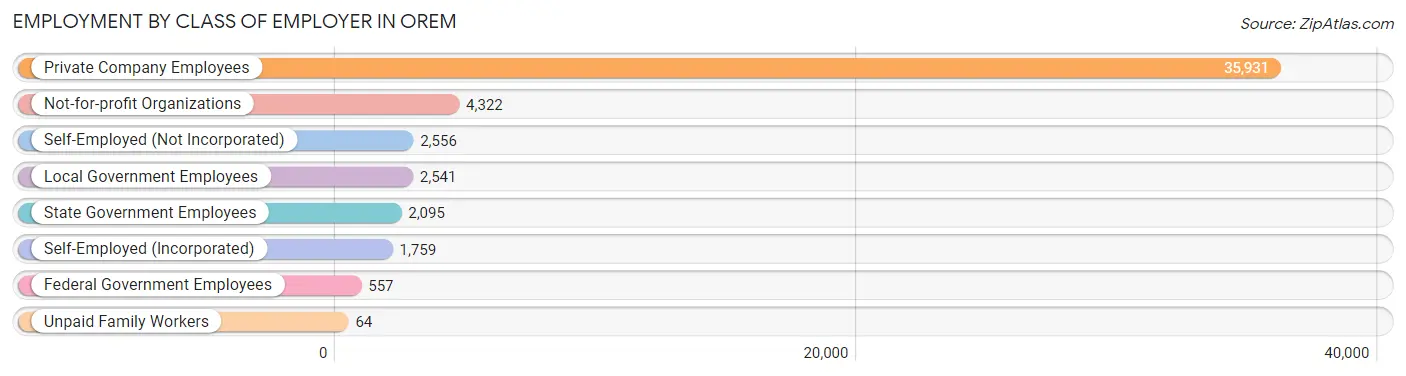
| Employer Class | # Employees | % Employees |
| Private Company Employees | 35,931 | 72.1% |
| Self-Employed (Incorporated) | 1,759 | 3.5% |
| Self-Employed (Not Incorporated) | 2,556 | 5.1% |
| Not-for-profit Organizations | 4,322 | 8.7% |
| Local Government Employees | 2,541 | 5.1% |
| State Government Employees | 2,095 | 4.2% |
| Federal Government Employees | 557 | 1.1% |
| Unpaid Family Workers | 64 | 0.1% |
| Total | 49,825 | 100.0% |
Employment Status by Age in Orem
According to the labor force statistics for Orem, out of the total population over 16 years of age (73,785), 71.3% or 52,609 individuals are in the labor force, with 3.4% or 1,789 of them unemployed. The age group with the highest labor force participation rate is 45 to 54 years, with 84.0% or 7,172 individuals in the labor force. Within the labor force, the 16 to 19 years age range has the highest percentage of unemployed individuals, with 14.7% or 666 of them being unemployed.
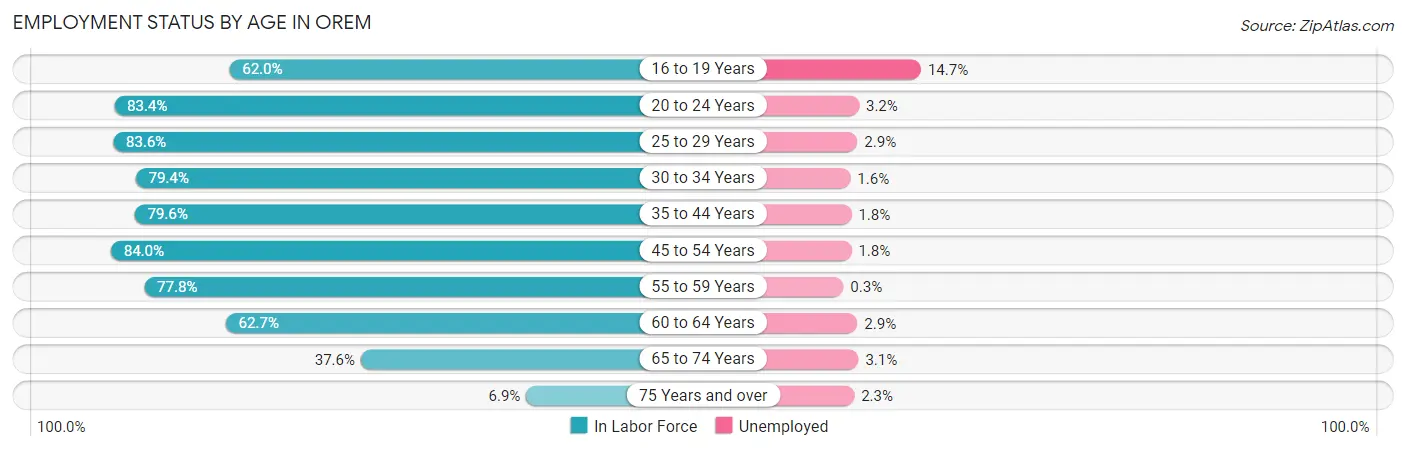
| Age Bracket | In Labor Force | Unemployed |
| 16 to 19 Years | 4,529 (62.0%) | 666 (14.7%) |
| 20 to 24 Years | 11,838 (83.4%) | 379 (3.2%) |
| 25 to 29 Years | 8,067 (83.6%) | 234 (2.9%) |
| 30 to 34 Years | 4,858 (79.4%) | 78 (1.6%) |
| 35 to 44 Years | 8,684 (79.6%) | 156 (1.8%) |
| 45 to 54 Years | 7,172 (84.0%) | 129 (1.8%) |
| 55 to 59 Years | 2,993 (77.8%) | 9 (0.3%) |
| 60 to 64 Years | 2,077 (62.7%) | 60 (2.9%) |
| 65 to 74 Years | 2,087 (37.6%) | 65 (3.1%) |
| 75 Years and over | 301 (6.9%) | 7 (2.3%) |
| Total | 52,609 (71.3%) | 1,789 (3.4%) |
Employment Status by Educational Attainment in Orem
According to labor force statistics for Orem, 79.9% of individuals (33,858) out of the total population between 25 and 64 years of age (42,375) are in the labor force, with 2.0% or 677 of them being unemployed. The group with the highest labor force participation rate are those with the educational attainment of bachelor's degree or higher, with 82.7% or 14,677 individuals in the labor force. Within the labor force, individuals with less than high school education have the highest percentage of unemployment, with 4.3% or 84 of them being unemployed.
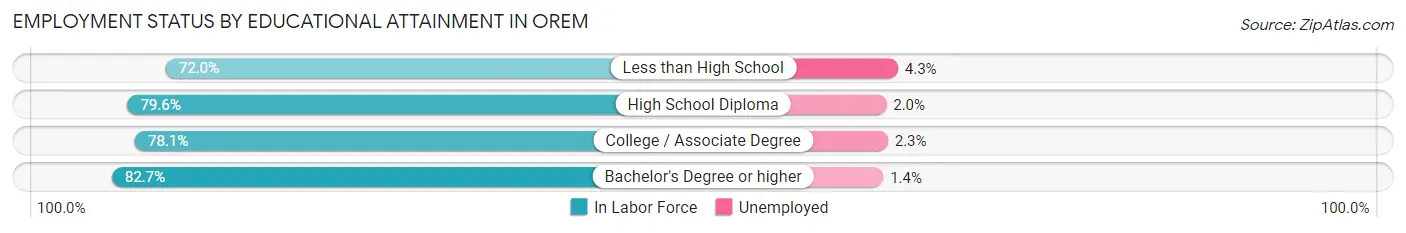
| Educational Attainment | In Labor Force | Unemployed |
| Less than High School | 1,954 (72.0%) | 117 (4.3%) |
| High School Diploma | 5,370 (79.6%) | 135 (2.0%) |
| College / Associate Degree | 11,846 (78.1%) | 349 (2.3%) |
| Bachelor's Degree or higher | 14,677 (82.7%) | 248 (1.4%) |
| Total | 33,858 (79.9%) | 848 (2.0%) |
Employment Occupations by Sex in Orem
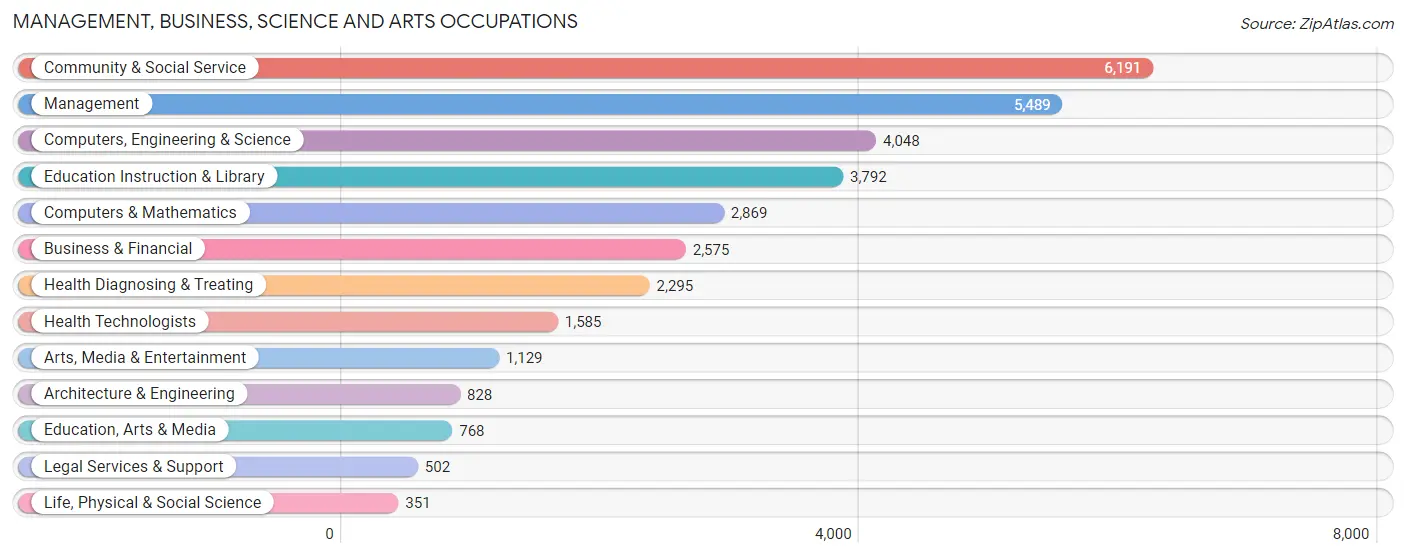
Management, Business, Science and Arts Occupations
The most common Management, Business, Science and Arts occupations in Orem are Community & Social Service (6,191 | 12.2%), Management (5,489 | 10.8%), Computers, Engineering & Science (4,048 | 8.0%), Education Instruction & Library (3,792 | 7.5%), and Computers & Mathematics (2,869 | 5.7%).
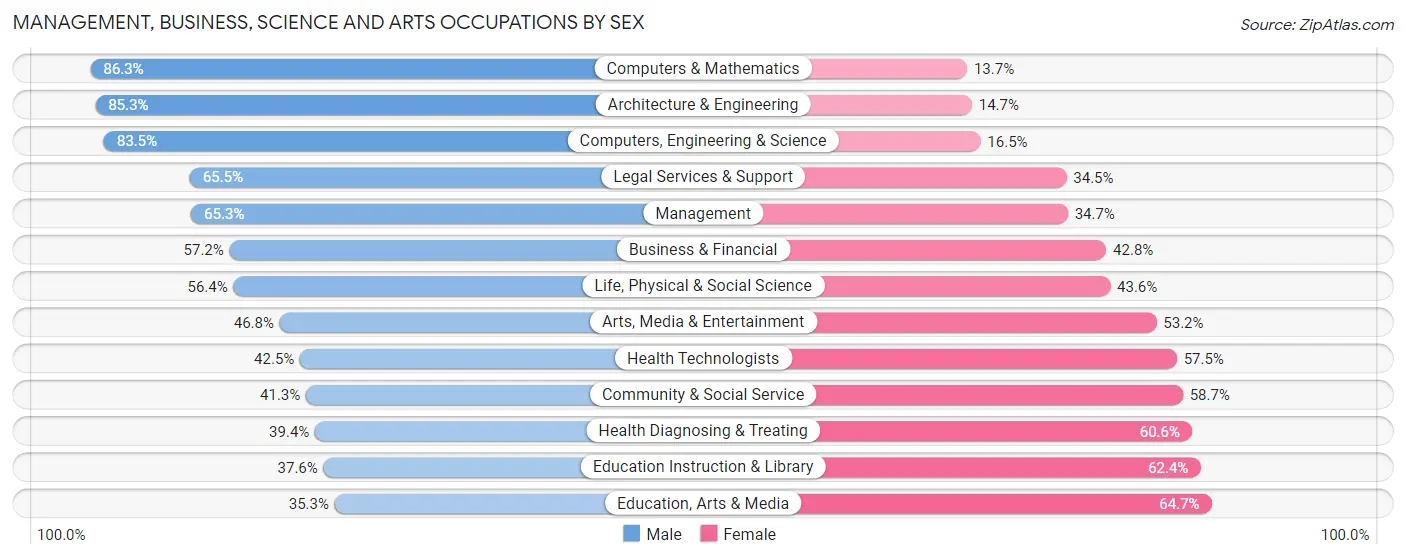
Management, Business, Science and Arts Occupations by Sex
Within the Management, Business, Science and Arts occupations in Orem, the most male-oriented occupations are Computers & Mathematics (86.3%), Architecture & Engineering (85.3%), and Computers, Engineering & Science (83.5%), while the most female-oriented occupations are Education, Arts & Media (64.7%), Education Instruction & Library (62.4%), and Health Diagnosing & Treating (60.6%).
| Occupation | Male | Female |
| Management | 3,582 (65.3%) | 1,907 (34.7%) |
| Business & Financial | 1,474 (57.2%) | 1,101 (42.8%) |
| Computers, Engineering & Science | 3,379 (83.5%) | 669 (16.5%) |
| Computers & Mathematics | 2,475 (86.3%) | 394 (13.7%) |
| Architecture & Engineering | 706 (85.3%) | 122 (14.7%) |
| Life, Physical & Social Science | 198 (56.4%) | 153 (43.6%) |
| Community & Social Service | 2,555 (41.3%) | 3,636 (58.7%) |
| Education, Arts & Media | 271 (35.3%) | 497 (64.7%) |
| Legal Services & Support | 329 (65.5%) | 173 (34.5%) |
| Education Instruction & Library | 1,427 (37.6%) | 2,365 (62.4%) |
| Arts, Media & Entertainment | 528 (46.8%) | 601 (53.2%) |
| Health Diagnosing & Treating | 904 (39.4%) | 1,391 (60.6%) |
| Health Technologists | 674 (42.5%) | 911 (57.5%) |
| Total (Category) | 11,894 (57.7%) | 8,704 (42.3%) |
| Total (Overall) | 28,372 (55.9%) | 22,373 (44.1%) |
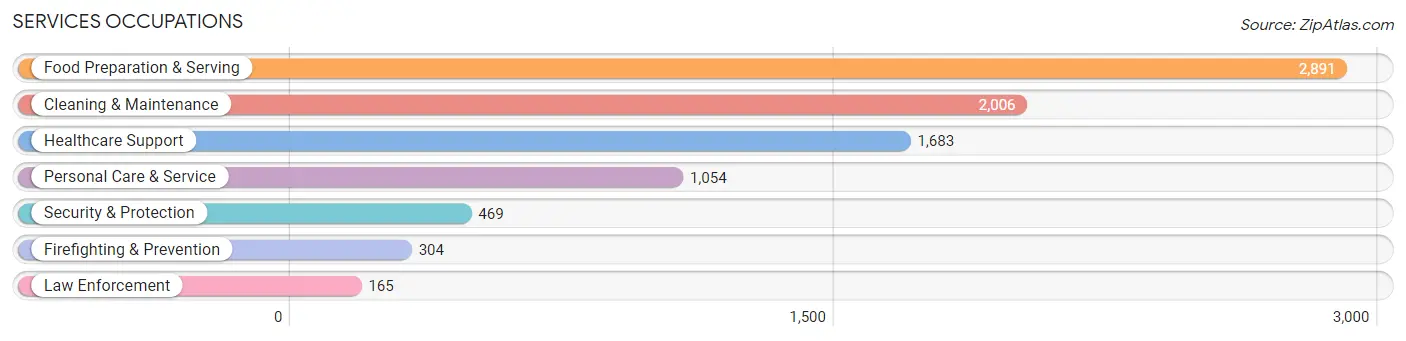
Services Occupations
The most common Services occupations in Orem are Food Preparation & Serving (2,891 | 5.7%), Cleaning & Maintenance (2,006 | 4.0%), Healthcare Support (1,683 | 3.3%), Personal Care & Service (1,054 | 2.1%), and Security & Protection (469 | 0.9%).
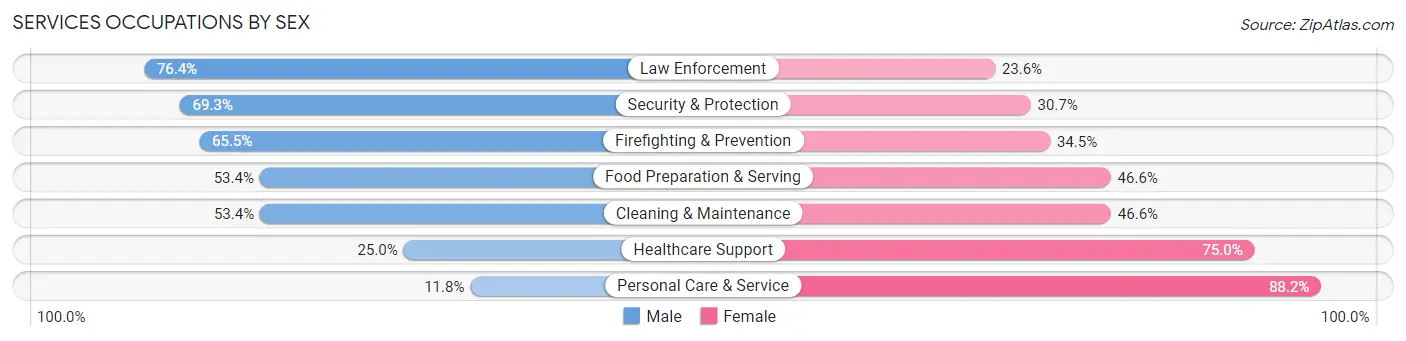
Services Occupations by Sex
Within the Services occupations in Orem, the most male-oriented occupations are Law Enforcement (76.4%), Security & Protection (69.3%), and Firefighting & Prevention (65.5%), while the most female-oriented occupations are Personal Care & Service (88.2%), Healthcare Support (75.0%), and Cleaning & Maintenance (46.6%).
| Occupation | Male | Female |
| Healthcare Support | 420 (25.0%) | 1,263 (75.0%) |
| Security & Protection | 325 (69.3%) | 144 (30.7%) |
| Firefighting & Prevention | 199 (65.5%) | 105 (34.5%) |
| Law Enforcement | 126 (76.4%) | 39 (23.6%) |
| Food Preparation & Serving | 1,545 (53.4%) | 1,346 (46.6%) |
| Cleaning & Maintenance | 1,071 (53.4%) | 935 (46.6%) |
| Personal Care & Service | 124 (11.8%) | 930 (88.2%) |
| Total (Category) | 3,485 (43.0%) | 4,618 (57.0%) |
| Total (Overall) | 28,372 (55.9%) | 22,373 (44.1%) |
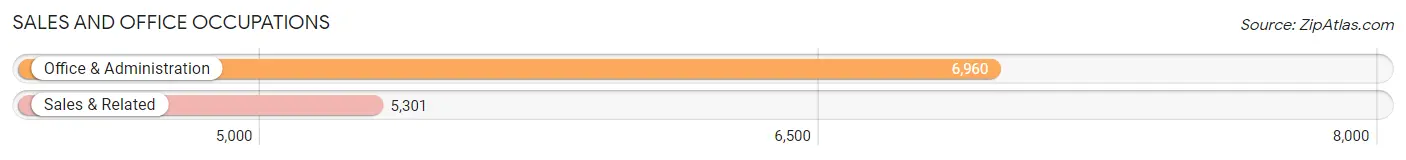
Sales and Office Occupations
The most common Sales and Office occupations in Orem are Office & Administration (6,960 | 13.7%), and Sales & Related (5,301 | 10.4%).
Sales and Office Occupations by Sex
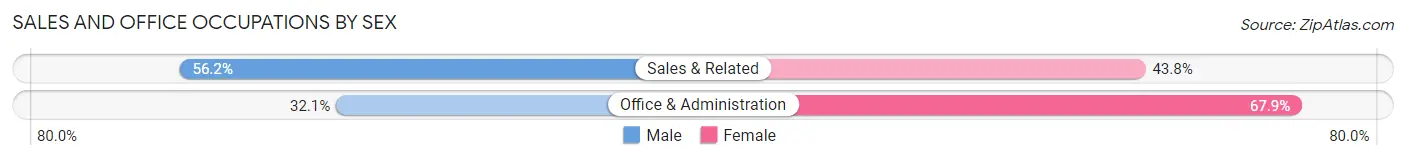
| Occupation | Male | Female |
| Sales & Related | 2,977 (56.2%) | 2,324 (43.8%) |
| Office & Administration | 2,233 (32.1%) | 4,727 (67.9%) |
| Total (Category) | 5,210 (42.5%) | 7,051 (57.5%) |
| Total (Overall) | 28,372 (55.9%) | 22,373 (44.1%) |
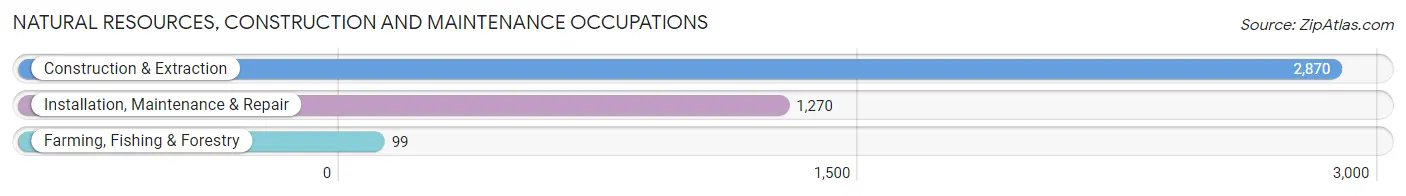
Natural Resources, Construction and Maintenance Occupations
The most common Natural Resources, Construction and Maintenance occupations in Orem are Construction & Extraction (2,870 | 5.7%), Installation, Maintenance & Repair (1,270 | 2.5%), and Farming, Fishing & Forestry (99 | 0.2%).
Natural Resources, Construction and Maintenance Occupations by Sex
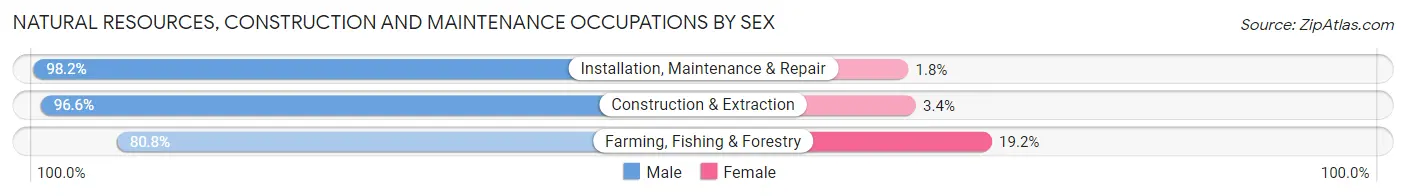
| Occupation | Male | Female |
| Farming, Fishing & Forestry | 80 (80.8%) | 19 (19.2%) |
| Construction & Extraction | 2,773 (96.6%) | 97 (3.4%) |
| Installation, Maintenance & Repair | 1,247 (98.2%) | 23 (1.8%) |
| Total (Category) | 4,100 (96.7%) | 139 (3.3%) |
| Total (Overall) | 28,372 (55.9%) | 22,373 (44.1%) |
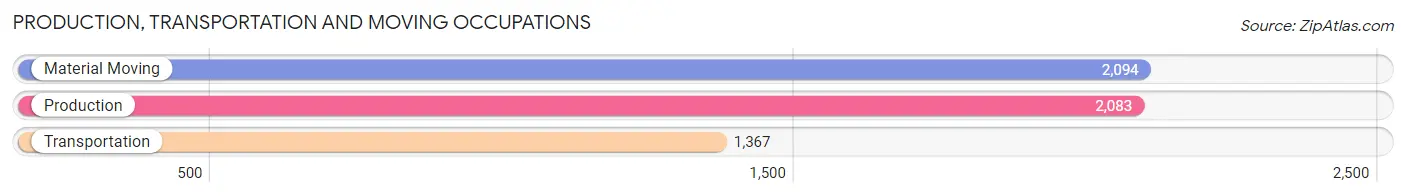
Production, Transportation and Moving Occupations
The most common Production, Transportation and Moving occupations in Orem are Material Moving (2,094 | 4.1%), Production (2,083 | 4.1%), and Transportation (1,367 | 2.7%).
Production, Transportation and Moving Occupations by Sex
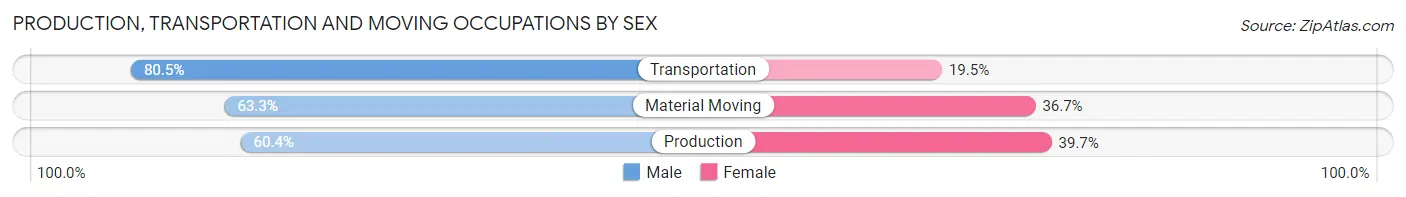
| Occupation | Male | Female |
| Production | 1,257 (60.4%) | 826 (39.7%) |
| Transportation | 1,100 (80.5%) | 267 (19.5%) |
| Material Moving | 1,326 (63.3%) | 768 (36.7%) |
| Total (Category) | 3,683 (66.4%) | 1,861 (33.6%) |
| Total (Overall) | 28,372 (55.9%) | 22,373 (44.1%) |
Employment Industries by Sex in Orem
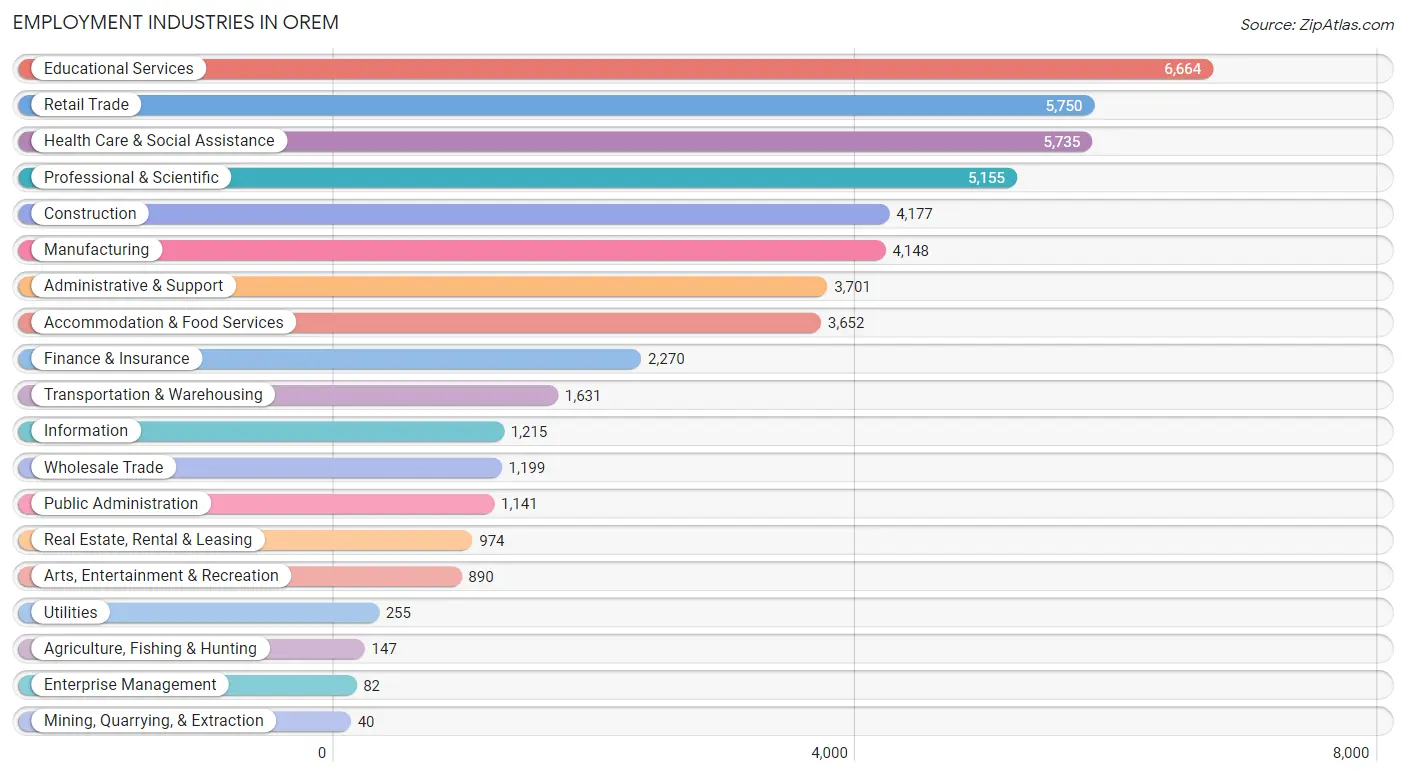
Employment Industries in Orem
The major employment industries in Orem include Educational Services (6,664 | 13.1%), Retail Trade (5,750 | 11.3%), Health Care & Social Assistance (5,735 | 11.3%), Professional & Scientific (5,155 | 10.2%), and Construction (4,177 | 8.2%).
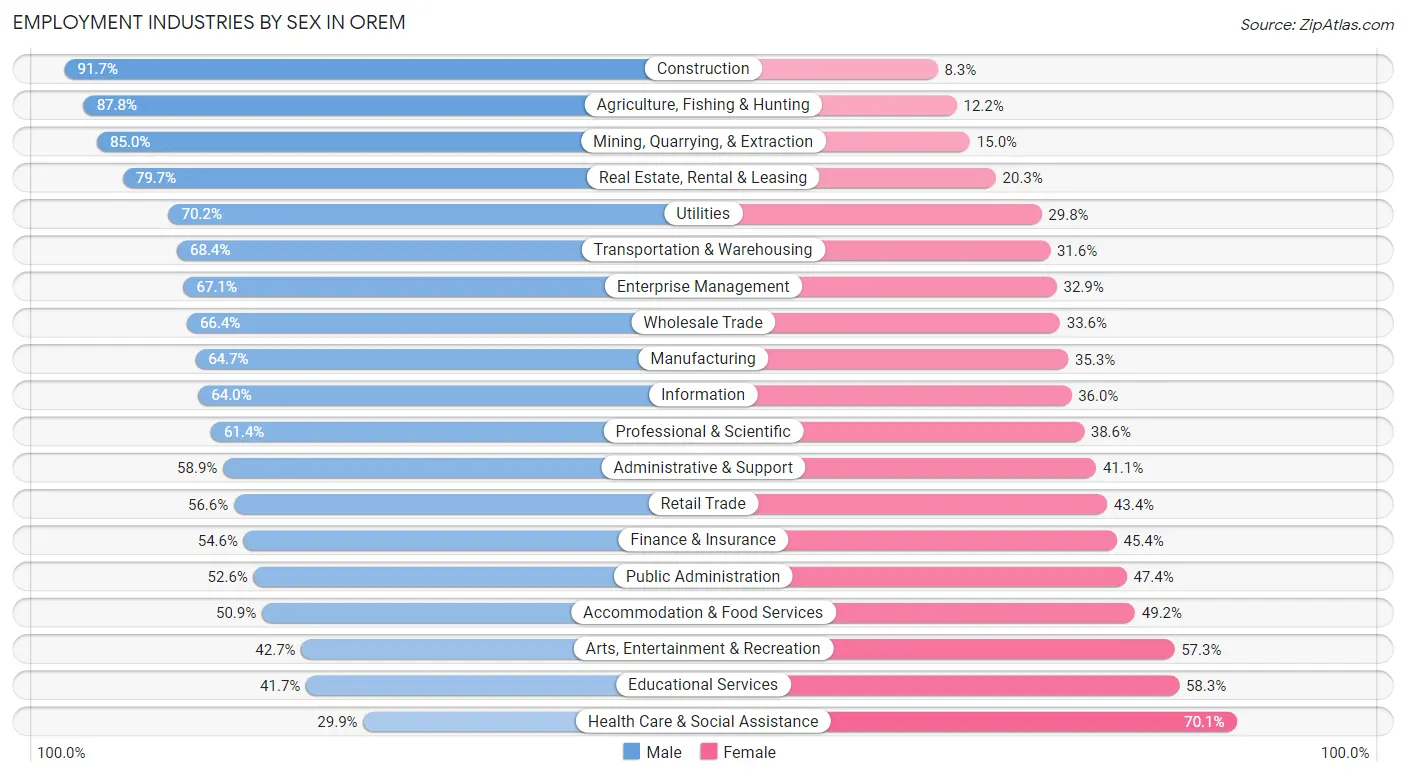
Employment Industries by Sex in Orem
The Orem industries that see more men than women are Construction (91.7%), Agriculture, Fishing & Hunting (87.8%), and Mining, Quarrying, & Extraction (85.0%), whereas the industries that tend to have a higher number of women are Health Care & Social Assistance (70.1%), Educational Services (58.3%), and Arts, Entertainment & Recreation (57.3%).
| Industry | Male | Female |
| Agriculture, Fishing & Hunting | 129 (87.8%) | 18 (12.2%) |
| Mining, Quarrying, & Extraction | 34 (85.0%) | 6 (15.0%) |
| Construction | 3,831 (91.7%) | 346 (8.3%) |
| Manufacturing | 2,683 (64.7%) | 1,465 (35.3%) |
| Wholesale Trade | 796 (66.4%) | 403 (33.6%) |
| Retail Trade | 3,257 (56.6%) | 2,493 (43.4%) |
| Transportation & Warehousing | 1,116 (68.4%) | 515 (31.6%) |
| Utilities | 179 (70.2%) | 76 (29.8%) |
| Information | 778 (64.0%) | 437 (36.0%) |
| Finance & Insurance | 1,240 (54.6%) | 1,030 (45.4%) |
| Real Estate, Rental & Leasing | 776 (79.7%) | 198 (20.3%) |
| Professional & Scientific | 3,166 (61.4%) | 1,989 (38.6%) |
| Enterprise Management | 55 (67.1%) | 27 (32.9%) |
| Administrative & Support | 2,180 (58.9%) | 1,521 (41.1%) |
| Educational Services | 2,780 (41.7%) | 3,884 (58.3%) |
| Health Care & Social Assistance | 1,713 (29.9%) | 4,022 (70.1%) |
| Arts, Entertainment & Recreation | 380 (42.7%) | 510 (57.3%) |
| Accommodation & Food Services | 1,857 (50.8%) | 1,795 (49.1%) |
| Public Administration | 600 (52.6%) | 541 (47.4%) |
| Total | 28,372 (55.9%) | 22,373 (44.1%) |
Education in Orem
School Enrollment in Orem
The most common levels of schooling among the 34,162 students in Orem are college / undergraduate (12,080 | 35.4%), high school (6,767 | 19.8%), and middle school (5,567 | 16.3%).
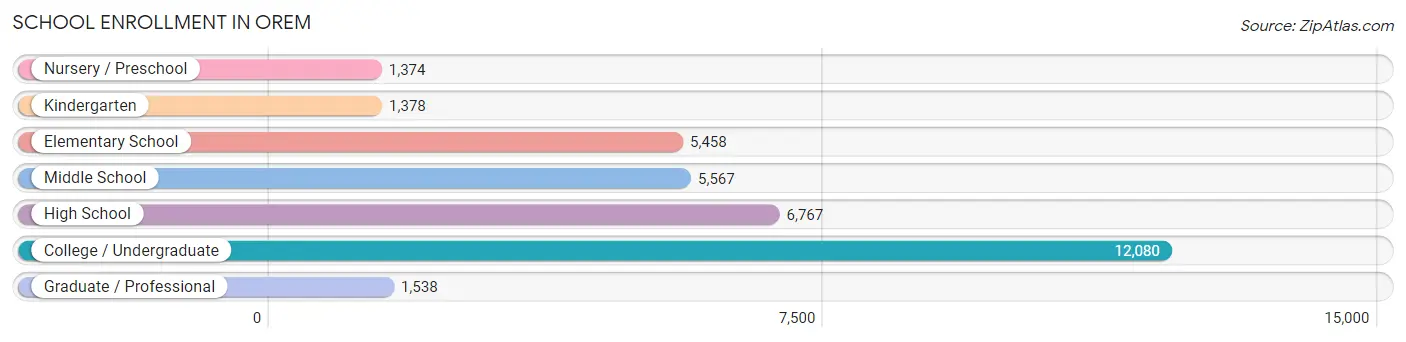
| School Level | # Students | % Students |
| Nursery / Preschool | 1,374 | 4.0% |
| Kindergarten | 1,378 | 4.0% |
| Elementary School | 5,458 | 16.0% |
| Middle School | 5,567 | 16.3% |
| High School | 6,767 | 19.8% |
| College / Undergraduate | 12,080 | 35.4% |
| Graduate / Professional | 1,538 | 4.5% |
| Total | 34,162 | 100.0% |
School Enrollment by Age by Funding Source in Orem
Out of a total of 34,162 students who are enrolled in schools in Orem, 6,798 (19.9%) attend a private institution, while the remaining 27,364 (80.1%) are enrolled in public schools. The age group of 3 to 4 year olds has the highest likelihood of being enrolled in private schools, with 496 (53.0% in the age bracket) enrolled. Conversely, the age group of 15 to 17 year olds has the lowest likelihood of being enrolled in a private school, with 4,252 (93.1% in the age bracket) attending a public institution.
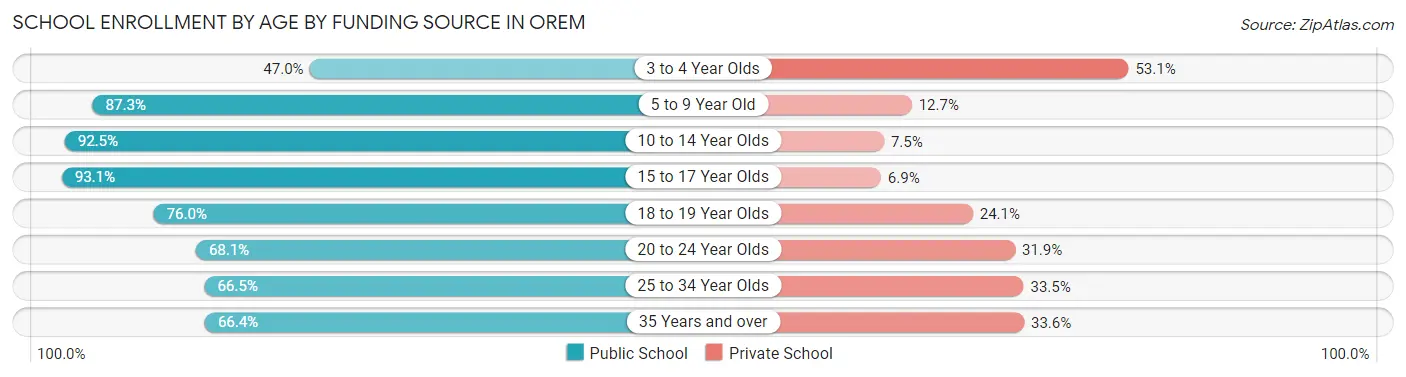
| Age Bracket | Public School | Private School |
| 3 to 4 Year Olds | 439 (46.9%) | 496 (53.0%) |
| 5 to 9 Year Old | 5,840 (87.3%) | 848 (12.7%) |
| 10 to 14 Year Olds | 6,534 (92.5%) | 530 (7.5%) |
| 15 to 17 Year Olds | 4,252 (93.1%) | 317 (6.9%) |
| 18 to 19 Year Olds | 2,217 (75.9%) | 702 (24.0%) |
| 20 to 24 Year Olds | 4,872 (68.1%) | 2,284 (31.9%) |
| 25 to 34 Year Olds | 2,306 (66.5%) | 1,162 (33.5%) |
| 35 Years and over | 905 (66.4%) | 458 (33.6%) |
| Total | 27,364 (80.1%) | 6,798 (19.9%) |
Educational Attainment by Field of Study in Orem
Business (3,753 | 15.9%), education (3,400 | 14.4%), arts & humanities (2,369 | 10.0%), science & technology (1,968 | 8.3%), and computers & mathematics (1,541 | 6.5%) are the most common fields of study among 23,633 individuals in Orem who have obtained a bachelor's degree or higher.
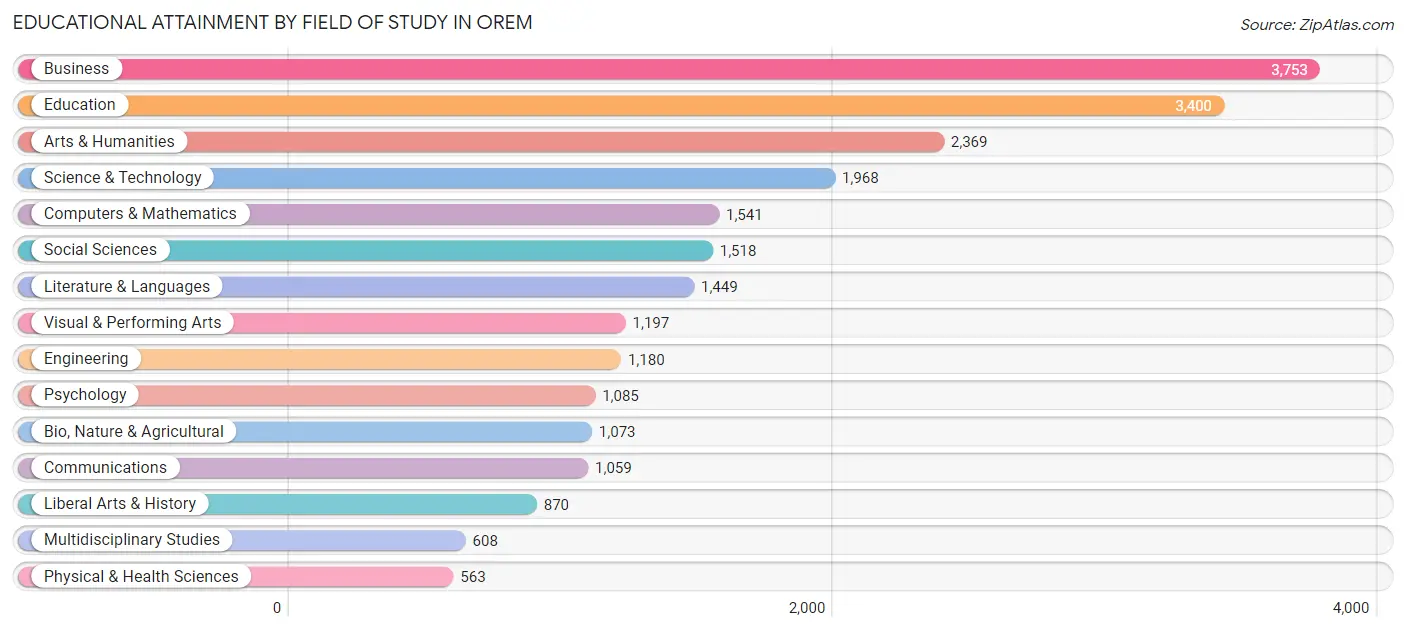
| Field of Study | # Graduates | % Graduates |
| Computers & Mathematics | 1,541 | 6.5% |
| Bio, Nature & Agricultural | 1,073 | 4.5% |
| Physical & Health Sciences | 563 | 2.4% |
| Psychology | 1,085 | 4.6% |
| Social Sciences | 1,518 | 6.4% |
| Engineering | 1,180 | 5.0% |
| Multidisciplinary Studies | 608 | 2.6% |
| Science & Technology | 1,968 | 8.3% |
| Business | 3,753 | 15.9% |
| Education | 3,400 | 14.4% |
| Literature & Languages | 1,449 | 6.1% |
| Liberal Arts & History | 870 | 3.7% |
| Visual & Performing Arts | 1,197 | 5.1% |
| Communications | 1,059 | 4.5% |
| Arts & Humanities | 2,369 | 10.0% |
| Total | 23,633 | 100.0% |
Transportation & Commute in Orem
Vehicle Availability by Sex in Orem
The most prevalent vehicle ownership categories in Orem are males with 2 vehicles (10,571, accounting for 38.5%) and females with 2 vehicles (7,436, making up 50.0%).
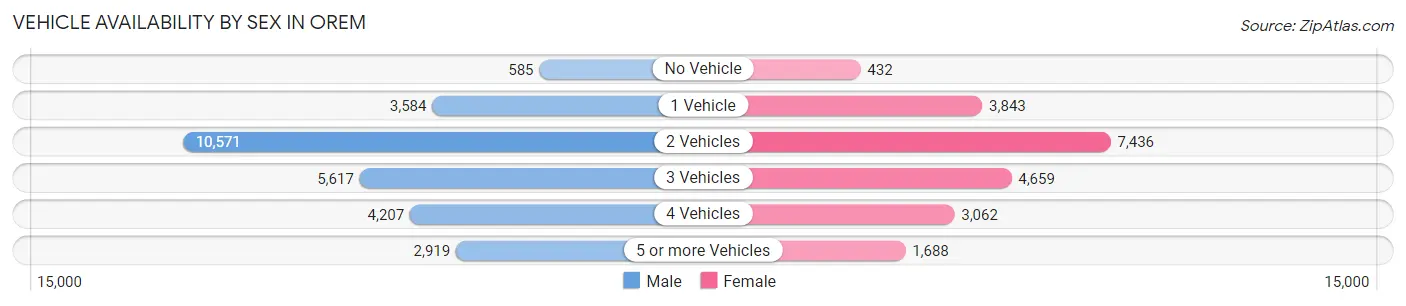
| Vehicles Available | Male | Female |
| No Vehicle | 585 (2.1%) | 432 (2.1%) |
| 1 Vehicle | 3,584 (13.0%) | 3,843 (18.2%) |
| 2 Vehicles | 10,571 (38.5%) | 7,436 (35.2%) |
| 3 Vehicles | 5,617 (20.4%) | 4,659 (22.1%) |
| 4 Vehicles | 4,207 (15.3%) | 3,062 (14.5%) |
| 5 or more Vehicles | 2,919 (10.6%) | 1,688 (8.0%) |
| Total | 27,483 (100.0%) | 21,120 (100.0%) |
Commute Time in Orem
The most frequently occuring commute durations in Orem are 10 to 14 minutes (9,396 commuters, 21.8%), 15 to 19 minutes (9,250 commuters, 21.5%), and 5 to 9 minutes (6,088 commuters, 14.1%).
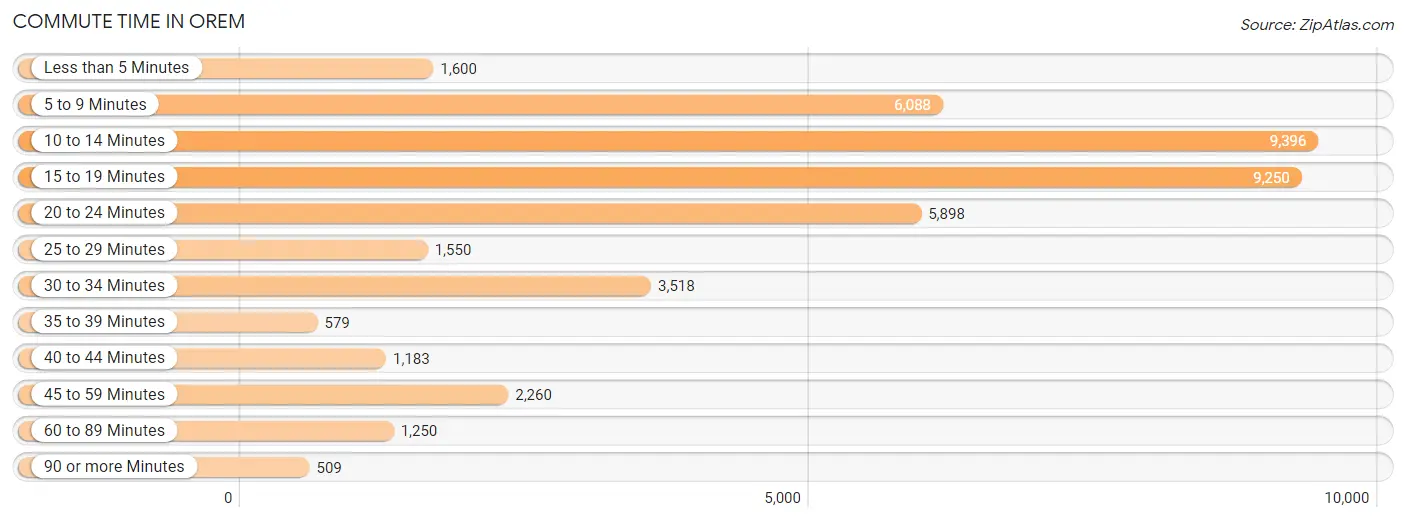
| Commute Time | # Commuters | % Commuters |
| Less than 5 Minutes | 1,600 | 3.7% |
| 5 to 9 Minutes | 6,088 | 14.1% |
| 10 to 14 Minutes | 9,396 | 21.8% |
| 15 to 19 Minutes | 9,250 | 21.5% |
| 20 to 24 Minutes | 5,898 | 13.7% |
| 25 to 29 Minutes | 1,550 | 3.6% |
| 30 to 34 Minutes | 3,518 | 8.2% |
| 35 to 39 Minutes | 579 | 1.3% |
| 40 to 44 Minutes | 1,183 | 2.8% |
| 45 to 59 Minutes | 2,260 | 5.2% |
| 60 to 89 Minutes | 1,250 | 2.9% |
| 90 or more Minutes | 509 | 1.2% |
Commute Time by Sex in Orem
The most common commute times in Orem are 15 to 19 minutes (5,261 commuters, 21.8%) for males and 10 to 14 minutes (4,494 commuters, 23.8%) for females.
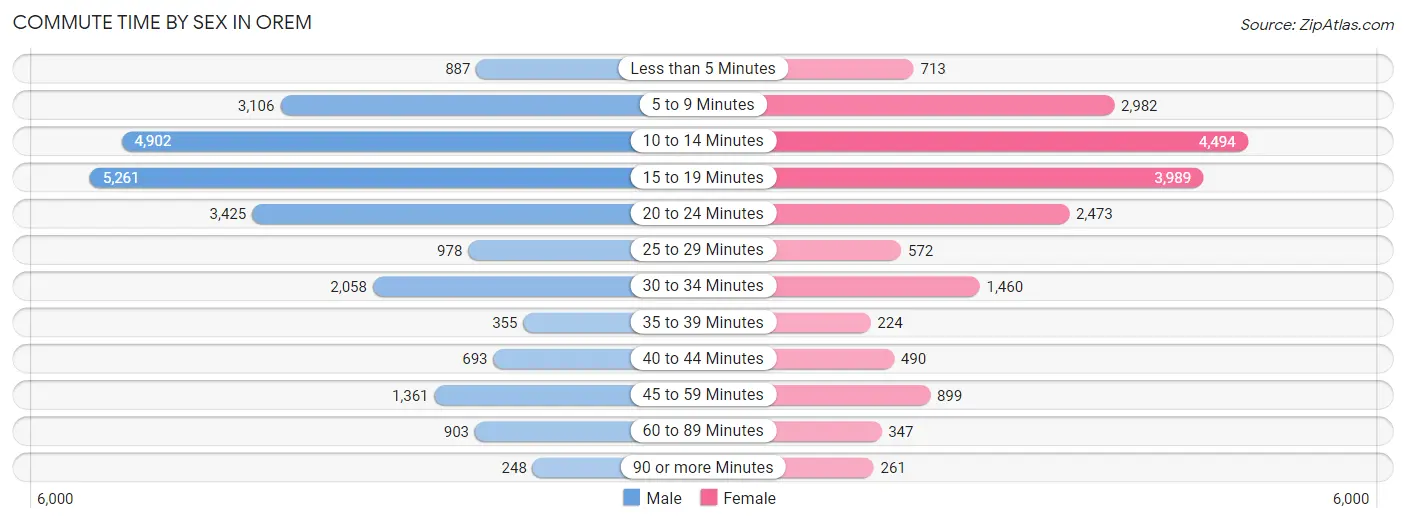
| Commute Time | Male | Female |
| Less than 5 Minutes | 887 (3.7%) | 713 (3.8%) |
| 5 to 9 Minutes | 3,106 (12.9%) | 2,982 (15.8%) |
| 10 to 14 Minutes | 4,902 (20.3%) | 4,494 (23.8%) |
| 15 to 19 Minutes | 5,261 (21.8%) | 3,989 (21.1%) |
| 20 to 24 Minutes | 3,425 (14.2%) | 2,473 (13.1%) |
| 25 to 29 Minutes | 978 (4.1%) | 572 (3.0%) |
| 30 to 34 Minutes | 2,058 (8.5%) | 1,460 (7.7%) |
| 35 to 39 Minutes | 355 (1.5%) | 224 (1.2%) |
| 40 to 44 Minutes | 693 (2.9%) | 490 (2.6%) |
| 45 to 59 Minutes | 1,361 (5.6%) | 899 (4.8%) |
| 60 to 89 Minutes | 903 (3.7%) | 347 (1.8%) |
| 90 or more Minutes | 248 (1.0%) | 261 (1.4%) |
Time of Departure to Work by Sex in Orem
The most frequent times of departure to work in Orem are 7:30 AM to 7:59 AM (3,260, 13.5%) for males and 7:30 AM to 7:59 AM (2,648, 14.0%) for females.
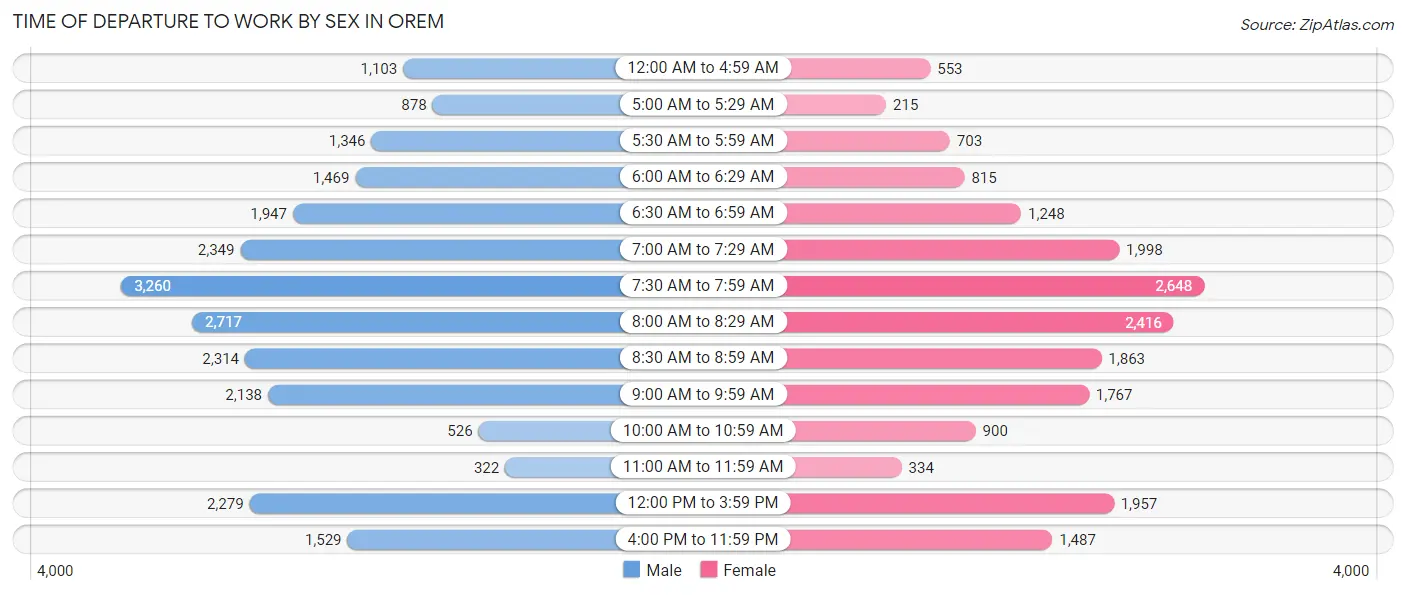
| Time of Departure | Male | Female |
| 12:00 AM to 4:59 AM | 1,103 (4.6%) | 553 (2.9%) |
| 5:00 AM to 5:29 AM | 878 (3.6%) | 215 (1.1%) |
| 5:30 AM to 5:59 AM | 1,346 (5.6%) | 703 (3.7%) |
| 6:00 AM to 6:29 AM | 1,469 (6.1%) | 815 (4.3%) |
| 6:30 AM to 6:59 AM | 1,947 (8.1%) | 1,248 (6.6%) |
| 7:00 AM to 7:29 AM | 2,349 (9.7%) | 1,998 (10.6%) |
| 7:30 AM to 7:59 AM | 3,260 (13.5%) | 2,648 (14.0%) |
| 8:00 AM to 8:29 AM | 2,717 (11.2%) | 2,416 (12.8%) |
| 8:30 AM to 8:59 AM | 2,314 (9.6%) | 1,863 (9.9%) |
| 9:00 AM to 9:59 AM | 2,138 (8.8%) | 1,767 (9.3%) |
| 10:00 AM to 10:59 AM | 526 (2.2%) | 900 (4.8%) |
| 11:00 AM to 11:59 AM | 322 (1.3%) | 334 (1.8%) |
| 12:00 PM to 3:59 PM | 2,279 (9.4%) | 1,957 (10.3%) |
| 4:00 PM to 11:59 PM | 1,529 (6.3%) | 1,487 (7.9%) |
| Total | 24,177 (100.0%) | 18,904 (100.0%) |
Housing Occupancy in Orem
Occupancy by Ownership in Orem
Of the total 30,239 dwellings in Orem, owner-occupied units account for 18,113 (59.9%), while renter-occupied units make up 12,126 (40.1%).
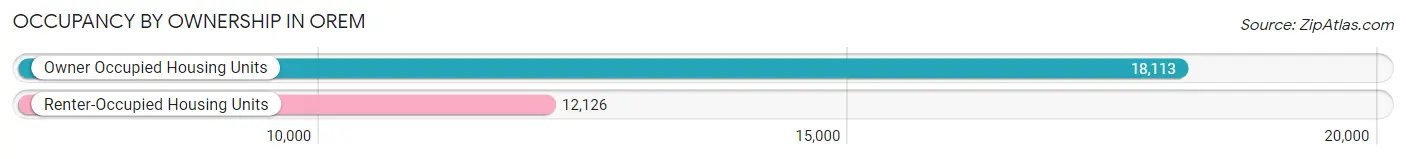
| Occupancy | # Housing Units | % Housing Units |
| Owner Occupied Housing Units | 18,113 | 59.9% |
| Renter-Occupied Housing Units | 12,126 | 40.1% |
| Total Occupied Housing Units | 30,239 | 100.0% |
Occupancy by Household Size in Orem
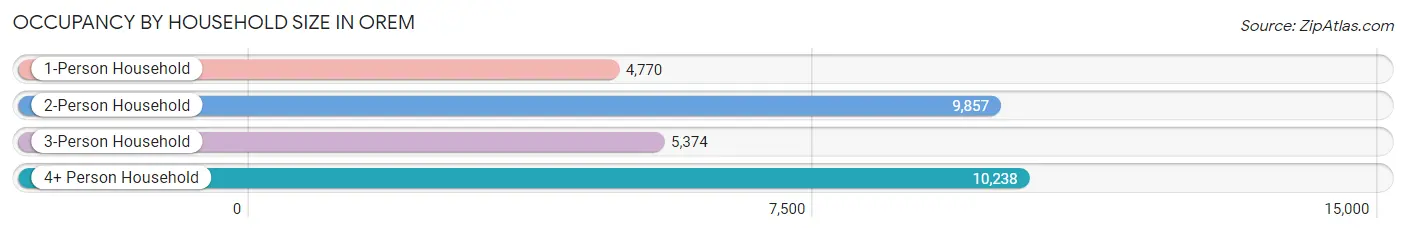
| Household Size | # Housing Units | % Housing Units |
| 1-Person Household | 4,770 | 15.8% |
| 2-Person Household | 9,857 | 32.6% |
| 3-Person Household | 5,374 | 17.8% |
| 4+ Person Household | 10,238 | 33.9% |
| Total Housing Units | 30,239 | 100.0% |
Occupancy by Ownership by Household Size in Orem
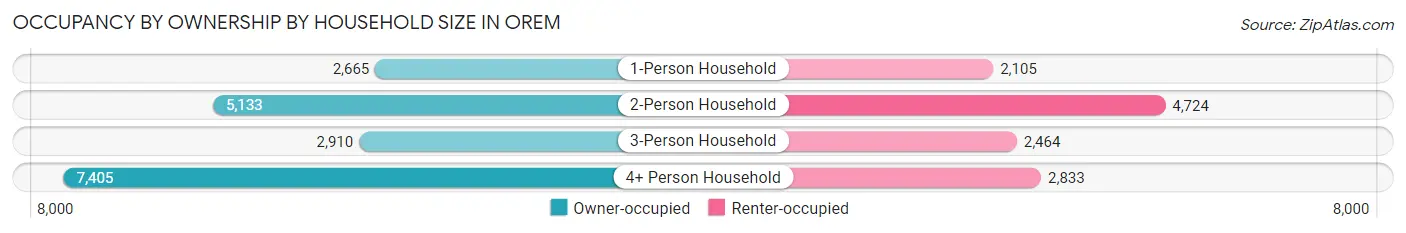
| Household Size | Owner-occupied | Renter-occupied |
| 1-Person Household | 2,665 (55.9%) | 2,105 (44.1%) |
| 2-Person Household | 5,133 (52.1%) | 4,724 (47.9%) |
| 3-Person Household | 2,910 (54.1%) | 2,464 (45.9%) |
| 4+ Person Household | 7,405 (72.3%) | 2,833 (27.7%) |
| Total Housing Units | 18,113 (59.9%) | 12,126 (40.1%) |
Occupancy by Educational Attainment in Orem
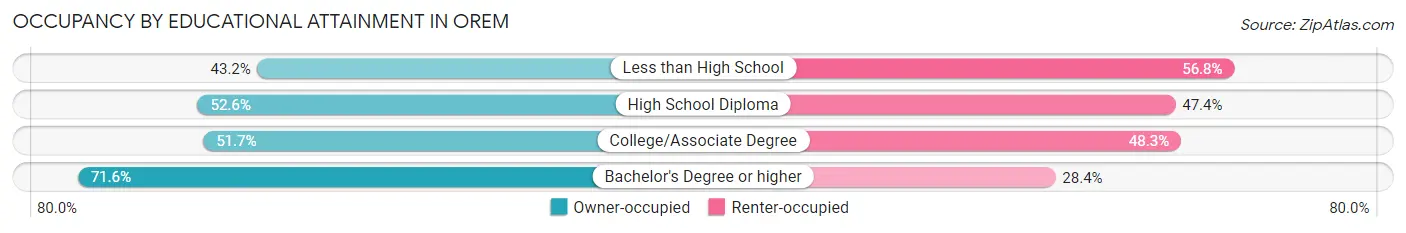
| Household Size | Owner-occupied | Renter-occupied |
| Less than High School | 521 (43.2%) | 685 (56.8%) |
| High School Diploma | 2,368 (52.6%) | 2,137 (47.4%) |
| College/Associate Degree | 6,046 (51.7%) | 5,658 (48.3%) |
| Bachelor's Degree or higher | 9,178 (71.6%) | 3,646 (28.4%) |
Occupancy by Age of Householder in Orem
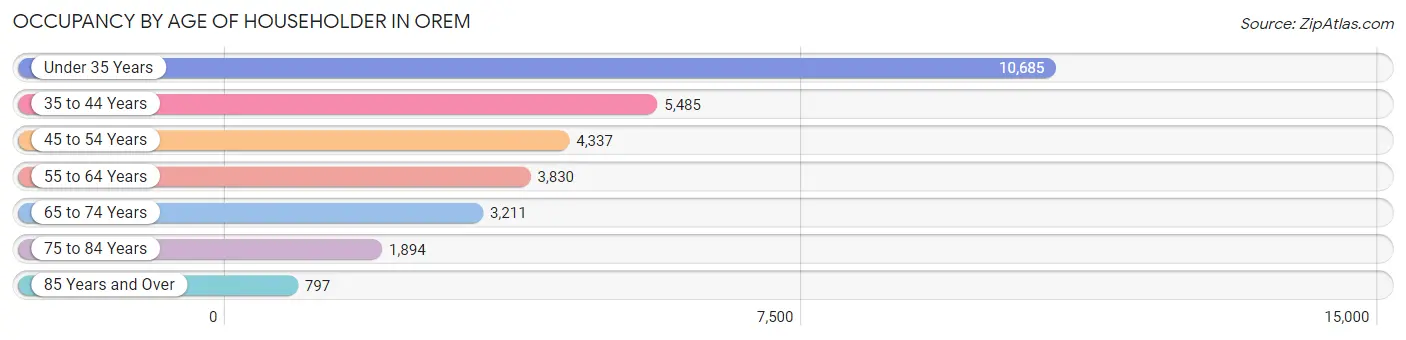
| Age Bracket | # Households | % Households |
| Under 35 Years | 10,685 | 35.3% |
| 35 to 44 Years | 5,485 | 18.1% |
| 45 to 54 Years | 4,337 | 14.3% |
| 55 to 64 Years | 3,830 | 12.7% |
| 65 to 74 Years | 3,211 | 10.6% |
| 75 to 84 Years | 1,894 | 6.3% |
| 85 Years and Over | 797 | 2.6% |
| Total | 30,239 | 100.0% |
Housing Finances in Orem
Median Income by Occupancy in Orem
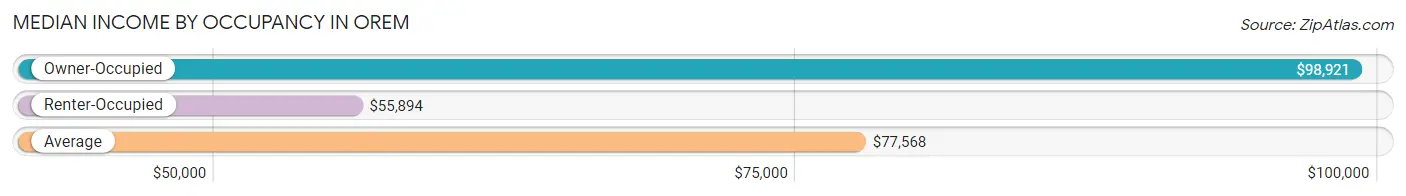
| Occupancy Type | # Households | Median Income |
| Owner-Occupied | 18,113 (59.9%) | $98,921 |
| Renter-Occupied | 12,126 (40.1%) | $55,894 |
| Average | 30,239 (100.0%) | $77,568 |
Occupancy by Householder Income Bracket in Orem
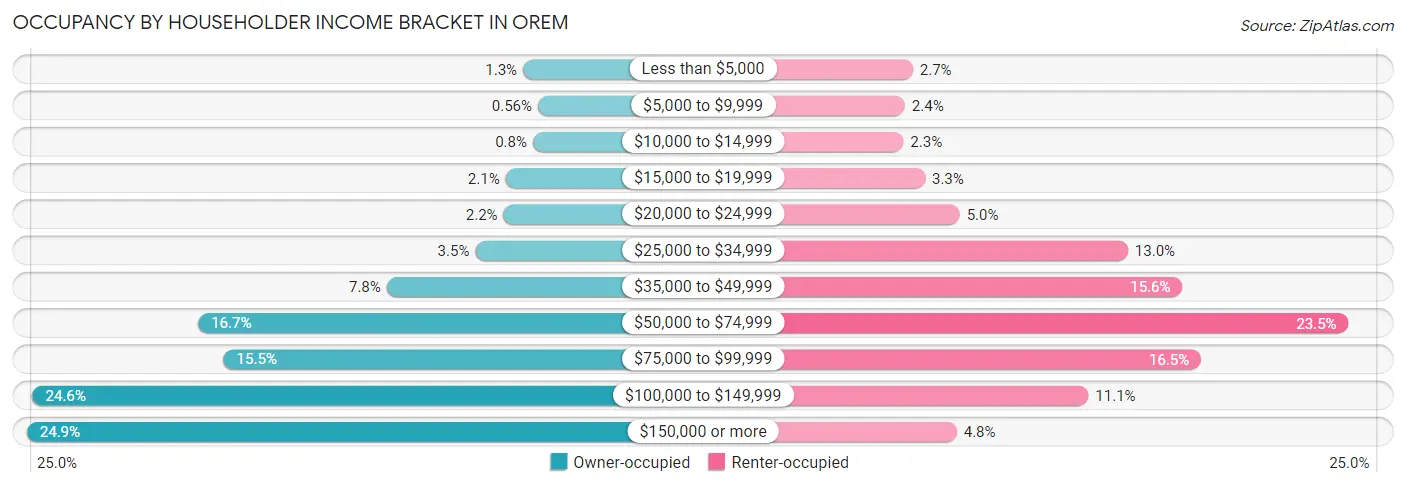
| Income Bracket | Owner-occupied | Renter-occupied |
| Less than $5,000 | 230 (1.3%) | 331 (2.7%) |
| $5,000 to $9,999 | 102 (0.6%) | 285 (2.4%) |
| $10,000 to $14,999 | 145 (0.8%) | 277 (2.3%) |
| $15,000 to $19,999 | 381 (2.1%) | 401 (3.3%) |
| $20,000 to $24,999 | 398 (2.2%) | 602 (5.0%) |
| $25,000 to $34,999 | 642 (3.5%) | 1,573 (13.0%) |
| $35,000 to $49,999 | 1,406 (7.8%) | 1,887 (15.6%) |
| $50,000 to $74,999 | 3,030 (16.7%) | 2,846 (23.5%) |
| $75,000 to $99,999 | 2,811 (15.5%) | 1,995 (16.5%) |
| $100,000 to $149,999 | 4,460 (24.6%) | 1,345 (11.1%) |
| $150,000 or more | 4,508 (24.9%) | 584 (4.8%) |
| Total | 18,113 (100.0%) | 12,126 (100.0%) |
Monthly Housing Cost Tiers in Orem
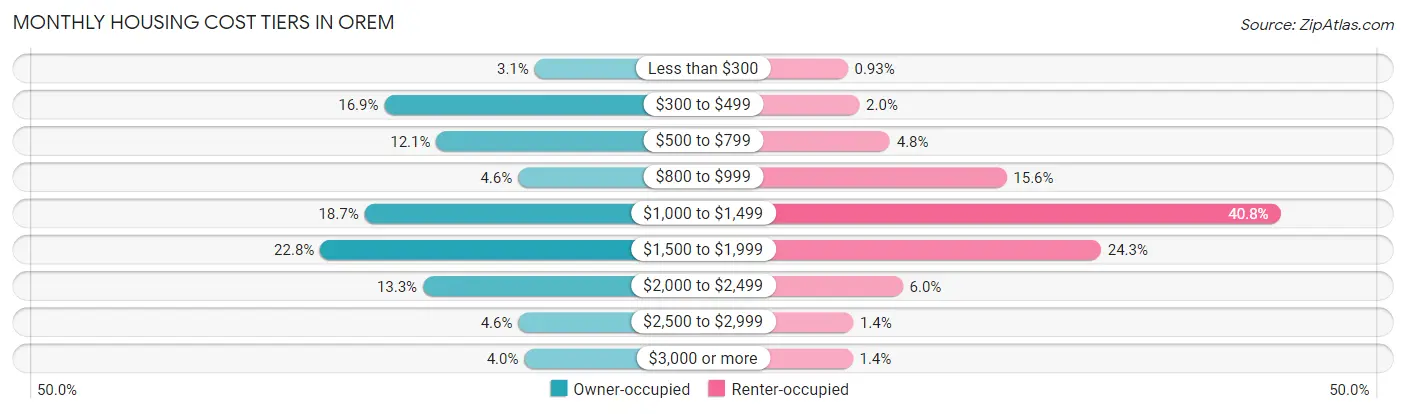
| Monthly Cost | Owner-occupied | Renter-occupied |
| Less than $300 | 552 (3.0%) | 113 (0.9%) |
| $300 to $499 | 3,060 (16.9%) | 242 (2.0%) |
| $500 to $799 | 2,192 (12.1%) | 584 (4.8%) |
| $800 to $999 | 828 (4.6%) | 1,885 (15.5%) |
| $1,000 to $1,499 | 3,389 (18.7%) | 4,945 (40.8%) |
| $1,500 to $1,999 | 4,128 (22.8%) | 2,940 (24.2%) |
| $2,000 to $2,499 | 2,415 (13.3%) | 727 (6.0%) |
| $2,500 to $2,999 | 825 (4.5%) | 174 (1.4%) |
| $3,000 or more | 724 (4.0%) | 168 (1.4%) |
| Total | 18,113 (100.0%) | 12,126 (100.0%) |
Physical Housing Characteristics in Orem
Housing Structures in Orem
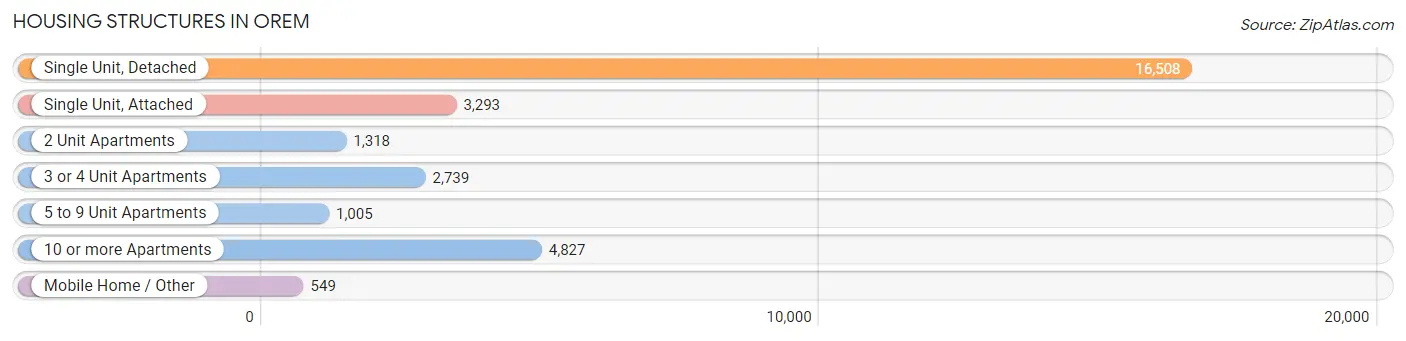
| Structure Type | # Housing Units | % Housing Units |
| Single Unit, Detached | 16,508 | 54.6% |
| Single Unit, Attached | 3,293 | 10.9% |
| 2 Unit Apartments | 1,318 | 4.4% |
| 3 or 4 Unit Apartments | 2,739 | 9.1% |
| 5 to 9 Unit Apartments | 1,005 | 3.3% |
| 10 or more Apartments | 4,827 | 16.0% |
| Mobile Home / Other | 549 | 1.8% |
| Total | 30,239 | 100.0% |
Housing Structures by Occupancy in Orem
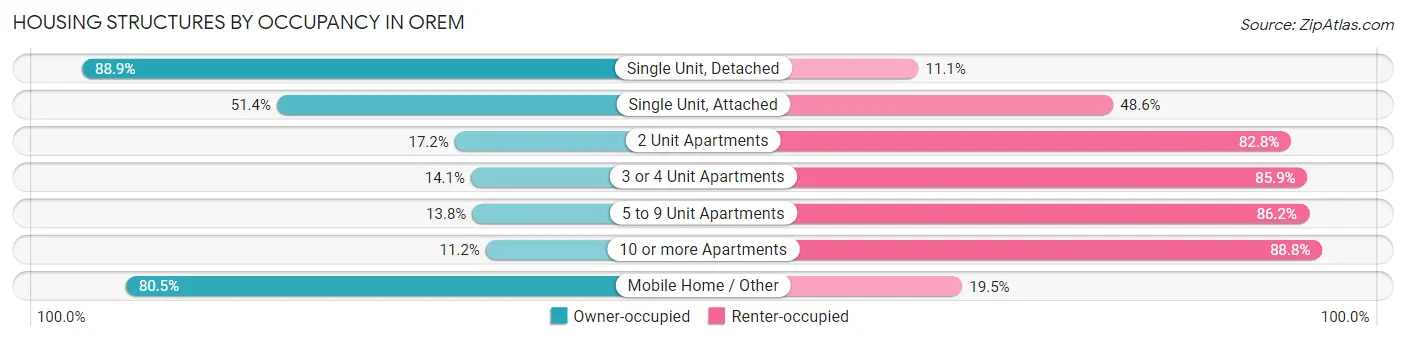
| Structure Type | Owner-occupied | Renter-occupied |
| Single Unit, Detached | 14,683 (88.9%) | 1,825 (11.1%) |
| Single Unit, Attached | 1,694 (51.4%) | 1,599 (48.6%) |
| 2 Unit Apartments | 227 (17.2%) | 1,091 (82.8%) |
| 3 or 4 Unit Apartments | 386 (14.1%) | 2,353 (85.9%) |
| 5 to 9 Unit Apartments | 139 (13.8%) | 866 (86.2%) |
| 10 or more Apartments | 542 (11.2%) | 4,285 (88.8%) |
| Mobile Home / Other | 442 (80.5%) | 107 (19.5%) |
| Total | 18,113 (59.9%) | 12,126 (40.1%) |
Housing Structures by Number of Rooms in Orem
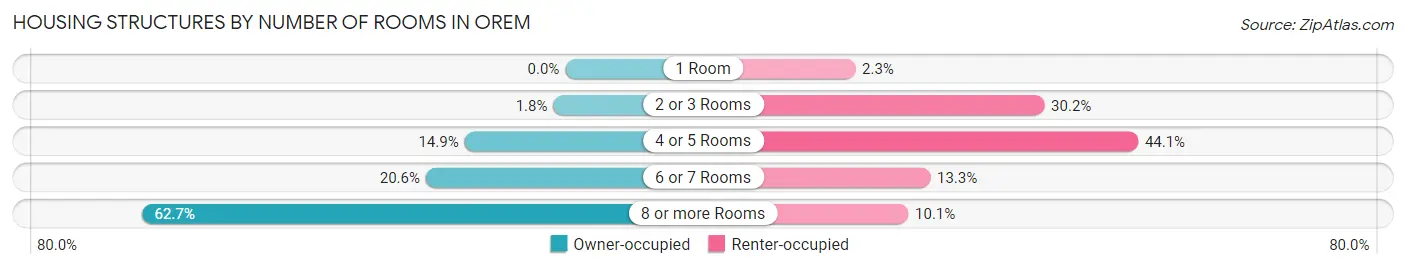
| Number of Rooms | Owner-occupied | Renter-occupied |
| 1 Room | 0 (0.0%) | 273 (2.2%) |
| 2 or 3 Rooms | 320 (1.8%) | 3,664 (30.2%) |
| 4 or 5 Rooms | 2,700 (14.9%) | 5,348 (44.1%) |
| 6 or 7 Rooms | 3,737 (20.6%) | 1,617 (13.3%) |
| 8 or more Rooms | 11,356 (62.7%) | 1,224 (10.1%) |
| Total | 18,113 (100.0%) | 12,126 (100.0%) |
Housing Structure by Heating Type in Orem
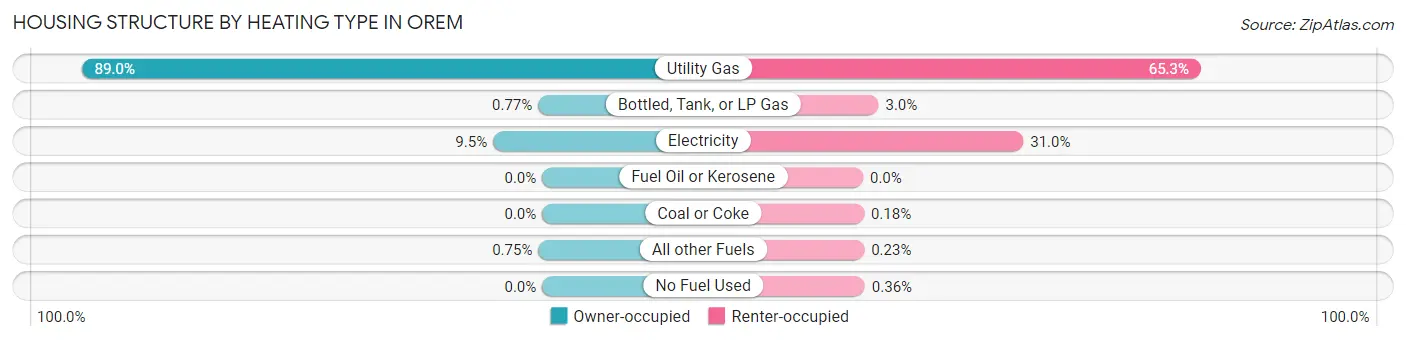
| Heating Type | Owner-occupied | Renter-occupied |
| Utility Gas | 16,118 (89.0%) | 7,914 (65.3%) |
| Bottled, Tank, or LP Gas | 140 (0.8%) | 362 (3.0%) |
| Electricity | 1,719 (9.5%) | 3,756 (31.0%) |
| Fuel Oil or Kerosene | 0 (0.0%) | 0 (0.0%) |
| Coal or Coke | 0 (0.0%) | 22 (0.2%) |
| All other Fuels | 136 (0.7%) | 28 (0.2%) |
| No Fuel Used | 0 (0.0%) | 44 (0.4%) |
| Total | 18,113 (100.0%) | 12,126 (100.0%) |
Household Vehicle Usage in Orem
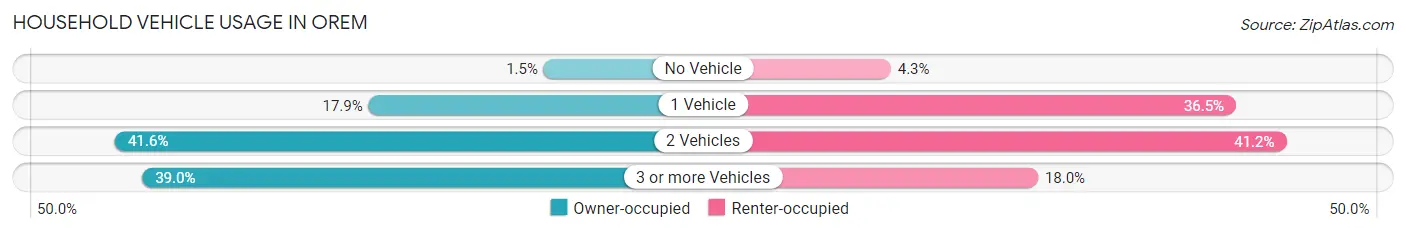
| Vehicles per Household | Owner-occupied | Renter-occupied |
| No Vehicle | 277 (1.5%) | 519 (4.3%) |
| 1 Vehicle | 3,240 (17.9%) | 4,426 (36.5%) |
| 2 Vehicles | 7,528 (41.6%) | 4,996 (41.2%) |
| 3 or more Vehicles | 7,068 (39.0%) | 2,185 (18.0%) |
| Total | 18,113 (100.0%) | 12,126 (100.0%) |
Real Estate & Mortgages in Orem
Real Estate and Mortgage Overview in Orem
| Characteristic | Without Mortgage | With Mortgage |
| Housing Units | 5,998 | 12,115 |
| Median Property Value | $380,900 | $398,400 |
| Median Household Income | $85,739 | $3,249 |
| Monthly Housing Costs | $469 | $716 |
| Real Estate Taxes | $1,758 | $324 |
Property Value by Mortgage Status in Orem
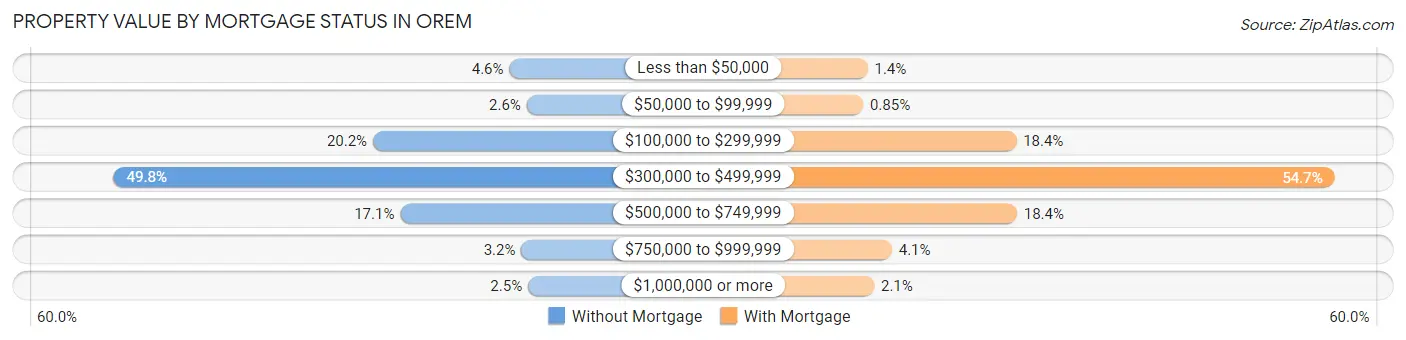
| Property Value | Without Mortgage | With Mortgage |
| Less than $50,000 | 276 (4.6%) | 166 (1.4%) |
| $50,000 to $99,999 | 157 (2.6%) | 103 (0.9%) |
| $100,000 to $299,999 | 1,211 (20.2%) | 2,224 (18.4%) |
| $300,000 to $499,999 | 2,988 (49.8%) | 6,631 (54.7%) |
| $500,000 to $749,999 | 1,024 (17.1%) | 2,233 (18.4%) |
| $750,000 to $999,999 | 194 (3.2%) | 502 (4.1%) |
| $1,000,000 or more | 148 (2.5%) | 256 (2.1%) |
| Total | 5,998 (100.0%) | 12,115 (100.0%) |
Household Income by Mortgage Status in Orem
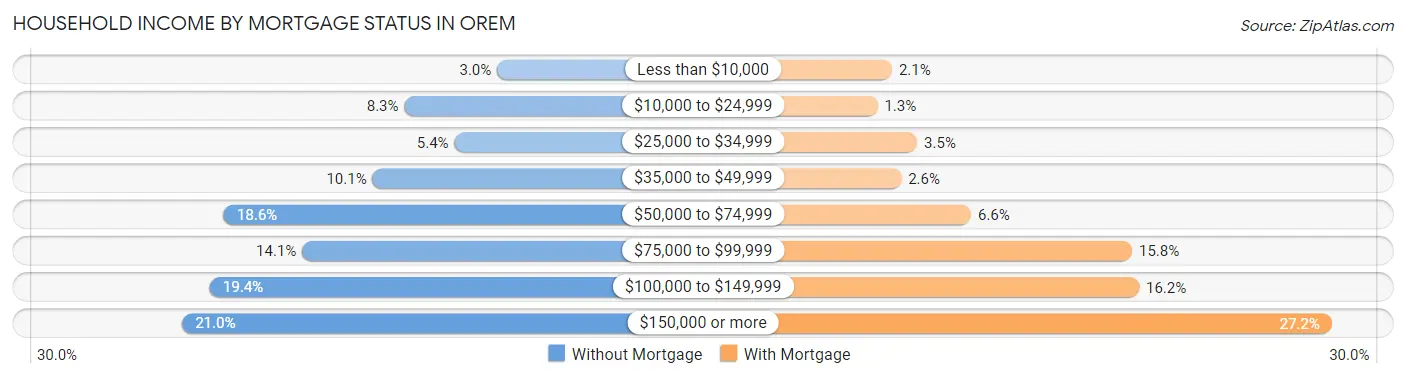
| Household Income | Without Mortgage | With Mortgage |
| Less than $10,000 | 180 (3.0%) | 252 (2.1%) |
| $10,000 to $24,999 | 498 (8.3%) | 152 (1.3%) |
| $25,000 to $34,999 | 326 (5.4%) | 426 (3.5%) |
| $35,000 to $49,999 | 607 (10.1%) | 316 (2.6%) |
| $50,000 to $74,999 | 1,116 (18.6%) | 799 (6.6%) |
| $75,000 to $99,999 | 848 (14.1%) | 1,914 (15.8%) |
| $100,000 to $149,999 | 1,164 (19.4%) | 1,963 (16.2%) |
| $150,000 or more | 1,259 (21.0%) | 3,296 (27.2%) |
| Total | 5,998 (100.0%) | 12,115 (100.0%) |
Property Value to Household Income Ratio in Orem
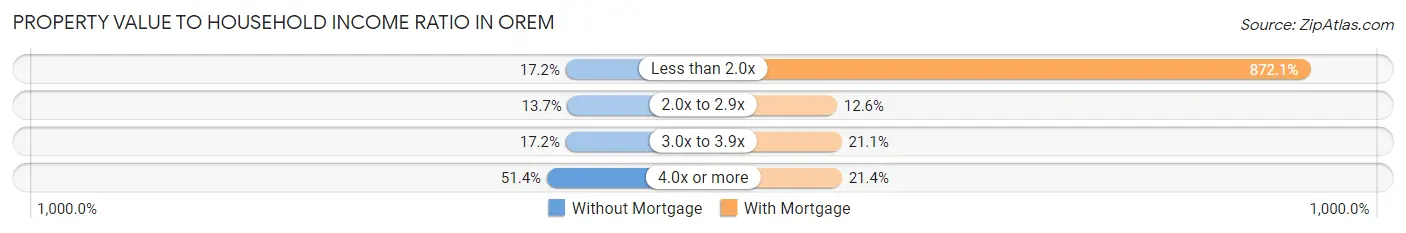
| Value-to-Income Ratio | Without Mortgage | With Mortgage |
| Less than 2.0x | 1,031 (17.2%) | 105,659 (872.1%) |
| 2.0x to 2.9x | 824 (13.7%) | 1,526 (12.6%) |
| 3.0x to 3.9x | 1,029 (17.2%) | 2,556 (21.1%) |
| 4.0x or more | 3,084 (51.4%) | 2,598 (21.4%) |
| Total | 5,998 (100.0%) | 12,115 (100.0%) |
Real Estate Taxes by Mortgage Status in Orem
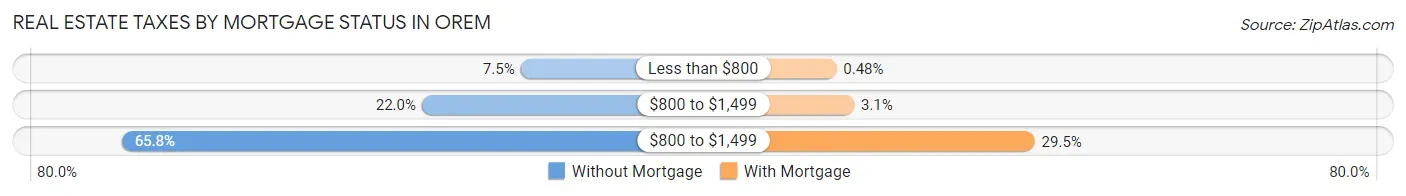
| Property Taxes | Without Mortgage | With Mortgage |
| Less than $800 | 452 (7.5%) | 58 (0.5%) |
| $800 to $1,499 | 1,317 (22.0%) | 372 (3.1%) |
| $800 to $1,499 | 3,947 (65.8%) | 3,569 (29.5%) |
| Total | 5,998 (100.0%) | 12,115 (100.0%) |
Health & Disability in Orem
Health Insurance Coverage by Age in Orem
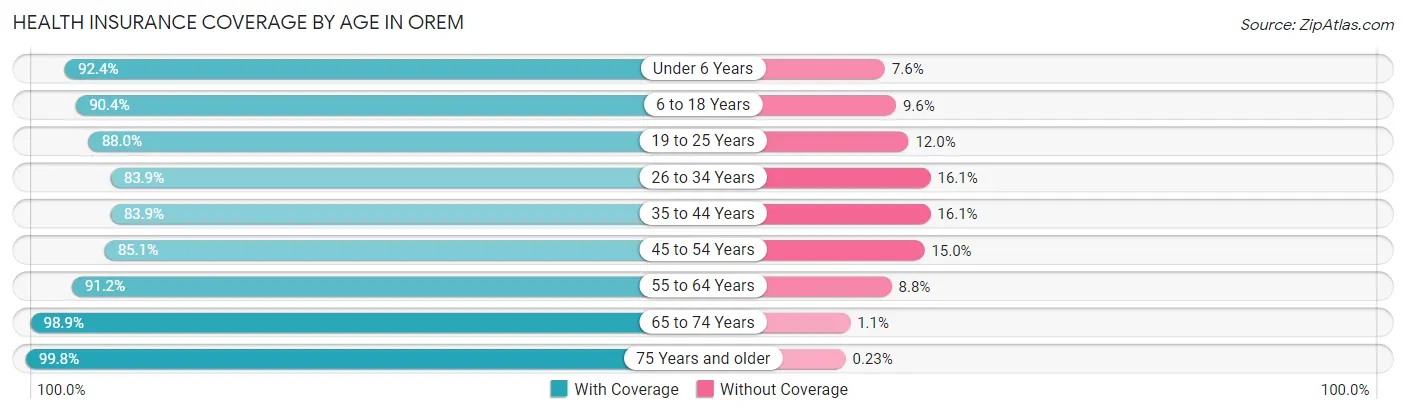
| Age Bracket | With Coverage | Without Coverage |
| Under 6 Years | 8,020 (92.4%) | 657 (7.6%) |
| 6 to 18 Years | 18,081 (90.4%) | 1,929 (9.6%) |
| 19 to 25 Years | 15,925 (88.0%) | 2,166 (12.0%) |
| 26 to 34 Years | 11,475 (83.9%) | 2,198 (16.1%) |
| 35 to 44 Years | 9,129 (83.9%) | 1,746 (16.1%) |
| 45 to 54 Years | 7,209 (85.1%) | 1,267 (14.9%) |
| 55 to 64 Years | 6,481 (91.2%) | 627 (8.8%) |
| 65 to 74 Years | 5,457 (98.9%) | 61 (1.1%) |
| 75 Years and older | 4,273 (99.8%) | 10 (0.2%) |
| Total | 86,050 (89.0%) | 10,661 (11.0%) |
Health Insurance Coverage by Citizenship Status in Orem
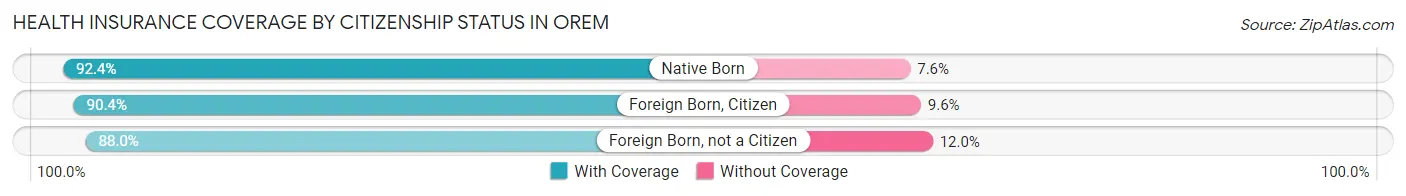
| Citizenship Status | With Coverage | Without Coverage |
| Native Born | 8,020 (92.4%) | 657 (7.6%) |
| Foreign Born, Citizen | 18,081 (90.4%) | 1,929 (9.6%) |
| Foreign Born, not a Citizen | 15,925 (88.0%) | 2,166 (12.0%) |
Health Insurance Coverage by Household Income in Orem
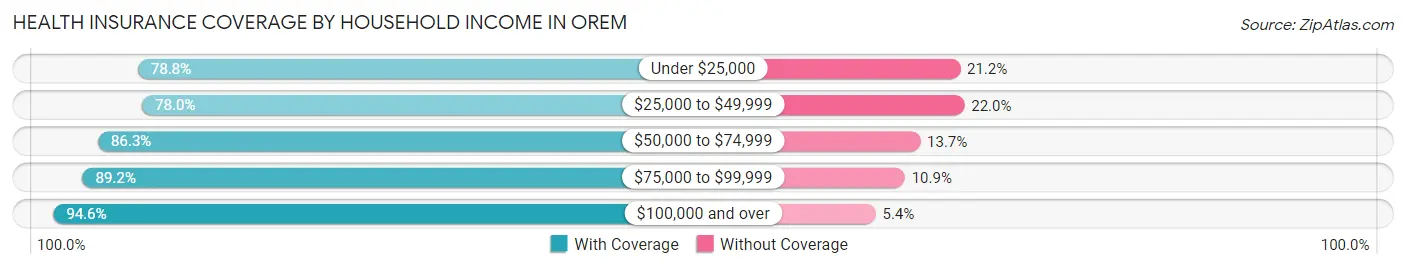
| Household Income | With Coverage | Without Coverage |
| Under $25,000 | 5,211 (78.8%) | 1,404 (21.2%) |
| $25,000 to $49,999 | 10,239 (78.0%) | 2,891 (22.0%) |
| $50,000 to $74,999 | 14,799 (86.3%) | 2,357 (13.7%) |
| $75,000 to $99,999 | 13,057 (89.1%) | 1,589 (10.8%) |
| $100,000 and over | 40,846 (94.6%) | 2,323 (5.4%) |
Public vs Private Health Insurance Coverage by Age in Orem
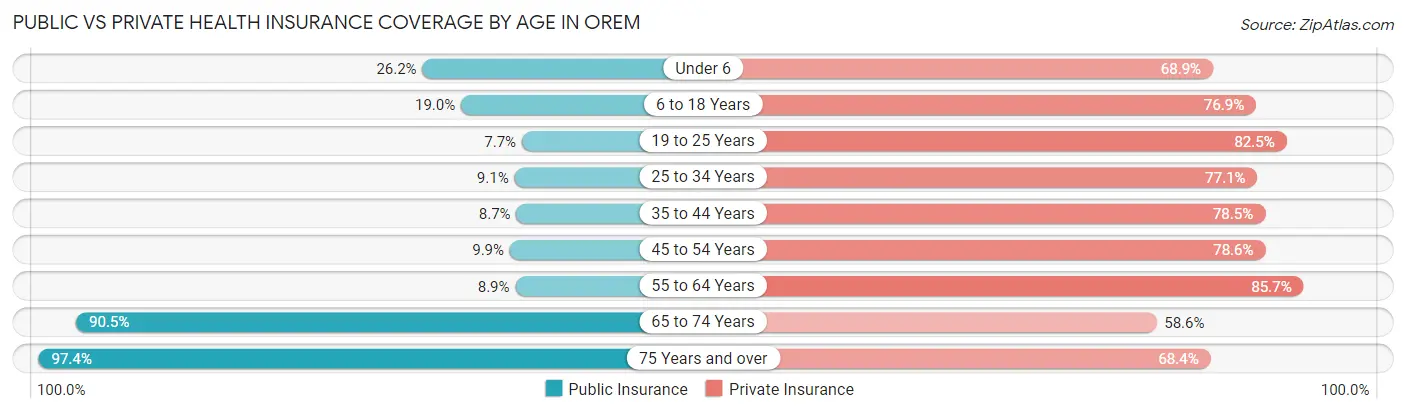
| Age Bracket | Public Insurance | Private Insurance |
| Under 6 | 2,269 (26.2%) | 5,977 (68.9%) |
| 6 to 18 Years | 3,800 (19.0%) | 15,383 (76.9%) |
| 19 to 25 Years | 1,391 (7.7%) | 14,931 (82.5%) |
| 25 to 34 Years | 1,240 (9.1%) | 10,547 (77.1%) |
| 35 to 44 Years | 947 (8.7%) | 8,541 (78.5%) |
| 45 to 54 Years | 842 (9.9%) | 6,662 (78.6%) |
| 55 to 64 Years | 633 (8.9%) | 6,091 (85.7%) |
| 65 to 74 Years | 4,991 (90.4%) | 3,232 (58.6%) |
| 75 Years and over | 4,172 (97.4%) | 2,931 (68.4%) |
| Total | 20,285 (21.0%) | 74,295 (76.8%) |
Disability Status by Sex by Age in Orem
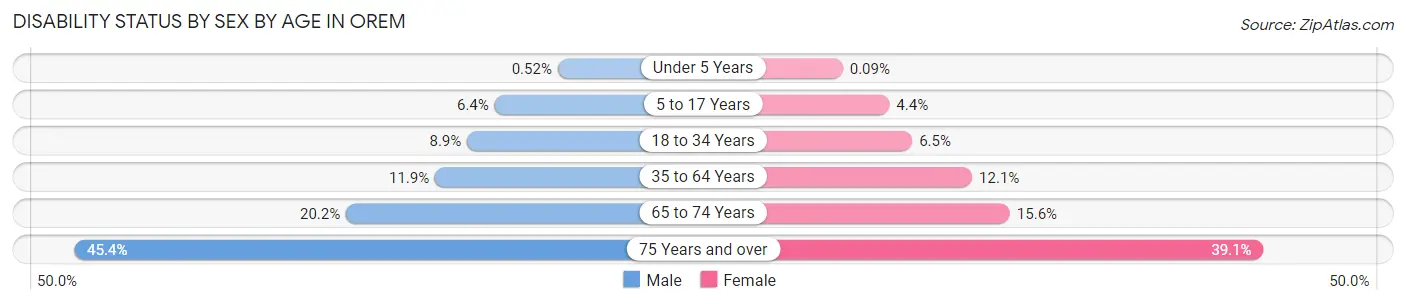
| Age Bracket | Male | Female |
| Under 5 Years | 21 (0.5%) | 3 (0.1%) |
| 5 to 17 Years | 623 (6.4%) | 403 (4.4%) |
| 18 to 34 Years | 1,580 (8.9%) | 1,072 (6.5%) |
| 35 to 64 Years | 1,547 (11.9%) | 1,631 (12.1%) |
| 65 to 74 Years | 526 (20.2%) | 454 (15.6%) |
| 75 Years and over | 898 (45.4%) | 902 (39.1%) |
Disability Class by Sex by Age in Orem
Disability Class: Hearing Difficulty
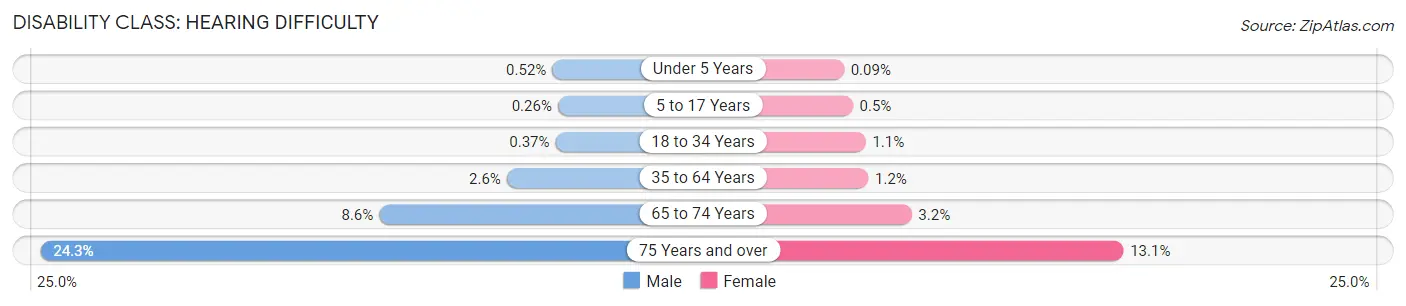
| Age Bracket | Male | Female |
| Under 5 Years | 21 (0.5%) | 3 (0.1%) |
| 5 to 17 Years | 25 (0.3%) | 46 (0.5%) |
| 18 to 34 Years | 65 (0.4%) | 180 (1.1%) |
| 35 to 64 Years | 342 (2.6%) | 165 (1.2%) |
| 65 to 74 Years | 223 (8.6%) | 94 (3.2%) |
| 75 Years and over | 480 (24.3%) | 301 (13.1%) |
Disability Class: Vision Difficulty
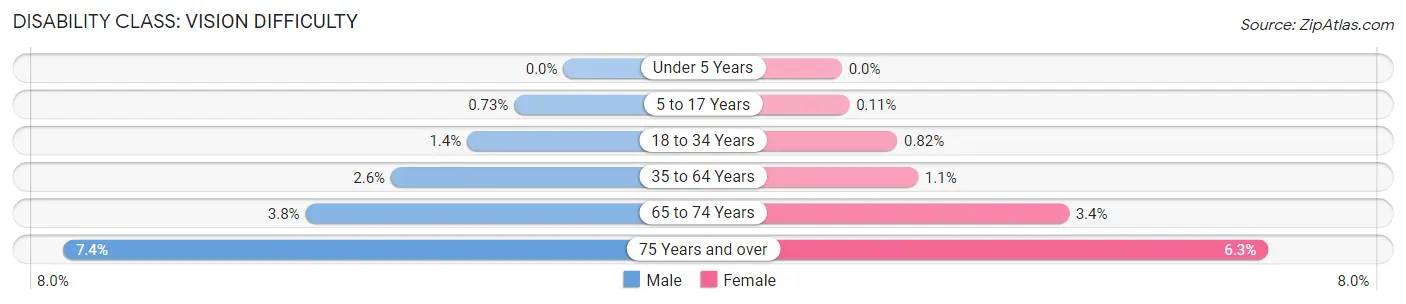
| Age Bracket | Male | Female |
| Under 5 Years | 0 (0.0%) | 0 (0.0%) |
| 5 to 17 Years | 71 (0.7%) | 10 (0.1%) |
| 18 to 34 Years | 253 (1.4%) | 134 (0.8%) |
| 35 to 64 Years | 333 (2.6%) | 152 (1.1%) |
| 65 to 74 Years | 100 (3.8%) | 98 (3.4%) |
| 75 Years and over | 147 (7.4%) | 146 (6.3%) |
Disability Class: Cognitive Difficulty
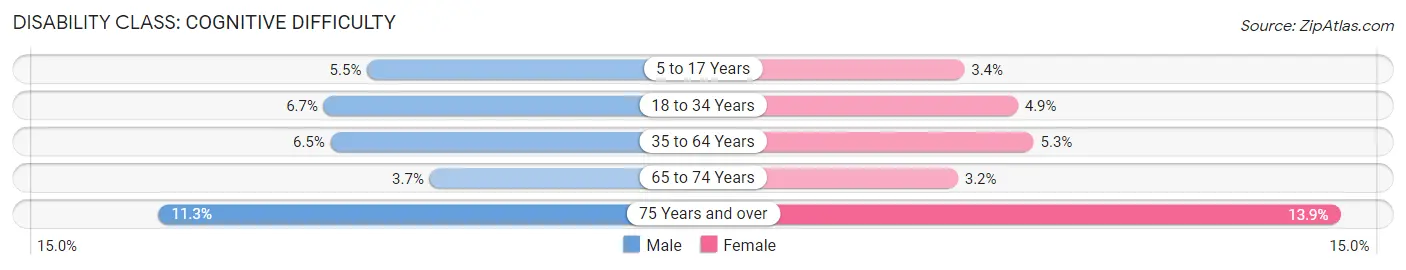
| Age Bracket | Male | Female |
| 5 to 17 Years | 533 (5.5%) | 311 (3.4%) |
| 18 to 34 Years | 1,180 (6.7%) | 803 (4.9%) |
| 35 to 64 Years | 842 (6.5%) | 719 (5.3%) |
| 65 to 74 Years | 97 (3.7%) | 94 (3.2%) |
| 75 Years and over | 223 (11.3%) | 320 (13.9%) |
Disability Class: Ambulatory Difficulty
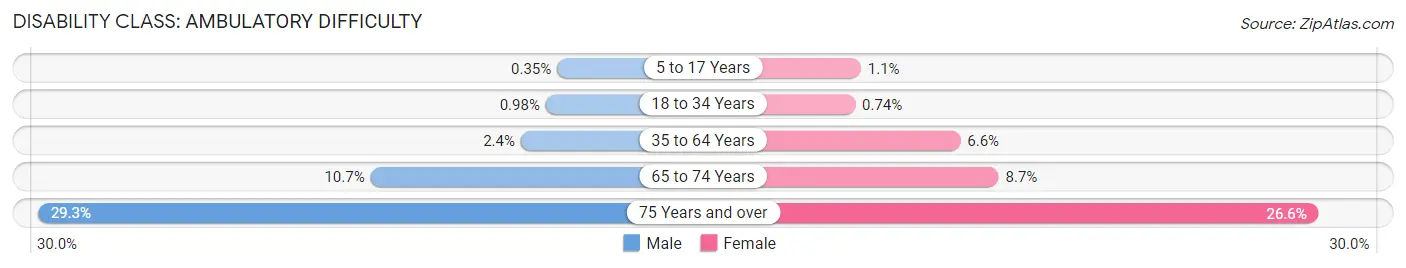
| Age Bracket | Male | Female |
| 5 to 17 Years | 34 (0.4%) | 97 (1.1%) |
| 18 to 34 Years | 174 (1.0%) | 122 (0.7%) |
| 35 to 64 Years | 308 (2.4%) | 889 (6.6%) |
| 65 to 74 Years | 280 (10.7%) | 254 (8.7%) |
| 75 Years and over | 579 (29.3%) | 612 (26.6%) |
Disability Class: Self-Care Difficulty
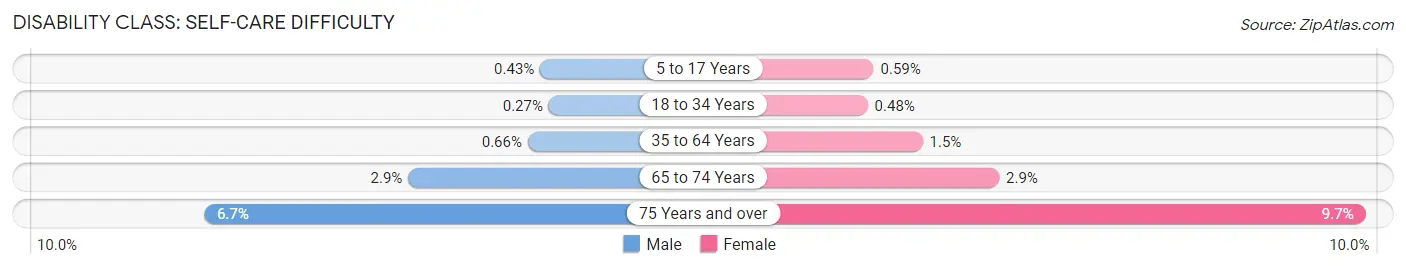
| Age Bracket | Male | Female |
| 5 to 17 Years | 42 (0.4%) | 54 (0.6%) |
| 18 to 34 Years | 48 (0.3%) | 79 (0.5%) |
| 35 to 64 Years | 86 (0.7%) | 202 (1.5%) |
| 65 to 74 Years | 75 (2.9%) | 85 (2.9%) |
| 75 Years and over | 132 (6.7%) | 224 (9.7%) |
Technology Access in Orem
Computing Device Access in Orem
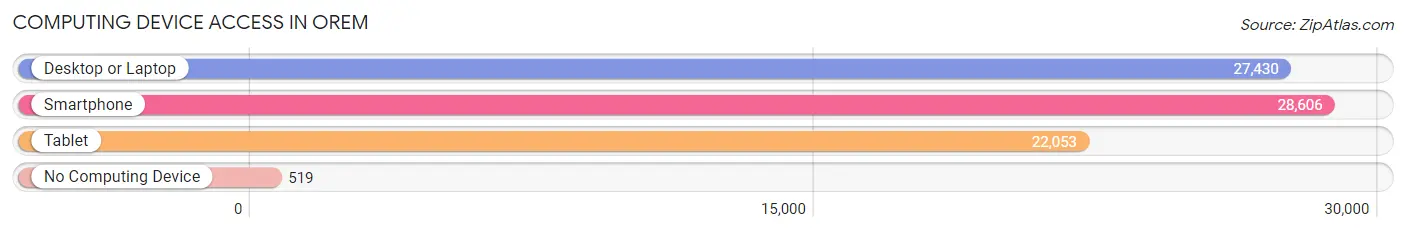
| Device Type | # Households | % Households |
| Desktop or Laptop | 27,430 | 90.7% |
| Smartphone | 28,606 | 94.6% |
| Tablet | 22,053 | 72.9% |
| No Computing Device | 519 | 1.7% |
| Total | 30,239 | 100.0% |
Internet Access in Orem
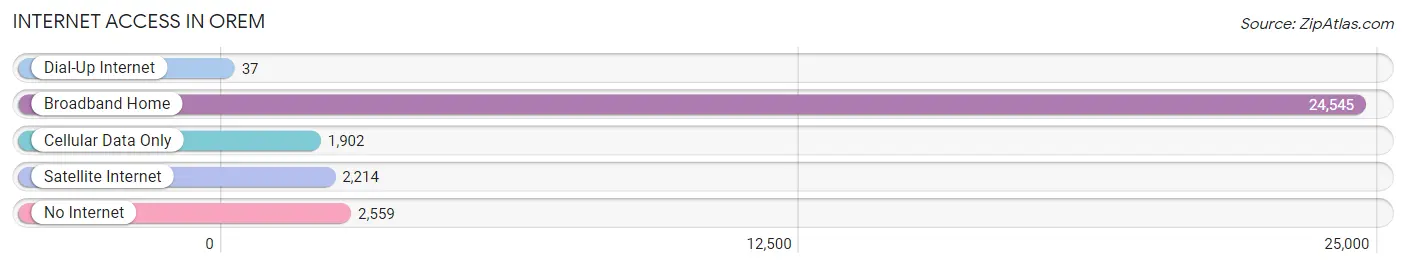
| Internet Type | # Households | % Households |
| Dial-Up Internet | 37 | 0.1% |
| Broadband Home | 24,545 | 81.2% |
| Cellular Data Only | 1,902 | 6.3% |
| Satellite Internet | 2,214 | 7.3% |
| No Internet | 2,559 | 8.5% |
| Total | 30,239 | 100.0% |
Orem Summary
Orem, Utah is a city located in Utah County, Utah, United States. It is part of the Provo-Orem Metropolitan Statistical Area. The population was 84,324 at the 2010 census, making it the fifth-largest city in Utah. Orem is located in the northern part of Utah Valley at the base of Mount Timpanogos. It is adjacent to Provo, Lindon, and Vineyard and is about 45 miles south of Salt Lake City and the Wasatch Front.
History
Orem was first settled in 1877 by David O. Calder, who was a Mormon pioneer. He named the city after his son, Walter C. Orem. The city was incorporated in 1919 and was originally known as Provo Bench. In the early 1900s, Orem was a small agricultural community. It was known for its fruit orchards and was the home of the Orem Fruit Growers Association.
Geography
Orem is located in the northern part of Utah Valley at the base of Mount Timpanogos. It is bordered by Provo to the east, Lindon to the north, Vineyard to the west, and American Fork to the south. The city has a total area of 16.3 square miles, of which 16.2 square miles is land and 0.1 square miles is water.
Economy
Orem is home to several large employers, including Utah Valley University, Novell, Inc., and the Orem City Corporation. The city is also home to several small businesses, including restaurants, retail stores, and service providers.
The city's economy is largely based on education, healthcare, and technology. The city is home to several educational institutions, including Utah Valley University, Brigham Young University, and the Utah Valley Regional Medical Center.
Demographics
As of the 2010 census, there were 84,324 people, 24,811 households, and 19,813 families residing in the city. The population density was 5,169.7 people per square mile. The racial makeup of the city was 87.2% White, 1.3% African American, 0.7% Native American, 2.5% Asian, 0.2% Pacific Islander, 5.9% from other races, and 2.4% from two or more races. Hispanic or Latino of any race were 11.7% of the population.
The median income for a household in the city was $50,856, and the median income for a family was $59,817. Males had a median income of $41,845 versus $30,858 for females. The per capita income for the city was $20,945. About 6.2% of families and 8.7% of the population were below the poverty line, including 10.2% of those under age 18 and 4.7% of those age 65 or over.
Conclusion
Orem, Utah is a city located in Utah County, Utah, United States. It is part of the Provo-Orem Metropolitan Statistical Area. The city has a rich history, with its first settlement in 1877 by David O. Calder. Orem is located in the northern part of Utah Valley at the base of Mount Timpanogos and is bordered by Provo, Lindon, Vineyard, and American Fork. The city's economy is largely based on education, healthcare, and technology. As of the 2010 census, the population of Orem was 84,324. The median income for a household in the city was $50,856, and the median income for a family was $59,817. Orem is a vibrant city with a diverse population and a strong economy.
Common Questions
What is Per Capita Income in Orem?
Per Capita income in Orem is $32,143.
What is the Median Family Income in Orem?
Median Family Income in Orem is $84,323.
What is the Median Household income in Orem?
Median Household Income in Orem is $77,568.
What is Income or Wage Gap in Orem?
Income or Wage Gap in Orem is 40.5%.
Women in Orem earn 59.5 cents for every dollar earned by a man.
What is Family Income Deficit in Orem?
Family Income Deficit in Orem is $10,128.
Families that are below poverty line in Orem earn $10,128 less on average than the poverty threshold level.
What is Inequality or Gini Index in Orem?
Inequality or Gini Index in Orem is 0.43.
What is the Total Population of Orem?
Total Population of Orem is 97,100.
What is the Total Male Population of Orem?
Total Male Population of Orem is 49,279.
What is the Total Female Population of Orem?
Total Female Population of Orem is 47,821.
What is the Ratio of Males per 100 Females in Orem?
There are 103.05 Males per 100 Females in Orem.
What is the Ratio of Females per 100 Males in Orem?
There are 97.04 Females per 100 Males in Orem.
What is the Median Population Age in Orem?
Median Population Age in Orem is 26.8 Years.
What is the Average Family Size in Orem
Average Family Size in Orem is 3.5 People.
What is the Average Household Size in Orem
Average Household Size in Orem is 3.1 People.
How Large is the Labor Force in Orem?
There are 52,609 People in the Labor Forcein in Orem.
What is the Percentage of People in the Labor Force in Orem?
71.3% of People are in the Labor Force in Orem.
What is the Unemployment Rate in Orem?
Unemployment Rate in Orem is 3.4%.