Bountiful, UT Map & Demographics
Bountiful Map
Bountiful Overview
$41,107
PER CAPITA INCOME
$112,076
AVG FAMILY INCOME
$96,060
AVG HOUSEHOLD INCOME
40.0%
WAGE / INCOME GAP [ % ]
60.0¢/ $1
WAGE / INCOME GAP [ $ ]
0.43
INEQUALITY / GINI INDEX
45,353
TOTAL POPULATION
22,372
MALE POPULATION
22,981
FEMALE POPULATION
97.35
MALES / 100 FEMALES
102.72
FEMALES / 100 MALES
32.2
MEDIAN AGE
3.6
AVG FAMILY SIZE
3.1
AVG HOUSEHOLD SIZE
22,095
LABOR FORCE [ PEOPLE ]
66.5%
PERCENT IN LABOR FORCE
2.6%
UNEMPLOYMENT RATE
Bountiful Zip Codes
Bountiful Area Codes
Income in Bountiful
Income Overview in Bountiful
Per Capita Income in Bountiful is $41,107, while median incomes of families and households are $112,076 and $96,060 respectively.
| Characteristic | Number | Measure |
| Per Capita Income | 45,353 | $41,107 |
| Median Family Income | 10,818 | $112,076 |
| Mean Family Income | 10,818 | $139,453 |
| Median Household Income | 14,505 | $96,060 |
| Mean Household Income | 14,505 | $123,037 |
| Income Deficit | 10,818 | $0 |
| Wage / Income Gap (%) | 45,353 | 40.01% |
| Wage / Income Gap ($) | 45,353 | 59.99¢ per $1 |
| Gini / Inequality Index | 45,353 | 0.43 |
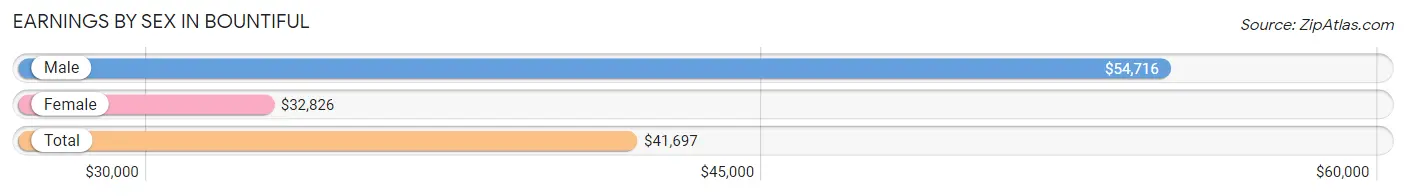
Earnings by Sex in Bountiful
Average Earnings in Bountiful are $41,697, $54,716 for men and $32,826 for women, a difference of 40.0%.
| Sex | Number | Average Earnings |
| Male | 12,964 (55.5%) | $54,716 |
| Female | 10,388 (44.5%) | $32,826 |
| Total | 23,352 (100.0%) | $41,697 |
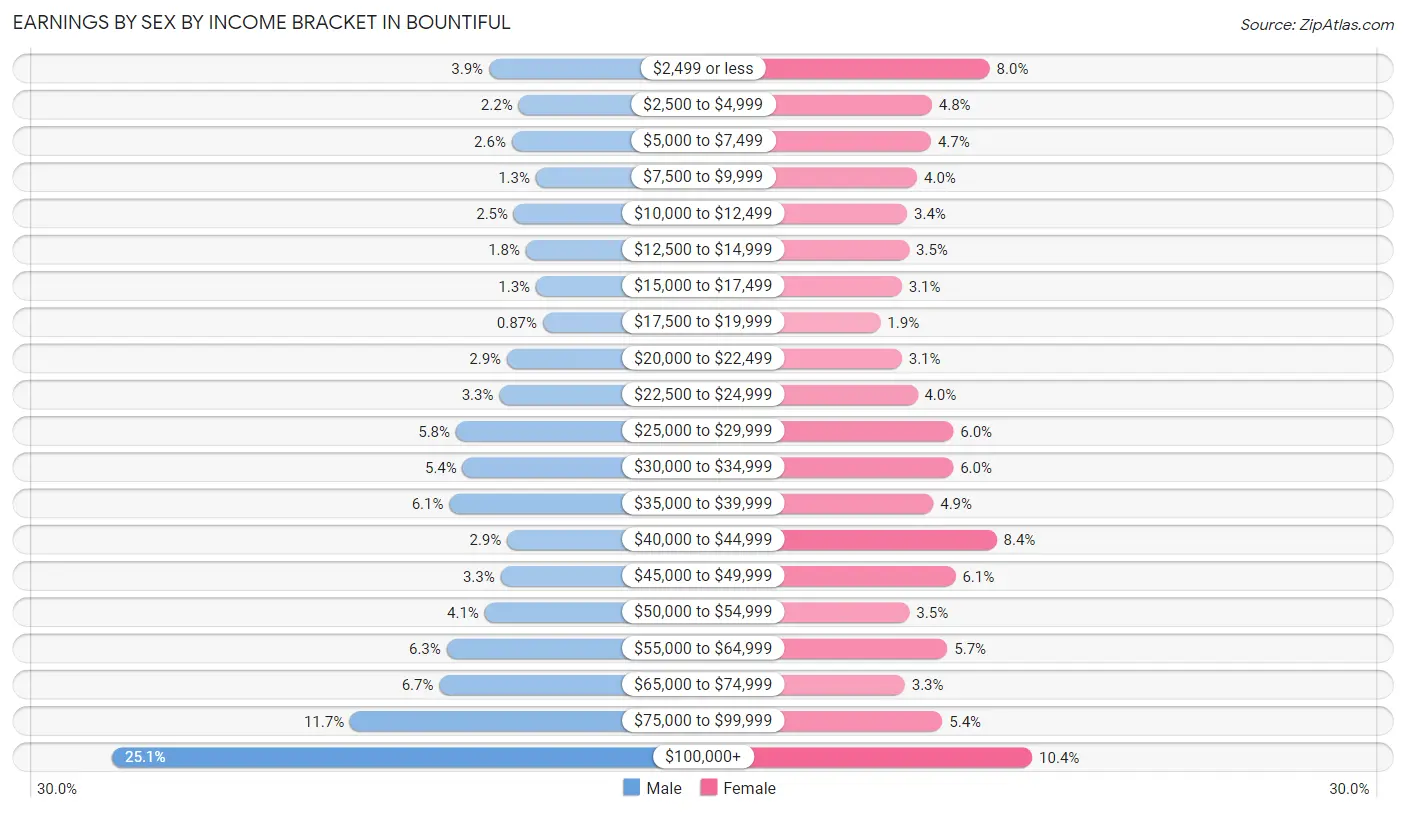
Earnings by Sex by Income Bracket in Bountiful
The most common earnings brackets in Bountiful are $100,000+ for men (3,251 | 25.1%) and $100,000+ for women (1,082 | 10.4%).
| Income | Male | Female |
| $2,499 or less | 505 (3.9%) | 834 (8.0%) |
| $2,500 to $4,999 | 291 (2.2%) | 497 (4.8%) |
| $5,000 to $7,499 | 340 (2.6%) | 491 (4.7%) |
| $7,500 to $9,999 | 165 (1.3%) | 410 (4.0%) |
| $10,000 to $12,499 | 324 (2.5%) | 352 (3.4%) |
| $12,500 to $14,999 | 237 (1.8%) | 364 (3.5%) |
| $15,000 to $17,499 | 163 (1.3%) | 321 (3.1%) |
| $17,500 to $19,999 | 113 (0.9%) | 196 (1.9%) |
| $20,000 to $22,499 | 375 (2.9%) | 321 (3.1%) |
| $22,500 to $24,999 | 431 (3.3%) | 412 (4.0%) |
| $25,000 to $29,999 | 747 (5.8%) | 622 (6.0%) |
| $30,000 to $34,999 | 697 (5.4%) | 621 (6.0%) |
| $35,000 to $39,999 | 795 (6.1%) | 505 (4.9%) |
| $40,000 to $44,999 | 373 (2.9%) | 875 (8.4%) |
| $45,000 to $49,999 | 421 (3.3%) | 635 (6.1%) |
| $50,000 to $54,999 | 537 (4.1%) | 366 (3.5%) |
| $55,000 to $64,999 | 814 (6.3%) | 587 (5.7%) |
| $65,000 to $74,999 | 867 (6.7%) | 339 (3.3%) |
| $75,000 to $99,999 | 1,518 (11.7%) | 558 (5.4%) |
| $100,000+ | 3,251 (25.1%) | 1,082 (10.4%) |
| Total | 12,964 (100.0%) | 10,388 (100.0%) |
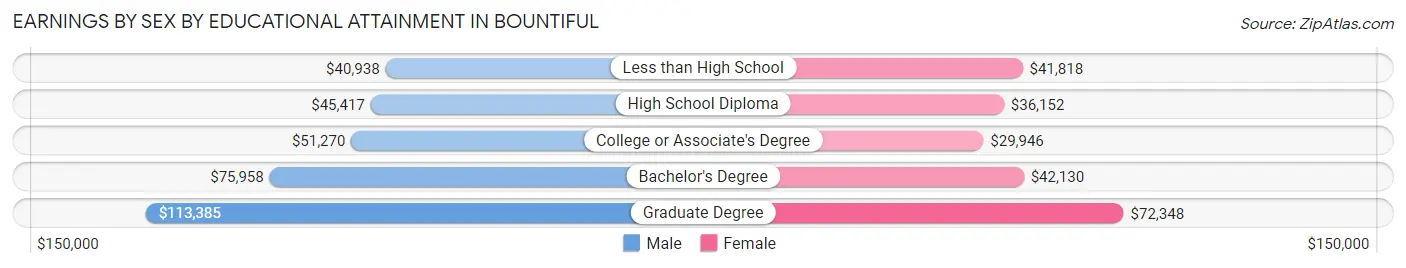
Earnings by Sex by Educational Attainment in Bountiful
Average earnings in Bountiful are $67,343 for men and $40,140 for women, a difference of 40.4%. Men with an educational attainment of graduate degree enjoy the highest average annual earnings of $113,385, while those with less than high school education earn the least with $40,938. Women with an educational attainment of graduate degree earn the most with the average annual earnings of $72,348, while those with college or associate's degree education have the smallest earnings of $29,946.
| Educational Attainment | Male Income | Female Income |
| Less than High School | $40,938 | $41,818 |
| High School Diploma | $45,417 | $36,152 |
| College or Associate's Degree | $51,270 | $29,946 |
| Bachelor's Degree | $75,958 | $42,130 |
| Graduate Degree | $113,385 | $72,348 |
| Total | $67,343 | $40,140 |
Family Income in Bountiful
Family Income Brackets in Bountiful
According to the Bountiful family income data, there are 2,704 families falling into the $100,000 to $149,999 income range, which is the most common income bracket and makes up 25.0% of all families. Conversely, the $10,000 to $14,999 income bracket is the least frequent group with only 76 families (0.7%) belonging to this category.
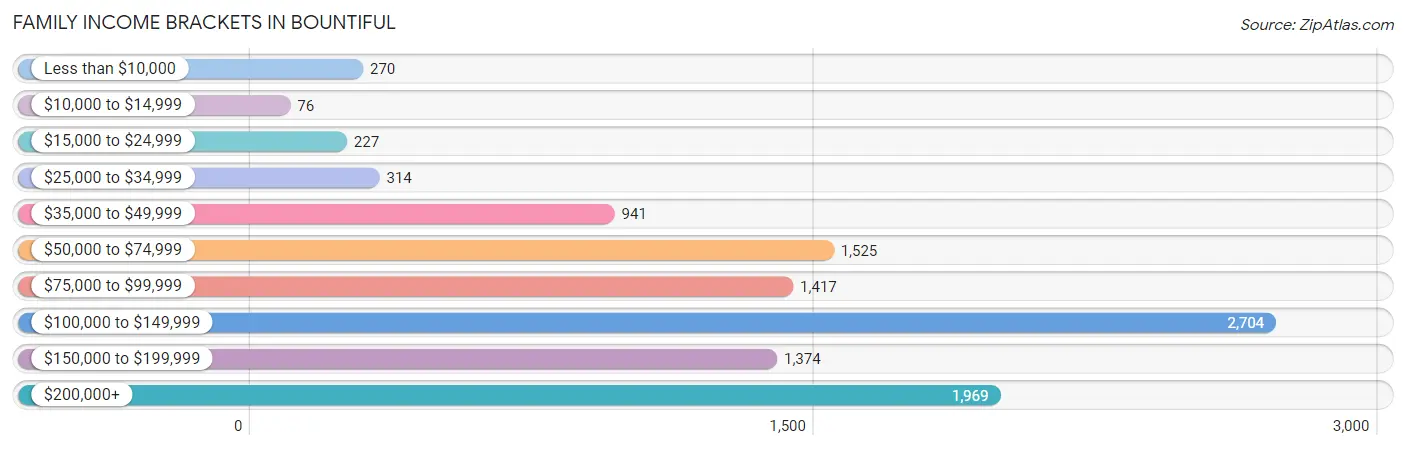
| Income Bracket | # Families | % Families |
| Less than $10,000 | 270 | 2.5% |
| $10,000 to $14,999 | 76 | 0.7% |
| $15,000 to $24,999 | 227 | 2.1% |
| $25,000 to $34,999 | 314 | 2.9% |
| $35,000 to $49,999 | 941 | 8.7% |
| $50,000 to $74,999 | 1,525 | 14.1% |
| $75,000 to $99,999 | 1,417 | 13.1% |
| $100,000 to $149,999 | 2,704 | 25.0% |
| $150,000 to $199,999 | 1,374 | 12.7% |
| $200,000+ | 1,969 | 18.2% |
Family Income by Famaliy Size in Bountiful
7+ person families (544 | 5.0%) account for the highest median family income in Bountiful with $153,125 per family, while 2-person families (4,419 | 40.8%) have the highest median income of $44,105 per family member.
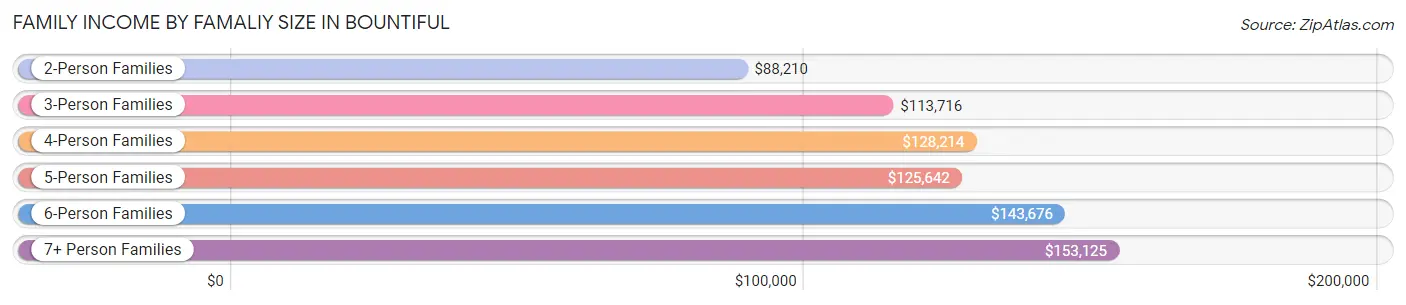
| Income Bracket | # Families | Median Income |
| 2-Person Families | 4,419 (40.8%) | $88,210 |
| 3-Person Families | 1,792 (16.6%) | $113,716 |
| 4-Person Families | 1,870 (17.3%) | $128,214 |
| 5-Person Families | 1,505 (13.9%) | $125,642 |
| 6-Person Families | 688 (6.4%) | $143,676 |
| 7+ Person Families | 544 (5.0%) | $153,125 |
| Total | 10,818 (100.0%) | $112,076 |
Family Income by Number of Earners in Bountiful
The median family income in Bountiful is $112,076, with families comprising 3+ earners (1,841) having the highest median family income of $160,446, while families with no earners (1,376) have the lowest median family income of $61,143, accounting for 17.0% and 12.7% of families, respectively.
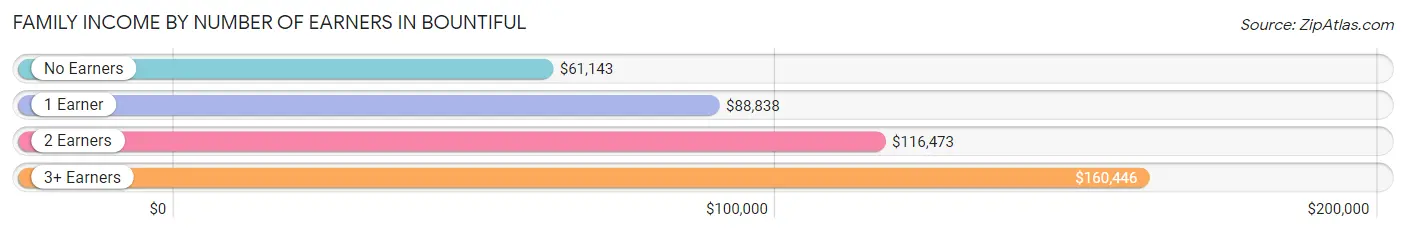
| Number of Earners | # Families | Median Income |
| No Earners | 1,376 (12.7%) | $61,143 |
| 1 Earner | 2,967 (27.4%) | $88,838 |
| 2 Earners | 4,634 (42.8%) | $116,473 |
| 3+ Earners | 1,841 (17.0%) | $160,446 |
| Total | 10,818 (100.0%) | $112,076 |
Household Income in Bountiful
Household Income Brackets in Bountiful
With 3,438 households falling in the category, the $100,000 to $149,999 income range is the most frequent in Bountiful, accounting for 23.7% of all households. In contrast, only 174 households (1.2%) fall into the $10,000 to $14,999 income bracket, making it the least populous group.
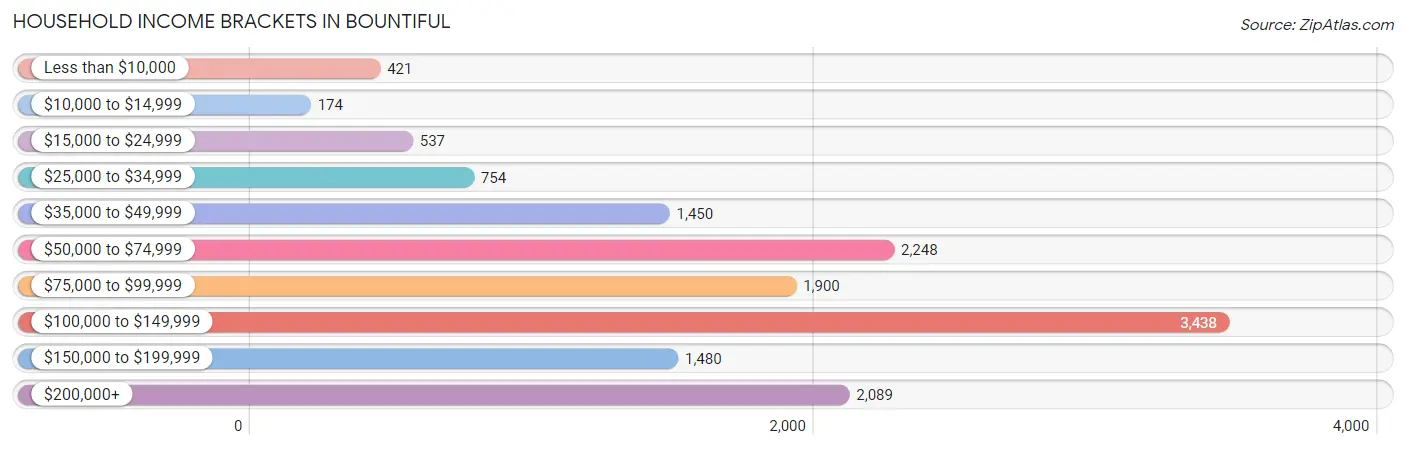
| Income Bracket | # Households | % Households |
| Less than $10,000 | 421 | 2.9% |
| $10,000 to $14,999 | 174 | 1.2% |
| $15,000 to $24,999 | 537 | 3.7% |
| $25,000 to $34,999 | 754 | 5.2% |
| $35,000 to $49,999 | 1,450 | 10.0% |
| $50,000 to $74,999 | 2,248 | 15.5% |
| $75,000 to $99,999 | 1,900 | 13.1% |
| $100,000 to $149,999 | 3,438 | 23.7% |
| $150,000 to $199,999 | 1,480 | 10.2% |
| $200,000+ | 2,089 | 14.4% |
Household Income by Householder Age in Bountiful
The median household income in Bountiful is $96,060, with the highest median household income of $131,596 found in the 45 to 64 years age bracket for the primary householder. A total of 4,228 households (29.1%) fall into this category. Meanwhile, the 65+ years age bracket for the primary householder has the lowest median household income of $67,289, with 3,792 households (26.1%) in this group.
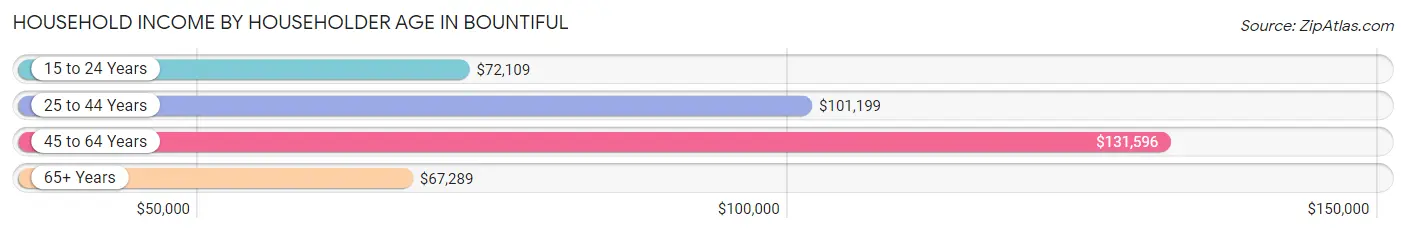
| Income Bracket | # Households | Median Income |
| 15 to 24 Years | 555 (3.8%) | $72,109 |
| 25 to 44 Years | 5,930 (40.9%) | $101,199 |
| 45 to 64 Years | 4,228 (29.1%) | $131,596 |
| 65+ Years | 3,792 (26.1%) | $67,289 |
| Total | 14,505 (100.0%) | $96,060 |
Poverty in Bountiful
Income Below Poverty by Sex and Age in Bountiful
With 5.5% poverty level for males and 7.7% for females among the residents of Bountiful, 5 year old males and under 5 year old females are the most vulnerable to poverty, with 62 males (17.8%) and 306 females (15.6%) in their respective age groups living below the poverty level.
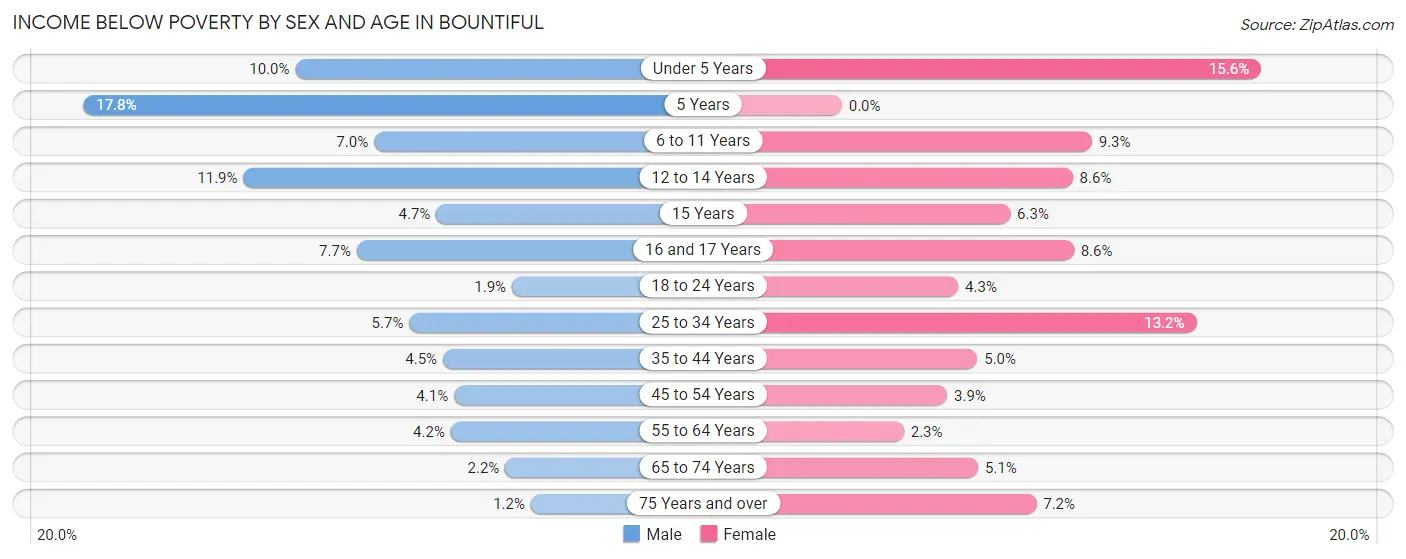
| Age Bracket | Male | Female |
| Under 5 Years | 194 (10.0%) | 306 (15.6%) |
| 5 Years | 62 (17.8%) | 0 (0.0%) |
| 6 to 11 Years | 160 (7.0%) | 192 (9.3%) |
| 12 to 14 Years | 133 (11.9%) | 103 (8.6%) |
| 15 Years | 16 (4.7%) | 20 (6.2%) |
| 16 and 17 Years | 47 (7.7%) | 59 (8.6%) |
| 18 to 24 Years | 33 (1.9%) | 84 (4.3%) |
| 25 to 34 Years | 233 (5.7%) | 502 (13.2%) |
| 35 to 44 Years | 124 (4.5%) | 133 (5.0%) |
| 45 to 54 Years | 76 (4.1%) | 70 (3.9%) |
| 55 to 64 Years | 92 (4.2%) | 53 (2.3%) |
| 65 to 74 Years | 33 (2.2%) | 92 (5.1%) |
| 75 Years and over | 15 (1.2%) | 127 (7.2%) |
| Total | 1,218 (5.5%) | 1,741 (7.7%) |
Income Above Poverty by Sex and Age in Bountiful
According to the poverty statistics in Bountiful, males aged 75 years and over and females aged 5 years are the age groups that are most secure financially, with 98.8% of males and 100.0% of females in these age groups living above the poverty line.
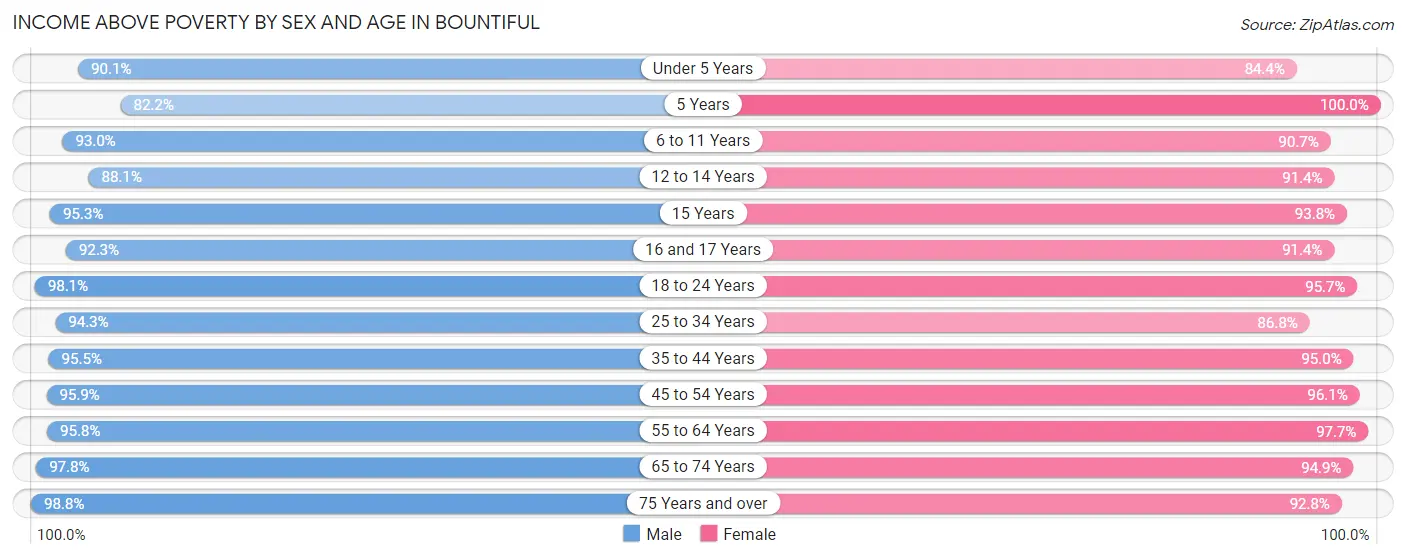
| Age Bracket | Male | Female |
| Under 5 Years | 1,755 (90.0%) | 1,660 (84.4%) |
| 5 Years | 286 (82.2%) | 342 (100.0%) |
| 6 to 11 Years | 2,116 (93.0%) | 1,876 (90.7%) |
| 12 to 14 Years | 987 (88.1%) | 1,099 (91.4%) |
| 15 Years | 323 (95.3%) | 300 (93.8%) |
| 16 and 17 Years | 566 (92.3%) | 626 (91.4%) |
| 18 to 24 Years | 1,696 (98.1%) | 1,861 (95.7%) |
| 25 to 34 Years | 3,839 (94.3%) | 3,314 (86.8%) |
| 35 to 44 Years | 2,647 (95.5%) | 2,513 (95.0%) |
| 45 to 54 Years | 1,795 (95.9%) | 1,720 (96.1%) |
| 55 to 64 Years | 2,110 (95.8%) | 2,254 (97.7%) |
| 65 to 74 Years | 1,498 (97.8%) | 1,725 (94.9%) |
| 75 Years and over | 1,222 (98.8%) | 1,632 (92.8%) |
| Total | 20,840 (94.5%) | 20,922 (92.3%) |
Income Below Poverty Among Married-Couple Families in Bountiful
The poverty statistics for married-couple families in Bountiful show that 3.6% or 332 of the total 9,109 families live below the poverty line. Families with 3 or 4 children have the highest poverty rate of 10.6%, comprising of 189 families. On the other hand, families with no children have the lowest poverty rate of 1.4%, which includes 64 families.
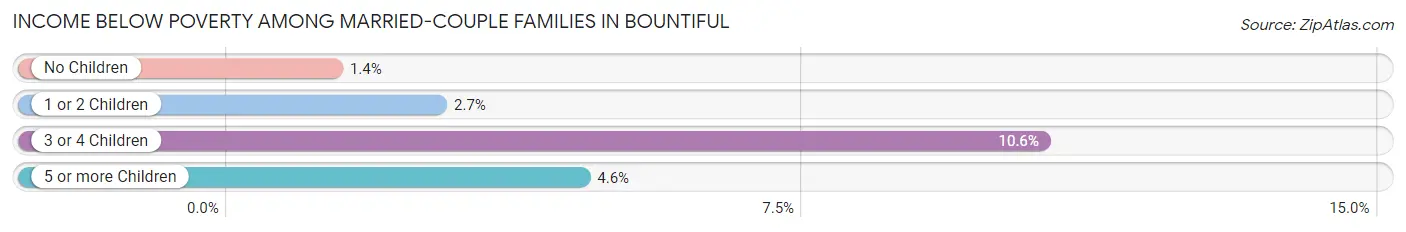
| Children | Above Poverty | Below Poverty |
| No Children | 4,605 (98.6%) | 64 (1.4%) |
| 1 or 2 Children | 2,248 (97.3%) | 63 (2.7%) |
| 3 or 4 Children | 1,592 (89.4%) | 189 (10.6%) |
| 5 or more Children | 332 (95.4%) | 16 (4.6%) |
| Total | 8,777 (96.4%) | 332 (3.6%) |
Income Below Poverty Among Single-Parent Households in Bountiful
According to the poverty data in Bountiful, 2.3% or 16 single-father households and 23.4% or 235 single-mother households are living below the poverty line. Among single-father households, those with no children have the highest poverty rate, with 16 households (3.3%) experiencing poverty. Likewise, among single-mother households, those with 3 or 4 children have the highest poverty rate, with 44 households (33.3%) falling below the poverty line.
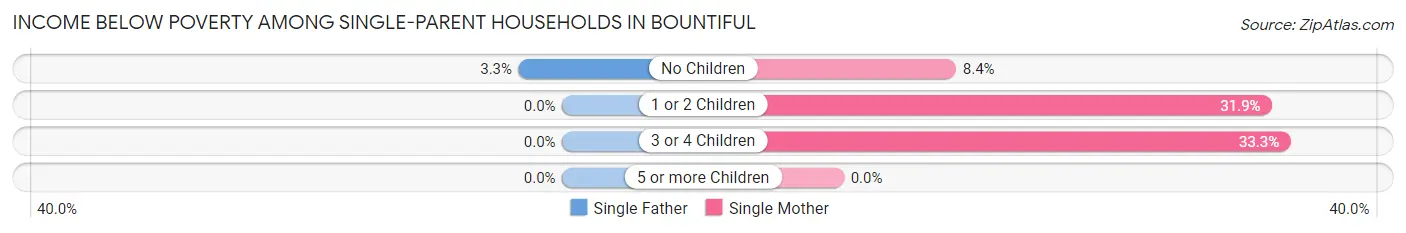
| Children | Single Father | Single Mother |
| No Children | 16 (3.3%) | 31 (8.4%) |
| 1 or 2 Children | 0 (0.0%) | 160 (31.9%) |
| 3 or 4 Children | 0 (0.0%) | 44 (33.3%) |
| 5 or more Children | 0 (0.0%) | 0 (0.0%) |
| Total | 16 (2.3%) | 235 (23.4%) |
Income Below Poverty Among Married-Couple vs Single-Parent Households in Bountiful
The poverty data for Bountiful shows that 332 of the married-couple family households (3.6%) and 251 of the single-parent households (14.7%) are living below the poverty level. Within the married-couple family households, those with 3 or 4 children have the highest poverty rate, with 189 households (10.6%) falling below the poverty line. Among the single-parent households, those with 3 or 4 children have the highest poverty rate, with 44 household (31.9%) living below poverty.
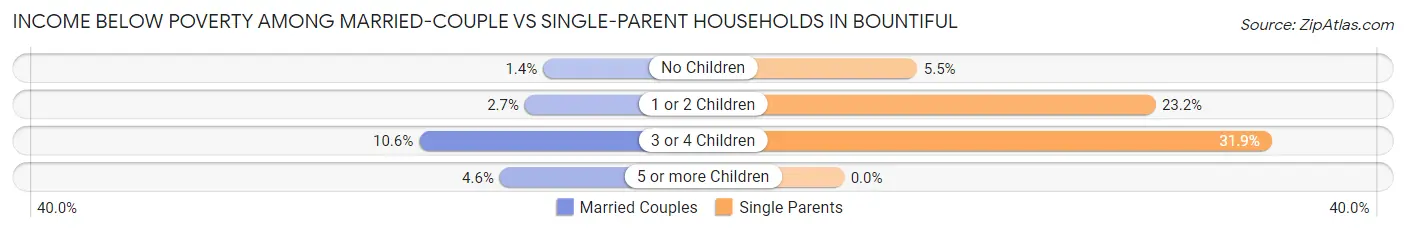
| Children | Married-Couple Families | Single-Parent Households |
| No Children | 64 (1.4%) | 47 (5.4%) |
| 1 or 2 Children | 63 (2.7%) | 160 (23.2%) |
| 3 or 4 Children | 189 (10.6%) | 44 (31.9%) |
| 5 or more Children | 16 (4.6%) | 0 (0.0%) |
| Total | 332 (3.6%) | 251 (14.7%) |
Race in Bountiful
The most populous races in Bountiful are White / Caucasian (40,684 | 89.7%), Hispanic or Latino (3,282 | 7.2%), and Two or more Races (2,320 | 5.1%).
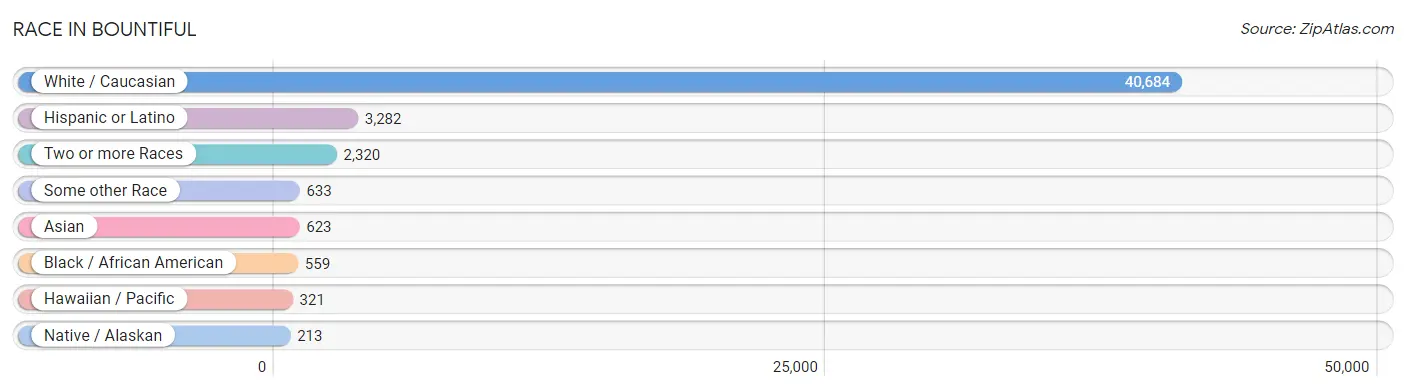
| Race | # Population | % Population |
| Asian | 623 | 1.4% |
| Black / African American | 559 | 1.2% |
| Hawaiian / Pacific | 321 | 0.7% |
| Hispanic or Latino | 3,282 | 7.2% |
| Native / Alaskan | 213 | 0.5% |
| White / Caucasian | 40,684 | 89.7% |
| Two or more Races | 2,320 | 5.1% |
| Some other Race | 633 | 1.4% |
| Total | 45,353 | 100.0% |
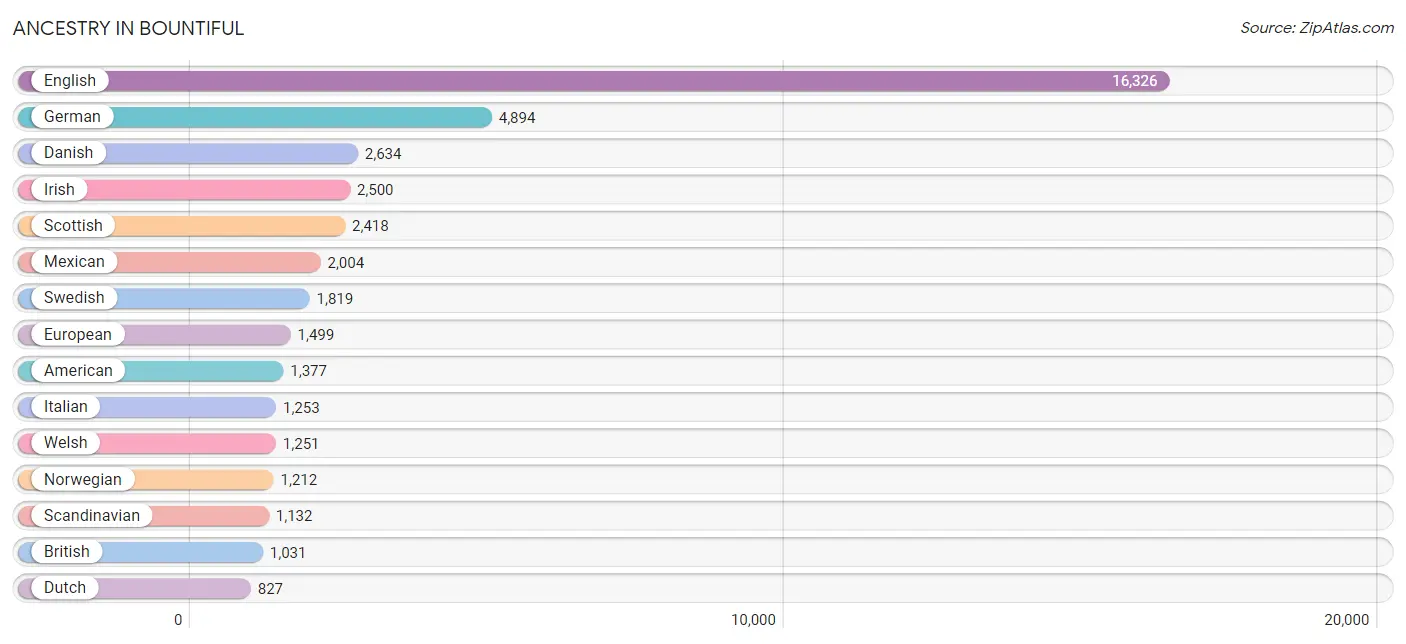
Ancestry in Bountiful
The most populous ancestries reported in Bountiful are English (16,326 | 36.0%), German (4,894 | 10.8%), Danish (2,634 | 5.8%), Irish (2,500 | 5.5%), and Scottish (2,418 | 5.3%), together accounting for 63.4% of all Bountiful residents.
| Ancestry | # Population | % Population |
| African | 180 | 0.4% |
| Alaskan Athabascan | 14 | 0.0% |
| Albanian | 37 | 0.1% |
| American | 1,377 | 3.0% |
| Arab | 144 | 0.3% |
| Arapaho | 10 | 0.0% |
| Australian | 36 | 0.1% |
| Austrian | 9 | 0.0% |
| Bangladeshi | 29 | 0.1% |
| Basque | 9 | 0.0% |
| Belgian | 29 | 0.1% |
| Bhutanese | 430 | 0.9% |
| Brazilian | 240 | 0.5% |
| British | 1,031 | 2.3% |
| Burmese | 201 | 0.4% |
| Cambodian | 1 | 0.0% |
| Canadian | 134 | 0.3% |
| Central American | 308 | 0.7% |
| Central American Indian | 45 | 0.1% |
| Cherokee | 135 | 0.3% |
| Chilean | 3 | 0.0% |
| Chippewa | 9 | 0.0% |
| Choctaw | 22 | 0.1% |
| Colombian | 60 | 0.1% |
| Comanche | 101 | 0.2% |
| Costa Rican | 18 | 0.0% |
| Croatian | 333 | 0.7% |
| Czech | 59 | 0.1% |
| Danish | 2,634 | 5.8% |
| Dominican | 17 | 0.0% |
| Dutch | 827 | 1.8% |
| Dutch West Indian | 7 | 0.0% |
| Eastern European | 78 | 0.2% |
| English | 16,326 | 36.0% |
| Ethiopian | 16 | 0.0% |
| European | 1,499 | 3.3% |
| Fijian | 2 | 0.0% |
| Finnish | 89 | 0.2% |
| French | 752 | 1.7% |
| French Canadian | 104 | 0.2% |
| German | 4,894 | 10.8% |
| Greek | 148 | 0.3% |
| Guamanian / Chamorro | 15 | 0.0% |
| Guatemalan | 192 | 0.4% |
| Honduran | 15 | 0.0% |
| Hungarian | 177 | 0.4% |
| Icelander | 22 | 0.1% |
| Indian (Asian) | 164 | 0.4% |
| Iranian | 7 | 0.0% |
| Irish | 2,500 | 5.5% |
| Iroquois | 32 | 0.1% |
| Italian | 1,253 | 2.8% |
| Korean | 91 | 0.2% |
| Laotian | 47 | 0.1% |
| Lebanese | 62 | 0.1% |
| Lithuanian | 21 | 0.1% |
| Mexican | 2,004 | 4.4% |
| Mexican American Indian | 46 | 0.1% |
| Native Hawaiian | 52 | 0.1% |
| Navajo | 101 | 0.2% |
| Northern European | 399 | 0.9% |
| Norwegian | 1,212 | 2.7% |
| Pakistani | 61 | 0.1% |
| Panamanian | 22 | 0.1% |
| Peruvian | 223 | 0.5% |
| Polish | 351 | 0.8% |
| Portuguese | 5 | 0.0% |
| Puerto Rican | 214 | 0.5% |
| Puget Sound Salish | 8 | 0.0% |
| Russian | 234 | 0.5% |
| Salvadoran | 61 | 0.1% |
| Samoan | 107 | 0.2% |
| Scandinavian | 1,132 | 2.5% |
| Scotch-Irish | 435 | 1.0% |
| Scottish | 2,418 | 5.3% |
| Serbian | 42 | 0.1% |
| Shoshone | 6 | 0.0% |
| Sioux | 41 | 0.1% |
| Slavic | 8 | 0.0% |
| Slovene | 41 | 0.1% |
| South American | 345 | 0.8% |
| Spanish | 206 | 0.4% |
| Sri Lankan | 176 | 0.4% |
| Subsaharan African | 196 | 0.4% |
| Swedish | 1,819 | 4.0% |
| Swiss | 611 | 1.3% |
| Syrian | 44 | 0.1% |
| Thai | 90 | 0.2% |
| Tongan | 227 | 0.5% |
| Ukrainian | 204 | 0.4% |
| Venezuelan | 59 | 0.1% |
| Welsh | 1,251 | 2.8% |
| Yaqui | 11 | 0.0% |
| Yugoslavian | 11 | 0.0% | View All 94 Rows |
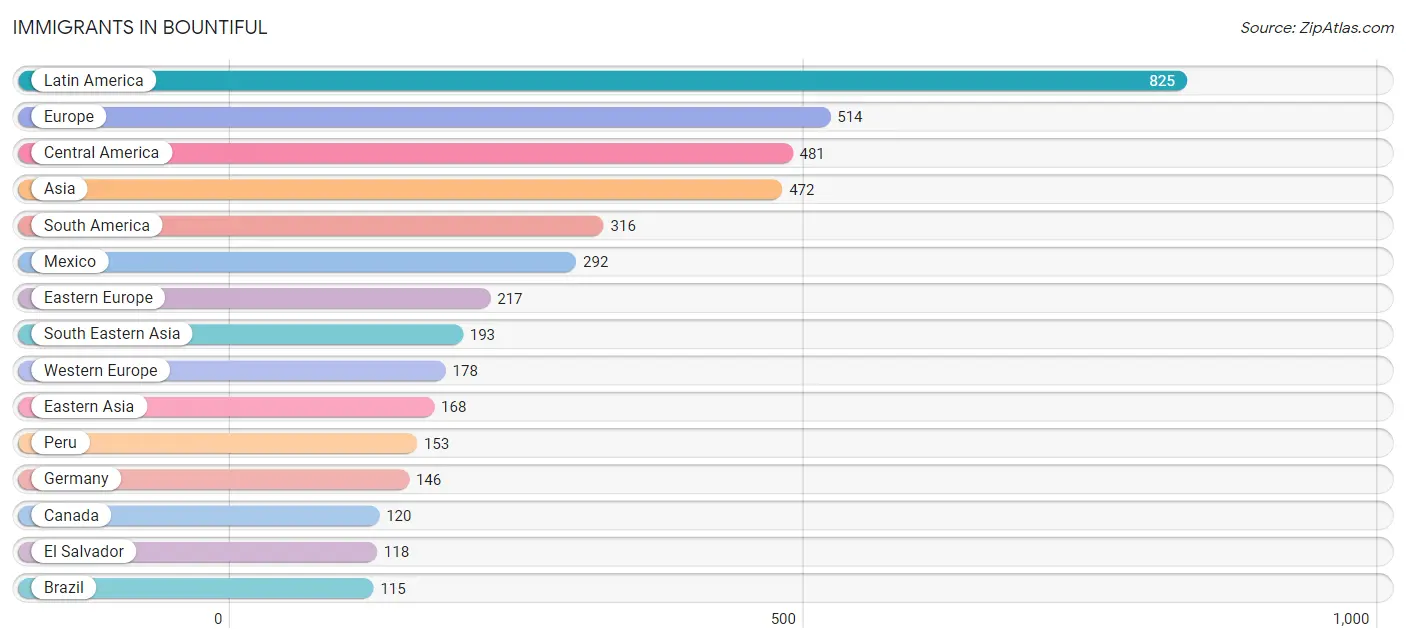
Immigrants in Bountiful
The most numerous immigrant groups reported in Bountiful came from Latin America (825 | 1.8%), Europe (514 | 1.1%), Central America (481 | 1.1%), Asia (472 | 1.0%), and South America (316 | 0.7%), together accounting for 5.7% of all Bountiful residents.
| Immigration Origin | # Population | % Population |
| Africa | 25 | 0.1% |
| Asia | 472 | 1.0% |
| Australia | 10 | 0.0% |
| Bosnia and Herzegovina | 82 | 0.2% |
| Brazil | 115 | 0.3% |
| Canada | 120 | 0.3% |
| Caribbean | 28 | 0.1% |
| Central America | 481 | 1.1% |
| China | 45 | 0.1% |
| Colombia | 26 | 0.1% |
| Denmark | 8 | 0.0% |
| Dominican Republic | 17 | 0.0% |
| Eastern Africa | 25 | 0.1% |
| Eastern Asia | 168 | 0.4% |
| Eastern Europe | 217 | 0.5% |
| El Salvador | 118 | 0.3% |
| Ethiopia | 16 | 0.0% |
| Europe | 514 | 1.1% |
| Germany | 146 | 0.3% |
| Guatemala | 71 | 0.2% |
| Haiti | 11 | 0.0% |
| Hong Kong | 14 | 0.0% |
| India | 85 | 0.2% |
| Italy | 39 | 0.1% |
| Japan | 20 | 0.0% |
| Kenya | 9 | 0.0% |
| Korea | 102 | 0.2% |
| Latin America | 825 | 1.8% |
| Malaysia | 36 | 0.1% |
| Mexico | 292 | 0.6% |
| Netherlands | 32 | 0.1% |
| Northern Europe | 57 | 0.1% |
| Oceania | 12 | 0.0% |
| Peru | 153 | 0.3% |
| Philippines | 10 | 0.0% |
| Russia | 7 | 0.0% |
| Saudi Arabia | 19 | 0.0% |
| Scotland | 6 | 0.0% |
| South America | 316 | 0.7% |
| South Central Asia | 92 | 0.2% |
| South Eastern Asia | 193 | 0.4% |
| Southern Europe | 62 | 0.1% |
| Spain | 23 | 0.1% |
| Sri Lanka | 7 | 0.0% |
| Thailand | 61 | 0.1% |
| Ukraine | 23 | 0.1% |
| Venezuela | 22 | 0.1% |
| Vietnam | 86 | 0.2% |
| Western Asia | 19 | 0.0% |
| Western Europe | 178 | 0.4% | View All 50 Rows |
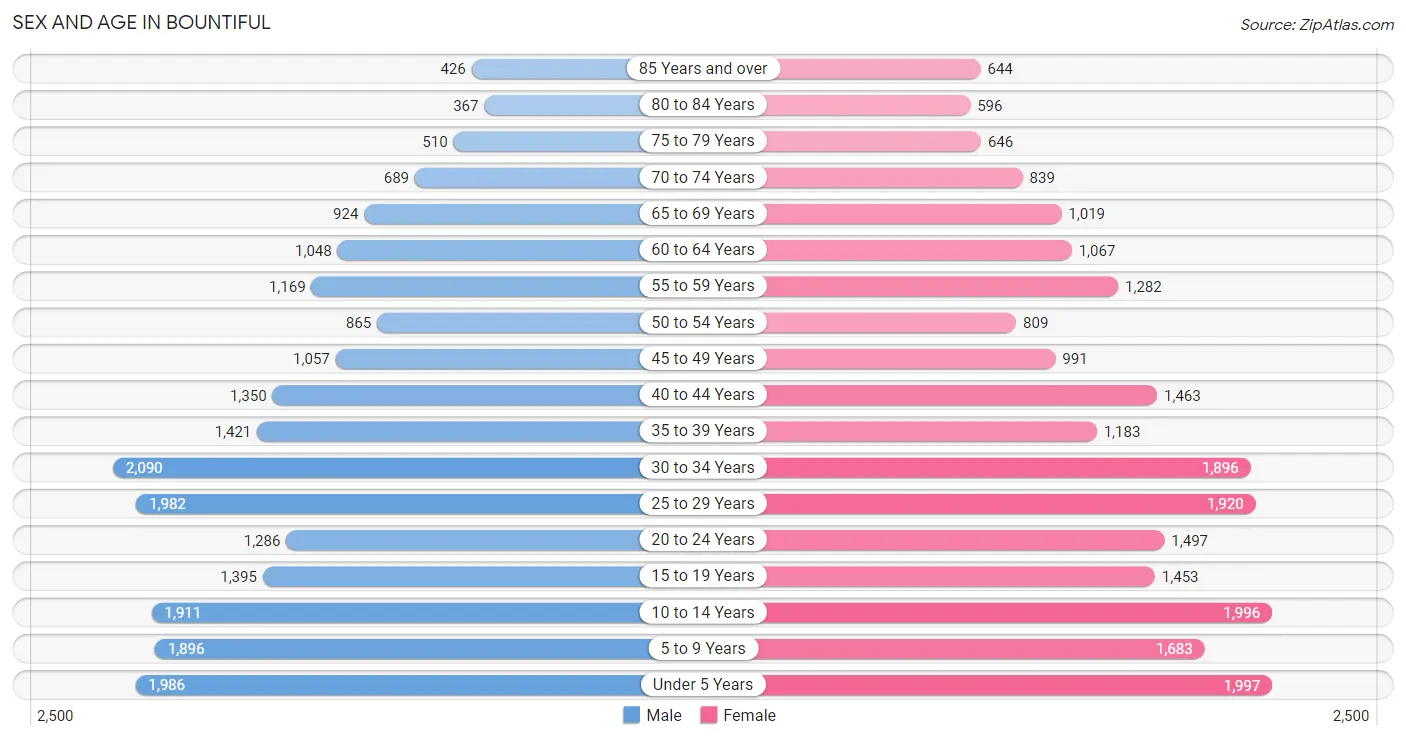
Sex and Age in Bountiful
Sex and Age in Bountiful
The most populous age groups in Bountiful are 30 to 34 Years (2,090 | 9.3%) for men and Under 5 Years (1,997 | 8.7%) for women.
| Age Bracket | Male | Female |
| Under 5 Years | 1,986 (8.9%) | 1,997 (8.7%) |
| 5 to 9 Years | 1,896 (8.5%) | 1,683 (7.3%) |
| 10 to 14 Years | 1,911 (8.5%) | 1,996 (8.7%) |
| 15 to 19 Years | 1,395 (6.2%) | 1,453 (6.3%) |
| 20 to 24 Years | 1,286 (5.8%) | 1,497 (6.5%) |
| 25 to 29 Years | 1,982 (8.9%) | 1,920 (8.4%) |
| 30 to 34 Years | 2,090 (9.3%) | 1,896 (8.3%) |
| 35 to 39 Years | 1,421 (6.4%) | 1,183 (5.1%) |
| 40 to 44 Years | 1,350 (6.0%) | 1,463 (6.4%) |
| 45 to 49 Years | 1,057 (4.7%) | 991 (4.3%) |
| 50 to 54 Years | 865 (3.9%) | 809 (3.5%) |
| 55 to 59 Years | 1,169 (5.2%) | 1,282 (5.6%) |
| 60 to 64 Years | 1,048 (4.7%) | 1,067 (4.6%) |
| 65 to 69 Years | 924 (4.1%) | 1,019 (4.4%) |
| 70 to 74 Years | 689 (3.1%) | 839 (3.6%) |
| 75 to 79 Years | 510 (2.3%) | 646 (2.8%) |
| 80 to 84 Years | 367 (1.6%) | 596 (2.6%) |
| 85 Years and over | 426 (1.9%) | 644 (2.8%) |
| Total | 22,372 (100.0%) | 22,981 (100.0%) |
Families and Households in Bountiful
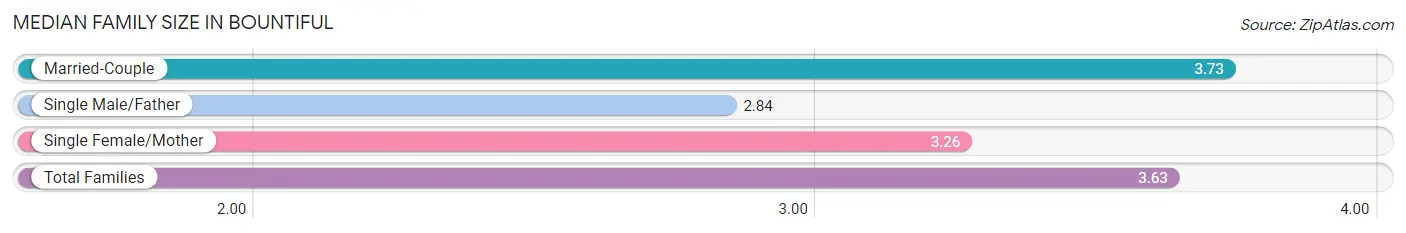
Median Family Size in Bountiful
The median family size in Bountiful is 3.63 persons per family, with married-couple families (9,109 | 84.2%) accounting for the largest median family size of 3.73 persons per family. On the other hand, single male/father families (705 | 6.5%) represent the smallest median family size with 2.84 persons per family.
| Family Type | # Families | Family Size |
| Married-Couple | 9,109 (84.2%) | 3.73 |
| Single Male/Father | 705 (6.5%) | 2.84 |
| Single Female/Mother | 1,004 (9.3%) | 3.26 |
| Total Families | 10,818 (100.0%) | 3.63 |
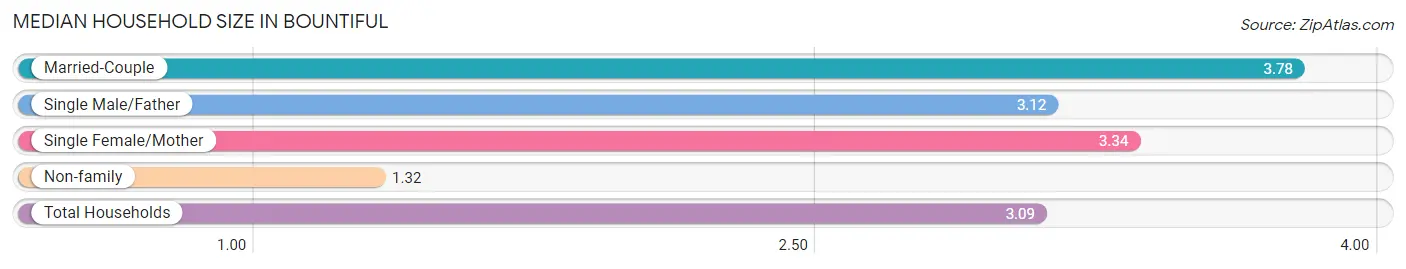
Median Household Size in Bountiful
The median household size in Bountiful is 3.09 persons per household, with married-couple households (9,109 | 62.8%) accounting for the largest median household size of 3.78 persons per household. non-family households (3,687 | 25.4%) represent the smallest median household size with 1.32 persons per household.
| Household Type | # Households | Household Size |
| Married-Couple | 9,109 (62.8%) | 3.78 |
| Single Male/Father | 705 (4.9%) | 3.12 |
| Single Female/Mother | 1,004 (6.9%) | 3.34 |
| Non-family | 3,687 (25.4%) | 1.32 |
| Total Households | 14,505 (100.0%) | 3.09 |
Household Size by Marriage Status in Bountiful
Out of a total of 14,505 households in Bountiful, 10,818 (74.6%) are family households, while 3,687 (25.4%) are nonfamily households. The most numerous type of family households are 2-person households, comprising 4,168, and the most common type of nonfamily households are 1-person households, comprising 3,018.
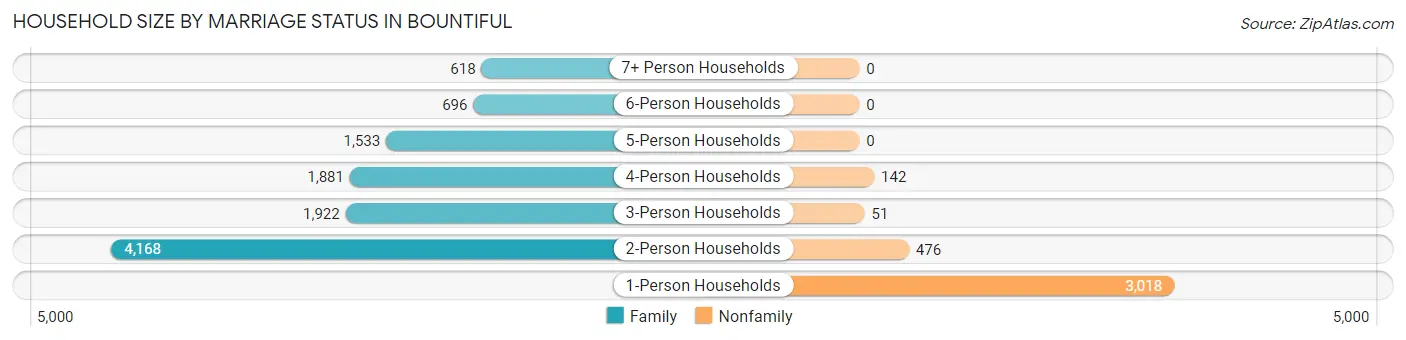
| Household Size | Family Households | Nonfamily Households |
| 1-Person Households | - | 3,018 (20.8%) |
| 2-Person Households | 4,168 (28.7%) | 476 (3.3%) |
| 3-Person Households | 1,922 (13.3%) | 51 (0.4%) |
| 4-Person Households | 1,881 (13.0%) | 142 (1.0%) |
| 5-Person Households | 1,533 (10.6%) | 0 (0.0%) |
| 6-Person Households | 696 (4.8%) | 0 (0.0%) |
| 7+ Person Households | 618 (4.3%) | 0 (0.0%) |
| Total | 10,818 (74.6%) | 3,687 (25.4%) |
Female Fertility in Bountiful
Fertility by Age in Bountiful
Average fertility rate in Bountiful is 64.0 births per 1,000 women. Women in the age bracket of 20 to 34 years have the highest fertility rate with 109.0 births per 1,000 women. Women in the age bracket of 20 to 34 years acount for 85.6% of all women with births.
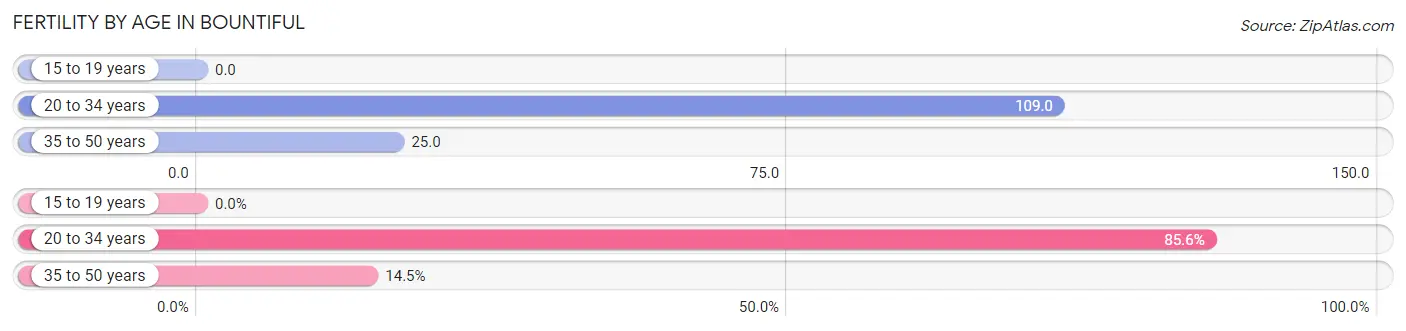
| Age Bracket | Women with Births | Births / 1,000 Women |
| 15 to 19 years | 0 (0.0%) | 0.0 |
| 20 to 34 years | 580 (85.6%) | 109.0 |
| 35 to 50 years | 98 (14.4%) | 25.0 |
| Total | 678 (100.0%) | 64.0 |
Fertility by Age by Marriage Status in Bountiful
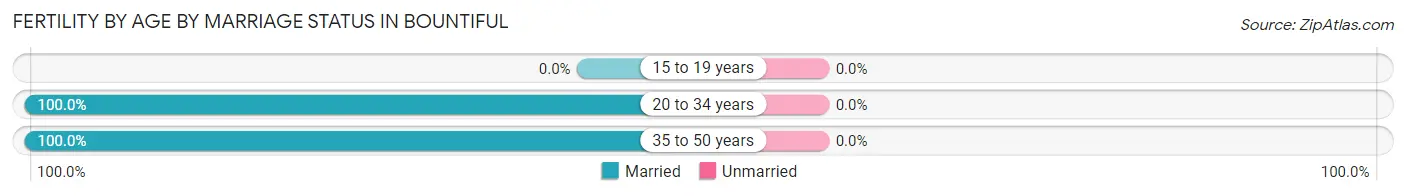
| Age Bracket | Married | Unmarried |
| 15 to 19 years | 0 (0.0%) | 0 (0.0%) |
| 20 to 34 years | 580 (100.0%) | 0 (0.0%) |
| 35 to 50 years | 98 (100.0%) | 0 (0.0%) |
| Total | 678 (100.0%) | 0 (0.0%) |
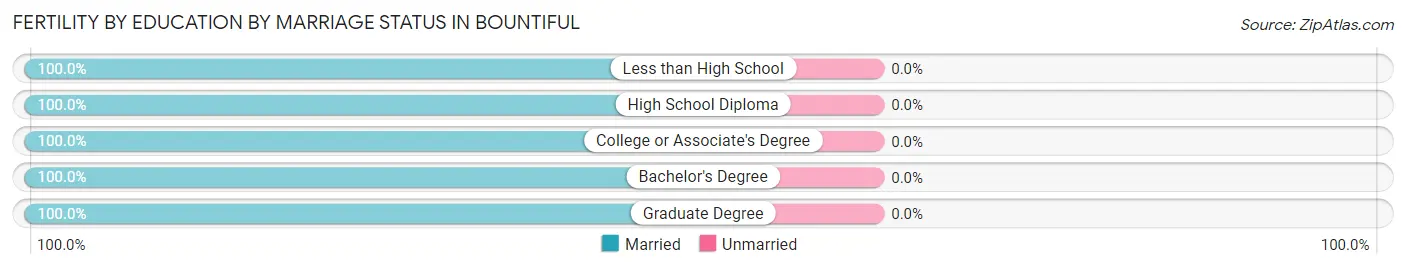
Fertility by Education in Bountiful
Average fertility rate in Bountiful is 64.0 births per 1,000 women. Women with the education attainment of college or associate's degree have the highest fertility rate of 82.0 births per 1,000 women, while women with the education attainment of less than high school have the lowest fertility at 13.0 births per 1,000 women. Women with the education attainment of college or associate's degree represent 39.1% of all women with births.
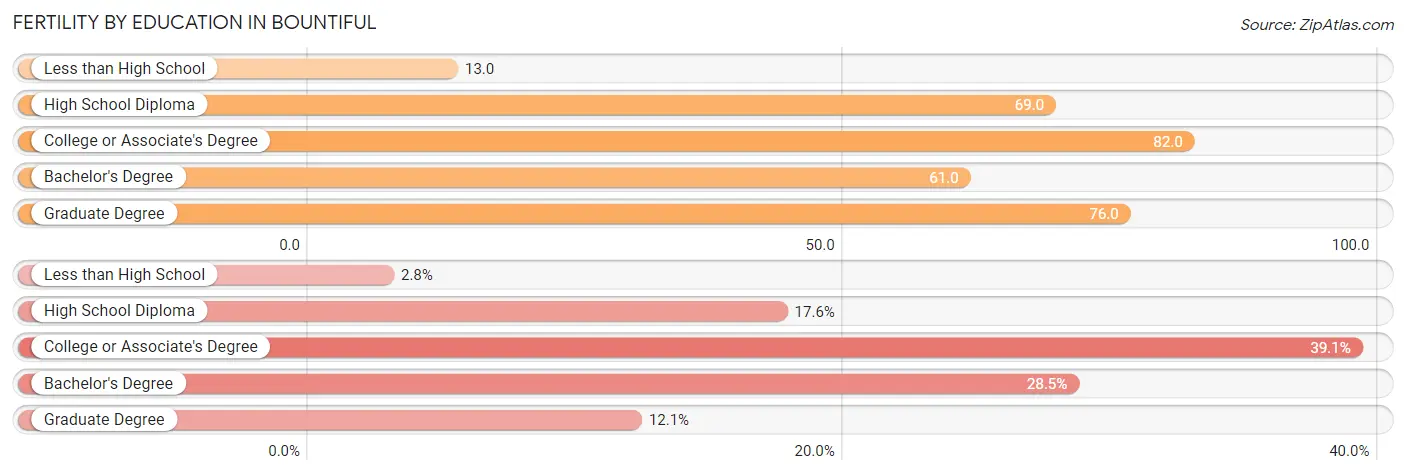
| Educational Attainment | Women with Births | Births / 1,000 Women |
| Less than High School | 19 (2.8%) | 13.0 |
| High School Diploma | 119 (17.5%) | 69.0 |
| College or Associate's Degree | 265 (39.1%) | 82.0 |
| Bachelor's Degree | 193 (28.5%) | 61.0 |
| Graduate Degree | 82 (12.1%) | 76.0 |
| Total | 678 (100.0%) | 64.0 |
Fertility by Education by Marriage Status in Bountiful
| Educational Attainment | Married | Unmarried |
| Less than High School | 19 (100.0%) | 0 (0.0%) |
| High School Diploma | 119 (100.0%) | 0 (0.0%) |
| College or Associate's Degree | 265 (100.0%) | 0 (0.0%) |
| Bachelor's Degree | 193 (100.0%) | 0 (0.0%) |
| Graduate Degree | 82 (100.0%) | 0 (0.0%) |
| Total | 678 (100.0%) | 0 (0.0%) |
Employment Characteristics in Bountiful
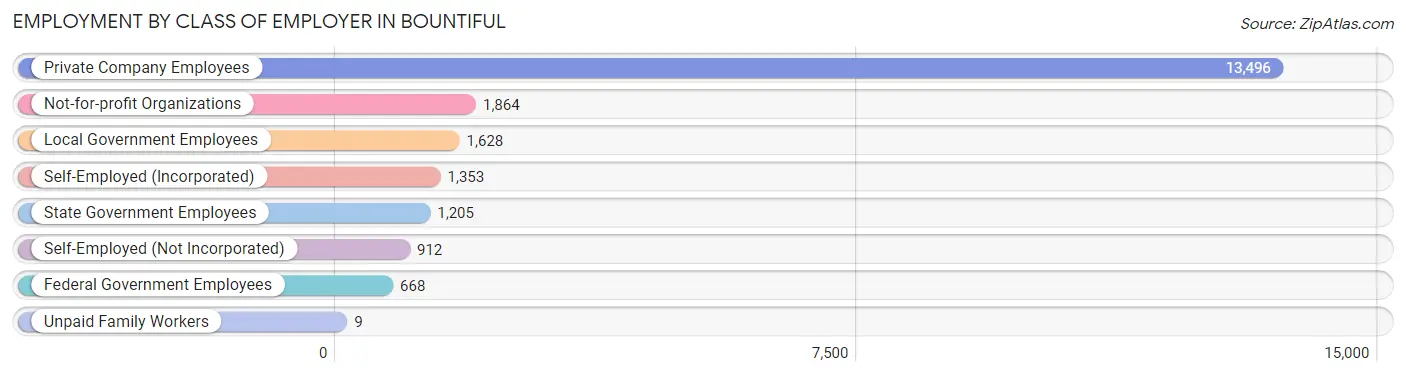
Employment by Class of Employer in Bountiful
Among the 21,135 employed individuals in Bountiful, private company employees (13,496 | 63.9%), not-for-profit organizations (1,864 | 8.8%), and local government employees (1,628 | 7.7%) make up the most common classes of employment.
| Employer Class | # Employees | % Employees |
| Private Company Employees | 13,496 | 63.9% |
| Self-Employed (Incorporated) | 1,353 | 6.4% |
| Self-Employed (Not Incorporated) | 912 | 4.3% |
| Not-for-profit Organizations | 1,864 | 8.8% |
| Local Government Employees | 1,628 | 7.7% |
| State Government Employees | 1,205 | 5.7% |
| Federal Government Employees | 668 | 3.2% |
| Unpaid Family Workers | 9 | 0.0% |
| Total | 21,135 | 100.0% |
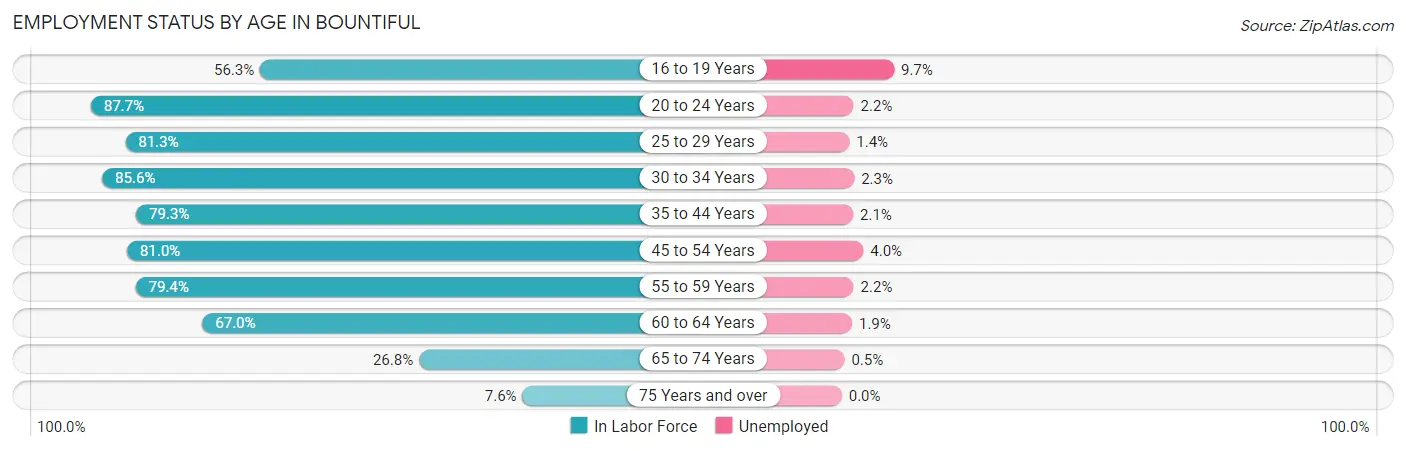
Employment Status by Age in Bountiful
According to the labor force statistics for Bountiful, out of the total population over 16 years of age (33,225), 66.5% or 22,095 individuals are in the labor force, with 2.6% or 574 of them unemployed. The age group with the highest labor force participation rate is 20 to 24 years, with 87.7% or 2,441 individuals in the labor force. Within the labor force, the 16 to 19 years age range has the highest percentage of unemployed individuals, with 9.7% or 120 of them being unemployed.
| Age Bracket | In Labor Force | Unemployed |
| 16 to 19 Years | 1,232 (56.3%) | 120 (9.7%) |
| 20 to 24 Years | 2,441 (87.7%) | 54 (2.2%) |
| 25 to 29 Years | 3,172 (81.3%) | 44 (1.4%) |
| 30 to 34 Years | 3,412 (85.6%) | 78 (2.3%) |
| 35 to 44 Years | 4,296 (79.3%) | 90 (2.1%) |
| 45 to 54 Years | 3,015 (81.0%) | 121 (4.0%) |
| 55 to 59 Years | 1,946 (79.4%) | 43 (2.2%) |
| 60 to 64 Years | 1,417 (67.0%) | 27 (1.9%) |
| 65 to 74 Years | 930 (26.8%) | 5 (0.5%) |
| 75 Years and over | 242 (7.6%) | 0 (0.0%) |
| Total | 22,095 (66.5%) | 574 (2.6%) |
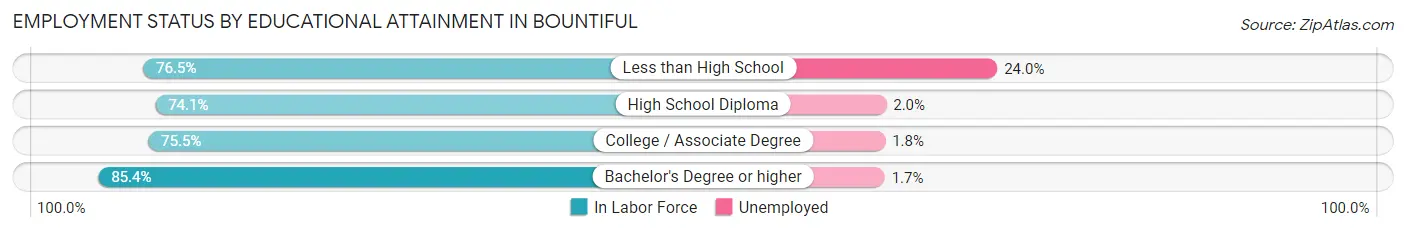
Employment Status by Educational Attainment in Bountiful
According to labor force statistics for Bountiful, 79.9% of individuals (17,253) out of the total population between 25 and 64 years of age (21,593) are in the labor force, with 2.3% or 397 of them being unemployed. The group with the highest labor force participation rate are those with the educational attainment of bachelor's degree or higher, with 85.4% or 8,620 individuals in the labor force. Within the labor force, individuals with less than high school education have the highest percentage of unemployment, with 24.0% or 104 of them being unemployed.
| Educational Attainment | In Labor Force | Unemployed |
| Less than High School | 434 (76.5%) | 136 (24.0%) |
| High School Diploma | 2,669 (74.1%) | 72 (2.0%) |
| College / Associate Degree | 5,534 (75.5%) | 132 (1.8%) |
| Bachelor's Degree or higher | 8,620 (85.4%) | 172 (1.7%) |
| Total | 17,253 (79.9%) | 497 (2.3%) |
Employment Occupations by Sex in Bountiful
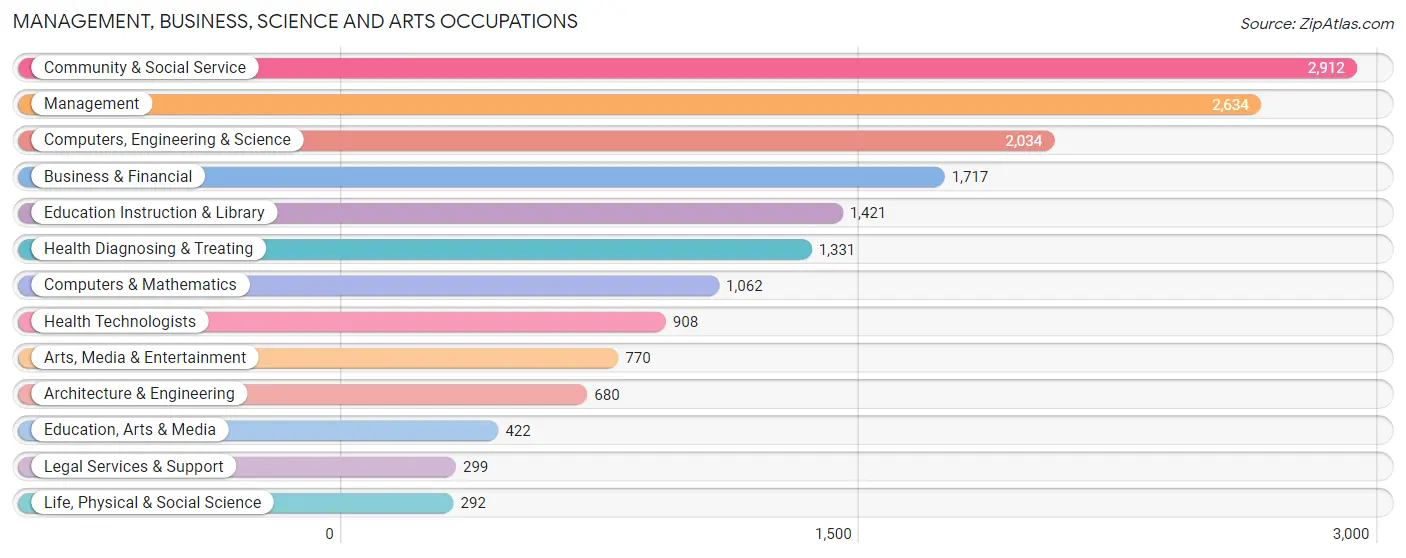
Management, Business, Science and Arts Occupations
The most common Management, Business, Science and Arts occupations in Bountiful are Community & Social Service (2,912 | 13.6%), Management (2,634 | 12.3%), Computers, Engineering & Science (2,034 | 9.5%), Business & Financial (1,717 | 8.0%), and Education Instruction & Library (1,421 | 6.6%).
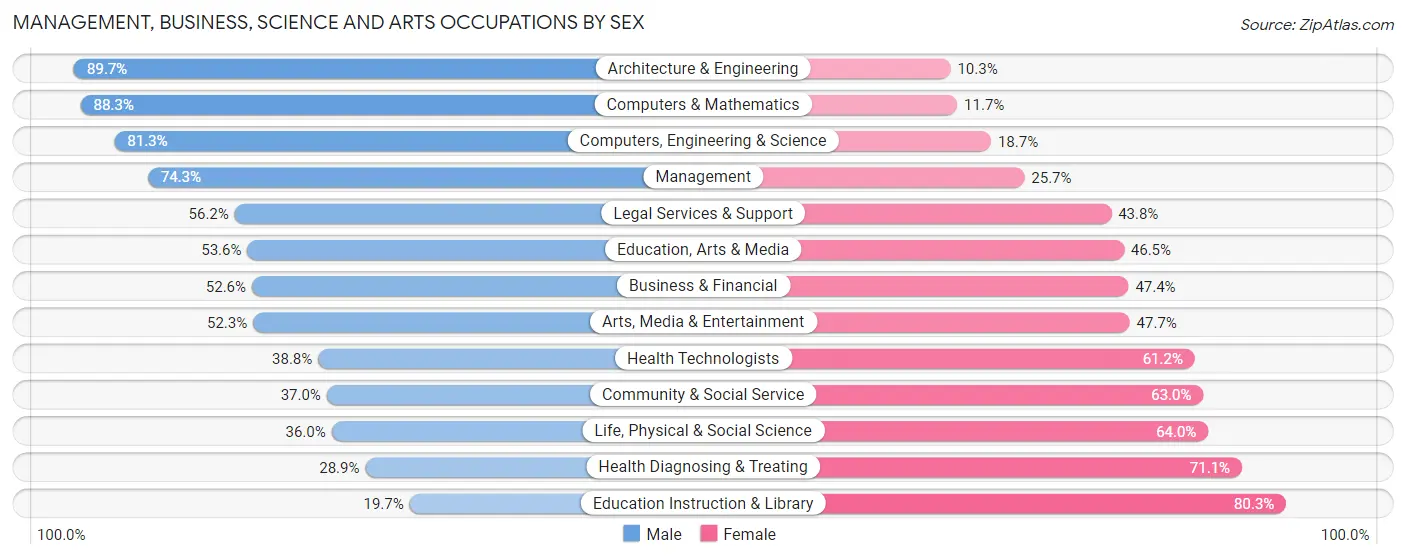
Management, Business, Science and Arts Occupations by Sex
Within the Management, Business, Science and Arts occupations in Bountiful, the most male-oriented occupations are Architecture & Engineering (89.7%), Computers & Mathematics (88.3%), and Computers, Engineering & Science (81.3%), while the most female-oriented occupations are Education Instruction & Library (80.3%), Health Diagnosing & Treating (71.1%), and Life, Physical & Social Science (64.0%).
| Occupation | Male | Female |
| Management | 1,957 (74.3%) | 677 (25.7%) |
| Business & Financial | 903 (52.6%) | 814 (47.4%) |
| Computers, Engineering & Science | 1,653 (81.3%) | 381 (18.7%) |
| Computers & Mathematics | 938 (88.3%) | 124 (11.7%) |
| Architecture & Engineering | 610 (89.7%) | 70 (10.3%) |
| Life, Physical & Social Science | 105 (36.0%) | 187 (64.0%) |
| Community & Social Service | 1,077 (37.0%) | 1,835 (63.0%) |
| Education, Arts & Media | 226 (53.5%) | 196 (46.5%) |
| Legal Services & Support | 168 (56.2%) | 131 (43.8%) |
| Education Instruction & Library | 280 (19.7%) | 1,141 (80.3%) |
| Arts, Media & Entertainment | 403 (52.3%) | 367 (47.7%) |
| Health Diagnosing & Treating | 385 (28.9%) | 946 (71.1%) |
| Health Technologists | 352 (38.8%) | 556 (61.2%) |
| Total (Category) | 5,975 (56.2%) | 4,653 (43.8%) |
| Total (Overall) | 12,159 (56.7%) | 9,296 (43.3%) |
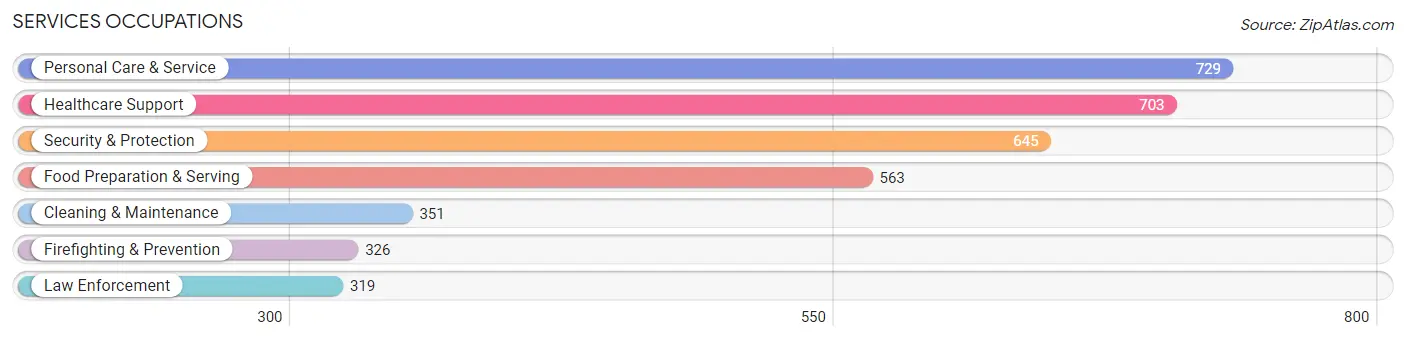
Services Occupations
The most common Services occupations in Bountiful are Personal Care & Service (729 | 3.4%), Healthcare Support (703 | 3.3%), Security & Protection (645 | 3.0%), Food Preparation & Serving (563 | 2.6%), and Cleaning & Maintenance (351 | 1.6%).
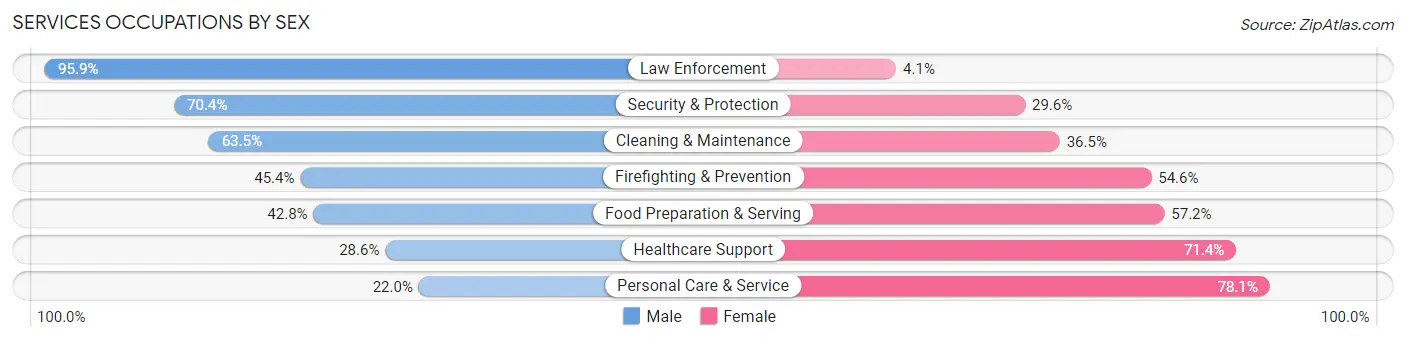
Services Occupations by Sex
Within the Services occupations in Bountiful, the most male-oriented occupations are Law Enforcement (95.9%), Security & Protection (70.4%), and Cleaning & Maintenance (63.5%), while the most female-oriented occupations are Personal Care & Service (78.0%), Healthcare Support (71.4%), and Food Preparation & Serving (57.2%).
| Occupation | Male | Female |
| Healthcare Support | 201 (28.6%) | 502 (71.4%) |
| Security & Protection | 454 (70.4%) | 191 (29.6%) |
| Firefighting & Prevention | 148 (45.4%) | 178 (54.6%) |
| Law Enforcement | 306 (95.9%) | 13 (4.1%) |
| Food Preparation & Serving | 241 (42.8%) | 322 (57.2%) |
| Cleaning & Maintenance | 223 (63.5%) | 128 (36.5%) |
| Personal Care & Service | 160 (22.0%) | 569 (78.0%) |
| Total (Category) | 1,279 (42.8%) | 1,712 (57.2%) |
| Total (Overall) | 12,159 (56.7%) | 9,296 (43.3%) |
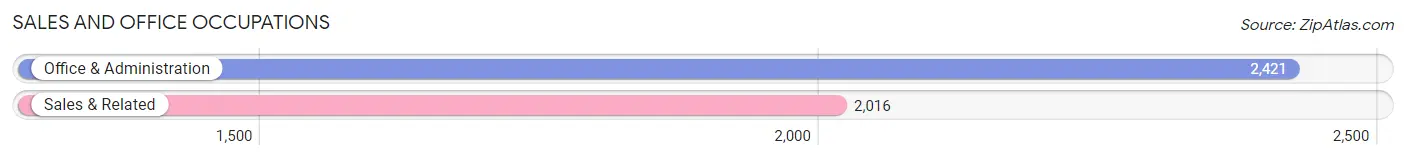
Sales and Office Occupations
The most common Sales and Office occupations in Bountiful are Office & Administration (2,421 | 11.3%), and Sales & Related (2,016 | 9.4%).
Sales and Office Occupations by Sex
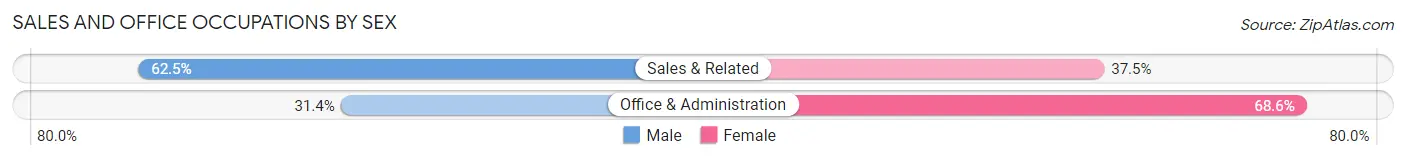
| Occupation | Male | Female |
| Sales & Related | 1,260 (62.5%) | 756 (37.5%) |
| Office & Administration | 760 (31.4%) | 1,661 (68.6%) |
| Total (Category) | 2,020 (45.5%) | 2,417 (54.5%) |
| Total (Overall) | 12,159 (56.7%) | 9,296 (43.3%) |
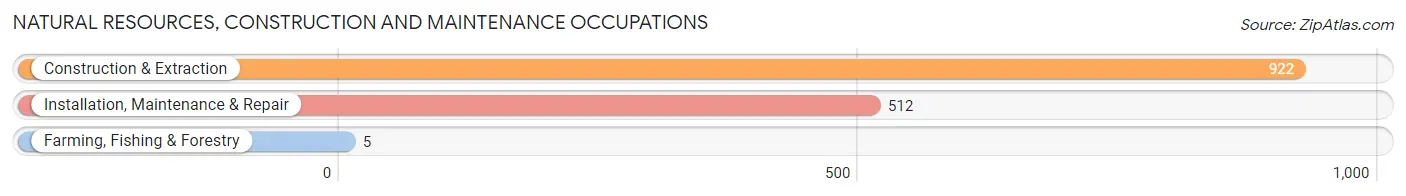
Natural Resources, Construction and Maintenance Occupations
The most common Natural Resources, Construction and Maintenance occupations in Bountiful are Construction & Extraction (922 | 4.3%), Installation, Maintenance & Repair (512 | 2.4%), and Farming, Fishing & Forestry (5 | 0.0%).
Natural Resources, Construction and Maintenance Occupations by Sex
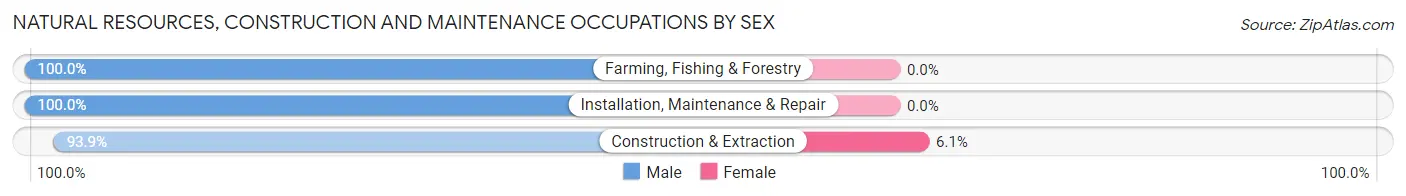
| Occupation | Male | Female |
| Farming, Fishing & Forestry | 5 (100.0%) | 0 (0.0%) |
| Construction & Extraction | 866 (93.9%) | 56 (6.1%) |
| Installation, Maintenance & Repair | 512 (100.0%) | 0 (0.0%) |
| Total (Category) | 1,383 (96.1%) | 56 (3.9%) |
| Total (Overall) | 12,159 (56.7%) | 9,296 (43.3%) |
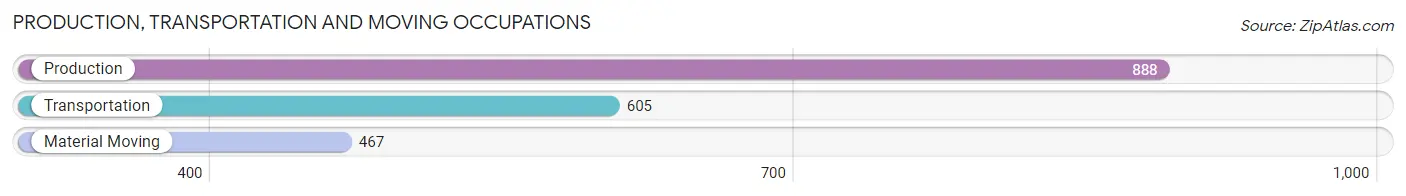
Production, Transportation and Moving Occupations
The most common Production, Transportation and Moving occupations in Bountiful are Production (888 | 4.1%), Transportation (605 | 2.8%), and Material Moving (467 | 2.2%).
Production, Transportation and Moving Occupations by Sex
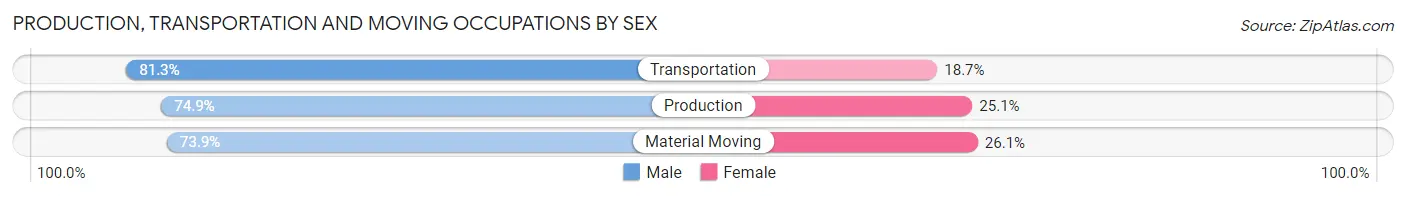
| Occupation | Male | Female |
| Production | 665 (74.9%) | 223 (25.1%) |
| Transportation | 492 (81.3%) | 113 (18.7%) |
| Material Moving | 345 (73.9%) | 122 (26.1%) |
| Total (Category) | 1,502 (76.6%) | 458 (23.4%) |
| Total (Overall) | 12,159 (56.7%) | 9,296 (43.3%) |
Employment Industries by Sex in Bountiful
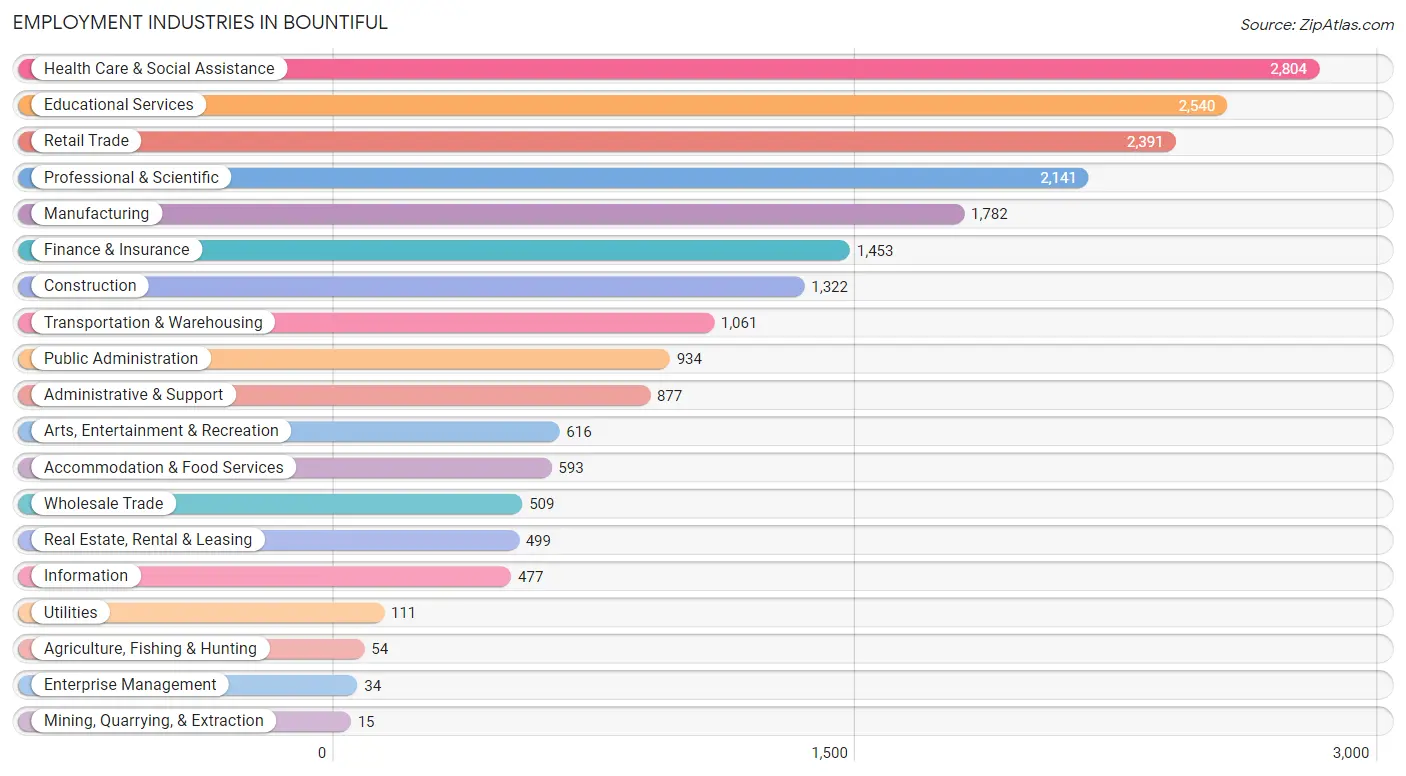
Employment Industries in Bountiful
The major employment industries in Bountiful include Health Care & Social Assistance (2,804 | 13.1%), Educational Services (2,540 | 11.8%), Retail Trade (2,391 | 11.1%), Professional & Scientific (2,141 | 10.0%), and Manufacturing (1,782 | 8.3%).
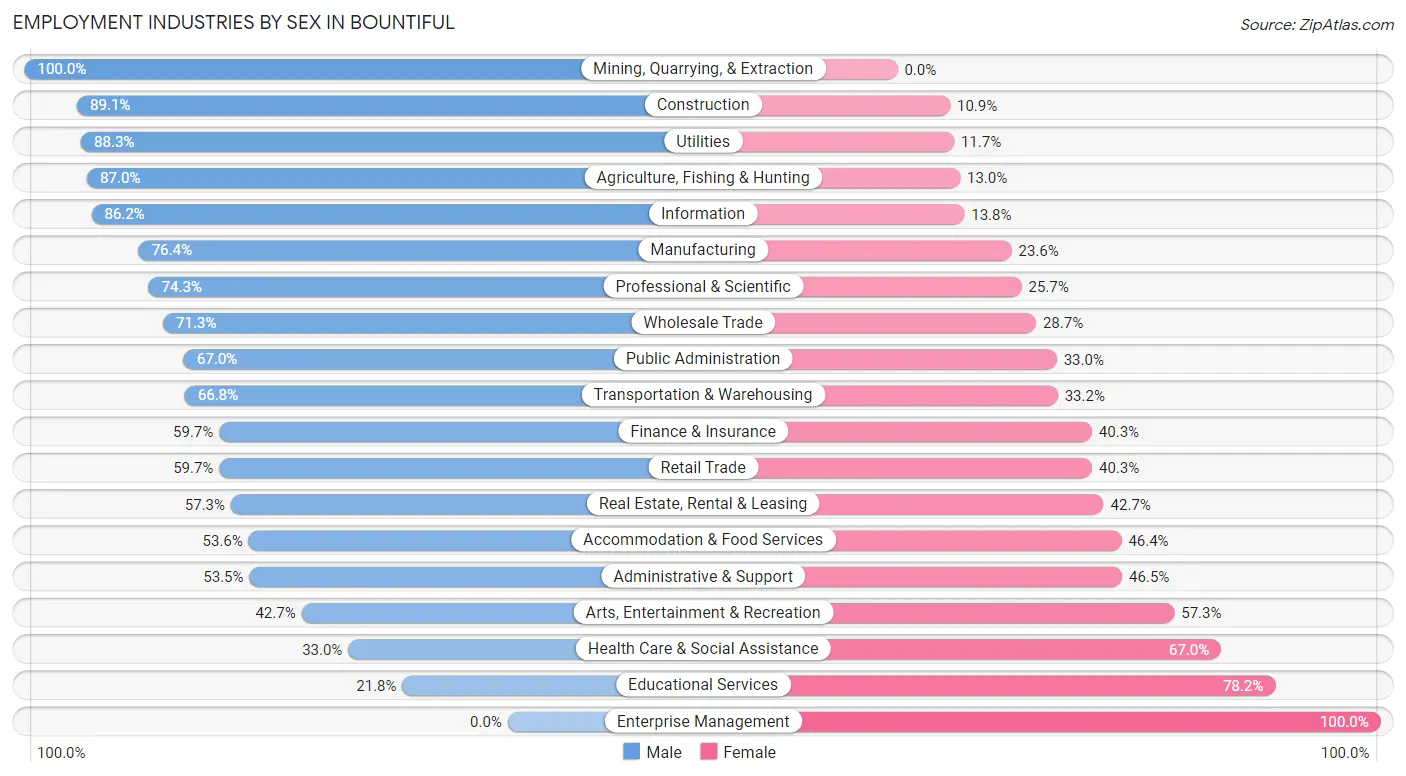
Employment Industries by Sex in Bountiful
The Bountiful industries that see more men than women are Mining, Quarrying, & Extraction (100.0%), Construction (89.1%), and Utilities (88.3%), whereas the industries that tend to have a higher number of women are Enterprise Management (100.0%), Educational Services (78.2%), and Health Care & Social Assistance (67.0%).
| Industry | Male | Female |
| Agriculture, Fishing & Hunting | 47 (87.0%) | 7 (13.0%) |
| Mining, Quarrying, & Extraction | 15 (100.0%) | 0 (0.0%) |
| Construction | 1,178 (89.1%) | 144 (10.9%) |
| Manufacturing | 1,361 (76.4%) | 421 (23.6%) |
| Wholesale Trade | 363 (71.3%) | 146 (28.7%) |
| Retail Trade | 1,428 (59.7%) | 963 (40.3%) |
| Transportation & Warehousing | 709 (66.8%) | 352 (33.2%) |
| Utilities | 98 (88.3%) | 13 (11.7%) |
| Information | 411 (86.2%) | 66 (13.8%) |
| Finance & Insurance | 868 (59.7%) | 585 (40.3%) |
| Real Estate, Rental & Leasing | 286 (57.3%) | 213 (42.7%) |
| Professional & Scientific | 1,591 (74.3%) | 550 (25.7%) |
| Enterprise Management | 0 (0.0%) | 34 (100.0%) |
| Administrative & Support | 469 (53.5%) | 408 (46.5%) |
| Educational Services | 554 (21.8%) | 1,986 (78.2%) |
| Health Care & Social Assistance | 926 (33.0%) | 1,878 (67.0%) |
| Arts, Entertainment & Recreation | 263 (42.7%) | 353 (57.3%) |
| Accommodation & Food Services | 318 (53.6%) | 275 (46.4%) |
| Public Administration | 626 (67.0%) | 308 (33.0%) |
| Total | 12,159 (56.7%) | 9,296 (43.3%) |
Education in Bountiful
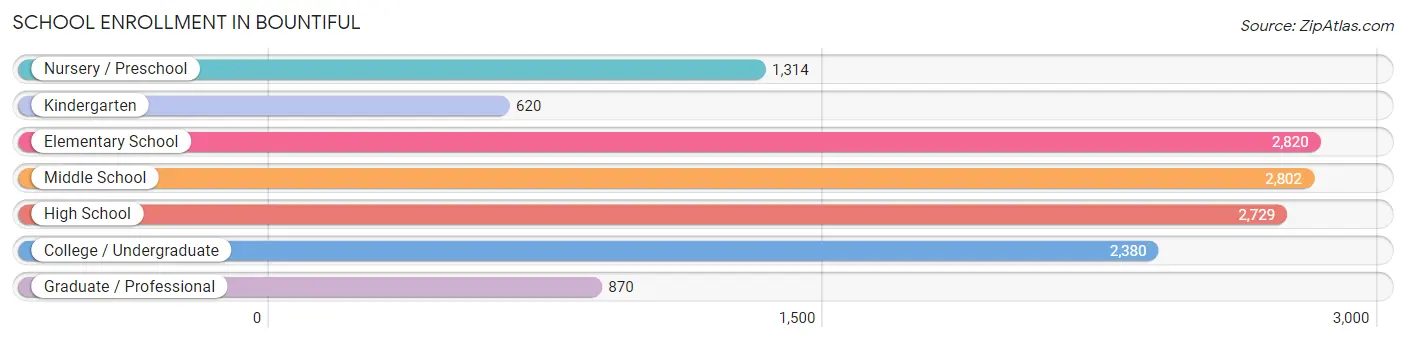
School Enrollment in Bountiful
The most common levels of schooling among the 13,535 students in Bountiful are elementary school (2,820 | 20.8%), middle school (2,802 | 20.7%), and high school (2,729 | 20.2%).
| School Level | # Students | % Students |
| Nursery / Preschool | 1,314 | 9.7% |
| Kindergarten | 620 | 4.6% |
| Elementary School | 2,820 | 20.8% |
| Middle School | 2,802 | 20.7% |
| High School | 2,729 | 20.2% |
| College / Undergraduate | 2,380 | 17.6% |
| Graduate / Professional | 870 | 6.4% |
| Total | 13,535 | 100.0% |
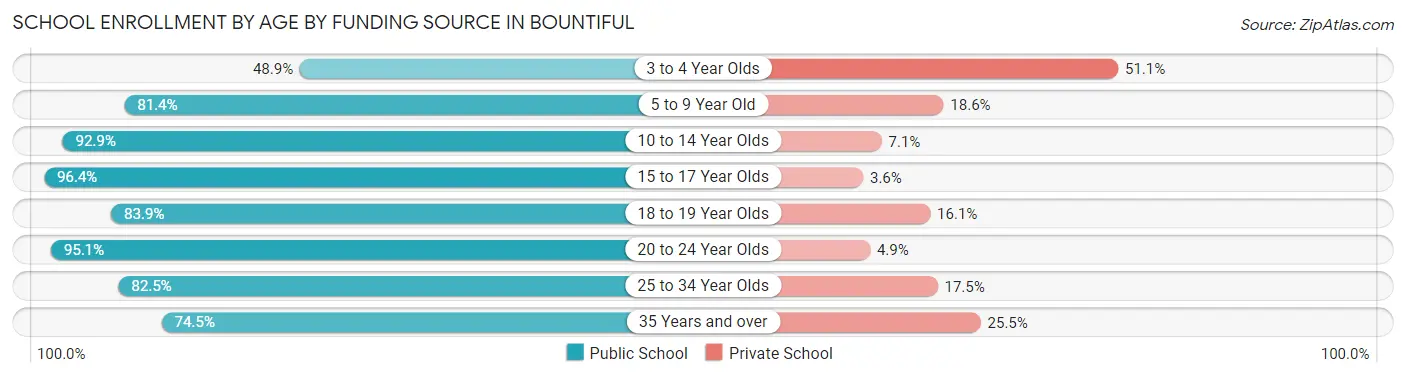
School Enrollment by Age by Funding Source in Bountiful
Out of a total of 13,535 students who are enrolled in schools in Bountiful, 1,949 (14.4%) attend a private institution, while the remaining 11,586 (85.6%) are enrolled in public schools. The age group of 3 to 4 year olds has the highest likelihood of being enrolled in private schools, with 439 (51.1% in the age bracket) enrolled. Conversely, the age group of 15 to 17 year olds has the lowest likelihood of being enrolled in a private school, with 1,787 (96.4% in the age bracket) attending a public institution.
| Age Bracket | Public School | Private School |
| 3 to 4 Year Olds | 420 (48.9%) | 439 (51.1%) |
| 5 to 9 Year Old | 2,756 (81.4%) | 629 (18.6%) |
| 10 to 14 Year Olds | 3,523 (92.9%) | 268 (7.1%) |
| 15 to 17 Year Olds | 1,787 (96.4%) | 67 (3.6%) |
| 18 to 19 Year Olds | 557 (83.9%) | 107 (16.1%) |
| 20 to 24 Year Olds | 952 (95.1%) | 49 (4.9%) |
| 25 to 34 Year Olds | 1,227 (82.5%) | 260 (17.5%) |
| 35 Years and over | 368 (74.5%) | 126 (25.5%) |
| Total | 11,586 (85.6%) | 1,949 (14.4%) |
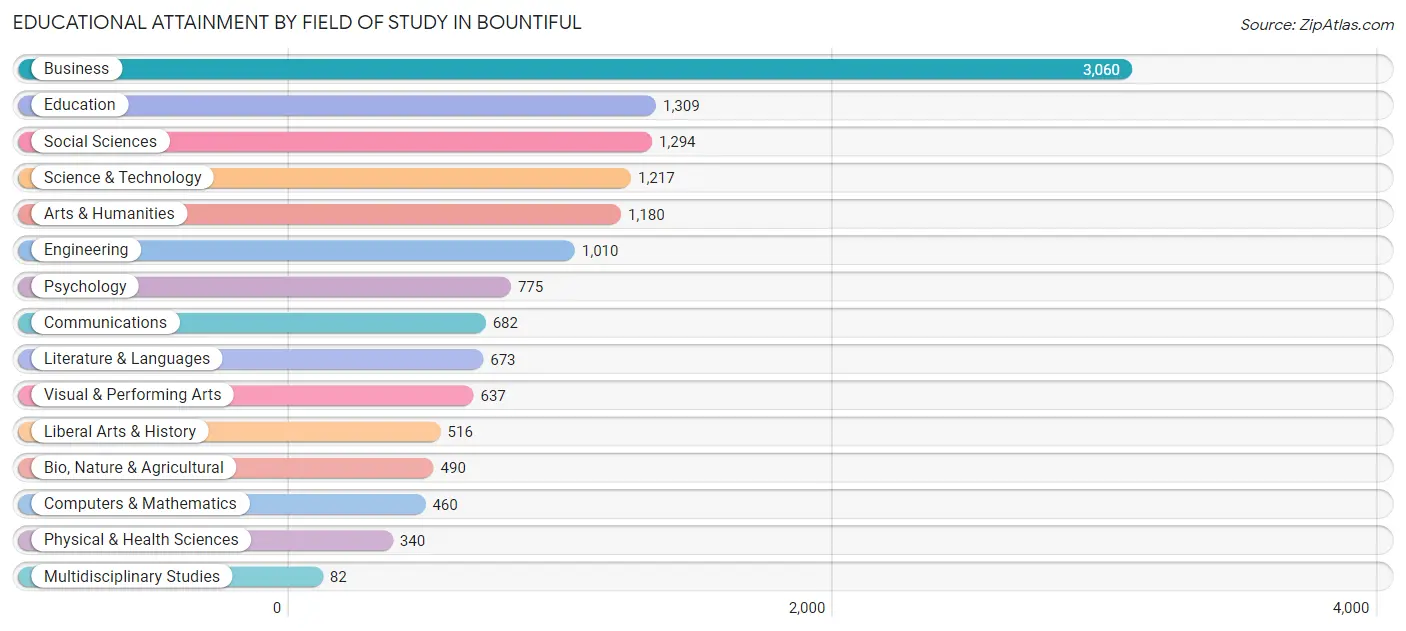
Educational Attainment by Field of Study in Bountiful
Business (3,060 | 22.3%), education (1,309 | 9.5%), social sciences (1,294 | 9.4%), science & technology (1,217 | 8.9%), and arts & humanities (1,180 | 8.6%) are the most common fields of study among 13,725 individuals in Bountiful who have obtained a bachelor's degree or higher.
| Field of Study | # Graduates | % Graduates |
| Computers & Mathematics | 460 | 3.4% |
| Bio, Nature & Agricultural | 490 | 3.6% |
| Physical & Health Sciences | 340 | 2.5% |
| Psychology | 775 | 5.7% |
| Social Sciences | 1,294 | 9.4% |
| Engineering | 1,010 | 7.4% |
| Multidisciplinary Studies | 82 | 0.6% |
| Science & Technology | 1,217 | 8.9% |
| Business | 3,060 | 22.3% |
| Education | 1,309 | 9.5% |
| Literature & Languages | 673 | 4.9% |
| Liberal Arts & History | 516 | 3.8% |
| Visual & Performing Arts | 637 | 4.6% |
| Communications | 682 | 5.0% |
| Arts & Humanities | 1,180 | 8.6% |
| Total | 13,725 | 100.0% |
Transportation & Commute in Bountiful
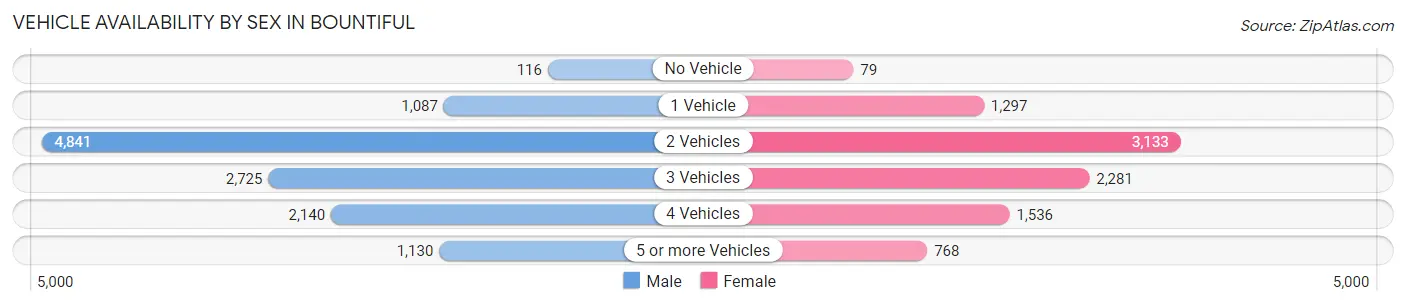
Vehicle Availability by Sex in Bountiful
The most prevalent vehicle ownership categories in Bountiful are males with 2 vehicles (4,841, accounting for 40.2%) and females with 2 vehicles (3,133, making up 53.2%).
| Vehicles Available | Male | Female |
| No Vehicle | 116 (1.0%) | 79 (0.9%) |
| 1 Vehicle | 1,087 (9.0%) | 1,297 (14.3%) |
| 2 Vehicles | 4,841 (40.2%) | 3,133 (34.4%) |
| 3 Vehicles | 2,725 (22.6%) | 2,281 (25.1%) |
| 4 Vehicles | 2,140 (17.8%) | 1,536 (16.9%) |
| 5 or more Vehicles | 1,130 (9.4%) | 768 (8.5%) |
| Total | 12,039 (100.0%) | 9,094 (100.0%) |
Commute Time in Bountiful
The most frequently occuring commute durations in Bountiful are 20 to 24 minutes (3,439 commuters, 19.6%), 30 to 34 minutes (2,630 commuters, 15.0%), and 10 to 14 minutes (2,448 commuters, 14.0%).
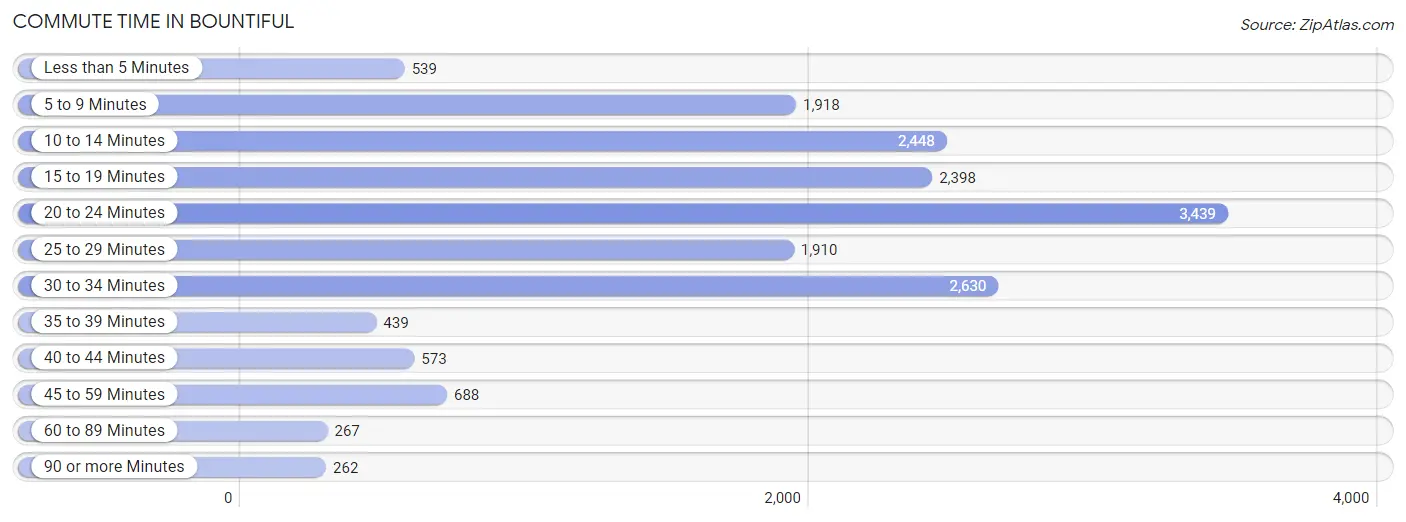
| Commute Time | # Commuters | % Commuters |
| Less than 5 Minutes | 539 | 3.1% |
| 5 to 9 Minutes | 1,918 | 11.0% |
| 10 to 14 Minutes | 2,448 | 14.0% |
| 15 to 19 Minutes | 2,398 | 13.7% |
| 20 to 24 Minutes | 3,439 | 19.6% |
| 25 to 29 Minutes | 1,910 | 10.9% |
| 30 to 34 Minutes | 2,630 | 15.0% |
| 35 to 39 Minutes | 439 | 2.5% |
| 40 to 44 Minutes | 573 | 3.3% |
| 45 to 59 Minutes | 688 | 3.9% |
| 60 to 89 Minutes | 267 | 1.5% |
| 90 or more Minutes | 262 | 1.5% |
Commute Time by Sex in Bountiful
The most common commute times in Bountiful are 20 to 24 minutes (2,112 commuters, 21.6%) for males and 20 to 24 minutes (1,327 commuters, 17.2%) for females.
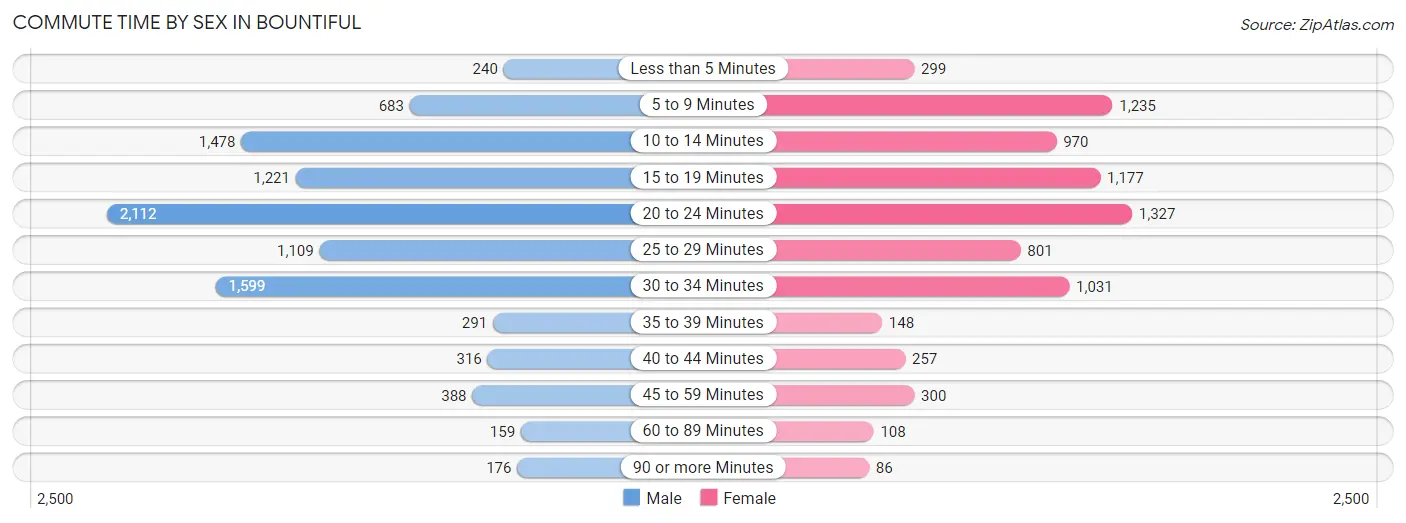
| Commute Time | Male | Female |
| Less than 5 Minutes | 240 (2.5%) | 299 (3.9%) |
| 5 to 9 Minutes | 683 (7.0%) | 1,235 (16.0%) |
| 10 to 14 Minutes | 1,478 (15.1%) | 970 (12.5%) |
| 15 to 19 Minutes | 1,221 (12.5%) | 1,177 (15.2%) |
| 20 to 24 Minutes | 2,112 (21.6%) | 1,327 (17.2%) |
| 25 to 29 Minutes | 1,109 (11.4%) | 801 (10.3%) |
| 30 to 34 Minutes | 1,599 (16.4%) | 1,031 (13.3%) |
| 35 to 39 Minutes | 291 (3.0%) | 148 (1.9%) |
| 40 to 44 Minutes | 316 (3.2%) | 257 (3.3%) |
| 45 to 59 Minutes | 388 (4.0%) | 300 (3.9%) |
| 60 to 89 Minutes | 159 (1.6%) | 108 (1.4%) |
| 90 or more Minutes | 176 (1.8%) | 86 (1.1%) |
Time of Departure to Work by Sex in Bountiful
The most frequent times of departure to work in Bountiful are 7:00 AM to 7:29 AM (1,653, 16.9%) for males and 8:30 AM to 8:59 AM (1,065, 13.8%) for females.
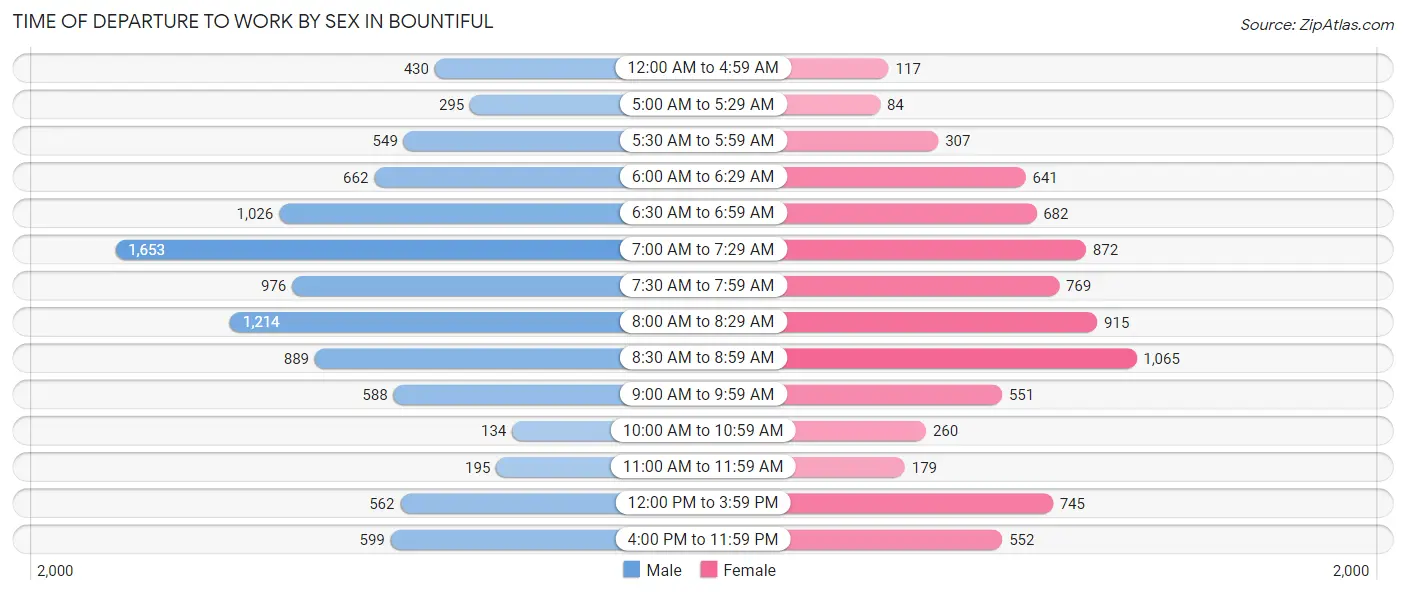
| Time of Departure | Male | Female |
| 12:00 AM to 4:59 AM | 430 (4.4%) | 117 (1.5%) |
| 5:00 AM to 5:29 AM | 295 (3.0%) | 84 (1.1%) |
| 5:30 AM to 5:59 AM | 549 (5.6%) | 307 (4.0%) |
| 6:00 AM to 6:29 AM | 662 (6.8%) | 641 (8.3%) |
| 6:30 AM to 6:59 AM | 1,026 (10.5%) | 682 (8.8%) |
| 7:00 AM to 7:29 AM | 1,653 (16.9%) | 872 (11.3%) |
| 7:30 AM to 7:59 AM | 976 (10.0%) | 769 (9.9%) |
| 8:00 AM to 8:29 AM | 1,214 (12.4%) | 915 (11.8%) |
| 8:30 AM to 8:59 AM | 889 (9.1%) | 1,065 (13.8%) |
| 9:00 AM to 9:59 AM | 588 (6.0%) | 551 (7.1%) |
| 10:00 AM to 10:59 AM | 134 (1.4%) | 260 (3.4%) |
| 11:00 AM to 11:59 AM | 195 (2.0%) | 179 (2.3%) |
| 12:00 PM to 3:59 PM | 562 (5.8%) | 745 (9.6%) |
| 4:00 PM to 11:59 PM | 599 (6.1%) | 552 (7.1%) |
| Total | 9,772 (100.0%) | 7,739 (100.0%) |
Housing Occupancy in Bountiful
Occupancy by Ownership in Bountiful
Of the total 14,505 dwellings in Bountiful, owner-occupied units account for 10,590 (73.0%), while renter-occupied units make up 3,915 (27.0%).
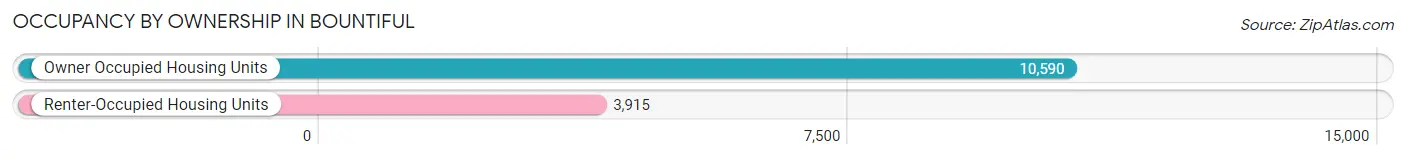
| Occupancy | # Housing Units | % Housing Units |
| Owner Occupied Housing Units | 10,590 | 73.0% |
| Renter-Occupied Housing Units | 3,915 | 27.0% |
| Total Occupied Housing Units | 14,505 | 100.0% |
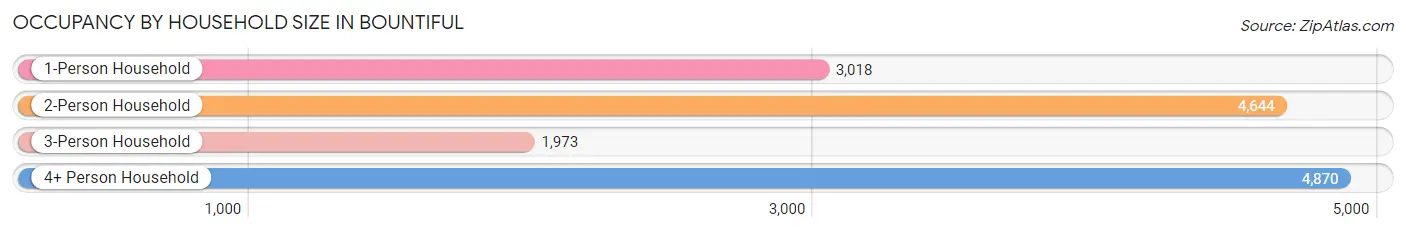
Occupancy by Household Size in Bountiful
| Household Size | # Housing Units | % Housing Units |
| 1-Person Household | 3,018 | 20.8% |
| 2-Person Household | 4,644 | 32.0% |
| 3-Person Household | 1,973 | 13.6% |
| 4+ Person Household | 4,870 | 33.6% |
| Total Housing Units | 14,505 | 100.0% |
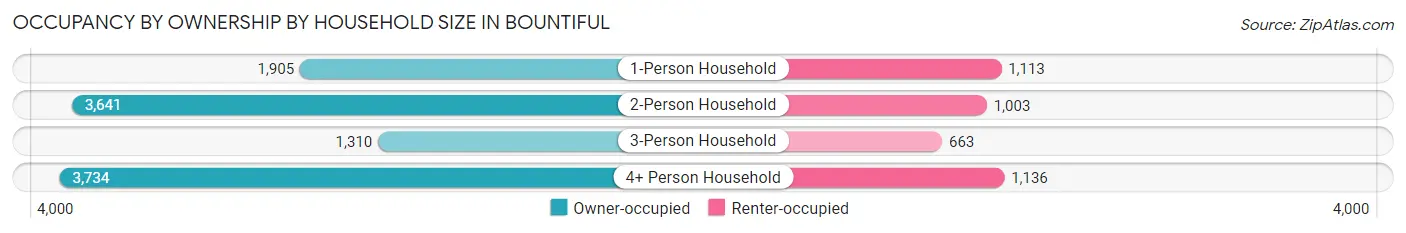
Occupancy by Ownership by Household Size in Bountiful
| Household Size | Owner-occupied | Renter-occupied |
| 1-Person Household | 1,905 (63.1%) | 1,113 (36.9%) |
| 2-Person Household | 3,641 (78.4%) | 1,003 (21.6%) |
| 3-Person Household | 1,310 (66.4%) | 663 (33.6%) |
| 4+ Person Household | 3,734 (76.7%) | 1,136 (23.3%) |
| Total Housing Units | 10,590 (73.0%) | 3,915 (27.0%) |
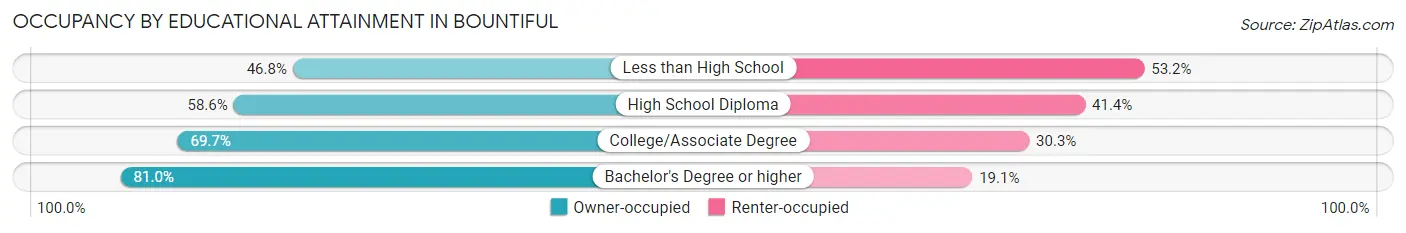
Occupancy by Educational Attainment in Bountiful
| Household Size | Owner-occupied | Renter-occupied |
| Less than High School | 178 (46.8%) | 202 (53.2%) |
| High School Diploma | 1,203 (58.6%) | 851 (41.4%) |
| College/Associate Degree | 3,476 (69.7%) | 1,513 (30.3%) |
| Bachelor's Degree or higher | 5,733 (80.9%) | 1,349 (19.1%) |
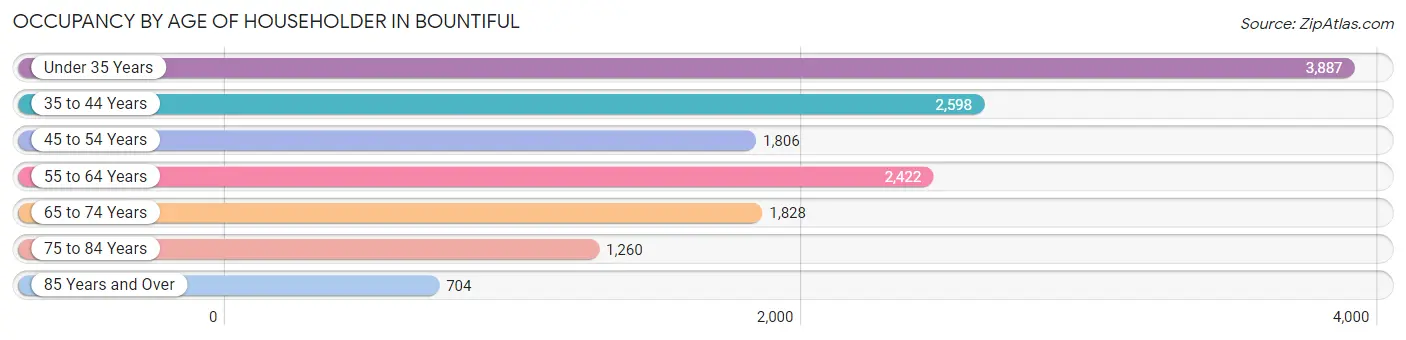
Occupancy by Age of Householder in Bountiful
| Age Bracket | # Households | % Households |
| Under 35 Years | 3,887 | 26.8% |
| 35 to 44 Years | 2,598 | 17.9% |
| 45 to 54 Years | 1,806 | 12.4% |
| 55 to 64 Years | 2,422 | 16.7% |
| 65 to 74 Years | 1,828 | 12.6% |
| 75 to 84 Years | 1,260 | 8.7% |
| 85 Years and Over | 704 | 4.9% |
| Total | 14,505 | 100.0% |
Housing Finances in Bountiful
Median Income by Occupancy in Bountiful
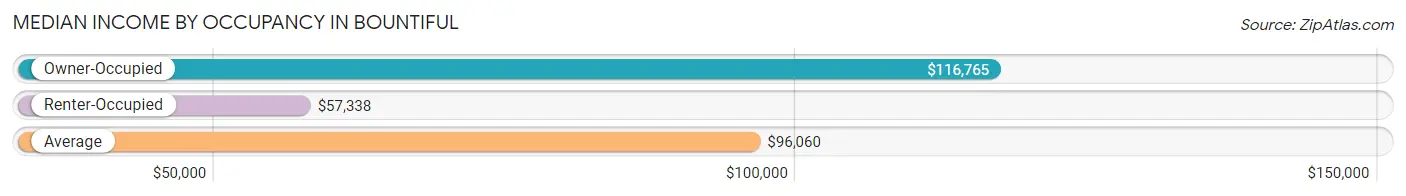
| Occupancy Type | # Households | Median Income |
| Owner-Occupied | 10,590 (73.0%) | $116,765 |
| Renter-Occupied | 3,915 (27.0%) | $57,338 |
| Average | 14,505 (100.0%) | $96,060 |
Occupancy by Householder Income Bracket in Bountiful
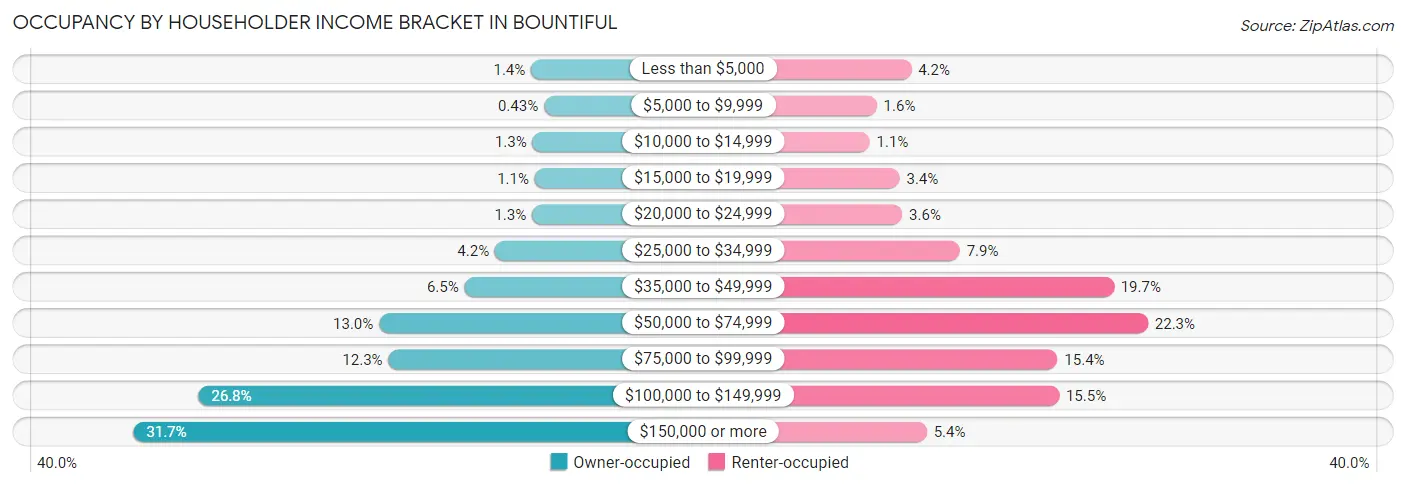
| Income Bracket | Owner-occupied | Renter-occupied |
| Less than $5,000 | 149 (1.4%) | 166 (4.2%) |
| $5,000 to $9,999 | 46 (0.4%) | 63 (1.6%) |
| $10,000 to $14,999 | 138 (1.3%) | 42 (1.1%) |
| $15,000 to $19,999 | 120 (1.1%) | 131 (3.4%) |
| $20,000 to $24,999 | 142 (1.3%) | 139 (3.5%) |
| $25,000 to $34,999 | 441 (4.2%) | 311 (7.9%) |
| $35,000 to $49,999 | 686 (6.5%) | 770 (19.7%) |
| $50,000 to $74,999 | 1,376 (13.0%) | 872 (22.3%) |
| $75,000 to $99,999 | 1,300 (12.3%) | 602 (15.4%) |
| $100,000 to $149,999 | 2,834 (26.8%) | 607 (15.5%) |
| $150,000 or more | 3,358 (31.7%) | 212 (5.4%) |
| Total | 10,590 (100.0%) | 3,915 (100.0%) |
Monthly Housing Cost Tiers in Bountiful
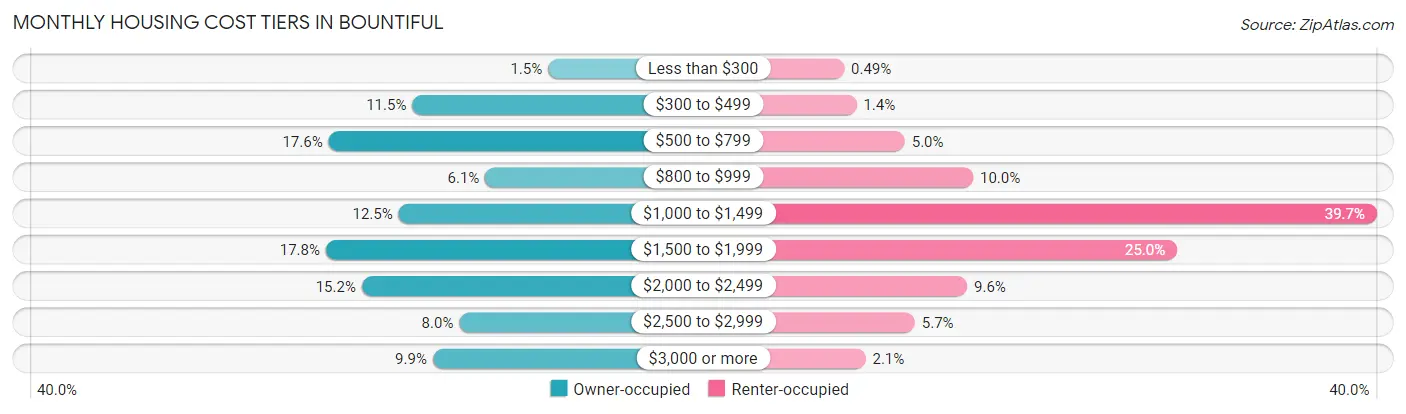
| Monthly Cost | Owner-occupied | Renter-occupied |
| Less than $300 | 154 (1.5%) | 19 (0.5%) |
| $300 to $499 | 1,213 (11.5%) | 55 (1.4%) |
| $500 to $799 | 1,866 (17.6%) | 194 (5.0%) |
| $800 to $999 | 644 (6.1%) | 391 (10.0%) |
| $1,000 to $1,499 | 1,320 (12.5%) | 1,555 (39.7%) |
| $1,500 to $1,999 | 1,887 (17.8%) | 979 (25.0%) |
| $2,000 to $2,499 | 1,607 (15.2%) | 374 (9.6%) |
| $2,500 to $2,999 | 846 (8.0%) | 223 (5.7%) |
| $3,000 or more | 1,053 (9.9%) | 81 (2.1%) |
| Total | 10,590 (100.0%) | 3,915 (100.0%) |
Physical Housing Characteristics in Bountiful
Housing Structures in Bountiful
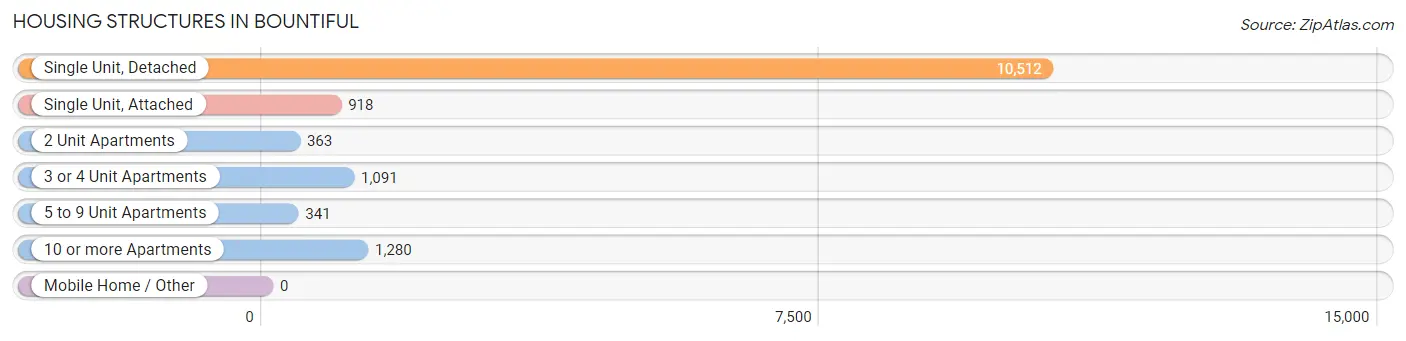
| Structure Type | # Housing Units | % Housing Units |
| Single Unit, Detached | 10,512 | 72.5% |
| Single Unit, Attached | 918 | 6.3% |
| 2 Unit Apartments | 363 | 2.5% |
| 3 or 4 Unit Apartments | 1,091 | 7.5% |
| 5 to 9 Unit Apartments | 341 | 2.4% |
| 10 or more Apartments | 1,280 | 8.8% |
| Mobile Home / Other | 0 | 0.0% |
| Total | 14,505 | 100.0% |
Housing Structures by Occupancy in Bountiful
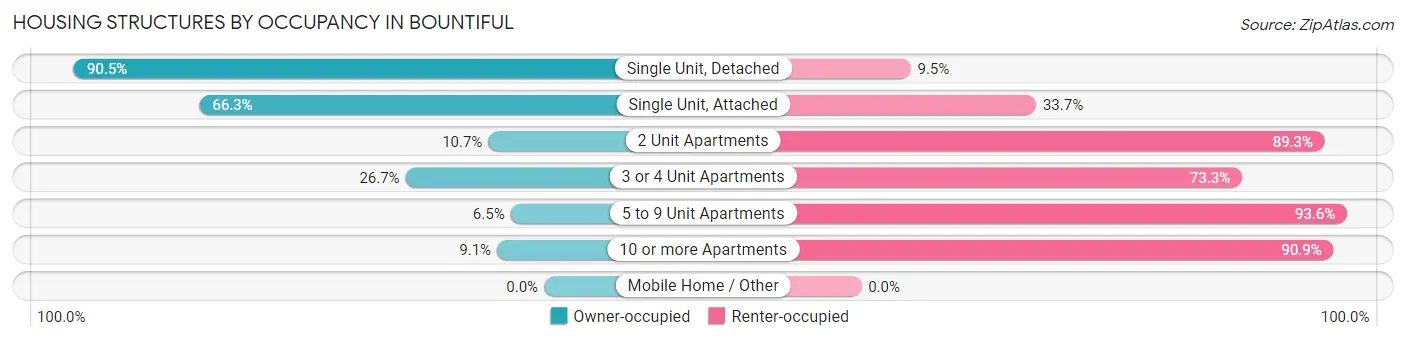
| Structure Type | Owner-occupied | Renter-occupied |
| Single Unit, Detached | 9,513 (90.5%) | 999 (9.5%) |
| Single Unit, Attached | 609 (66.3%) | 309 (33.7%) |
| 2 Unit Apartments | 39 (10.7%) | 324 (89.3%) |
| 3 or 4 Unit Apartments | 291 (26.7%) | 800 (73.3%) |
| 5 to 9 Unit Apartments | 22 (6.5%) | 319 (93.5%) |
| 10 or more Apartments | 116 (9.1%) | 1,164 (90.9%) |
| Mobile Home / Other | 0 (0.0%) | 0 (0.0%) |
| Total | 10,590 (73.0%) | 3,915 (27.0%) |
Housing Structures by Number of Rooms in Bountiful
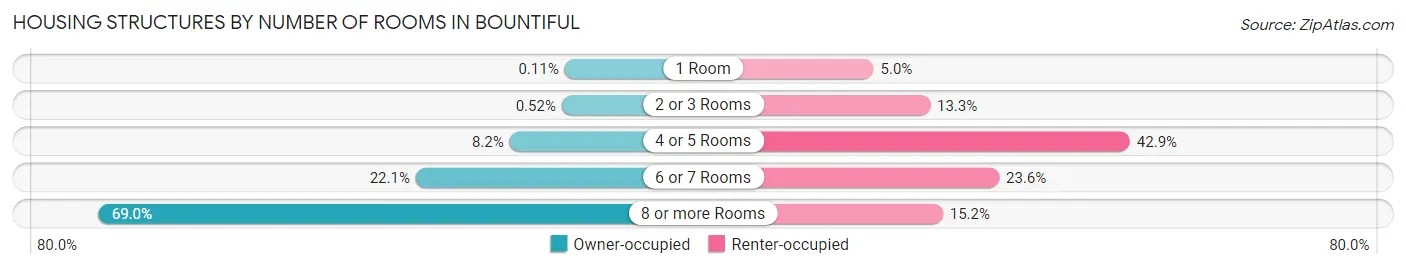
| Number of Rooms | Owner-occupied | Renter-occupied |
| 1 Room | 12 (0.1%) | 195 (5.0%) |
| 2 or 3 Rooms | 55 (0.5%) | 522 (13.3%) |
| 4 or 5 Rooms | 872 (8.2%) | 1,680 (42.9%) |
| 6 or 7 Rooms | 2,342 (22.1%) | 922 (23.5%) |
| 8 or more Rooms | 7,309 (69.0%) | 596 (15.2%) |
| Total | 10,590 (100.0%) | 3,915 (100.0%) |
Housing Structure by Heating Type in Bountiful
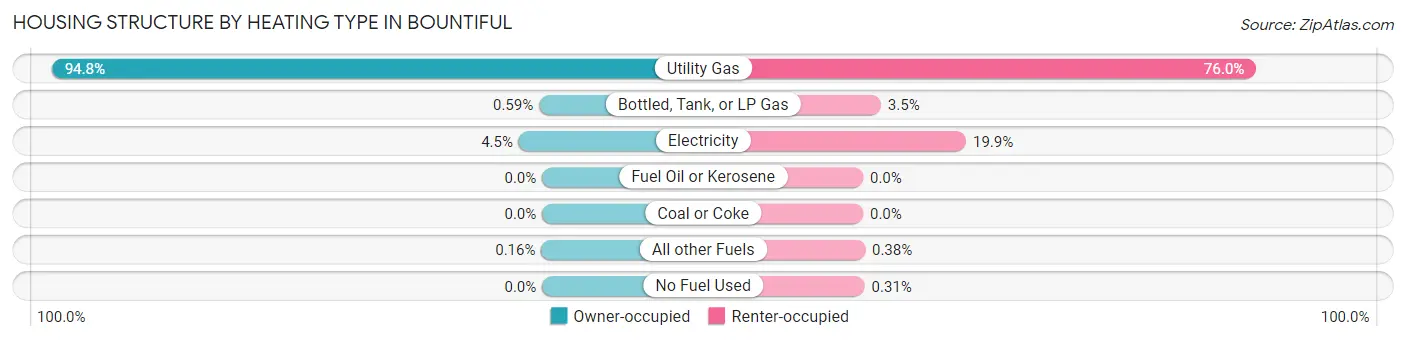
| Heating Type | Owner-occupied | Renter-occupied |
| Utility Gas | 10,034 (94.8%) | 2,974 (76.0%) |
| Bottled, Tank, or LP Gas | 62 (0.6%) | 135 (3.5%) |
| Electricity | 477 (4.5%) | 779 (19.9%) |
| Fuel Oil or Kerosene | 0 (0.0%) | 0 (0.0%) |
| Coal or Coke | 0 (0.0%) | 0 (0.0%) |
| All other Fuels | 17 (0.2%) | 15 (0.4%) |
| No Fuel Used | 0 (0.0%) | 12 (0.3%) |
| Total | 10,590 (100.0%) | 3,915 (100.0%) |
Household Vehicle Usage in Bountiful
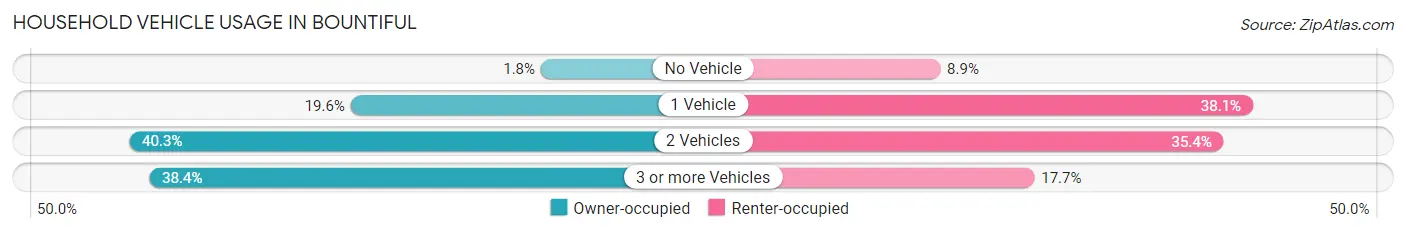
| Vehicles per Household | Owner-occupied | Renter-occupied |
| No Vehicle | 192 (1.8%) | 348 (8.9%) |
| 1 Vehicle | 2,071 (19.6%) | 1,491 (38.1%) |
| 2 Vehicles | 4,263 (40.3%) | 1,384 (35.3%) |
| 3 or more Vehicles | 4,064 (38.4%) | 692 (17.7%) |
| Total | 10,590 (100.0%) | 3,915 (100.0%) |
Real Estate & Mortgages in Bountiful
Real Estate and Mortgage Overview in Bountiful
| Characteristic | Without Mortgage | With Mortgage |
| Housing Units | 3,722 | 6,868 |
| Median Property Value | $443,500 | $444,000 |
| Median Household Income | $100,529 | $2,354 |
| Monthly Housing Costs | $572 | $1,053 |
| Real Estate Taxes | $2,740 | $60 |
Property Value by Mortgage Status in Bountiful
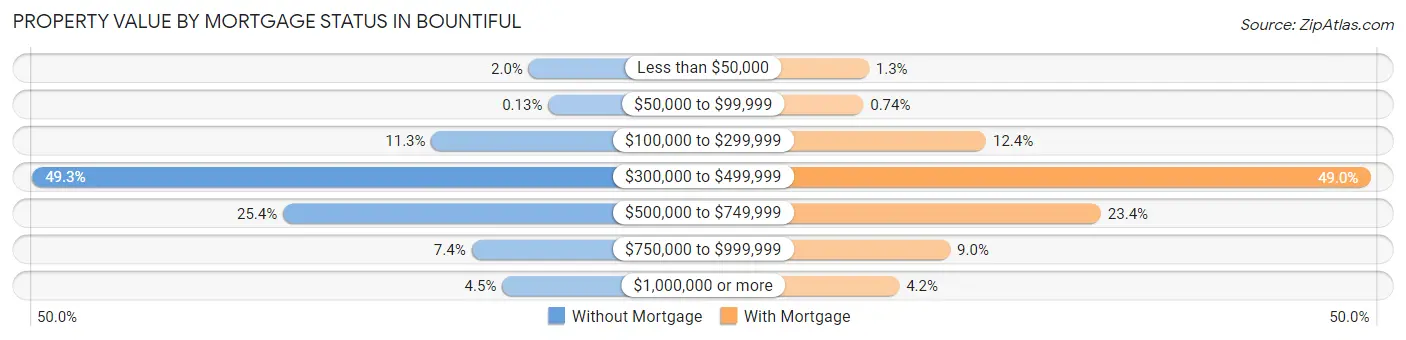
| Property Value | Without Mortgage | With Mortgage |
| Less than $50,000 | 74 (2.0%) | 87 (1.3%) |
| $50,000 to $99,999 | 5 (0.1%) | 51 (0.7%) |
| $100,000 to $299,999 | 419 (11.3%) | 854 (12.4%) |
| $300,000 to $499,999 | 1,834 (49.3%) | 3,366 (49.0%) |
| $500,000 to $749,999 | 945 (25.4%) | 1,605 (23.4%) |
| $750,000 to $999,999 | 277 (7.4%) | 619 (9.0%) |
| $1,000,000 or more | 168 (4.5%) | 286 (4.2%) |
| Total | 3,722 (100.0%) | 6,868 (100.0%) |
Household Income by Mortgage Status in Bountiful
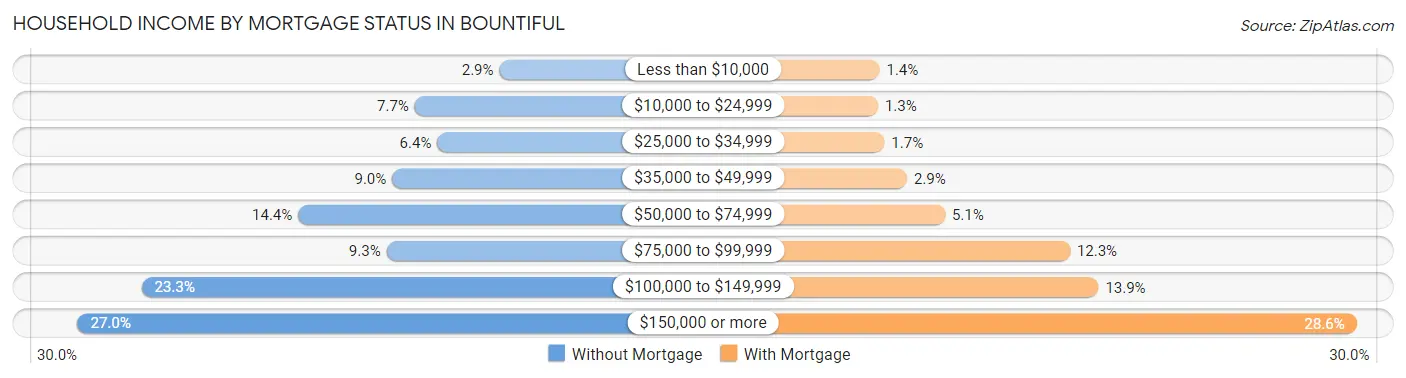
| Household Income | Without Mortgage | With Mortgage |
| Less than $10,000 | 107 (2.9%) | 94 (1.4%) |
| $10,000 to $24,999 | 287 (7.7%) | 88 (1.3%) |
| $25,000 to $34,999 | 239 (6.4%) | 113 (1.7%) |
| $35,000 to $49,999 | 335 (9.0%) | 202 (2.9%) |
| $50,000 to $74,999 | 535 (14.4%) | 351 (5.1%) |
| $75,000 to $99,999 | 347 (9.3%) | 841 (12.2%) |
| $100,000 to $149,999 | 868 (23.3%) | 953 (13.9%) |
| $150,000 or more | 1,004 (27.0%) | 1,966 (28.6%) |
| Total | 3,722 (100.0%) | 6,868 (100.0%) |
Property Value to Household Income Ratio in Bountiful
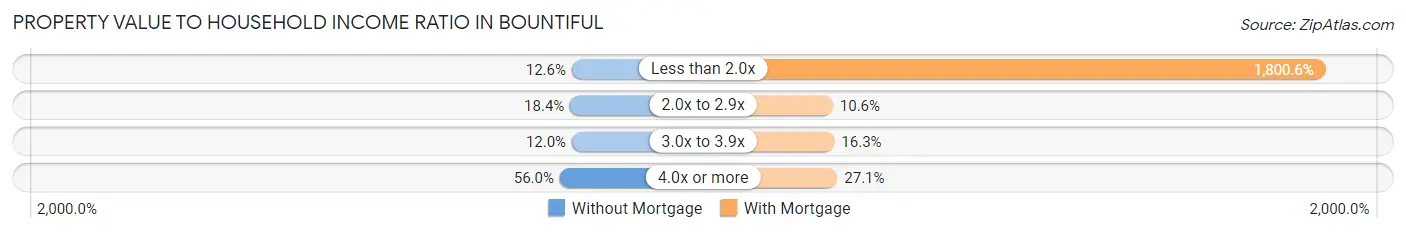
| Value-to-Income Ratio | Without Mortgage | With Mortgage |
| Less than 2.0x | 468 (12.6%) | 123,668 (1,800.6%) |
| 2.0x to 2.9x | 686 (18.4%) | 729 (10.6%) |
| 3.0x to 3.9x | 445 (12.0%) | 1,120 (16.3%) |
| 4.0x or more | 2,083 (56.0%) | 1,860 (27.1%) |
| Total | 3,722 (100.0%) | 6,868 (100.0%) |
Real Estate Taxes by Mortgage Status in Bountiful
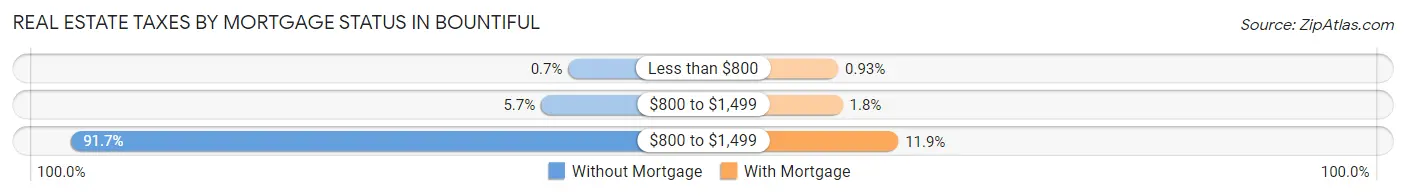
| Property Taxes | Without Mortgage | With Mortgage |
| Less than $800 | 26 (0.7%) | 64 (0.9%) |
| $800 to $1,499 | 211 (5.7%) | 120 (1.8%) |
| $800 to $1,499 | 3,412 (91.7%) | 817 (11.9%) |
| Total | 3,722 (100.0%) | 6,868 (100.0%) |
Health & Disability in Bountiful
Health Insurance Coverage by Age in Bountiful
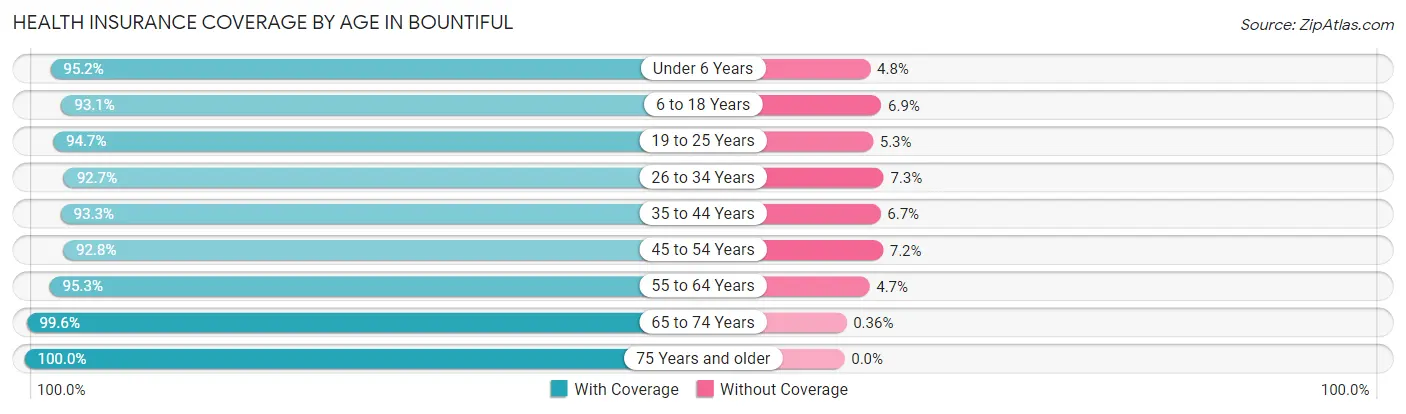
| Age Bracket | With Coverage | Without Coverage |
| Under 6 Years | 4,448 (95.2%) | 225 (4.8%) |
| 6 to 18 Years | 8,664 (93.1%) | 638 (6.9%) |
| 19 to 25 Years | 3,782 (94.7%) | 212 (5.3%) |
| 26 to 34 Years | 6,448 (92.7%) | 508 (7.3%) |
| 35 to 44 Years | 5,046 (93.3%) | 364 (6.7%) |
| 45 to 54 Years | 3,398 (92.8%) | 263 (7.2%) |
| 55 to 64 Years | 4,299 (95.3%) | 210 (4.7%) |
| 65 to 74 Years | 3,336 (99.6%) | 12 (0.4%) |
| 75 Years and older | 2,996 (100.0%) | 0 (0.0%) |
| Total | 42,417 (94.6%) | 2,432 (5.4%) |
Health Insurance Coverage by Citizenship Status in Bountiful
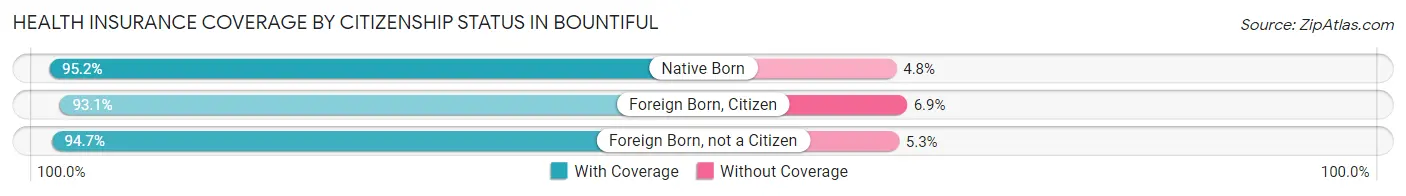
| Citizenship Status | With Coverage | Without Coverage |
| Native Born | 4,448 (95.2%) | 225 (4.8%) |
| Foreign Born, Citizen | 8,664 (93.1%) | 638 (6.9%) |
| Foreign Born, not a Citizen | 3,782 (94.7%) | 212 (5.3%) |
Health Insurance Coverage by Household Income in Bountiful
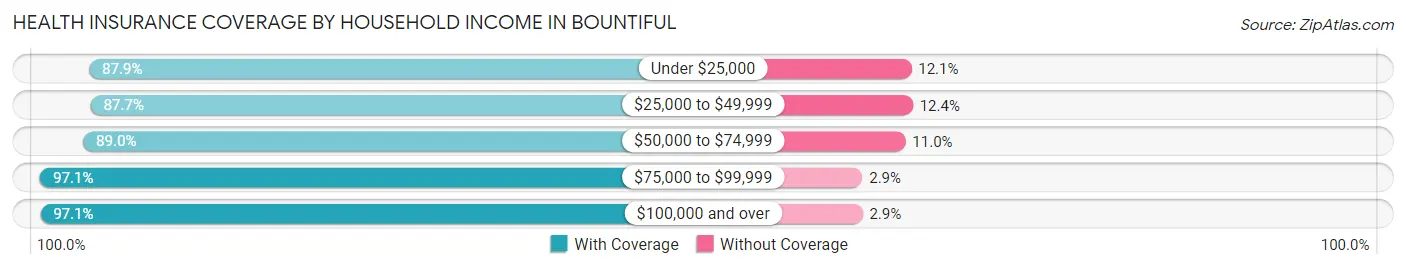
| Household Income | With Coverage | Without Coverage |
| Under $25,000 | 1,964 (87.9%) | 270 (12.1%) |
| $25,000 to $49,999 | 4,463 (87.6%) | 629 (12.3%) |
| $50,000 to $74,999 | 4,766 (89.0%) | 588 (11.0%) |
| $75,000 to $99,999 | 5,254 (97.1%) | 157 (2.9%) |
| $100,000 and over | 25,940 (97.1%) | 784 (2.9%) |
Public vs Private Health Insurance Coverage by Age in Bountiful
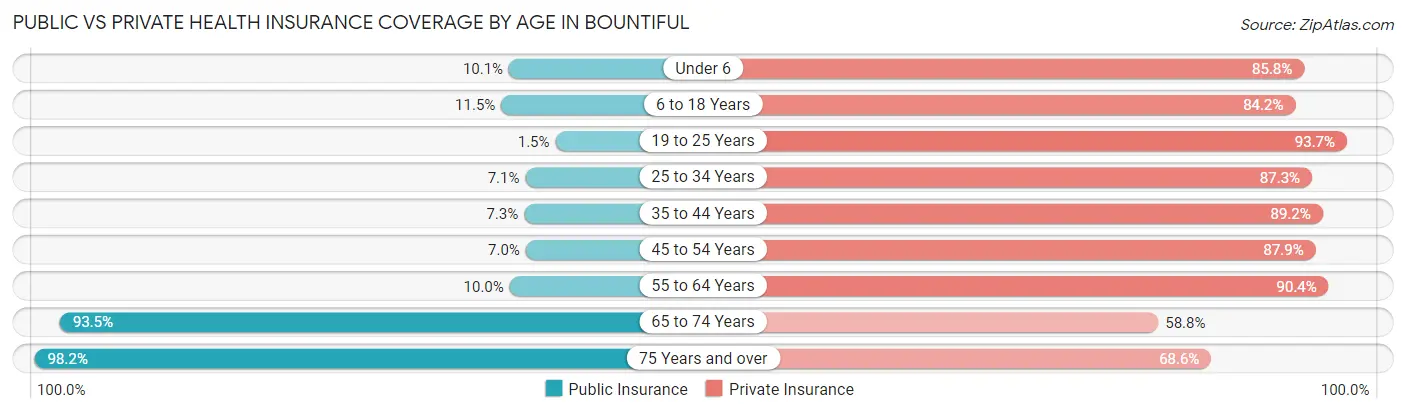
| Age Bracket | Public Insurance | Private Insurance |
| Under 6 | 472 (10.1%) | 4,010 (85.8%) |
| 6 to 18 Years | 1,073 (11.5%) | 7,829 (84.2%) |
| 19 to 25 Years | 59 (1.5%) | 3,744 (93.7%) |
| 25 to 34 Years | 491 (7.1%) | 6,069 (87.3%) |
| 35 to 44 Years | 395 (7.3%) | 4,828 (89.2%) |
| 45 to 54 Years | 256 (7.0%) | 3,219 (87.9%) |
| 55 to 64 Years | 450 (10.0%) | 4,074 (90.3%) |
| 65 to 74 Years | 3,129 (93.5%) | 1,967 (58.8%) |
| 75 Years and over | 2,941 (98.2%) | 2,054 (68.6%) |
| Total | 9,266 (20.7%) | 37,794 (84.3%) |
Disability Status by Sex by Age in Bountiful
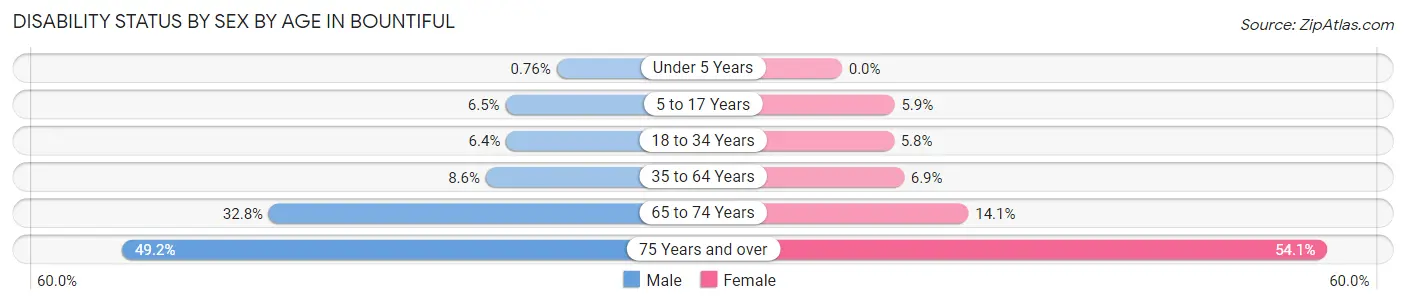
| Age Bracket | Male | Female |
| Under 5 Years | 15 (0.8%) | 0 (0.0%) |
| 5 to 17 Years | 307 (6.5%) | 275 (5.9%) |
| 18 to 34 Years | 365 (6.4%) | 333 (5.8%) |
| 35 to 64 Years | 591 (8.6%) | 465 (6.9%) |
| 65 to 74 Years | 502 (32.8%) | 256 (14.1%) |
| 75 Years and over | 608 (49.1%) | 951 (54.1%) |
Disability Class by Sex by Age in Bountiful
Disability Class: Hearing Difficulty
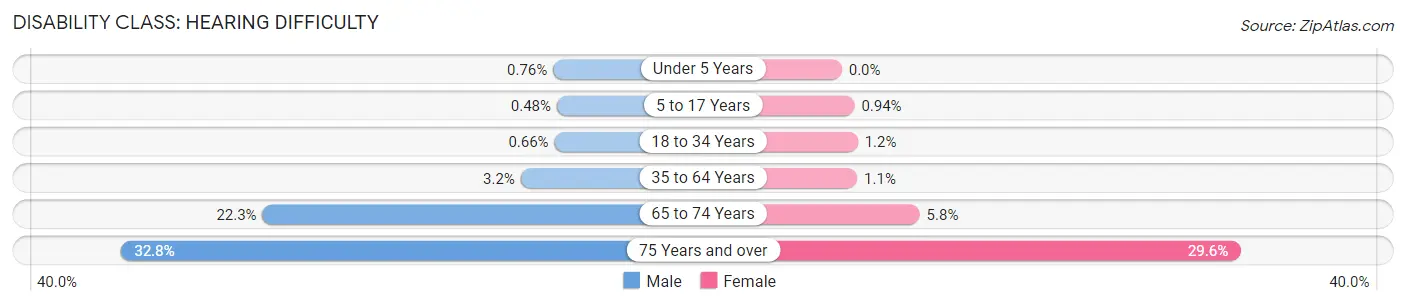
| Age Bracket | Male | Female |
| Under 5 Years | 15 (0.8%) | 0 (0.0%) |
| 5 to 17 Years | 23 (0.5%) | 44 (0.9%) |
| 18 to 34 Years | 38 (0.7%) | 68 (1.2%) |
| 35 to 64 Years | 217 (3.2%) | 77 (1.1%) |
| 65 to 74 Years | 342 (22.3%) | 105 (5.8%) |
| 75 Years and over | 406 (32.8%) | 520 (29.6%) |
Disability Class: Vision Difficulty
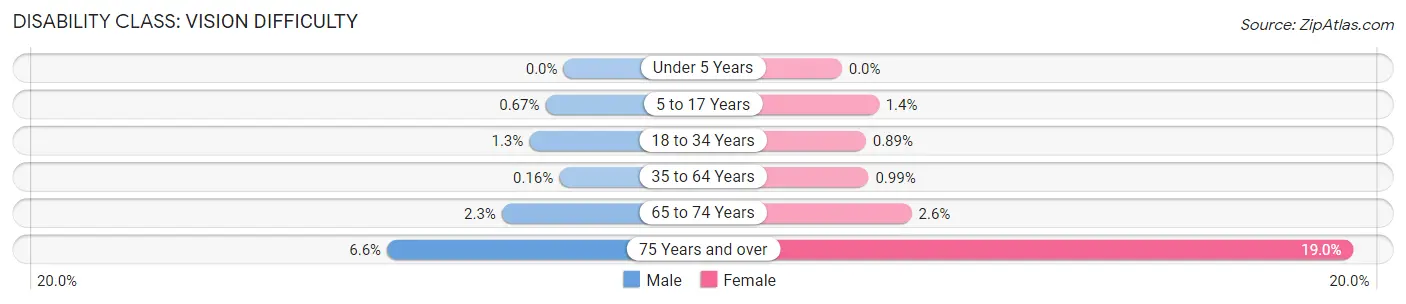
| Age Bracket | Male | Female |
| Under 5 Years | 0 (0.0%) | 0 (0.0%) |
| 5 to 17 Years | 32 (0.7%) | 64 (1.4%) |
| 18 to 34 Years | 73 (1.3%) | 51 (0.9%) |
| 35 to 64 Years | 11 (0.2%) | 67 (1.0%) |
| 65 to 74 Years | 35 (2.3%) | 47 (2.6%) |
| 75 Years and over | 81 (6.6%) | 334 (19.0%) |
Disability Class: Cognitive Difficulty
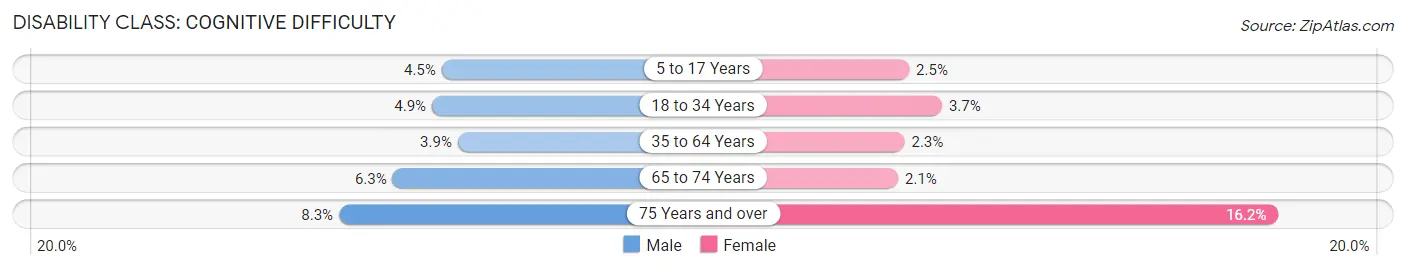
| Age Bracket | Male | Female |
| 5 to 17 Years | 215 (4.5%) | 117 (2.5%) |
| 18 to 34 Years | 280 (4.9%) | 214 (3.7%) |
| 35 to 64 Years | 268 (3.9%) | 157 (2.3%) |
| 65 to 74 Years | 97 (6.3%) | 38 (2.1%) |
| 75 Years and over | 103 (8.3%) | 285 (16.2%) |
Disability Class: Ambulatory Difficulty
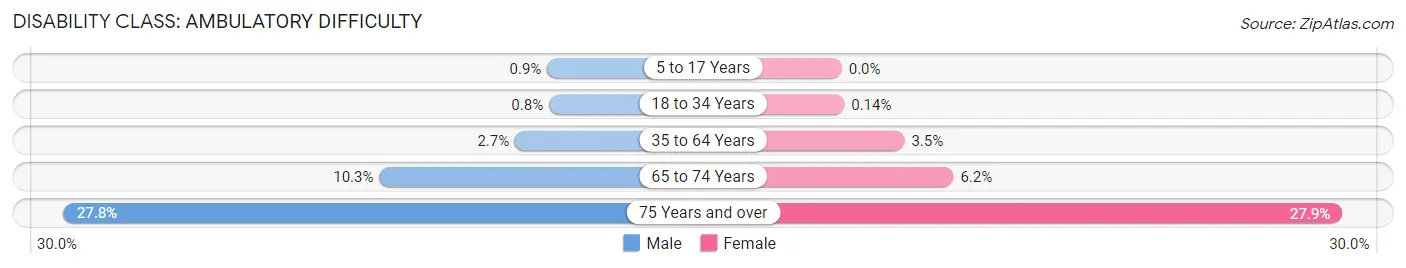
| Age Bracket | Male | Female |
| 5 to 17 Years | 43 (0.9%) | 0 (0.0%) |
| 18 to 34 Years | 46 (0.8%) | 8 (0.1%) |
| 35 to 64 Years | 184 (2.7%) | 235 (3.5%) |
| 65 to 74 Years | 157 (10.2%) | 113 (6.2%) |
| 75 Years and over | 344 (27.8%) | 490 (27.9%) |
Disability Class: Self-Care Difficulty
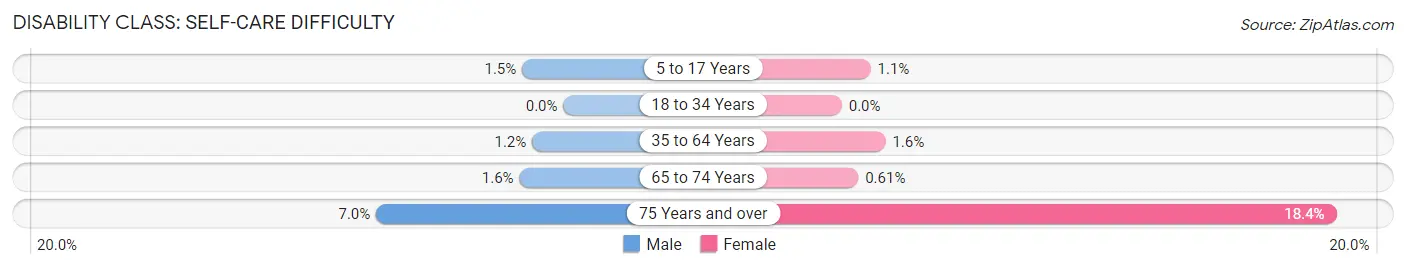
| Age Bracket | Male | Female |
| 5 to 17 Years | 73 (1.5%) | 50 (1.1%) |
| 18 to 34 Years | 0 (0.0%) | 0 (0.0%) |
| 35 to 64 Years | 79 (1.2%) | 109 (1.6%) |
| 65 to 74 Years | 25 (1.6%) | 11 (0.6%) |
| 75 Years and over | 86 (7.0%) | 323 (18.4%) |
Technology Access in Bountiful
Computing Device Access in Bountiful
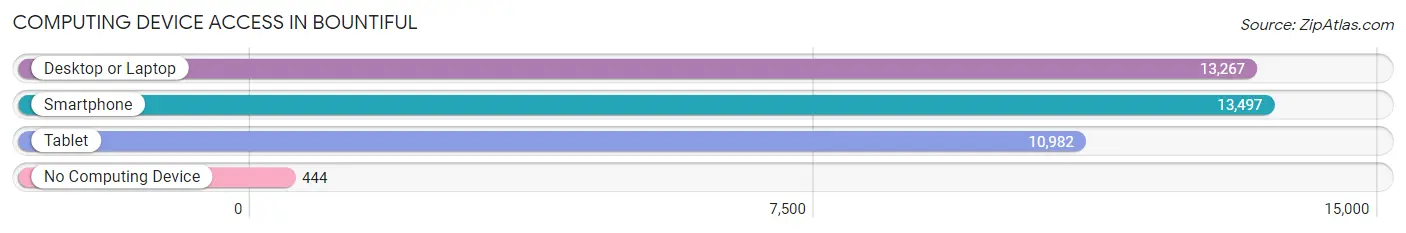
| Device Type | # Households | % Households |
| Desktop or Laptop | 13,267 | 91.5% |
| Smartphone | 13,497 | 93.0% |
| Tablet | 10,982 | 75.7% |
| No Computing Device | 444 | 3.1% |
| Total | 14,505 | 100.0% |
Internet Access in Bountiful
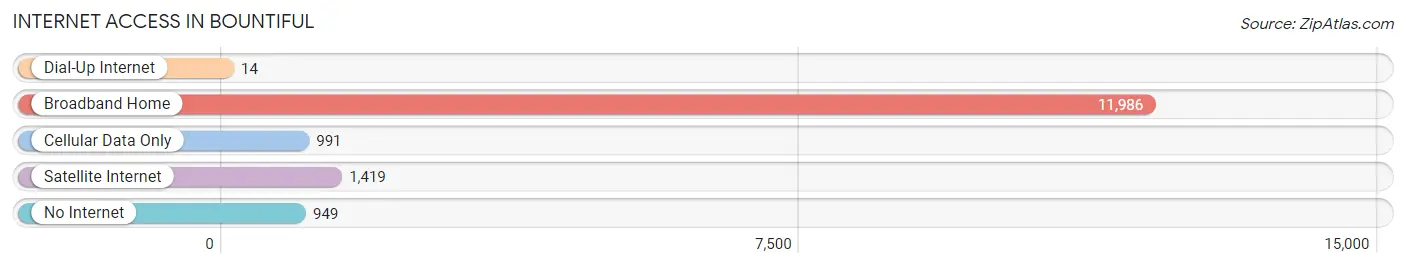
| Internet Type | # Households | % Households |
| Dial-Up Internet | 14 | 0.1% |
| Broadband Home | 11,986 | 82.6% |
| Cellular Data Only | 991 | 6.8% |
| Satellite Internet | 1,419 | 9.8% |
| No Internet | 949 | 6.5% |
| Total | 14,505 | 100.0% |
Bountiful Summary
Bountiful, Utah is a city located in Davis County, Utah, United States. It is part of the Ogden-Clearfield Metropolitan Statistical Area. The population was 42,552 at the 2010 census, making it the 13th largest city in the state.
History
Bountiful was first settled in 1847 by Perrigrine Sessions and his family. The city was named after the Book of Mormon term for a place of great abundance. The city was incorporated in 1892 and has grown steadily since then.
Geography
Bountiful is located at the base of the Wasatch Mountains, just north of Salt Lake City. It is bordered by the cities of Woods Cross to the north, West Bountiful to the west, and Centerville to the south. The city covers an area of 11.6 square miles and has an elevation of 4,330 feet.
Climate
Bountiful has a humid continental climate, with cold winters and hot summers. The average annual temperature is 46°F, with an average high of 68°F in July and an average low of 24°F in January. The average annual precipitation is 17.5 inches.
Economy
Bountiful’s economy is largely based on retail, healthcare, and manufacturing. The city is home to several large employers, including Intermountain Healthcare, Smith’s Food and Drug, and ATK. The city also has a thriving small business sector, with many locally owned restaurants, shops, and services.
Demographics
As of the 2010 census, Bountiful had a population of 42,552. The racial makeup of the city was 91.3% White, 1.2% African American, 0.7% Native American, 1.7% Asian, 0.2% Pacific Islander, 2.7% from other races, and 2.2% from two or more races. Hispanic or Latino of any race were 6.7% of the population.
The median income for a household in Bountiful was $60,945, and the median income for a family was $71,845. The per capita income for the city was $27,845. About 4.3% of families and 5.7% of the population were below the poverty line, including 6.3% of those under age 18 and 4.2% of those age 65 or over.
Bountiful is a diverse city with a strong sense of community. It is a great place to live, work, and raise a family. With its close proximity to Salt Lake City, Bountiful offers easy access to all the amenities of a large city, while still maintaining its small-town charm.
Common Questions
What is Per Capita Income in Bountiful?
Per Capita income in Bountiful is $41,107.
What is the Median Family Income in Bountiful?
Median Family Income in Bountiful is $112,076.
What is the Median Household income in Bountiful?
Median Household Income in Bountiful is $96,060.
What is Income or Wage Gap in Bountiful?
Income or Wage Gap in Bountiful is 40.0%.
Women in Bountiful earn 60.0 cents for every dollar earned by a man.
What is Inequality or Gini Index in Bountiful?
Inequality or Gini Index in Bountiful is 0.43.
What is the Total Population of Bountiful?
Total Population of Bountiful is 45,353.
What is the Total Male Population of Bountiful?
Total Male Population of Bountiful is 22,372.
What is the Total Female Population of Bountiful?
Total Female Population of Bountiful is 22,981.
What is the Ratio of Males per 100 Females in Bountiful?
There are 97.35 Males per 100 Females in Bountiful.
What is the Ratio of Females per 100 Males in Bountiful?
There are 102.72 Females per 100 Males in Bountiful.
What is the Median Population Age in Bountiful?
Median Population Age in Bountiful is 32.2 Years.
What is the Average Family Size in Bountiful
Average Family Size in Bountiful is 3.6 People.
What is the Average Household Size in Bountiful
Average Household Size in Bountiful is 3.1 People.
How Large is the Labor Force in Bountiful?
There are 22,095 People in the Labor Forcein in Bountiful.
What is the Percentage of People in the Labor Force in Bountiful?
66.5% of People are in the Labor Force in Bountiful.
What is the Unemployment Rate in Bountiful?
Unemployment Rate in Bountiful is 2.6%.