Pleasant Grove, UT Map & Demographics
Pleasant Grove Map
Pleasant Grove Overview
$36,359
PER CAPITA INCOME
$99,992
AVG FAMILY INCOME
$91,322
AVG HOUSEHOLD INCOME
47.2%
WAGE / INCOME GAP [ % ]
52.8¢/ $1
WAGE / INCOME GAP [ $ ]
$12,715
FAMILY INCOME DEFICIT
0.41
INEQUALITY / GINI INDEX
37,453
TOTAL POPULATION
19,551
MALE POPULATION
17,902
FEMALE POPULATION
109.21
MALES / 100 FEMALES
91.57
FEMALES / 100 MALES
27.6
MEDIAN AGE
3.7
AVG FAMILY SIZE
3.2
AVG HOUSEHOLD SIZE
18,668
LABOR FORCE [ PEOPLE ]
69.7%
PERCENT IN LABOR FORCE
2.6%
UNEMPLOYMENT RATE
Pleasant Grove Zip Codes
Income in Pleasant Grove
Income Overview in Pleasant Grove
Per Capita Income in Pleasant Grove is $36,359, while median incomes of families and households are $99,992 and $91,322 respectively.
| Characteristic | Number | Measure |
| Per Capita Income | 37,453 | $36,359 |
| Median Family Income | 9,083 | $99,992 |
| Mean Family Income | 9,083 | $127,908 |
| Median Household Income | 11,492 | $91,322 |
| Mean Household Income | 11,492 | $116,194 |
| Income Deficit | 9,083 | $12,715 |
| Wage / Income Gap (%) | 37,453 | 47.17% |
| Wage / Income Gap ($) | 37,453 | 52.83¢ per $1 |
| Gini / Inequality Index | 37,453 | 0.41 |
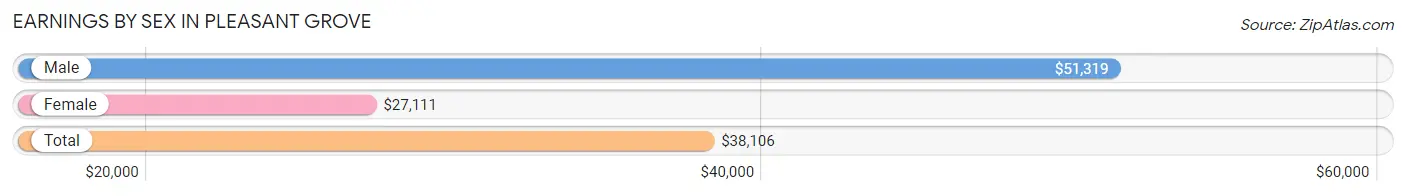
Earnings by Sex in Pleasant Grove
Average Earnings in Pleasant Grove are $38,106, $51,319 for men and $27,111 for women, a difference of 47.2%.
| Sex | Number | Average Earnings |
| Male | 11,504 (57.4%) | $51,319 |
| Female | 8,551 (42.6%) | $27,111 |
| Total | 20,055 (100.0%) | $38,106 |
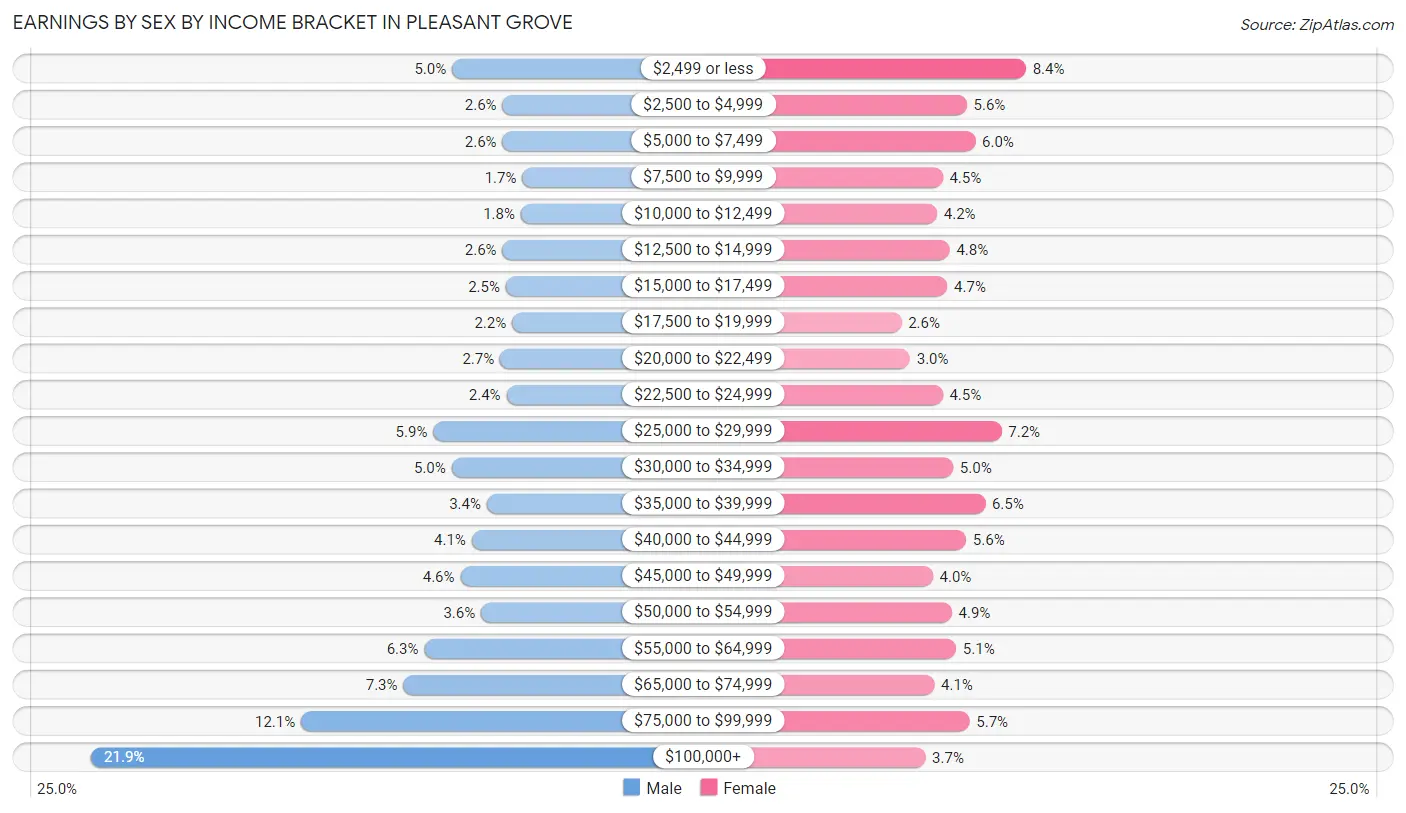
Earnings by Sex by Income Bracket in Pleasant Grove
The most common earnings brackets in Pleasant Grove are $100,000+ for men (2,517 | 21.9%) and $2,499 or less for women (717 | 8.4%).
| Income | Male | Female |
| $2,499 or less | 573 (5.0%) | 717 (8.4%) |
| $2,500 to $4,999 | 301 (2.6%) | 480 (5.6%) |
| $5,000 to $7,499 | 301 (2.6%) | 514 (6.0%) |
| $7,500 to $9,999 | 194 (1.7%) | 383 (4.5%) |
| $10,000 to $12,499 | 203 (1.8%) | 361 (4.2%) |
| $12,500 to $14,999 | 301 (2.6%) | 411 (4.8%) |
| $15,000 to $17,499 | 283 (2.5%) | 402 (4.7%) |
| $17,500 to $19,999 | 250 (2.2%) | 218 (2.5%) |
| $20,000 to $22,499 | 314 (2.7%) | 252 (2.9%) |
| $22,500 to $24,999 | 279 (2.4%) | 383 (4.5%) |
| $25,000 to $29,999 | 674 (5.9%) | 619 (7.2%) |
| $30,000 to $34,999 | 575 (5.0%) | 425 (5.0%) |
| $35,000 to $39,999 | 385 (3.4%) | 553 (6.5%) |
| $40,000 to $44,999 | 467 (4.1%) | 477 (5.6%) |
| $45,000 to $49,999 | 528 (4.6%) | 344 (4.0%) |
| $50,000 to $54,999 | 416 (3.6%) | 420 (4.9%) |
| $55,000 to $64,999 | 722 (6.3%) | 437 (5.1%) |
| $65,000 to $74,999 | 835 (7.3%) | 350 (4.1%) |
| $75,000 to $99,999 | 1,386 (12.0%) | 491 (5.7%) |
| $100,000+ | 2,517 (21.9%) | 314 (3.7%) |
| Total | 11,504 (100.0%) | 8,551 (100.0%) |
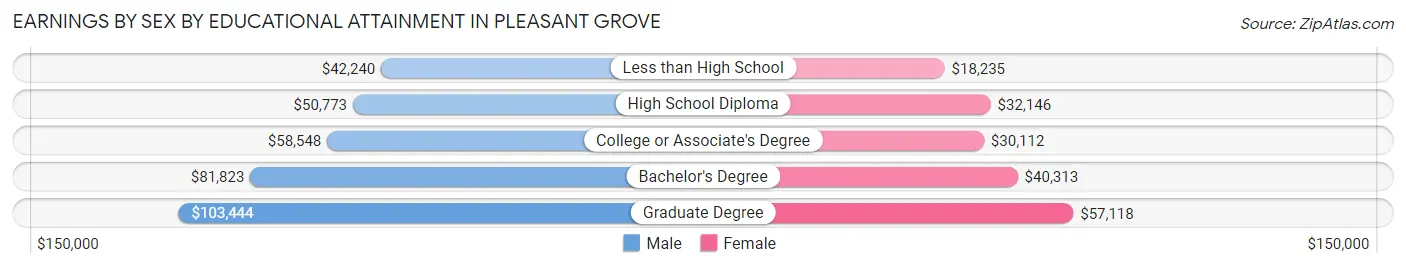
Earnings by Sex by Educational Attainment in Pleasant Grove
Average earnings in Pleasant Grove are $69,204 for men and $34,619 for women, a difference of 50.0%. Men with an educational attainment of graduate degree enjoy the highest average annual earnings of $103,444, while those with less than high school education earn the least with $42,240. Women with an educational attainment of graduate degree earn the most with the average annual earnings of $57,118, while those with less than high school education have the smallest earnings of $18,235.
| Educational Attainment | Male Income | Female Income |
| Less than High School | $42,240 | $18,235 |
| High School Diploma | $50,773 | $32,146 |
| College or Associate's Degree | $58,548 | $30,112 |
| Bachelor's Degree | $81,823 | $40,313 |
| Graduate Degree | $103,444 | $57,118 |
| Total | $69,204 | $34,619 |
Family Income in Pleasant Grove
Family Income Brackets in Pleasant Grove
According to the Pleasant Grove family income data, there are 2,225 families falling into the $100,000 to $149,999 income range, which is the most common income bracket and makes up 24.5% of all families. Conversely, the $10,000 to $14,999 income bracket is the least frequent group with only 54 families (0.6%) belonging to this category.
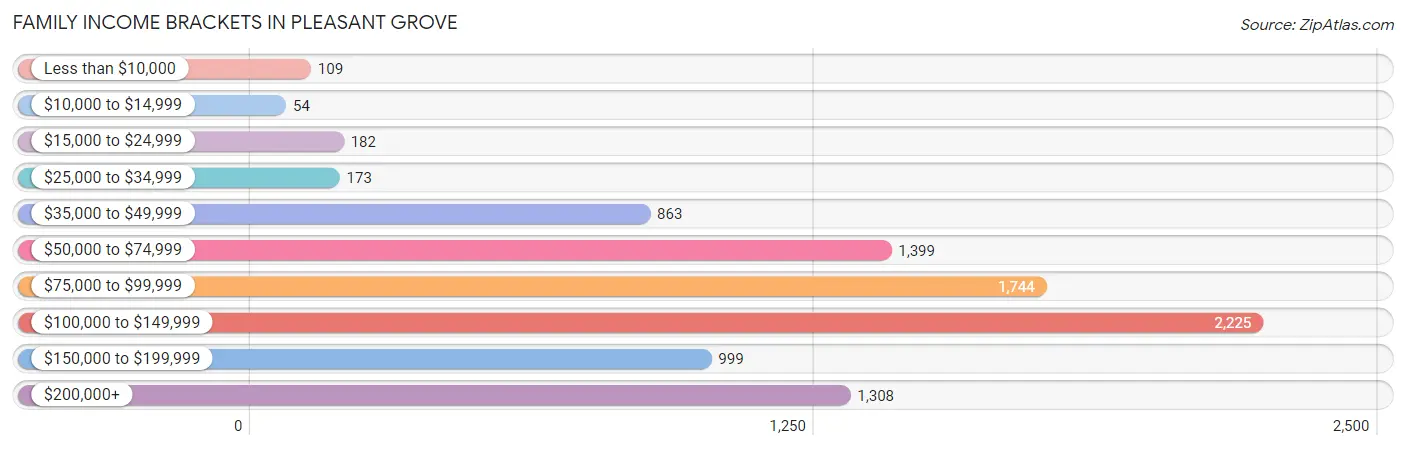
| Income Bracket | # Families | % Families |
| Less than $10,000 | 109 | 1.2% |
| $10,000 to $14,999 | 54 | 0.6% |
| $15,000 to $24,999 | 182 | 2.0% |
| $25,000 to $34,999 | 173 | 1.9% |
| $35,000 to $49,999 | 863 | 9.5% |
| $50,000 to $74,999 | 1,399 | 15.4% |
| $75,000 to $99,999 | 1,744 | 19.2% |
| $100,000 to $149,999 | 2,225 | 24.5% |
| $150,000 to $199,999 | 999 | 11.0% |
| $200,000+ | 1,308 | 14.4% |
Family Income by Famaliy Size in Pleasant Grove
6-person families (752 | 8.3%) account for the highest median family income in Pleasant Grove with $137,115 per family, while 2-person families (2,943 | 32.4%) have the highest median income of $40,914 per family member.
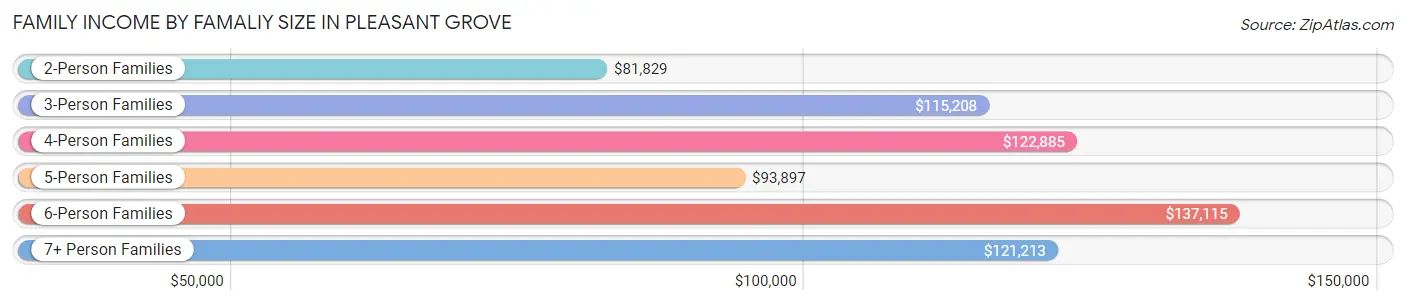
| Income Bracket | # Families | Median Income |
| 2-Person Families | 2,943 (32.4%) | $81,829 |
| 3-Person Families | 1,874 (20.6%) | $115,208 |
| 4-Person Families | 1,612 (17.7%) | $122,885 |
| 5-Person Families | 1,523 (16.8%) | $93,897 |
| 6-Person Families | 752 (8.3%) | $137,115 |
| 7+ Person Families | 379 (4.2%) | $121,213 |
| Total | 9,083 (100.0%) | $99,992 |
Family Income by Number of Earners in Pleasant Grove
The median family income in Pleasant Grove is $99,992, with families comprising 3+ earners (1,814) having the highest median family income of $132,125, while families with 1 earner (2,747) have the lowest median family income of $80,625, accounting for 20.0% and 30.2% of families, respectively.
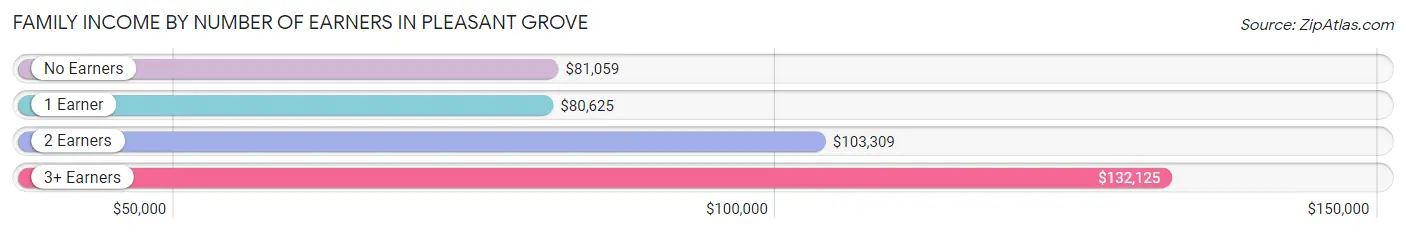
| Number of Earners | # Families | Median Income |
| No Earners | 681 (7.5%) | $81,059 |
| 1 Earner | 2,747 (30.2%) | $80,625 |
| 2 Earners | 3,841 (42.3%) | $103,309 |
| 3+ Earners | 1,814 (20.0%) | $132,125 |
| Total | 9,083 (100.0%) | $99,992 |
Household Income in Pleasant Grove
Household Income Brackets in Pleasant Grove
With 2,632 households falling in the category, the $100,000 to $149,999 income range is the most frequent in Pleasant Grove, accounting for 22.9% of all households. In contrast, only 184 households (1.6%) fall into the $10,000 to $14,999 income bracket, making it the least populous group.
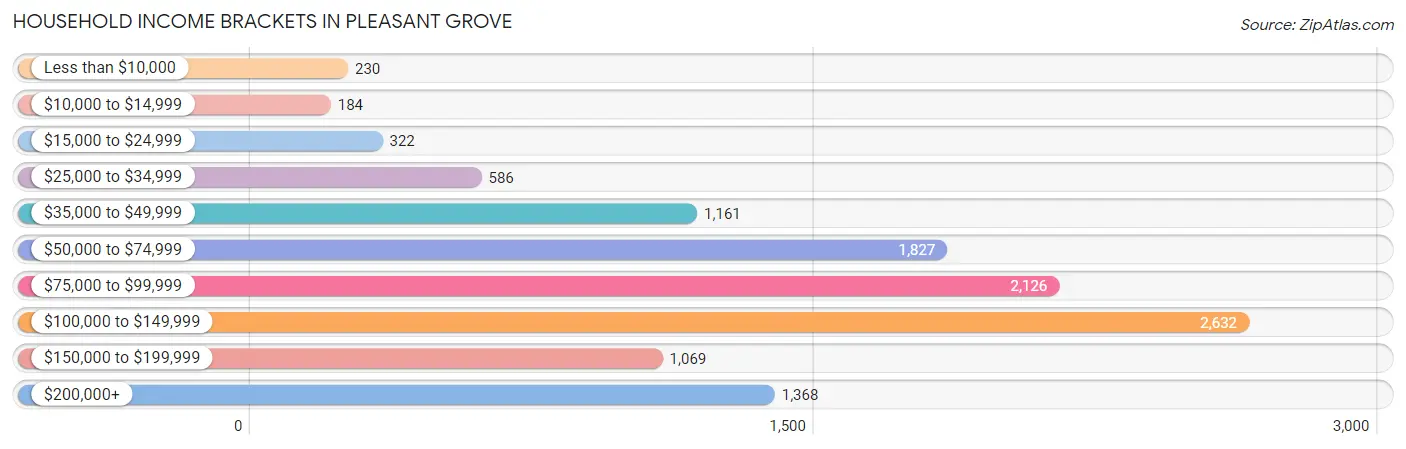
| Income Bracket | # Households | % Households |
| Less than $10,000 | 230 | 2.0% |
| $10,000 to $14,999 | 184 | 1.6% |
| $15,000 to $24,999 | 322 | 2.8% |
| $25,000 to $34,999 | 586 | 5.1% |
| $35,000 to $49,999 | 1,161 | 10.1% |
| $50,000 to $74,999 | 1,827 | 15.9% |
| $75,000 to $99,999 | 2,126 | 18.5% |
| $100,000 to $149,999 | 2,632 | 22.9% |
| $150,000 to $199,999 | 1,069 | 9.3% |
| $200,000+ | 1,368 | 11.9% |
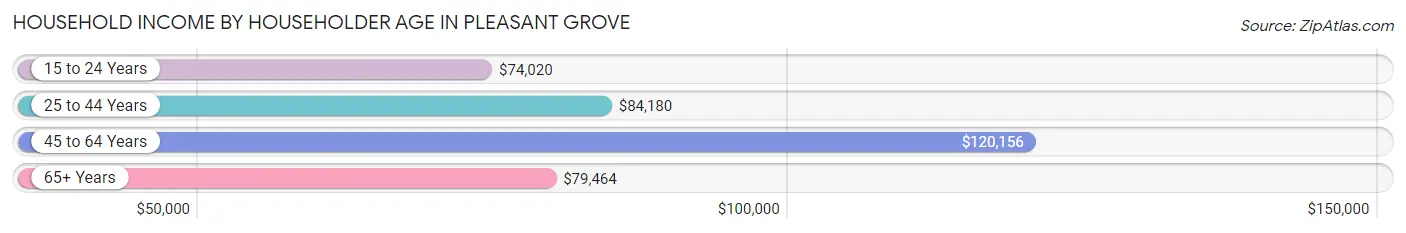
Household Income by Householder Age in Pleasant Grove
The median household income in Pleasant Grove is $91,322, with the highest median household income of $120,156 found in the 45 to 64 years age bracket for the primary householder. A total of 3,626 households (31.6%) fall into this category. Meanwhile, the 15 to 24 years age bracket for the primary householder has the lowest median household income of $74,020, with 825 households (7.2%) in this group.
| Income Bracket | # Households | Median Income |
| 15 to 24 Years | 825 (7.2%) | $74,020 |
| 25 to 44 Years | 4,932 (42.9%) | $84,180 |
| 45 to 64 Years | 3,626 (31.6%) | $120,156 |
| 65+ Years | 2,109 (18.3%) | $79,464 |
| Total | 11,492 (100.0%) | $91,322 |
Poverty in Pleasant Grove
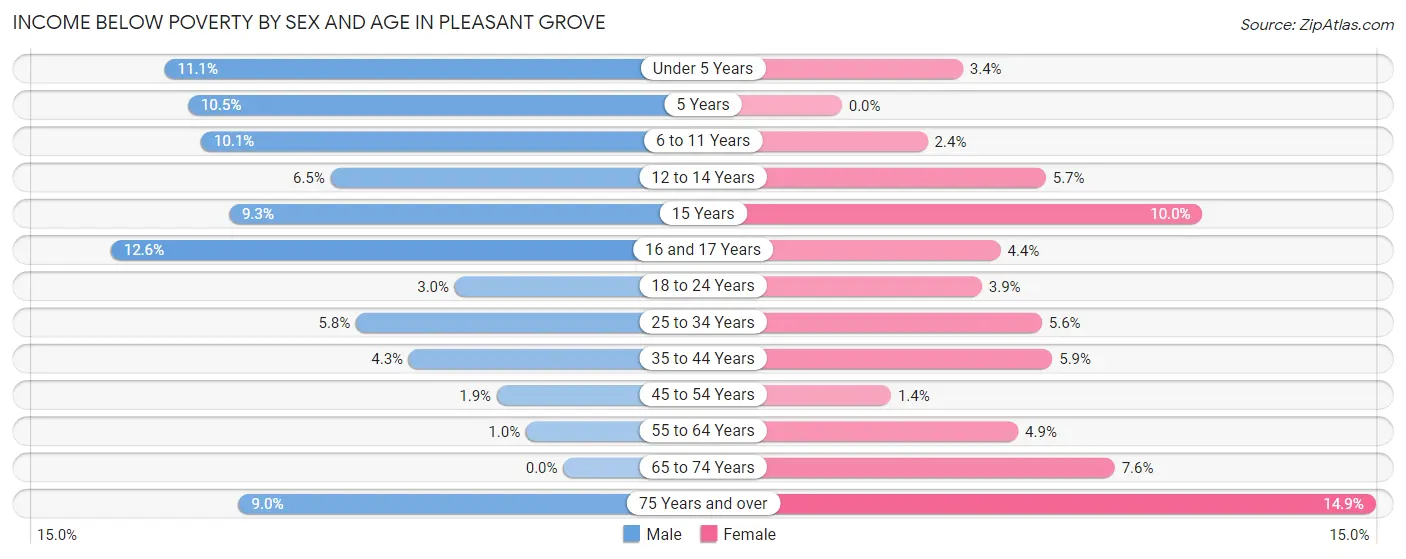
Income Below Poverty by Sex and Age in Pleasant Grove
With 5.6% poverty level for males and 4.9% for females among the residents of Pleasant Grove, 16 and 17 year old males and 75 year old and over females are the most vulnerable to poverty, with 76 males (12.6%) and 115 females (14.9%) in their respective age groups living below the poverty level.
| Age Bracket | Male | Female |
| Under 5 Years | 177 (11.1%) | 57 (3.4%) |
| 5 Years | 35 (10.4%) | 0 (0.0%) |
| 6 to 11 Years | 234 (10.1%) | 39 (2.4%) |
| 12 to 14 Years | 56 (6.5%) | 57 (5.7%) |
| 15 Years | 46 (9.3%) | 28 (10.0%) |
| 16 and 17 Years | 76 (12.6%) | 22 (4.4%) |
| 18 to 24 Years | 80 (3.0%) | 90 (3.9%) |
| 25 to 34 Years | 171 (5.8%) | 149 (5.6%) |
| 35 to 44 Years | 97 (4.3%) | 122 (5.9%) |
| 45 to 54 Years | 38 (1.8%) | 25 (1.4%) |
| 55 to 64 Years | 18 (1.0%) | 76 (4.9%) |
| 65 to 74 Years | 0 (0.0%) | 88 (7.6%) |
| 75 Years and over | 63 (9.0%) | 115 (14.9%) |
| Total | 1,091 (5.6%) | 868 (4.9%) |
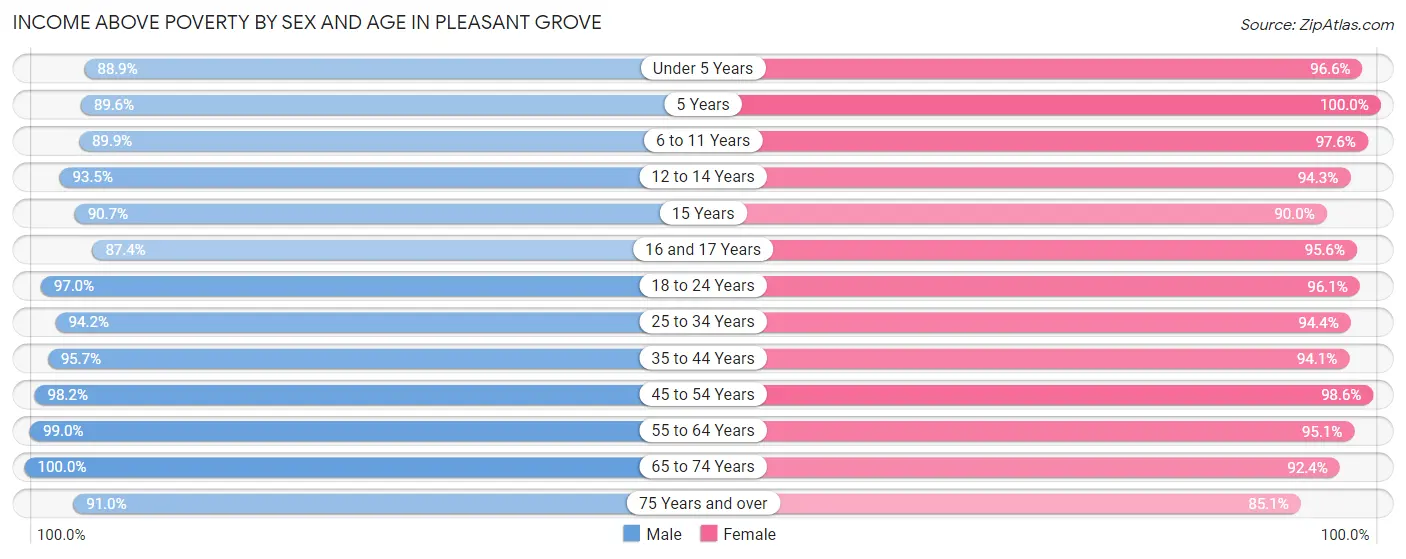
Income Above Poverty by Sex and Age in Pleasant Grove
According to the poverty statistics in Pleasant Grove, males aged 65 to 74 years and females aged 5 years are the age groups that are most secure financially, with 100.0% of males and 100.0% of females in these age groups living above the poverty line.
| Age Bracket | Male | Female |
| Under 5 Years | 1,418 (88.9%) | 1,633 (96.6%) |
| 5 Years | 300 (89.5%) | 334 (100.0%) |
| 6 to 11 Years | 2,085 (89.9%) | 1,596 (97.6%) |
| 12 to 14 Years | 808 (93.5%) | 946 (94.3%) |
| 15 Years | 448 (90.7%) | 251 (90.0%) |
| 16 and 17 Years | 527 (87.4%) | 476 (95.6%) |
| 18 to 24 Years | 2,568 (97.0%) | 2,219 (96.1%) |
| 25 to 34 Years | 2,792 (94.2%) | 2,527 (94.4%) |
| 35 to 44 Years | 2,161 (95.7%) | 1,959 (94.1%) |
| 45 to 54 Years | 2,013 (98.2%) | 1,806 (98.6%) |
| 55 to 64 Years | 1,713 (99.0%) | 1,473 (95.1%) |
| 65 to 74 Years | 912 (100.0%) | 1,070 (92.4%) |
| 75 Years and over | 634 (91.0%) | 659 (85.1%) |
| Total | 18,379 (94.4%) | 16,949 (95.1%) |
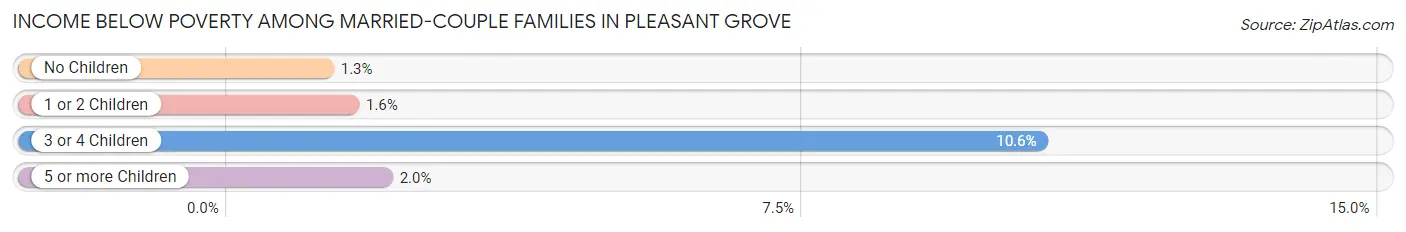
Income Below Poverty Among Married-Couple Families in Pleasant Grove
The poverty statistics for married-couple families in Pleasant Grove show that 3.1% or 241 of the total 7,741 families live below the poverty line. Families with 3 or 4 children have the highest poverty rate of 10.6%, comprising of 152 families. On the other hand, families with no children have the lowest poverty rate of 1.3%, which includes 44 families.
| Children | Above Poverty | Below Poverty |
| No Children | 3,489 (98.8%) | 44 (1.3%) |
| 1 or 2 Children | 2,485 (98.4%) | 40 (1.6%) |
| 3 or 4 Children | 1,284 (89.4%) | 152 (10.6%) |
| 5 or more Children | 242 (98.0%) | 5 (2.0%) |
| Total | 7,500 (96.9%) | 241 (3.1%) |
Income Below Poverty Among Single-Parent Households in Pleasant Grove
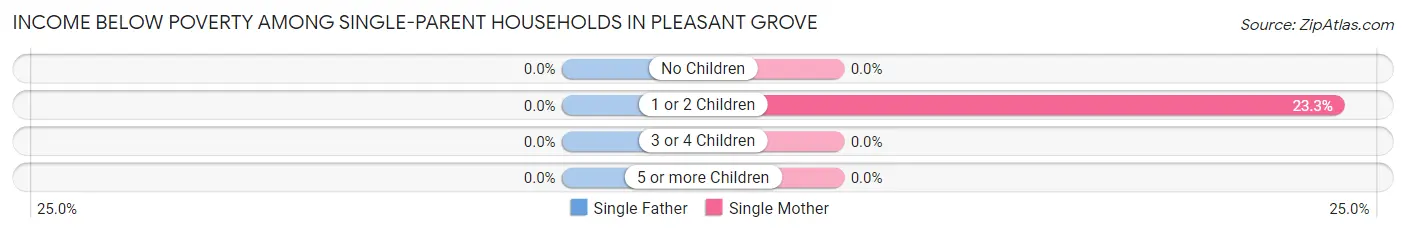
| Children | Single Father | Single Mother |
| No Children | 0 (0.0%) | 0 (0.0%) |
| 1 or 2 Children | 0 (0.0%) | 84 (23.3%) |
| 3 or 4 Children | 0 (0.0%) | 0 (0.0%) |
| 5 or more Children | 0 (0.0%) | 0 (0.0%) |
| Total | 0 (0.0%) | 84 (9.4%) |
Income Below Poverty Among Married-Couple vs Single-Parent Households in Pleasant Grove
The poverty data for Pleasant Grove shows that 241 of the married-couple family households (3.1%) and 84 of the single-parent households (6.3%) are living below the poverty level. Within the married-couple family households, those with 3 or 4 children have the highest poverty rate, with 152 households (10.6%) falling below the poverty line. Among the single-parent households, those with 1 or 2 children have the highest poverty rate, with 84 household (16.7%) living below poverty.
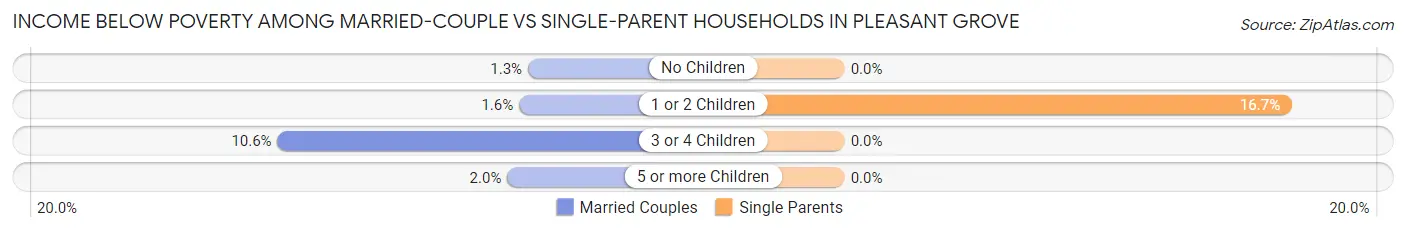
| Children | Married-Couple Families | Single-Parent Households |
| No Children | 44 (1.3%) | 0 (0.0%) |
| 1 or 2 Children | 40 (1.6%) | 84 (16.7%) |
| 3 or 4 Children | 152 (10.6%) | 0 (0.0%) |
| 5 or more Children | 5 (2.0%) | 0 (0.0%) |
| Total | 241 (3.1%) | 84 (6.3%) |
Race in Pleasant Grove
The most populous races in Pleasant Grove are White / Caucasian (32,392 | 86.5%), Hispanic or Latino (3,816 | 10.2%), and Two or more Races (2,548 | 6.8%).
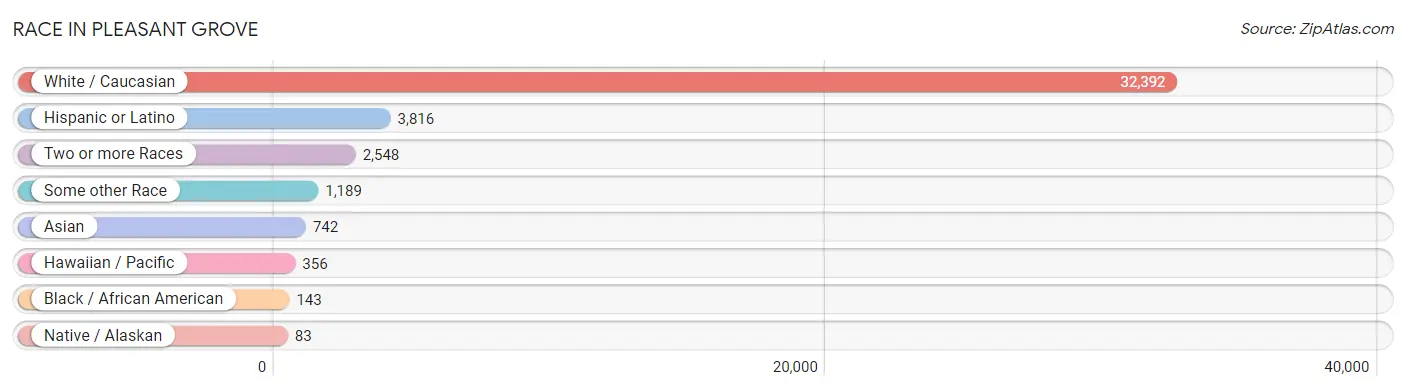
| Race | # Population | % Population |
| Asian | 742 | 2.0% |
| Black / African American | 143 | 0.4% |
| Hawaiian / Pacific | 356 | 0.9% |
| Hispanic or Latino | 3,816 | 10.2% |
| Native / Alaskan | 83 | 0.2% |
| White / Caucasian | 32,392 | 86.5% |
| Two or more Races | 2,548 | 6.8% |
| Some other Race | 1,189 | 3.2% |
| Total | 37,453 | 100.0% |
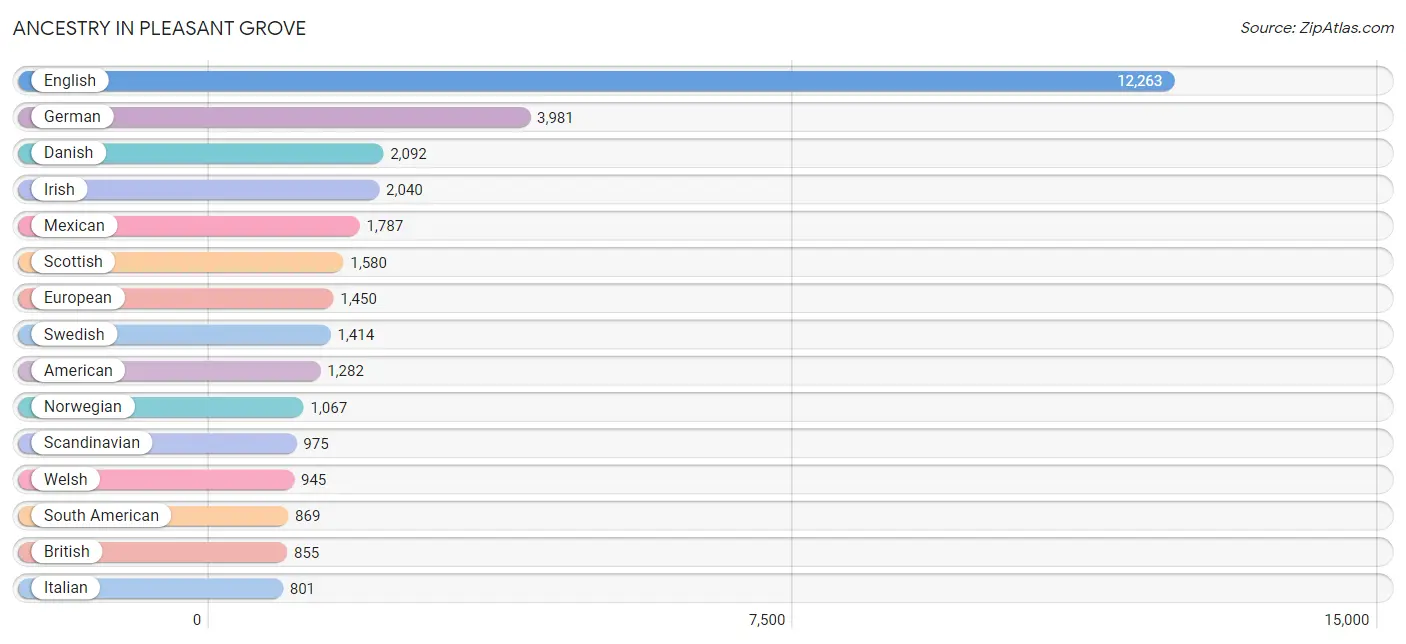
Ancestry in Pleasant Grove
The most populous ancestries reported in Pleasant Grove are English (12,263 | 32.7%), German (3,981 | 10.6%), Danish (2,092 | 5.6%), Irish (2,040 | 5.4%), and Mexican (1,787 | 4.8%), together accounting for 59.2% of all Pleasant Grove residents.
| Ancestry | # Population | % Population |
| African | 5 | 0.0% |
| Alaska Native | 6 | 0.0% |
| American | 1,282 | 3.4% |
| Arab | 10 | 0.0% |
| Argentinean | 219 | 0.6% |
| Armenian | 23 | 0.1% |
| Australian | 41 | 0.1% |
| Austrian | 9 | 0.0% |
| Bangladeshi | 239 | 0.6% |
| Basque | 6 | 0.0% |
| Bhutanese | 187 | 0.5% |
| Bolivian | 7 | 0.0% |
| Brazilian | 90 | 0.2% |
| British | 855 | 2.3% |
| Burmese | 160 | 0.4% |
| Canadian | 63 | 0.2% |
| Central American | 548 | 1.5% |
| Central American Indian | 105 | 0.3% |
| Cherokee | 9 | 0.0% |
| Chilean | 182 | 0.5% |
| Colombian | 87 | 0.2% |
| Costa Rican | 38 | 0.1% |
| Czech | 91 | 0.2% |
| Czechoslovakian | 14 | 0.0% |
| Danish | 2,092 | 5.6% |
| Dominican | 106 | 0.3% |
| Dutch | 413 | 1.1% |
| Ecuadorian | 189 | 0.5% |
| English | 12,263 | 32.7% |
| Estonian | 14 | 0.0% |
| European | 1,450 | 3.9% |
| Fijian | 23 | 0.1% |
| Finnish | 76 | 0.2% |
| French | 755 | 2.0% |
| French Canadian | 22 | 0.1% |
| German | 3,981 | 10.6% |
| Greek | 30 | 0.1% |
| Guatemalan | 179 | 0.5% |
| Haitian | 23 | 0.1% |
| Honduran | 51 | 0.1% |
| Hopi | 19 | 0.1% |
| Hungarian | 87 | 0.2% |
| Icelander | 167 | 0.4% |
| Indian (Asian) | 247 | 0.7% |
| Inupiat | 34 | 0.1% |
| Iranian | 17 | 0.1% |
| Irish | 2,040 | 5.4% |
| Italian | 801 | 2.1% |
| Korean | 409 | 1.1% |
| Laotian | 16 | 0.0% |
| Lithuanian | 49 | 0.1% |
| Malaysian | 9 | 0.0% |
| Mexican | 1,787 | 4.8% |
| Mexican American Indian | 86 | 0.2% |
| Moroccan | 8 | 0.0% |
| Native Hawaiian | 276 | 0.7% |
| Navajo | 31 | 0.1% |
| Nicaraguan | 50 | 0.1% |
| Nigerian | 13 | 0.0% |
| Northern European | 139 | 0.4% |
| Norwegian | 1,067 | 2.9% |
| Panamanian | 22 | 0.1% |
| Peruvian | 99 | 0.3% |
| Polish | 150 | 0.4% |
| Portuguese | 51 | 0.1% |
| Puerto Rican | 99 | 0.3% |
| Romanian | 9 | 0.0% |
| Russian | 209 | 0.6% |
| Salvadoran | 208 | 0.6% |
| Samoan | 172 | 0.5% |
| Scandinavian | 975 | 2.6% |
| Scotch-Irish | 355 | 0.9% |
| Scottish | 1,580 | 4.2% |
| Sioux | 52 | 0.1% |
| Slavic | 9 | 0.0% |
| Slovene | 11 | 0.0% |
| South American | 869 | 2.3% |
| South American Indian | 25 | 0.1% |
| Spaniard | 25 | 0.1% |
| Spanish | 49 | 0.1% |
| Sri Lankan | 6 | 0.0% |
| Subsaharan African | 18 | 0.1% |
| Swedish | 1,414 | 3.8% |
| Swiss | 359 | 1.0% |
| Thai | 85 | 0.2% |
| Tongan | 204 | 0.5% |
| Ukrainian | 20 | 0.1% |
| Ute | 12 | 0.0% |
| Venezuelan | 86 | 0.2% |
| Welsh | 945 | 2.5% |
| Yaqui | 19 | 0.1% |
| Yugoslavian | 34 | 0.1% | View All 92 Rows |
Immigrants in Pleasant Grove
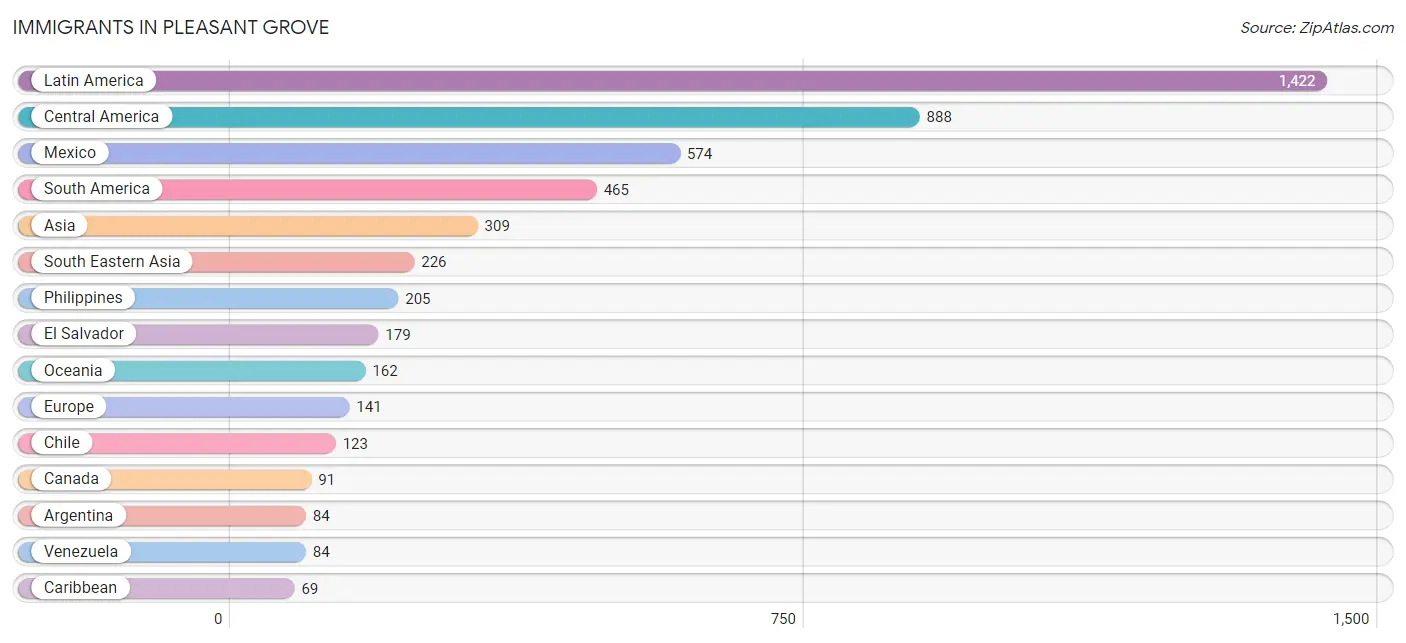
The most numerous immigrant groups reported in Pleasant Grove came from Latin America (1,422 | 3.8%), Central America (888 | 2.4%), Mexico (574 | 1.5%), South America (465 | 1.2%), and Asia (309 | 0.8%), together accounting for 9.8% of all Pleasant Grove residents.
| Immigration Origin | # Population | % Population |
| Africa | 15 | 0.0% |
| Argentina | 84 | 0.2% |
| Asia | 309 | 0.8% |
| Austria | 6 | 0.0% |
| Bolivia | 7 | 0.0% |
| Brazil | 35 | 0.1% |
| Canada | 91 | 0.2% |
| Caribbean | 69 | 0.2% |
| Central America | 888 | 2.4% |
| Chile | 123 | 0.3% |
| China | 38 | 0.1% |
| Colombia | 56 | 0.2% |
| Costa Rica | 38 | 0.1% |
| Czechoslovakia | 6 | 0.0% |
| Dominican Republic | 46 | 0.1% |
| Eastern Africa | 2 | 0.0% |
| Eastern Asia | 64 | 0.2% |
| Eastern Europe | 69 | 0.2% |
| Ecuador | 29 | 0.1% |
| El Salvador | 179 | 0.5% |
| England | 23 | 0.1% |
| Europe | 141 | 0.4% |
| Germany | 11 | 0.0% |
| Guatemala | 61 | 0.2% |
| Haiti | 23 | 0.1% |
| Honduras | 16 | 0.0% |
| Hungary | 9 | 0.0% |
| India | 13 | 0.0% |
| Iran | 6 | 0.0% |
| Italy | 6 | 0.0% |
| Korea | 26 | 0.1% |
| Latin America | 1,422 | 3.8% |
| Mexico | 574 | 1.5% |
| Morocco | 8 | 0.0% |
| Nicaragua | 8 | 0.0% |
| Northern Africa | 13 | 0.0% |
| Northern Europe | 49 | 0.1% |
| Oceania | 162 | 0.4% |
| Panama | 12 | 0.0% |
| Peru | 47 | 0.1% |
| Philippines | 205 | 0.5% |
| Romania | 11 | 0.0% |
| Russia | 43 | 0.1% |
| South America | 465 | 1.2% |
| South Central Asia | 19 | 0.1% |
| South Eastern Asia | 226 | 0.6% |
| Southern Europe | 6 | 0.0% |
| Sweden | 19 | 0.1% |
| Uganda | 2 | 0.0% |
| Venezuela | 84 | 0.2% |
| Vietnam | 21 | 0.1% |
| Western Europe | 17 | 0.1% | View All 52 Rows |
Sex and Age in Pleasant Grove
Sex and Age in Pleasant Grove
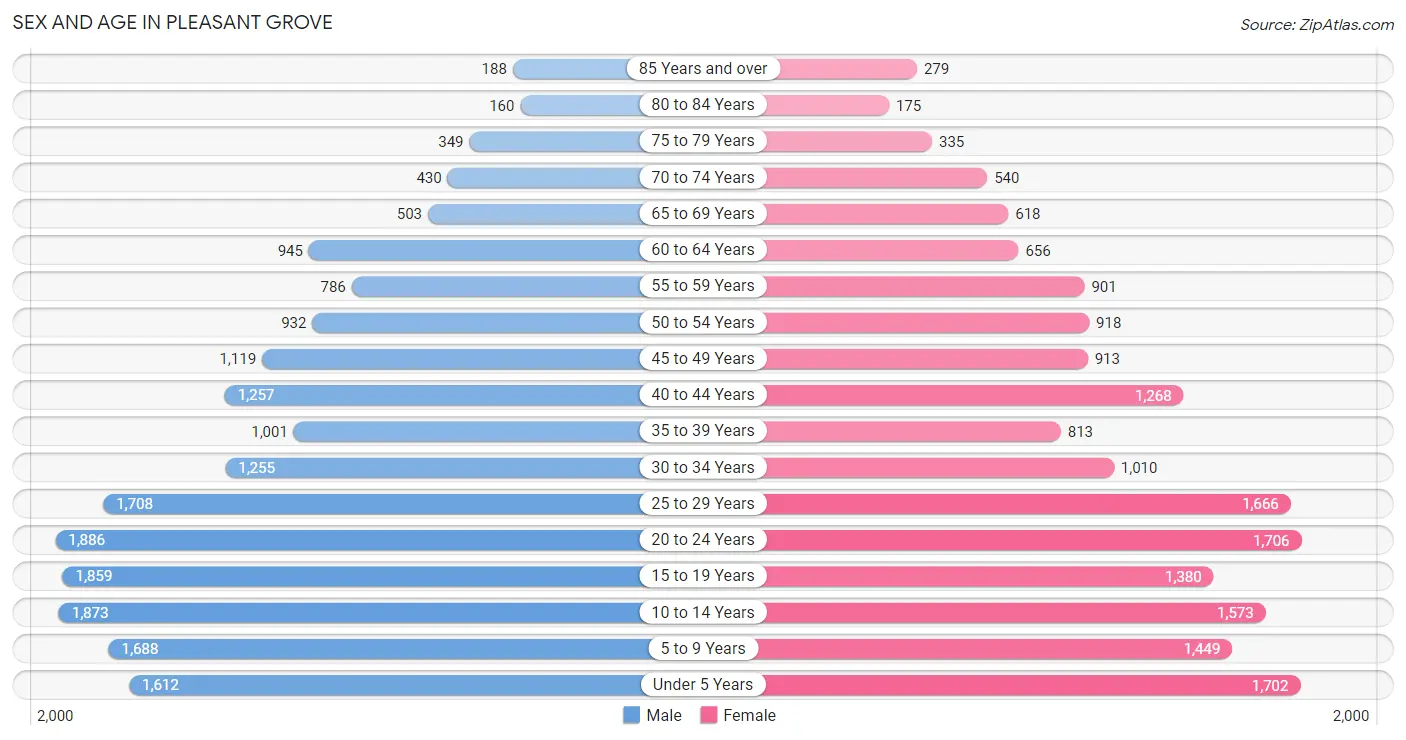
The most populous age groups in Pleasant Grove are 20 to 24 Years (1,886 | 9.7%) for men and 20 to 24 Years (1,706 | 9.5%) for women.
| Age Bracket | Male | Female |
| Under 5 Years | 1,612 (8.3%) | 1,702 (9.5%) |
| 5 to 9 Years | 1,688 (8.6%) | 1,449 (8.1%) |
| 10 to 14 Years | 1,873 (9.6%) | 1,573 (8.8%) |
| 15 to 19 Years | 1,859 (9.5%) | 1,380 (7.7%) |
| 20 to 24 Years | 1,886 (9.7%) | 1,706 (9.5%) |
| 25 to 29 Years | 1,708 (8.7%) | 1,666 (9.3%) |
| 30 to 34 Years | 1,255 (6.4%) | 1,010 (5.6%) |
| 35 to 39 Years | 1,001 (5.1%) | 813 (4.5%) |
| 40 to 44 Years | 1,257 (6.4%) | 1,268 (7.1%) |
| 45 to 49 Years | 1,119 (5.7%) | 913 (5.1%) |
| 50 to 54 Years | 932 (4.8%) | 918 (5.1%) |
| 55 to 59 Years | 786 (4.0%) | 901 (5.0%) |
| 60 to 64 Years | 945 (4.8%) | 656 (3.7%) |
| 65 to 69 Years | 503 (2.6%) | 618 (3.5%) |
| 70 to 74 Years | 430 (2.2%) | 540 (3.0%) |
| 75 to 79 Years | 349 (1.8%) | 335 (1.9%) |
| 80 to 84 Years | 160 (0.8%) | 175 (1.0%) |
| 85 Years and over | 188 (1.0%) | 279 (1.6%) |
| Total | 19,551 (100.0%) | 17,902 (100.0%) |
Families and Households in Pleasant Grove
Median Family Size in Pleasant Grove
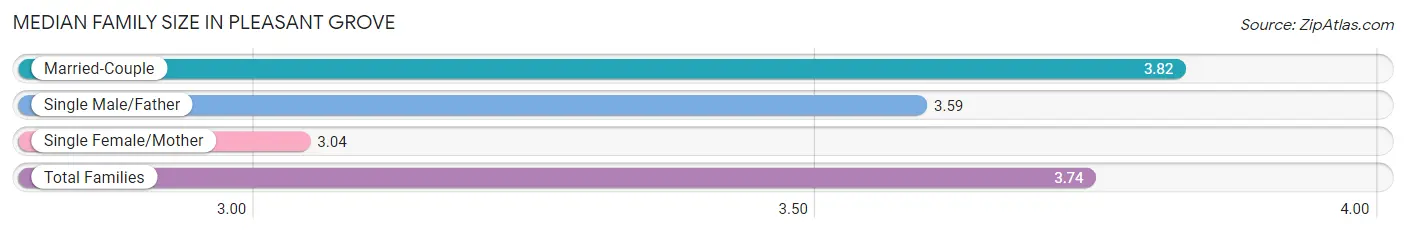
The median family size in Pleasant Grove is 3.74 persons per family, with married-couple families (7,741 | 85.2%) accounting for the largest median family size of 3.82 persons per family. On the other hand, single female/mother families (893 | 9.8%) represent the smallest median family size with 3.04 persons per family.
| Family Type | # Families | Family Size |
| Married-Couple | 7,741 (85.2%) | 3.82 |
| Single Male/Father | 449 (4.9%) | 3.59 |
| Single Female/Mother | 893 (9.8%) | 3.04 |
| Total Families | 9,083 (100.0%) | 3.74 |
Median Household Size in Pleasant Grove
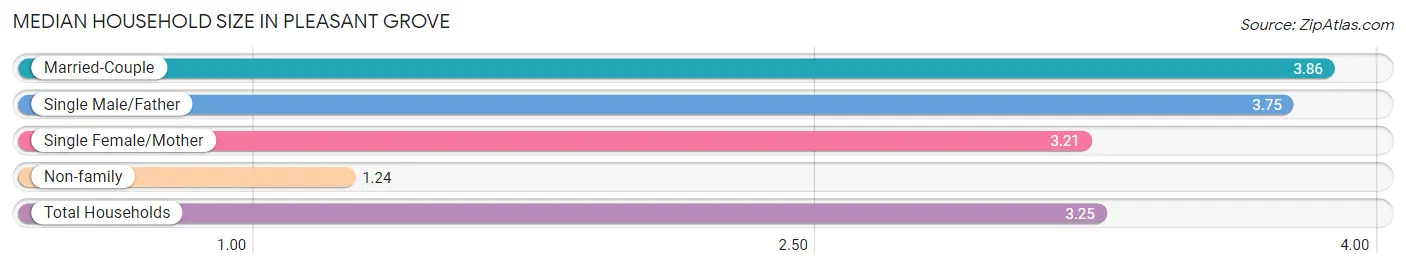
The median household size in Pleasant Grove is 3.25 persons per household, with married-couple households (7,741 | 67.4%) accounting for the largest median household size of 3.86 persons per household. non-family households (2,409 | 21.0%) represent the smallest median household size with 1.24 persons per household.
| Household Type | # Households | Household Size |
| Married-Couple | 7,741 (67.4%) | 3.86 |
| Single Male/Father | 449 (3.9%) | 3.75 |
| Single Female/Mother | 893 (7.8%) | 3.21 |
| Non-family | 2,409 (21.0%) | 1.24 |
| Total Households | 11,492 (100.0%) | 3.25 |
Household Size by Marriage Status in Pleasant Grove
Out of a total of 11,492 households in Pleasant Grove, 9,083 (79.0%) are family households, while 2,409 (21.0%) are nonfamily households. The most numerous type of family households are 2-person households, comprising 2,842, and the most common type of nonfamily households are 1-person households, comprising 1,990.
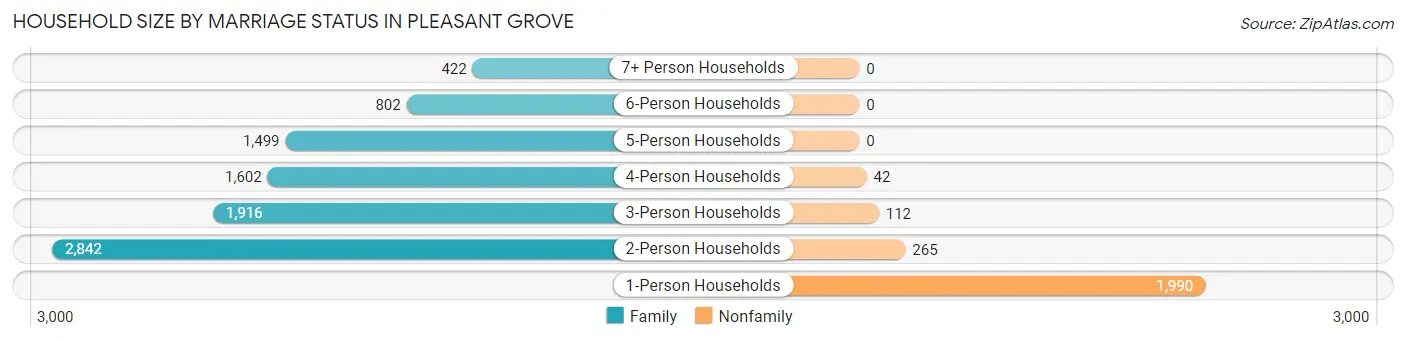
| Household Size | Family Households | Nonfamily Households |
| 1-Person Households | - | 1,990 (17.3%) |
| 2-Person Households | 2,842 (24.7%) | 265 (2.3%) |
| 3-Person Households | 1,916 (16.7%) | 112 (1.0%) |
| 4-Person Households | 1,602 (13.9%) | 42 (0.4%) |
| 5-Person Households | 1,499 (13.0%) | 0 (0.0%) |
| 6-Person Households | 802 (7.0%) | 0 (0.0%) |
| 7+ Person Households | 422 (3.7%) | 0 (0.0%) |
| Total | 9,083 (79.0%) | 2,409 (21.0%) |
Female Fertility in Pleasant Grove
Fertility by Age in Pleasant Grove
Average fertility rate in Pleasant Grove is 92.0 births per 1,000 women. Women in the age bracket of 20 to 34 years have the highest fertility rate with 168.0 births per 1,000 women. Women in the age bracket of 20 to 34 years acount for 88.4% of all women with births.
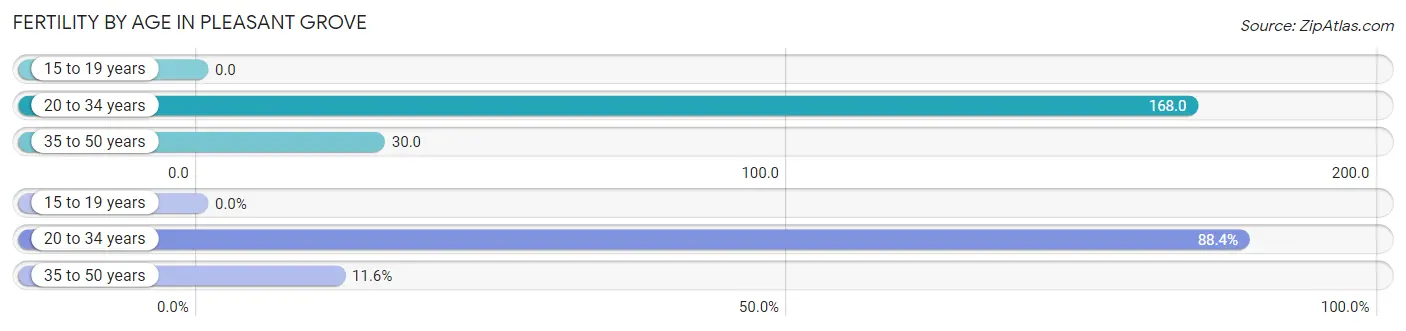
| Age Bracket | Women with Births | Births / 1,000 Women |
| 15 to 19 years | 0 (0.0%) | 0.0 |
| 20 to 34 years | 737 (88.4%) | 168.0 |
| 35 to 50 years | 97 (11.6%) | 30.0 |
| Total | 834 (100.0%) | 92.0 |
Fertility by Age by Marriage Status in Pleasant Grove
94.8% of women with births (834) in Pleasant Grove are married. The highest percentage of unmarried women with births falls into 20 to 34 years age bracket with 5.8% of them unmarried at the time of birth, while the lowest percentage of unmarried women with births belong to 35 to 50 years age bracket with 0.0% of them unmarried.
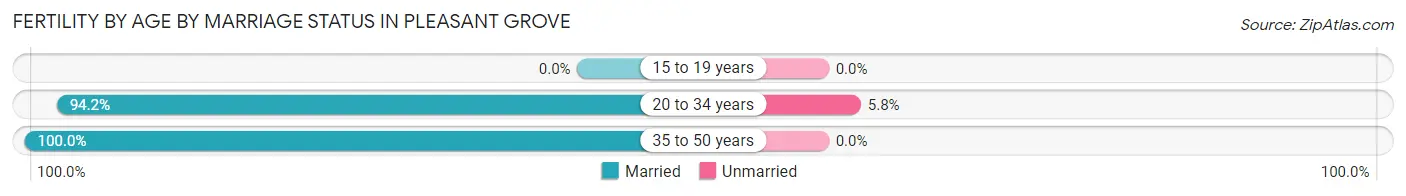
| Age Bracket | Married | Unmarried |
| 15 to 19 years | 0 (0.0%) | 0 (0.0%) |
| 20 to 34 years | 694 (94.2%) | 43 (5.8%) |
| 35 to 50 years | 97 (100.0%) | 0 (0.0%) |
| Total | 791 (94.8%) | 43 (5.2%) |
Fertility by Education in Pleasant Grove
Average fertility rate in Pleasant Grove is 92.0 births per 1,000 women. Women with the education attainment of bachelor's degree have the highest fertility rate of 175.0 births per 1,000 women, while women with the education attainment of less than high school have the lowest fertility at 25.0 births per 1,000 women. Women with the education attainment of bachelor's degree represent 50.8% of all women with births.
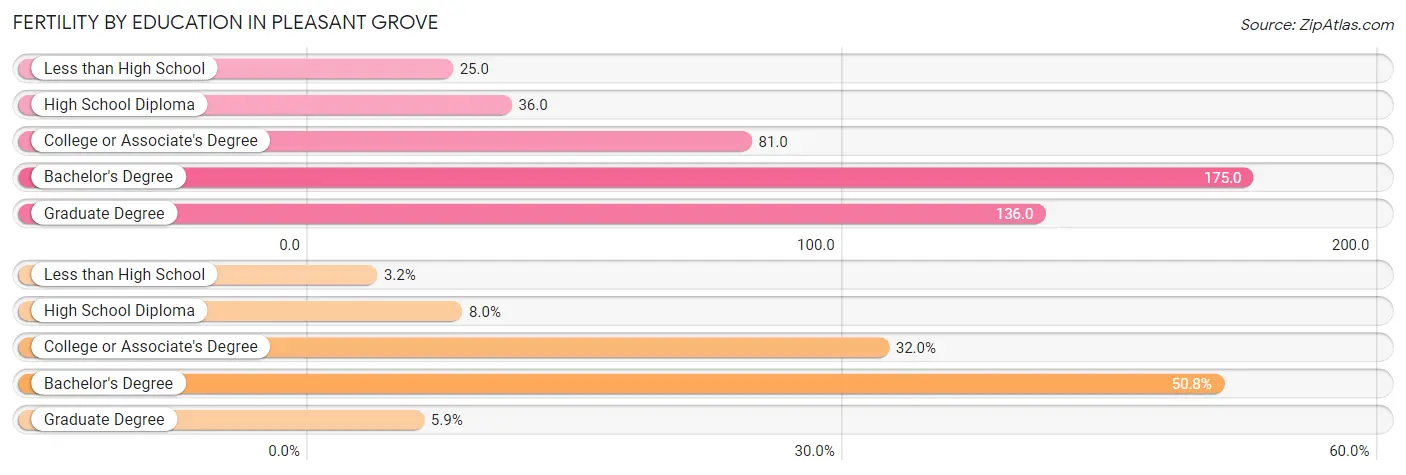
| Educational Attainment | Women with Births | Births / 1,000 Women |
| Less than High School | 27 (3.2%) | 25.0 |
| High School Diploma | 67 (8.0%) | 36.0 |
| College or Associate's Degree | 267 (32.0%) | 81.0 |
| Bachelor's Degree | 424 (50.8%) | 175.0 |
| Graduate Degree | 49 (5.9%) | 136.0 |
| Total | 834 (100.0%) | 92.0 |
Fertility by Education by Marriage Status in Pleasant Grove
5.2% of women with births in Pleasant Grove are unmarried. Women with the educational attainment of less than high school are most likely to be married with 100.0% of them married at childbirth, while women with the educational attainment of high school diploma are least likely to be married with 32.8% of them unmarried at childbirth.
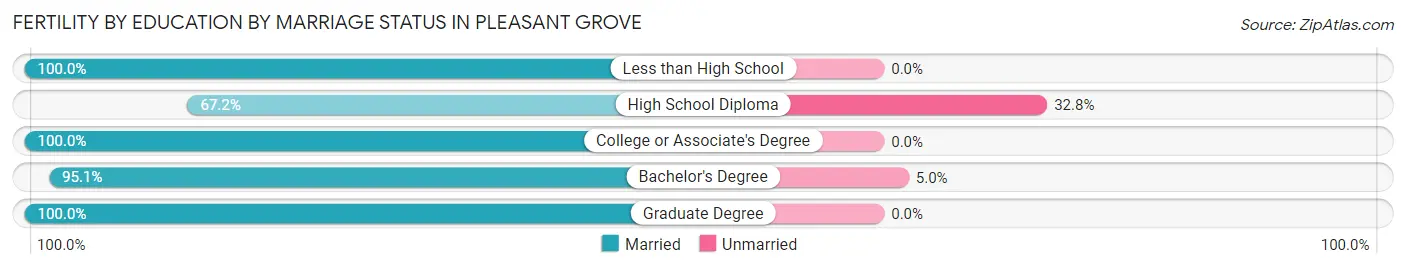
| Educational Attainment | Married | Unmarried |
| Less than High School | 27 (100.0%) | 0 (0.0%) |
| High School Diploma | 45 (67.2%) | 22 (32.8%) |
| College or Associate's Degree | 267 (100.0%) | 0 (0.0%) |
| Bachelor's Degree | 403 (95.1%) | 21 (5.0%) |
| Graduate Degree | 49 (100.0%) | 0 (0.0%) |
| Total | 791 (94.8%) | 43 (5.2%) |
Employment Characteristics in Pleasant Grove
Employment by Class of Employer in Pleasant Grove
Among the 18,039 employed individuals in Pleasant Grove, private company employees (12,712 | 70.5%), not-for-profit organizations (1,176 | 6.5%), and local government employees (1,115 | 6.2%) make up the most common classes of employment.
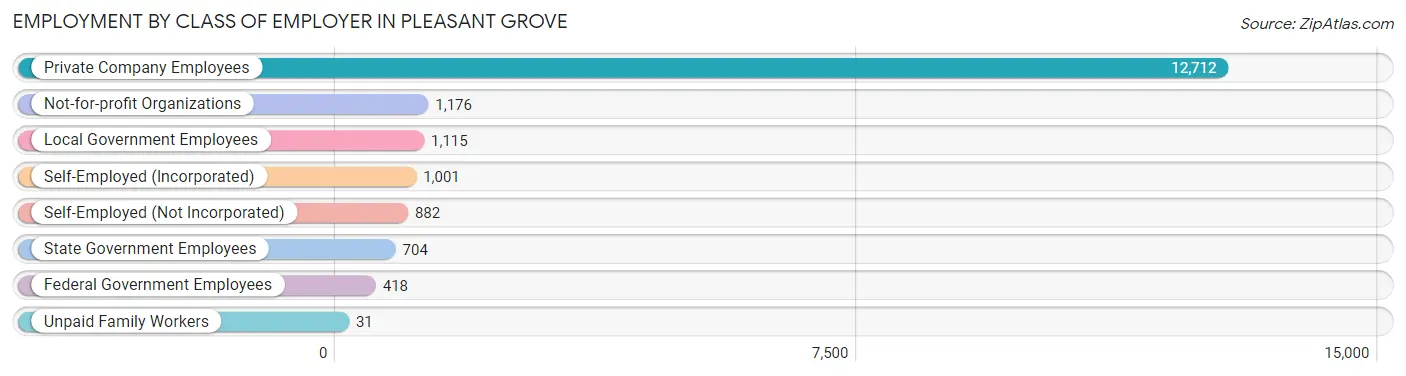
| Employer Class | # Employees | % Employees |
| Private Company Employees | 12,712 | 70.5% |
| Self-Employed (Incorporated) | 1,001 | 5.6% |
| Self-Employed (Not Incorporated) | 882 | 4.9% |
| Not-for-profit Organizations | 1,176 | 6.5% |
| Local Government Employees | 1,115 | 6.2% |
| State Government Employees | 704 | 3.9% |
| Federal Government Employees | 418 | 2.3% |
| Unpaid Family Workers | 31 | 0.2% |
| Total | 18,039 | 100.0% |
Employment Status by Age in Pleasant Grove
According to the labor force statistics for Pleasant Grove, out of the total population over 16 years of age (26,783), 69.7% or 18,668 individuals are in the labor force, with 2.6% or 485 of them unemployed. The age group with the highest labor force participation rate is 20 to 24 years, with 84.5% or 3,035 individuals in the labor force. Within the labor force, the 55 to 59 years age range has the highest percentage of unemployed individuals, with 6.8% or 97 of them being unemployed.
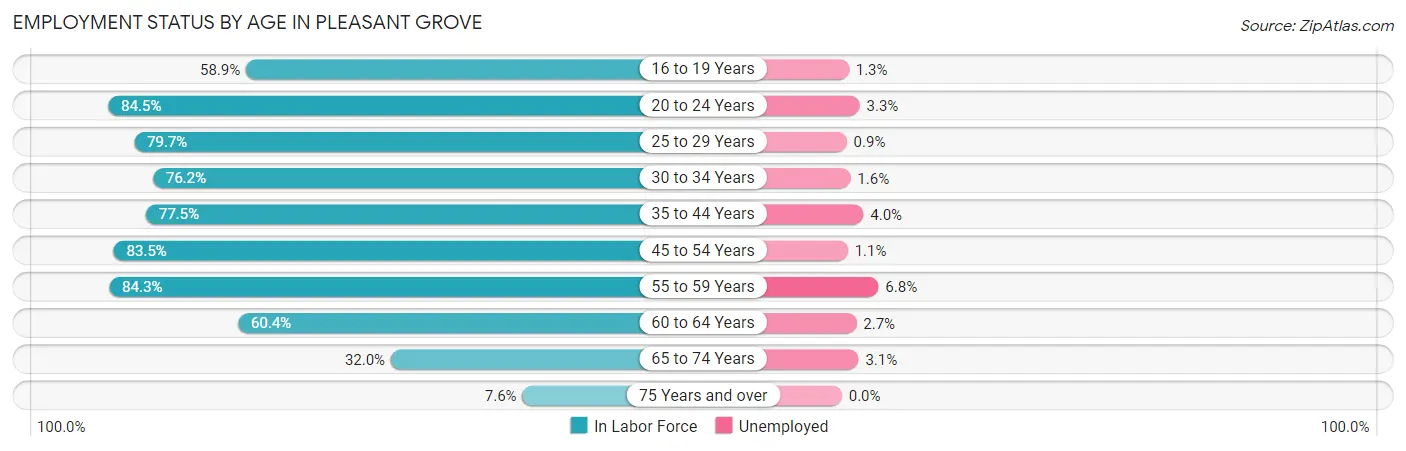
| Age Bracket | In Labor Force | Unemployed |
| 16 to 19 Years | 1,452 (58.9%) | 19 (1.3%) |
| 20 to 24 Years | 3,035 (84.5%) | 100 (3.3%) |
| 25 to 29 Years | 2,689 (79.7%) | 24 (0.9%) |
| 30 to 34 Years | 1,726 (76.2%) | 28 (1.6%) |
| 35 to 44 Years | 3,363 (77.5%) | 135 (4.0%) |
| 45 to 54 Years | 3,241 (83.5%) | 36 (1.1%) |
| 55 to 59 Years | 1,422 (84.3%) | 97 (6.8%) |
| 60 to 64 Years | 967 (60.4%) | 26 (2.7%) |
| 65 to 74 Years | 669 (32.0%) | 21 (3.1%) |
| 75 Years and over | 113 (7.6%) | 0 (0.0%) |
| Total | 18,668 (69.7%) | 485 (2.6%) |
Employment Status by Educational Attainment in Pleasant Grove
According to labor force statistics for Pleasant Grove, 78.2% of individuals (13,410) out of the total population between 25 and 64 years of age (17,148) are in the labor force, with 2.6% or 349 of them being unemployed. The group with the highest labor force participation rate are those with the educational attainment of bachelor's degree or higher, with 80.4% or 5,524 individuals in the labor force. Within the labor force, individuals with high school diploma education have the highest percentage of unemployment, with 5.6% or 113 of them being unemployed.
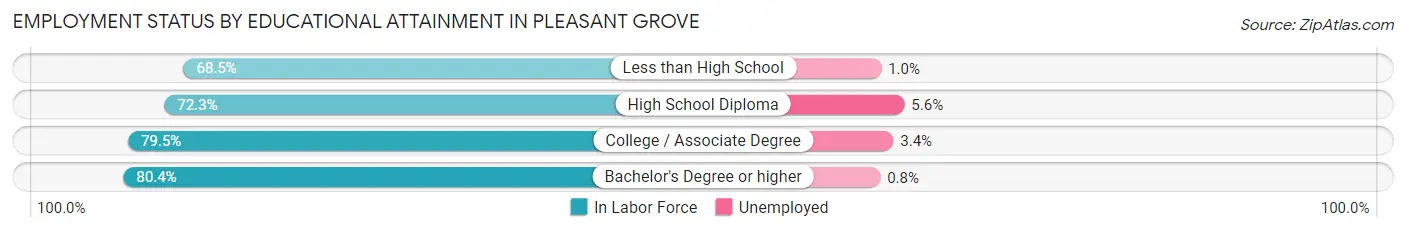
| Educational Attainment | In Labor Force | Unemployed |
| Less than High School | 511 (68.5%) | 7 (1.0%) |
| High School Diploma | 2,023 (72.3%) | 157 (5.6%) |
| College / Associate Degree | 5,353 (79.5%) | 229 (3.4%) |
| Bachelor's Degree or higher | 5,524 (80.4%) | 55 (0.8%) |
| Total | 13,410 (78.2%) | 446 (2.6%) |
Employment Occupations by Sex in Pleasant Grove
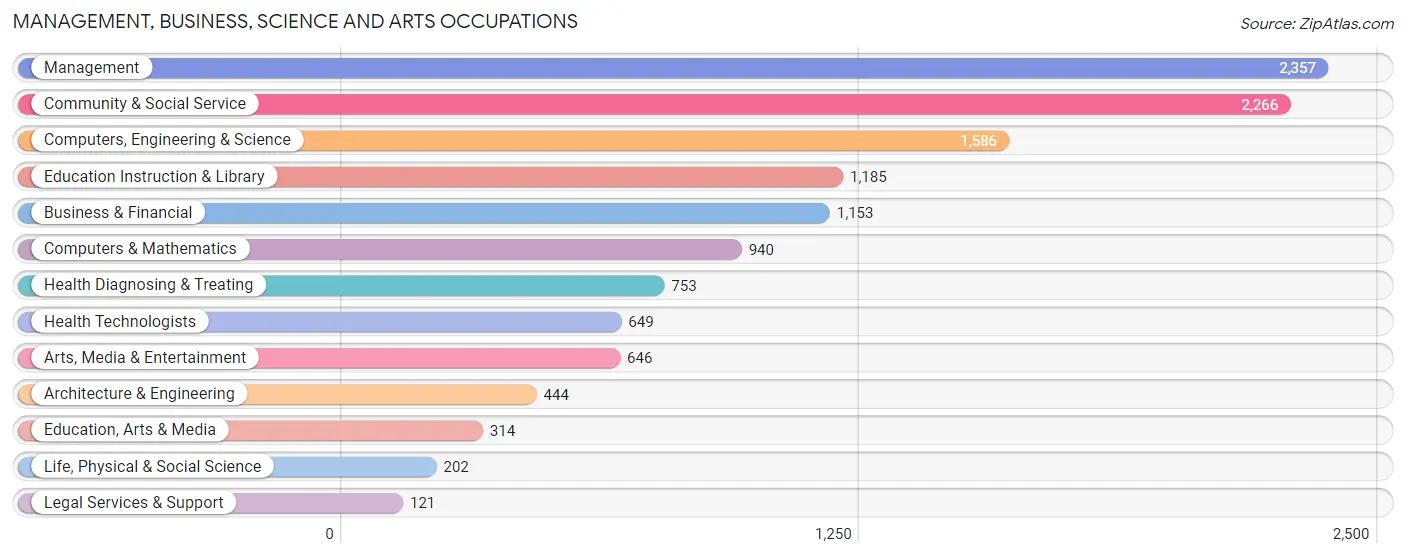
Management, Business, Science and Arts Occupations
The most common Management, Business, Science and Arts occupations in Pleasant Grove are Management (2,357 | 13.0%), Community & Social Service (2,266 | 12.5%), Computers, Engineering & Science (1,586 | 8.7%), Education Instruction & Library (1,185 | 6.5%), and Business & Financial (1,153 | 6.3%).
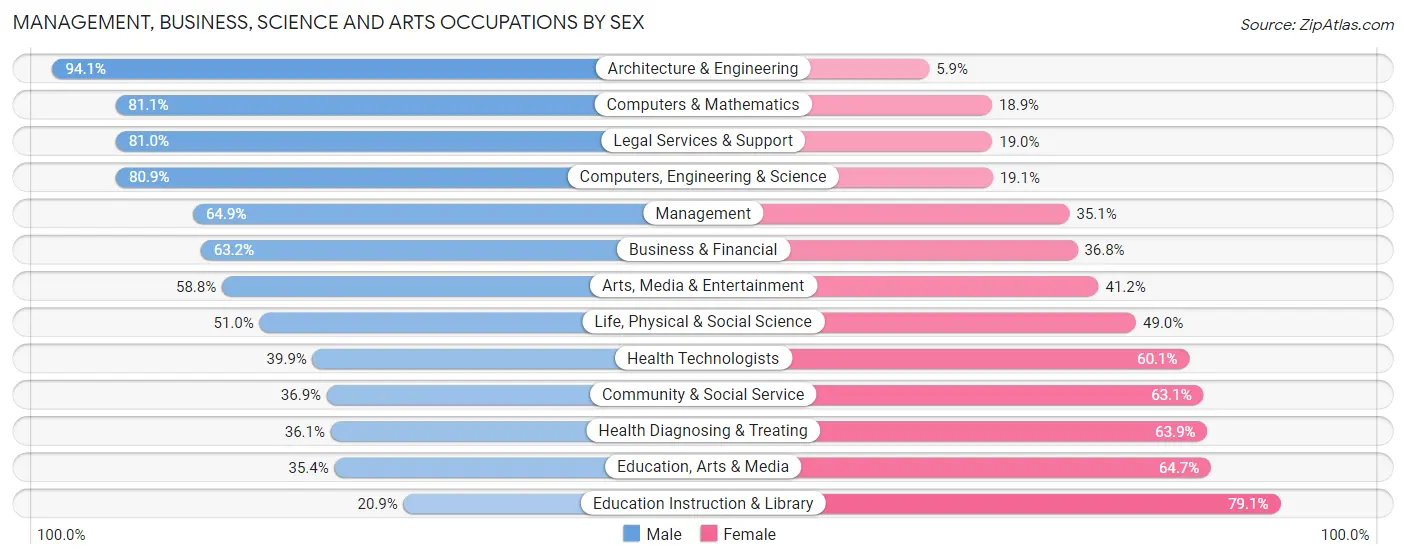
Management, Business, Science and Arts Occupations by Sex
Within the Management, Business, Science and Arts occupations in Pleasant Grove, the most male-oriented occupations are Architecture & Engineering (94.1%), Computers & Mathematics (81.1%), and Legal Services & Support (81.0%), while the most female-oriented occupations are Education Instruction & Library (79.1%), Education, Arts & Media (64.6%), and Health Diagnosing & Treating (63.9%).
| Occupation | Male | Female |
| Management | 1,529 (64.9%) | 828 (35.1%) |
| Business & Financial | 729 (63.2%) | 424 (36.8%) |
| Computers, Engineering & Science | 1,283 (80.9%) | 303 (19.1%) |
| Computers & Mathematics | 762 (81.1%) | 178 (18.9%) |
| Architecture & Engineering | 418 (94.1%) | 26 (5.9%) |
| Life, Physical & Social Science | 103 (51.0%) | 99 (49.0%) |
| Community & Social Service | 837 (36.9%) | 1,429 (63.1%) |
| Education, Arts & Media | 111 (35.3%) | 203 (64.6%) |
| Legal Services & Support | 98 (81.0%) | 23 (19.0%) |
| Education Instruction & Library | 248 (20.9%) | 937 (79.1%) |
| Arts, Media & Entertainment | 380 (58.8%) | 266 (41.2%) |
| Health Diagnosing & Treating | 272 (36.1%) | 481 (63.9%) |
| Health Technologists | 259 (39.9%) | 390 (60.1%) |
| Total (Category) | 4,650 (57.3%) | 3,465 (42.7%) |
| Total (Overall) | 10,675 (58.7%) | 7,497 (41.3%) |
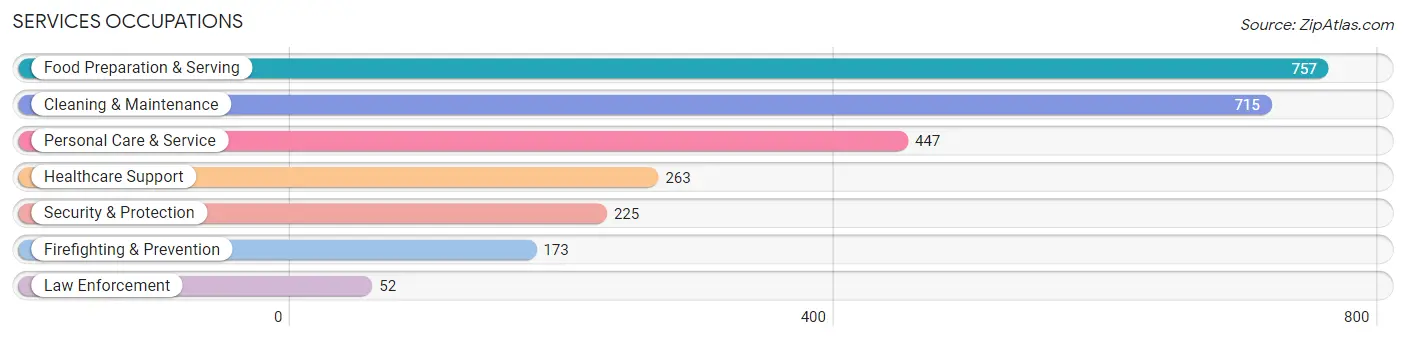
Services Occupations
The most common Services occupations in Pleasant Grove are Food Preparation & Serving (757 | 4.2%), Cleaning & Maintenance (715 | 3.9%), Personal Care & Service (447 | 2.5%), Healthcare Support (263 | 1.5%), and Security & Protection (225 | 1.2%).
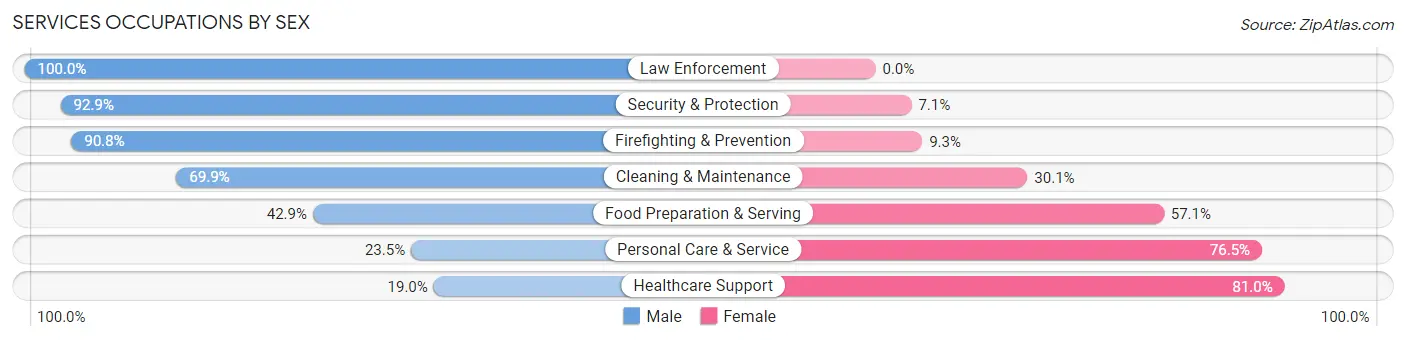
Services Occupations by Sex
Within the Services occupations in Pleasant Grove, the most male-oriented occupations are Law Enforcement (100.0%), Security & Protection (92.9%), and Firefighting & Prevention (90.7%), while the most female-oriented occupations are Healthcare Support (81.0%), Personal Care & Service (76.5%), and Food Preparation & Serving (57.1%).
| Occupation | Male | Female |
| Healthcare Support | 50 (19.0%) | 213 (81.0%) |
| Security & Protection | 209 (92.9%) | 16 (7.1%) |
| Firefighting & Prevention | 157 (90.7%) | 16 (9.2%) |
| Law Enforcement | 52 (100.0%) | 0 (0.0%) |
| Food Preparation & Serving | 325 (42.9%) | 432 (57.1%) |
| Cleaning & Maintenance | 500 (69.9%) | 215 (30.1%) |
| Personal Care & Service | 105 (23.5%) | 342 (76.5%) |
| Total (Category) | 1,189 (49.4%) | 1,218 (50.6%) |
| Total (Overall) | 10,675 (58.7%) | 7,497 (41.3%) |
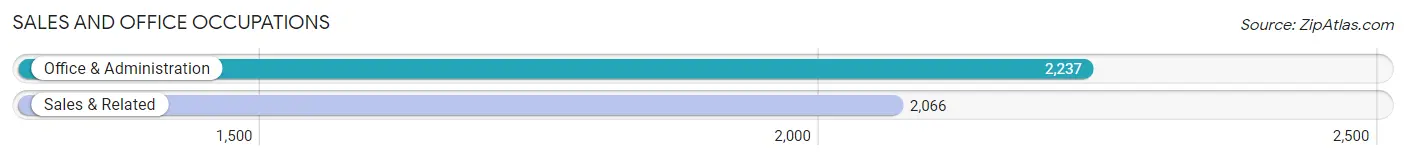
Sales and Office Occupations
The most common Sales and Office occupations in Pleasant Grove are Office & Administration (2,237 | 12.3%), and Sales & Related (2,066 | 11.4%).
Sales and Office Occupations by Sex
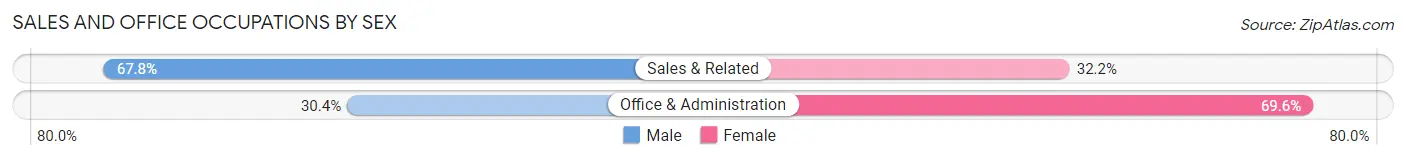
| Occupation | Male | Female |
| Sales & Related | 1,401 (67.8%) | 665 (32.2%) |
| Office & Administration | 680 (30.4%) | 1,557 (69.6%) |
| Total (Category) | 2,081 (48.4%) | 2,222 (51.6%) |
| Total (Overall) | 10,675 (58.7%) | 7,497 (41.3%) |
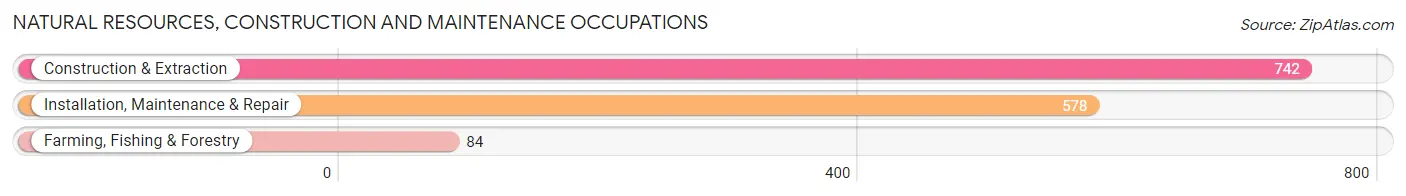
Natural Resources, Construction and Maintenance Occupations
The most common Natural Resources, Construction and Maintenance occupations in Pleasant Grove are Construction & Extraction (742 | 4.1%), Installation, Maintenance & Repair (578 | 3.2%), and Farming, Fishing & Forestry (84 | 0.5%).
Natural Resources, Construction and Maintenance Occupations by Sex
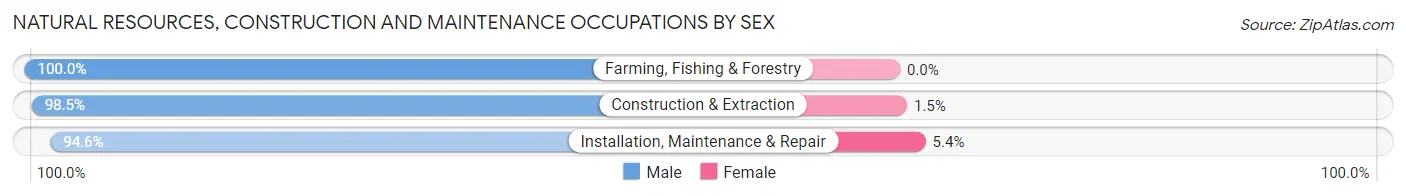
| Occupation | Male | Female |
| Farming, Fishing & Forestry | 84 (100.0%) | 0 (0.0%) |
| Construction & Extraction | 731 (98.5%) | 11 (1.5%) |
| Installation, Maintenance & Repair | 547 (94.6%) | 31 (5.4%) |
| Total (Category) | 1,362 (97.0%) | 42 (3.0%) |
| Total (Overall) | 10,675 (58.7%) | 7,497 (41.3%) |
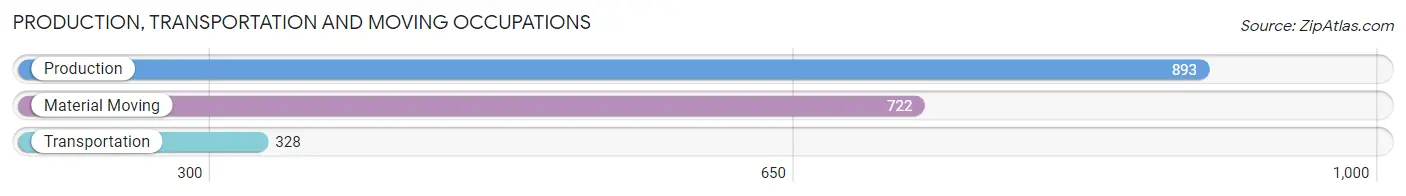
Production, Transportation and Moving Occupations
The most common Production, Transportation and Moving occupations in Pleasant Grove are Production (893 | 4.9%), Material Moving (722 | 4.0%), and Transportation (328 | 1.8%).
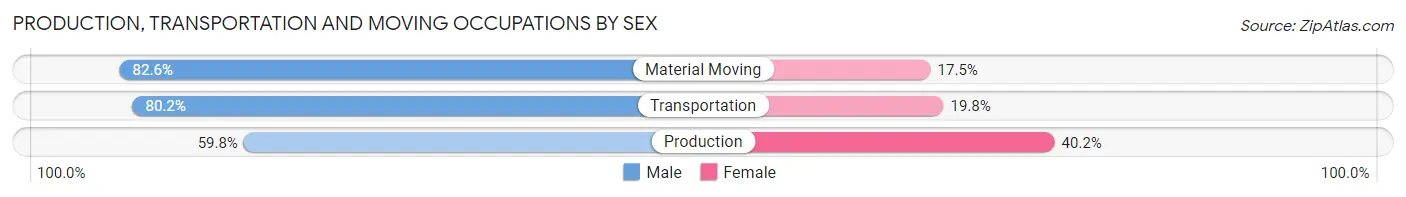
Production, Transportation and Moving Occupations by Sex
| Occupation | Male | Female |
| Production | 534 (59.8%) | 359 (40.2%) |
| Transportation | 263 (80.2%) | 65 (19.8%) |
| Material Moving | 596 (82.6%) | 126 (17.4%) |
| Total (Category) | 1,393 (71.7%) | 550 (28.3%) |
| Total (Overall) | 10,675 (58.7%) | 7,497 (41.3%) |
Employment Industries by Sex in Pleasant Grove
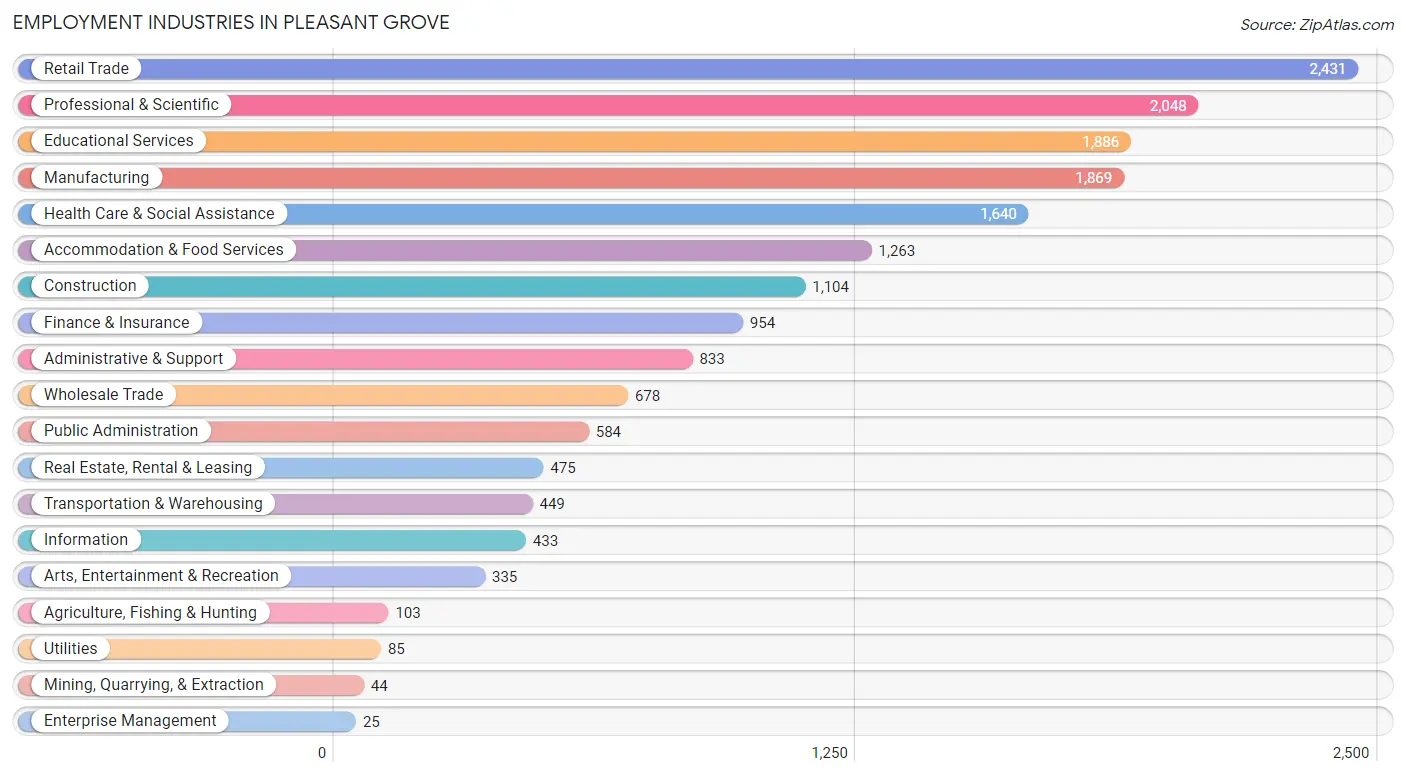
Employment Industries in Pleasant Grove
The major employment industries in Pleasant Grove include Retail Trade (2,431 | 13.4%), Professional & Scientific (2,048 | 11.3%), Educational Services (1,886 | 10.4%), Manufacturing (1,869 | 10.3%), and Health Care & Social Assistance (1,640 | 9.0%).
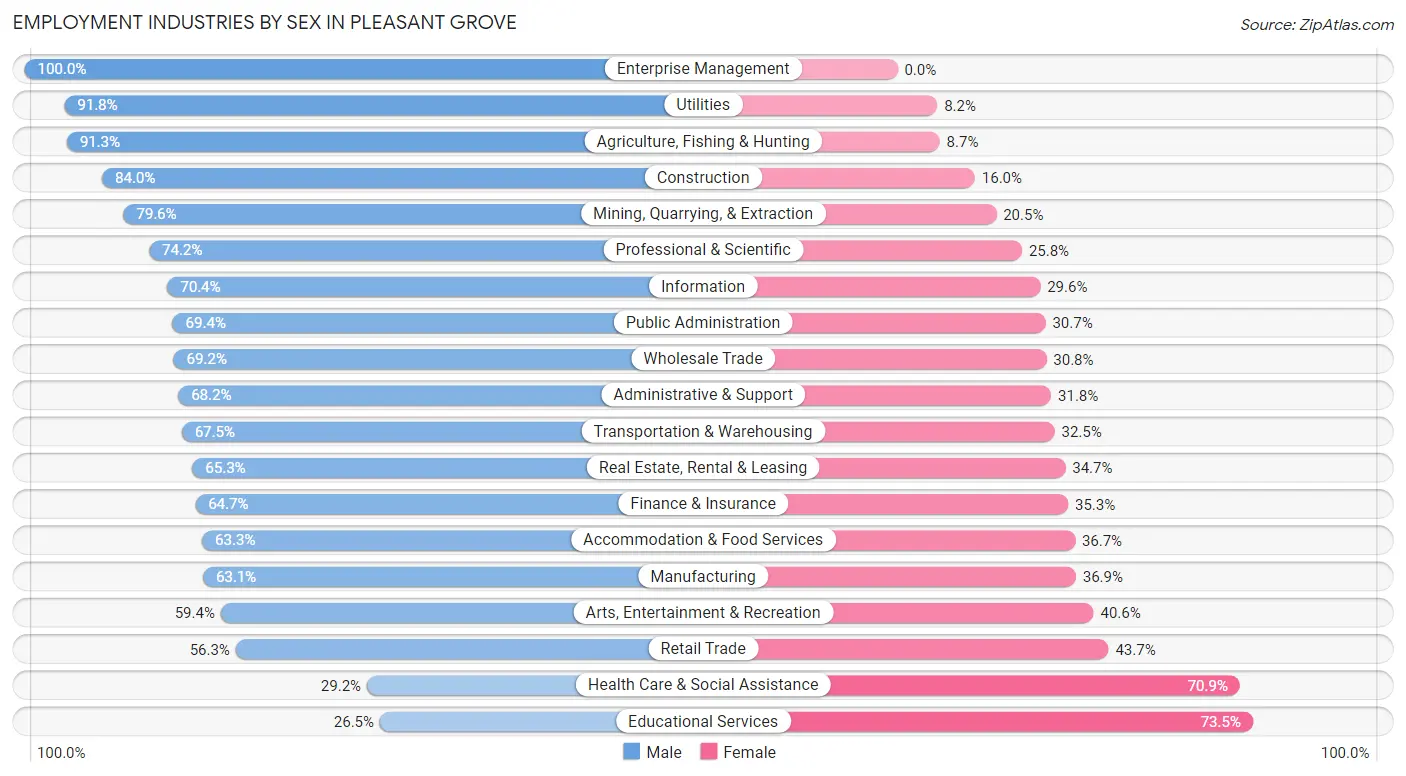
Employment Industries by Sex in Pleasant Grove
The Pleasant Grove industries that see more men than women are Enterprise Management (100.0%), Utilities (91.8%), and Agriculture, Fishing & Hunting (91.3%), whereas the industries that tend to have a higher number of women are Educational Services (73.5%), Health Care & Social Assistance (70.9%), and Retail Trade (43.7%).
| Industry | Male | Female |
| Agriculture, Fishing & Hunting | 94 (91.3%) | 9 (8.7%) |
| Mining, Quarrying, & Extraction | 35 (79.5%) | 9 (20.4%) |
| Construction | 927 (84.0%) | 177 (16.0%) |
| Manufacturing | 1,179 (63.1%) | 690 (36.9%) |
| Wholesale Trade | 469 (69.2%) | 209 (30.8%) |
| Retail Trade | 1,369 (56.3%) | 1,062 (43.7%) |
| Transportation & Warehousing | 303 (67.5%) | 146 (32.5%) |
| Utilities | 78 (91.8%) | 7 (8.2%) |
| Information | 305 (70.4%) | 128 (29.6%) |
| Finance & Insurance | 617 (64.7%) | 337 (35.3%) |
| Real Estate, Rental & Leasing | 310 (65.3%) | 165 (34.7%) |
| Professional & Scientific | 1,520 (74.2%) | 528 (25.8%) |
| Enterprise Management | 25 (100.0%) | 0 (0.0%) |
| Administrative & Support | 568 (68.2%) | 265 (31.8%) |
| Educational Services | 499 (26.5%) | 1,387 (73.5%) |
| Health Care & Social Assistance | 478 (29.1%) | 1,162 (70.9%) |
| Arts, Entertainment & Recreation | 199 (59.4%) | 136 (40.6%) |
| Accommodation & Food Services | 799 (63.3%) | 464 (36.7%) |
| Public Administration | 405 (69.4%) | 179 (30.6%) |
| Total | 10,675 (58.7%) | 7,497 (41.3%) |
Education in Pleasant Grove
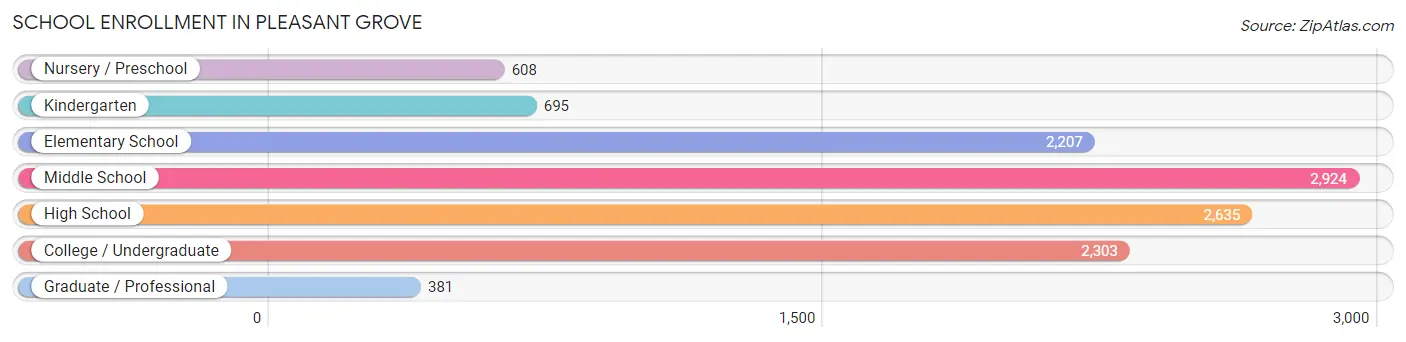
School Enrollment in Pleasant Grove
The most common levels of schooling among the 11,753 students in Pleasant Grove are middle school (2,924 | 24.9%), high school (2,635 | 22.4%), and college / undergraduate (2,303 | 19.6%).
| School Level | # Students | % Students |
| Nursery / Preschool | 608 | 5.2% |
| Kindergarten | 695 | 5.9% |
| Elementary School | 2,207 | 18.8% |
| Middle School | 2,924 | 24.9% |
| High School | 2,635 | 22.4% |
| College / Undergraduate | 2,303 | 19.6% |
| Graduate / Professional | 381 | 3.2% |
| Total | 11,753 | 100.0% |
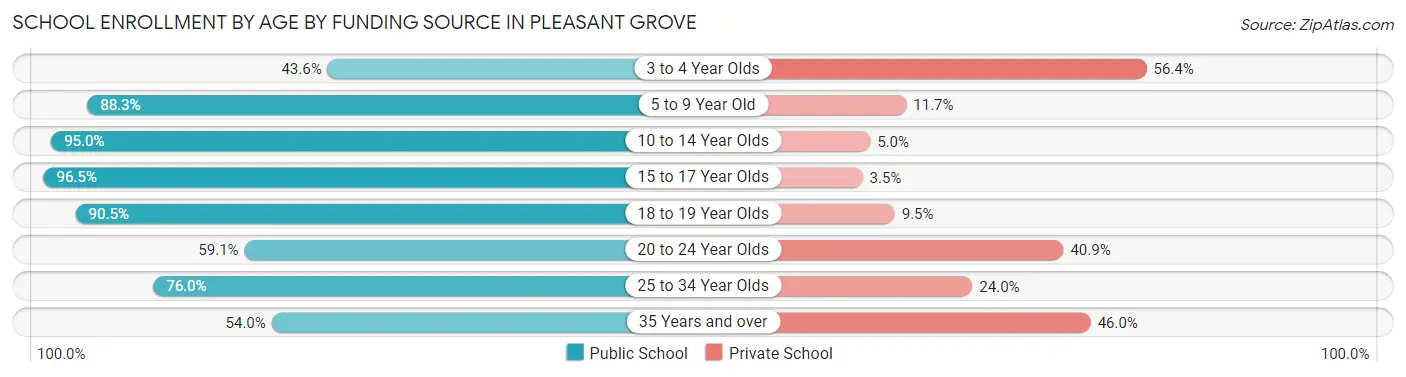
School Enrollment by Age by Funding Source in Pleasant Grove
Out of a total of 11,753 students who are enrolled in schools in Pleasant Grove, 1,786 (15.2%) attend a private institution, while the remaining 9,967 (84.8%) are enrolled in public schools. The age group of 3 to 4 year olds has the highest likelihood of being enrolled in private schools, with 233 (56.4% in the age bracket) enrolled. Conversely, the age group of 15 to 17 year olds has the lowest likelihood of being enrolled in a private school, with 1,750 (96.5% in the age bracket) attending a public institution.
| Age Bracket | Public School | Private School |
| 3 to 4 Year Olds | 180 (43.6%) | 233 (56.4%) |
| 5 to 9 Year Old | 2,600 (88.3%) | 344 (11.7%) |
| 10 to 14 Year Olds | 3,218 (95.0%) | 168 (5.0%) |
| 15 to 17 Year Olds | 1,750 (96.5%) | 64 (3.5%) |
| 18 to 19 Year Olds | 665 (90.5%) | 70 (9.5%) |
| 20 to 24 Year Olds | 714 (59.1%) | 495 (40.9%) |
| 25 to 34 Year Olds | 580 (76.0%) | 183 (24.0%) |
| 35 Years and over | 264 (54.0%) | 225 (46.0%) |
| Total | 9,967 (84.8%) | 1,786 (15.2%) |
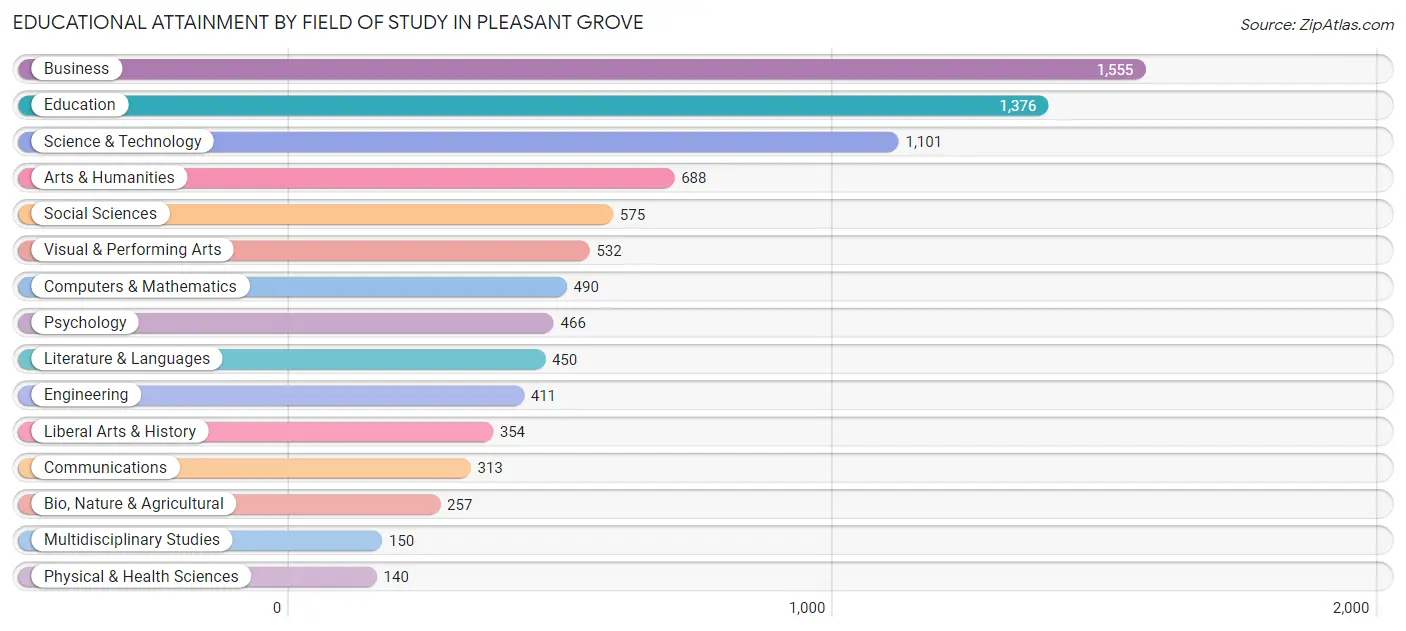
Educational Attainment by Field of Study in Pleasant Grove
Business (1,555 | 17.5%), education (1,376 | 15.5%), science & technology (1,101 | 12.4%), arts & humanities (688 | 7.8%), and social sciences (575 | 6.5%) are the most common fields of study among 8,858 individuals in Pleasant Grove who have obtained a bachelor's degree or higher.
| Field of Study | # Graduates | % Graduates |
| Computers & Mathematics | 490 | 5.5% |
| Bio, Nature & Agricultural | 257 | 2.9% |
| Physical & Health Sciences | 140 | 1.6% |
| Psychology | 466 | 5.3% |
| Social Sciences | 575 | 6.5% |
| Engineering | 411 | 4.6% |
| Multidisciplinary Studies | 150 | 1.7% |
| Science & Technology | 1,101 | 12.4% |
| Business | 1,555 | 17.5% |
| Education | 1,376 | 15.5% |
| Literature & Languages | 450 | 5.1% |
| Liberal Arts & History | 354 | 4.0% |
| Visual & Performing Arts | 532 | 6.0% |
| Communications | 313 | 3.5% |
| Arts & Humanities | 688 | 7.8% |
| Total | 8,858 | 100.0% |
Transportation & Commute in Pleasant Grove
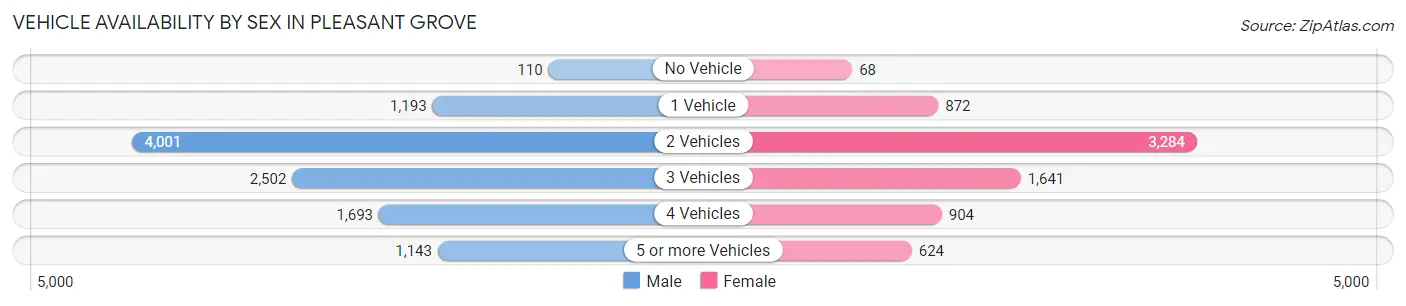
Vehicle Availability by Sex in Pleasant Grove
The most prevalent vehicle ownership categories in Pleasant Grove are males with 2 vehicles (4,001, accounting for 37.6%) and females with 2 vehicles (3,284, making up 54.1%).
| Vehicles Available | Male | Female |
| No Vehicle | 110 (1.0%) | 68 (0.9%) |
| 1 Vehicle | 1,193 (11.2%) | 872 (11.8%) |
| 2 Vehicles | 4,001 (37.6%) | 3,284 (44.4%) |
| 3 Vehicles | 2,502 (23.5%) | 1,641 (22.2%) |
| 4 Vehicles | 1,693 (15.9%) | 904 (12.2%) |
| 5 or more Vehicles | 1,143 (10.7%) | 624 (8.4%) |
| Total | 10,642 (100.0%) | 7,393 (100.0%) |
Commute Time in Pleasant Grove
The most frequently occuring commute durations in Pleasant Grove are 15 to 19 minutes (2,803 commuters, 18.0%), 10 to 14 minutes (2,489 commuters, 16.0%), and 5 to 9 minutes (2,379 commuters, 15.3%).
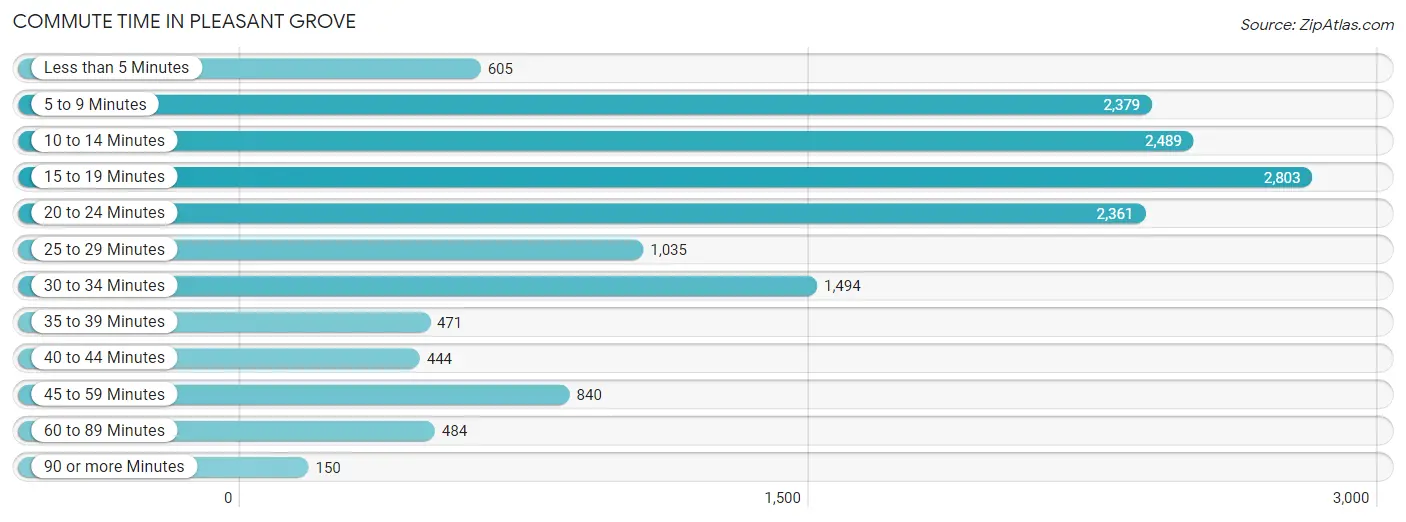
| Commute Time | # Commuters | % Commuters |
| Less than 5 Minutes | 605 | 3.9% |
| 5 to 9 Minutes | 2,379 | 15.3% |
| 10 to 14 Minutes | 2,489 | 16.0% |
| 15 to 19 Minutes | 2,803 | 18.0% |
| 20 to 24 Minutes | 2,361 | 15.2% |
| 25 to 29 Minutes | 1,035 | 6.7% |
| 30 to 34 Minutes | 1,494 | 9.6% |
| 35 to 39 Minutes | 471 | 3.0% |
| 40 to 44 Minutes | 444 | 2.9% |
| 45 to 59 Minutes | 840 | 5.4% |
| 60 to 89 Minutes | 484 | 3.1% |
| 90 or more Minutes | 150 | 1.0% |
Commute Time by Sex in Pleasant Grove
The most common commute times in Pleasant Grove are 20 to 24 minutes (1,520 commuters, 16.5%) for males and 15 to 19 minutes (1,311 commuters, 20.7%) for females.
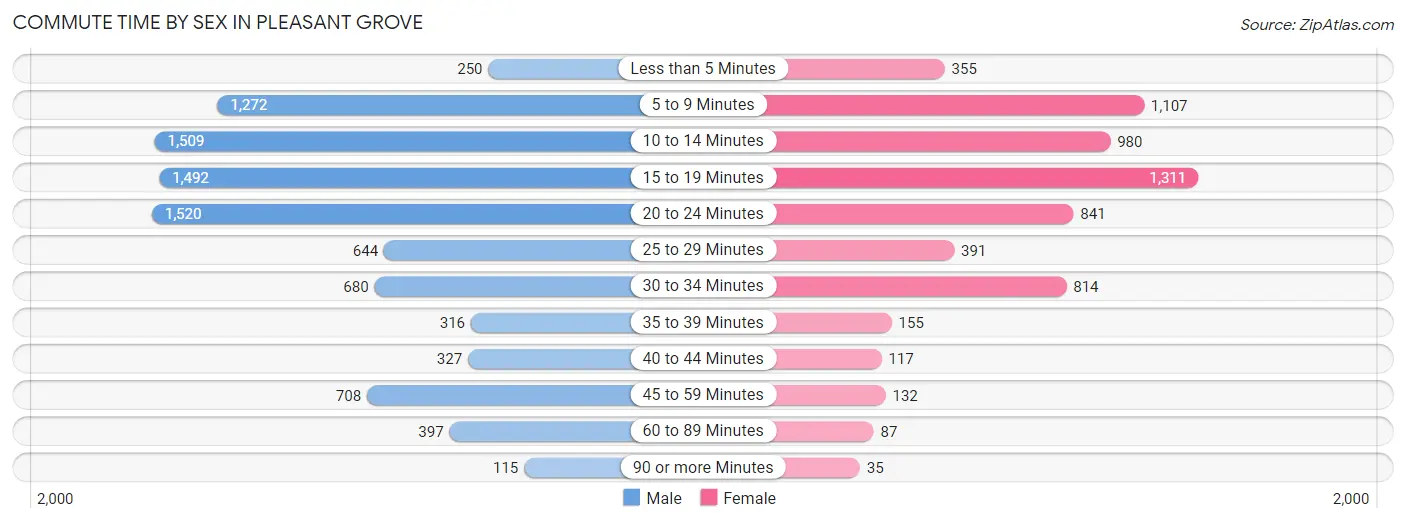
| Commute Time | Male | Female |
| Less than 5 Minutes | 250 (2.7%) | 355 (5.6%) |
| 5 to 9 Minutes | 1,272 (13.8%) | 1,107 (17.5%) |
| 10 to 14 Minutes | 1,509 (16.4%) | 980 (15.5%) |
| 15 to 19 Minutes | 1,492 (16.2%) | 1,311 (20.7%) |
| 20 to 24 Minutes | 1,520 (16.5%) | 841 (13.3%) |
| 25 to 29 Minutes | 644 (7.0%) | 391 (6.2%) |
| 30 to 34 Minutes | 680 (7.4%) | 814 (12.9%) |
| 35 to 39 Minutes | 316 (3.4%) | 155 (2.5%) |
| 40 to 44 Minutes | 327 (3.5%) | 117 (1.8%) |
| 45 to 59 Minutes | 708 (7.7%) | 132 (2.1%) |
| 60 to 89 Minutes | 397 (4.3%) | 87 (1.4%) |
| 90 or more Minutes | 115 (1.3%) | 35 (0.5%) |
Time of Departure to Work by Sex in Pleasant Grove
The most frequent times of departure to work in Pleasant Grove are 7:30 AM to 7:59 AM (1,643, 17.8%) for males and 7:30 AM to 7:59 AM (948, 15.0%) for females.
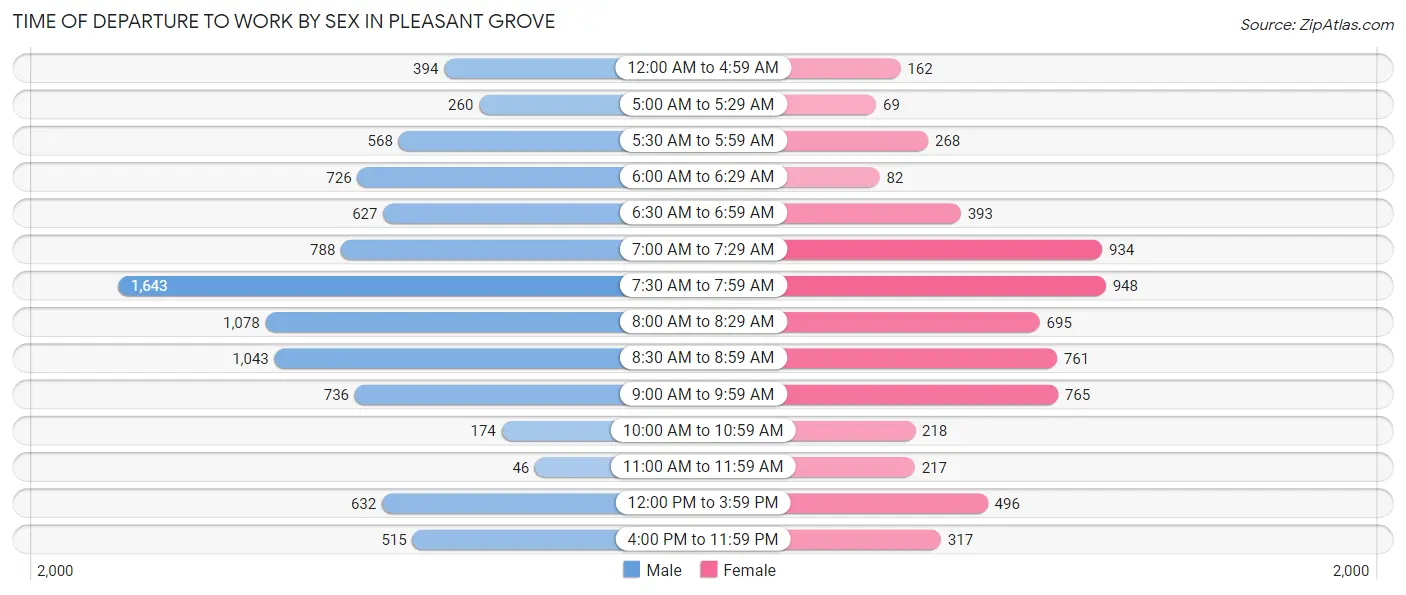
| Time of Departure | Male | Female |
| 12:00 AM to 4:59 AM | 394 (4.3%) | 162 (2.6%) |
| 5:00 AM to 5:29 AM | 260 (2.8%) | 69 (1.1%) |
| 5:30 AM to 5:59 AM | 568 (6.1%) | 268 (4.2%) |
| 6:00 AM to 6:29 AM | 726 (7.9%) | 82 (1.3%) |
| 6:30 AM to 6:59 AM | 627 (6.8%) | 393 (6.2%) |
| 7:00 AM to 7:29 AM | 788 (8.5%) | 934 (14.8%) |
| 7:30 AM to 7:59 AM | 1,643 (17.8%) | 948 (15.0%) |
| 8:00 AM to 8:29 AM | 1,078 (11.7%) | 695 (11.0%) |
| 8:30 AM to 8:59 AM | 1,043 (11.3%) | 761 (12.0%) |
| 9:00 AM to 9:59 AM | 736 (8.0%) | 765 (12.1%) |
| 10:00 AM to 10:59 AM | 174 (1.9%) | 218 (3.5%) |
| 11:00 AM to 11:59 AM | 46 (0.5%) | 217 (3.4%) |
| 12:00 PM to 3:59 PM | 632 (6.9%) | 496 (7.8%) |
| 4:00 PM to 11:59 PM | 515 (5.6%) | 317 (5.0%) |
| Total | 9,230 (100.0%) | 6,325 (100.0%) |
Housing Occupancy in Pleasant Grove
Occupancy by Ownership in Pleasant Grove
Of the total 11,492 dwellings in Pleasant Grove, owner-occupied units account for 7,700 (67.0%), while renter-occupied units make up 3,792 (33.0%).
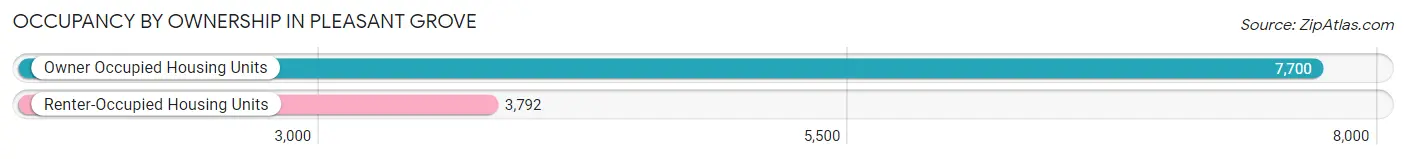
| Occupancy | # Housing Units | % Housing Units |
| Owner Occupied Housing Units | 7,700 | 67.0% |
| Renter-Occupied Housing Units | 3,792 | 33.0% |
| Total Occupied Housing Units | 11,492 | 100.0% |
Occupancy by Household Size in Pleasant Grove
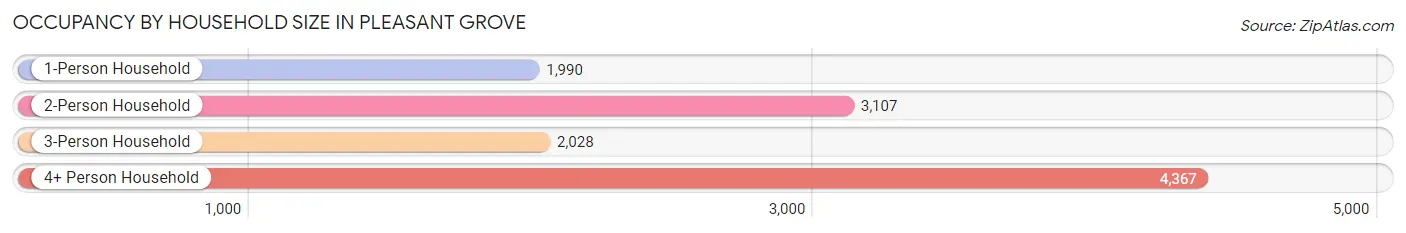
| Household Size | # Housing Units | % Housing Units |
| 1-Person Household | 1,990 | 17.3% |
| 2-Person Household | 3,107 | 27.0% |
| 3-Person Household | 2,028 | 17.6% |
| 4+ Person Household | 4,367 | 38.0% |
| Total Housing Units | 11,492 | 100.0% |
Occupancy by Ownership by Household Size in Pleasant Grove
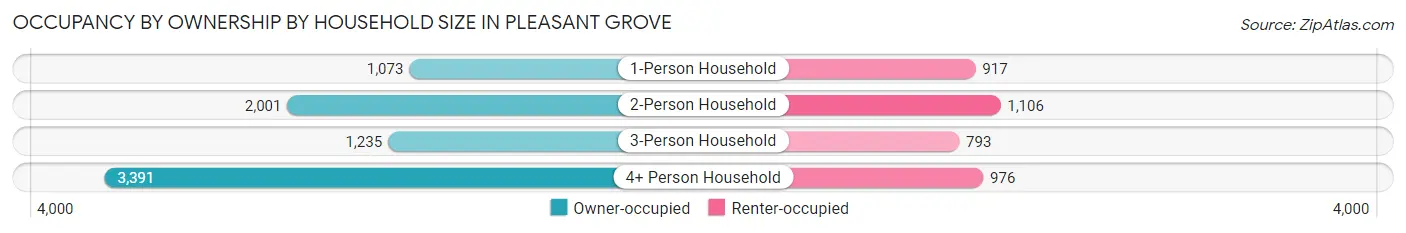
| Household Size | Owner-occupied | Renter-occupied |
| 1-Person Household | 1,073 (53.9%) | 917 (46.1%) |
| 2-Person Household | 2,001 (64.4%) | 1,106 (35.6%) |
| 3-Person Household | 1,235 (60.9%) | 793 (39.1%) |
| 4+ Person Household | 3,391 (77.6%) | 976 (22.4%) |
| Total Housing Units | 7,700 (67.0%) | 3,792 (33.0%) |
Occupancy by Educational Attainment in Pleasant Grove
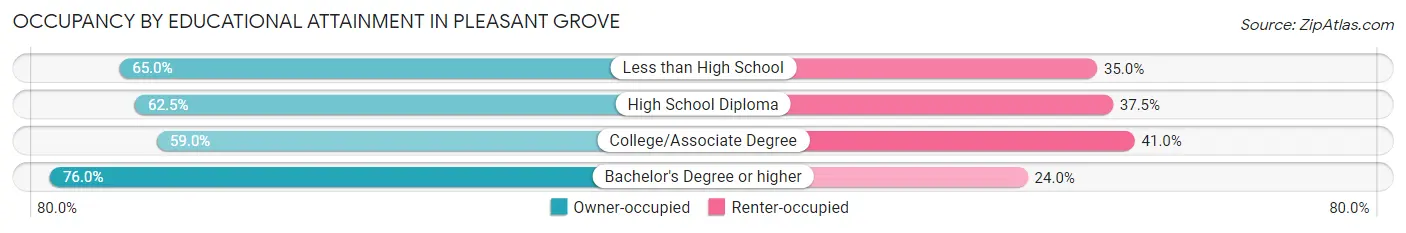
| Household Size | Owner-occupied | Renter-occupied |
| Less than High School | 230 (65.0%) | 124 (35.0%) |
| High School Diploma | 1,078 (62.5%) | 648 (37.5%) |
| College/Associate Degree | 2,639 (59.0%) | 1,833 (41.0%) |
| Bachelor's Degree or higher | 3,753 (76.0%) | 1,187 (24.0%) |
Occupancy by Age of Householder in Pleasant Grove
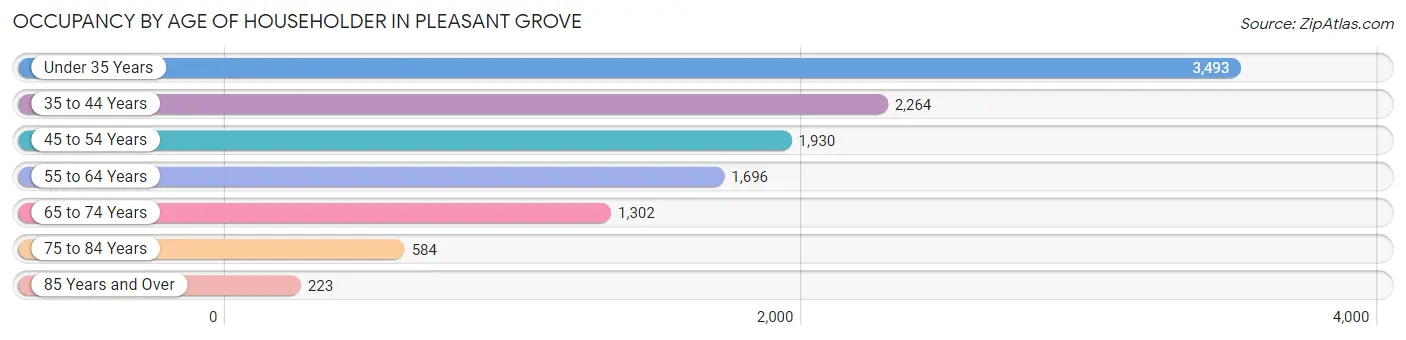
| Age Bracket | # Households | % Households |
| Under 35 Years | 3,493 | 30.4% |
| 35 to 44 Years | 2,264 | 19.7% |
| 45 to 54 Years | 1,930 | 16.8% |
| 55 to 64 Years | 1,696 | 14.8% |
| 65 to 74 Years | 1,302 | 11.3% |
| 75 to 84 Years | 584 | 5.1% |
| 85 Years and Over | 223 | 1.9% |
| Total | 11,492 | 100.0% |
Housing Finances in Pleasant Grove
Median Income by Occupancy in Pleasant Grove
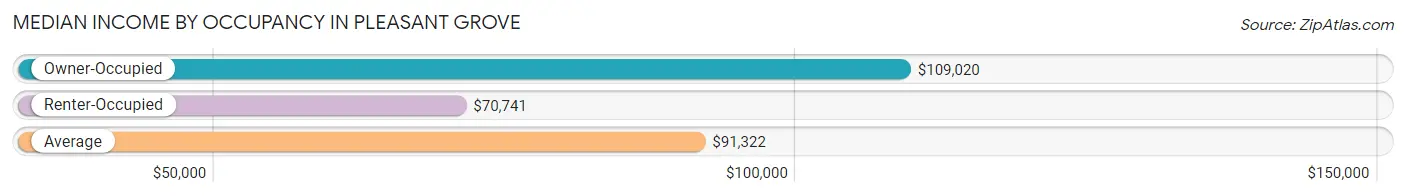
| Occupancy Type | # Households | Median Income |
| Owner-Occupied | 7,700 (67.0%) | $109,020 |
| Renter-Occupied | 3,792 (33.0%) | $70,741 |
| Average | 11,492 (100.0%) | $91,322 |
Occupancy by Householder Income Bracket in Pleasant Grove
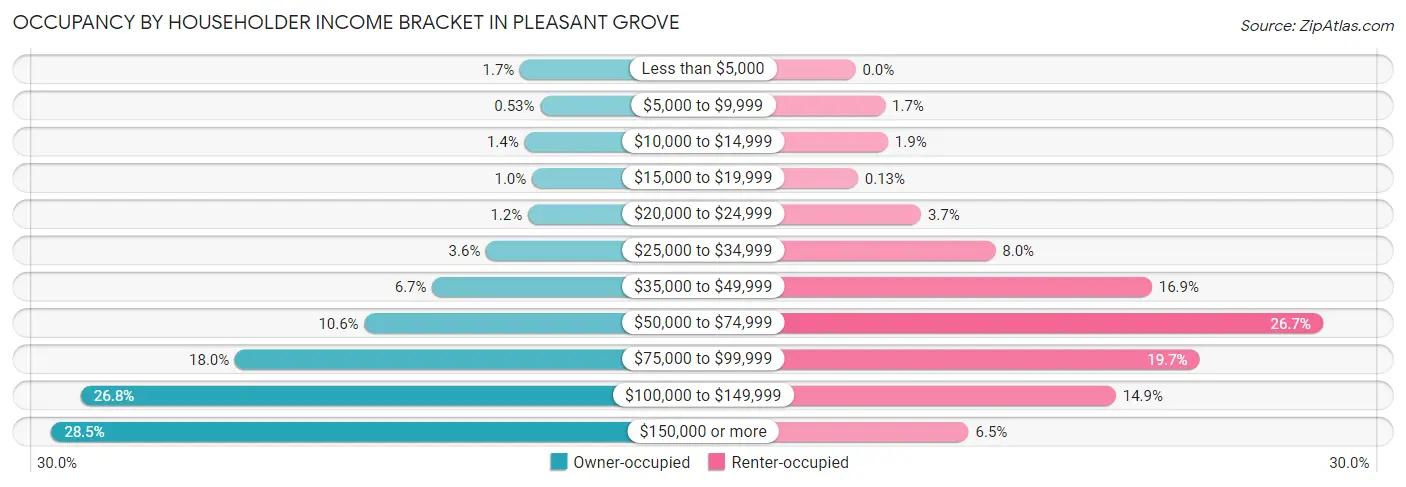
| Income Bracket | Owner-occupied | Renter-occupied |
| Less than $5,000 | 129 (1.7%) | 0 (0.0%) |
| $5,000 to $9,999 | 41 (0.5%) | 64 (1.7%) |
| $10,000 to $14,999 | 110 (1.4%) | 70 (1.8%) |
| $15,000 to $19,999 | 77 (1.0%) | 5 (0.1%) |
| $20,000 to $24,999 | 95 (1.2%) | 142 (3.7%) |
| $25,000 to $34,999 | 279 (3.6%) | 303 (8.0%) |
| $35,000 to $49,999 | 516 (6.7%) | 642 (16.9%) |
| $50,000 to $74,999 | 815 (10.6%) | 1,012 (26.7%) |
| $75,000 to $99,999 | 1,384 (18.0%) | 745 (19.7%) |
| $100,000 to $149,999 | 2,062 (26.8%) | 564 (14.9%) |
| $150,000 or more | 2,192 (28.5%) | 245 (6.5%) |
| Total | 7,700 (100.0%) | 3,792 (100.0%) |
Monthly Housing Cost Tiers in Pleasant Grove
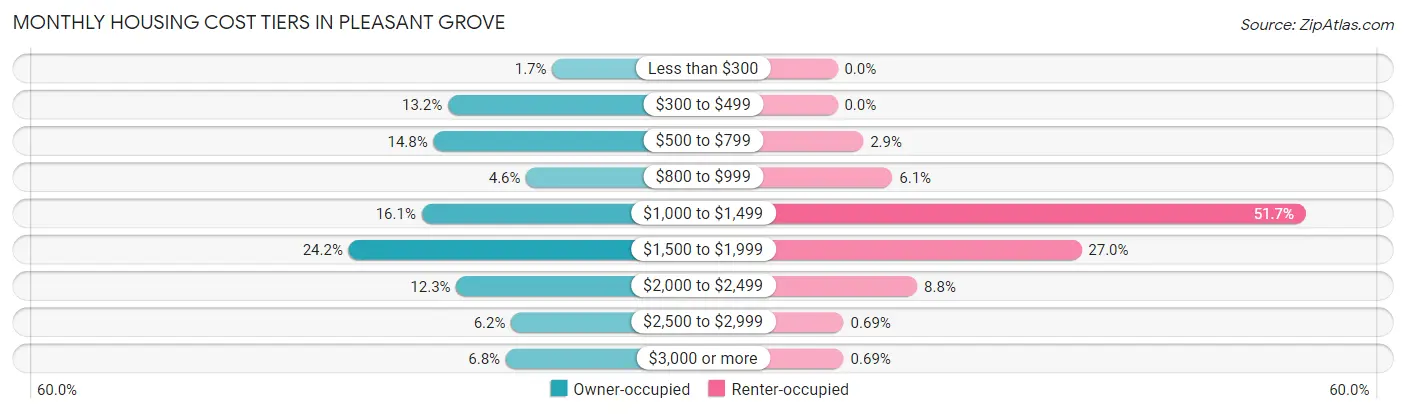
| Monthly Cost | Owner-occupied | Renter-occupied |
| Less than $300 | 131 (1.7%) | 0 (0.0%) |
| $300 to $499 | 1,018 (13.2%) | 0 (0.0%) |
| $500 to $799 | 1,141 (14.8%) | 108 (2.9%) |
| $800 to $999 | 352 (4.6%) | 230 (6.1%) |
| $1,000 to $1,499 | 1,242 (16.1%) | 1,962 (51.7%) |
| $1,500 to $1,999 | 1,863 (24.2%) | 1,022 (27.0%) |
| $2,000 to $2,499 | 947 (12.3%) | 334 (8.8%) |
| $2,500 to $2,999 | 480 (6.2%) | 26 (0.7%) |
| $3,000 or more | 526 (6.8%) | 26 (0.7%) |
| Total | 7,700 (100.0%) | 3,792 (100.0%) |
Physical Housing Characteristics in Pleasant Grove
Housing Structures in Pleasant Grove
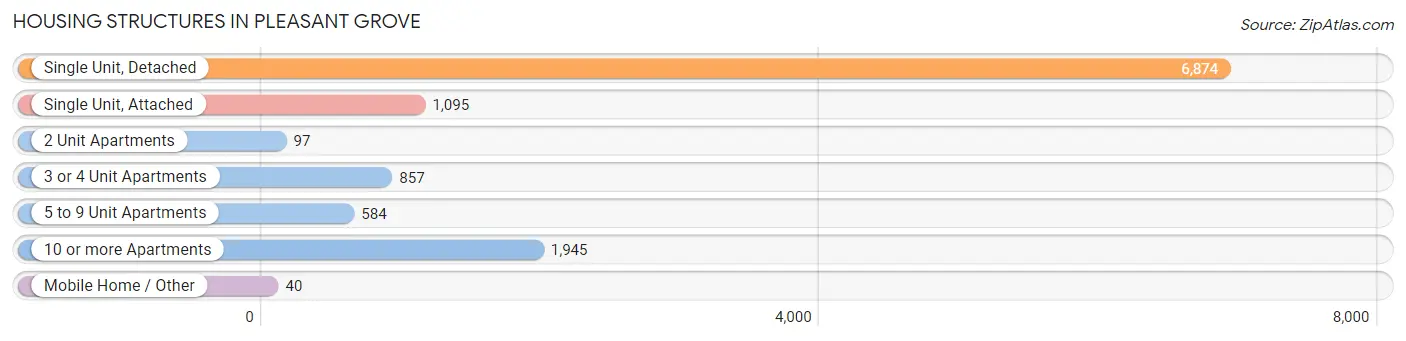
| Structure Type | # Housing Units | % Housing Units |
| Single Unit, Detached | 6,874 | 59.8% |
| Single Unit, Attached | 1,095 | 9.5% |
| 2 Unit Apartments | 97 | 0.8% |
| 3 or 4 Unit Apartments | 857 | 7.5% |
| 5 to 9 Unit Apartments | 584 | 5.1% |
| 10 or more Apartments | 1,945 | 16.9% |
| Mobile Home / Other | 40 | 0.4% |
| Total | 11,492 | 100.0% |
Housing Structures by Occupancy in Pleasant Grove
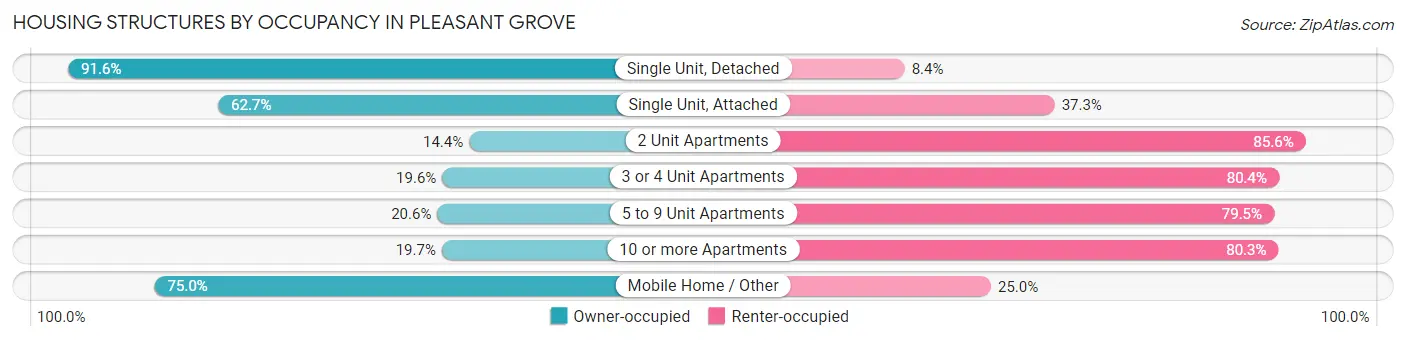
| Structure Type | Owner-occupied | Renter-occupied |
| Single Unit, Detached | 6,298 (91.6%) | 576 (8.4%) |
| Single Unit, Attached | 687 (62.7%) | 408 (37.3%) |
| 2 Unit Apartments | 14 (14.4%) | 83 (85.6%) |
| 3 or 4 Unit Apartments | 168 (19.6%) | 689 (80.4%) |
| 5 to 9 Unit Apartments | 120 (20.5%) | 464 (79.4%) |
| 10 or more Apartments | 383 (19.7%) | 1,562 (80.3%) |
| Mobile Home / Other | 30 (75.0%) | 10 (25.0%) |
| Total | 7,700 (67.0%) | 3,792 (33.0%) |
Housing Structures by Number of Rooms in Pleasant Grove
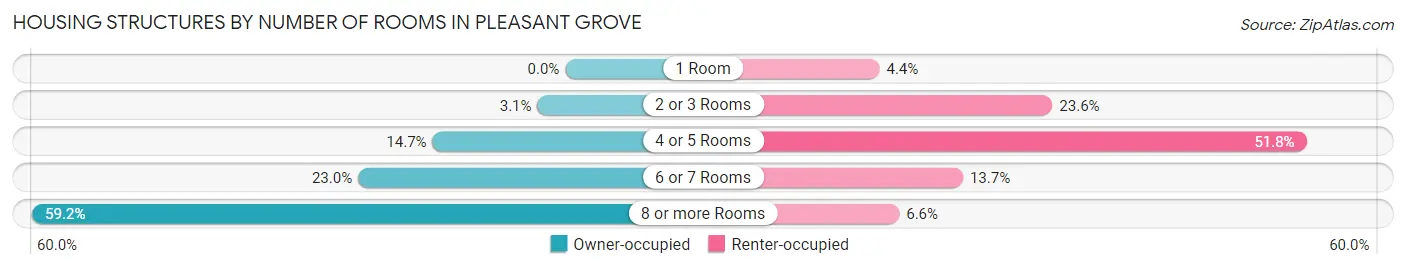
| Number of Rooms | Owner-occupied | Renter-occupied |
| 1 Room | 0 (0.0%) | 167 (4.4%) |
| 2 or 3 Rooms | 238 (3.1%) | 894 (23.6%) |
| 4 or 5 Rooms | 1,135 (14.7%) | 1,963 (51.8%) |
| 6 or 7 Rooms | 1,771 (23.0%) | 518 (13.7%) |
| 8 or more Rooms | 4,556 (59.2%) | 250 (6.6%) |
| Total | 7,700 (100.0%) | 3,792 (100.0%) |
Housing Structure by Heating Type in Pleasant Grove
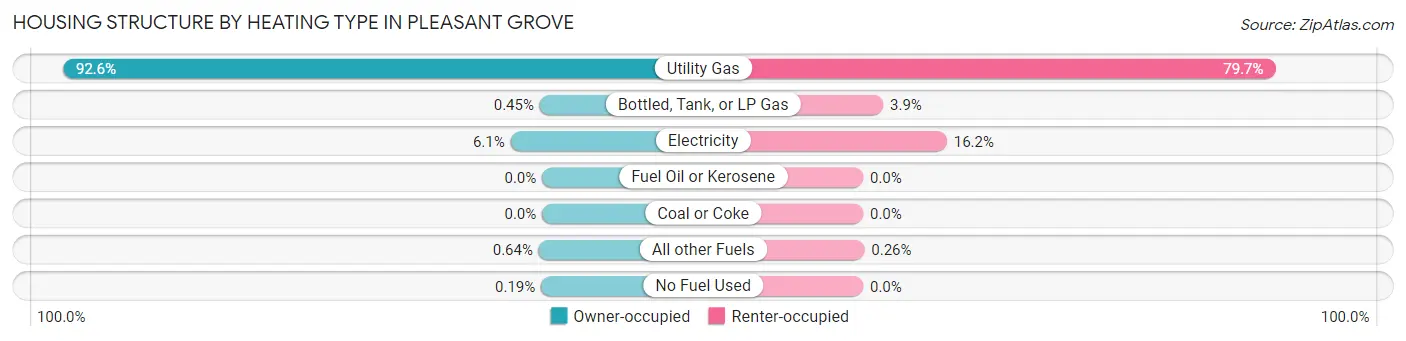
| Heating Type | Owner-occupied | Renter-occupied |
| Utility Gas | 7,132 (92.6%) | 3,021 (79.7%) |
| Bottled, Tank, or LP Gas | 35 (0.4%) | 147 (3.9%) |
| Electricity | 469 (6.1%) | 614 (16.2%) |
| Fuel Oil or Kerosene | 0 (0.0%) | 0 (0.0%) |
| Coal or Coke | 0 (0.0%) | 0 (0.0%) |
| All other Fuels | 49 (0.6%) | 10 (0.3%) |
| No Fuel Used | 15 (0.2%) | 0 (0.0%) |
| Total | 7,700 (100.0%) | 3,792 (100.0%) |
Household Vehicle Usage in Pleasant Grove
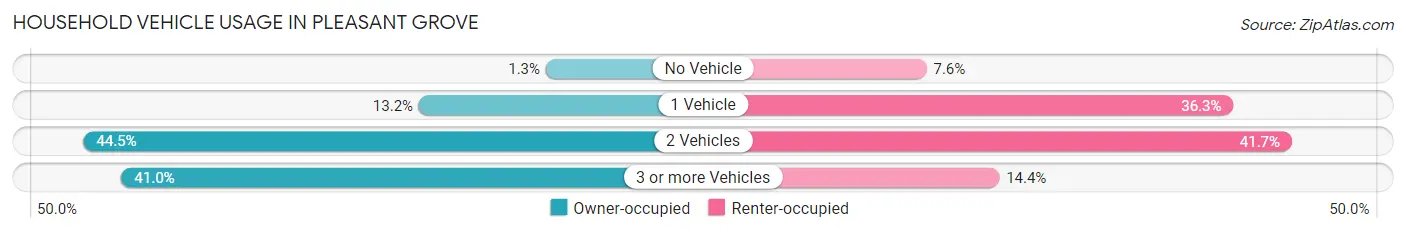
| Vehicles per Household | Owner-occupied | Renter-occupied |
| No Vehicle | 103 (1.3%) | 289 (7.6%) |
| 1 Vehicle | 1,016 (13.2%) | 1,375 (36.3%) |
| 2 Vehicles | 3,427 (44.5%) | 1,582 (41.7%) |
| 3 or more Vehicles | 3,154 (41.0%) | 546 (14.4%) |
| Total | 7,700 (100.0%) | 3,792 (100.0%) |
Real Estate & Mortgages in Pleasant Grove
Real Estate and Mortgage Overview in Pleasant Grove
| Characteristic | Without Mortgage | With Mortgage |
| Housing Units | 2,394 | 5,306 |
| Median Property Value | $426,300 | $415,200 |
| Median Household Income | $104,313 | $1,462 |
| Monthly Housing Costs | $521 | $519 |
| Real Estate Taxes | $2,058 | $114 |
Property Value by Mortgage Status in Pleasant Grove
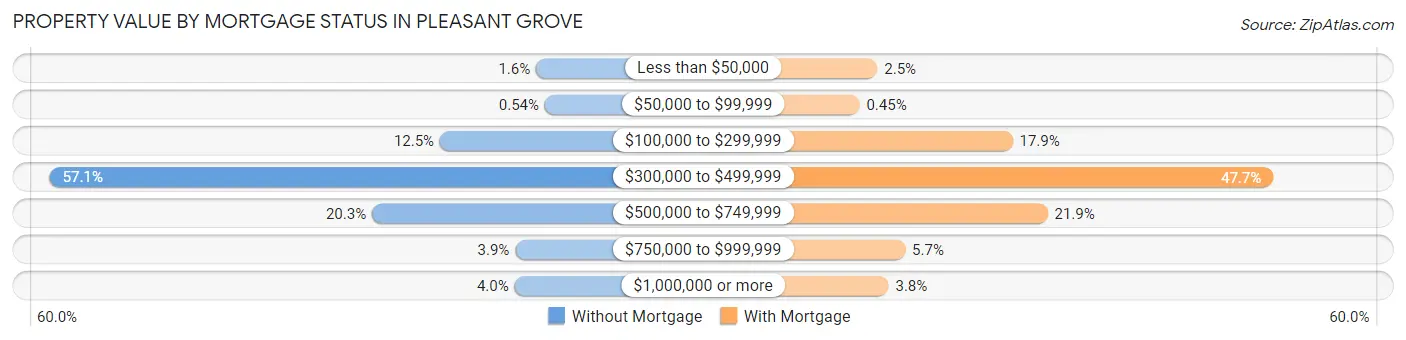
| Property Value | Without Mortgage | With Mortgage |
| Less than $50,000 | 37 (1.5%) | 132 (2.5%) |
| $50,000 to $99,999 | 13 (0.5%) | 24 (0.4%) |
| $100,000 to $299,999 | 300 (12.5%) | 952 (17.9%) |
| $300,000 to $499,999 | 1,368 (57.1%) | 2,533 (47.7%) |
| $500,000 to $749,999 | 486 (20.3%) | 1,164 (21.9%) |
| $750,000 to $999,999 | 94 (3.9%) | 301 (5.7%) |
| $1,000,000 or more | 96 (4.0%) | 200 (3.8%) |
| Total | 2,394 (100.0%) | 5,306 (100.0%) |
Household Income by Mortgage Status in Pleasant Grove
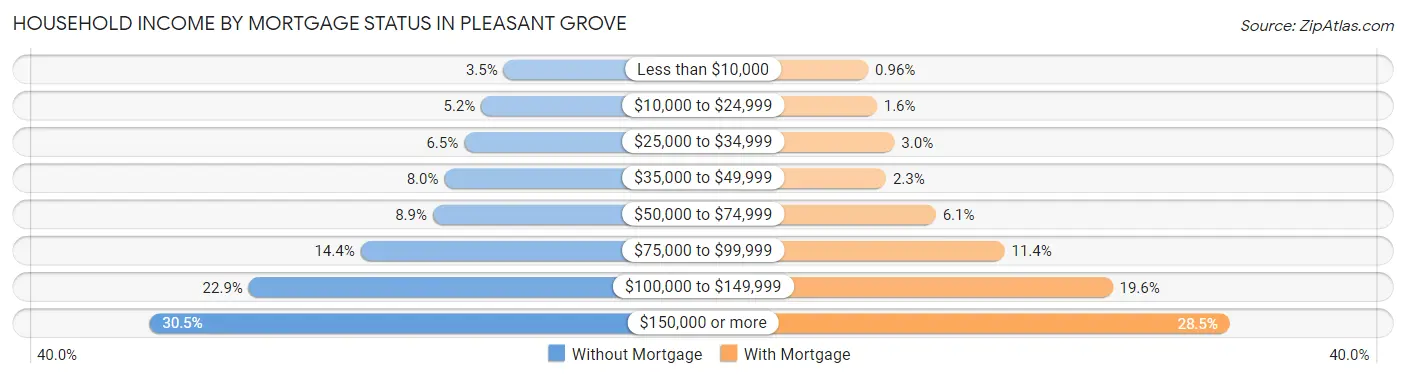
| Household Income | Without Mortgage | With Mortgage |
| Less than $10,000 | 84 (3.5%) | 51 (1.0%) |
| $10,000 to $24,999 | 125 (5.2%) | 86 (1.6%) |
| $25,000 to $34,999 | 156 (6.5%) | 157 (3.0%) |
| $35,000 to $49,999 | 192 (8.0%) | 123 (2.3%) |
| $50,000 to $74,999 | 213 (8.9%) | 324 (6.1%) |
| $75,000 to $99,999 | 345 (14.4%) | 602 (11.4%) |
| $100,000 to $149,999 | 549 (22.9%) | 1,039 (19.6%) |
| $150,000 or more | 730 (30.5%) | 1,513 (28.5%) |
| Total | 2,394 (100.0%) | 5,306 (100.0%) |
Property Value to Household Income Ratio in Pleasant Grove
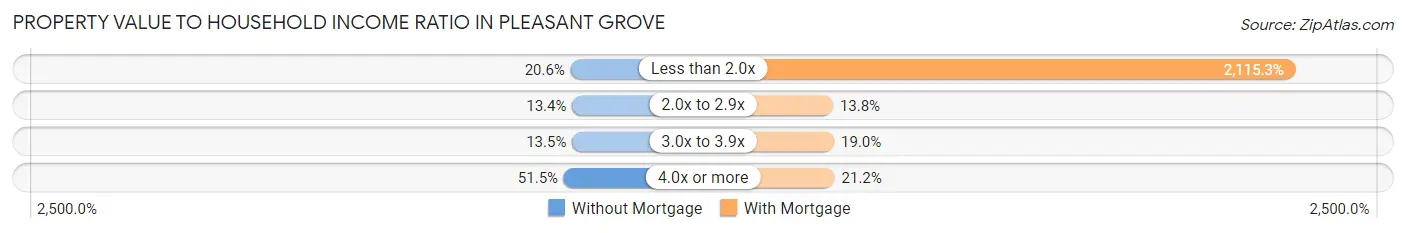
| Value-to-Income Ratio | Without Mortgage | With Mortgage |
| Less than 2.0x | 492 (20.5%) | 112,237 (2,115.3%) |
| 2.0x to 2.9x | 321 (13.4%) | 734 (13.8%) |
| 3.0x to 3.9x | 323 (13.5%) | 1,006 (19.0%) |
| 4.0x or more | 1,232 (51.5%) | 1,126 (21.2%) |
| Total | 2,394 (100.0%) | 5,306 (100.0%) |
Real Estate Taxes by Mortgage Status in Pleasant Grove
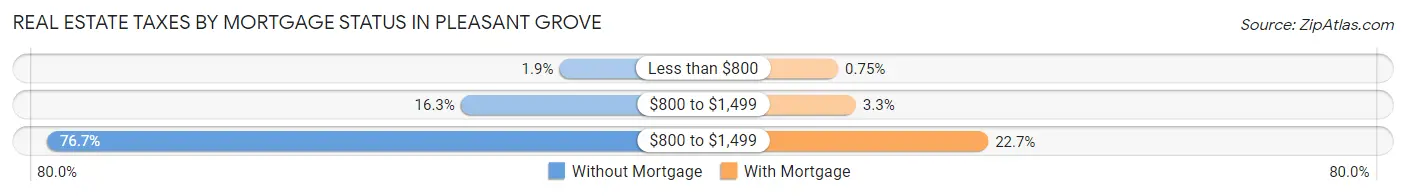
| Property Taxes | Without Mortgage | With Mortgage |
| Less than $800 | 45 (1.9%) | 40 (0.7%) |
| $800 to $1,499 | 390 (16.3%) | 177 (3.3%) |
| $800 to $1,499 | 1,837 (76.7%) | 1,203 (22.7%) |
| Total | 2,394 (100.0%) | 5,306 (100.0%) |
Health & Disability in Pleasant Grove
Health Insurance Coverage by Age in Pleasant Grove
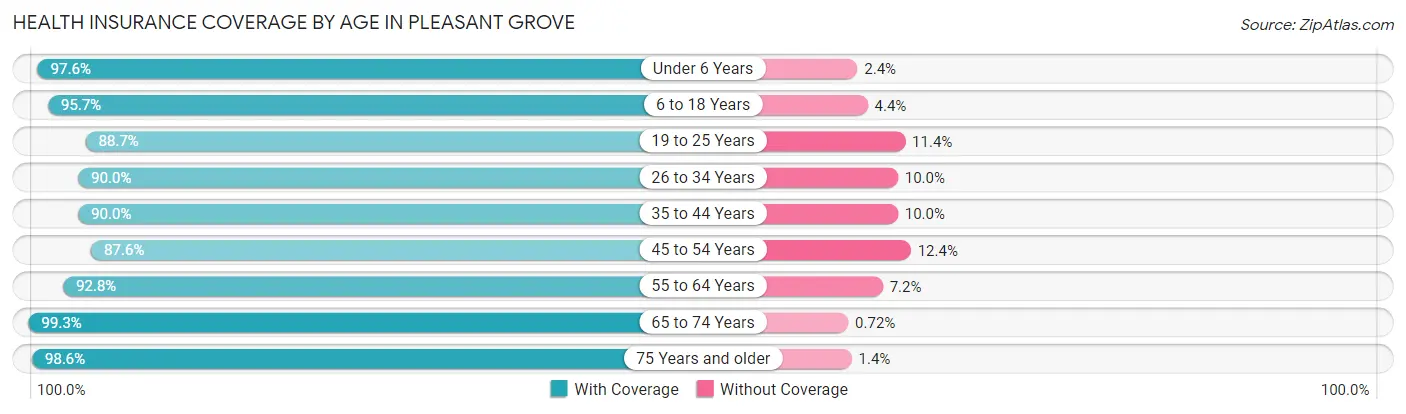
| Age Bracket | With Coverage | Without Coverage |
| Under 6 Years | 3,920 (97.6%) | 98 (2.4%) |
| 6 to 18 Years | 8,177 (95.7%) | 372 (4.3%) |
| 19 to 25 Years | 4,376 (88.6%) | 560 (11.4%) |
| 26 to 34 Years | 4,361 (90.0%) | 483 (10.0%) |
| 35 to 44 Years | 3,906 (90.0%) | 433 (10.0%) |
| 45 to 54 Years | 3,401 (87.6%) | 481 (12.4%) |
| 55 to 64 Years | 3,045 (92.8%) | 235 (7.2%) |
| 65 to 74 Years | 2,055 (99.3%) | 15 (0.7%) |
| 75 Years and older | 1,451 (98.6%) | 20 (1.4%) |
| Total | 34,692 (92.8%) | 2,697 (7.2%) |
Health Insurance Coverage by Citizenship Status in Pleasant Grove
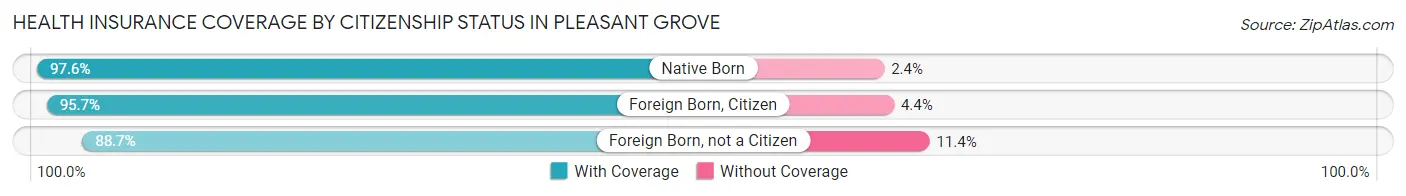
| Citizenship Status | With Coverage | Without Coverage |
| Native Born | 3,920 (97.6%) | 98 (2.4%) |
| Foreign Born, Citizen | 8,177 (95.7%) | 372 (4.3%) |
| Foreign Born, not a Citizen | 4,376 (88.6%) | 560 (11.4%) |
Health Insurance Coverage by Household Income in Pleasant Grove
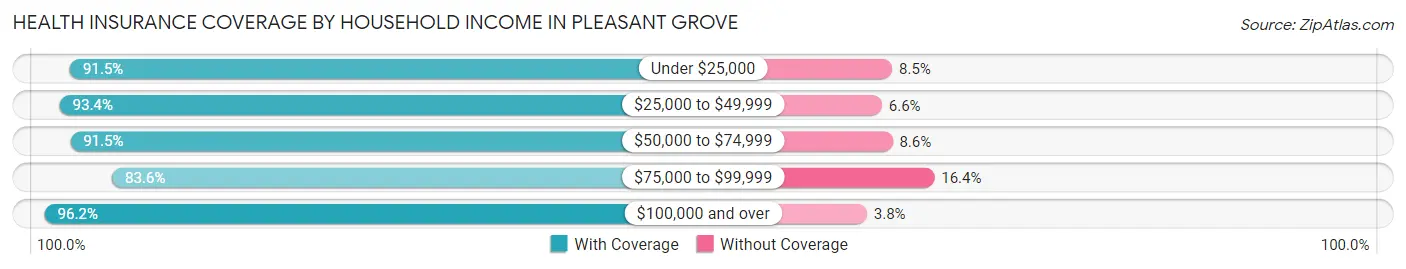
| Household Income | With Coverage | Without Coverage |
| Under $25,000 | 1,530 (91.5%) | 142 (8.5%) |
| $25,000 to $49,999 | 3,657 (93.4%) | 257 (6.6%) |
| $50,000 to $74,999 | 4,918 (91.4%) | 460 (8.6%) |
| $75,000 to $99,999 | 5,584 (83.6%) | 1,095 (16.4%) |
| $100,000 and over | 18,970 (96.2%) | 742 (3.8%) |
Public vs Private Health Insurance Coverage by Age in Pleasant Grove
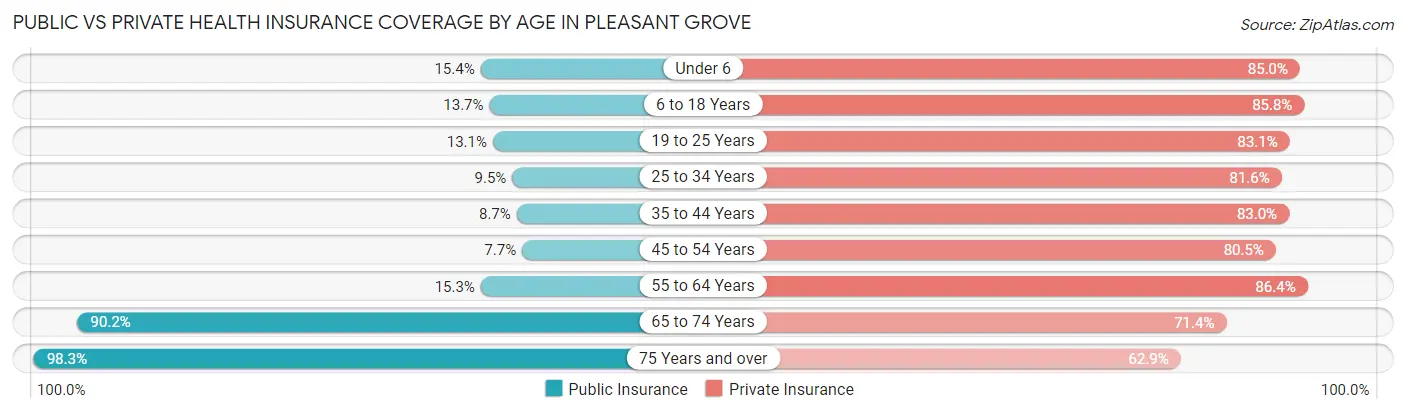
| Age Bracket | Public Insurance | Private Insurance |
| Under 6 | 618 (15.4%) | 3,416 (85.0%) |
| 6 to 18 Years | 1,174 (13.7%) | 7,337 (85.8%) |
| 19 to 25 Years | 646 (13.1%) | 4,102 (83.1%) |
| 25 to 34 Years | 460 (9.5%) | 3,953 (81.6%) |
| 35 to 44 Years | 376 (8.7%) | 3,601 (83.0%) |
| 45 to 54 Years | 298 (7.7%) | 3,126 (80.5%) |
| 55 to 64 Years | 503 (15.3%) | 2,835 (86.4%) |
| 65 to 74 Years | 1,867 (90.2%) | 1,477 (71.4%) |
| 75 Years and over | 1,446 (98.3%) | 925 (62.9%) |
| Total | 7,388 (19.8%) | 30,772 (82.3%) |
Disability Status by Sex by Age in Pleasant Grove
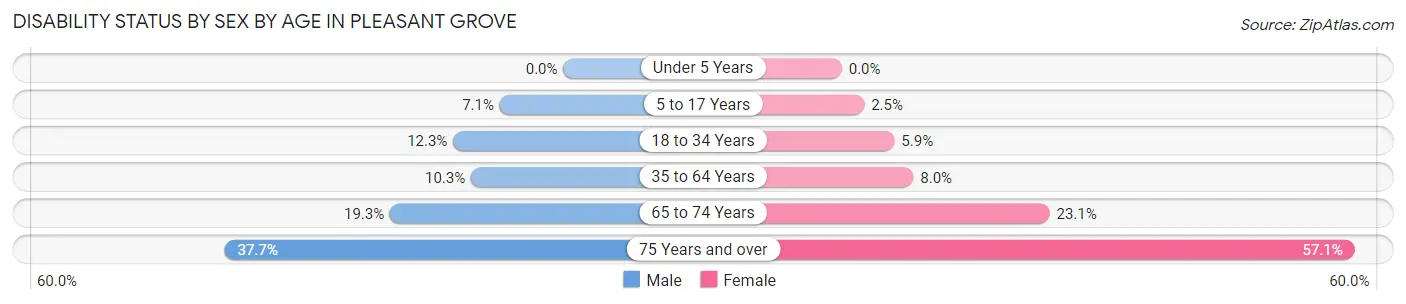
| Age Bracket | Male | Female |
| Under 5 Years | 0 (0.0%) | 0 (0.0%) |
| 5 to 17 Years | 330 (7.1%) | 95 (2.5%) |
| 18 to 34 Years | 686 (12.3%) | 292 (5.9%) |
| 35 to 64 Years | 621 (10.3%) | 435 (8.0%) |
| 65 to 74 Years | 176 (19.3%) | 268 (23.1%) |
| 75 Years and over | 263 (37.7%) | 442 (57.1%) |
Disability Class by Sex by Age in Pleasant Grove
Disability Class: Hearing Difficulty
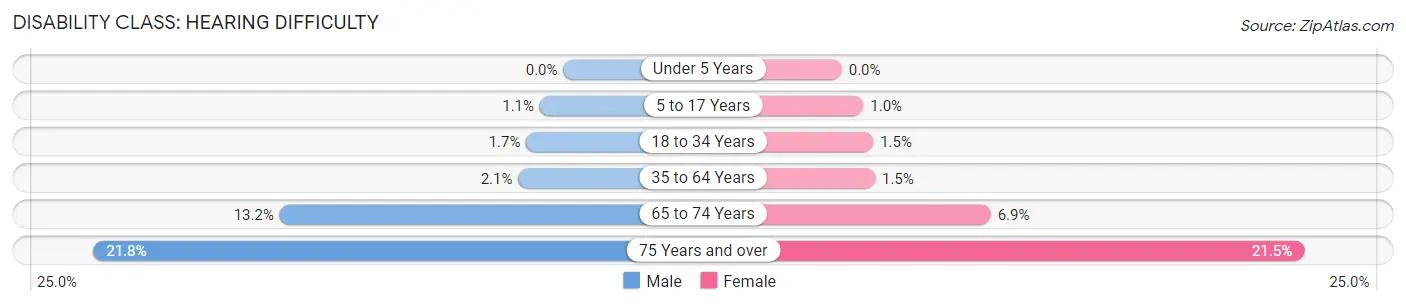
| Age Bracket | Male | Female |
| Under 5 Years | 0 (0.0%) | 0 (0.0%) |
| 5 to 17 Years | 51 (1.1%) | 38 (1.0%) |
| 18 to 34 Years | 96 (1.7%) | 73 (1.5%) |
| 35 to 64 Years | 126 (2.1%) | 84 (1.5%) |
| 65 to 74 Years | 120 (13.2%) | 80 (6.9%) |
| 75 Years and over | 152 (21.8%) | 166 (21.4%) |
Disability Class: Vision Difficulty
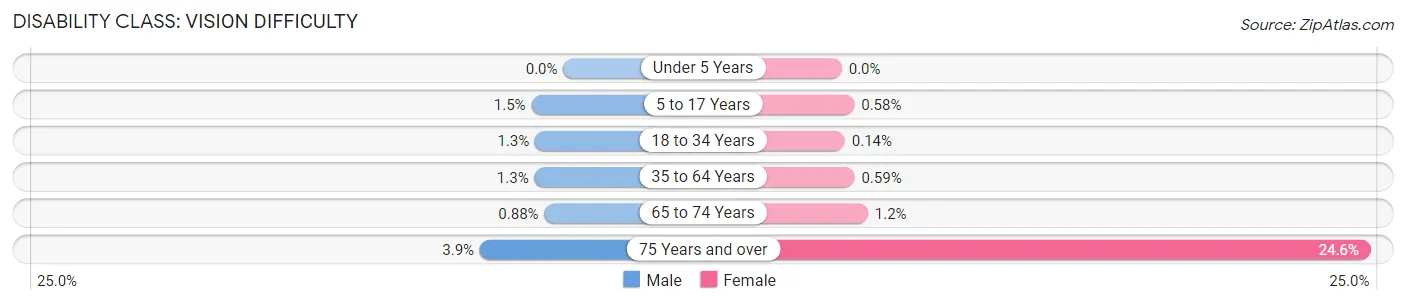
| Age Bracket | Male | Female |
| Under 5 Years | 0 (0.0%) | 0 (0.0%) |
| 5 to 17 Years | 69 (1.5%) | 22 (0.6%) |
| 18 to 34 Years | 73 (1.3%) | 7 (0.1%) |
| 35 to 64 Years | 81 (1.3%) | 32 (0.6%) |
| 65 to 74 Years | 8 (0.9%) | 14 (1.2%) |
| 75 Years and over | 27 (3.9%) | 190 (24.5%) |
Disability Class: Cognitive Difficulty
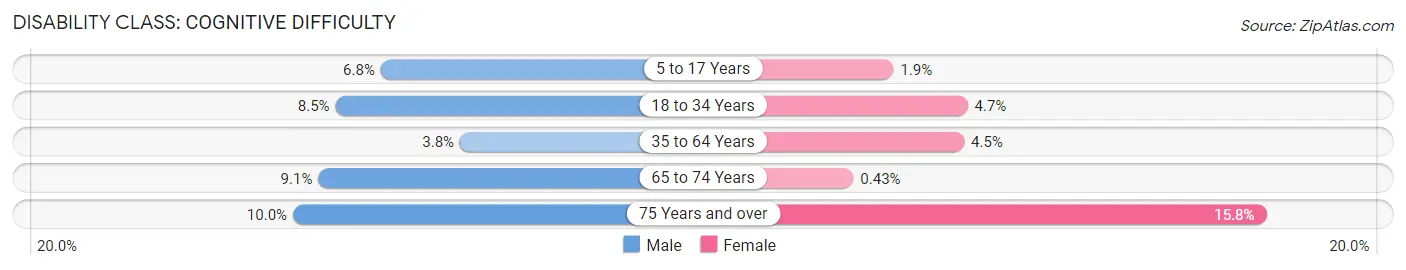
| Age Bracket | Male | Female |
| 5 to 17 Years | 316 (6.8%) | 73 (1.9%) |
| 18 to 34 Years | 473 (8.5%) | 233 (4.7%) |
| 35 to 64 Years | 232 (3.8%) | 248 (4.5%) |
| 65 to 74 Years | 83 (9.1%) | 5 (0.4%) |
| 75 Years and over | 70 (10.0%) | 122 (15.8%) |
Disability Class: Ambulatory Difficulty
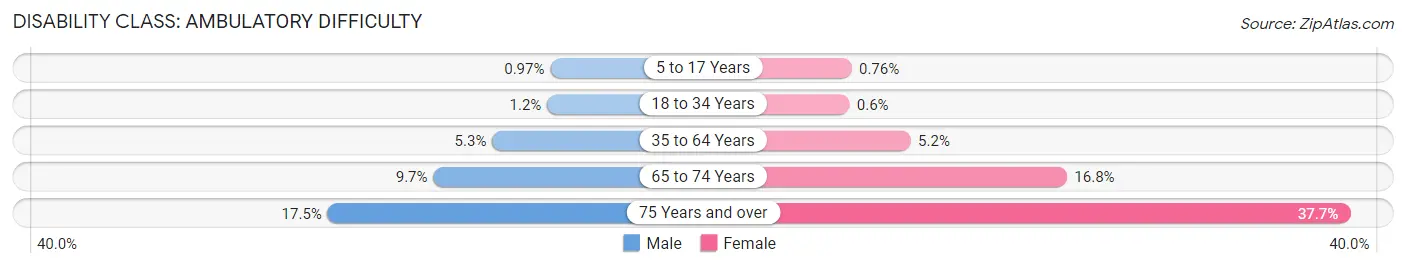
| Age Bracket | Male | Female |
| 5 to 17 Years | 45 (1.0%) | 29 (0.8%) |
| 18 to 34 Years | 67 (1.2%) | 30 (0.6%) |
| 35 to 64 Years | 319 (5.3%) | 281 (5.1%) |
| 65 to 74 Years | 88 (9.7%) | 194 (16.8%) |
| 75 Years and over | 122 (17.5%) | 292 (37.7%) |
Disability Class: Self-Care Difficulty
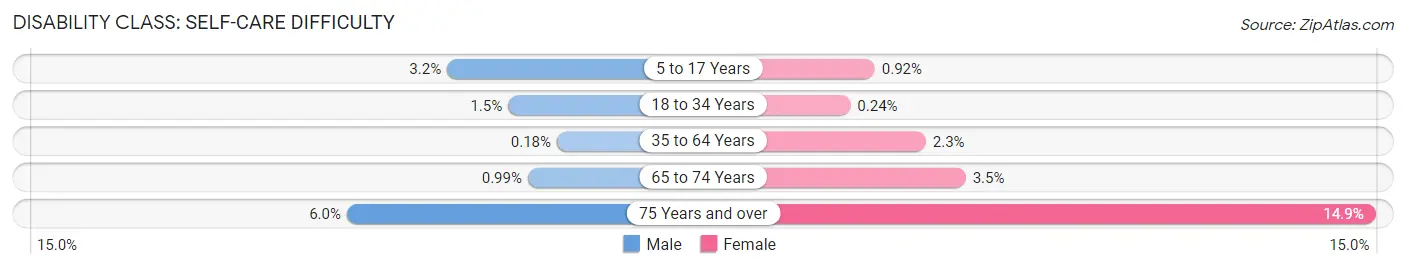
| Age Bracket | Male | Female |
| 5 to 17 Years | 151 (3.2%) | 35 (0.9%) |
| 18 to 34 Years | 86 (1.5%) | 12 (0.2%) |
| 35 to 64 Years | 11 (0.2%) | 128 (2.3%) |
| 65 to 74 Years | 9 (1.0%) | 40 (3.5%) |
| 75 Years and over | 42 (6.0%) | 115 (14.9%) |
Technology Access in Pleasant Grove
Computing Device Access in Pleasant Grove
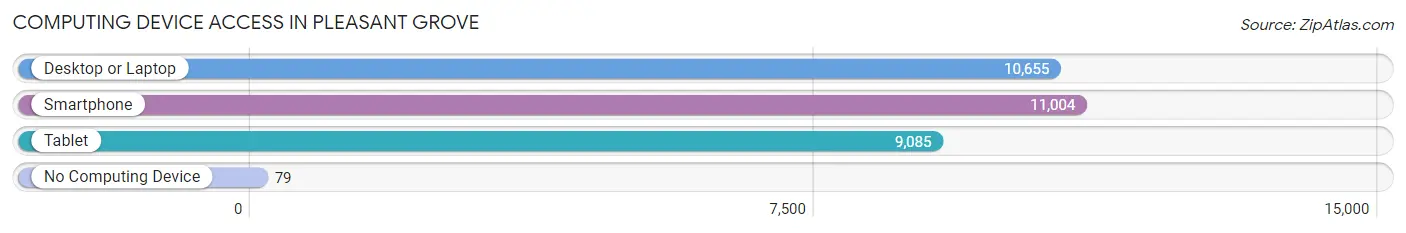
| Device Type | # Households | % Households |
| Desktop or Laptop | 10,655 | 92.7% |
| Smartphone | 11,004 | 95.8% |
| Tablet | 9,085 | 79.0% |
| No Computing Device | 79 | 0.7% |
| Total | 11,492 | 100.0% |
Internet Access in Pleasant Grove
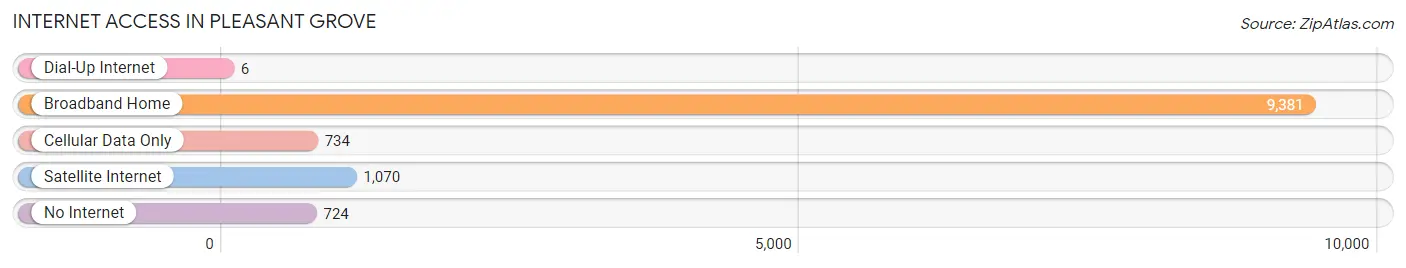
| Internet Type | # Households | % Households |
| Dial-Up Internet | 6 | 0.1% |
| Broadband Home | 9,381 | 81.6% |
| Cellular Data Only | 734 | 6.4% |
| Satellite Internet | 1,070 | 9.3% |
| No Internet | 724 | 6.3% |
| Total | 11,492 | 100.0% |
Pleasant Grove Summary
Pleasant Grove, Utah is a city located in Utah County, Utah, United States. It is part of the Provo-Orem Metropolitan Statistical Area. The population was 33,509 at the 2010 census, making it the ninth-largest city in Utah.
History
Pleasant Grove was first settled in 1850 by pioneers from the Church of Jesus Christ of Latter-day Saints. The city was originally named Battle Creek, after a nearby stream, but was later changed to Pleasant Grove due to the pleasant nature of the area. The city was incorporated in 1855 and has since grown to become one of the largest cities in Utah.
Geography
Pleasant Grove is located at 40°23'17" North, 111°41'17" West (40.3879, -111.6879). It is situated in the foothills of the Wasatch Mountains, at an elevation of 4,543 feet (1,386 m). The city covers an area of 11.6 square miles (30.1 km2).
Climate
Pleasant Grove has a humid continental climate, with cold, snowy winters and hot, dry summers. The average annual temperature is 46.2 °F (7.9 °C), with an average high of 68.2 °F (20.1 °C) and an average low of 24.2 °F (-4.4 °C). The average annual precipitation is 17.2 inches (437 mm).
Economy
Pleasant Grove is home to a variety of businesses, including retail stores, restaurants, and manufacturing companies. The city is also home to several large employers, including the Utah Valley University, the Utah Valley Regional Medical Center, and the Pleasant Grove City Corporation.
Demographics
As of the 2010 census, there were 33,509 people, 10,945 households, and 8,717 families residing in the city. The population density was 2,890.3 people per square mile (1,117.2/km2). The racial makeup of the city was 91.2% White, 0.7% African American, 0.5% Native American, 1.2% Asian, 0.2% Pacific Islander, 4.2% from other races, and 2.2% from two or more races. Hispanic or Latino of any race were 8.3% of the population.
The median income for a household in the city was $63,945, and the median income for a family was $71,945. Males had a median income of $50,945 versus $35,945 for females. The per capita income for the city was $25,945. About 4.2% of families and 6.2% of the population were below the poverty line, including 8.2% of those under age 18 and 4.2% of those age 65 or over.
Conclusion
Pleasant Grove, Utah is a city located in Utah County, Utah, United States. It is part of the Provo-Orem Metropolitan Statistical Area. The city was first settled in 1850 by pioneers from the Church of Jesus Christ of Latter-day Saints and has since grown to become one of the largest cities in Utah. Pleasant Grove has a humid continental climate, with cold, snowy winters and hot, dry summers. The city is home to a variety of businesses, including retail stores, restaurants, and manufacturing companies. As of the 2010 census, the population of Pleasant Grove was 33,509, with a median household income of $63,945.
Common Questions
What is Per Capita Income in Pleasant Grove?
Per Capita income in Pleasant Grove is $36,359.
What is the Median Family Income in Pleasant Grove?
Median Family Income in Pleasant Grove is $99,992.
What is the Median Household income in Pleasant Grove?
Median Household Income in Pleasant Grove is $91,322.
What is Income or Wage Gap in Pleasant Grove?
Income or Wage Gap in Pleasant Grove is 47.2%.
Women in Pleasant Grove earn 52.8 cents for every dollar earned by a man.
What is Family Income Deficit in Pleasant Grove?
Family Income Deficit in Pleasant Grove is $12,715.
Families that are below poverty line in Pleasant Grove earn $12,715 less on average than the poverty threshold level.
What is Inequality or Gini Index in Pleasant Grove?
Inequality or Gini Index in Pleasant Grove is 0.41.
What is the Total Population of Pleasant Grove?
Total Population of Pleasant Grove is 37,453.
What is the Total Male Population of Pleasant Grove?
Total Male Population of Pleasant Grove is 19,551.
What is the Total Female Population of Pleasant Grove?
Total Female Population of Pleasant Grove is 17,902.
What is the Ratio of Males per 100 Females in Pleasant Grove?
There are 109.21 Males per 100 Females in Pleasant Grove.
What is the Ratio of Females per 100 Males in Pleasant Grove?
There are 91.57 Females per 100 Males in Pleasant Grove.
What is the Median Population Age in Pleasant Grove?
Median Population Age in Pleasant Grove is 27.6 Years.
What is the Average Family Size in Pleasant Grove
Average Family Size in Pleasant Grove is 3.7 People.
What is the Average Household Size in Pleasant Grove
Average Household Size in Pleasant Grove is 3.2 People.
How Large is the Labor Force in Pleasant Grove?
There are 18,668 People in the Labor Forcein in Pleasant Grove.
What is the Percentage of People in the Labor Force in Pleasant Grove?
69.7% of People are in the Labor Force in Pleasant Grove.
What is the Unemployment Rate in Pleasant Grove?
Unemployment Rate in Pleasant Grove is 2.6%.