Cities with the Highest Percentage of Immigrants from Ukraine in Maryland
RELATED REPORTS & OPTIONS
Ukraine
Maryland
Compare Cities
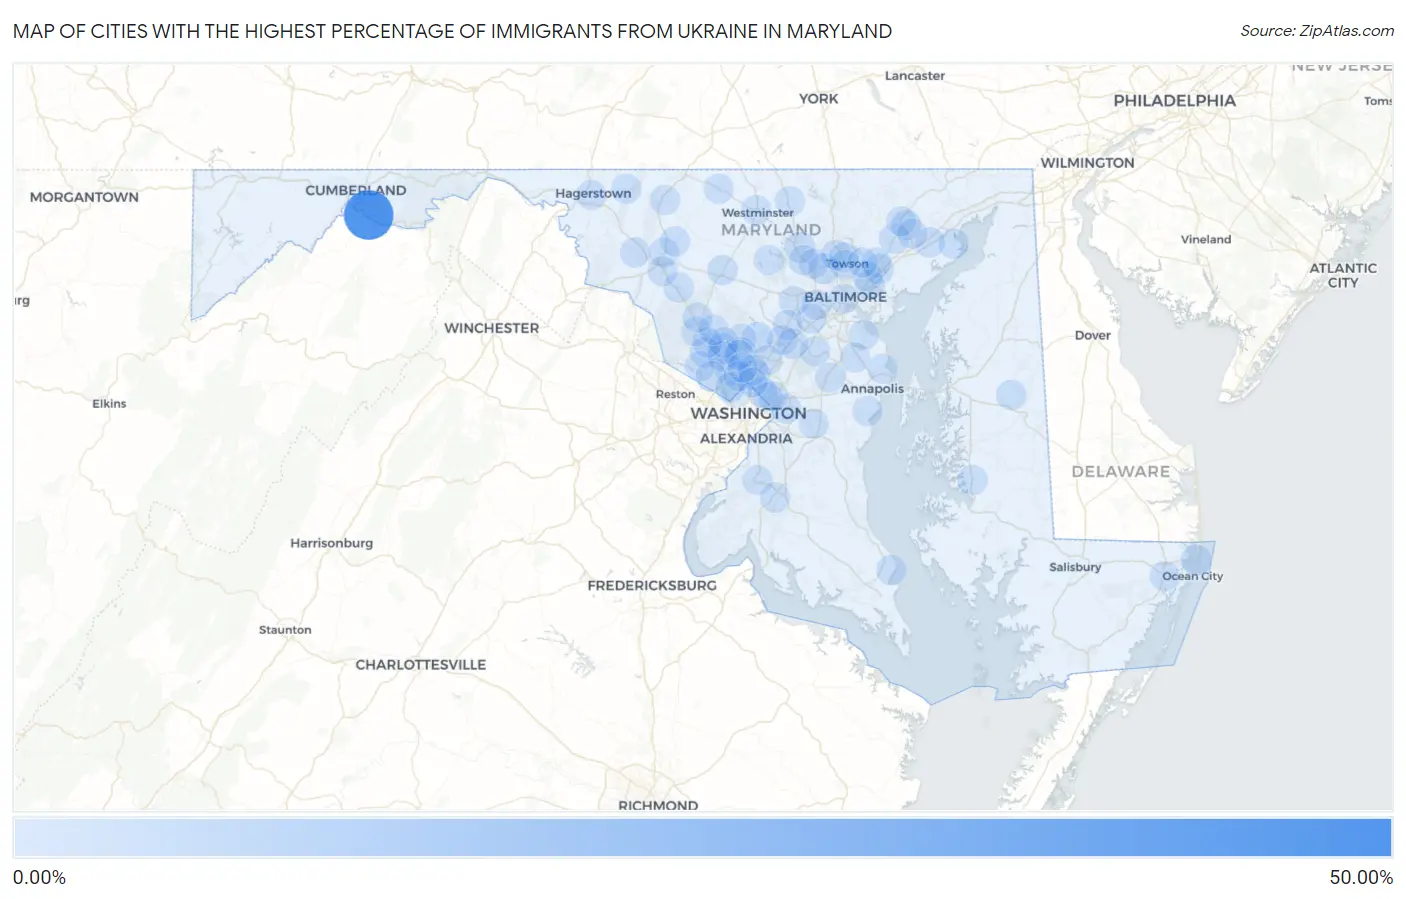
Map of Cities with the Highest Percentage of Immigrants from Ukraine in Maryland
0.00%
50.00%
Cities with the Highest Percentage of Immigrants from Ukraine in Maryland
| City | Ukraine | vs State | vs National | |
| 1. | Spring Gap | 50.00% | 0.10%(+49.9)#1 | 0.12%(+49.9)#1 |
| 2. | Ashton Sandy Spring | 2.13% | 0.10%(+2.03)#2 | 0.12%(+2.02)#127 |
| 3. | Reisterstown | 1.87% | 0.10%(+1.77)#3 | 0.12%(+1.76)#156 |
| 4. | Pikesville | 1.79% | 0.10%(+1.69)#4 | 0.12%(+1.68)#171 |
| 5. | Derwood | 1.78% | 0.10%(+1.68)#5 | 0.12%(+1.67)#172 |
| 6. | Ocean City | 1.54% | 0.10%(+1.44)#6 | 0.12%(+1.43)#214 |
| 7. | North Laurel | 1.31% | 0.10%(+1.21)#7 | 0.12%(+1.20)#258 |
| 8. | Leisure World | 1.04% | 0.10%(+0.934)#8 | 0.12%(+0.920)#341 |
| 9. | Mays Chapel | 0.83% | 0.10%(+0.727)#9 | 0.12%(+0.713)#421 |
| 10. | Urbana | 0.79% | 0.10%(+0.690)#10 | 0.12%(+0.677)#450 |
| 11. | North Potomac | 0.76% | 0.10%(+0.655)#11 | 0.12%(+0.642)#470 |
| 12. | North Bethesda | 0.60% | 0.10%(+0.502)#12 | 0.12%(+0.489)#600 |
| 13. | Redland | 0.56% | 0.10%(+0.459)#13 | 0.12%(+0.446)#645 |
| 14. | Mount Airy | 0.53% | 0.10%(+0.425)#14 | 0.12%(+0.412)#687 |
| 15. | Ridgely | 0.52% | 0.10%(+0.418)#15 | 0.12%(+0.405)#694 |
| 16. | Four Corners | 0.46% | 0.10%(+0.361)#16 | 0.12%(+0.348)#770 |
| 17. | Middletown | 0.46% | 0.10%(+0.359)#17 | 0.12%(+0.346)#774 |
| 18. | Aberdeen Proving Ground | 0.44% | 0.10%(+0.341)#18 | 0.12%(+0.328)#804 |
| 19. | Rockville | 0.43% | 0.10%(+0.332)#19 | 0.12%(+0.319)#816 |
| 20. | Potomac | 0.43% | 0.10%(+0.327)#20 | 0.12%(+0.314)#821 |
| 21. | Friendship Heights Village | 0.42% | 0.10%(+0.314)#21 | 0.12%(+0.301)#845 |
| 22. | Trappe | 0.39% | 0.10%(+0.290)#22 | 0.12%(+0.277)#899 |
| 23. | Thurmont | 0.36% | 0.10%(+0.262)#23 | 0.12%(+0.249)#958 |
| 24. | Travilah | 0.35% | 0.10%(+0.248)#24 | 0.12%(+0.235)#985 |
| 25. | Fort Meade | 0.35% | 0.10%(+0.247)#25 | 0.12%(+0.234)#989 |
| 26. | Chesapeake Ranch Estates | 0.33% | 0.10%(+0.227)#26 | 0.12%(+0.214)#1,023 |
| 27. | Olney | 0.28% | 0.10%(+0.176)#27 | 0.12%(+0.163)#1,139 |
| 28. | Gaithersburg | 0.27% | 0.10%(+0.165)#28 | 0.12%(+0.152)#1,167 |
| 29. | Bethesda | 0.26% | 0.10%(+0.160)#29 | 0.12%(+0.147)#1,177 |
| 30. | Owings Mills | 0.25% | 0.10%(+0.146)#30 | 0.12%(+0.133)#1,228 |
| 31. | Frederick | 0.23% | 0.10%(+0.132)#31 | 0.12%(+0.119)#1,275 |
| 32. | Pleasant Hills | 0.23% | 0.10%(+0.127)#32 | 0.12%(+0.114)#1,297 |
| 33. | Bel Air | 0.20% | 0.10%(+0.095)#33 | 0.12%(+0.082)#1,413 |
| 34. | Ilchester | 0.19% | 0.10%(+0.091)#34 | 0.12%(+0.078)#1,430 |
| 35. | Brentwood | 0.19% | 0.10%(+0.082)#35 | 0.12%(+0.069)#1,470 |
| 36. | Chevy Chase View | 0.18% | 0.10%(+0.075)#36 | 0.12%(+0.062)#1,505 |
| 37. | Edmonston | 0.17% | 0.10%(+0.069)#37 | 0.12%(+0.056)#1,537 |
| 38. | Brock Hall | 0.17% | 0.10%(+0.065)#38 | 0.12%(+0.052)#1,557 |
| 39. | Smithsburg | 0.17% | 0.10%(+0.062)#39 | 0.12%(+0.049)#1,573 |
| 40. | Hampstead | 0.16% | 0.10%(+0.057)#40 | 0.12%(+0.044)#1,588 |
| 41. | Accokeek | 0.14% | 0.10%(+0.039)#41 | 0.12%(+0.025)#1,678 |
| 42. | Berlin | 0.14% | 0.10%(+0.036)#42 | 0.12%(+0.023)#1,692 |
| 43. | White Marsh | 0.14% | 0.10%(+0.033)#43 | 0.12%(+0.020)#1,705 |
| 44. | Riverside | 0.14% | 0.10%(+0.032)#44 | 0.12%(+0.019)#1,707 |
| 45. | Aspen Hill | 0.13% | 0.10%(+0.028)#45 | 0.12%(+0.015)#1,727 |
| 46. | Hagerstown | 0.13% | 0.10%(+0.026)#46 | 0.12%(+0.013)#1,738 |
| 47. | Bel Air South | 0.12% | 0.10%(+0.020)#47 | 0.12%(+0.007)#1,777 |
| 48. | Eldersburg | 0.12% | 0.10%(+0.019)#48 | 0.12%(+0.006)#1,781 |
| 49. | Mayo | 0.12% | 0.10%(+0.018)#49 | 0.12%(+0.005)#1,787 |
| 50. | Perry Hall | 0.12% | 0.10%(+0.014)#50 | 0.12%(+0.000)#1,821 |
| 51. | Towson | 0.11% | 0.10%(+0.012)#51 | 0.12%(-0.001)#1,830 |
| 52. | Walkersville | 0.11% | 0.10%(+0.010)#52 | 0.12%(-0.004)#1,840 |
| 53. | Germantown | 0.11% | 0.10%(+0.009)#53 | 0.12%(-0.004)#1,845 |
| 54. | Taneytown | 0.11% | 0.10%(+0.008)#54 | 0.12%(-0.005)#1,857 |
| 55. | Cape St Claire | 0.11% | 0.10%(+0.006)#55 | 0.12%(-0.007)#1,873 |
| 56. | Garrison | 0.10% | 0.10%(-0.000)#56 | 0.12%(-0.013)#1,918 |
| 57. | Ellicott City | 0.098% | 0.10%(-0.005)#57 | 0.12%(-0.018)#1,949 |
| 58. | Montgomery Village | 0.089% | 0.10%(-0.013)#58 | 0.12%(-0.027)#2,004 |
| 59. | Green Valley | 0.085% | 0.10%(-0.018)#59 | 0.12%(-0.031)#2,037 |
| 60. | Columbia | 0.079% | 0.10%(-0.024)#60 | 0.12%(-0.037)#2,089 |
| 61. | Crofton | 0.078% | 0.10%(-0.024)#61 | 0.12%(-0.037)#2,096 |
| 62. | Overlea | 0.078% | 0.10%(-0.025)#62 | 0.12%(-0.038)#2,099 |
| 63. | Ballenger Creek | 0.074% | 0.10%(-0.029)#63 | 0.12%(-0.042)#2,136 |
| 64. | Kemp Mill | 0.071% | 0.10%(-0.032)#64 | 0.12%(-0.045)#2,152 |
| 65. | Catonsville | 0.070% | 0.10%(-0.033)#65 | 0.12%(-0.046)#2,163 |
| 66. | Riviera Beach | 0.058% | 0.10%(-0.045)#66 | 0.12%(-0.058)#2,283 |
| 67. | Clarksburg | 0.056% | 0.10%(-0.046)#67 | 0.12%(-0.059)#2,293 |
| 68. | Summerfield | 0.056% | 0.10%(-0.046)#68 | 0.12%(-0.059)#2,294 |
| 69. | Rosedale | 0.050% | 0.10%(-0.053)#69 | 0.12%(-0.066)#2,357 |
| 70. | Westminster | 0.050% | 0.10%(-0.053)#70 | 0.12%(-0.066)#2,360 |
| 71. | Scaggsville | 0.046% | 0.10%(-0.056)#71 | 0.12%(-0.069)#2,391 |
| 72. | Lutherville | 0.045% | 0.10%(-0.057)#72 | 0.12%(-0.070)#2,400 |
| 73. | Baltimore | 0.039% | 0.10%(-0.064)#73 | 0.12%(-0.077)#2,472 |
| 74. | Chillum | 0.036% | 0.10%(-0.066)#74 | 0.12%(-0.080)#2,500 |
| 75. | Fairland | 0.031% | 0.10%(-0.072)#75 | 0.12%(-0.085)#2,571 |
| 76. | Severna Park | 0.027% | 0.10%(-0.075)#76 | 0.12%(-0.089)#2,612 |
| 77. | Carney | 0.024% | 0.10%(-0.079)#77 | 0.12%(-0.092)#2,643 |
| 78. | Silver Spring | 0.020% | 0.10%(-0.083)#78 | 0.12%(-0.096)#2,697 |
| 79. | Bel Air North | 0.019% | 0.10%(-0.084)#79 | 0.12%(-0.097)#2,703 |
| 80. | Wheaton | 0.015% | 0.10%(-0.088)#80 | 0.12%(-0.101)#2,745 |
| 81. | Waldorf | 0.0074% | 0.10%(-0.095)#81 | 0.12%(-0.108)#2,825 |
Common Questions
What are the Top 10 Cities with the Highest Percentage of Immigrants from Ukraine in Maryland?
Top 10 Cities with the Highest Percentage of Immigrants from Ukraine in Maryland are:
#1
50.00%
#2
2.13%
#3
1.87%
#4
1.79%
#5
1.78%
#6
1.54%
#7
1.31%
#8
1.04%
#9
0.83%
#10
0.79%
What city has the Highest Percentage of Immigrants from Ukraine in Maryland?
Spring Gap has the Highest Percentage of Immigrants from Ukraine in Maryland with 50.00%.
What is the Percentage of Immigrants from Ukraine in the State of Maryland?
Percentage of Immigrants from Ukraine in Maryland is 0.10%.
What is the Percentage of Immigrants from Ukraine in the United States?
Percentage of Immigrants from Ukraine in the United States is 0.12%.