Buckley, MI Map & Demographics
Buckley Map
Buckley Overview
$21,940
PER CAPITA INCOME
$67,708
AVG FAMILY INCOME
$64,931
AVG HOUSEHOLD INCOME
7.7%
WAGE / INCOME GAP [ % ]
92.3¢/ $1
WAGE / INCOME GAP [ $ ]
0.30
INEQUALITY / GINI INDEX
874
TOTAL POPULATION
508
MALE POPULATION
366
FEMALE POPULATION
138.80
MALES / 100 FEMALES
72.05
FEMALES / 100 MALES
31.4
MEDIAN AGE
4.1
AVG FAMILY SIZE
3.5
AVG HOUSEHOLD SIZE
381
LABOR FORCE [ PEOPLE ]
62.4%
PERCENT IN LABOR FORCE
6.3%
UNEMPLOYMENT RATE
Buckley Zip Codes
Buckley Area Codes
Income in Buckley
Income Overview in Buckley
Per Capita Income in Buckley is $21,940, while median incomes of families and households are $67,708 and $64,931 respectively.
| Characteristic | Number | Measure |
| Per Capita Income | 874 | $21,940 |
| Median Family Income | 190 | $67,708 |
| Mean Family Income | 190 | $79,072 |
| Median Household Income | 247 | $64,931 |
| Mean Household Income | 247 | $75,640 |
| Income Deficit | 190 | $0 |
| Wage / Income Gap (%) | 874 | 7.73% |
| Wage / Income Gap ($) | 874 | 92.27¢ per $1 |
| Gini / Inequality Index | 874 | 0.30 |
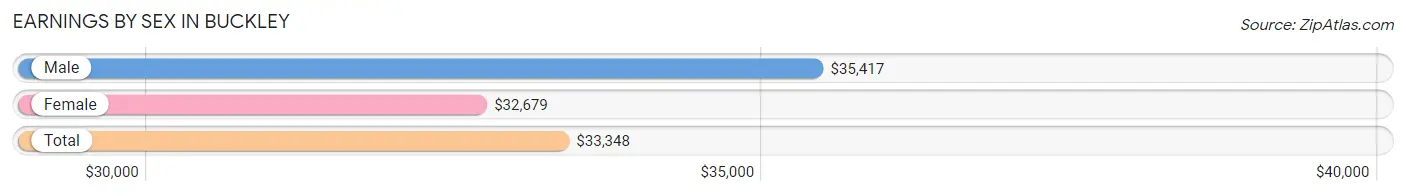
Earnings by Sex in Buckley
Average Earnings in Buckley are $33,348, $35,417 for men and $32,679 for women, a difference of 7.7%.
| Sex | Number | Average Earnings |
| Male | 230 (58.2%) | $35,417 |
| Female | 165 (41.8%) | $32,679 |
| Total | 395 (100.0%) | $33,348 |
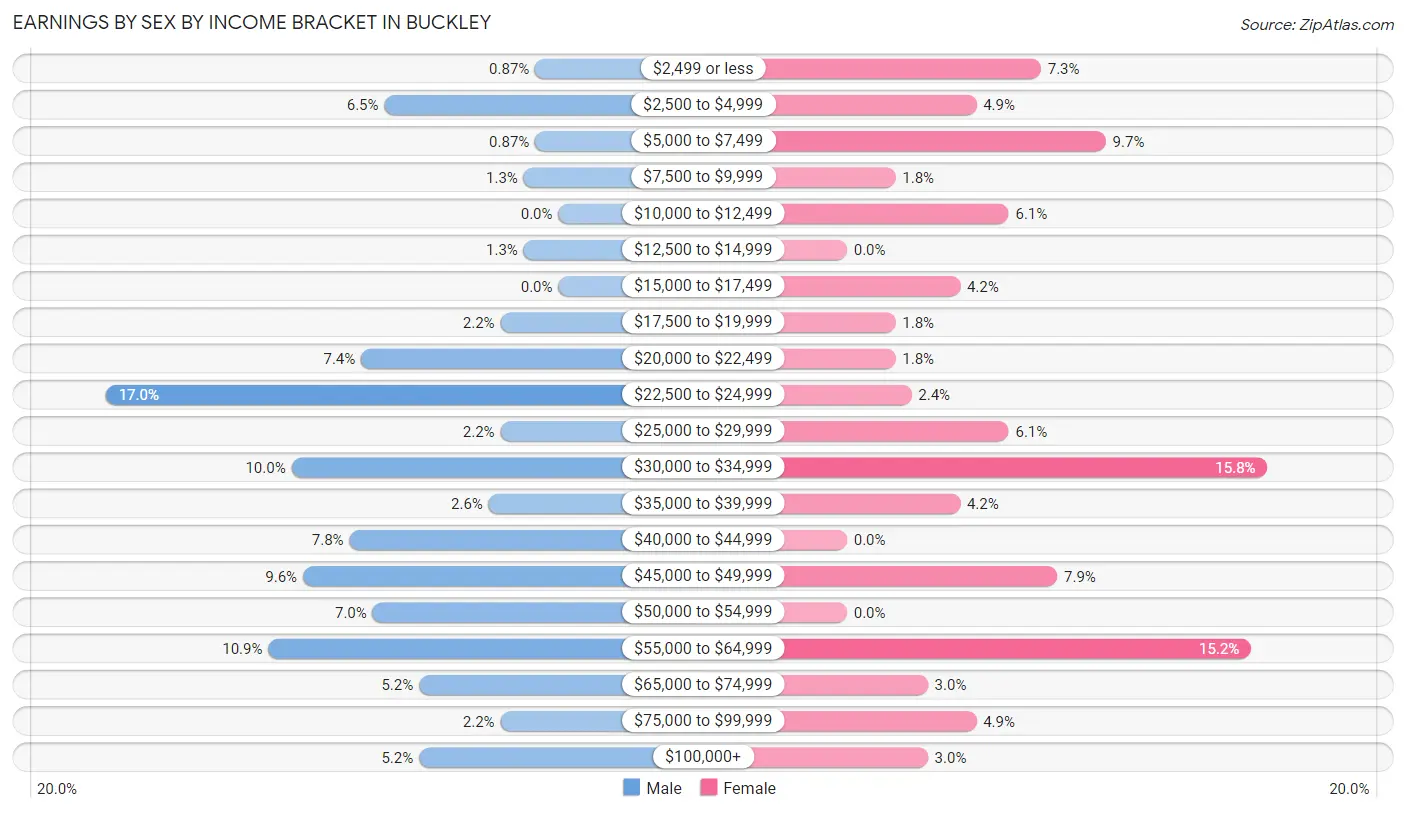
Earnings by Sex by Income Bracket in Buckley
The most common earnings brackets in Buckley are $22,500 to $24,999 for men (39 | 17.0%) and $30,000 to $34,999 for women (26 | 15.8%).
| Income | Male | Female |
| $2,499 or less | 2 (0.9%) | 12 (7.3%) |
| $2,500 to $4,999 | 15 (6.5%) | 8 (4.9%) |
| $5,000 to $7,499 | 2 (0.9%) | 16 (9.7%) |
| $7,500 to $9,999 | 3 (1.3%) | 3 (1.8%) |
| $10,000 to $12,499 | 0 (0.0%) | 10 (6.1%) |
| $12,500 to $14,999 | 3 (1.3%) | 0 (0.0%) |
| $15,000 to $17,499 | 0 (0.0%) | 7 (4.2%) |
| $17,500 to $19,999 | 5 (2.2%) | 3 (1.8%) |
| $20,000 to $22,499 | 17 (7.4%) | 3 (1.8%) |
| $22,500 to $24,999 | 39 (17.0%) | 4 (2.4%) |
| $25,000 to $29,999 | 5 (2.2%) | 10 (6.1%) |
| $30,000 to $34,999 | 23 (10.0%) | 26 (15.8%) |
| $35,000 to $39,999 | 6 (2.6%) | 7 (4.2%) |
| $40,000 to $44,999 | 18 (7.8%) | 0 (0.0%) |
| $45,000 to $49,999 | 22 (9.6%) | 13 (7.9%) |
| $50,000 to $54,999 | 16 (7.0%) | 0 (0.0%) |
| $55,000 to $64,999 | 25 (10.9%) | 25 (15.1%) |
| $65,000 to $74,999 | 12 (5.2%) | 5 (3.0%) |
| $75,000 to $99,999 | 5 (2.2%) | 8 (4.9%) |
| $100,000+ | 12 (5.2%) | 5 (3.0%) |
| Total | 230 (100.0%) | 165 (100.0%) |
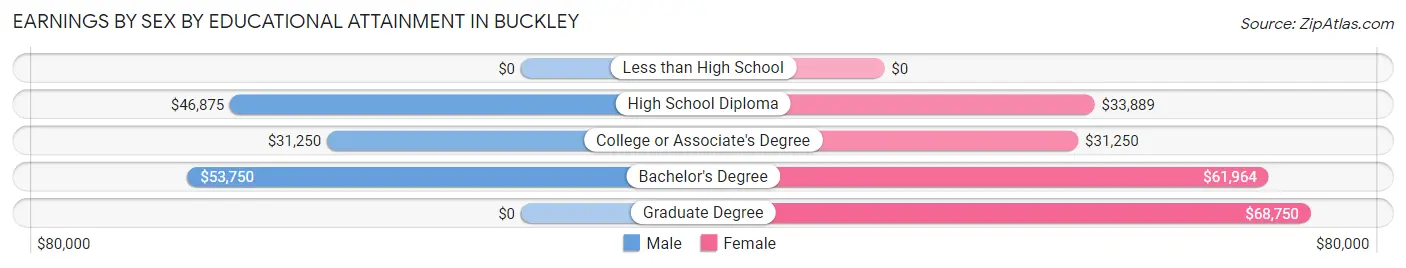
Earnings by Sex by Educational Attainment in Buckley
Average earnings in Buckley are $36,458 for men and $35,000 for women, a difference of 4.0%. Men with an educational attainment of bachelor's degree enjoy the highest average annual earnings of $53,750, while those with college or associate's degree education earn the least with $31,250. Women with an educational attainment of graduate degree earn the most with the average annual earnings of $68,750, while those with college or associate's degree education have the smallest earnings of $31,250.
| Educational Attainment | Male Income | Female Income |
| Less than High School | - | - |
| High School Diploma | $46,875 | $33,889 |
| College or Associate's Degree | $31,250 | $31,250 |
| Bachelor's Degree | $53,750 | $61,964 |
| Graduate Degree | - | - |
| Total | $36,458 | $35,000 |
Family Income in Buckley
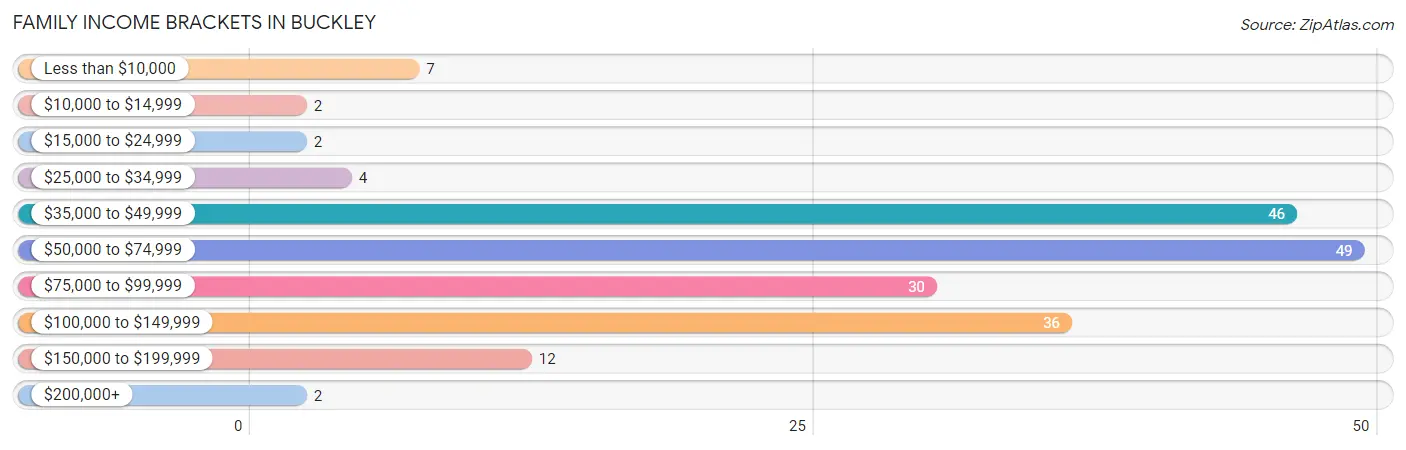
Family Income Brackets in Buckley
According to the Buckley family income data, there are 49 families falling into the $50,000 to $74,999 income range, which is the most common income bracket and makes up 25.8% of all families. Conversely, the $10,000 to $14,999 income bracket is the least frequent group with only 2 families (1.1%) belonging to this category.
| Income Bracket | # Families | % Families |
| Less than $10,000 | 7 | 3.7% |
| $10,000 to $14,999 | 2 | 1.1% |
| $15,000 to $24,999 | 2 | 1.1% |
| $25,000 to $34,999 | 4 | 2.1% |
| $35,000 to $49,999 | 46 | 24.2% |
| $50,000 to $74,999 | 49 | 25.8% |
| $75,000 to $99,999 | 30 | 15.8% |
| $100,000 to $149,999 | 36 | 18.9% |
| $150,000 to $199,999 | 12 | 6.3% |
| $200,000+ | 2 | 1.1% |
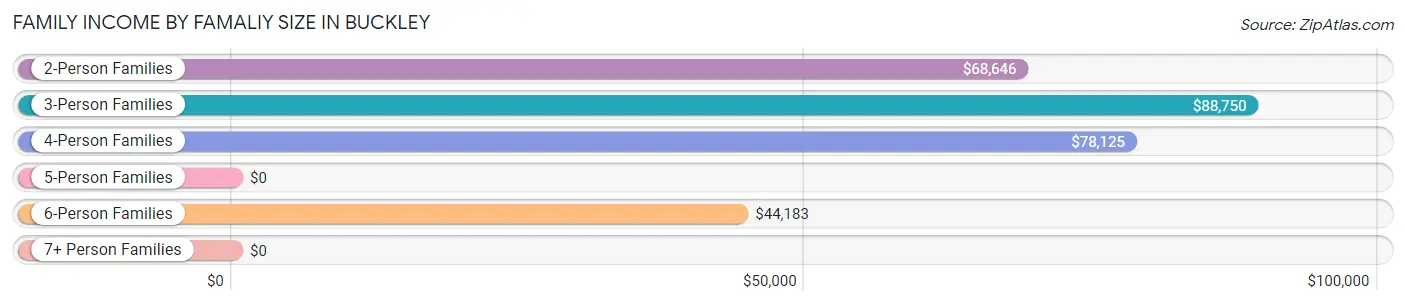
Family Income by Famaliy Size in Buckley
3-person families (44 | 23.2%) account for the highest median family income in Buckley with $88,750 per family, while 2-person families (69 | 36.3%) have the highest median income of $34,323 per family member.
| Income Bracket | # Families | Median Income |
| 2-Person Families | 69 (36.3%) | $68,646 |
| 3-Person Families | 44 (23.2%) | $88,750 |
| 4-Person Families | 15 (7.9%) | $78,125 |
| 5-Person Families | 4 (2.1%) | $0 |
| 6-Person Families | 35 (18.4%) | $44,183 |
| 7+ Person Families | 23 (12.1%) | $0 |
| Total | 190 (100.0%) | $67,708 |
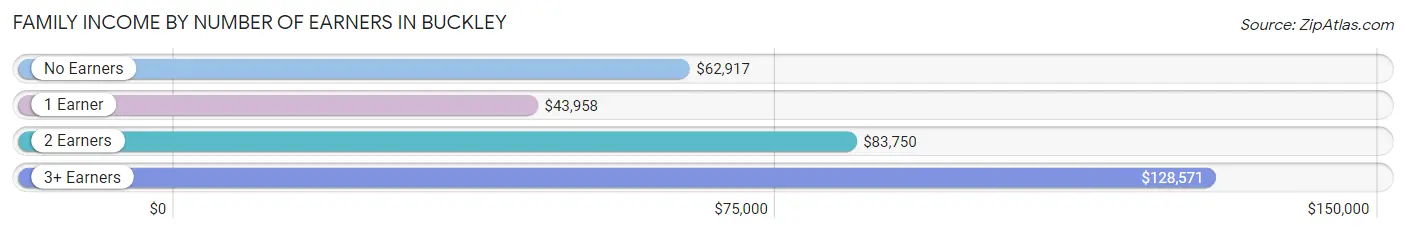
Family Income by Number of Earners in Buckley
The median family income in Buckley is $67,708, with families comprising 3+ earners (28) having the highest median family income of $128,571, while families with 1 earner (64) have the lowest median family income of $43,958, accounting for 14.7% and 33.7% of families, respectively.
| Number of Earners | # Families | Median Income |
| No Earners | 27 (14.2%) | $62,917 |
| 1 Earner | 64 (33.7%) | $43,958 |
| 2 Earners | 71 (37.4%) | $83,750 |
| 3+ Earners | 28 (14.7%) | $128,571 |
| Total | 190 (100.0%) | $67,708 |
Household Income in Buckley
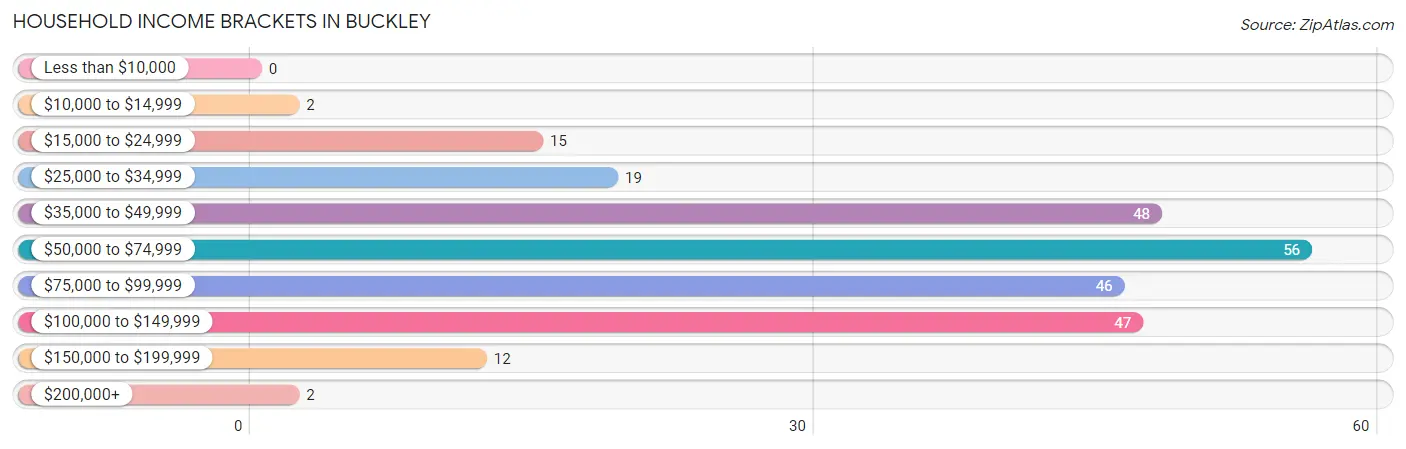
Household Income Brackets in Buckley
With 56 households falling in the category, the $50,000 to $74,999 income range is the most frequent in Buckley, accounting for 22.7% of all households.
| Income Bracket | # Households | % Households |
| Less than $10,000 | 0 | 0.0% |
| $10,000 to $14,999 | 2 | 0.8% |
| $15,000 to $24,999 | 15 | 6.1% |
| $25,000 to $34,999 | 19 | 7.7% |
| $35,000 to $49,999 | 48 | 19.4% |
| $50,000 to $74,999 | 56 | 22.7% |
| $75,000 to $99,999 | 46 | 18.6% |
| $100,000 to $149,999 | 47 | 19.0% |
| $150,000 to $199,999 | 12 | 4.9% |
| $200,000+ | 2 | 0.8% |
Household Income by Householder Age in Buckley
The median household income in Buckley is $64,931, with the highest median household income of $71,875 found in the 25 to 44 years age bracket for the primary householder. A total of 109 households (44.1%) fall into this category. Meanwhile, the 15 to 24 years age bracket for the primary householder has the lowest median household income of $52,321, with 15 households (6.1%) in this group.
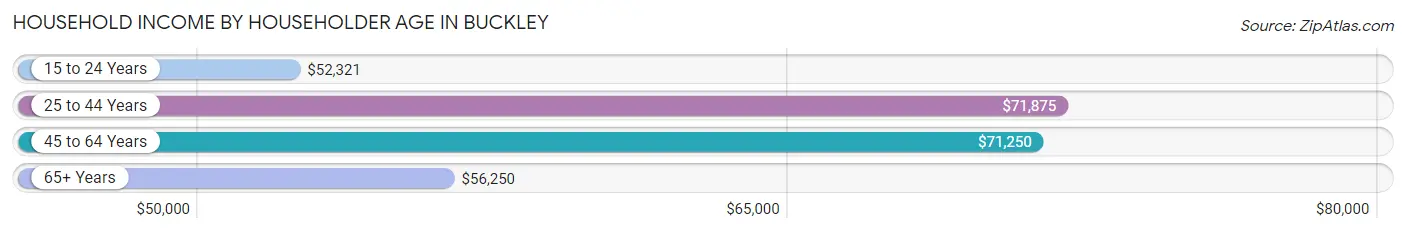
| Income Bracket | # Households | Median Income |
| 15 to 24 Years | 15 (6.1%) | $52,321 |
| 25 to 44 Years | 109 (44.1%) | $71,875 |
| 45 to 64 Years | 71 (28.7%) | $71,250 |
| 65+ Years | 52 (21.0%) | $56,250 |
| Total | 247 (100.0%) | $64,931 |
Poverty in Buckley
Income Below Poverty by Sex and Age in Buckley
With 3.0% poverty level for males and 10.4% for females among the residents of Buckley, 18 to 24 year old males and under 5 year old females are the most vulnerable to poverty, with 2 males (9.1%) and 12 females (42.9%) in their respective age groups living below the poverty level.
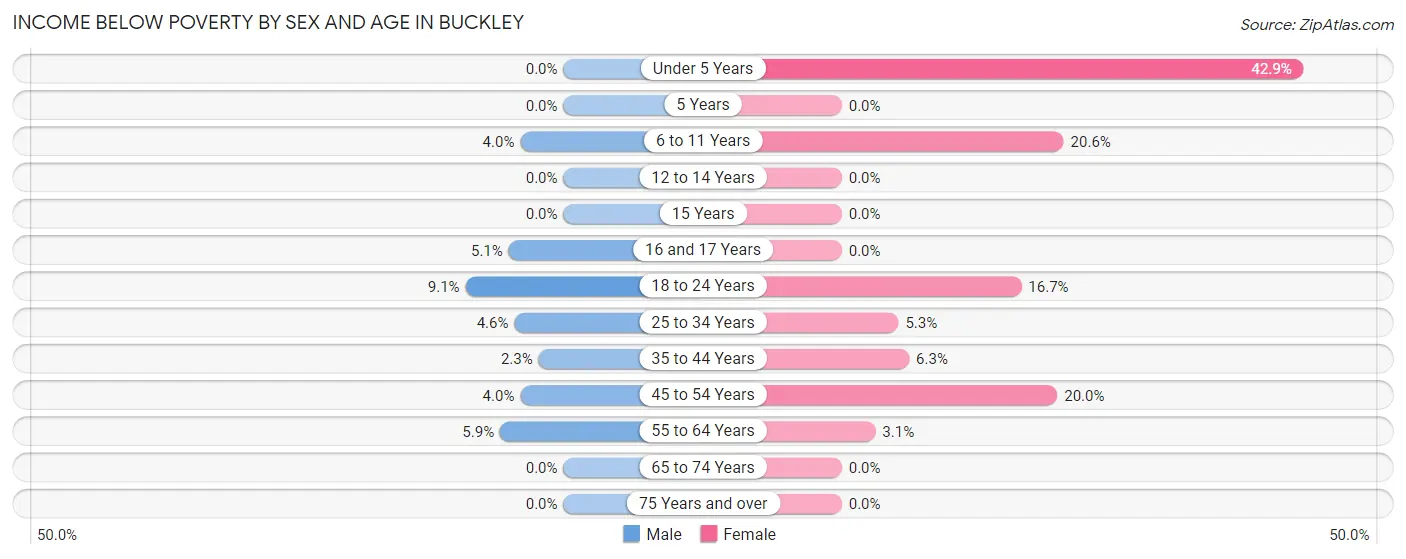
| Age Bracket | Male | Female |
| Under 5 Years | 0 (0.0%) | 12 (42.9%) |
| 5 Years | 0 (0.0%) | 0 (0.0%) |
| 6 to 11 Years | 2 (4.0%) | 7 (20.6%) |
| 12 to 14 Years | 0 (0.0%) | 0 (0.0%) |
| 15 Years | 0 (0.0%) | 0 (0.0%) |
| 16 and 17 Years | 3 (5.1%) | 0 (0.0%) |
| 18 to 24 Years | 2 (9.1%) | 7 (16.7%) |
| 25 to 34 Years | 2 (4.5%) | 1 (5.3%) |
| 35 to 44 Years | 2 (2.3%) | 7 (6.2%) |
| 45 to 54 Years | 2 (4.0%) | 3 (20.0%) |
| 55 to 64 Years | 2 (5.9%) | 1 (3.1%) |
| 65 to 74 Years | 0 (0.0%) | 0 (0.0%) |
| 75 Years and over | 0 (0.0%) | 0 (0.0%) |
| Total | 15 (3.0%) | 38 (10.4%) |
Income Above Poverty by Sex and Age in Buckley
According to the poverty statistics in Buckley, males aged under 5 years and females aged 5 years are the age groups that are most secure financially, with 100.0% of males and 100.0% of females in these age groups living above the poverty line.
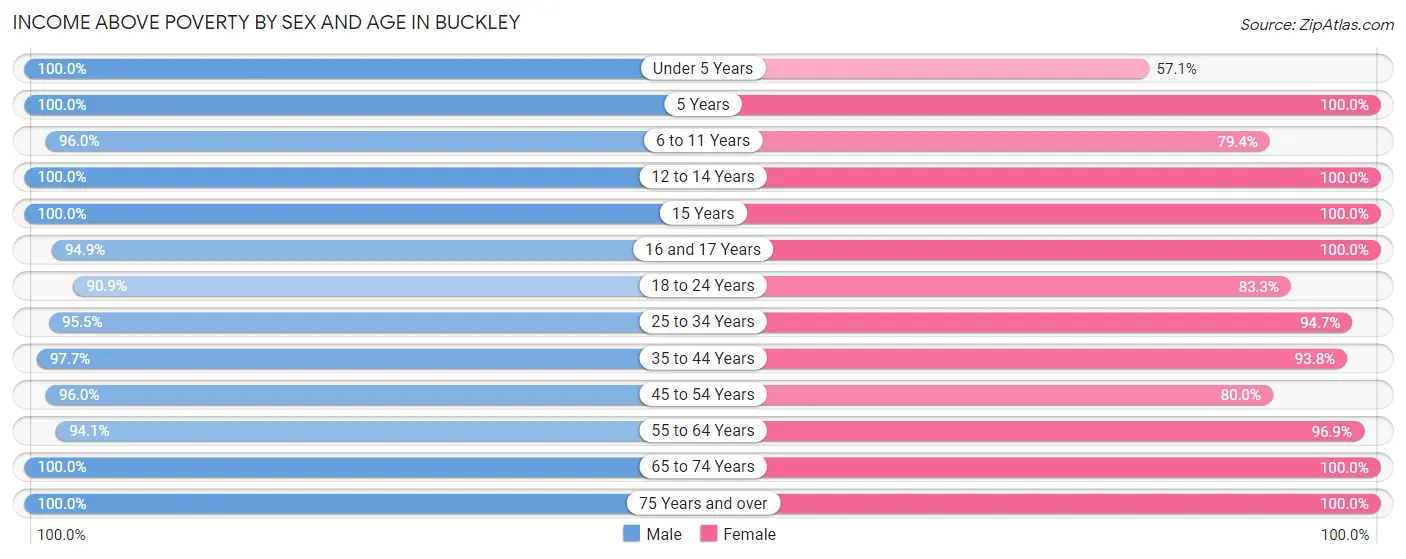
| Age Bracket | Male | Female |
| Under 5 Years | 38 (100.0%) | 16 (57.1%) |
| 5 Years | 4 (100.0%) | 10 (100.0%) |
| 6 to 11 Years | 48 (96.0%) | 27 (79.4%) |
| 12 to 14 Years | 54 (100.0%) | 23 (100.0%) |
| 15 Years | 15 (100.0%) | 3 (100.0%) |
| 16 and 17 Years | 56 (94.9%) | 12 (100.0%) |
| 18 to 24 Years | 20 (90.9%) | 35 (83.3%) |
| 25 to 34 Years | 42 (95.5%) | 18 (94.7%) |
| 35 to 44 Years | 85 (97.7%) | 105 (93.8%) |
| 45 to 54 Years | 48 (96.0%) | 12 (80.0%) |
| 55 to 64 Years | 32 (94.1%) | 31 (96.9%) |
| 65 to 74 Years | 35 (100.0%) | 26 (100.0%) |
| 75 Years and over | 12 (100.0%) | 10 (100.0%) |
| Total | 489 (97.0%) | 328 (89.6%) |
Income Below Poverty Among Married-Couple Families in Buckley
The poverty statistics for married-couple families in Buckley show that 3.5% or 6 of the total 169 families live below the poverty line. Families with 5 or more children have the highest poverty rate of 11.8%, comprising of 2 families. On the other hand, families with 3 or 4 children have the lowest poverty rate of 0.0%, which includes 0 families.
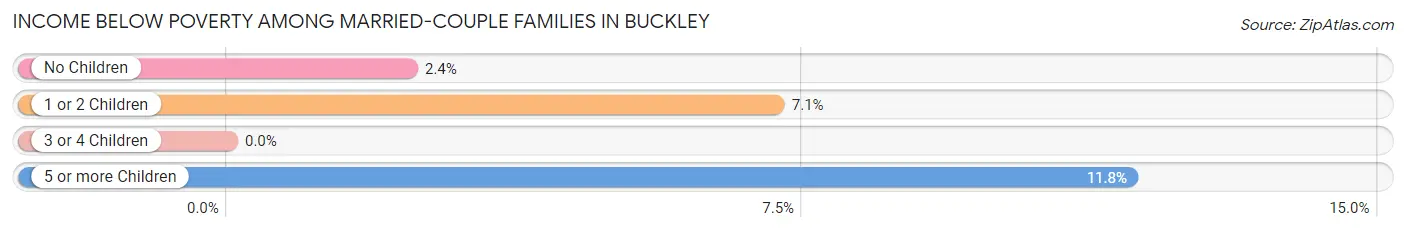
| Children | Above Poverty | Below Poverty |
| No Children | 83 (97.7%) | 2 (2.4%) |
| 1 or 2 Children | 26 (92.9%) | 2 (7.1%) |
| 3 or 4 Children | 39 (100.0%) | 0 (0.0%) |
| 5 or more Children | 15 (88.2%) | 2 (11.8%) |
| Total | 163 (96.5%) | 6 (3.5%) |
Income Below Poverty Among Single-Parent Households in Buckley
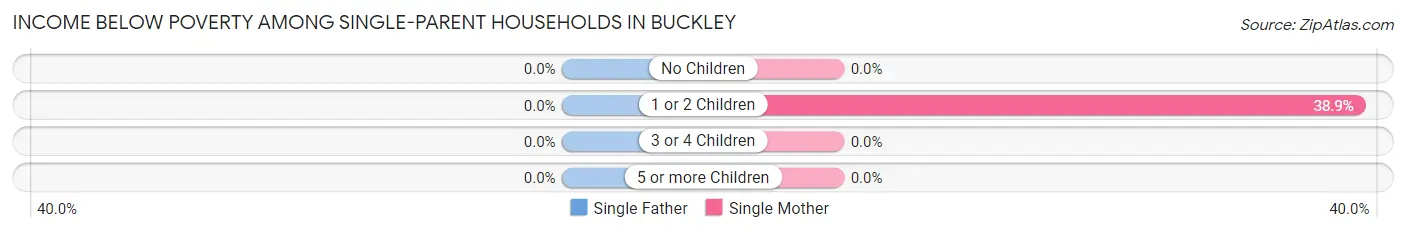
| Children | Single Father | Single Mother |
| No Children | 0 (0.0%) | 0 (0.0%) |
| 1 or 2 Children | 0 (0.0%) | 7 (38.9%) |
| 3 or 4 Children | 0 (0.0%) | 0 (0.0%) |
| 5 or more Children | 0 (0.0%) | 0 (0.0%) |
| Total | 0 (0.0%) | 7 (36.8%) |
Income Below Poverty Among Married-Couple vs Single-Parent Households in Buckley
The poverty data for Buckley shows that 6 of the married-couple family households (3.5%) and 7 of the single-parent households (33.3%) are living below the poverty level. Within the married-couple family households, those with 5 or more children have the highest poverty rate, with 2 households (11.8%) falling below the poverty line. Among the single-parent households, those with 1 or 2 children have the highest poverty rate, with 7 household (38.9%) living below poverty.
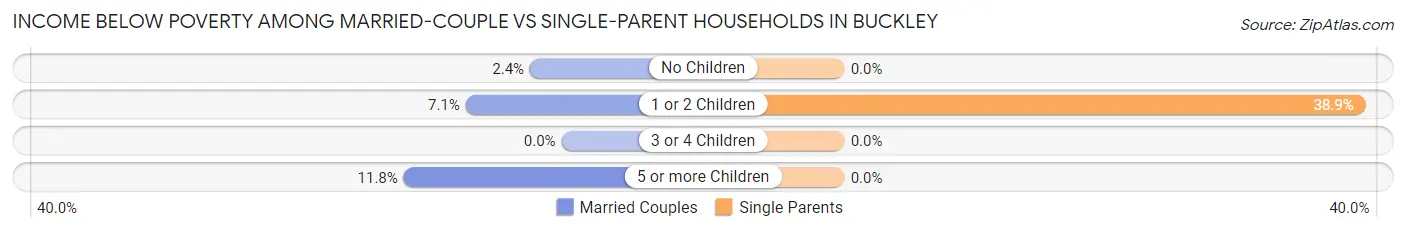
| Children | Married-Couple Families | Single-Parent Households |
| No Children | 2 (2.4%) | 0 (0.0%) |
| 1 or 2 Children | 2 (7.1%) | 7 (38.9%) |
| 3 or 4 Children | 0 (0.0%) | 0 (0.0%) |
| 5 or more Children | 2 (11.8%) | 0 (0.0%) |
| Total | 6 (3.5%) | 7 (33.3%) |
Race in Buckley
The most populous races in Buckley are White / Caucasian (853 | 97.6%), Two or more Races (14 | 1.6%), and Asian (6 | 0.7%).
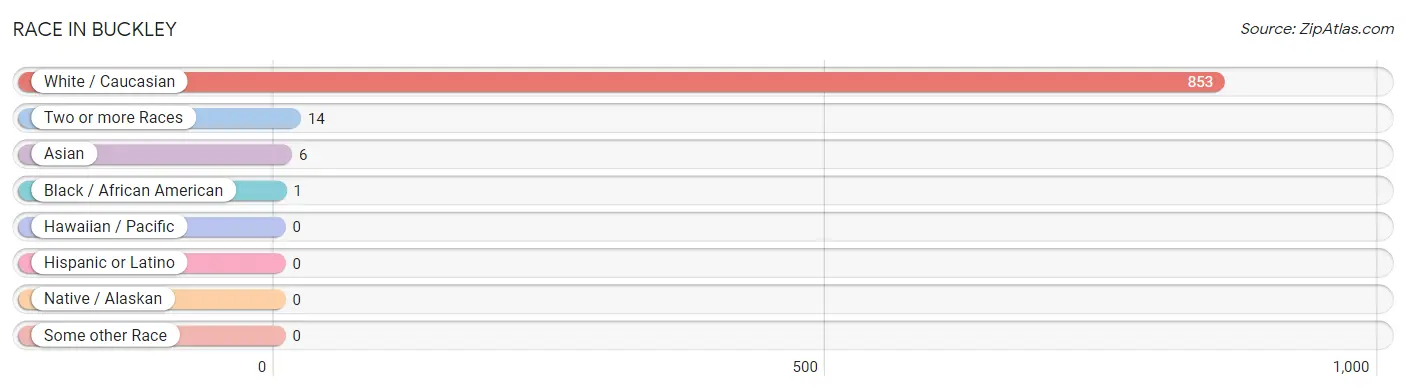
| Race | # Population | % Population |
| Asian | 6 | 0.7% |
| Black / African American | 1 | 0.1% |
| Hawaiian / Pacific | 0 | 0.0% |
| Hispanic or Latino | 0 | 0.0% |
| Native / Alaskan | 0 | 0.0% |
| White / Caucasian | 853 | 97.6% |
| Two or more Races | 14 | 1.6% |
| Some other Race | 0 | 0.0% |
| Total | 874 | 100.0% |
Ancestry in Buckley
The most populous ancestries reported in Buckley are German (157 | 18.0%), Polish (77 | 8.8%), English (70 | 8.0%), Irish (57 | 6.5%), and French (36 | 4.1%), together accounting for 45.4% of all Buckley residents.
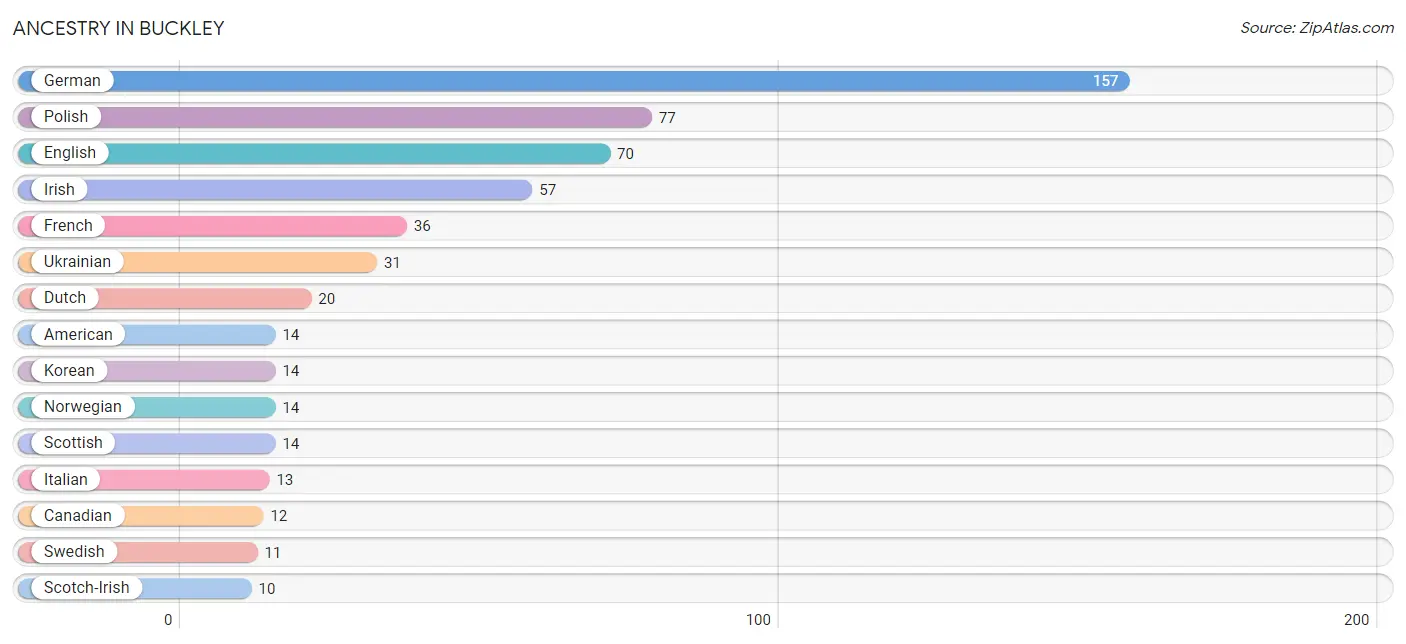
| Ancestry | # Population | % Population |
| American | 14 | 1.6% |
| British | 7 | 0.8% |
| Canadian | 12 | 1.4% |
| Cherokee | 1 | 0.1% |
| Czech | 2 | 0.2% |
| Dutch | 20 | 2.3% |
| English | 70 | 8.0% |
| European | 3 | 0.3% |
| French | 36 | 4.1% |
| French Canadian | 9 | 1.0% |
| German | 157 | 18.0% |
| Hungarian | 2 | 0.2% |
| Irish | 57 | 6.5% |
| Italian | 13 | 1.5% |
| Korean | 14 | 1.6% |
| Norwegian | 14 | 1.6% |
| Pennsylvania German | 4 | 0.5% |
| Polish | 77 | 8.8% |
| Scotch-Irish | 10 | 1.1% |
| Scottish | 14 | 1.6% |
| Slavic | 8 | 0.9% |
| Swedish | 11 | 1.3% |
| Ukrainian | 31 | 3.5% |
| Welsh | 2 | 0.2% | View All 24 Rows |
Immigrants in Buckley
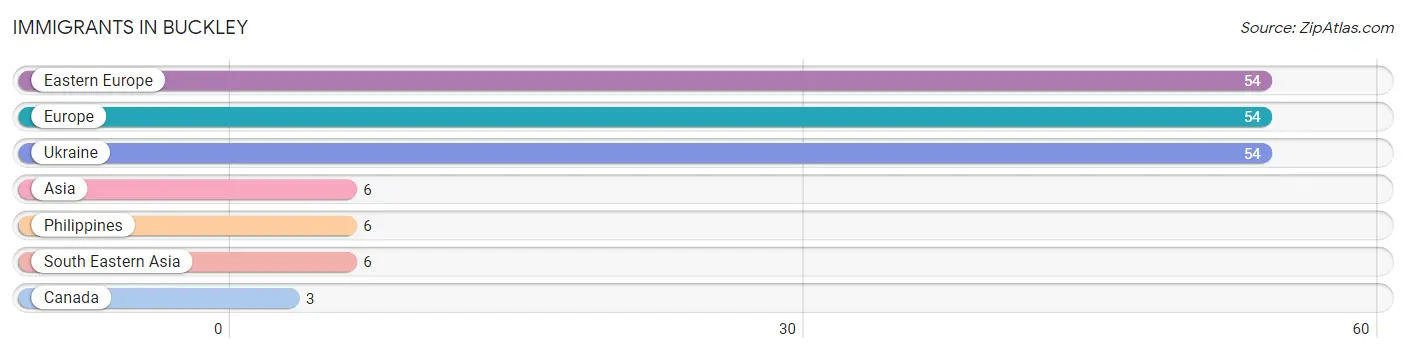
The most numerous immigrant groups reported in Buckley came from Eastern Europe (54 | 6.2%), Europe (54 | 6.2%), Ukraine (54 | 6.2%), Asia (6 | 0.7%), and Philippines (6 | 0.7%), together accounting for 19.9% of all Buckley residents.
| Immigration Origin | # Population | % Population |
| Asia | 6 | 0.7% |
| Canada | 3 | 0.3% |
| Eastern Europe | 54 | 6.2% |
| Europe | 54 | 6.2% |
| Philippines | 6 | 0.7% |
| South Eastern Asia | 6 | 0.7% |
| Ukraine | 54 | 6.2% | View All 7 Rows |
Sex and Age in Buckley
Sex and Age in Buckley
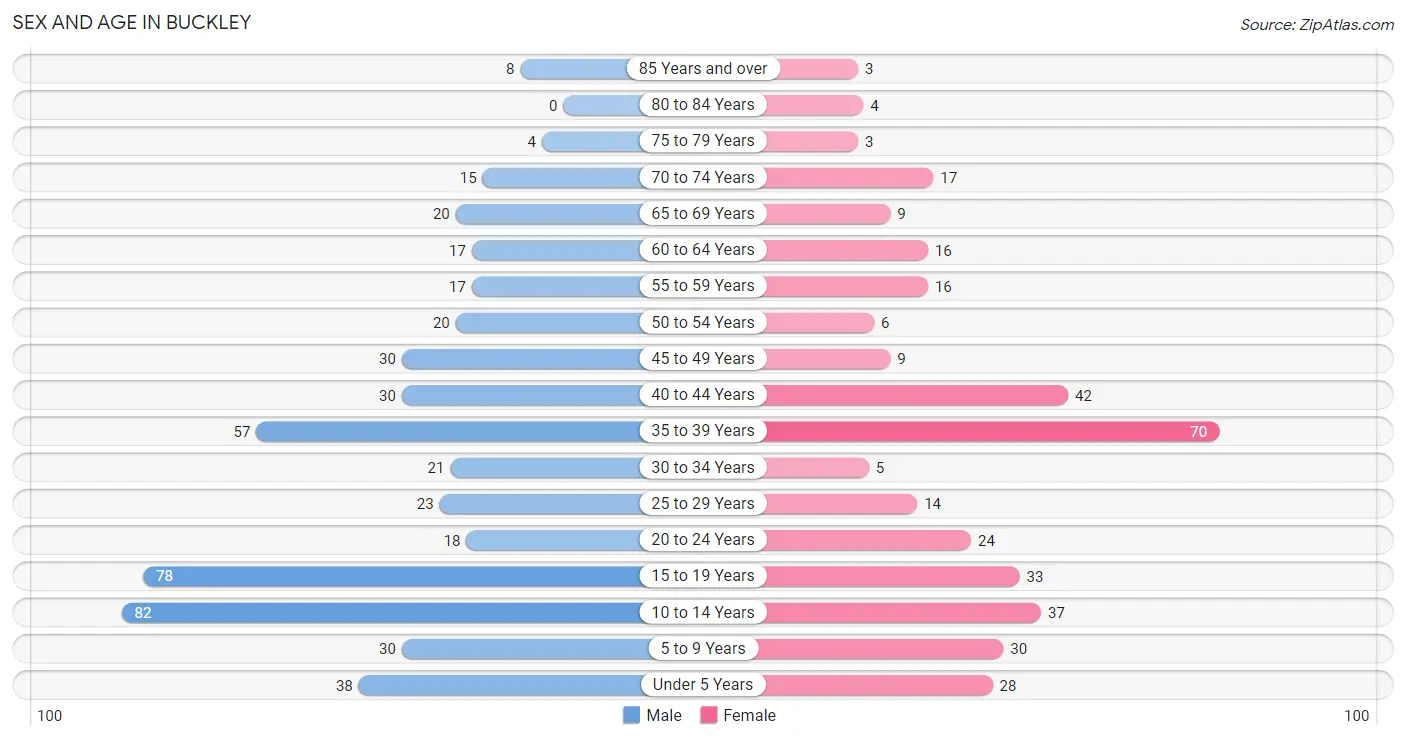
The most populous age groups in Buckley are 10 to 14 Years (82 | 16.1%) for men and 35 to 39 Years (70 | 19.1%) for women.
| Age Bracket | Male | Female |
| Under 5 Years | 38 (7.5%) | 28 (7.6%) |
| 5 to 9 Years | 30 (5.9%) | 30 (8.2%) |
| 10 to 14 Years | 82 (16.1%) | 37 (10.1%) |
| 15 to 19 Years | 78 (15.3%) | 33 (9.0%) |
| 20 to 24 Years | 18 (3.5%) | 24 (6.6%) |
| 25 to 29 Years | 23 (4.5%) | 14 (3.8%) |
| 30 to 34 Years | 21 (4.1%) | 5 (1.4%) |
| 35 to 39 Years | 57 (11.2%) | 70 (19.1%) |
| 40 to 44 Years | 30 (5.9%) | 42 (11.5%) |
| 45 to 49 Years | 30 (5.9%) | 9 (2.5%) |
| 50 to 54 Years | 20 (3.9%) | 6 (1.6%) |
| 55 to 59 Years | 17 (3.4%) | 16 (4.4%) |
| 60 to 64 Years | 17 (3.4%) | 16 (4.4%) |
| 65 to 69 Years | 20 (3.9%) | 9 (2.5%) |
| 70 to 74 Years | 15 (2.9%) | 17 (4.6%) |
| 75 to 79 Years | 4 (0.8%) | 3 (0.8%) |
| 80 to 84 Years | 0 (0.0%) | 4 (1.1%) |
| 85 Years and over | 8 (1.6%) | 3 (0.8%) |
| Total | 508 (100.0%) | 366 (100.0%) |
Families and Households in Buckley
Median Family Size in Buckley
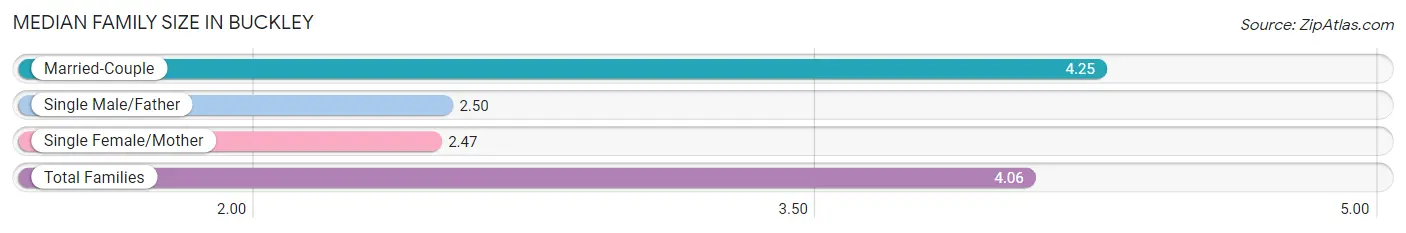
The median family size in Buckley is 4.06 persons per family, with married-couple families (169 | 88.9%) accounting for the largest median family size of 4.25 persons per family. On the other hand, single female/mother families (19 | 10.0%) represent the smallest median family size with 2.47 persons per family.
| Family Type | # Families | Family Size |
| Married-Couple | 169 (88.9%) | 4.25 |
| Single Male/Father | 2 (1.1%) | 2.50 |
| Single Female/Mother | 19 (10.0%) | 2.47 |
| Total Families | 190 (100.0%) | 4.06 |
Median Household Size in Buckley
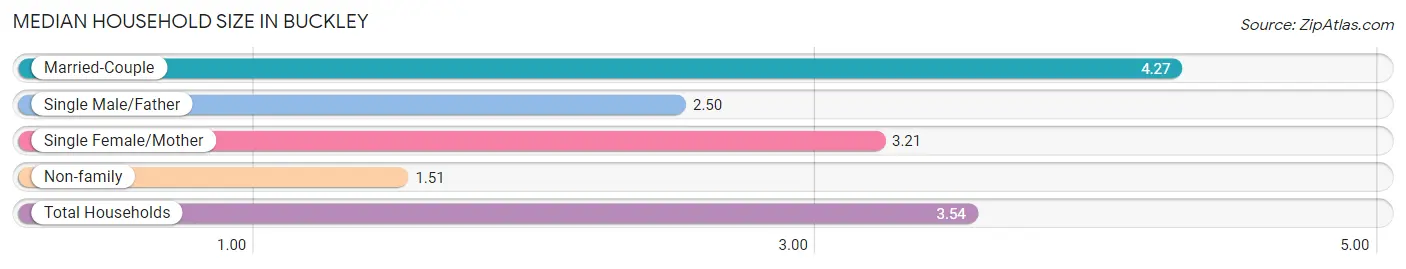
The median household size in Buckley is 3.54 persons per household, with married-couple households (169 | 68.4%) accounting for the largest median household size of 4.27 persons per household. non-family households (57 | 23.1%) represent the smallest median household size with 1.51 persons per household.
| Household Type | # Households | Household Size |
| Married-Couple | 169 (68.4%) | 4.27 |
| Single Male/Father | 2 (0.8%) | 2.50 |
| Single Female/Mother | 19 (7.7%) | 3.21 |
| Non-family | 57 (23.1%) | 1.51 |
| Total Households | 247 (100.0%) | 3.54 |
Household Size by Marriage Status in Buckley
Out of a total of 247 households in Buckley, 190 (76.9%) are family households, while 57 (23.1%) are nonfamily households. The most numerous type of family households are 2-person households, comprising 60, and the most common type of nonfamily households are 1-person households, comprising 43.
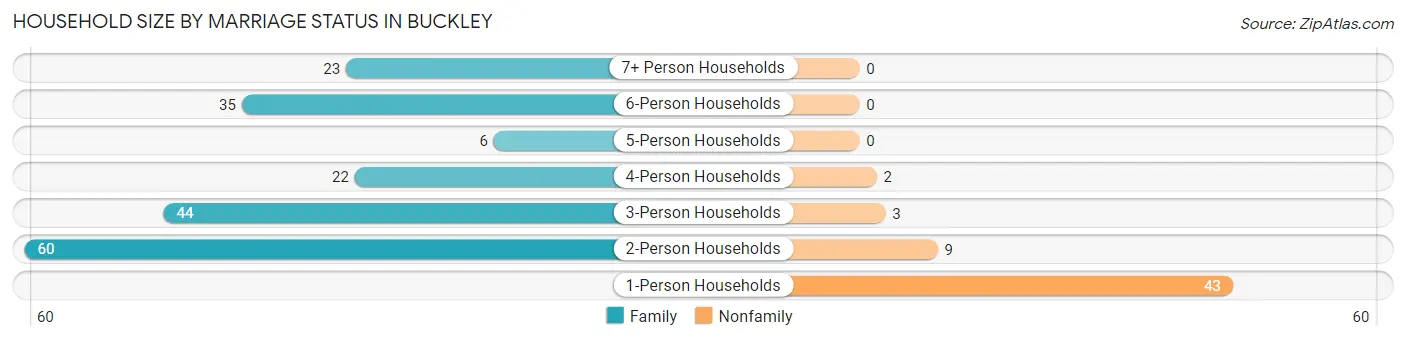
| Household Size | Family Households | Nonfamily Households |
| 1-Person Households | - | 43 (17.4%) |
| 2-Person Households | 60 (24.3%) | 9 (3.6%) |
| 3-Person Households | 44 (17.8%) | 3 (1.2%) |
| 4-Person Households | 22 (8.9%) | 2 (0.8%) |
| 5-Person Households | 6 (2.4%) | 0 (0.0%) |
| 6-Person Households | 35 (14.2%) | 0 (0.0%) |
| 7+ Person Households | 23 (9.3%) | 0 (0.0%) |
| Total | 190 (76.9%) | 57 (23.1%) |
Female Fertility in Buckley
Fertility by Age in Buckley
Average fertility rate in Buckley is 55.0 births per 1,000 women. Women in the age bracket of 20 to 34 years have the highest fertility rate with 256.0 births per 1,000 women. Women in the age bracket of 20 to 34 years acount for 100.0% of all women with births.
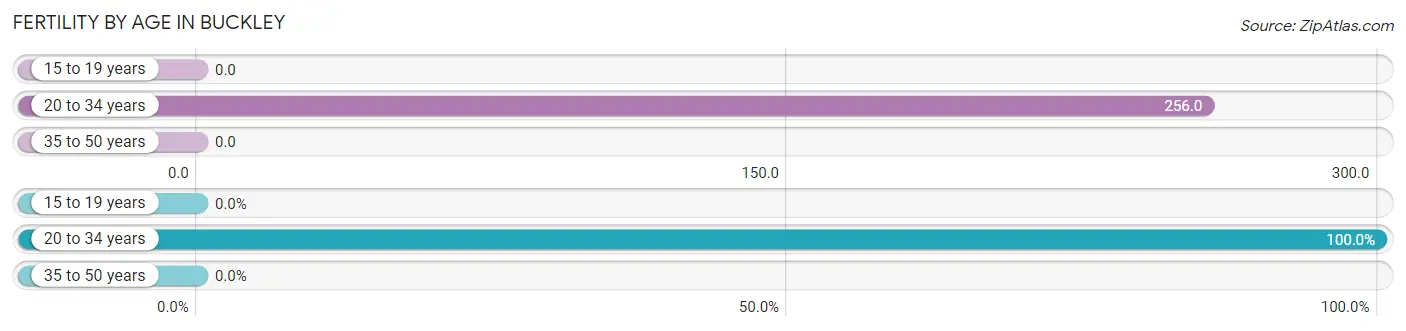
| Age Bracket | Women with Births | Births / 1,000 Women |
| 15 to 19 years | 0 (0.0%) | 0.0 |
| 20 to 34 years | 11 (100.0%) | 256.0 |
| 35 to 50 years | 0 (0.0%) | 0.0 |
| Total | 11 (100.0%) | 55.0 |
Fertility by Age by Marriage Status in Buckley
9.1% of women with births (11) in Buckley are married. The highest percentage of unmarried women with births falls into 20 to 34 years age bracket with 90.9% of them unmarried at the time of birth, while the lowest percentage of unmarried women with births belong to 20 to 34 years age bracket with 90.9% of them unmarried.
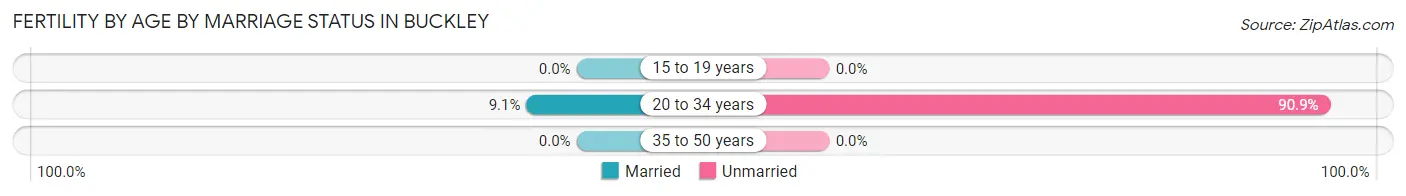
| Age Bracket | Married | Unmarried |
| 15 to 19 years | 0 (0.0%) | 0 (0.0%) |
| 20 to 34 years | 1 (9.1%) | 10 (90.9%) |
| 35 to 50 years | 0 (0.0%) | 0 (0.0%) |
| Total | 1 (9.1%) | 10 (90.9%) |
Fertility by Education in Buckley
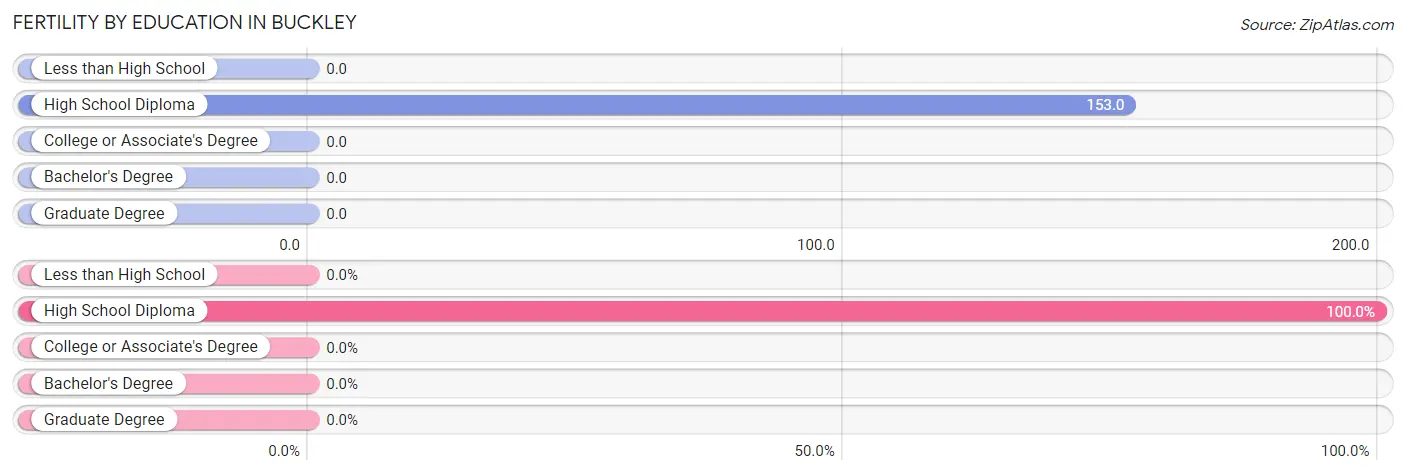
| Educational Attainment | Women with Births | Births / 1,000 Women |
| Less than High School | 0 (0.0%) | 0.0 |
| High School Diploma | 11 (100.0%) | 153.0 |
| College or Associate's Degree | 0 (0.0%) | 0.0 |
| Bachelor's Degree | 0 (0.0%) | 0.0 |
| Graduate Degree | 0 (0.0%) | 0.0 |
| Total | 11 (100.0%) | 55.0 |
Fertility by Education by Marriage Status in Buckley
90.9% of women with births in Buckley are unmarried. Women with the educational attainment of high school diploma are most likely to be married with 9.1% of them married at childbirth, while women with the educational attainment of high school diploma are least likely to be married with 90.9% of them unmarried at childbirth.
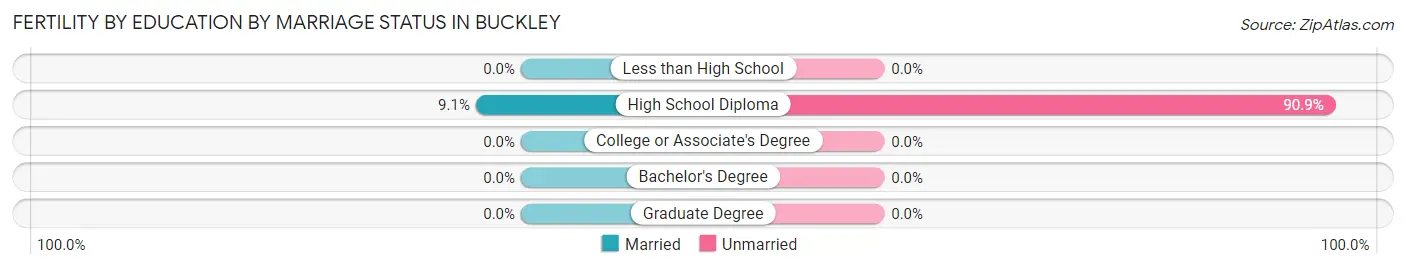
| Educational Attainment | Married | Unmarried |
| Less than High School | 0 (0.0%) | 0 (0.0%) |
| High School Diploma | 1 (9.1%) | 10 (90.9%) |
| College or Associate's Degree | 0 (0.0%) | 0 (0.0%) |
| Bachelor's Degree | 0 (0.0%) | 0 (0.0%) |
| Graduate Degree | 0 (0.0%) | 0 (0.0%) |
| Total | 1 (9.1%) | 10 (90.9%) |
Employment Characteristics in Buckley
Employment by Class of Employer in Buckley
Among the 353 employed individuals in Buckley, private company employees (218 | 61.8%), not-for-profit organizations (57 | 16.2%), and self-employed (not incorporated) (38 | 10.8%) make up the most common classes of employment.
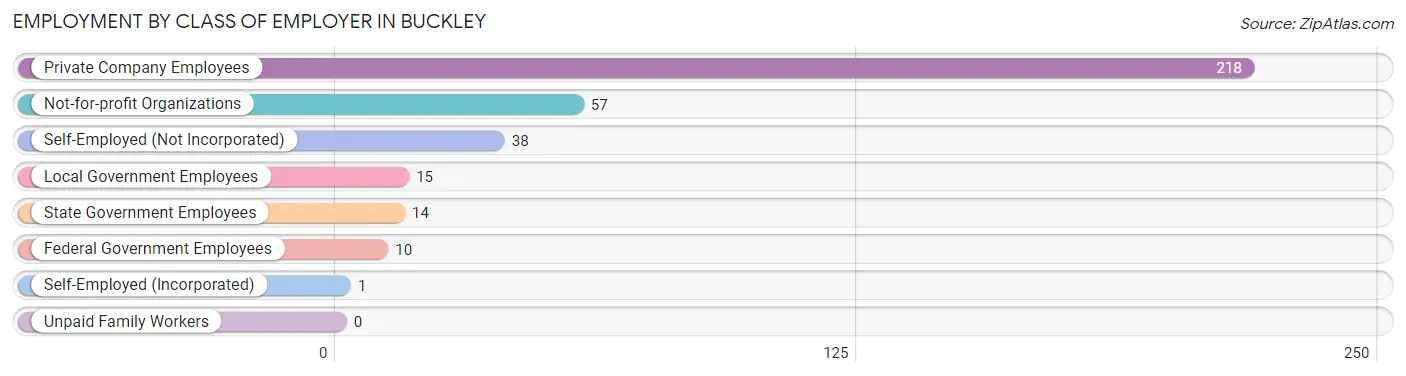
| Employer Class | # Employees | % Employees |
| Private Company Employees | 218 | 61.8% |
| Self-Employed (Incorporated) | 1 | 0.3% |
| Self-Employed (Not Incorporated) | 38 | 10.8% |
| Not-for-profit Organizations | 57 | 16.2% |
| Local Government Employees | 15 | 4.3% |
| State Government Employees | 14 | 4.0% |
| Federal Government Employees | 10 | 2.8% |
| Unpaid Family Workers | 0 | 0.0% |
| Total | 353 | 100.0% |
Employment Status by Age in Buckley
According to the labor force statistics for Buckley, out of the total population over 16 years of age (611), 62.4% or 381 individuals are in the labor force, with 6.3% or 24 of them unemployed. The age group with the highest labor force participation rate is 30 to 34 years, with 100.0% or 26 individuals in the labor force. Within the labor force, the 16 to 19 years age range has the highest percentage of unemployed individuals, with 50.0% or 10 of them being unemployed.
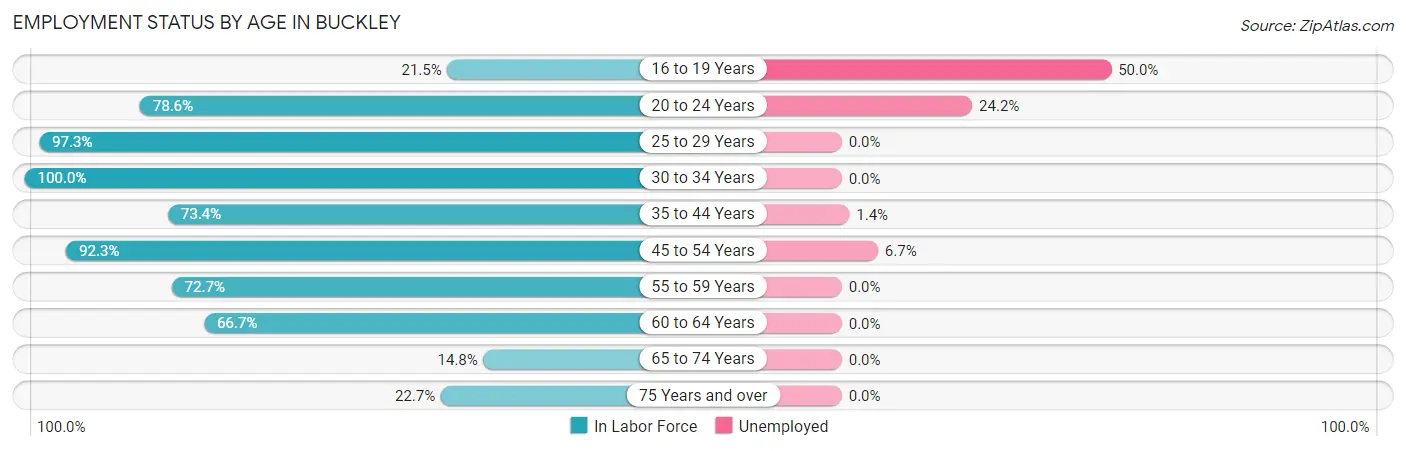
| Age Bracket | In Labor Force | Unemployed |
| 16 to 19 Years | 20 (21.5%) | 10 (50.0%) |
| 20 to 24 Years | 33 (78.6%) | 8 (24.2%) |
| 25 to 29 Years | 36 (97.3%) | 0 (0.0%) |
| 30 to 34 Years | 26 (100.0%) | 0 (0.0%) |
| 35 to 44 Years | 146 (73.4%) | 2 (1.4%) |
| 45 to 54 Years | 60 (92.3%) | 4 (6.7%) |
| 55 to 59 Years | 24 (72.7%) | 0 (0.0%) |
| 60 to 64 Years | 22 (66.7%) | 0 (0.0%) |
| 65 to 74 Years | 9 (14.8%) | 0 (0.0%) |
| 75 Years and over | 5 (22.7%) | 0 (0.0%) |
| Total | 381 (62.4%) | 24 (6.3%) |
Employment Status by Educational Attainment in Buckley
According to labor force statistics for Buckley, 79.9% of individuals (314) out of the total population between 25 and 64 years of age (393) are in the labor force, with 1.9% or 6 of them being unemployed. The group with the highest labor force participation rate are those with the educational attainment of less than high school, with 100.0% or 48 individuals in the labor force. Within the labor force, individuals with bachelor's degree or higher education have the highest percentage of unemployment, with 7.3% or 4 of them being unemployed.
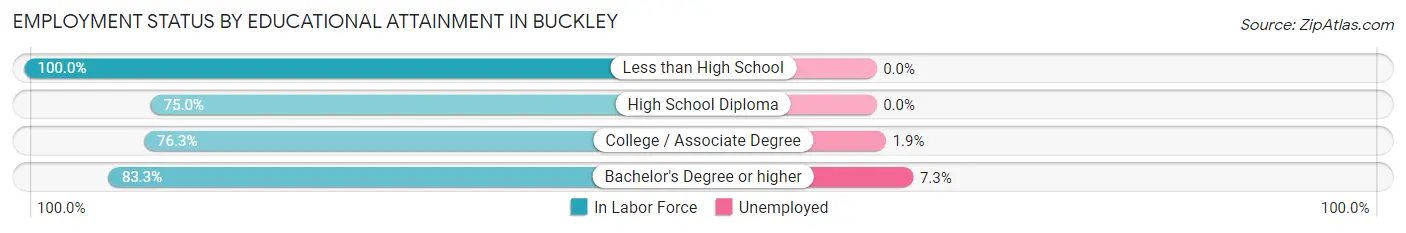
| Educational Attainment | In Labor Force | Unemployed |
| Less than High School | 48 (100.0%) | 0 (0.0%) |
| High School Diploma | 105 (75.0%) | 0 (0.0%) |
| College / Associate Degree | 106 (76.3%) | 3 (1.9%) |
| Bachelor's Degree or higher | 55 (83.3%) | 5 (7.3%) |
| Total | 314 (79.9%) | 7 (1.9%) |
Employment Occupations by Sex in Buckley
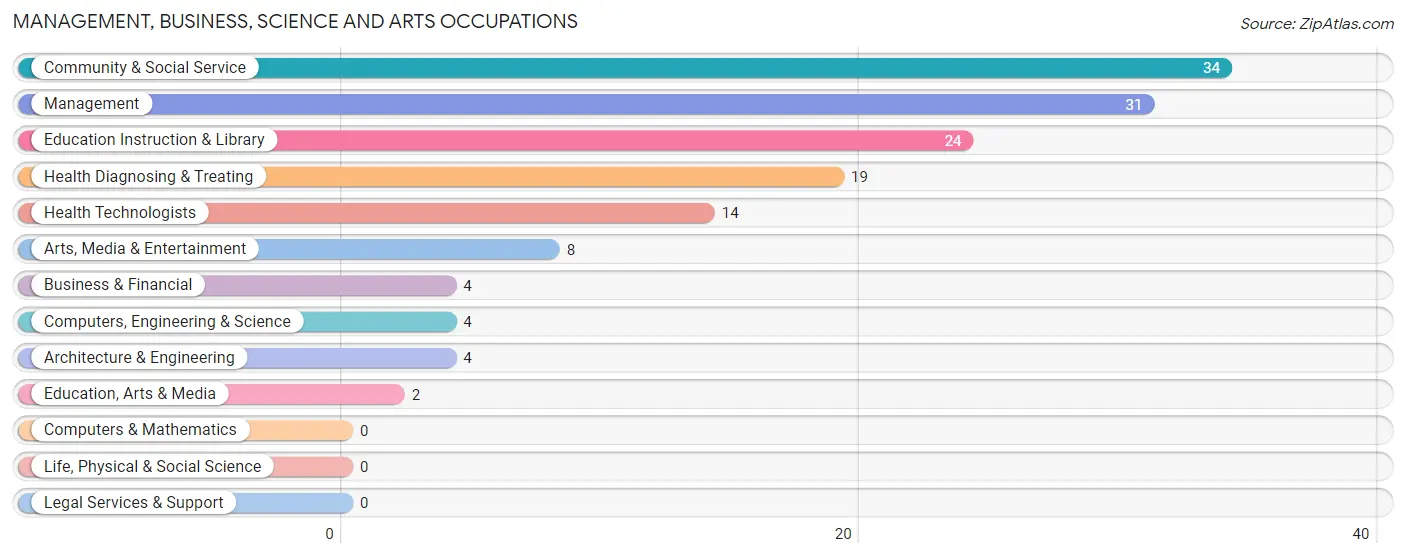
Management, Business, Science and Arts Occupations
The most common Management, Business, Science and Arts occupations in Buckley are Community & Social Service (34 | 9.5%), Management (31 | 8.7%), Education Instruction & Library (24 | 6.7%), Health Diagnosing & Treating (19 | 5.3%), and Health Technologists (14 | 3.9%).
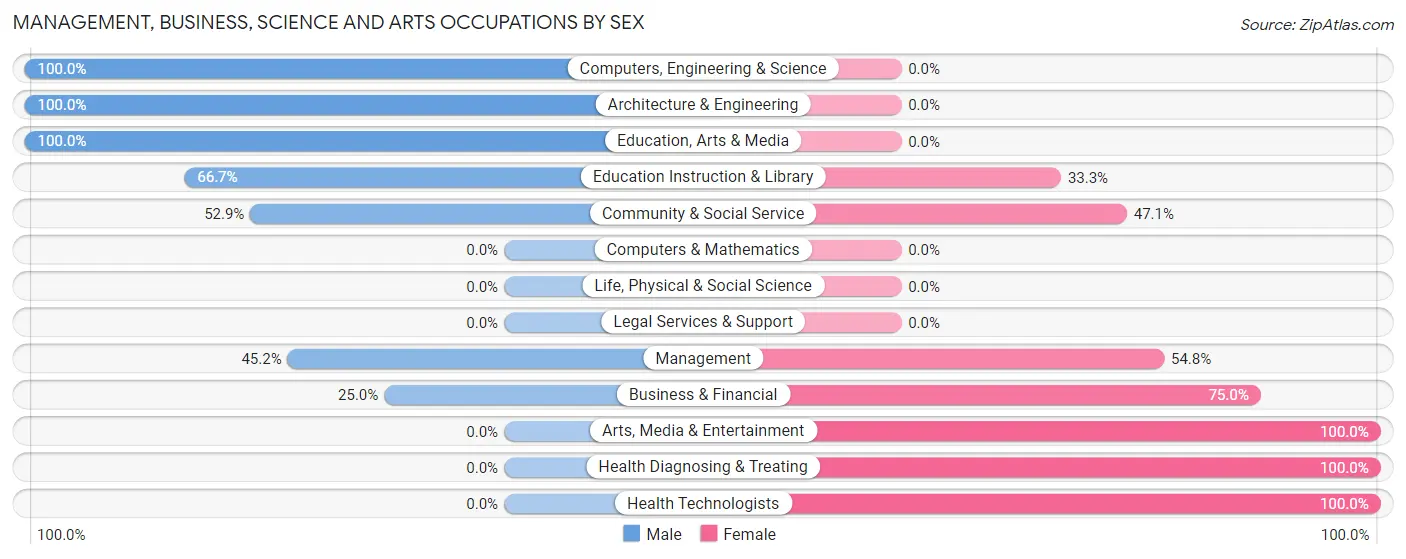
Management, Business, Science and Arts Occupations by Sex
Within the Management, Business, Science and Arts occupations in Buckley, the most male-oriented occupations are Computers, Engineering & Science (100.0%), Architecture & Engineering (100.0%), and Education, Arts & Media (100.0%), while the most female-oriented occupations are Arts, Media & Entertainment (100.0%), Health Diagnosing & Treating (100.0%), and Health Technologists (100.0%).
| Occupation | Male | Female |
| Management | 14 (45.2%) | 17 (54.8%) |
| Business & Financial | 1 (25.0%) | 3 (75.0%) |
| Computers, Engineering & Science | 4 (100.0%) | 0 (0.0%) |
| Computers & Mathematics | 0 (0.0%) | 0 (0.0%) |
| Architecture & Engineering | 4 (100.0%) | 0 (0.0%) |
| Life, Physical & Social Science | 0 (0.0%) | 0 (0.0%) |
| Community & Social Service | 18 (52.9%) | 16 (47.1%) |
| Education, Arts & Media | 2 (100.0%) | 0 (0.0%) |
| Legal Services & Support | 0 (0.0%) | 0 (0.0%) |
| Education Instruction & Library | 16 (66.7%) | 8 (33.3%) |
| Arts, Media & Entertainment | 0 (0.0%) | 8 (100.0%) |
| Health Diagnosing & Treating | 0 (0.0%) | 19 (100.0%) |
| Health Technologists | 0 (0.0%) | 14 (100.0%) |
| Total (Category) | 37 (40.2%) | 55 (59.8%) |
| Total (Overall) | 215 (60.2%) | 142 (39.8%) |
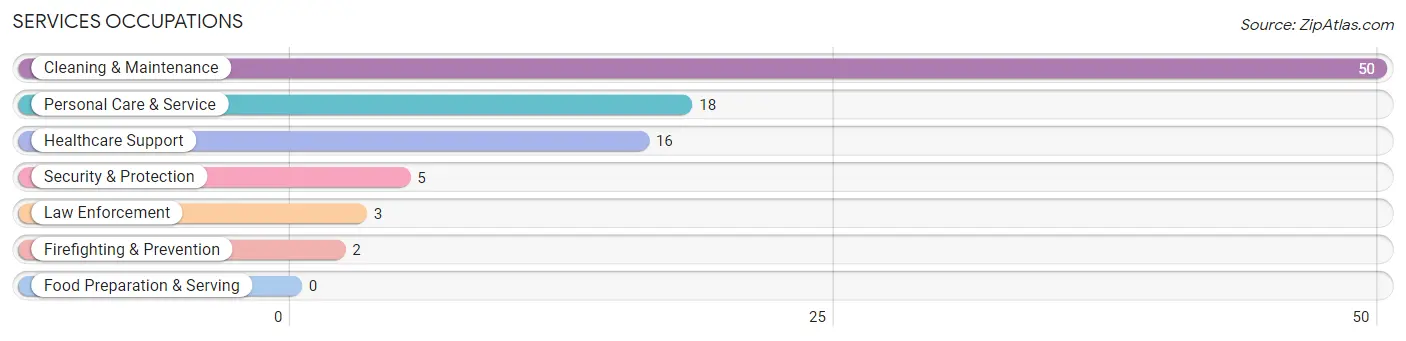
Services Occupations
The most common Services occupations in Buckley are Cleaning & Maintenance (50 | 14.0%), Personal Care & Service (18 | 5.0%), Healthcare Support (16 | 4.5%), Security & Protection (5 | 1.4%), and Law Enforcement (3 | 0.8%).
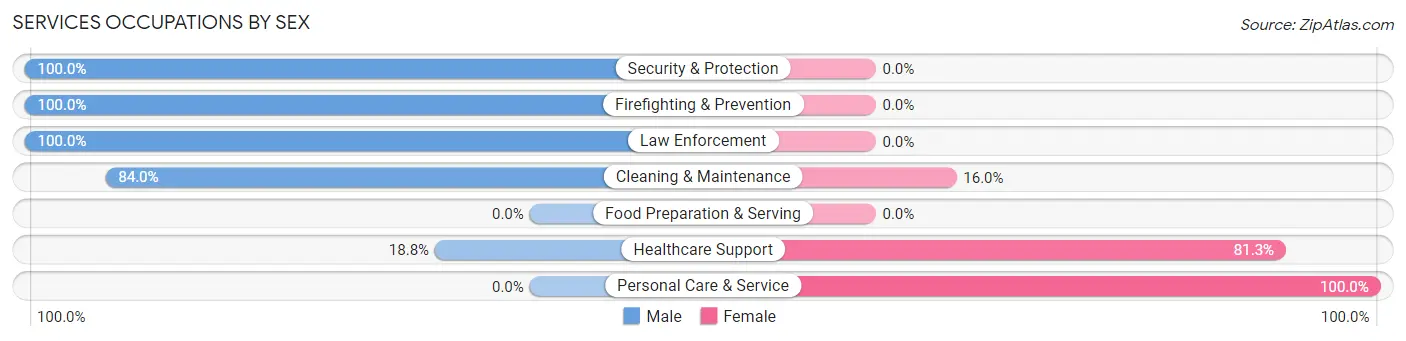
Services Occupations by Sex
Within the Services occupations in Buckley, the most male-oriented occupations are Security & Protection (100.0%), Firefighting & Prevention (100.0%), and Law Enforcement (100.0%), while the most female-oriented occupations are Personal Care & Service (100.0%), Healthcare Support (81.2%), and Cleaning & Maintenance (16.0%).
| Occupation | Male | Female |
| Healthcare Support | 3 (18.8%) | 13 (81.2%) |
| Security & Protection | 5 (100.0%) | 0 (0.0%) |
| Firefighting & Prevention | 2 (100.0%) | 0 (0.0%) |
| Law Enforcement | 3 (100.0%) | 0 (0.0%) |
| Food Preparation & Serving | 0 (0.0%) | 0 (0.0%) |
| Cleaning & Maintenance | 42 (84.0%) | 8 (16.0%) |
| Personal Care & Service | 0 (0.0%) | 18 (100.0%) |
| Total (Category) | 50 (56.2%) | 39 (43.8%) |
| Total (Overall) | 215 (60.2%) | 142 (39.8%) |
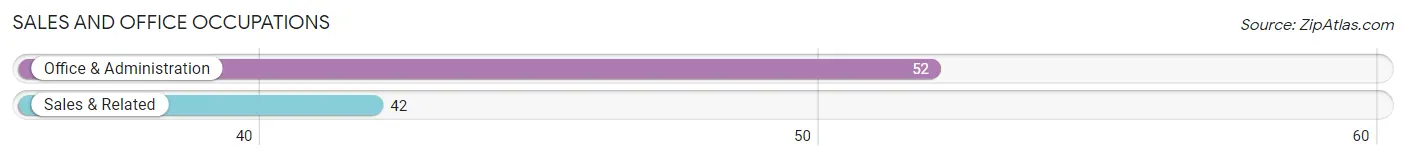
Sales and Office Occupations
The most common Sales and Office occupations in Buckley are Office & Administration (52 | 14.6%), and Sales & Related (42 | 11.8%).
Sales and Office Occupations by Sex
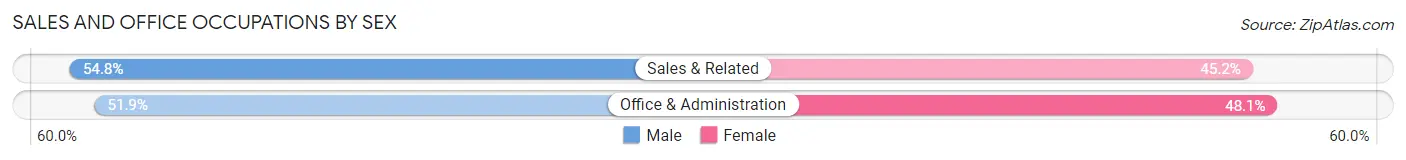
| Occupation | Male | Female |
| Sales & Related | 23 (54.8%) | 19 (45.2%) |
| Office & Administration | 27 (51.9%) | 25 (48.1%) |
| Total (Category) | 50 (53.2%) | 44 (46.8%) |
| Total (Overall) | 215 (60.2%) | 142 (39.8%) |
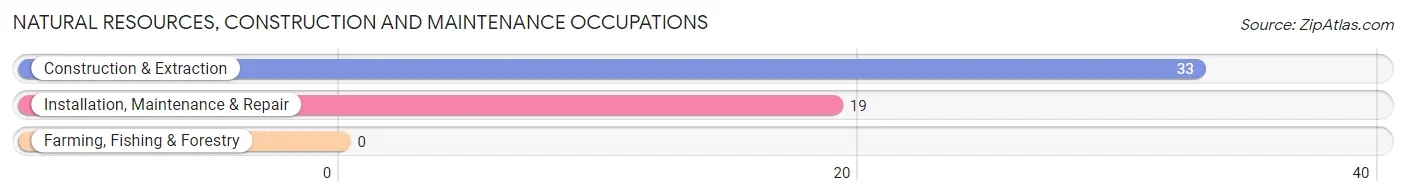
Natural Resources, Construction and Maintenance Occupations
The most common Natural Resources, Construction and Maintenance occupations in Buckley are Construction & Extraction (33 | 9.2%), and Installation, Maintenance & Repair (19 | 5.3%).
Natural Resources, Construction and Maintenance Occupations by Sex
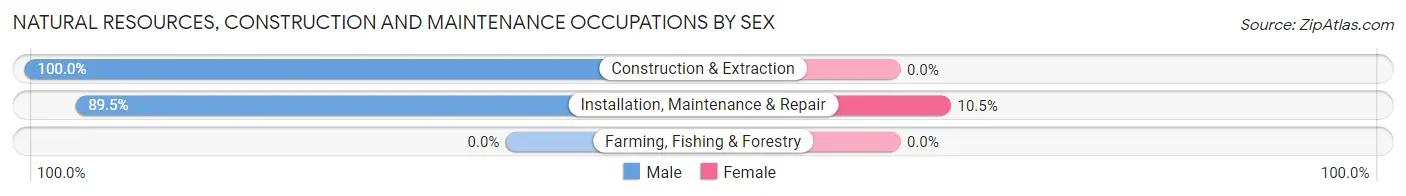
| Occupation | Male | Female |
| Farming, Fishing & Forestry | 0 (0.0%) | 0 (0.0%) |
| Construction & Extraction | 33 (100.0%) | 0 (0.0%) |
| Installation, Maintenance & Repair | 17 (89.5%) | 2 (10.5%) |
| Total (Category) | 50 (96.2%) | 2 (3.8%) |
| Total (Overall) | 215 (60.2%) | 142 (39.8%) |
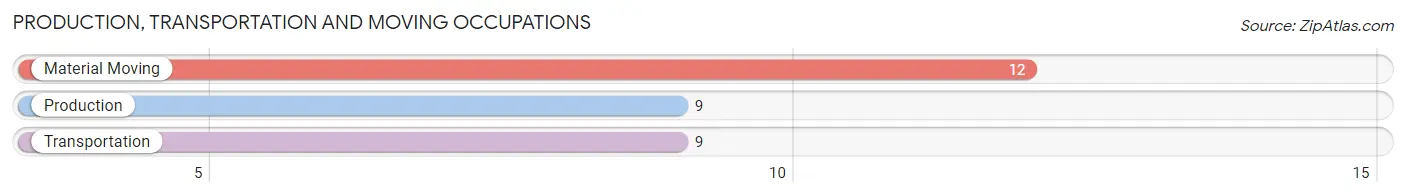
Production, Transportation and Moving Occupations
The most common Production, Transportation and Moving occupations in Buckley are Material Moving (12 | 3.4%), Production (9 | 2.5%), and Transportation (9 | 2.5%).
Production, Transportation and Moving Occupations by Sex
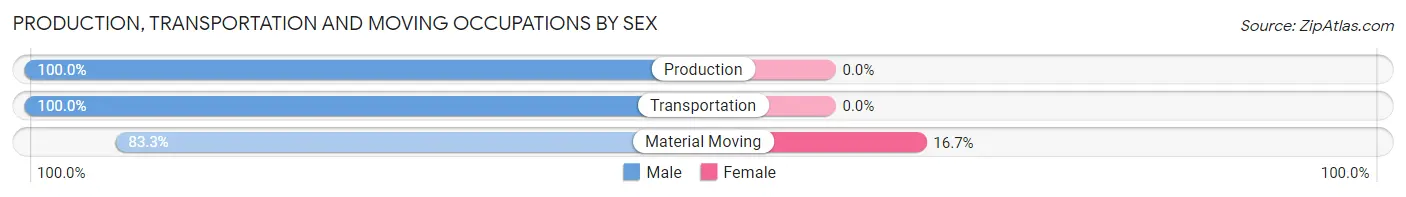
| Occupation | Male | Female |
| Production | 9 (100.0%) | 0 (0.0%) |
| Transportation | 9 (100.0%) | 0 (0.0%) |
| Material Moving | 10 (83.3%) | 2 (16.7%) |
| Total (Category) | 28 (93.3%) | 2 (6.7%) |
| Total (Overall) | 215 (60.2%) | 142 (39.8%) |
Employment Industries by Sex in Buckley
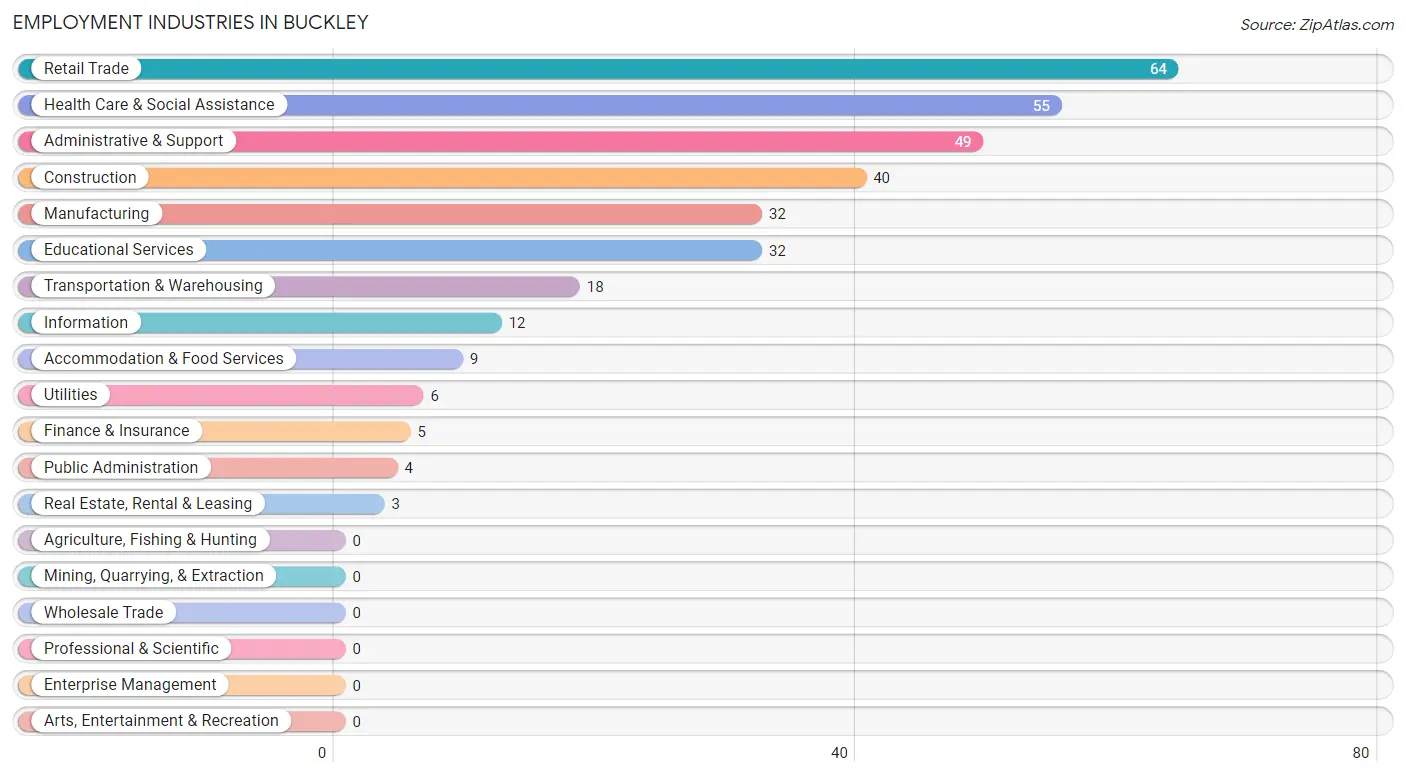
Employment Industries in Buckley
The major employment industries in Buckley include Retail Trade (64 | 17.9%), Health Care & Social Assistance (55 | 15.4%), Administrative & Support (49 | 13.7%), Construction (40 | 11.2%), and Manufacturing (32 | 9.0%).
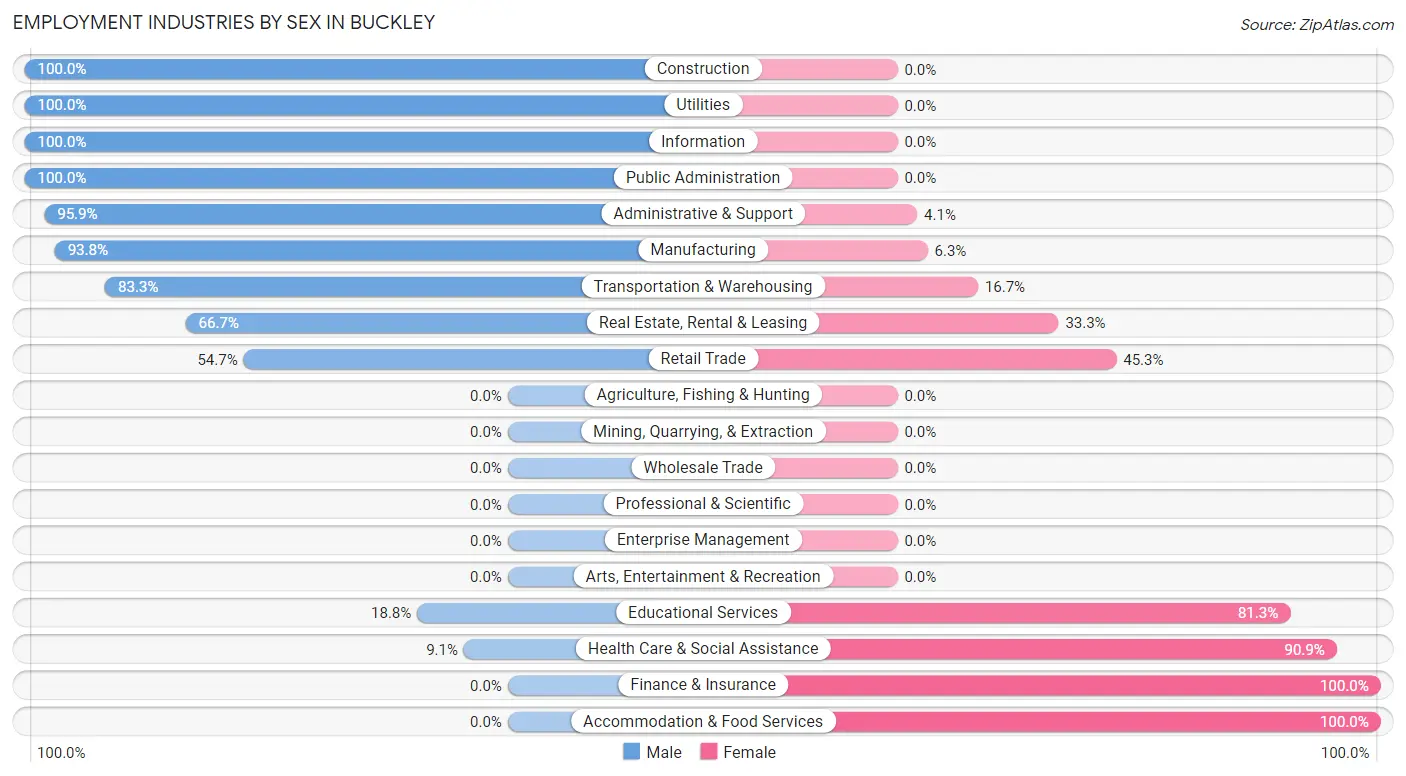
Employment Industries by Sex in Buckley
The Buckley industries that see more men than women are Construction (100.0%), Utilities (100.0%), and Information (100.0%), whereas the industries that tend to have a higher number of women are Finance & Insurance (100.0%), Accommodation & Food Services (100.0%), and Health Care & Social Assistance (90.9%).
| Industry | Male | Female |
| Agriculture, Fishing & Hunting | 0 (0.0%) | 0 (0.0%) |
| Mining, Quarrying, & Extraction | 0 (0.0%) | 0 (0.0%) |
| Construction | 40 (100.0%) | 0 (0.0%) |
| Manufacturing | 30 (93.8%) | 2 (6.2%) |
| Wholesale Trade | 0 (0.0%) | 0 (0.0%) |
| Retail Trade | 35 (54.7%) | 29 (45.3%) |
| Transportation & Warehousing | 15 (83.3%) | 3 (16.7%) |
| Utilities | 6 (100.0%) | 0 (0.0%) |
| Information | 12 (100.0%) | 0 (0.0%) |
| Finance & Insurance | 0 (0.0%) | 5 (100.0%) |
| Real Estate, Rental & Leasing | 2 (66.7%) | 1 (33.3%) |
| Professional & Scientific | 0 (0.0%) | 0 (0.0%) |
| Enterprise Management | 0 (0.0%) | 0 (0.0%) |
| Administrative & Support | 47 (95.9%) | 2 (4.1%) |
| Educational Services | 6 (18.8%) | 26 (81.2%) |
| Health Care & Social Assistance | 5 (9.1%) | 50 (90.9%) |
| Arts, Entertainment & Recreation | 0 (0.0%) | 0 (0.0%) |
| Accommodation & Food Services | 0 (0.0%) | 9 (100.0%) |
| Public Administration | 4 (100.0%) | 0 (0.0%) |
| Total | 215 (60.2%) | 142 (39.8%) |
Education in Buckley
School Enrollment in Buckley
The most common levels of schooling among the 317 students in Buckley are high school (133 | 42.0%), middle school (74 | 23.3%), and kindergarten (42 | 13.3%).
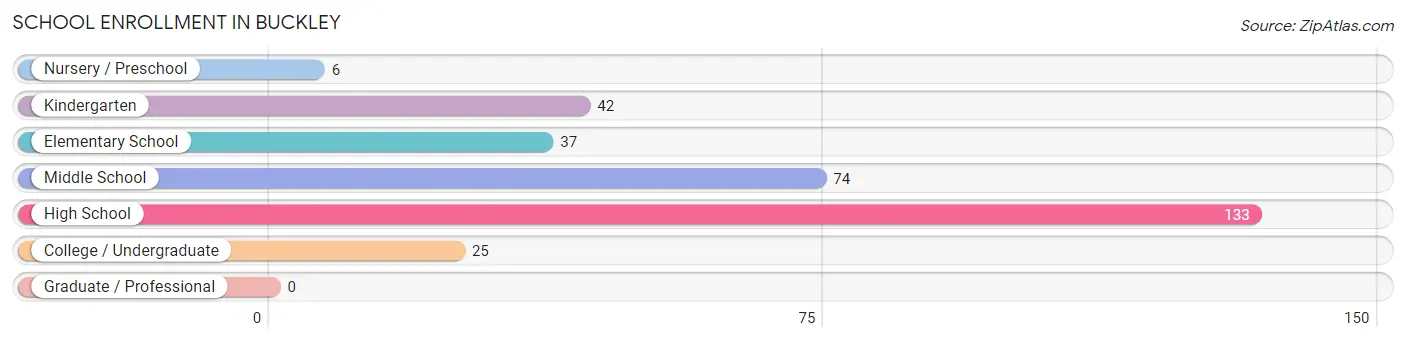
| School Level | # Students | % Students |
| Nursery / Preschool | 6 | 1.9% |
| Kindergarten | 42 | 13.3% |
| Elementary School | 37 | 11.7% |
| Middle School | 74 | 23.3% |
| High School | 133 | 42.0% |
| College / Undergraduate | 25 | 7.9% |
| Graduate / Professional | 0 | 0.0% |
| Total | 317 | 100.0% |
School Enrollment by Age by Funding Source in Buckley
Out of a total of 317 students who are enrolled in schools in Buckley, 7 (2.2%) attend a private institution, while the remaining 310 (97.8%) are enrolled in public schools. The age group of 10 to 14 year olds has the highest likelihood of being enrolled in private schools, with 7 (5.9% in the age bracket) enrolled. Conversely, the age group of 3 to 4 year olds has the lowest likelihood of being enrolled in a private school, with 27 (100.0% in the age bracket) attending a public institution.
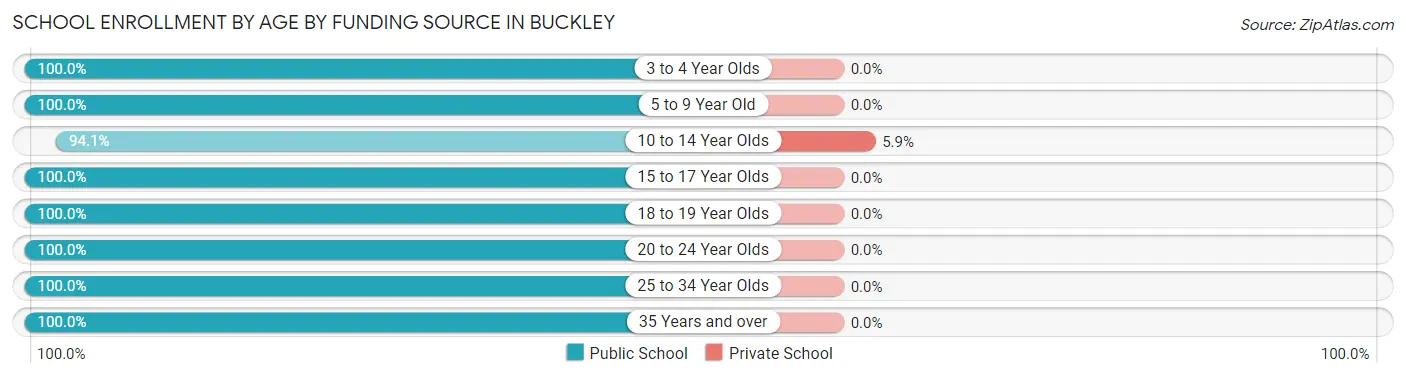
| Age Bracket | Public School | Private School |
| 3 to 4 Year Olds | 27 (100.0%) | 0 (0.0%) |
| 5 to 9 Year Old | 55 (100.0%) | 0 (0.0%) |
| 10 to 14 Year Olds | 112 (94.1%) | 7 (5.9%) |
| 15 to 17 Year Olds | 89 (100.0%) | 0 (0.0%) |
| 18 to 19 Year Olds | 12 (100.0%) | 0 (0.0%) |
| 20 to 24 Year Olds | 2 (100.0%) | 0 (0.0%) |
| 25 to 34 Year Olds | 6 (100.0%) | 0 (0.0%) |
| 35 Years and over | 7 (100.0%) | 0 (0.0%) |
| Total | 310 (97.8%) | 7 (2.2%) |
Educational Attainment by Field of Study in Buckley
Education (21 | 24.1%), science & technology (14 | 16.1%), engineering (12 | 13.8%), business (12 | 13.8%), and bio, nature & agricultural (6 | 6.9%) are the most common fields of study among 87 individuals in Buckley who have obtained a bachelor's degree or higher.
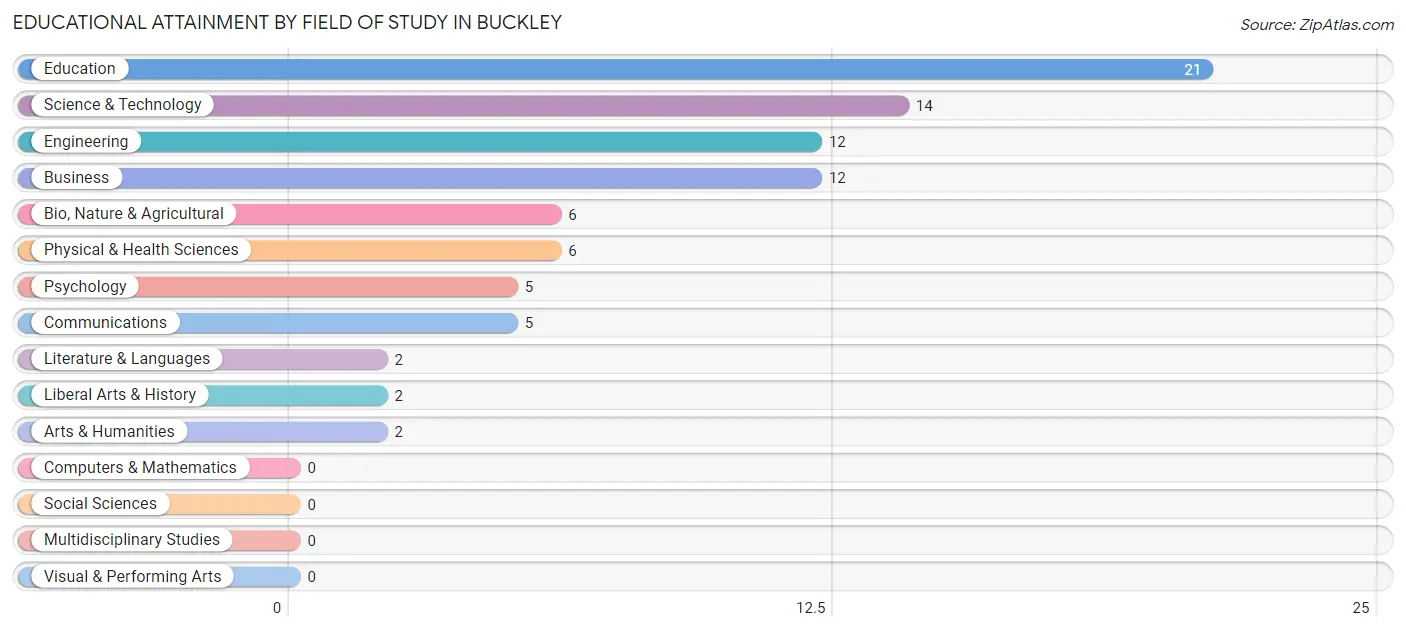
| Field of Study | # Graduates | % Graduates |
| Computers & Mathematics | 0 | 0.0% |
| Bio, Nature & Agricultural | 6 | 6.9% |
| Physical & Health Sciences | 6 | 6.9% |
| Psychology | 5 | 5.8% |
| Social Sciences | 0 | 0.0% |
| Engineering | 12 | 13.8% |
| Multidisciplinary Studies | 0 | 0.0% |
| Science & Technology | 14 | 16.1% |
| Business | 12 | 13.8% |
| Education | 21 | 24.1% |
| Literature & Languages | 2 | 2.3% |
| Liberal Arts & History | 2 | 2.3% |
| Visual & Performing Arts | 0 | 0.0% |
| Communications | 5 | 5.8% |
| Arts & Humanities | 2 | 2.3% |
| Total | 87 | 100.0% |
Transportation & Commute in Buckley
Vehicle Availability by Sex in Buckley
The most prevalent vehicle ownership categories in Buckley are males with 2 vehicles (134, accounting for 62.9%) and females with 2 vehicles (68, making up 95.7%).
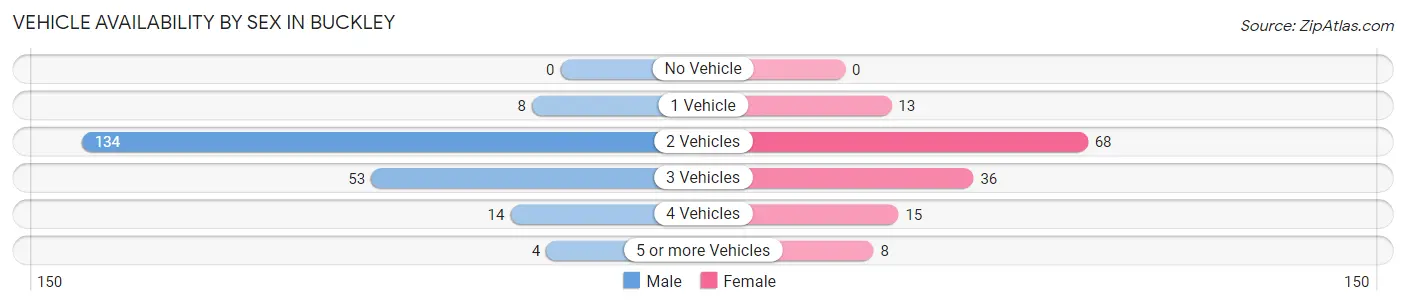
| Vehicles Available | Male | Female |
| No Vehicle | 0 (0.0%) | 0 (0.0%) |
| 1 Vehicle | 8 (3.8%) | 13 (9.3%) |
| 2 Vehicles | 134 (62.9%) | 68 (48.6%) |
| 3 Vehicles | 53 (24.9%) | 36 (25.7%) |
| 4 Vehicles | 14 (6.6%) | 15 (10.7%) |
| 5 or more Vehicles | 4 (1.9%) | 8 (5.7%) |
| Total | 213 (100.0%) | 140 (100.0%) |
Commute Time in Buckley
The most frequently occuring commute durations in Buckley are 25 to 29 minutes (72 commuters, 21.2%), 30 to 34 minutes (66 commuters, 19.4%), and 45 to 59 minutes (55 commuters, 16.2%).
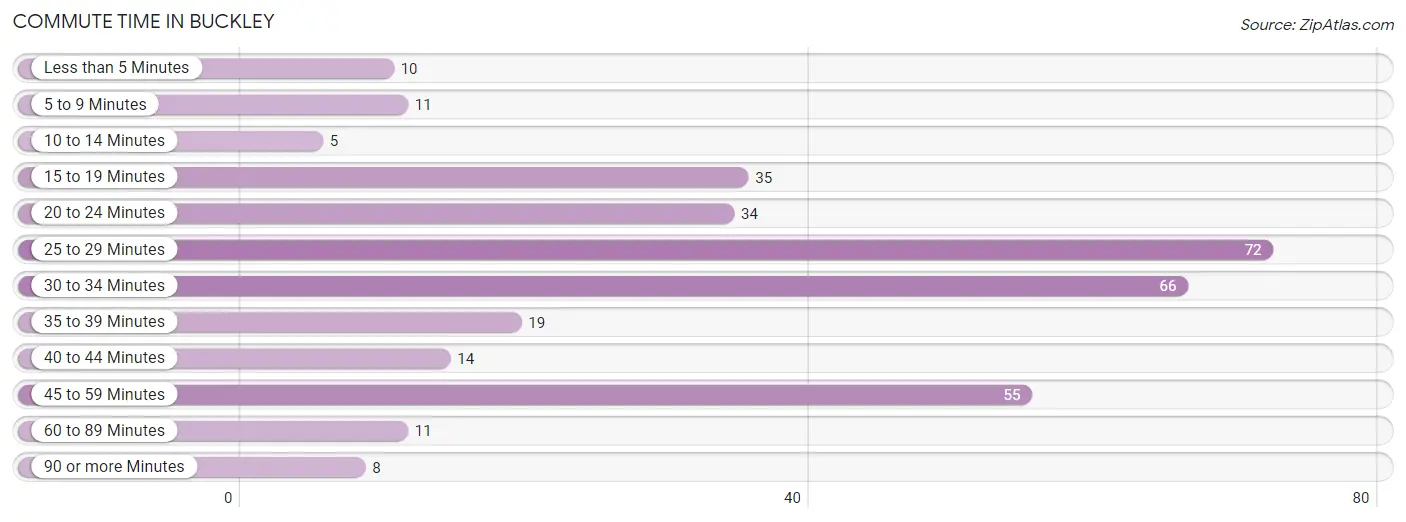
| Commute Time | # Commuters | % Commuters |
| Less than 5 Minutes | 10 | 2.9% |
| 5 to 9 Minutes | 11 | 3.2% |
| 10 to 14 Minutes | 5 | 1.5% |
| 15 to 19 Minutes | 35 | 10.3% |
| 20 to 24 Minutes | 34 | 10.0% |
| 25 to 29 Minutes | 72 | 21.2% |
| 30 to 34 Minutes | 66 | 19.4% |
| 35 to 39 Minutes | 19 | 5.6% |
| 40 to 44 Minutes | 14 | 4.1% |
| 45 to 59 Minutes | 55 | 16.2% |
| 60 to 89 Minutes | 11 | 3.2% |
| 90 or more Minutes | 8 | 2.4% |
Commute Time by Sex in Buckley
The most common commute times in Buckley are 45 to 59 minutes (48 commuters, 23.2%) for males and 30 to 34 minutes (41 commuters, 30.8%) for females.
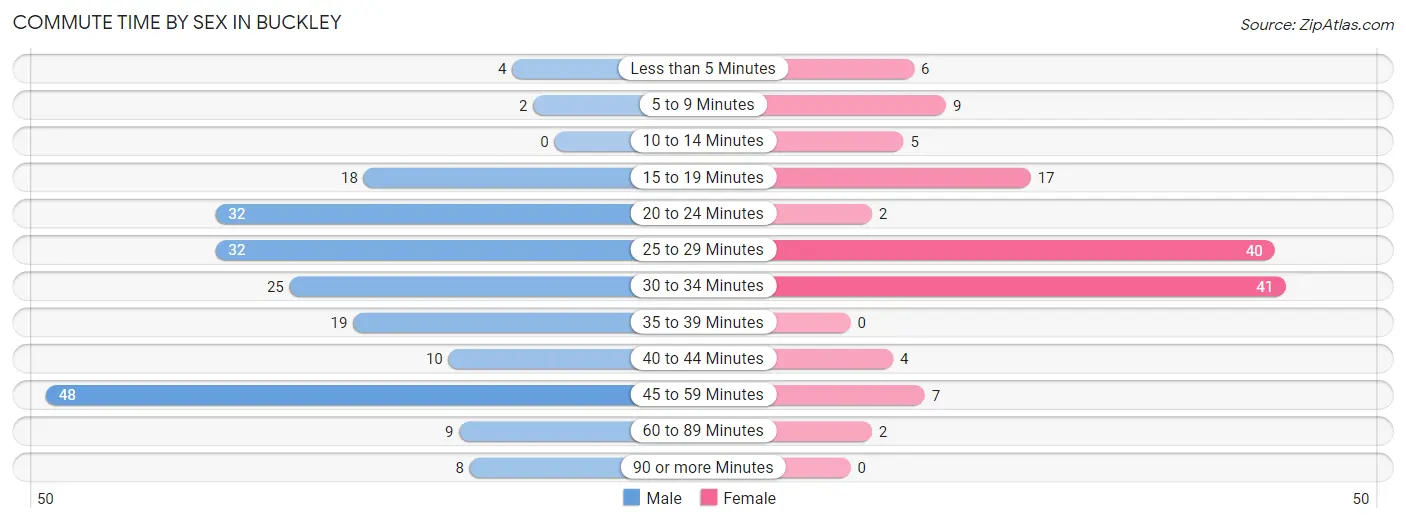
| Commute Time | Male | Female |
| Less than 5 Minutes | 4 (1.9%) | 6 (4.5%) |
| 5 to 9 Minutes | 2 (1.0%) | 9 (6.8%) |
| 10 to 14 Minutes | 0 (0.0%) | 5 (3.8%) |
| 15 to 19 Minutes | 18 (8.7%) | 17 (12.8%) |
| 20 to 24 Minutes | 32 (15.5%) | 2 (1.5%) |
| 25 to 29 Minutes | 32 (15.5%) | 40 (30.1%) |
| 30 to 34 Minutes | 25 (12.1%) | 41 (30.8%) |
| 35 to 39 Minutes | 19 (9.2%) | 0 (0.0%) |
| 40 to 44 Minutes | 10 (4.8%) | 4 (3.0%) |
| 45 to 59 Minutes | 48 (23.2%) | 7 (5.3%) |
| 60 to 89 Minutes | 9 (4.3%) | 2 (1.5%) |
| 90 or more Minutes | 8 (3.9%) | 0 (0.0%) |
Time of Departure to Work by Sex in Buckley
The most frequent times of departure to work in Buckley are 7:30 AM to 7:59 AM (51, 24.6%) for males and 7:30 AM to 7:59 AM (29, 21.8%) for females.
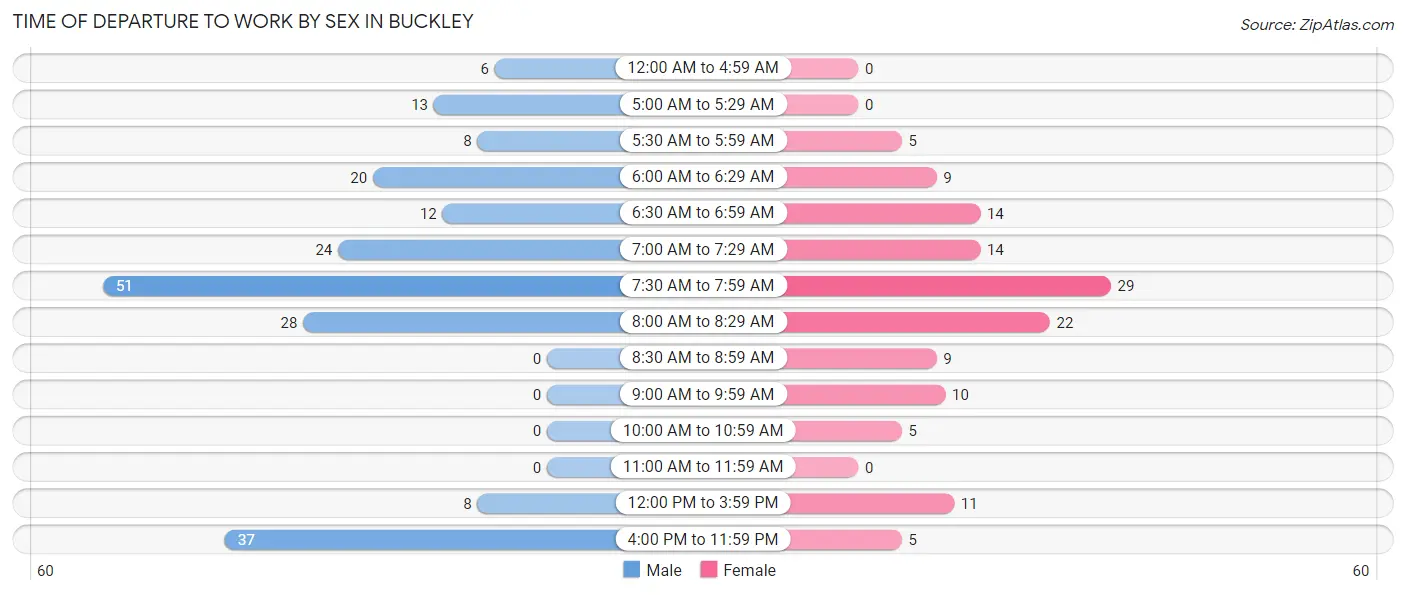
| Time of Departure | Male | Female |
| 12:00 AM to 4:59 AM | 6 (2.9%) | 0 (0.0%) |
| 5:00 AM to 5:29 AM | 13 (6.3%) | 0 (0.0%) |
| 5:30 AM to 5:59 AM | 8 (3.9%) | 5 (3.8%) |
| 6:00 AM to 6:29 AM | 20 (9.7%) | 9 (6.8%) |
| 6:30 AM to 6:59 AM | 12 (5.8%) | 14 (10.5%) |
| 7:00 AM to 7:29 AM | 24 (11.6%) | 14 (10.5%) |
| 7:30 AM to 7:59 AM | 51 (24.6%) | 29 (21.8%) |
| 8:00 AM to 8:29 AM | 28 (13.5%) | 22 (16.5%) |
| 8:30 AM to 8:59 AM | 0 (0.0%) | 9 (6.8%) |
| 9:00 AM to 9:59 AM | 0 (0.0%) | 10 (7.5%) |
| 10:00 AM to 10:59 AM | 0 (0.0%) | 5 (3.8%) |
| 11:00 AM to 11:59 AM | 0 (0.0%) | 0 (0.0%) |
| 12:00 PM to 3:59 PM | 8 (3.9%) | 11 (8.3%) |
| 4:00 PM to 11:59 PM | 37 (17.9%) | 5 (3.8%) |
| Total | 207 (100.0%) | 133 (100.0%) |
Housing Occupancy in Buckley
Occupancy by Ownership in Buckley
Of the total 247 dwellings in Buckley, owner-occupied units account for 202 (81.8%), while renter-occupied units make up 45 (18.2%).
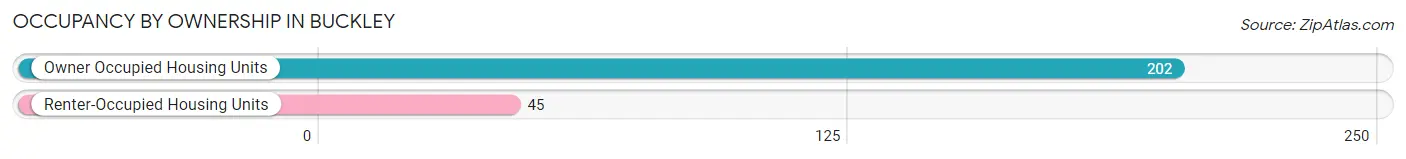
| Occupancy | # Housing Units | % Housing Units |
| Owner Occupied Housing Units | 202 | 81.8% |
| Renter-Occupied Housing Units | 45 | 18.2% |
| Total Occupied Housing Units | 247 | 100.0% |
Occupancy by Household Size in Buckley
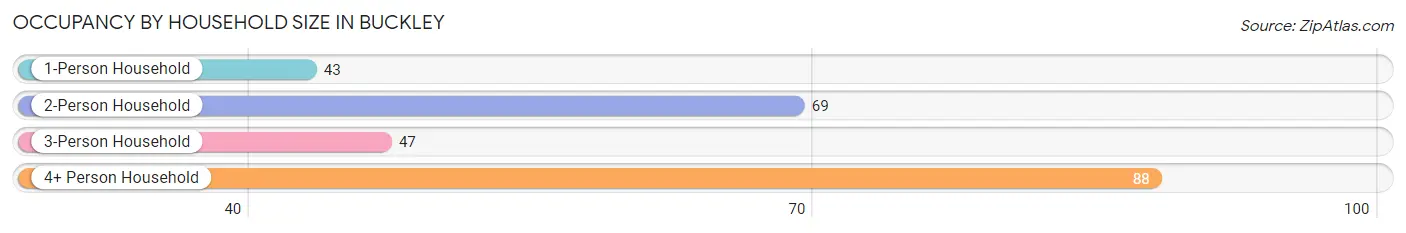
| Household Size | # Housing Units | % Housing Units |
| 1-Person Household | 43 | 17.4% |
| 2-Person Household | 69 | 27.9% |
| 3-Person Household | 47 | 19.0% |
| 4+ Person Household | 88 | 35.6% |
| Total Housing Units | 247 | 100.0% |
Occupancy by Ownership by Household Size in Buckley
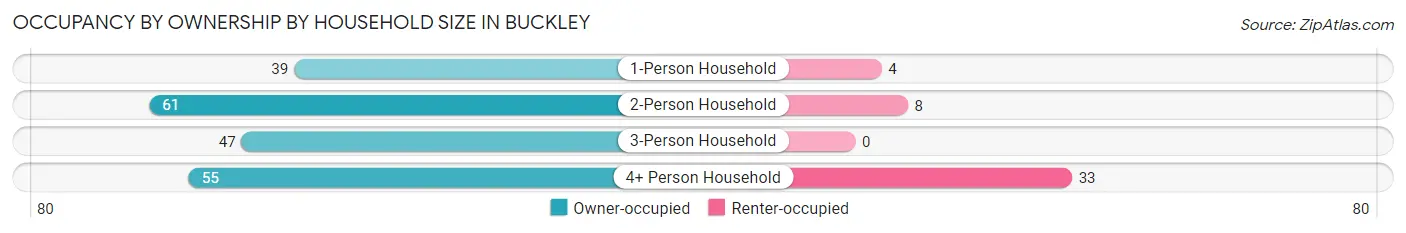
| Household Size | Owner-occupied | Renter-occupied |
| 1-Person Household | 39 (90.7%) | 4 (9.3%) |
| 2-Person Household | 61 (88.4%) | 8 (11.6%) |
| 3-Person Household | 47 (100.0%) | 0 (0.0%) |
| 4+ Person Household | 55 (62.5%) | 33 (37.5%) |
| Total Housing Units | 202 (81.8%) | 45 (18.2%) |
Occupancy by Educational Attainment in Buckley
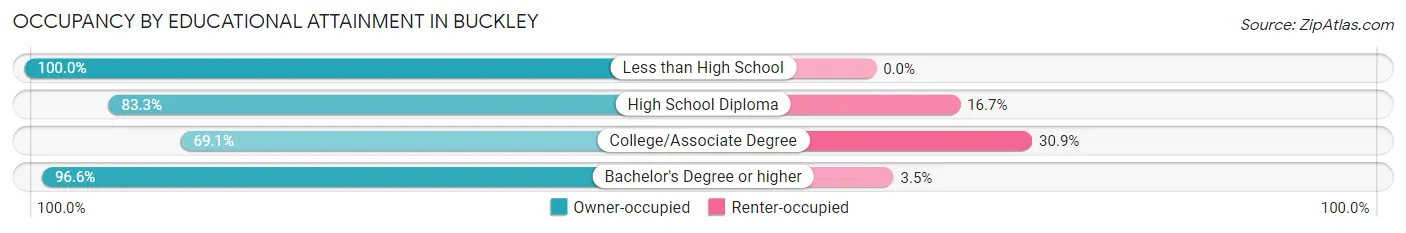
| Household Size | Owner-occupied | Renter-occupied |
| Less than High School | 14 (100.0%) | 0 (0.0%) |
| High School Diploma | 65 (83.3%) | 13 (16.7%) |
| College/Associate Degree | 67 (69.1%) | 30 (30.9%) |
| Bachelor's Degree or higher | 56 (96.6%) | 2 (3.5%) |
Occupancy by Age of Householder in Buckley
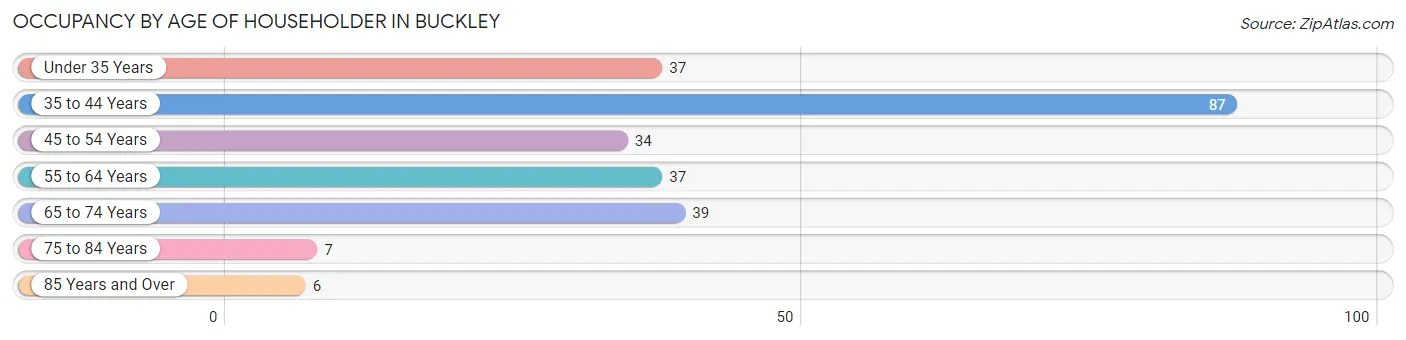
| Age Bracket | # Households | % Households |
| Under 35 Years | 37 | 15.0% |
| 35 to 44 Years | 87 | 35.2% |
| 45 to 54 Years | 34 | 13.8% |
| 55 to 64 Years | 37 | 15.0% |
| 65 to 74 Years | 39 | 15.8% |
| 75 to 84 Years | 7 | 2.8% |
| 85 Years and Over | 6 | 2.4% |
| Total | 247 | 100.0% |
Housing Finances in Buckley
Median Income by Occupancy in Buckley
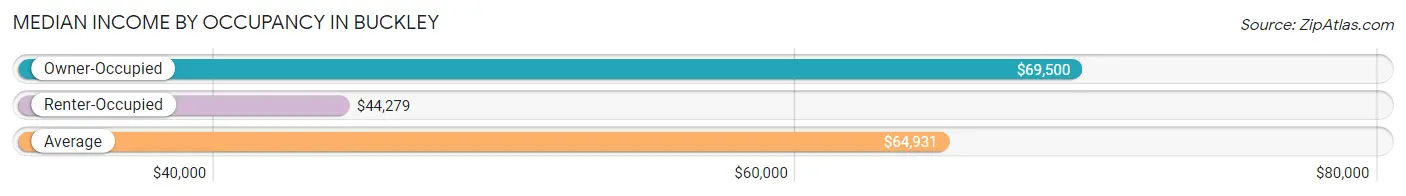
| Occupancy Type | # Households | Median Income |
| Owner-Occupied | 202 (81.8%) | $69,500 |
| Renter-Occupied | 45 (18.2%) | $44,279 |
| Average | 247 (100.0%) | $64,931 |
Occupancy by Householder Income Bracket in Buckley
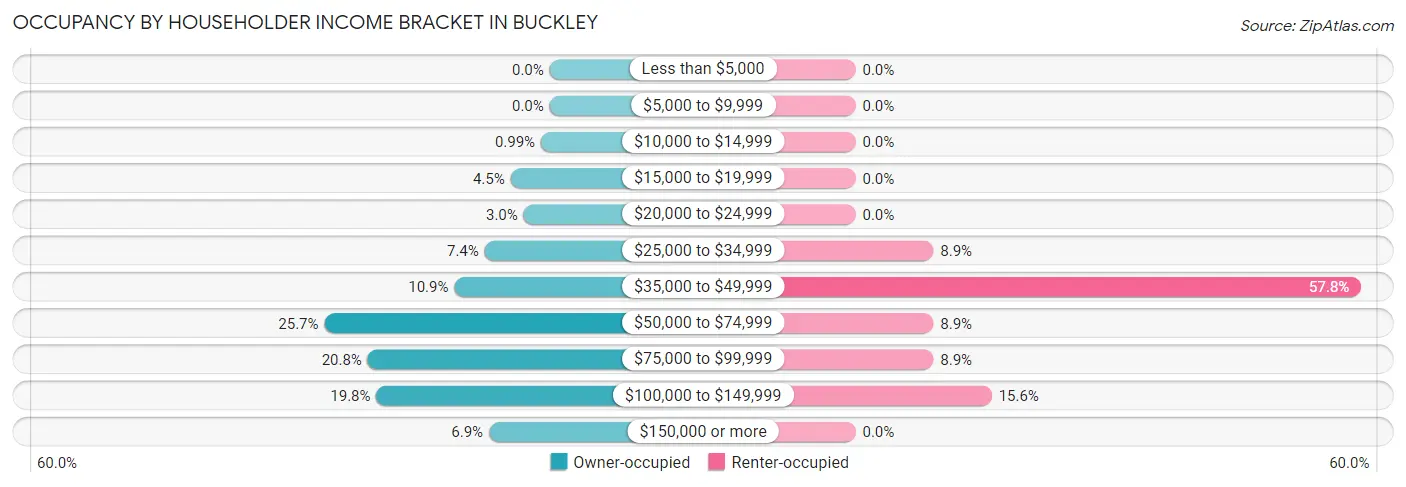
| Income Bracket | Owner-occupied | Renter-occupied |
| Less than $5,000 | 0 (0.0%) | 0 (0.0%) |
| $5,000 to $9,999 | 0 (0.0%) | 0 (0.0%) |
| $10,000 to $14,999 | 2 (1.0%) | 0 (0.0%) |
| $15,000 to $19,999 | 9 (4.5%) | 0 (0.0%) |
| $20,000 to $24,999 | 6 (3.0%) | 0 (0.0%) |
| $25,000 to $34,999 | 15 (7.4%) | 4 (8.9%) |
| $35,000 to $49,999 | 22 (10.9%) | 26 (57.8%) |
| $50,000 to $74,999 | 52 (25.7%) | 4 (8.9%) |
| $75,000 to $99,999 | 42 (20.8%) | 4 (8.9%) |
| $100,000 to $149,999 | 40 (19.8%) | 7 (15.6%) |
| $150,000 or more | 14 (6.9%) | 0 (0.0%) |
| Total | 202 (100.0%) | 45 (100.0%) |
Monthly Housing Cost Tiers in Buckley
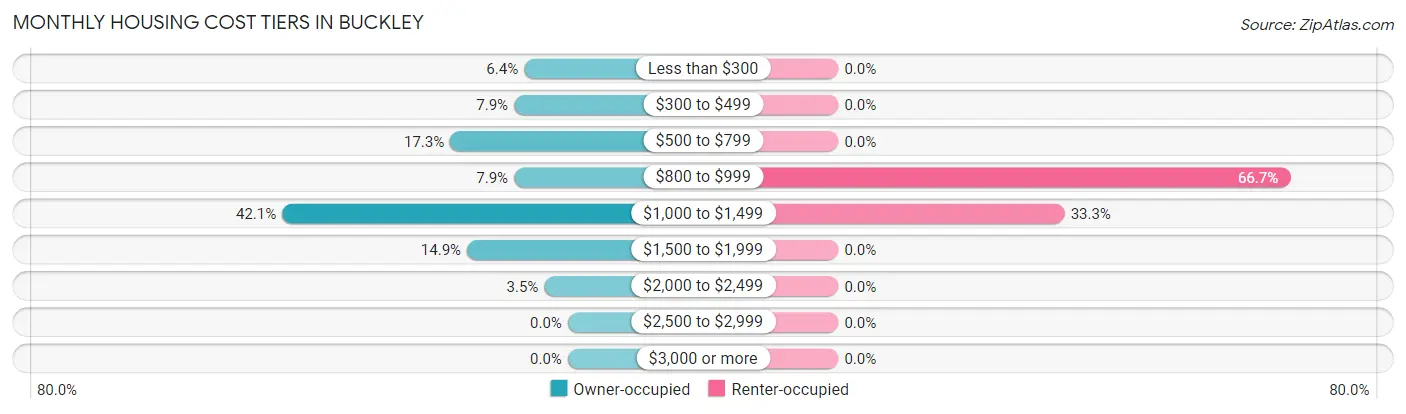
| Monthly Cost | Owner-occupied | Renter-occupied |
| Less than $300 | 13 (6.4%) | 0 (0.0%) |
| $300 to $499 | 16 (7.9%) | 0 (0.0%) |
| $500 to $799 | 35 (17.3%) | 0 (0.0%) |
| $800 to $999 | 16 (7.9%) | 30 (66.7%) |
| $1,000 to $1,499 | 85 (42.1%) | 15 (33.3%) |
| $1,500 to $1,999 | 30 (14.8%) | 0 (0.0%) |
| $2,000 to $2,499 | 7 (3.5%) | 0 (0.0%) |
| $2,500 to $2,999 | 0 (0.0%) | 0 (0.0%) |
| $3,000 or more | 0 (0.0%) | 0 (0.0%) |
| Total | 202 (100.0%) | 45 (100.0%) |
Physical Housing Characteristics in Buckley
Housing Structures in Buckley
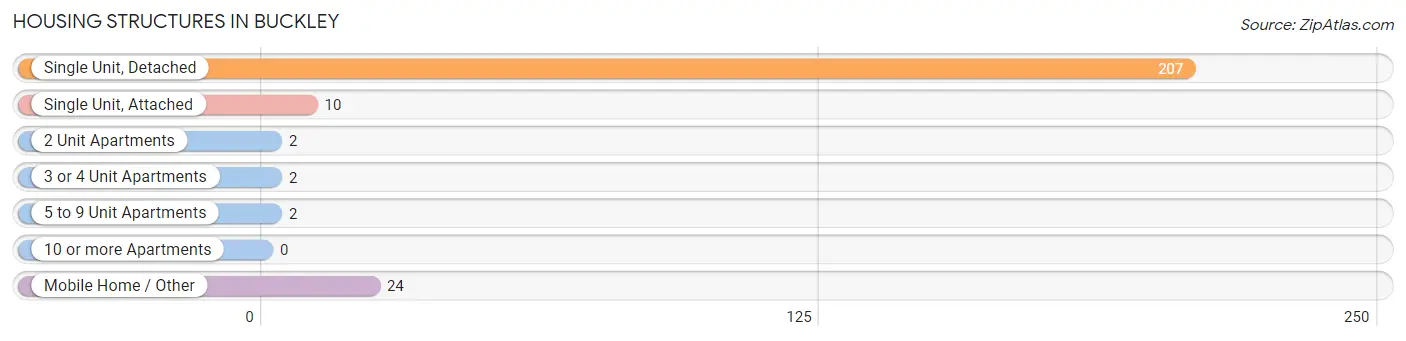
| Structure Type | # Housing Units | % Housing Units |
| Single Unit, Detached | 207 | 83.8% |
| Single Unit, Attached | 10 | 4.1% |
| 2 Unit Apartments | 2 | 0.8% |
| 3 or 4 Unit Apartments | 2 | 0.8% |
| 5 to 9 Unit Apartments | 2 | 0.8% |
| 10 or more Apartments | 0 | 0.0% |
| Mobile Home / Other | 24 | 9.7% |
| Total | 247 | 100.0% |
Housing Structures by Occupancy in Buckley
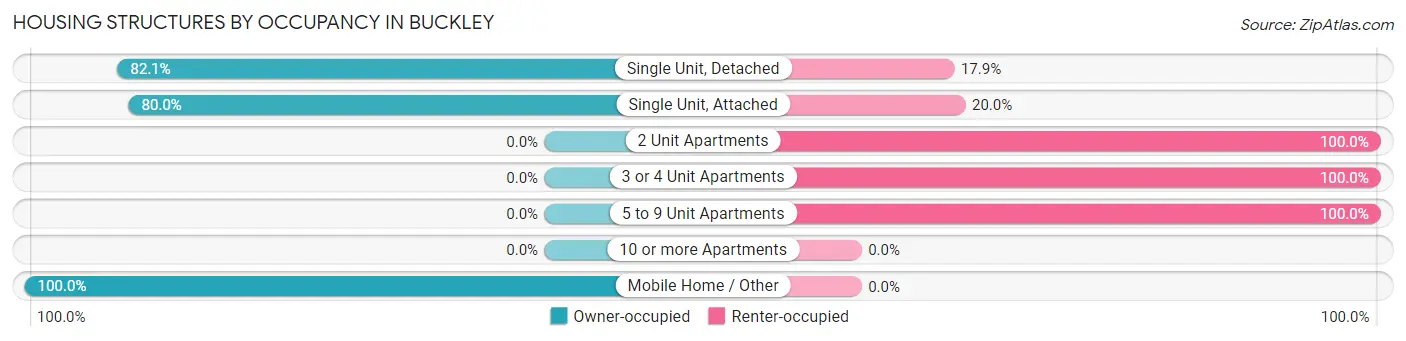
| Structure Type | Owner-occupied | Renter-occupied |
| Single Unit, Detached | 170 (82.1%) | 37 (17.9%) |
| Single Unit, Attached | 8 (80.0%) | 2 (20.0%) |
| 2 Unit Apartments | 0 (0.0%) | 2 (100.0%) |
| 3 or 4 Unit Apartments | 0 (0.0%) | 2 (100.0%) |
| 5 to 9 Unit Apartments | 0 (0.0%) | 2 (100.0%) |
| 10 or more Apartments | 0 (0.0%) | 0 (0.0%) |
| Mobile Home / Other | 24 (100.0%) | 0 (0.0%) |
| Total | 202 (81.8%) | 45 (18.2%) |
Housing Structures by Number of Rooms in Buckley
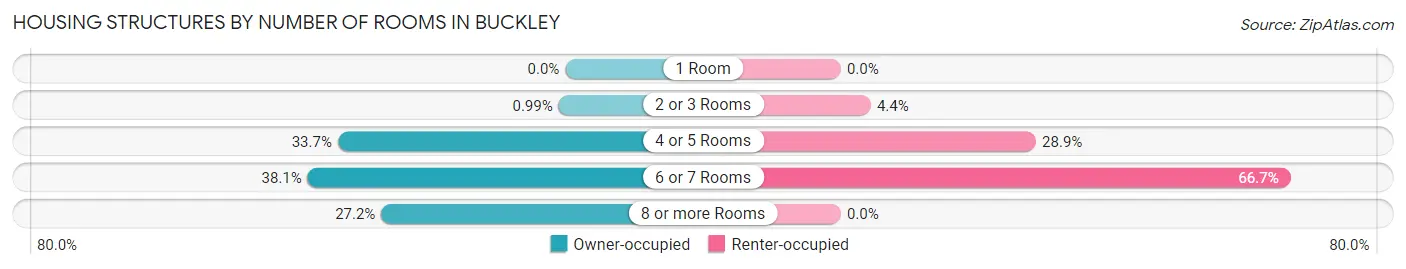
| Number of Rooms | Owner-occupied | Renter-occupied |
| 1 Room | 0 (0.0%) | 0 (0.0%) |
| 2 or 3 Rooms | 2 (1.0%) | 2 (4.4%) |
| 4 or 5 Rooms | 68 (33.7%) | 13 (28.9%) |
| 6 or 7 Rooms | 77 (38.1%) | 30 (66.7%) |
| 8 or more Rooms | 55 (27.2%) | 0 (0.0%) |
| Total | 202 (100.0%) | 45 (100.0%) |
Housing Structure by Heating Type in Buckley
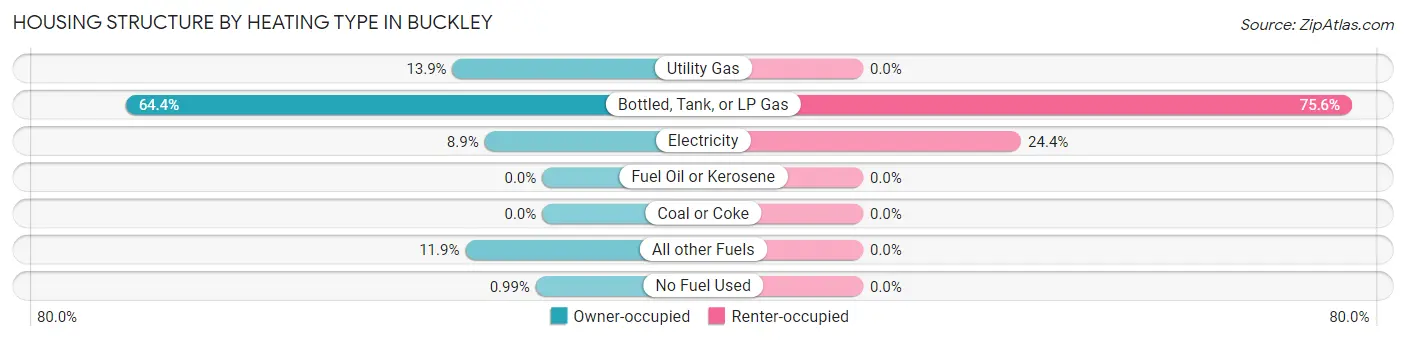
| Heating Type | Owner-occupied | Renter-occupied |
| Utility Gas | 28 (13.9%) | 0 (0.0%) |
| Bottled, Tank, or LP Gas | 130 (64.4%) | 34 (75.6%) |
| Electricity | 18 (8.9%) | 11 (24.4%) |
| Fuel Oil or Kerosene | 0 (0.0%) | 0 (0.0%) |
| Coal or Coke | 0 (0.0%) | 0 (0.0%) |
| All other Fuels | 24 (11.9%) | 0 (0.0%) |
| No Fuel Used | 2 (1.0%) | 0 (0.0%) |
| Total | 202 (100.0%) | 45 (100.0%) |
Household Vehicle Usage in Buckley
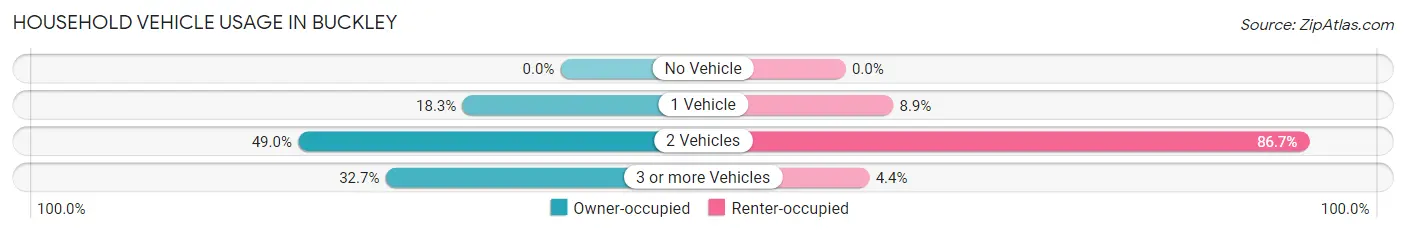
| Vehicles per Household | Owner-occupied | Renter-occupied |
| No Vehicle | 0 (0.0%) | 0 (0.0%) |
| 1 Vehicle | 37 (18.3%) | 4 (8.9%) |
| 2 Vehicles | 99 (49.0%) | 39 (86.7%) |
| 3 or more Vehicles | 66 (32.7%) | 2 (4.4%) |
| Total | 202 (100.0%) | 45 (100.0%) |
Real Estate & Mortgages in Buckley
Real Estate and Mortgage Overview in Buckley
| Characteristic | Without Mortgage | With Mortgage |
| Housing Units | 58 | 144 |
| Median Property Value | $183,300 | $150,000 |
| Median Household Income | $53,750 | $14 |
| Monthly Housing Costs | $560 | $0 |
| Real Estate Taxes | $1,938 | $15 |
Property Value by Mortgage Status in Buckley
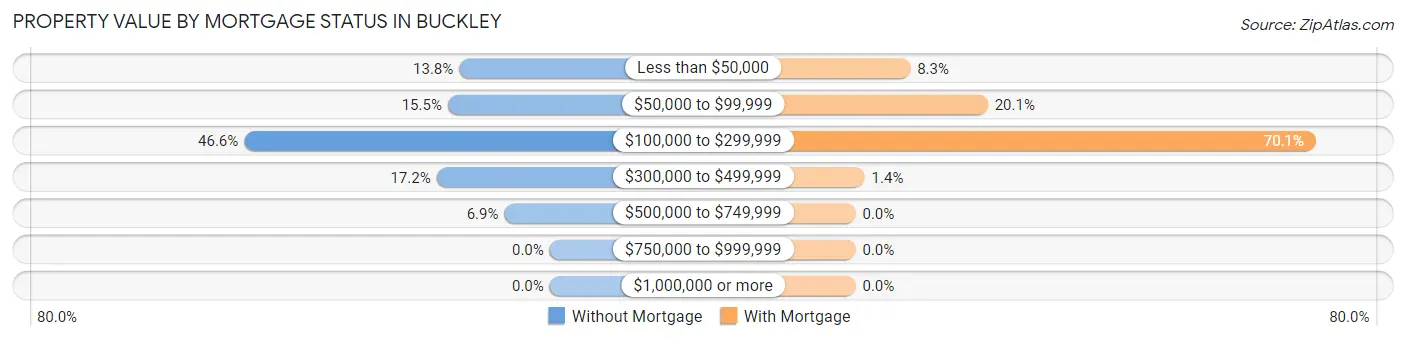
| Property Value | Without Mortgage | With Mortgage |
| Less than $50,000 | 8 (13.8%) | 12 (8.3%) |
| $50,000 to $99,999 | 9 (15.5%) | 29 (20.1%) |
| $100,000 to $299,999 | 27 (46.6%) | 101 (70.1%) |
| $300,000 to $499,999 | 10 (17.2%) | 2 (1.4%) |
| $500,000 to $749,999 | 4 (6.9%) | 0 (0.0%) |
| $750,000 to $999,999 | 0 (0.0%) | 0 (0.0%) |
| $1,000,000 or more | 0 (0.0%) | 0 (0.0%) |
| Total | 58 (100.0%) | 144 (100.0%) |
Household Income by Mortgage Status in Buckley
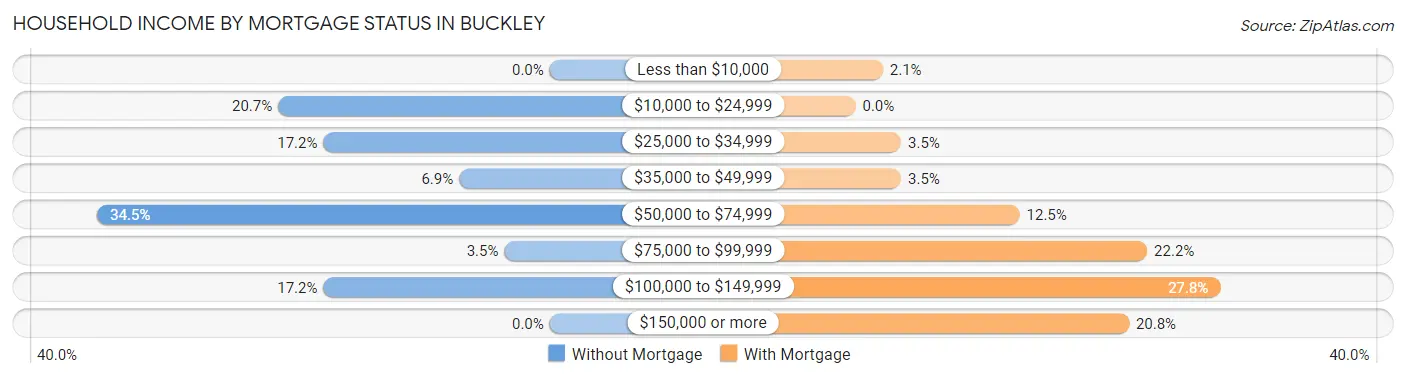
| Household Income | Without Mortgage | With Mortgage |
| Less than $10,000 | 0 (0.0%) | 3 (2.1%) |
| $10,000 to $24,999 | 12 (20.7%) | 0 (0.0%) |
| $25,000 to $34,999 | 10 (17.2%) | 5 (3.5%) |
| $35,000 to $49,999 | 4 (6.9%) | 5 (3.5%) |
| $50,000 to $74,999 | 20 (34.5%) | 18 (12.5%) |
| $75,000 to $99,999 | 2 (3.5%) | 32 (22.2%) |
| $100,000 to $149,999 | 10 (17.2%) | 40 (27.8%) |
| $150,000 or more | 0 (0.0%) | 30 (20.8%) |
| Total | 58 (100.0%) | 144 (100.0%) |
Property Value to Household Income Ratio in Buckley
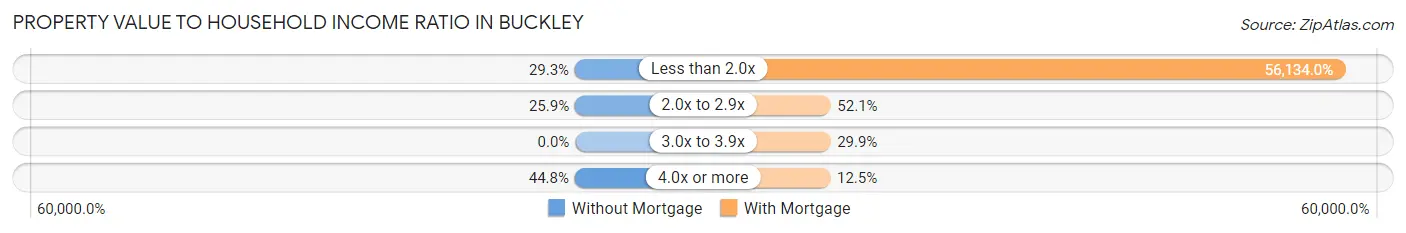
| Value-to-Income Ratio | Without Mortgage | With Mortgage |
| Less than 2.0x | 17 (29.3%) | 80,833 (56,134.0%) |
| 2.0x to 2.9x | 15 (25.9%) | 75 (52.1%) |
| 3.0x to 3.9x | 0 (0.0%) | 43 (29.9%) |
| 4.0x or more | 26 (44.8%) | 18 (12.5%) |
| Total | 58 (100.0%) | 144 (100.0%) |
Real Estate Taxes by Mortgage Status in Buckley
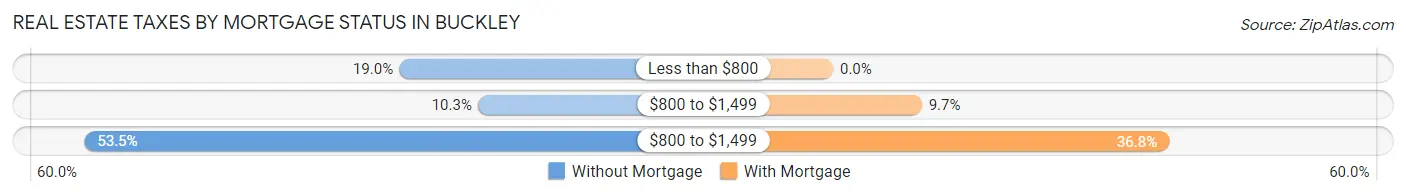
| Property Taxes | Without Mortgage | With Mortgage |
| Less than $800 | 11 (19.0%) | 0 (0.0%) |
| $800 to $1,499 | 6 (10.3%) | 14 (9.7%) |
| $800 to $1,499 | 31 (53.4%) | 53 (36.8%) |
| Total | 58 (100.0%) | 144 (100.0%) |
Health & Disability in Buckley
Health Insurance Coverage by Age in Buckley
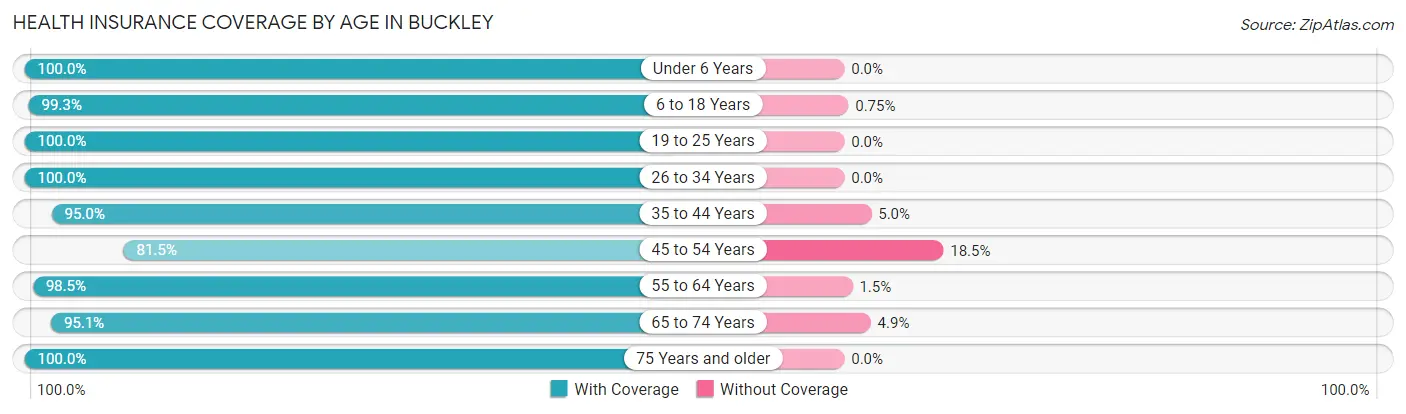
| Age Bracket | With Coverage | Without Coverage |
| Under 6 Years | 80 (100.0%) | 0 (0.0%) |
| 6 to 18 Years | 266 (99.3%) | 2 (0.7%) |
| 19 to 25 Years | 53 (100.0%) | 0 (0.0%) |
| 26 to 34 Years | 60 (100.0%) | 0 (0.0%) |
| 35 to 44 Years | 189 (95.0%) | 10 (5.0%) |
| 45 to 54 Years | 53 (81.5%) | 12 (18.5%) |
| 55 to 64 Years | 65 (98.5%) | 1 (1.5%) |
| 65 to 74 Years | 58 (95.1%) | 3 (4.9%) |
| 75 Years and older | 22 (100.0%) | 0 (0.0%) |
| Total | 846 (96.8%) | 28 (3.2%) |
Health Insurance Coverage by Citizenship Status in Buckley
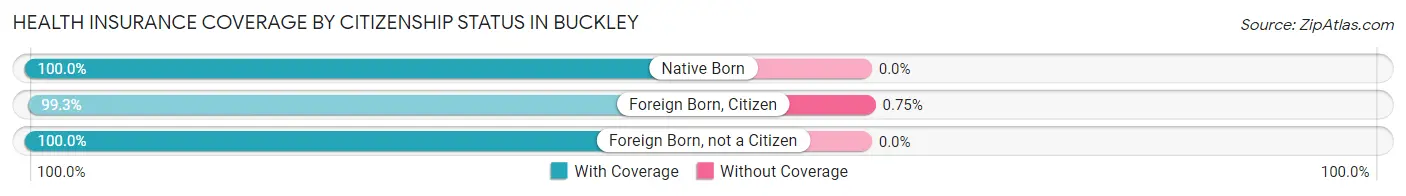
| Citizenship Status | With Coverage | Without Coverage |
| Native Born | 80 (100.0%) | 0 (0.0%) |
| Foreign Born, Citizen | 266 (99.3%) | 2 (0.7%) |
| Foreign Born, not a Citizen | 53 (100.0%) | 0 (0.0%) |
Health Insurance Coverage by Household Income in Buckley
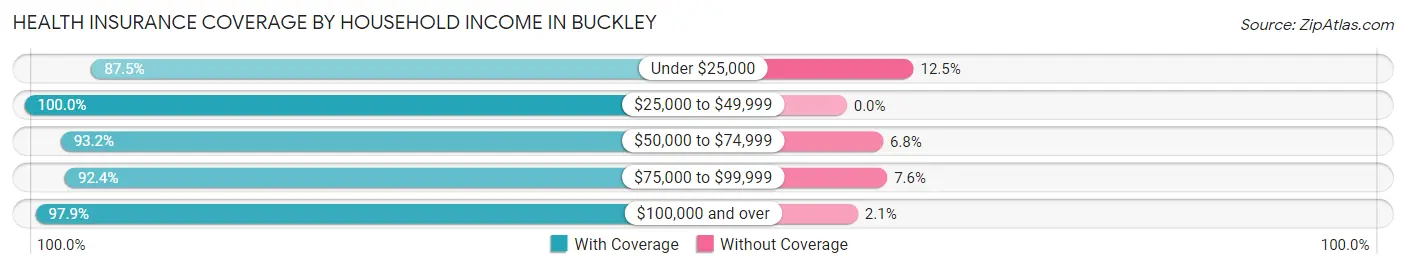
| Household Income | With Coverage | Without Coverage |
| Under $25,000 | 21 (87.5%) | 3 (12.5%) |
| $25,000 to $49,999 | 297 (100.0%) | 0 (0.0%) |
| $50,000 to $74,999 | 124 (93.2%) | 9 (6.8%) |
| $75,000 to $99,999 | 122 (92.4%) | 10 (7.6%) |
| $100,000 and over | 282 (97.9%) | 6 (2.1%) |
Public vs Private Health Insurance Coverage by Age in Buckley
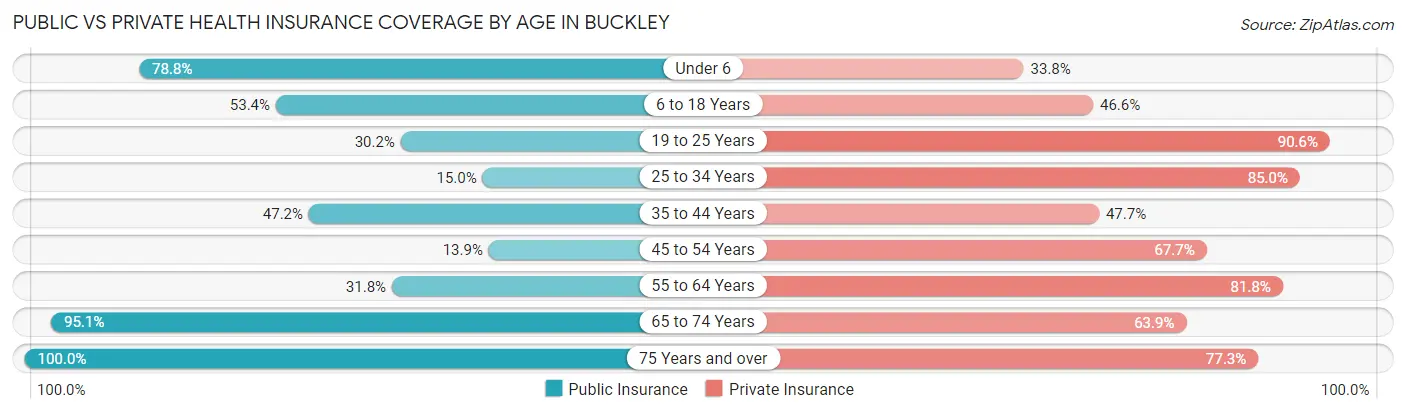
| Age Bracket | Public Insurance | Private Insurance |
| Under 6 | 63 (78.7%) | 27 (33.8%) |
| 6 to 18 Years | 143 (53.4%) | 125 (46.6%) |
| 19 to 25 Years | 16 (30.2%) | 48 (90.6%) |
| 25 to 34 Years | 9 (15.0%) | 51 (85.0%) |
| 35 to 44 Years | 94 (47.2%) | 95 (47.7%) |
| 45 to 54 Years | 9 (13.9%) | 44 (67.7%) |
| 55 to 64 Years | 21 (31.8%) | 54 (81.8%) |
| 65 to 74 Years | 58 (95.1%) | 39 (63.9%) |
| 75 Years and over | 22 (100.0%) | 17 (77.3%) |
| Total | 435 (49.8%) | 500 (57.2%) |
Disability Status by Sex by Age in Buckley
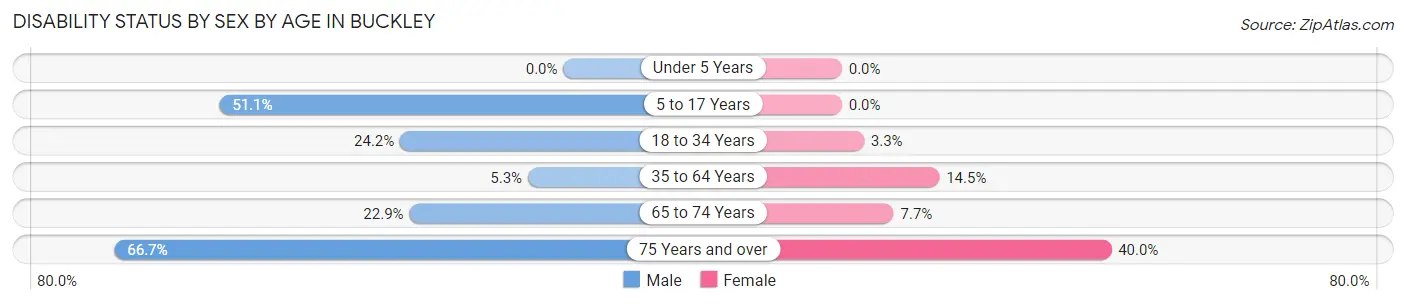
| Age Bracket | Male | Female |
| Under 5 Years | 0 (0.0%) | 0 (0.0%) |
| 5 to 17 Years | 95 (51.1%) | 0 (0.0%) |
| 18 to 34 Years | 16 (24.2%) | 2 (3.3%) |
| 35 to 64 Years | 9 (5.3%) | 23 (14.5%) |
| 65 to 74 Years | 8 (22.9%) | 2 (7.7%) |
| 75 Years and over | 8 (66.7%) | 4 (40.0%) |
Disability Class by Sex by Age in Buckley
Disability Class: Hearing Difficulty
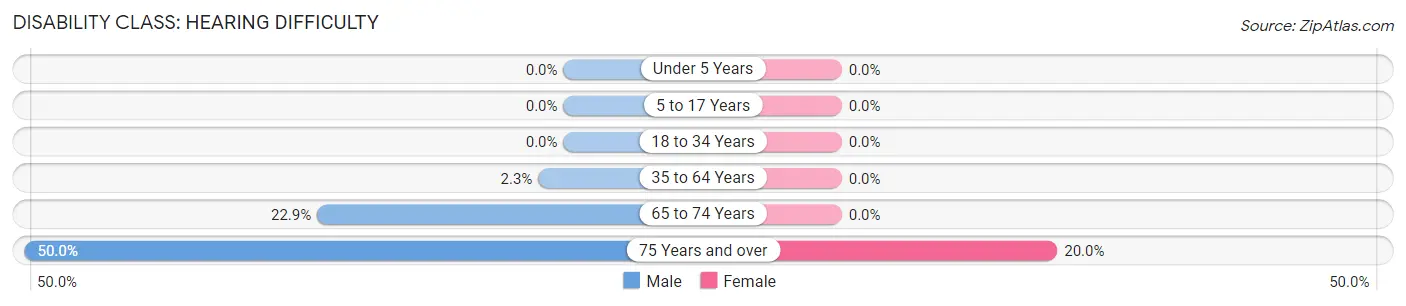
| Age Bracket | Male | Female |
| Under 5 Years | 0 (0.0%) | 0 (0.0%) |
| 5 to 17 Years | 0 (0.0%) | 0 (0.0%) |
| 18 to 34 Years | 0 (0.0%) | 0 (0.0%) |
| 35 to 64 Years | 4 (2.3%) | 0 (0.0%) |
| 65 to 74 Years | 8 (22.9%) | 0 (0.0%) |
| 75 Years and over | 6 (50.0%) | 2 (20.0%) |
Disability Class: Vision Difficulty
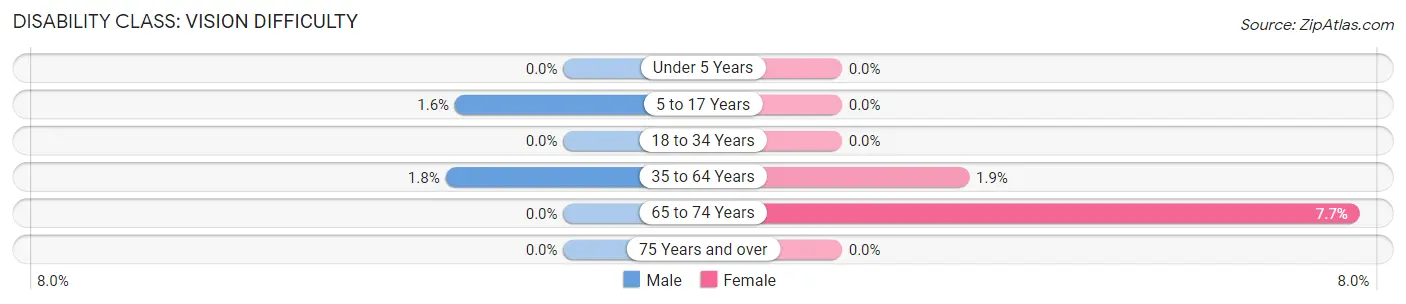
| Age Bracket | Male | Female |
| Under 5 Years | 0 (0.0%) | 0 (0.0%) |
| 5 to 17 Years | 3 (1.6%) | 0 (0.0%) |
| 18 to 34 Years | 0 (0.0%) | 0 (0.0%) |
| 35 to 64 Years | 3 (1.8%) | 3 (1.9%) |
| 65 to 74 Years | 0 (0.0%) | 2 (7.7%) |
| 75 Years and over | 0 (0.0%) | 0 (0.0%) |
Disability Class: Cognitive Difficulty
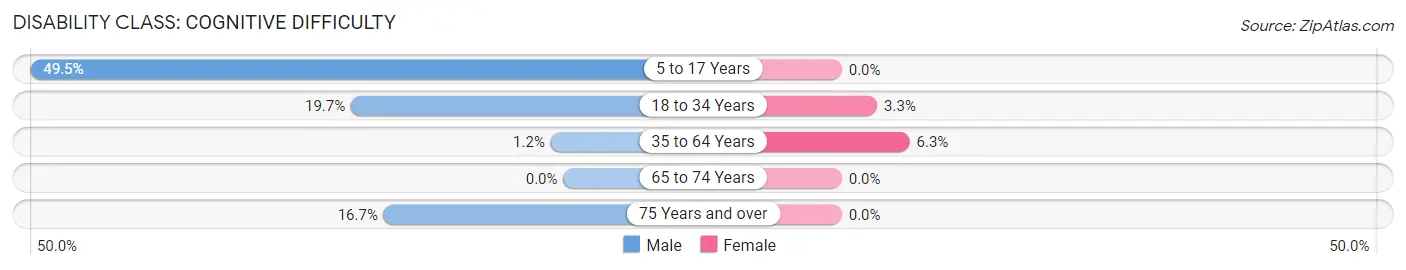
| Age Bracket | Male | Female |
| 5 to 17 Years | 92 (49.5%) | 0 (0.0%) |
| 18 to 34 Years | 13 (19.7%) | 2 (3.3%) |
| 35 to 64 Years | 2 (1.2%) | 10 (6.3%) |
| 65 to 74 Years | 0 (0.0%) | 0 (0.0%) |
| 75 Years and over | 2 (16.7%) | 0 (0.0%) |
Disability Class: Ambulatory Difficulty
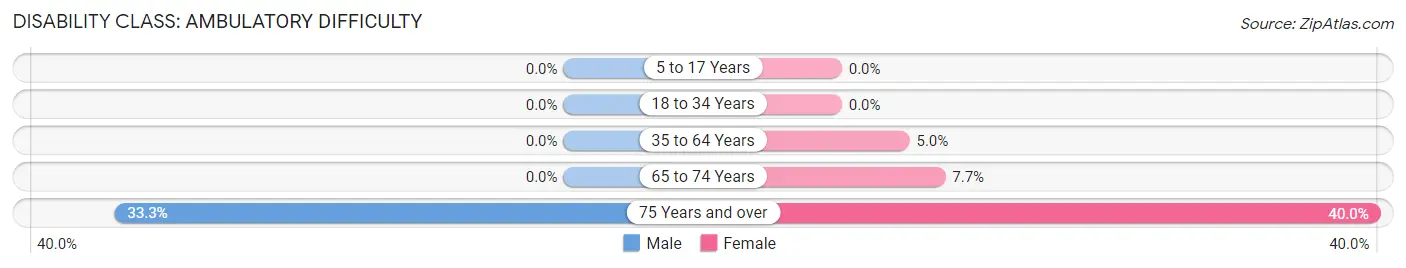
| Age Bracket | Male | Female |
| 5 to 17 Years | 0 (0.0%) | 0 (0.0%) |
| 18 to 34 Years | 0 (0.0%) | 0 (0.0%) |
| 35 to 64 Years | 0 (0.0%) | 8 (5.0%) |
| 65 to 74 Years | 0 (0.0%) | 2 (7.7%) |
| 75 Years and over | 4 (33.3%) | 4 (40.0%) |
Disability Class: Self-Care Difficulty
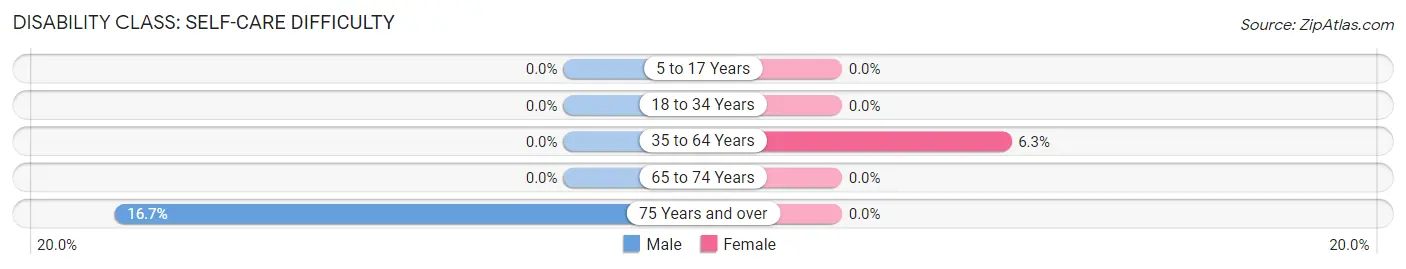
| Age Bracket | Male | Female |
| 5 to 17 Years | 0 (0.0%) | 0 (0.0%) |
| 18 to 34 Years | 0 (0.0%) | 0 (0.0%) |
| 35 to 64 Years | 0 (0.0%) | 10 (6.3%) |
| 65 to 74 Years | 0 (0.0%) | 0 (0.0%) |
| 75 Years and over | 2 (16.7%) | 0 (0.0%) |
Technology Access in Buckley
Computing Device Access in Buckley
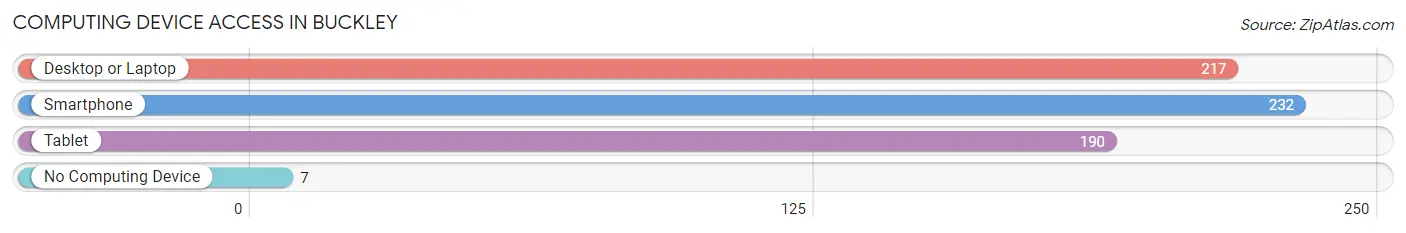
| Device Type | # Households | % Households |
| Desktop or Laptop | 217 | 87.8% |
| Smartphone | 232 | 93.9% |
| Tablet | 190 | 76.9% |
| No Computing Device | 7 | 2.8% |
| Total | 247 | 100.0% |
Internet Access in Buckley
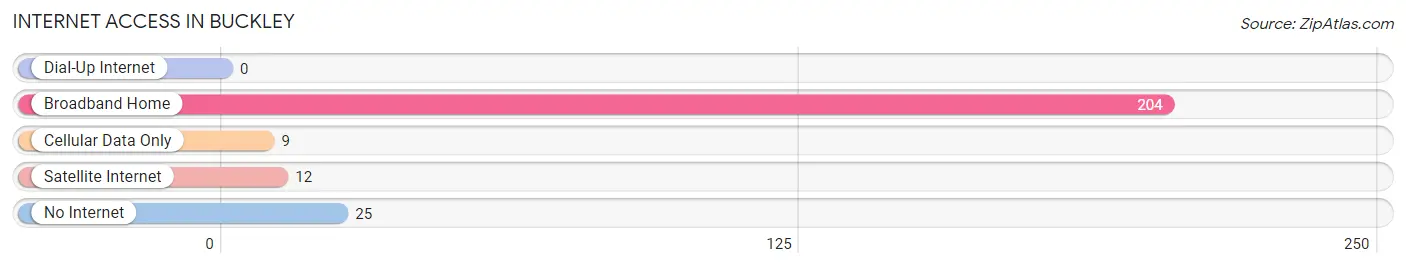
| Internet Type | # Households | % Households |
| Dial-Up Internet | 0 | 0.0% |
| Broadband Home | 204 | 82.6% |
| Cellular Data Only | 9 | 3.6% |
| Satellite Internet | 12 | 4.9% |
| No Internet | 25 | 10.1% |
| Total | 247 | 100.0% |
Buckley Summary
Buckley is a small village located in the northern part of Michigan’s Lower Peninsula. It is situated in the middle of the Manistee National Forest, and is surrounded by rolling hills and lush forests. The village is home to a population of just over 1,000 people, and is known for its small-town charm and friendly atmosphere.
Geography
Buckley is located in the northern part of Michigan’s Lower Peninsula, in the county of Wexford. It is situated in the middle of the Manistee National Forest, and is surrounded by rolling hills and lush forests. The village is located on the banks of the Manistee River, and is just a few miles from Lake Michigan. The village is also close to the towns of Cadillac and Traverse City.
The village of Buckley is located at an elevation of 890 feet above sea level. The climate in the area is generally mild, with temperatures ranging from the low 30s in the winter to the mid-80s in the summer. The area receives an average of 40 inches of precipitation each year, with most of it falling in the form of snow.
Economy
The economy of Buckley is largely based on tourism and agriculture. The village is home to several small businesses, including restaurants, shops, and a few small manufacturing companies. The village also has a small airport, which serves as a hub for private and commercial flights.
Agriculture is also an important part of the local economy. The area is home to several farms, which produce a variety of crops, including corn, soybeans, and wheat. The village also has a few wineries, which produce a variety of wines.
Demographics
As of the 2010 census, the population of Buckley was 1,072. The racial makeup of the village was 97.2% White, 0.7% African American, 0.3% Native American, 0.2% Asian, 0.1% Pacific Islander, 0.2% from other races, and 1.3% from two or more races. Hispanic or Latino of any race were 1.3% of the population.
The median household income in Buckley was $37,917, and the median family income was $45,625. The per capita income for the village was $19,945. About 11.2% of families and 14.2% of the population were below the poverty line, including 18.2% of those under age 18 and 8.3% of those age 65 or over.
History
The area that is now Buckley was first settled in the early 1800s by a group of settlers from New York. The village was originally known as “Buckley’s Corners”, and was named after the first settler, John Buckley. The village was officially incorporated in 1871.
In the late 1800s, the village was a popular destination for tourists, who came to enjoy the area’s natural beauty and outdoor activities. The village was also home to several small businesses, including a sawmill, a grist mill, and a blacksmith shop.
In the early 1900s, the village began to decline as the lumber industry moved away from the area. The village was also hit hard by the Great Depression, and many of the businesses closed. However, the village was able to survive, and in recent years it has seen a resurgence in tourism and economic activity.
Common Questions
What is Per Capita Income in Buckley?
Per Capita income in Buckley is $21,940.
What is the Median Family Income in Buckley?
Median Family Income in Buckley is $67,708.
What is the Median Household income in Buckley?
Median Household Income in Buckley is $64,931.
What is Income or Wage Gap in Buckley?
Income or Wage Gap in Buckley is 7.7%.
Women in Buckley earn 92.3 cents for every dollar earned by a man.
What is Inequality or Gini Index in Buckley?
Inequality or Gini Index in Buckley is 0.30.
What is the Total Population of Buckley?
Total Population of Buckley is 874.
What is the Total Male Population of Buckley?
Total Male Population of Buckley is 508.
What is the Total Female Population of Buckley?
Total Female Population of Buckley is 366.
What is the Ratio of Males per 100 Females in Buckley?
There are 138.80 Males per 100 Females in Buckley.
What is the Ratio of Females per 100 Males in Buckley?
There are 72.05 Females per 100 Males in Buckley.
What is the Median Population Age in Buckley?
Median Population Age in Buckley is 31.4 Years.
What is the Average Family Size in Buckley
Average Family Size in Buckley is 4.1 People.
What is the Average Household Size in Buckley
Average Household Size in Buckley is 3.5 People.
How Large is the Labor Force in Buckley?
There are 381 People in the Labor Forcein in Buckley.
What is the Percentage of People in the Labor Force in Buckley?
62.4% of People are in the Labor Force in Buckley.
What is the Unemployment Rate in Buckley?
Unemployment Rate in Buckley is 6.3%.