Carolina, RI Map & Demographics
Carolina Map
Carolina Overview
$32,499
PER CAPITA INCOME
$105,677
AVG FAMILY INCOME
$92,419
AVG HOUSEHOLD INCOME
46.0%
WAGE / INCOME GAP [ % ]
54.0¢/ $1
WAGE / INCOME GAP [ $ ]
0.35
INEQUALITY / GINI INDEX
1,165
TOTAL POPULATION
524
MALE POPULATION
641
FEMALE POPULATION
81.75
MALES / 100 FEMALES
122.33
FEMALES / 100 MALES
43.5
MEDIAN AGE
3.7
AVG FAMILY SIZE
3.0
AVG HOUSEHOLD SIZE
586
LABOR FORCE [ PEOPLE ]
62.9%
PERCENT IN LABOR FORCE
6.1%
UNEMPLOYMENT RATE
Carolina Zip Codes
Carolina Area Codes
Income in Carolina
Income Overview in Carolina
Per Capita Income in Carolina is $32,499, while median incomes of families and households are $105,677 and $92,419 respectively.
| Characteristic | Number | Measure |
| Per Capita Income | 1,165 | $32,499 |
| Median Family Income | 263 | $105,677 |
| Mean Family Income | 263 | $108,300 |
| Median Household Income | 388 | $92,419 |
| Mean Household Income | 388 | $95,345 |
| Income Deficit | 263 | $0 |
| Wage / Income Gap (%) | 1,165 | 45.97% |
| Wage / Income Gap ($) | 1,165 | 54.03¢ per $1 |
| Gini / Inequality Index | 1,165 | 0.35 |
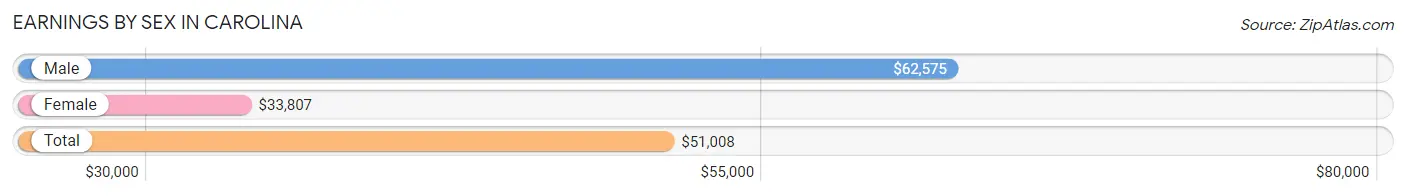
Earnings by Sex in Carolina
Average Earnings in Carolina are $51,008, $62,575 for men and $33,807 for women, a difference of 46.0%.
| Sex | Number | Average Earnings |
| Male | 322 (55.0%) | $62,575 |
| Female | 263 (45.0%) | $33,807 |
| Total | 585 (100.0%) | $51,008 |
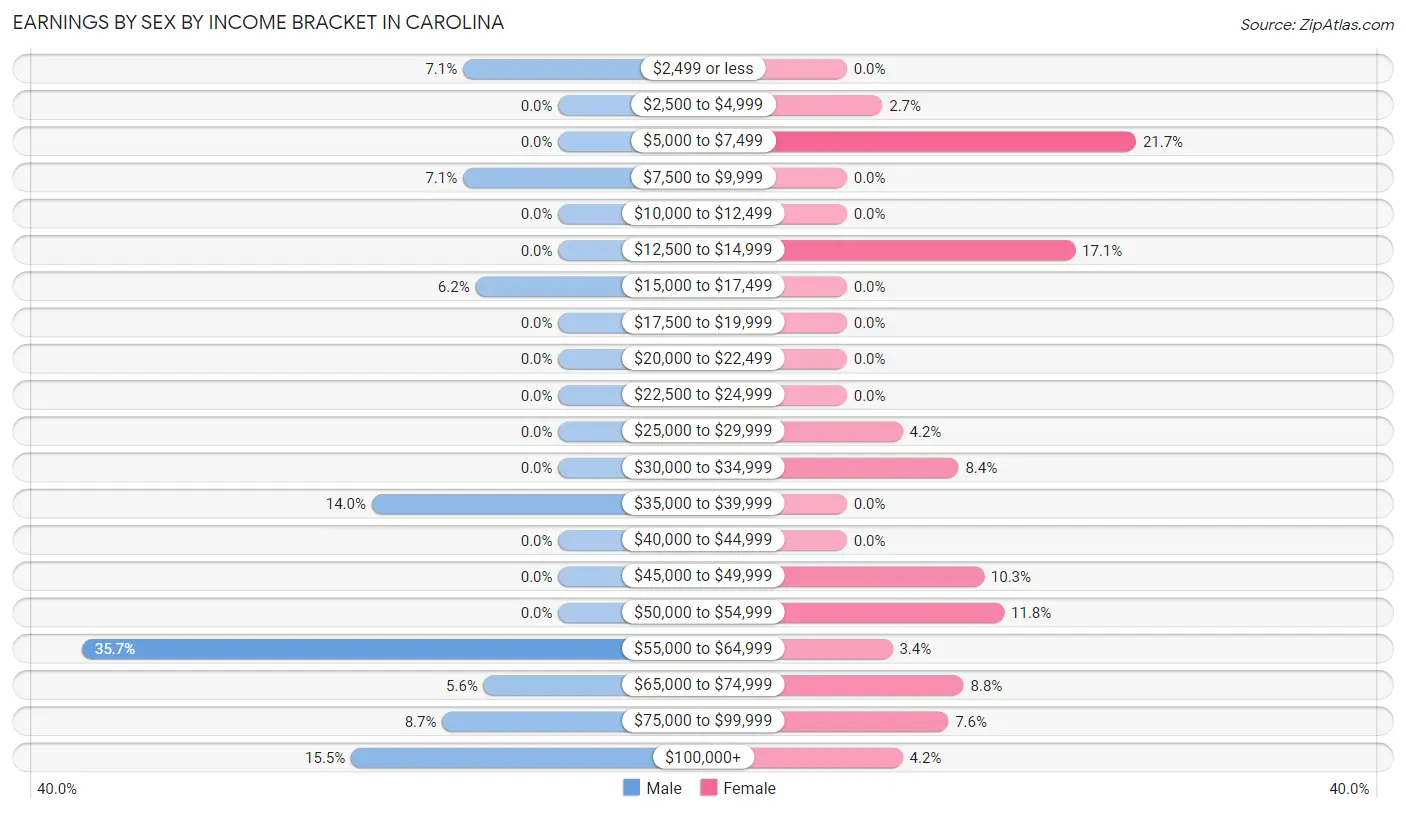
Earnings by Sex by Income Bracket in Carolina
The most common earnings brackets in Carolina are $55,000 to $64,999 for men (115 | 35.7%) and $5,000 to $7,499 for women (57 | 21.7%).
| Income | Male | Female |
| $2,499 or less | 23 (7.1%) | 0 (0.0%) |
| $2,500 to $4,999 | 0 (0.0%) | 7 (2.7%) |
| $5,000 to $7,499 | 0 (0.0%) | 57 (21.7%) |
| $7,500 to $9,999 | 23 (7.1%) | 0 (0.0%) |
| $10,000 to $12,499 | 0 (0.0%) | 0 (0.0%) |
| $12,500 to $14,999 | 0 (0.0%) | 45 (17.1%) |
| $15,000 to $17,499 | 20 (6.2%) | 0 (0.0%) |
| $17,500 to $19,999 | 0 (0.0%) | 0 (0.0%) |
| $20,000 to $22,499 | 0 (0.0%) | 0 (0.0%) |
| $22,500 to $24,999 | 0 (0.0%) | 0 (0.0%) |
| $25,000 to $29,999 | 0 (0.0%) | 11 (4.2%) |
| $30,000 to $34,999 | 0 (0.0%) | 22 (8.4%) |
| $35,000 to $39,999 | 45 (14.0%) | 0 (0.0%) |
| $40,000 to $44,999 | 0 (0.0%) | 0 (0.0%) |
| $45,000 to $49,999 | 0 (0.0%) | 27 (10.3%) |
| $50,000 to $54,999 | 0 (0.0%) | 31 (11.8%) |
| $55,000 to $64,999 | 115 (35.7%) | 9 (3.4%) |
| $65,000 to $74,999 | 18 (5.6%) | 23 (8.7%) |
| $75,000 to $99,999 | 28 (8.7%) | 20 (7.6%) |
| $100,000+ | 50 (15.5%) | 11 (4.2%) |
| Total | 322 (100.0%) | 263 (100.0%) |
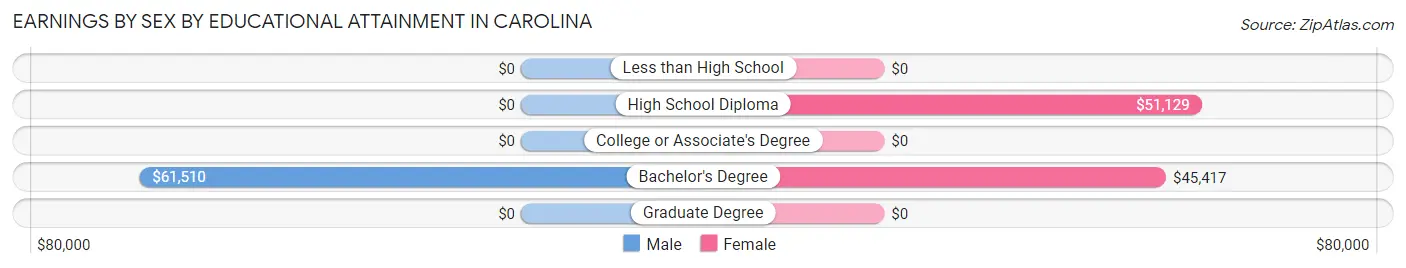
Earnings by Sex by Educational Attainment in Carolina
Average earnings in Carolina are $60,859 for men and $33,807 for women, a difference of 44.5%. Men with an educational attainment of bachelor's degree enjoy the highest average annual earnings of $61,510, while those with bachelor's degree education earn the least with $61,510. Women with an educational attainment of high school diploma earn the most with the average annual earnings of $51,129, while those with bachelor's degree education have the smallest earnings of $45,417.
| Educational Attainment | Male Income | Female Income |
| Less than High School | - | - |
| High School Diploma | - | - |
| College or Associate's Degree | - | - |
| Bachelor's Degree | $61,510 | $45,417 |
| Graduate Degree | - | - |
| Total | $60,859 | $33,807 |
Family Income in Carolina
Family Income Brackets in Carolina
According to the Carolina family income data, there are 110 families falling into the $100,000 to $149,999 income range, which is the most common income bracket and makes up 41.8% of all families.
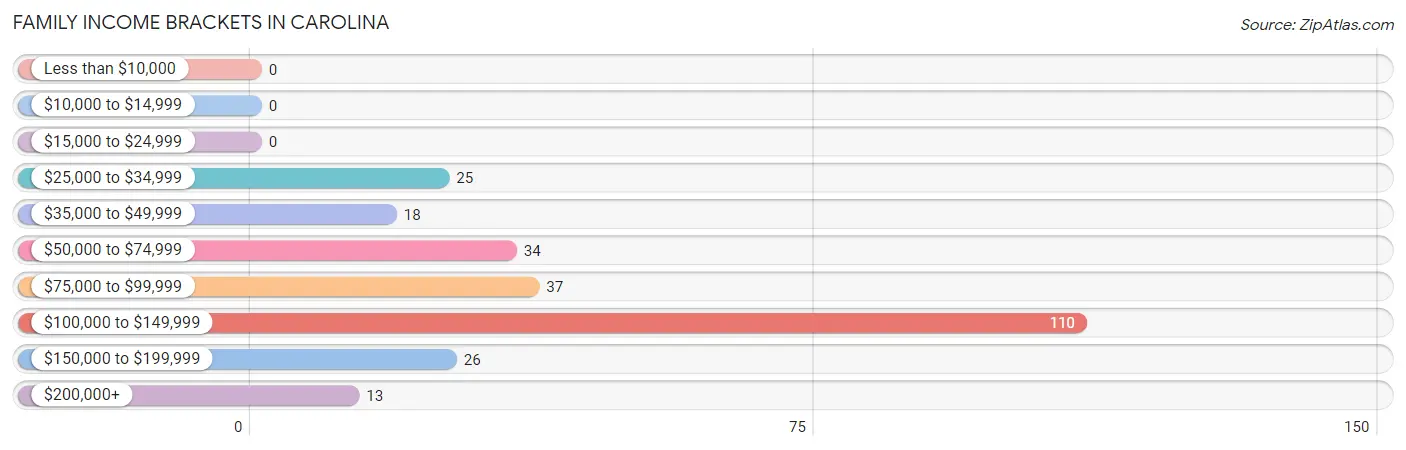
| Income Bracket | # Families | % Families |
| Less than $10,000 | 0 | 0.0% |
| $10,000 to $14,999 | 0 | 0.0% |
| $15,000 to $24,999 | 0 | 0.0% |
| $25,000 to $34,999 | 25 | 9.5% |
| $35,000 to $49,999 | 18 | 6.8% |
| $50,000 to $74,999 | 34 | 12.9% |
| $75,000 to $99,999 | 37 | 14.1% |
| $100,000 to $149,999 | 110 | 41.8% |
| $150,000 to $199,999 | 26 | 9.9% |
| $200,000+ | 13 | 4.9% |
Family Income by Famaliy Size in Carolina
4-person families (78 | 29.7%) account for the highest median family income in Carolina with $130,469 per family, while 2-person families (93 | 35.4%) have the highest median income of $64,258 per family member.
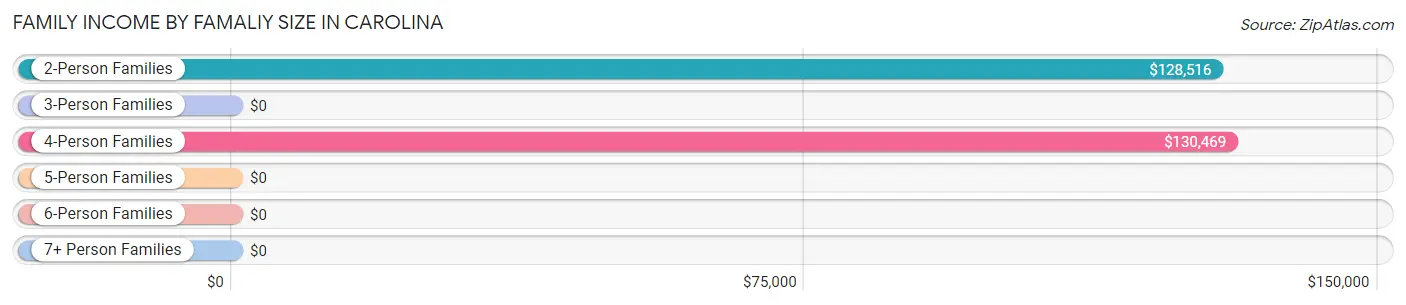
| Income Bracket | # Families | Median Income |
| 2-Person Families | 93 (35.4%) | $128,516 |
| 3-Person Families | 25 (9.5%) | $0 |
| 4-Person Families | 78 (29.7%) | $130,469 |
| 5-Person Families | 23 (8.7%) | $0 |
| 6-Person Families | 31 (11.8%) | $0 |
| 7+ Person Families | 13 (4.9%) | $0 |
| Total | 263 (100.0%) | $105,677 |
Family Income by Number of Earners in Carolina
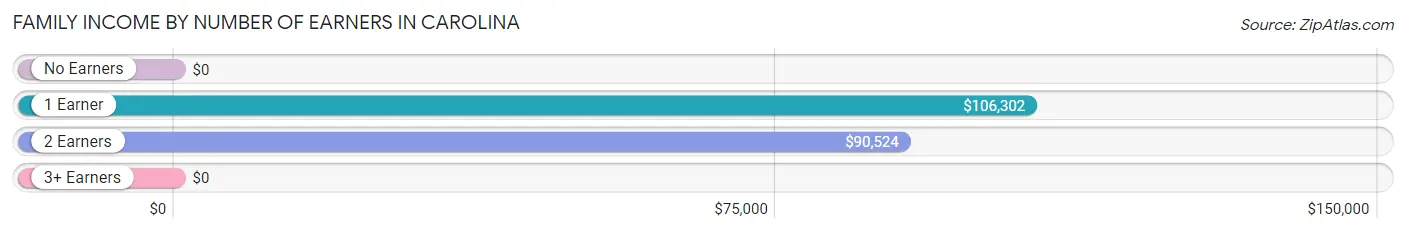
| Number of Earners | # Families | Median Income |
| No Earners | 34 (12.9%) | $0 |
| 1 Earner | 97 (36.9%) | $106,302 |
| 2 Earners | 71 (27.0%) | $90,524 |
| 3+ Earners | 61 (23.2%) | $0 |
| Total | 263 (100.0%) | $105,677 |
Household Income in Carolina
Household Income Brackets in Carolina
With 139 households falling in the category, the $100,000 to $149,999 income range is the most frequent in Carolina, accounting for 35.8% of all households.
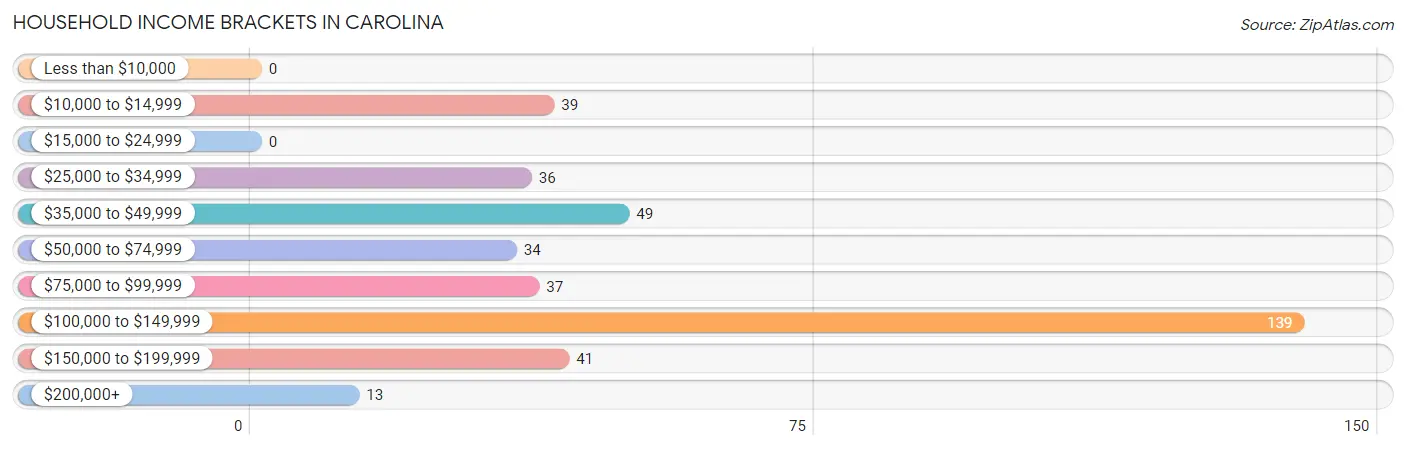
| Income Bracket | # Households | % Households |
| Less than $10,000 | 0 | 0.0% |
| $10,000 to $14,999 | 39 | 10.1% |
| $15,000 to $24,999 | 0 | 0.0% |
| $25,000 to $34,999 | 36 | 9.3% |
| $35,000 to $49,999 | 49 | 12.6% |
| $50,000 to $74,999 | 34 | 8.8% |
| $75,000 to $99,999 | 37 | 9.5% |
| $100,000 to $149,999 | 139 | 35.8% |
| $150,000 to $199,999 | 41 | 10.6% |
| $200,000+ | 13 | 3.4% |
Household Income by Householder Age in Carolina
The median household income in Carolina is $92,419, with the highest median household income of $107,292 found in the 45 to 64 years age bracket for the primary householder. A total of 182 households (46.9%) fall into this category.
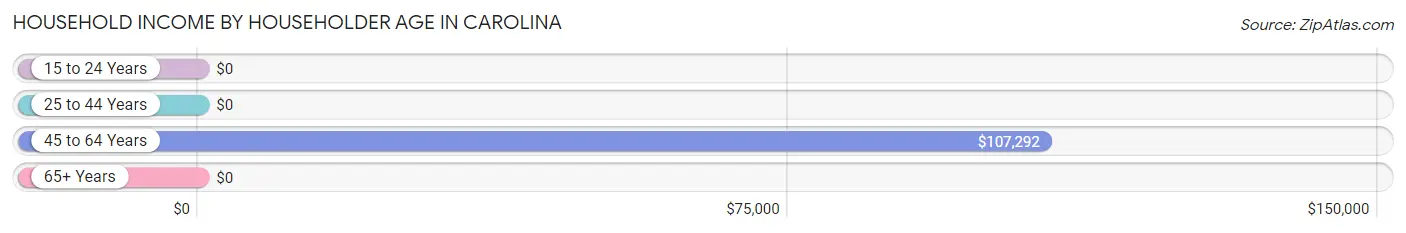
| Income Bracket | # Households | Median Income |
| 15 to 24 Years | 0 (0.0%) | $0 |
| 25 to 44 Years | 58 (14.9%) | $0 |
| 45 to 64 Years | 182 (46.9%) | $107,292 |
| 65+ Years | 148 (38.1%) | $0 |
| Total | 388 (100.0%) | $92,419 |
Poverty in Carolina
Income Below Poverty by Sex and Age in Carolina
With 4.4% poverty level for males and 3.3% for females among the residents of Carolina, 55 to 64 year old males and 25 to 34 year old females are the most vulnerable to poverty, with 23 males (60.5%) and 21 females (100.0%) in their respective age groups living below the poverty level.
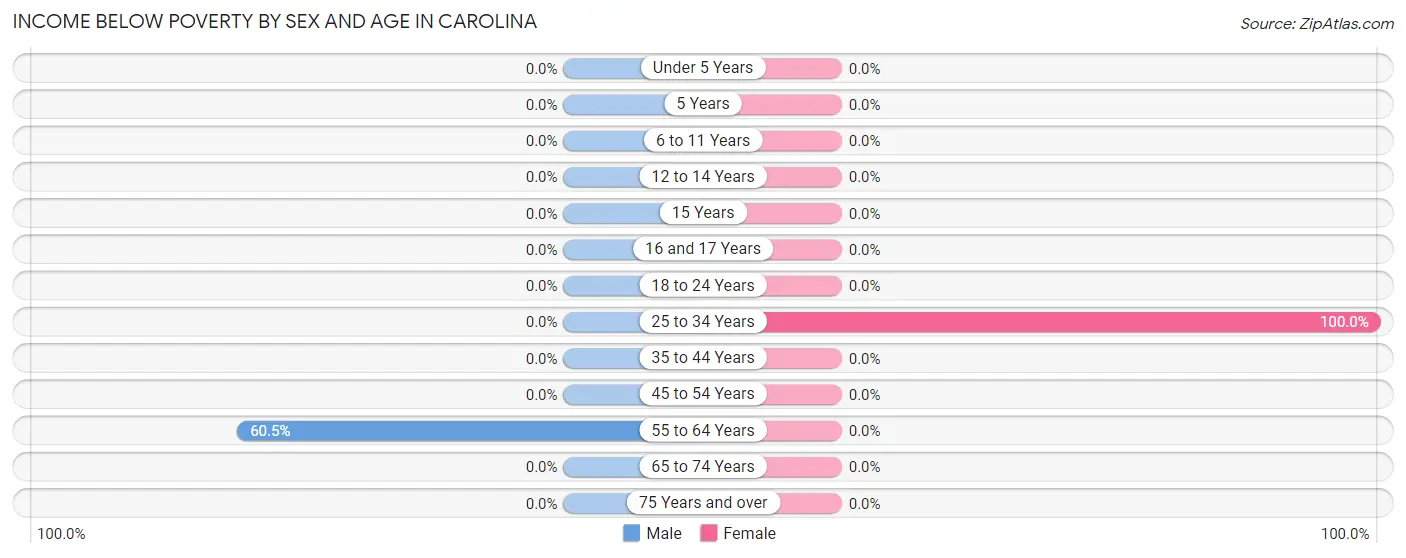
| Age Bracket | Male | Female |
| Under 5 Years | 0 (0.0%) | 0 (0.0%) |
| 5 Years | 0 (0.0%) | 0 (0.0%) |
| 6 to 11 Years | 0 (0.0%) | 0 (0.0%) |
| 12 to 14 Years | 0 (0.0%) | 0 (0.0%) |
| 15 Years | 0 (0.0%) | 0 (0.0%) |
| 16 and 17 Years | 0 (0.0%) | 0 (0.0%) |
| 18 to 24 Years | 0 (0.0%) | 0 (0.0%) |
| 25 to 34 Years | 0 (0.0%) | 21 (100.0%) |
| 35 to 44 Years | 0 (0.0%) | 0 (0.0%) |
| 45 to 54 Years | 0 (0.0%) | 0 (0.0%) |
| 55 to 64 Years | 23 (60.5%) | 0 (0.0%) |
| 65 to 74 Years | 0 (0.0%) | 0 (0.0%) |
| 75 Years and over | 0 (0.0%) | 0 (0.0%) |
| Total | 23 (4.4%) | 21 (3.3%) |
Income Above Poverty by Sex and Age in Carolina
According to the poverty statistics in Carolina, males aged under 5 years and females aged 6 to 11 years are the age groups that are most secure financially, with 100.0% of males and 100.0% of females in these age groups living above the poverty line.
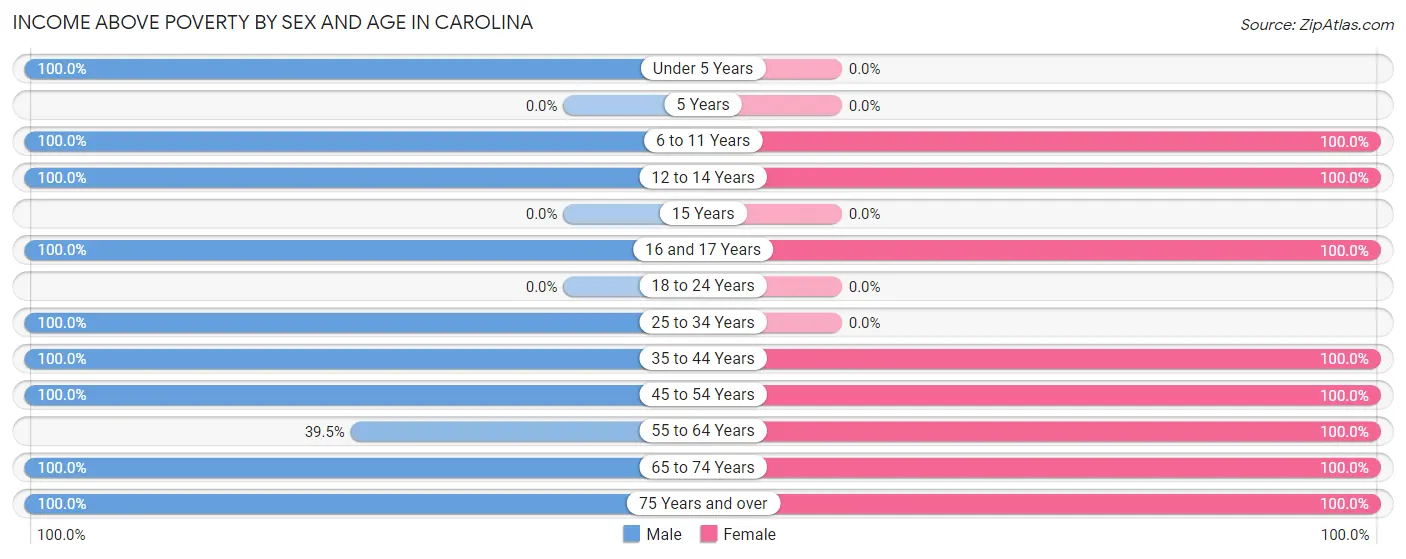
| Age Bracket | Male | Female |
| Under 5 Years | 13 (100.0%) | 0 (0.0%) |
| 5 Years | 0 (0.0%) | 0 (0.0%) |
| 6 to 11 Years | 41 (100.0%) | 126 (100.0%) |
| 12 to 14 Years | 27 (100.0%) | 26 (100.0%) |
| 15 Years | 0 (0.0%) | 0 (0.0%) |
| 16 and 17 Years | 67 (100.0%) | 56 (100.0%) |
| 18 to 24 Years | 0 (0.0%) | 0 (0.0%) |
| 25 to 34 Years | 27 (100.0%) | 0 (0.0%) |
| 35 to 44 Years | 83 (100.0%) | 123 (100.0%) |
| 45 to 54 Years | 135 (100.0%) | 87 (100.0%) |
| 55 to 64 Years | 15 (39.5%) | 90 (100.0%) |
| 65 to 74 Years | 60 (100.0%) | 81 (100.0%) |
| 75 Years and over | 33 (100.0%) | 31 (100.0%) |
| Total | 501 (95.6%) | 620 (96.7%) |
Income Below Poverty Among Married-Couple Families in Carolina
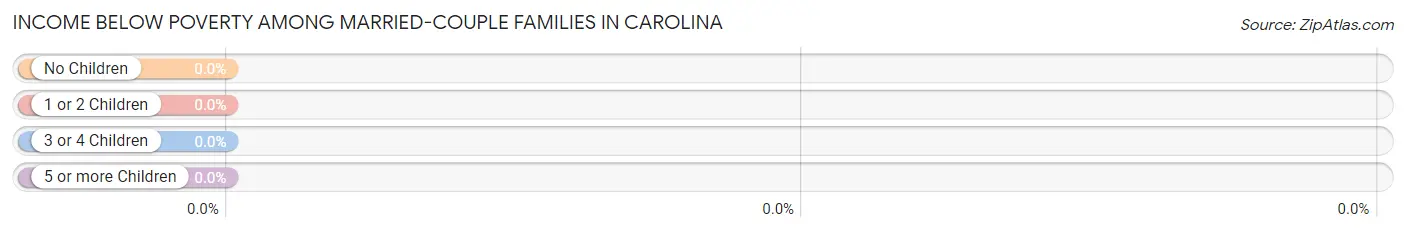
| Children | Above Poverty | Below Poverty |
| No Children | 82 (100.0%) | 0 (0.0%) |
| 1 or 2 Children | 103 (100.0%) | 0 (0.0%) |
| 3 or 4 Children | 44 (100.0%) | 0 (0.0%) |
| 5 or more Children | 0 (0.0%) | 0 (0.0%) |
| Total | 229 (100.0%) | 0 (0.0%) |
Income Below Poverty Among Single-Parent Households in Carolina
| Children | Single Father | Single Mother |
| No Children | 0 (0.0%) | 0 (0.0%) |
| 1 or 2 Children | 0 (0.0%) | 0 (0.0%) |
| 3 or 4 Children | 0 (0.0%) | 0 (0.0%) |
| 5 or more Children | 0 (0.0%) | 0 (0.0%) |
| Total | 0 (0.0%) | 0 (0.0%) |
Income Below Poverty Among Married-Couple vs Single-Parent Households in Carolina
| Children | Married-Couple Families | Single-Parent Households |
| No Children | 0 (0.0%) | 0 (0.0%) |
| 1 or 2 Children | 0 (0.0%) | 0 (0.0%) |
| 3 or 4 Children | 0 (0.0%) | 0 (0.0%) |
| 5 or more Children | 0 (0.0%) | 0 (0.0%) |
| Total | 0 (0.0%) | 0 (0.0%) |
Race in Carolina
The most populous races in Carolina are White / Caucasian (1,136 | 97.5%), and Two or more Races (29 | 2.5%).
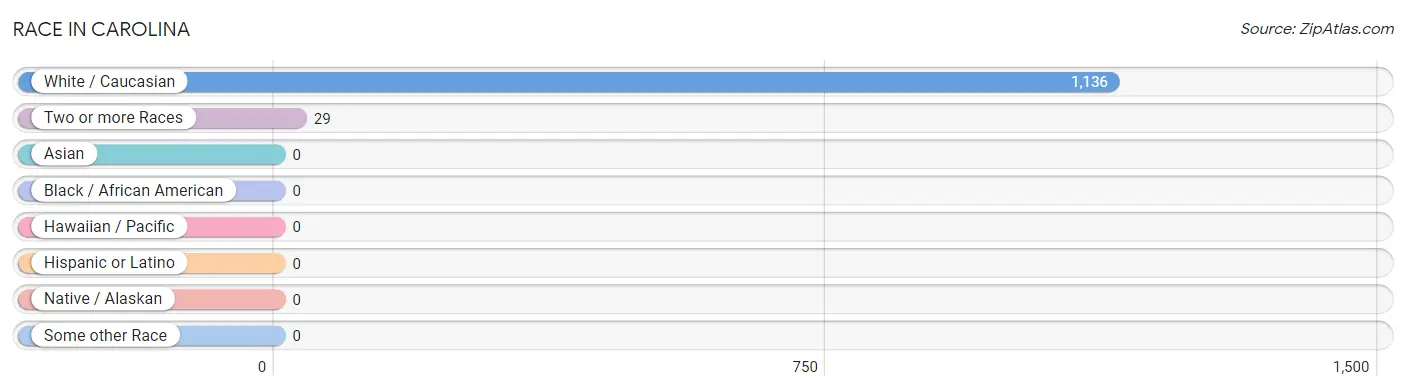
| Race | # Population | % Population |
| Asian | 0 | 0.0% |
| Black / African American | 0 | 0.0% |
| Hawaiian / Pacific | 0 | 0.0% |
| Hispanic or Latino | 0 | 0.0% |
| Native / Alaskan | 0 | 0.0% |
| White / Caucasian | 1,136 | 97.5% |
| Two or more Races | 29 | 2.5% |
| Some other Race | 0 | 0.0% |
| Total | 1,165 | 100.0% |
Ancestry in Carolina
The most populous ancestries reported in Carolina are English (239 | 20.5%), Irish (173 | 14.8%), German (86 | 7.4%), French (75 | 6.4%), and Italian (73 | 6.3%), together accounting for 55.5% of all Carolina residents.
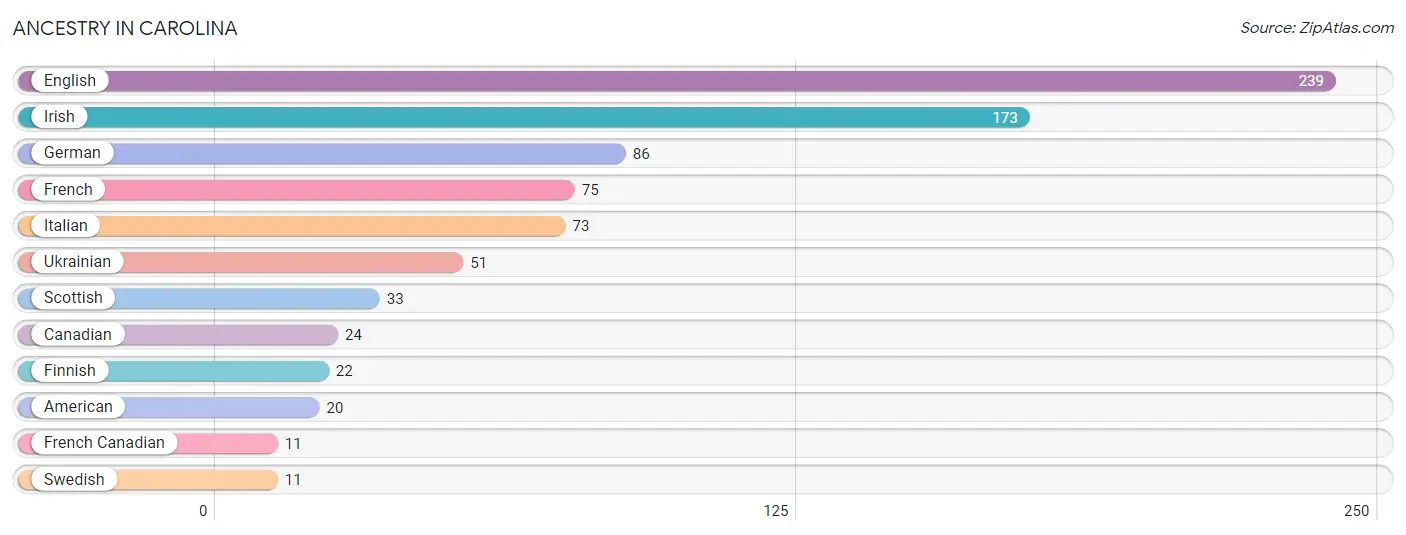
| Ancestry | # Population | % Population |
| American | 20 | 1.7% |
| Canadian | 24 | 2.1% |
| English | 239 | 20.5% |
| Finnish | 22 | 1.9% |
| French | 75 | 6.4% |
| French Canadian | 11 | 0.9% |
| German | 86 | 7.4% |
| Irish | 173 | 14.8% |
| Italian | 73 | 6.3% |
| Scottish | 33 | 2.8% |
| Swedish | 11 | 0.9% |
| Ukrainian | 51 | 4.4% | View All 12 Rows |
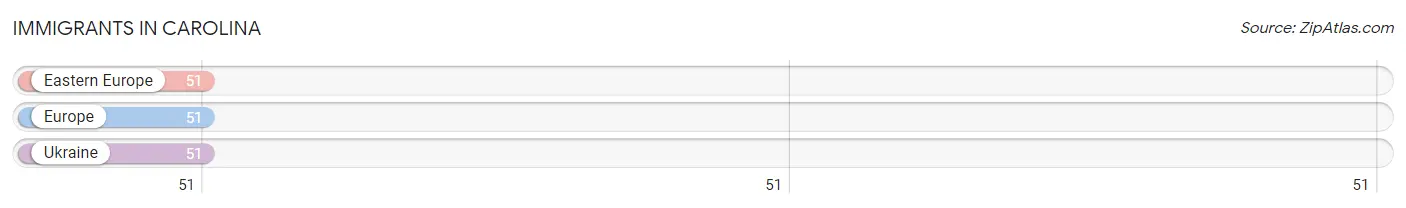
Immigrants in Carolina
The most numerous immigrant groups reported in Carolina came from Eastern Europe (51 | 4.4%), Europe (51 | 4.4%), and Ukraine (51 | 4.4%), together accounting for 13.1% of all Carolina residents.
| Immigration Origin | # Population | % Population |
| Eastern Europe | 51 | 4.4% |
| Europe | 51 | 4.4% |
| Ukraine | 51 | 4.4% | View All 3 Rows |
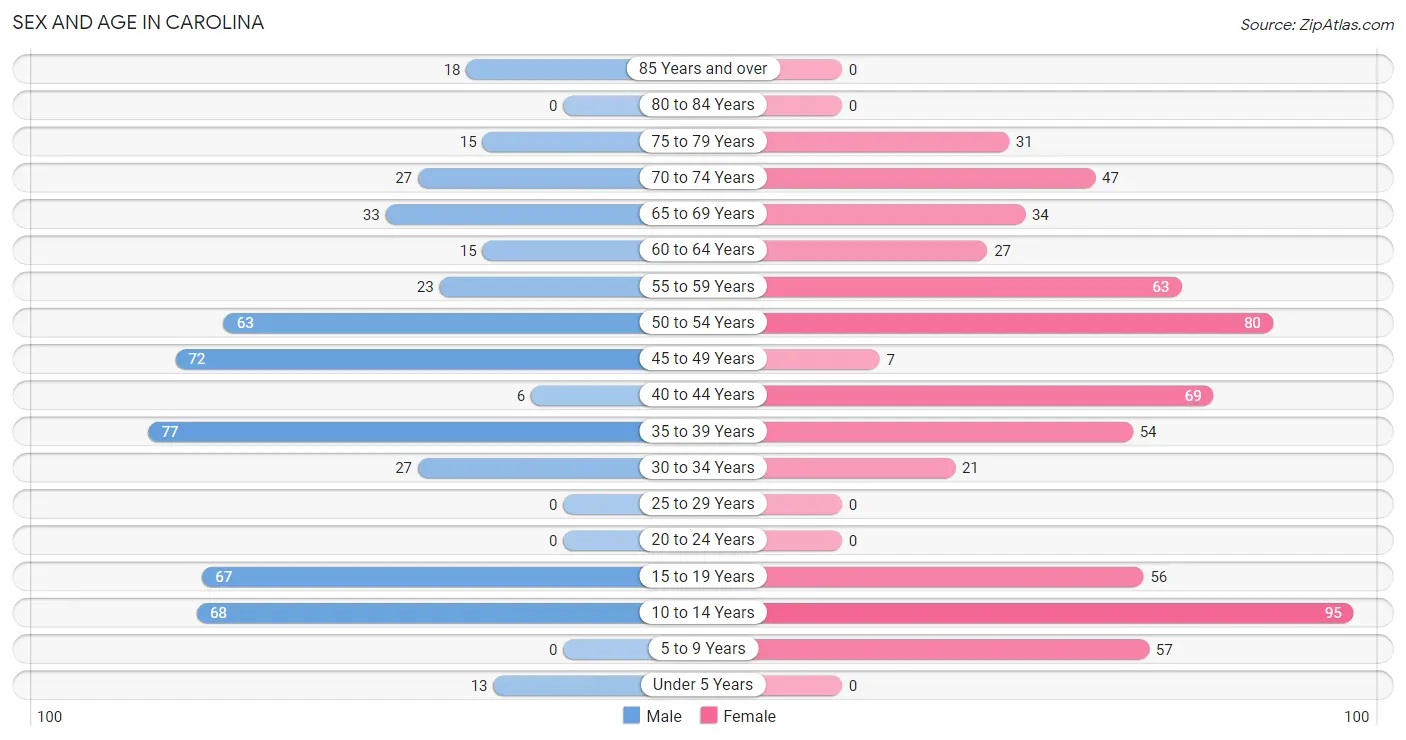
Sex and Age in Carolina
Sex and Age in Carolina
The most populous age groups in Carolina are 35 to 39 Years (77 | 14.7%) for men and 10 to 14 Years (95 | 14.8%) for women.
| Age Bracket | Male | Female |
| Under 5 Years | 13 (2.5%) | 0 (0.0%) |
| 5 to 9 Years | 0 (0.0%) | 57 (8.9%) |
| 10 to 14 Years | 68 (13.0%) | 95 (14.8%) |
| 15 to 19 Years | 67 (12.8%) | 56 (8.7%) |
| 20 to 24 Years | 0 (0.0%) | 0 (0.0%) |
| 25 to 29 Years | 0 (0.0%) | 0 (0.0%) |
| 30 to 34 Years | 27 (5.1%) | 21 (3.3%) |
| 35 to 39 Years | 77 (14.7%) | 54 (8.4%) |
| 40 to 44 Years | 6 (1.1%) | 69 (10.8%) |
| 45 to 49 Years | 72 (13.7%) | 7 (1.1%) |
| 50 to 54 Years | 63 (12.0%) | 80 (12.5%) |
| 55 to 59 Years | 23 (4.4%) | 63 (9.8%) |
| 60 to 64 Years | 15 (2.9%) | 27 (4.2%) |
| 65 to 69 Years | 33 (6.3%) | 34 (5.3%) |
| 70 to 74 Years | 27 (5.1%) | 47 (7.3%) |
| 75 to 79 Years | 15 (2.9%) | 31 (4.8%) |
| 80 to 84 Years | 0 (0.0%) | 0 (0.0%) |
| 85 Years and over | 18 (3.4%) | 0 (0.0%) |
| Total | 524 (100.0%) | 641 (100.0%) |
Families and Households in Carolina
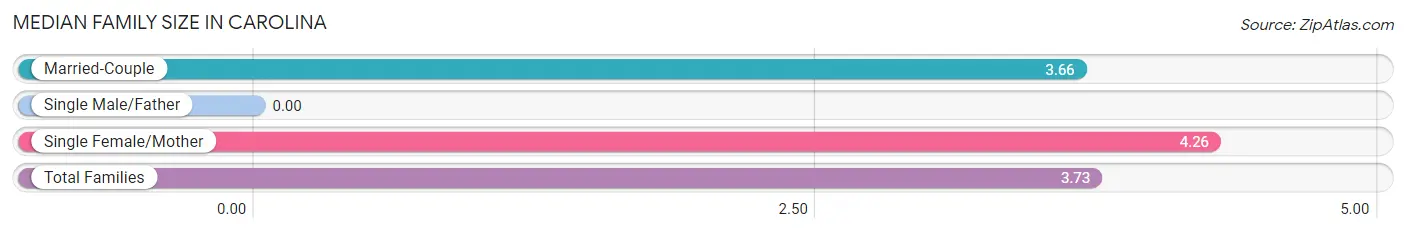
Median Family Size in Carolina
| Family Type | # Families | Family Size |
| Married-Couple | 229 (87.1%) | 3.66 |
| Single Male/Father | 0 (0.0%) | - |
| Single Female/Mother | 34 (12.9%) | 4.26 |
| Total Families | 263 (100.0%) | 3.73 |
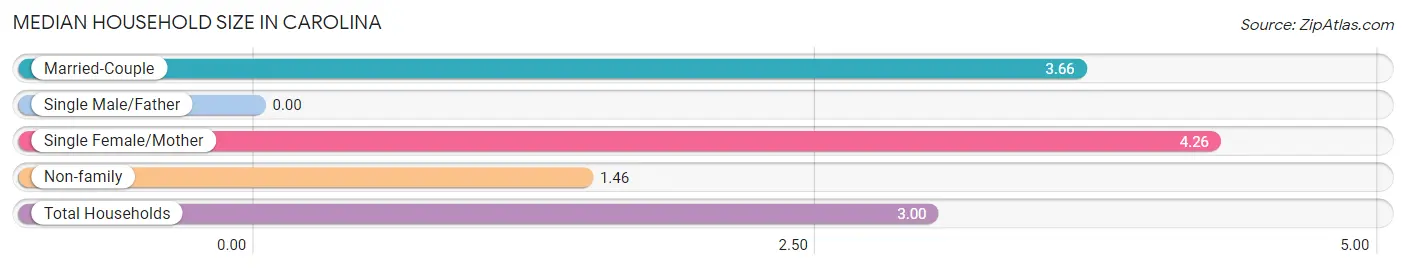
Median Household Size in Carolina
| Household Type | # Households | Household Size |
| Married-Couple | 229 (59.0%) | 3.66 |
| Single Male/Father | 0 (0.0%) | - |
| Single Female/Mother | 34 (8.8%) | 4.26 |
| Non-family | 125 (32.2%) | 1.46 |
| Total Households | 388 (100.0%) | 3.00 |
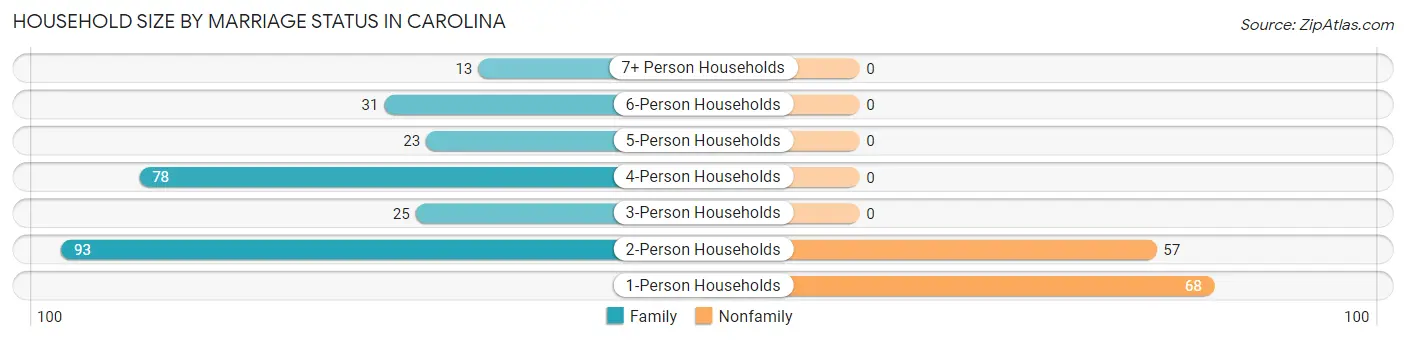
Household Size by Marriage Status in Carolina
Out of a total of 388 households in Carolina, 263 (67.8%) are family households, while 125 (32.2%) are nonfamily households. The most numerous type of family households are 2-person households, comprising 93, and the most common type of nonfamily households are 1-person households, comprising 68.
| Household Size | Family Households | Nonfamily Households |
| 1-Person Households | - | 68 (17.5%) |
| 2-Person Households | 93 (24.0%) | 57 (14.7%) |
| 3-Person Households | 25 (6.4%) | 0 (0.0%) |
| 4-Person Households | 78 (20.1%) | 0 (0.0%) |
| 5-Person Households | 23 (5.9%) | 0 (0.0%) |
| 6-Person Households | 31 (8.0%) | 0 (0.0%) |
| 7+ Person Households | 13 (3.4%) | 0 (0.0%) |
| Total | 263 (67.8%) | 125 (32.2%) |
Female Fertility in Carolina
Fertility by Age in Carolina
| Age Bracket | Women with Births | Births / 1,000 Women |
| 15 to 19 years | 0 (0.0%) | 0.0 |
| 20 to 34 years | 0 (0.0%) | 0.0 |
| 35 to 50 years | 0 (0.0%) | 0.0 |
| Total | 0 (0.0%) | 0.0 |
Fertility by Age by Marriage Status in Carolina
| Age Bracket | Married | Unmarried |
| 15 to 19 years | 0 (0.0%) | 0 (0.0%) |
| 20 to 34 years | 0 (0.0%) | 0 (0.0%) |
| 35 to 50 years | 0 (0.0%) | 0 (0.0%) |
| Total | 0 (0.0%) | 0 (0.0%) |
Fertility by Education in Carolina
| Educational Attainment | Women with Births | Births / 1,000 Women |
| Less than High School | 0 (0.0%) | 0.0 |
| High School Diploma | 0 (0.0%) | 0.0 |
| College or Associate's Degree | 0 (0.0%) | 0.0 |
| Bachelor's Degree | 0 (0.0%) | 0.0 |
| Graduate Degree | 0 (0.0%) | 0.0 |
| Total | 0 (0.0%) | 0.0 |
Fertility by Education by Marriage Status in Carolina
| Educational Attainment | Married | Unmarried |
| Less than High School | 0 (0.0%) | 0 (0.0%) |
| High School Diploma | 0 (0.0%) | 0 (0.0%) |
| College or Associate's Degree | 0 (0.0%) | 0 (0.0%) |
| Bachelor's Degree | 0 (0.0%) | 0 (0.0%) |
| Graduate Degree | 0 (0.0%) | 0 (0.0%) |
| Total | 0 (0.0%) | 0 (0.0%) |
Employment Characteristics in Carolina
Employment by Class of Employer in Carolina
Among the 550 employed individuals in Carolina, private company employees (427 | 77.6%), self-employed (not incorporated) (55 | 10.0%), and not-for-profit organizations (50 | 9.1%) make up the most common classes of employment.
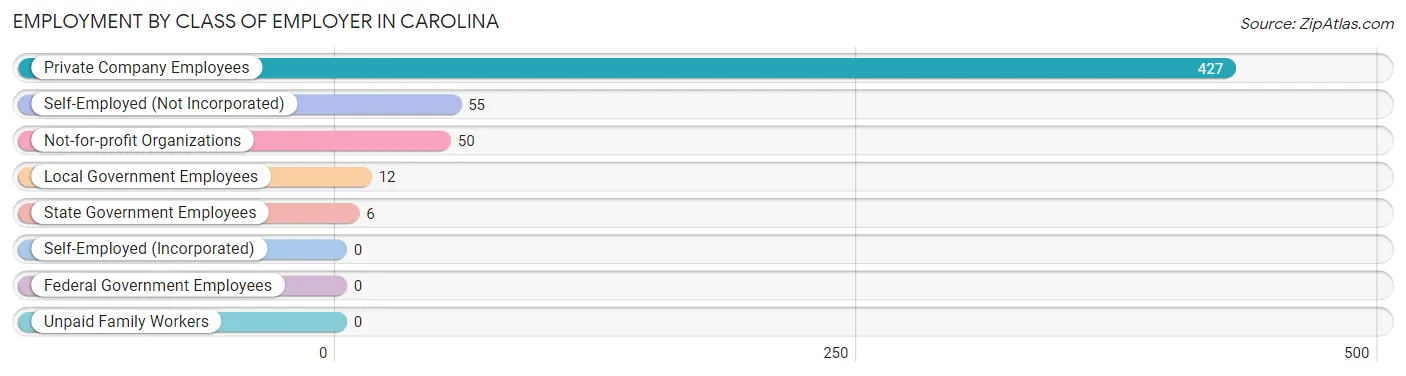
| Employer Class | # Employees | % Employees |
| Private Company Employees | 427 | 77.6% |
| Self-Employed (Incorporated) | 0 | 0.0% |
| Self-Employed (Not Incorporated) | 55 | 10.0% |
| Not-for-profit Organizations | 50 | 9.1% |
| Local Government Employees | 12 | 2.2% |
| State Government Employees | 6 | 1.1% |
| Federal Government Employees | 0 | 0.0% |
| Unpaid Family Workers | 0 | 0.0% |
| Total | 550 | 100.0% |
Employment Status by Age in Carolina
According to the labor force statistics for Carolina, out of the total population over 16 years of age (932), 62.9% or 586 individuals are in the labor force, with 6.1% or 36 of them unemployed. The age group with the highest labor force participation rate is 35 to 44 years, with 88.8% or 183 individuals in the labor force. Within the labor force, the 65 to 74 years age range has the highest percentage of unemployed individuals, with 17.2% or 11 of them being unemployed.
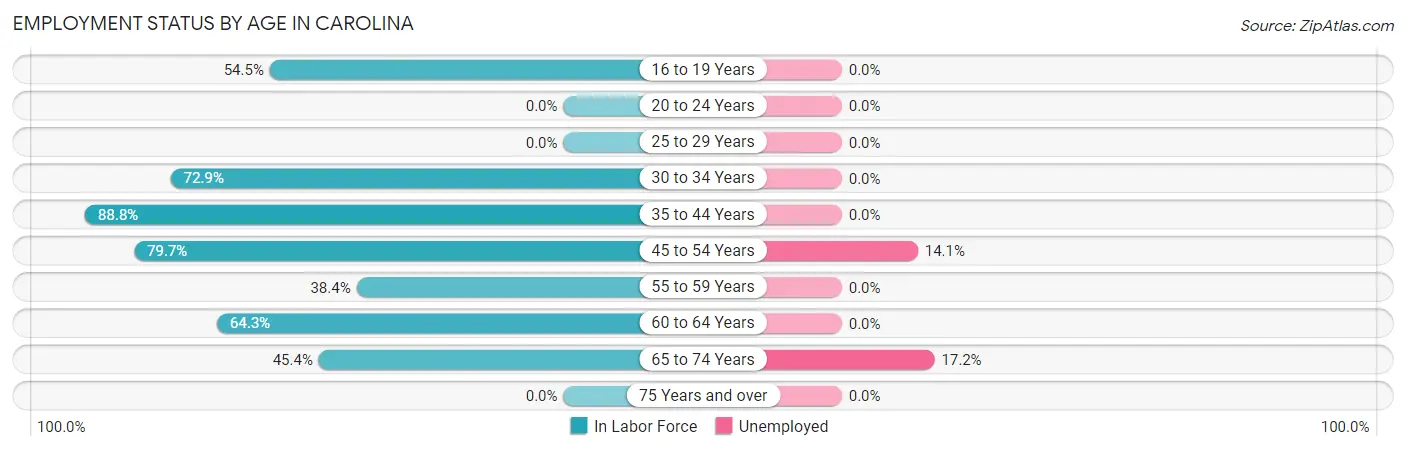
| Age Bracket | In Labor Force | Unemployed |
| 16 to 19 Years | 67 (54.5%) | 0 (0.0%) |
| 20 to 24 Years | 0 (0.0%) | 0 (0.0%) |
| 25 to 29 Years | 0 (0.0%) | 0 (0.0%) |
| 30 to 34 Years | 35 (72.9%) | 0 (0.0%) |
| 35 to 44 Years | 183 (88.8%) | 0 (0.0%) |
| 45 to 54 Years | 177 (79.7%) | 25 (14.1%) |
| 55 to 59 Years | 33 (38.4%) | 0 (0.0%) |
| 60 to 64 Years | 27 (64.3%) | 0 (0.0%) |
| 65 to 74 Years | 64 (45.4%) | 11 (17.2%) |
| 75 Years and over | 0 (0.0%) | 0 (0.0%) |
| Total | 586 (62.9%) | 36 (6.1%) |
Employment Status by Educational Attainment in Carolina
According to labor force statistics for Carolina, 75.3% of individuals (455) out of the total population between 25 and 64 years of age (604) are in the labor force, with 5.5% or 25 of them being unemployed. The group with the highest labor force participation rate are those with the educational attainment of bachelor's degree or higher, with 80.0% or 152 individuals in the labor force. Within the labor force, individuals with college / associate degree education have the highest percentage of unemployment, with 15.9% or 25 of them being unemployed.
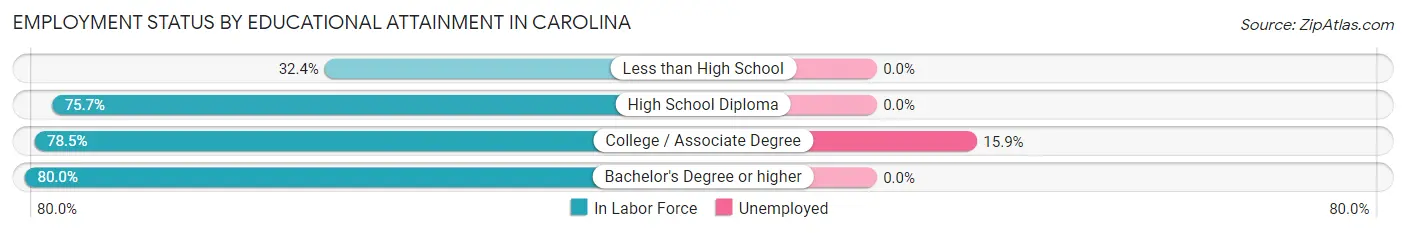
| Educational Attainment | In Labor Force | Unemployed |
| Less than High School | 12 (32.4%) | 0 (0.0%) |
| High School Diploma | 134 (75.7%) | 0 (0.0%) |
| College / Associate Degree | 157 (78.5%) | 32 (15.9%) |
| Bachelor's Degree or higher | 152 (80.0%) | 0 (0.0%) |
| Total | 455 (75.3%) | 33 (5.5%) |
Employment Occupations by Sex in Carolina
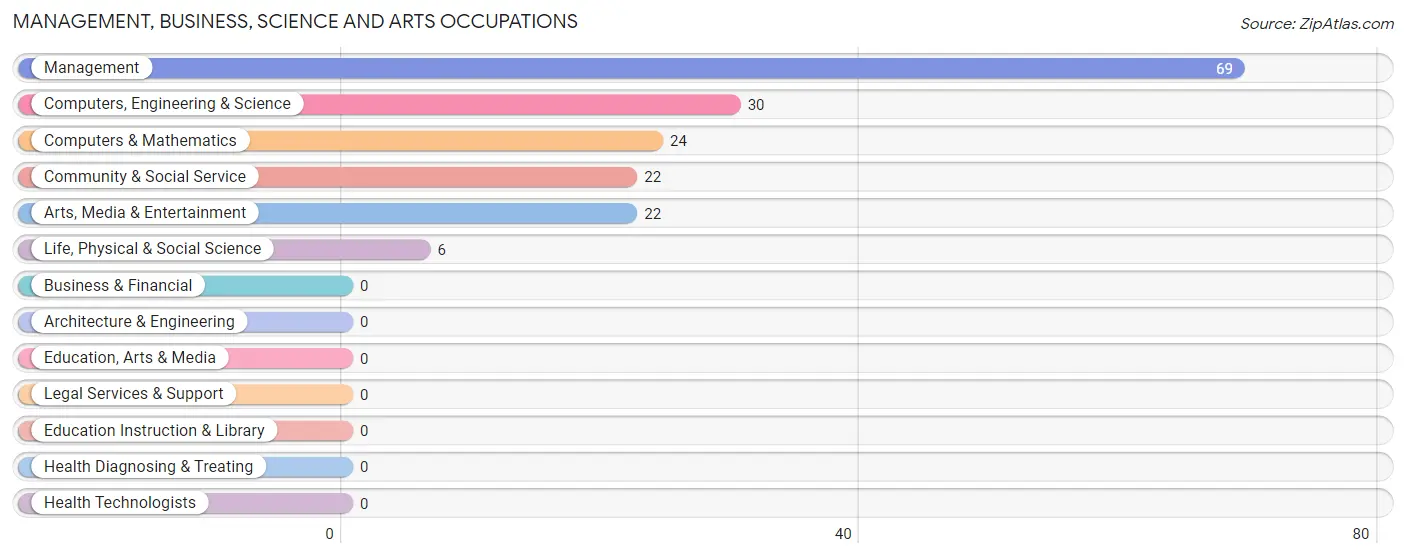
Management, Business, Science and Arts Occupations
The most common Management, Business, Science and Arts occupations in Carolina are Management (69 | 12.6%), Computers, Engineering & Science (30 | 5.4%), Computers & Mathematics (24 | 4.4%), Community & Social Service (22 | 4.0%), and Arts, Media & Entertainment (22 | 4.0%).
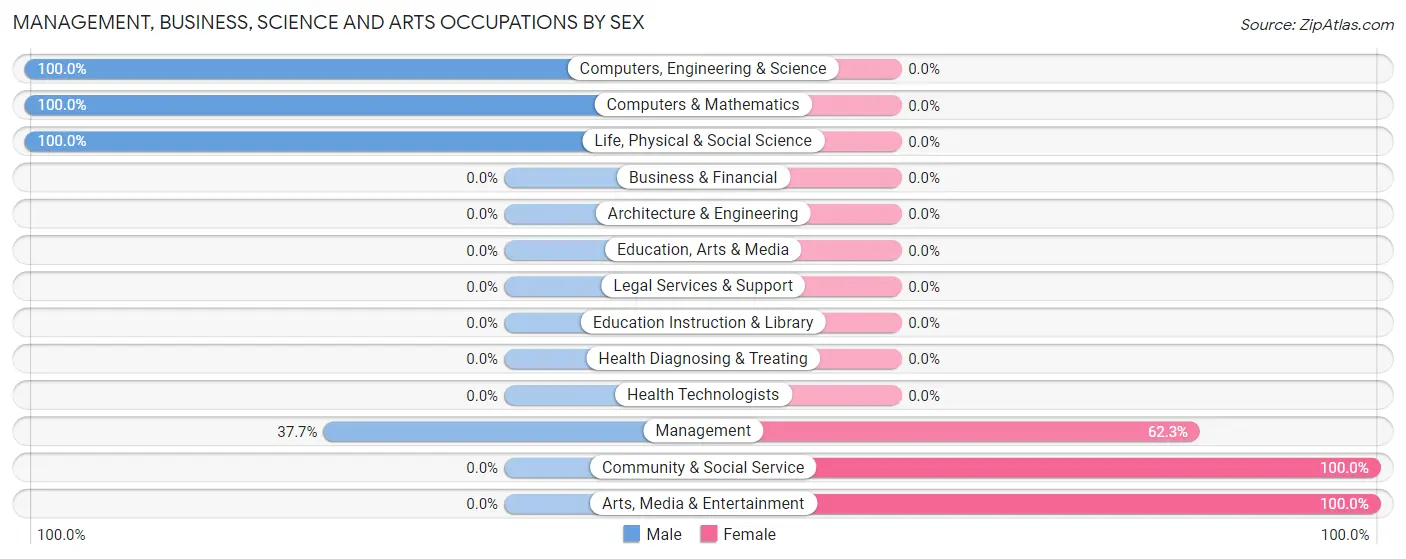
Management, Business, Science and Arts Occupations by Sex
Within the Management, Business, Science and Arts occupations in Carolina, the most male-oriented occupations are Computers, Engineering & Science (100.0%), Computers & Mathematics (100.0%), and Life, Physical & Social Science (100.0%), while the most female-oriented occupations are Community & Social Service (100.0%), Arts, Media & Entertainment (100.0%), and Management (62.3%).
| Occupation | Male | Female |
| Management | 26 (37.7%) | 43 (62.3%) |
| Business & Financial | 0 (0.0%) | 0 (0.0%) |
| Computers, Engineering & Science | 30 (100.0%) | 0 (0.0%) |
| Computers & Mathematics | 24 (100.0%) | 0 (0.0%) |
| Architecture & Engineering | 0 (0.0%) | 0 (0.0%) |
| Life, Physical & Social Science | 6 (100.0%) | 0 (0.0%) |
| Community & Social Service | 0 (0.0%) | 22 (100.0%) |
| Education, Arts & Media | 0 (0.0%) | 0 (0.0%) |
| Legal Services & Support | 0 (0.0%) | 0 (0.0%) |
| Education Instruction & Library | 0 (0.0%) | 0 (0.0%) |
| Arts, Media & Entertainment | 0 (0.0%) | 22 (100.0%) |
| Health Diagnosing & Treating | 0 (0.0%) | 0 (0.0%) |
| Health Technologists | 0 (0.0%) | 0 (0.0%) |
| Total (Category) | 56 (46.3%) | 65 (53.7%) |
| Total (Overall) | 322 (58.6%) | 228 (41.4%) |
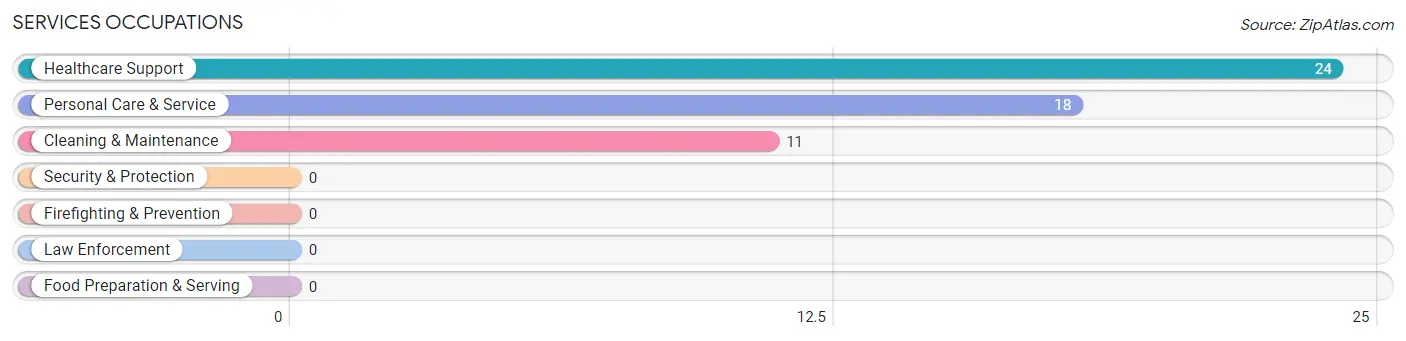
Services Occupations
The most common Services occupations in Carolina are Healthcare Support (24 | 4.4%), Personal Care & Service (18 | 3.3%), and Cleaning & Maintenance (11 | 2.0%).
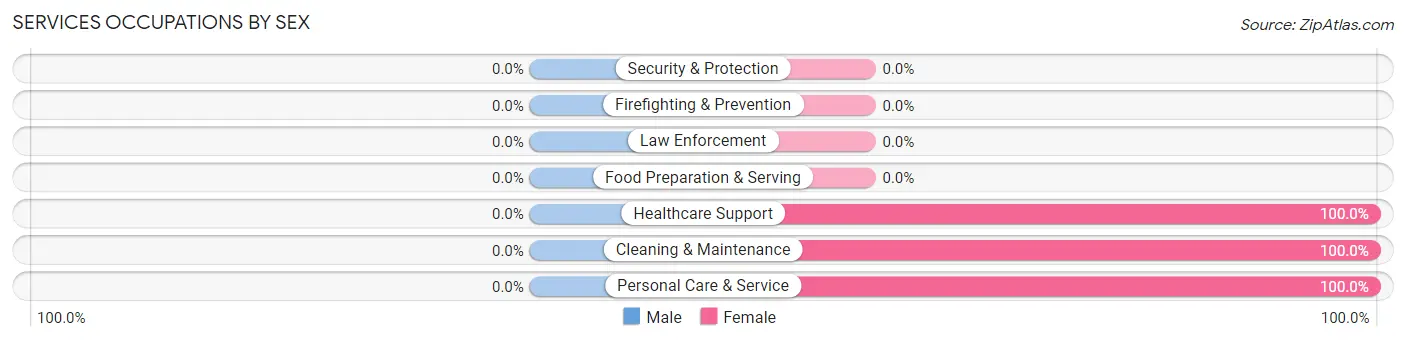
Services Occupations by Sex
| Occupation | Male | Female |
| Healthcare Support | 0 (0.0%) | 24 (100.0%) |
| Security & Protection | 0 (0.0%) | 0 (0.0%) |
| Firefighting & Prevention | 0 (0.0%) | 0 (0.0%) |
| Law Enforcement | 0 (0.0%) | 0 (0.0%) |
| Food Preparation & Serving | 0 (0.0%) | 0 (0.0%) |
| Cleaning & Maintenance | 0 (0.0%) | 11 (100.0%) |
| Personal Care & Service | 0 (0.0%) | 18 (100.0%) |
| Total (Category) | 0 (0.0%) | 53 (100.0%) |
| Total (Overall) | 322 (58.6%) | 228 (41.4%) |
Sales and Office Occupations
The most common Sales and Office occupations in Carolina are Office & Administration (137 | 24.9%), and Sales & Related (110 | 20.0%).
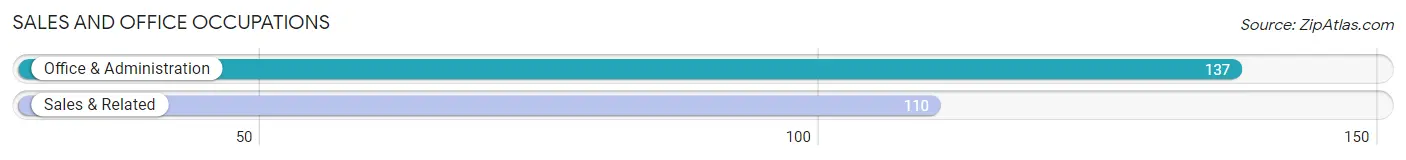
Sales and Office Occupations by Sex
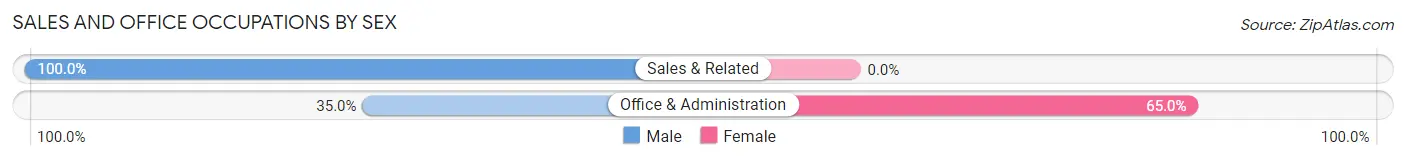
| Occupation | Male | Female |
| Sales & Related | 110 (100.0%) | 0 (0.0%) |
| Office & Administration | 48 (35.0%) | 89 (65.0%) |
| Total (Category) | 158 (64.0%) | 89 (36.0%) |
| Total (Overall) | 322 (58.6%) | 228 (41.4%) |
Natural Resources, Construction and Maintenance Occupations
The most common Natural Resources, Construction and Maintenance occupations in Carolina are Construction & Extraction (31 | 5.6%), Farming, Fishing & Forestry (27 | 4.9%), and Installation, Maintenance & Repair (12 | 2.2%).
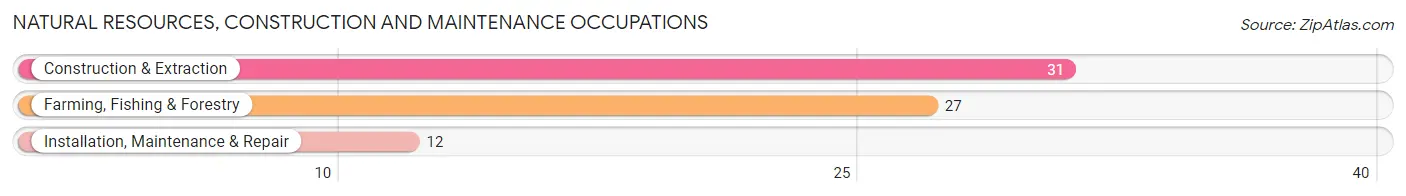
Natural Resources, Construction and Maintenance Occupations by Sex
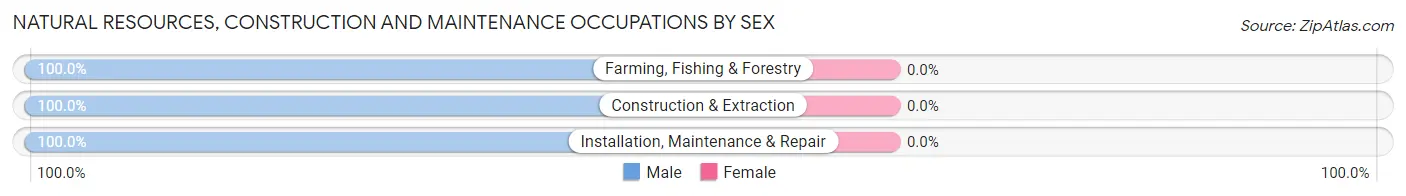
| Occupation | Male | Female |
| Farming, Fishing & Forestry | 27 (100.0%) | 0 (0.0%) |
| Construction & Extraction | 31 (100.0%) | 0 (0.0%) |
| Installation, Maintenance & Repair | 12 (100.0%) | 0 (0.0%) |
| Total (Category) | 70 (100.0%) | 0 (0.0%) |
| Total (Overall) | 322 (58.6%) | 228 (41.4%) |
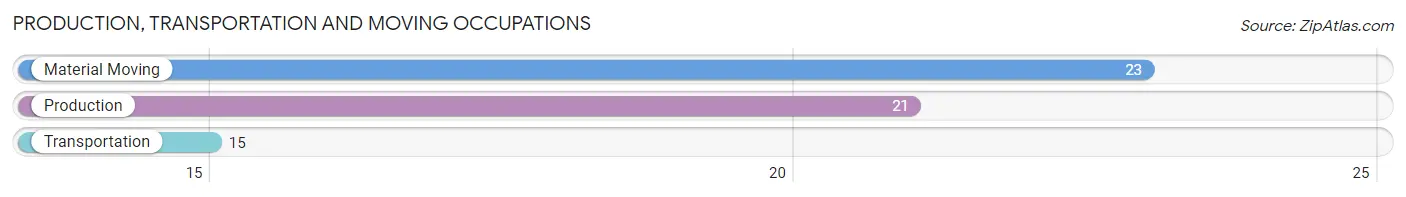
Production, Transportation and Moving Occupations
The most common Production, Transportation and Moving occupations in Carolina are Material Moving (23 | 4.2%), Production (21 | 3.8%), and Transportation (15 | 2.7%).
Production, Transportation and Moving Occupations by Sex
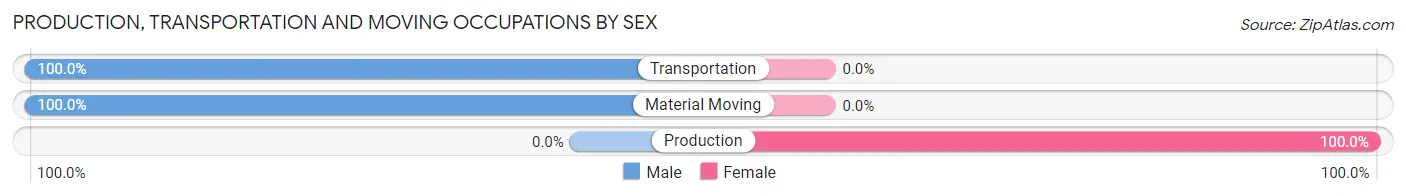
| Occupation | Male | Female |
| Production | 0 (0.0%) | 21 (100.0%) |
| Transportation | 15 (100.0%) | 0 (0.0%) |
| Material Moving | 23 (100.0%) | 0 (0.0%) |
| Total (Category) | 38 (64.4%) | 21 (35.6%) |
| Total (Overall) | 322 (58.6%) | 228 (41.4%) |
Employment Industries by Sex in Carolina
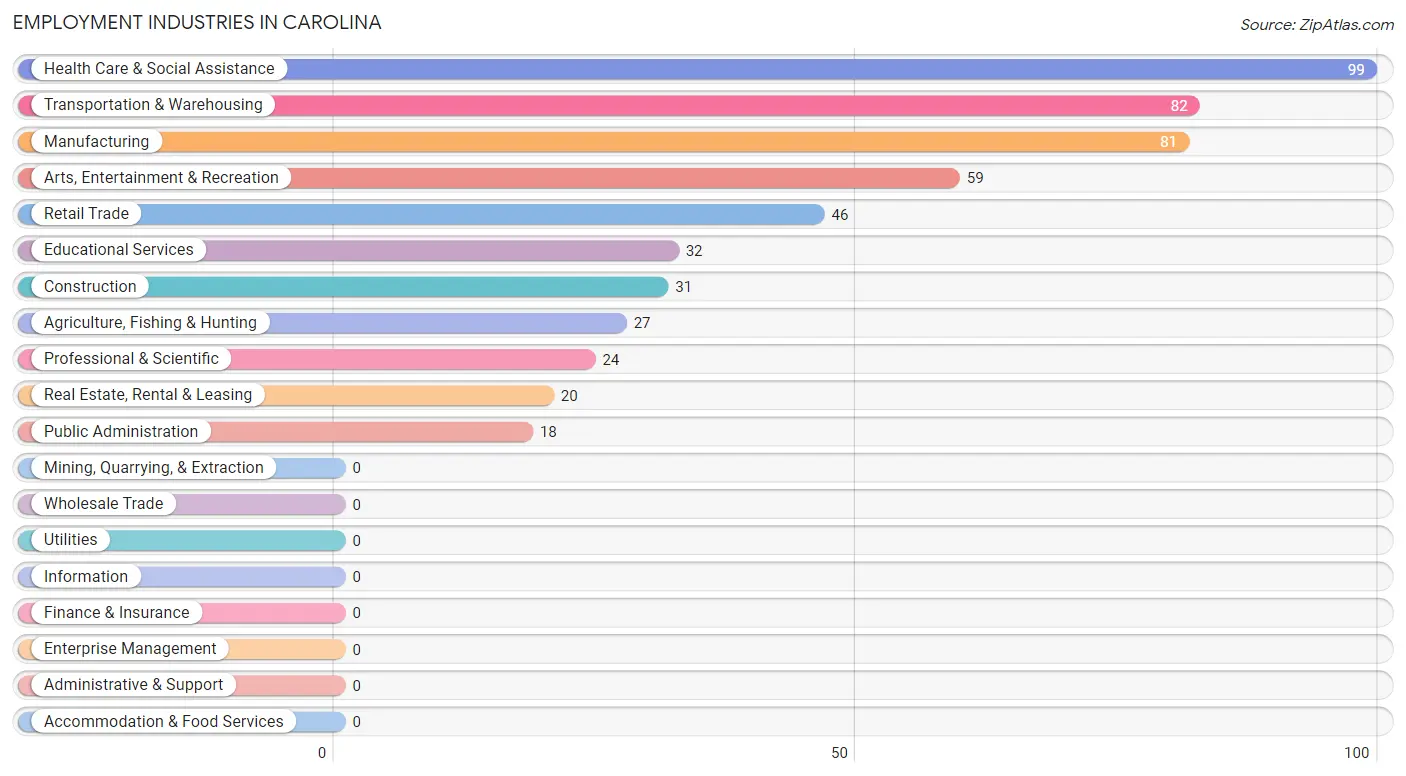
Employment Industries in Carolina
The major employment industries in Carolina include Health Care & Social Assistance (99 | 18.0%), Transportation & Warehousing (82 | 14.9%), Manufacturing (81 | 14.7%), Arts, Entertainment & Recreation (59 | 10.7%), and Retail Trade (46 | 8.4%).
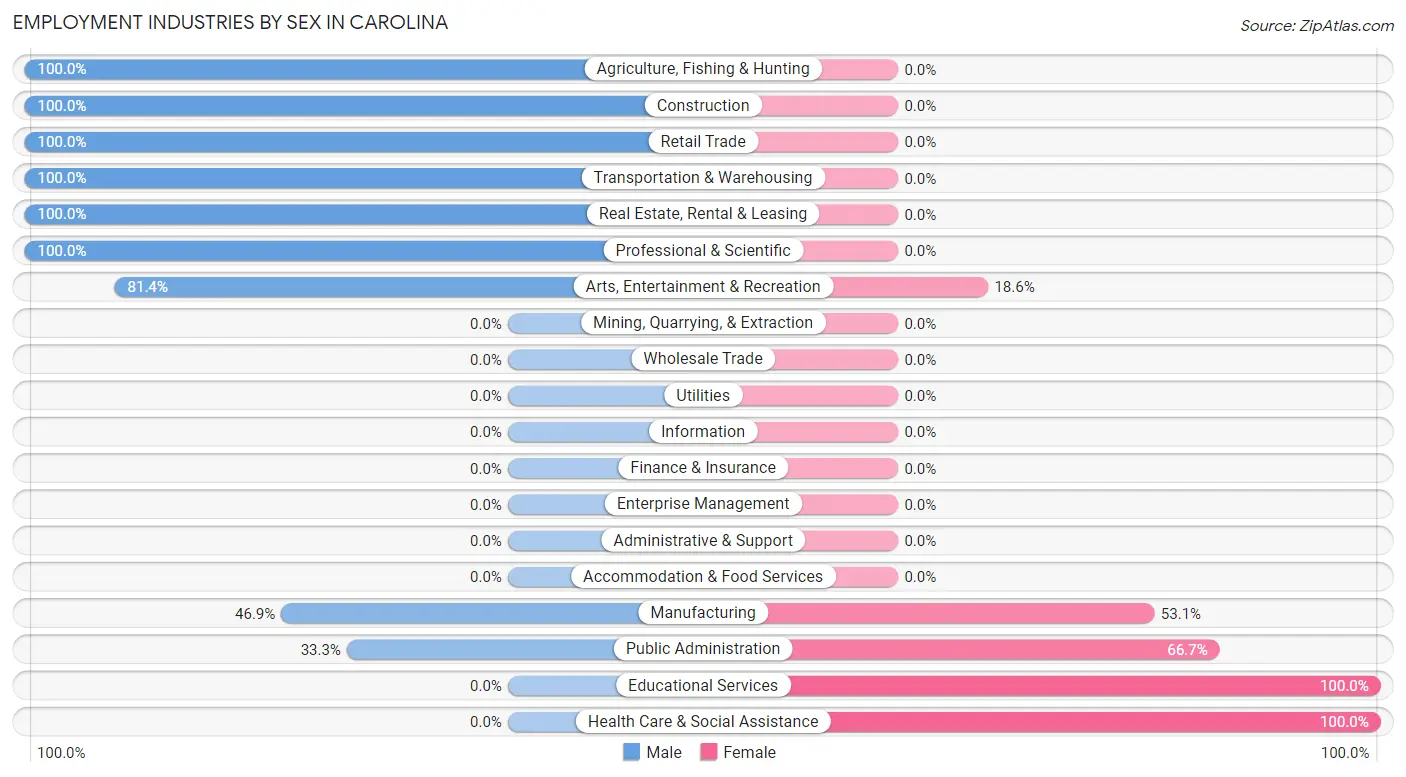
Employment Industries by Sex in Carolina
The Carolina industries that see more men than women are Agriculture, Fishing & Hunting (100.0%), Construction (100.0%), and Retail Trade (100.0%), whereas the industries that tend to have a higher number of women are Educational Services (100.0%), Health Care & Social Assistance (100.0%), and Public Administration (66.7%).
| Industry | Male | Female |
| Agriculture, Fishing & Hunting | 27 (100.0%) | 0 (0.0%) |
| Mining, Quarrying, & Extraction | 0 (0.0%) | 0 (0.0%) |
| Construction | 31 (100.0%) | 0 (0.0%) |
| Manufacturing | 38 (46.9%) | 43 (53.1%) |
| Wholesale Trade | 0 (0.0%) | 0 (0.0%) |
| Retail Trade | 46 (100.0%) | 0 (0.0%) |
| Transportation & Warehousing | 82 (100.0%) | 0 (0.0%) |
| Utilities | 0 (0.0%) | 0 (0.0%) |
| Information | 0 (0.0%) | 0 (0.0%) |
| Finance & Insurance | 0 (0.0%) | 0 (0.0%) |
| Real Estate, Rental & Leasing | 20 (100.0%) | 0 (0.0%) |
| Professional & Scientific | 24 (100.0%) | 0 (0.0%) |
| Enterprise Management | 0 (0.0%) | 0 (0.0%) |
| Administrative & Support | 0 (0.0%) | 0 (0.0%) |
| Educational Services | 0 (0.0%) | 32 (100.0%) |
| Health Care & Social Assistance | 0 (0.0%) | 99 (100.0%) |
| Arts, Entertainment & Recreation | 48 (81.4%) | 11 (18.6%) |
| Accommodation & Food Services | 0 (0.0%) | 0 (0.0%) |
| Public Administration | 6 (33.3%) | 12 (66.7%) |
| Total | 322 (58.6%) | 228 (41.4%) |
Education in Carolina
School Enrollment in Carolina
The most common levels of schooling among the 267 students in Carolina are middle school (143 | 53.6%), high school (56 | 21.0%), and elementary school (36 | 13.5%).
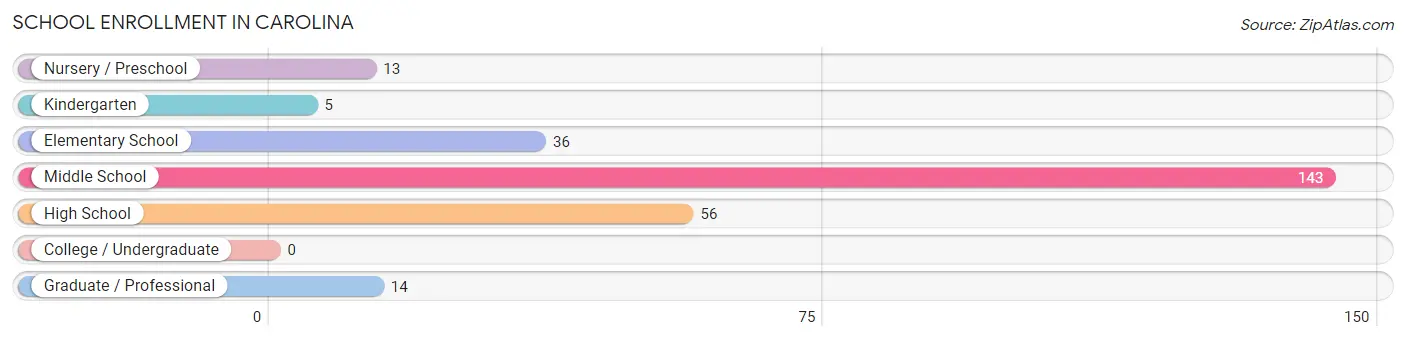
| School Level | # Students | % Students |
| Nursery / Preschool | 13 | 4.9% |
| Kindergarten | 5 | 1.9% |
| Elementary School | 36 | 13.5% |
| Middle School | 143 | 53.6% |
| High School | 56 | 21.0% |
| College / Undergraduate | 0 | 0.0% |
| Graduate / Professional | 14 | 5.2% |
| Total | 267 | 100.0% |
School Enrollment by Age by Funding Source in Carolina
Out of a total of 267 students who are enrolled in schools in Carolina, 26 (9.7%) attend a private institution, while the remaining 241 (90.3%) are enrolled in public schools. The age group of 25 to 34 year olds has the highest likelihood of being enrolled in private schools, with 14 (100.0% in the age bracket) enrolled. Conversely, the age group of 3 to 4 year olds has the lowest likelihood of being enrolled in a private school, with 13 (100.0% in the age bracket) attending a public institution.
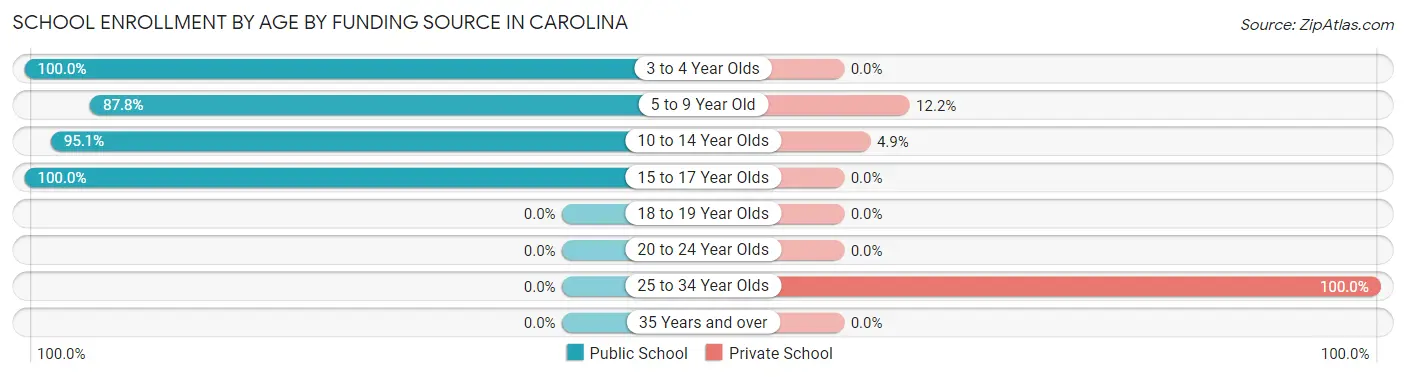
| Age Bracket | Public School | Private School |
| 3 to 4 Year Olds | 13 (100.0%) | 0 (0.0%) |
| 5 to 9 Year Old | 36 (87.8%) | 5 (12.2%) |
| 10 to 14 Year Olds | 136 (95.1%) | 7 (4.9%) |
| 15 to 17 Year Olds | 56 (100.0%) | 0 (0.0%) |
| 18 to 19 Year Olds | 0 (0.0%) | 0 (0.0%) |
| 20 to 24 Year Olds | 0 (0.0%) | 0 (0.0%) |
| 25 to 34 Year Olds | 0 (0.0%) | 14 (100.0%) |
| 35 Years and over | 0 (0.0%) | 0 (0.0%) |
| Total | 241 (90.3%) | 26 (9.7%) |
Educational Attainment by Field of Study in Carolina
Business (114 | 34.4%), visual & performing arts (60 | 18.1%), social sciences (29 | 8.8%), liberal arts & history (27 | 8.2%), and engineering (26 | 7.9%) are the most common fields of study among 331 individuals in Carolina who have obtained a bachelor's degree or higher.
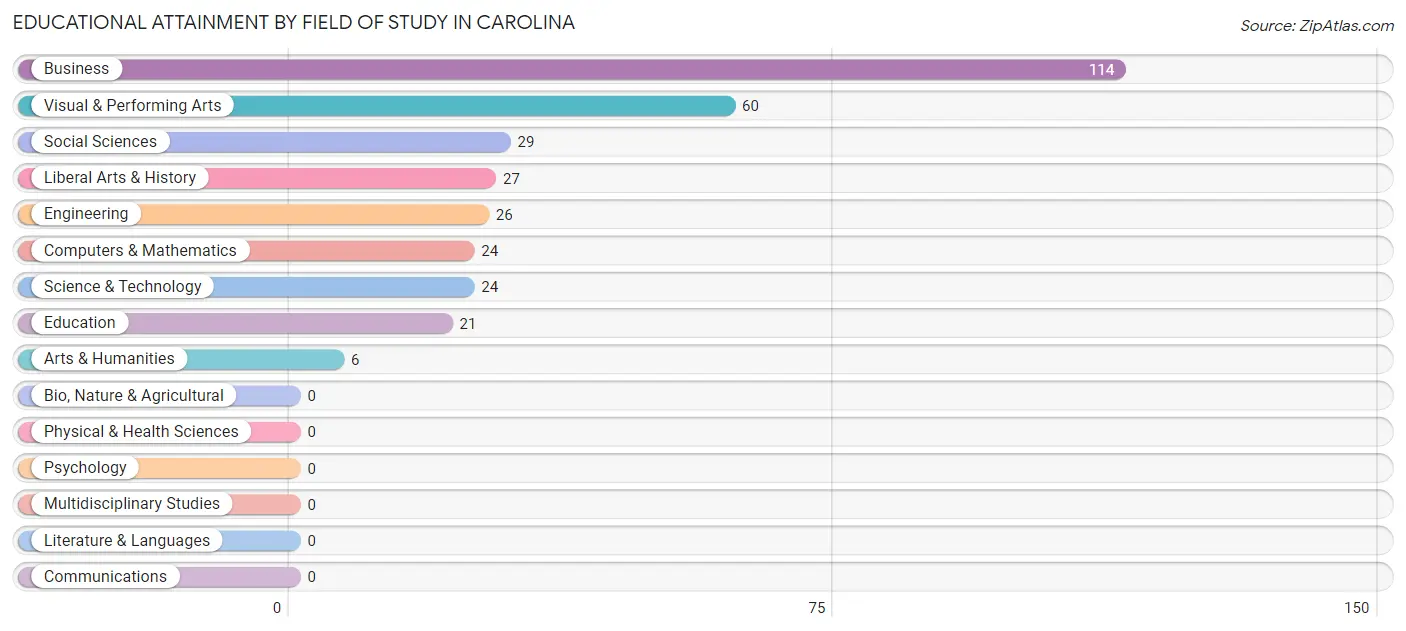
| Field of Study | # Graduates | % Graduates |
| Computers & Mathematics | 24 | 7.2% |
| Bio, Nature & Agricultural | 0 | 0.0% |
| Physical & Health Sciences | 0 | 0.0% |
| Psychology | 0 | 0.0% |
| Social Sciences | 29 | 8.8% |
| Engineering | 26 | 7.9% |
| Multidisciplinary Studies | 0 | 0.0% |
| Science & Technology | 24 | 7.2% |
| Business | 114 | 34.4% |
| Education | 21 | 6.3% |
| Literature & Languages | 0 | 0.0% |
| Liberal Arts & History | 27 | 8.2% |
| Visual & Performing Arts | 60 | 18.1% |
| Communications | 0 | 0.0% |
| Arts & Humanities | 6 | 1.8% |
| Total | 331 | 100.0% |
Transportation & Commute in Carolina
Vehicle Availability by Sex in Carolina
The most prevalent vehicle ownership categories in Carolina are males with 2 vehicles (192, accounting for 59.6%) and females with 2 vehicles (117, making up 84.2%).
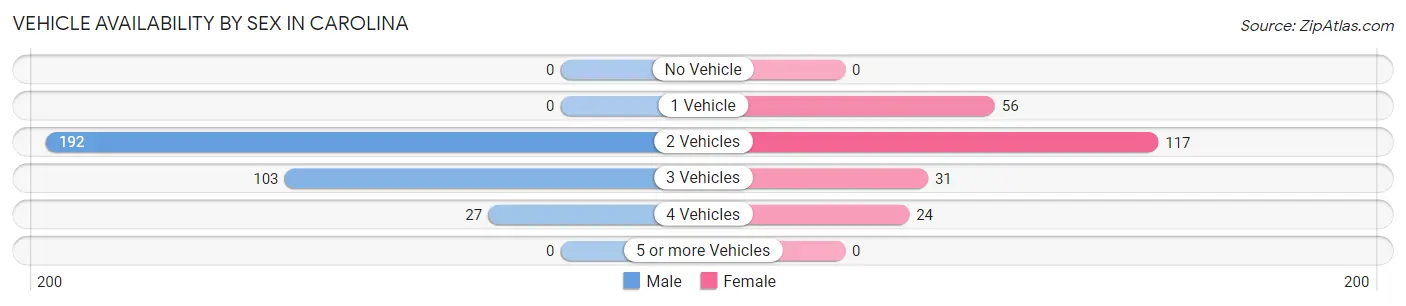
| Vehicles Available | Male | Female |
| No Vehicle | 0 (0.0%) | 0 (0.0%) |
| 1 Vehicle | 0 (0.0%) | 56 (24.6%) |
| 2 Vehicles | 192 (59.6%) | 117 (51.3%) |
| 3 Vehicles | 103 (32.0%) | 31 (13.6%) |
| 4 Vehicles | 27 (8.4%) | 24 (10.5%) |
| 5 or more Vehicles | 0 (0.0%) | 0 (0.0%) |
| Total | 322 (100.0%) | 228 (100.0%) |
Commute Time in Carolina
The most frequently occuring commute durations in Carolina are 45 to 59 minutes (125 commuters, 22.7%), 20 to 24 minutes (80 commuters, 14.5%), and 90 or more minutes (67 commuters, 12.2%).
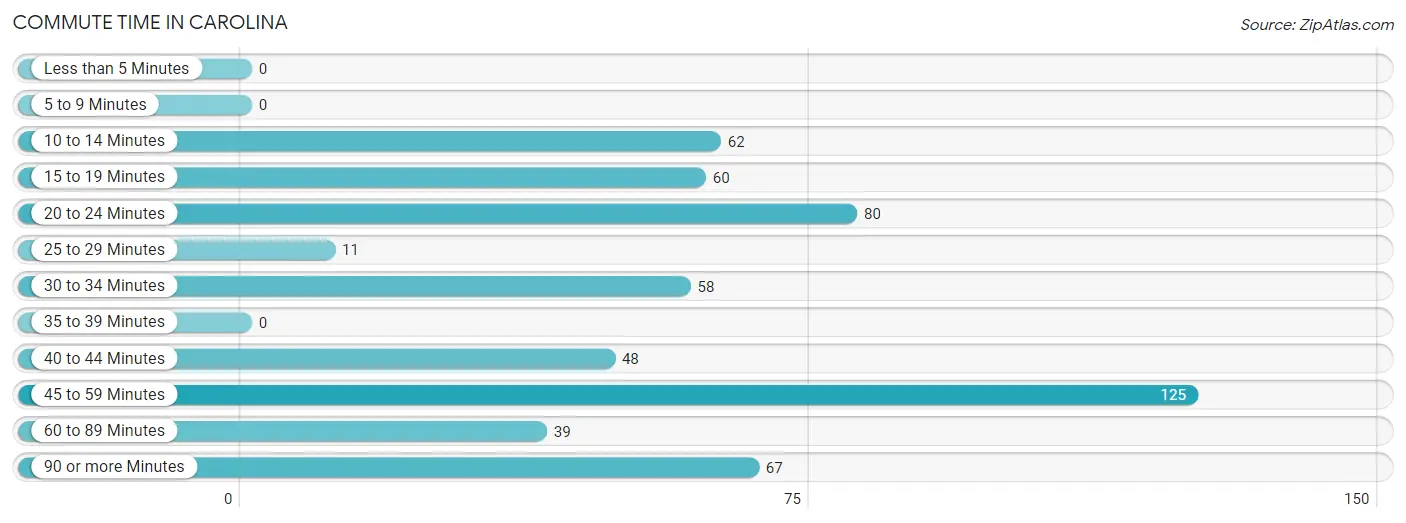
| Commute Time | # Commuters | % Commuters |
| Less than 5 Minutes | 0 | 0.0% |
| 5 to 9 Minutes | 0 | 0.0% |
| 10 to 14 Minutes | 62 | 11.3% |
| 15 to 19 Minutes | 60 | 10.9% |
| 20 to 24 Minutes | 80 | 14.5% |
| 25 to 29 Minutes | 11 | 2.0% |
| 30 to 34 Minutes | 58 | 10.5% |
| 35 to 39 Minutes | 0 | 0.0% |
| 40 to 44 Minutes | 48 | 8.7% |
| 45 to 59 Minutes | 125 | 22.7% |
| 60 to 89 Minutes | 39 | 7.1% |
| 90 or more Minutes | 67 | 12.2% |
Commute Time by Sex in Carolina
The most common commute times in Carolina are 90 or more minutes (67 commuters, 20.8%) for males and 45 to 59 minutes (99 commuters, 43.4%) for females.
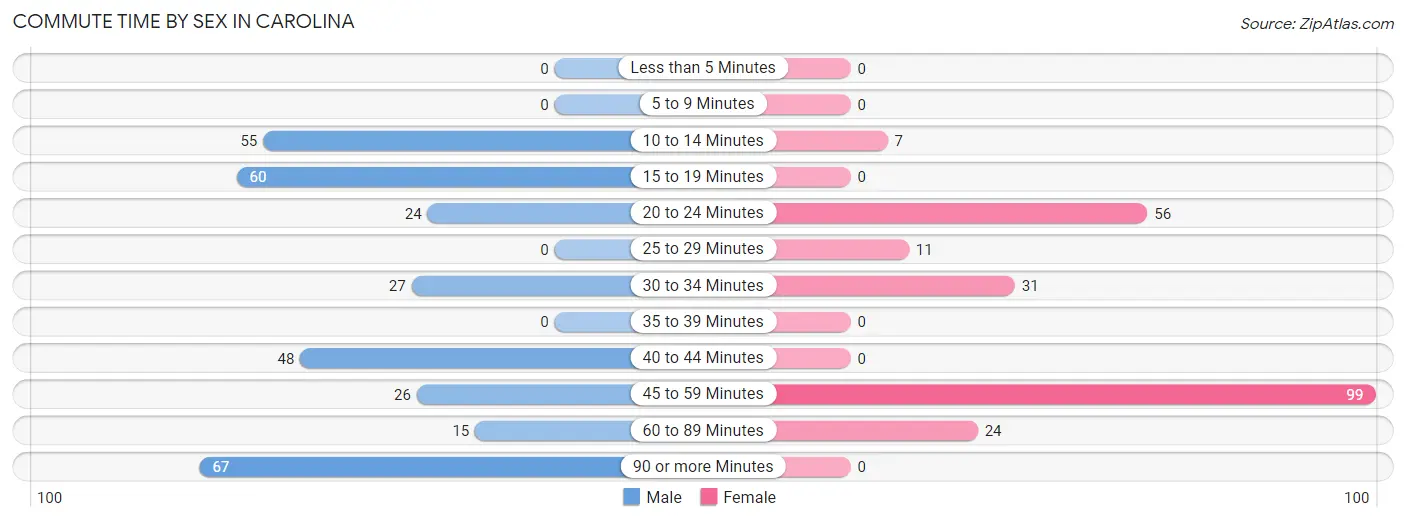
| Commute Time | Male | Female |
| Less than 5 Minutes | 0 (0.0%) | 0 (0.0%) |
| 5 to 9 Minutes | 0 (0.0%) | 0 (0.0%) |
| 10 to 14 Minutes | 55 (17.1%) | 7 (3.1%) |
| 15 to 19 Minutes | 60 (18.6%) | 0 (0.0%) |
| 20 to 24 Minutes | 24 (7.4%) | 56 (24.6%) |
| 25 to 29 Minutes | 0 (0.0%) | 11 (4.8%) |
| 30 to 34 Minutes | 27 (8.4%) | 31 (13.6%) |
| 35 to 39 Minutes | 0 (0.0%) | 0 (0.0%) |
| 40 to 44 Minutes | 48 (14.9%) | 0 (0.0%) |
| 45 to 59 Minutes | 26 (8.1%) | 99 (43.4%) |
| 60 to 89 Minutes | 15 (4.7%) | 24 (10.5%) |
| 90 or more Minutes | 67 (20.8%) | 0 (0.0%) |
Time of Departure to Work by Sex in Carolina
The most frequent times of departure to work in Carolina are 6:00 AM to 6:29 AM (117, 36.3%) for males and 5:30 AM to 5:59 AM (77, 33.8%) for females.
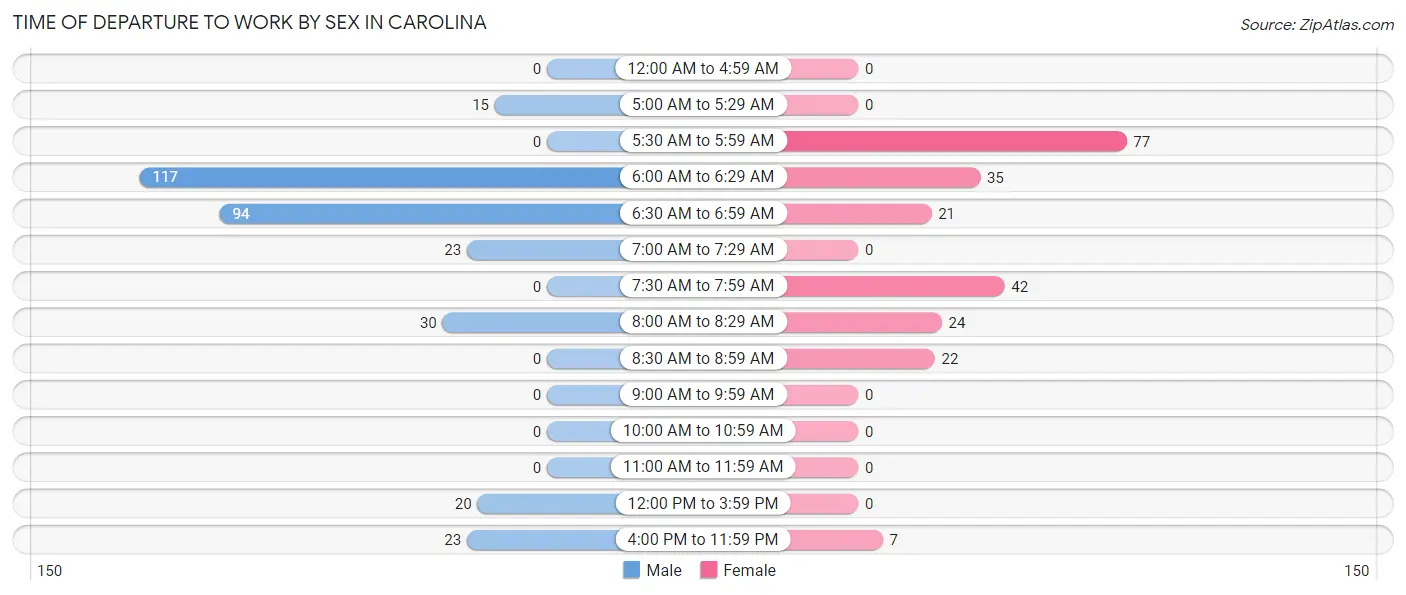
| Time of Departure | Male | Female |
| 12:00 AM to 4:59 AM | 0 (0.0%) | 0 (0.0%) |
| 5:00 AM to 5:29 AM | 15 (4.7%) | 0 (0.0%) |
| 5:30 AM to 5:59 AM | 0 (0.0%) | 77 (33.8%) |
| 6:00 AM to 6:29 AM | 117 (36.3%) | 35 (15.3%) |
| 6:30 AM to 6:59 AM | 94 (29.2%) | 21 (9.2%) |
| 7:00 AM to 7:29 AM | 23 (7.1%) | 0 (0.0%) |
| 7:30 AM to 7:59 AM | 0 (0.0%) | 42 (18.4%) |
| 8:00 AM to 8:29 AM | 30 (9.3%) | 24 (10.5%) |
| 8:30 AM to 8:59 AM | 0 (0.0%) | 22 (9.7%) |
| 9:00 AM to 9:59 AM | 0 (0.0%) | 0 (0.0%) |
| 10:00 AM to 10:59 AM | 0 (0.0%) | 0 (0.0%) |
| 11:00 AM to 11:59 AM | 0 (0.0%) | 0 (0.0%) |
| 12:00 PM to 3:59 PM | 20 (6.2%) | 0 (0.0%) |
| 4:00 PM to 11:59 PM | 23 (7.1%) | 7 (3.1%) |
| Total | 322 (100.0%) | 228 (100.0%) |
Housing Occupancy in Carolina
Occupancy by Ownership in Carolina
Of the total 388 dwellings in Carolina, owner-occupied units account for 311 (80.1%), while renter-occupied units make up 77 (19.9%).
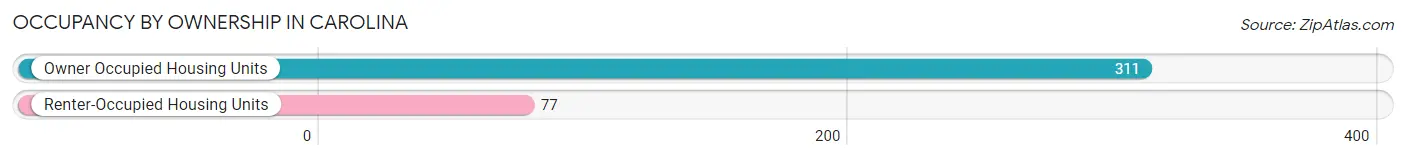
| Occupancy | # Housing Units | % Housing Units |
| Owner Occupied Housing Units | 311 | 80.1% |
| Renter-Occupied Housing Units | 77 | 19.9% |
| Total Occupied Housing Units | 388 | 100.0% |
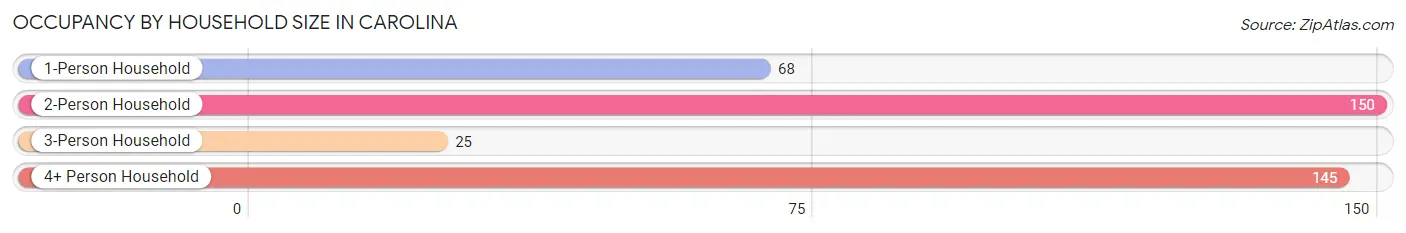
Occupancy by Household Size in Carolina
| Household Size | # Housing Units | % Housing Units |
| 1-Person Household | 68 | 17.5% |
| 2-Person Household | 150 | 38.7% |
| 3-Person Household | 25 | 6.4% |
| 4+ Person Household | 145 | 37.4% |
| Total Housing Units | 388 | 100.0% |
Occupancy by Ownership by Household Size in Carolina
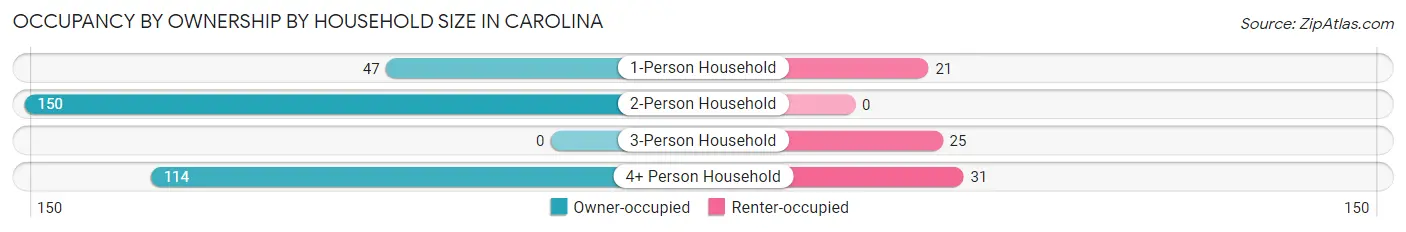
| Household Size | Owner-occupied | Renter-occupied |
| 1-Person Household | 47 (69.1%) | 21 (30.9%) |
| 2-Person Household | 150 (100.0%) | 0 (0.0%) |
| 3-Person Household | 0 (0.0%) | 25 (100.0%) |
| 4+ Person Household | 114 (78.6%) | 31 (21.4%) |
| Total Housing Units | 311 (80.1%) | 77 (19.9%) |
Occupancy by Educational Attainment in Carolina
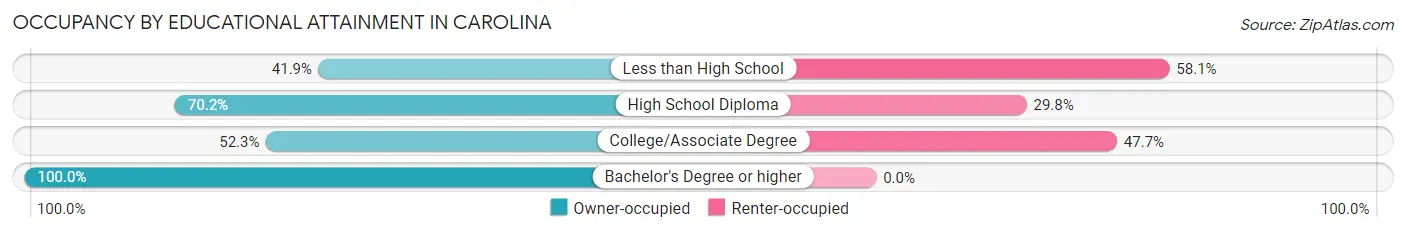
| Household Size | Owner-occupied | Renter-occupied |
| Less than High School | 18 (41.9%) | 25 (58.1%) |
| High School Diploma | 73 (70.2%) | 31 (29.8%) |
| College/Associate Degree | 23 (52.3%) | 21 (47.7%) |
| Bachelor's Degree or higher | 197 (100.0%) | 0 (0.0%) |
Occupancy by Age of Householder in Carolina
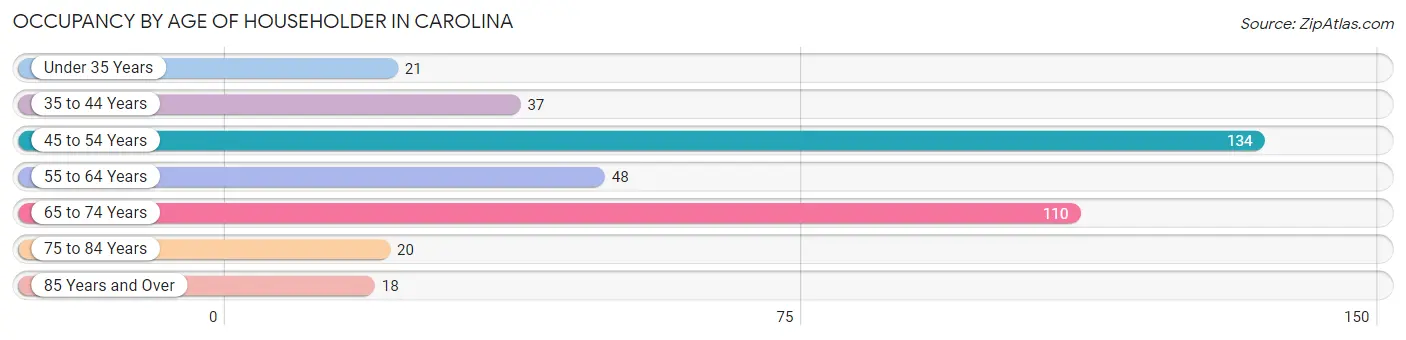
| Age Bracket | # Households | % Households |
| Under 35 Years | 21 | 5.4% |
| 35 to 44 Years | 37 | 9.5% |
| 45 to 54 Years | 134 | 34.5% |
| 55 to 64 Years | 48 | 12.4% |
| 65 to 74 Years | 110 | 28.3% |
| 75 to 84 Years | 20 | 5.1% |
| 85 Years and Over | 18 | 4.6% |
| Total | 388 | 100.0% |
Housing Finances in Carolina
Median Income by Occupancy in Carolina
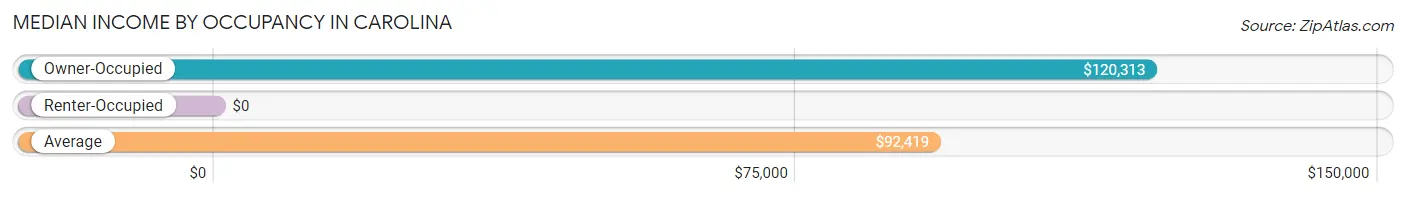
| Occupancy Type | # Households | Median Income |
| Owner-Occupied | 311 (80.1%) | $120,313 |
| Renter-Occupied | 77 (19.9%) | $0 |
| Average | 388 (100.0%) | $92,419 |
Occupancy by Householder Income Bracket in Carolina
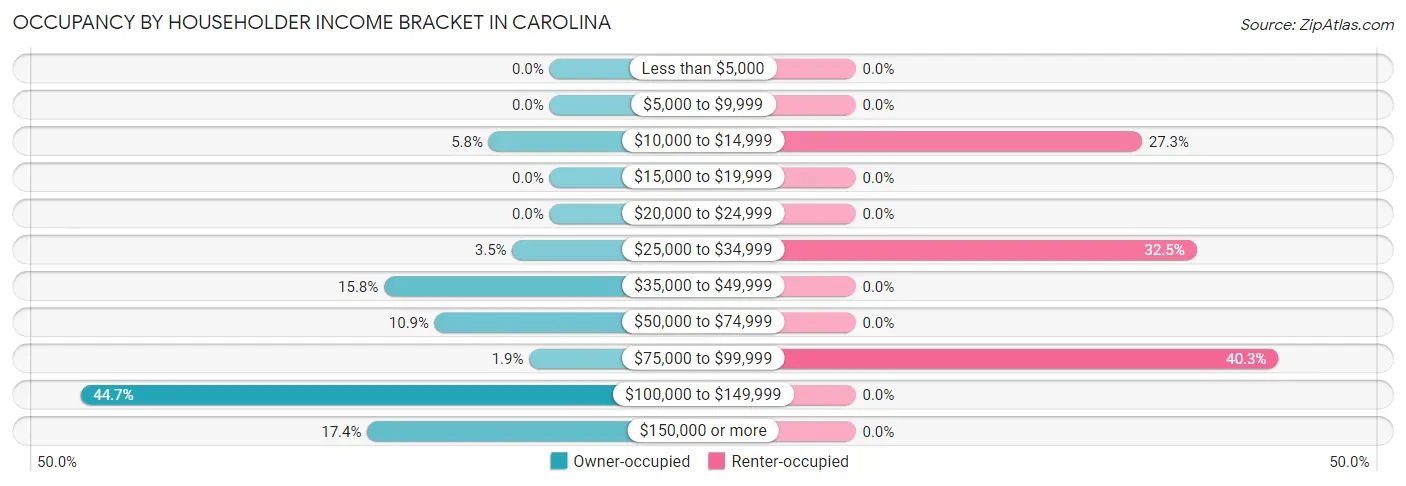
| Income Bracket | Owner-occupied | Renter-occupied |
| Less than $5,000 | 0 (0.0%) | 0 (0.0%) |
| $5,000 to $9,999 | 0 (0.0%) | 0 (0.0%) |
| $10,000 to $14,999 | 18 (5.8%) | 21 (27.3%) |
| $15,000 to $19,999 | 0 (0.0%) | 0 (0.0%) |
| $20,000 to $24,999 | 0 (0.0%) | 0 (0.0%) |
| $25,000 to $34,999 | 11 (3.5%) | 25 (32.5%) |
| $35,000 to $49,999 | 49 (15.8%) | 0 (0.0%) |
| $50,000 to $74,999 | 34 (10.9%) | 0 (0.0%) |
| $75,000 to $99,999 | 6 (1.9%) | 31 (40.3%) |
| $100,000 to $149,999 | 139 (44.7%) | 0 (0.0%) |
| $150,000 or more | 54 (17.4%) | 0 (0.0%) |
| Total | 311 (100.0%) | 77 (100.0%) |
Monthly Housing Cost Tiers in Carolina
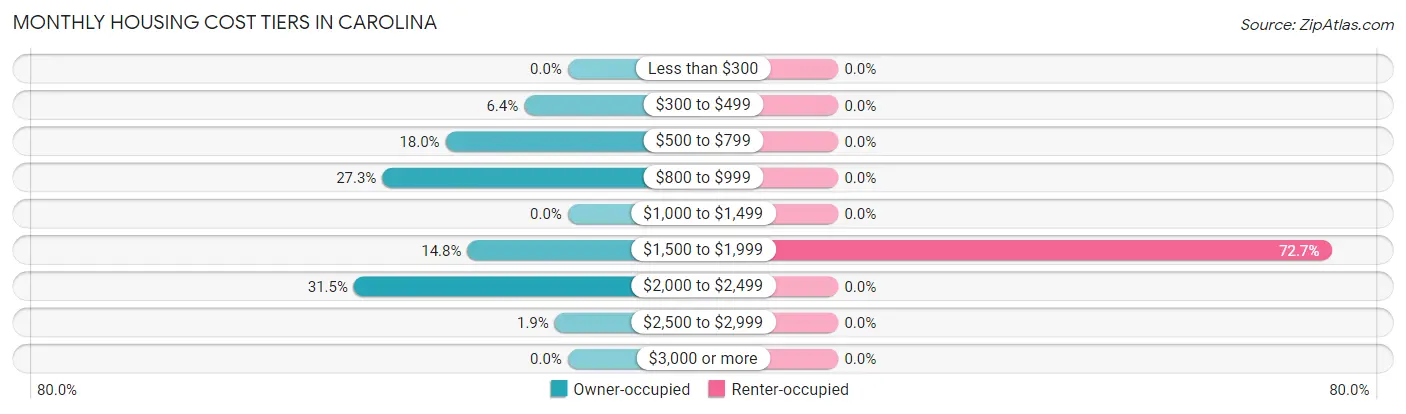
| Monthly Cost | Owner-occupied | Renter-occupied |
| Less than $300 | 0 (0.0%) | 0 (0.0%) |
| $300 to $499 | 20 (6.4%) | 0 (0.0%) |
| $500 to $799 | 56 (18.0%) | 0 (0.0%) |
| $800 to $999 | 85 (27.3%) | 0 (0.0%) |
| $1,000 to $1,499 | 0 (0.0%) | 0 (0.0%) |
| $1,500 to $1,999 | 46 (14.8%) | 56 (72.7%) |
| $2,000 to $2,499 | 98 (31.5%) | 0 (0.0%) |
| $2,500 to $2,999 | 6 (1.9%) | 0 (0.0%) |
| $3,000 or more | 0 (0.0%) | 0 (0.0%) |
| Total | 311 (100.0%) | 77 (100.0%) |
Physical Housing Characteristics in Carolina
Housing Structures in Carolina
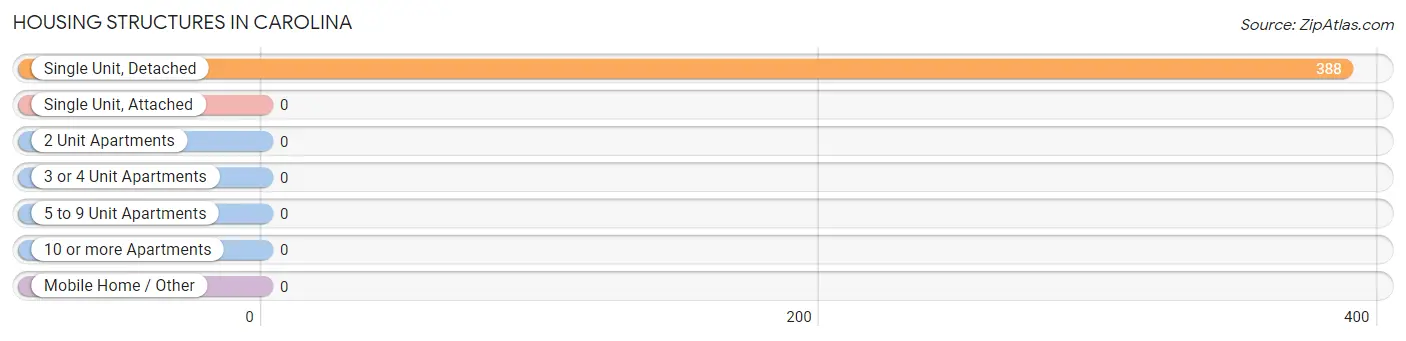
| Structure Type | # Housing Units | % Housing Units |
| Single Unit, Detached | 388 | 100.0% |
| Single Unit, Attached | 0 | 0.0% |
| 2 Unit Apartments | 0 | 0.0% |
| 3 or 4 Unit Apartments | 0 | 0.0% |
| 5 to 9 Unit Apartments | 0 | 0.0% |
| 10 or more Apartments | 0 | 0.0% |
| Mobile Home / Other | 0 | 0.0% |
| Total | 388 | 100.0% |
Housing Structures by Occupancy in Carolina
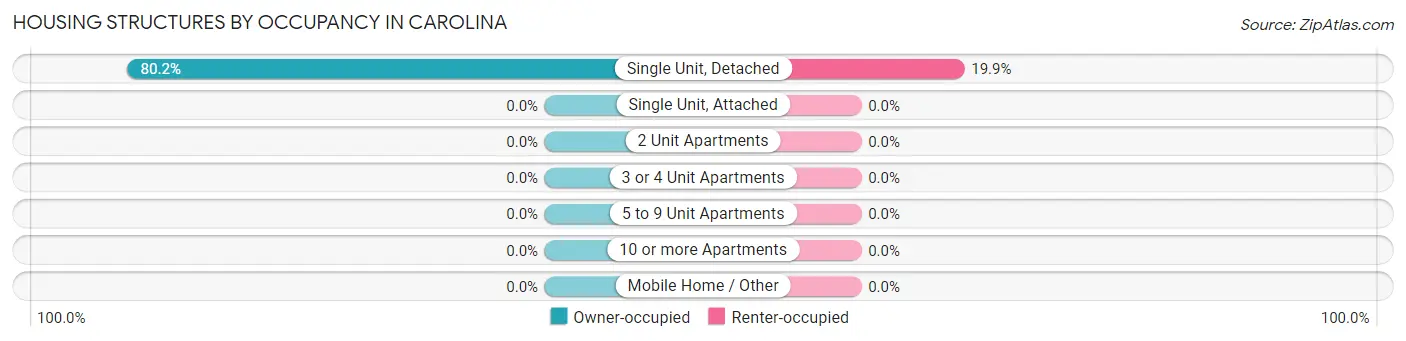
| Structure Type | Owner-occupied | Renter-occupied |
| Single Unit, Detached | 311 (80.1%) | 77 (19.9%) |
| Single Unit, Attached | 0 (0.0%) | 0 (0.0%) |
| 2 Unit Apartments | 0 (0.0%) | 0 (0.0%) |
| 3 or 4 Unit Apartments | 0 (0.0%) | 0 (0.0%) |
| 5 to 9 Unit Apartments | 0 (0.0%) | 0 (0.0%) |
| 10 or more Apartments | 0 (0.0%) | 0 (0.0%) |
| Mobile Home / Other | 0 (0.0%) | 0 (0.0%) |
| Total | 311 (80.1%) | 77 (19.9%) |
Housing Structures by Number of Rooms in Carolina
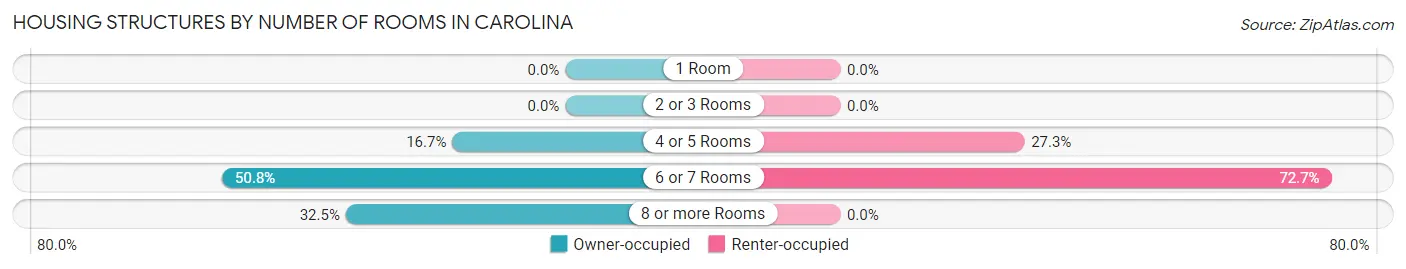
| Number of Rooms | Owner-occupied | Renter-occupied |
| 1 Room | 0 (0.0%) | 0 (0.0%) |
| 2 or 3 Rooms | 0 (0.0%) | 0 (0.0%) |
| 4 or 5 Rooms | 52 (16.7%) | 21 (27.3%) |
| 6 or 7 Rooms | 158 (50.8%) | 56 (72.7%) |
| 8 or more Rooms | 101 (32.5%) | 0 (0.0%) |
| Total | 311 (100.0%) | 77 (100.0%) |
Housing Structure by Heating Type in Carolina
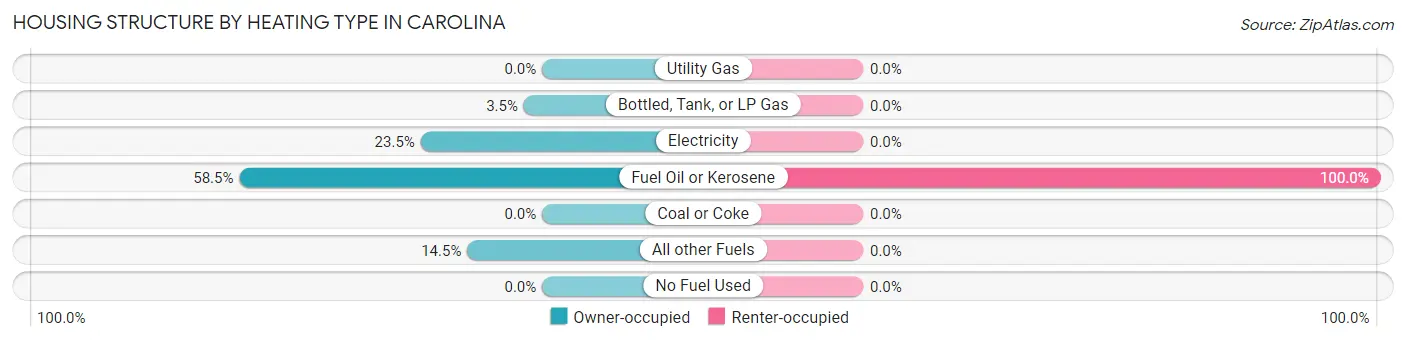
| Heating Type | Owner-occupied | Renter-occupied |
| Utility Gas | 0 (0.0%) | 0 (0.0%) |
| Bottled, Tank, or LP Gas | 11 (3.5%) | 0 (0.0%) |
| Electricity | 73 (23.5%) | 0 (0.0%) |
| Fuel Oil or Kerosene | 182 (58.5%) | 77 (100.0%) |
| Coal or Coke | 0 (0.0%) | 0 (0.0%) |
| All other Fuels | 45 (14.5%) | 0 (0.0%) |
| No Fuel Used | 0 (0.0%) | 0 (0.0%) |
| Total | 311 (100.0%) | 77 (100.0%) |
Household Vehicle Usage in Carolina
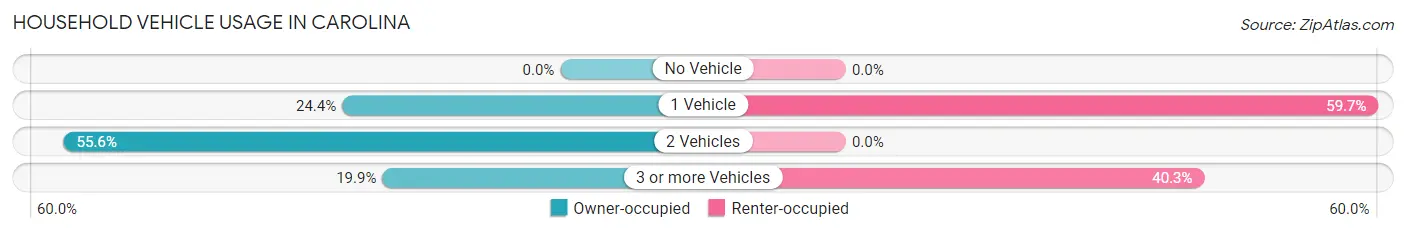
| Vehicles per Household | Owner-occupied | Renter-occupied |
| No Vehicle | 0 (0.0%) | 0 (0.0%) |
| 1 Vehicle | 76 (24.4%) | 46 (59.7%) |
| 2 Vehicles | 173 (55.6%) | 0 (0.0%) |
| 3 or more Vehicles | 62 (19.9%) | 31 (40.3%) |
| Total | 311 (100.0%) | 77 (100.0%) |
Real Estate & Mortgages in Carolina
Real Estate and Mortgage Overview in Carolina
| Characteristic | Without Mortgage | With Mortgage |
| Housing Units | 143 | 168 |
| Median Property Value | $279,100 | $367,400 |
| Median Household Income | - | - |
| Monthly Housing Costs | $680 | $0 |
| Real Estate Taxes | $3,662 | $0 |
Property Value by Mortgage Status in Carolina
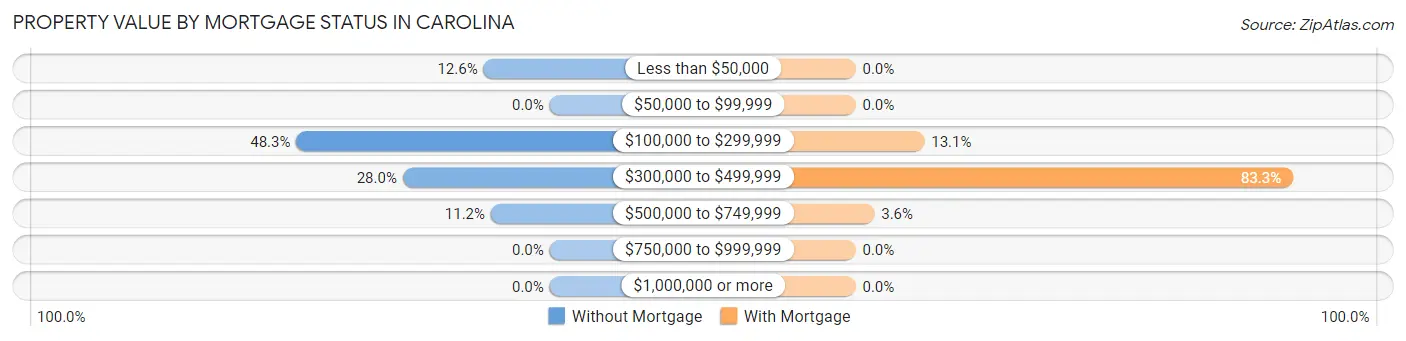
| Property Value | Without Mortgage | With Mortgage |
| Less than $50,000 | 18 (12.6%) | 0 (0.0%) |
| $50,000 to $99,999 | 0 (0.0%) | 0 (0.0%) |
| $100,000 to $299,999 | 69 (48.2%) | 22 (13.1%) |
| $300,000 to $499,999 | 40 (28.0%) | 140 (83.3%) |
| $500,000 to $749,999 | 16 (11.2%) | 6 (3.6%) |
| $750,000 to $999,999 | 0 (0.0%) | 0 (0.0%) |
| $1,000,000 or more | 0 (0.0%) | 0 (0.0%) |
| Total | 143 (100.0%) | 168 (100.0%) |
Household Income by Mortgage Status in Carolina
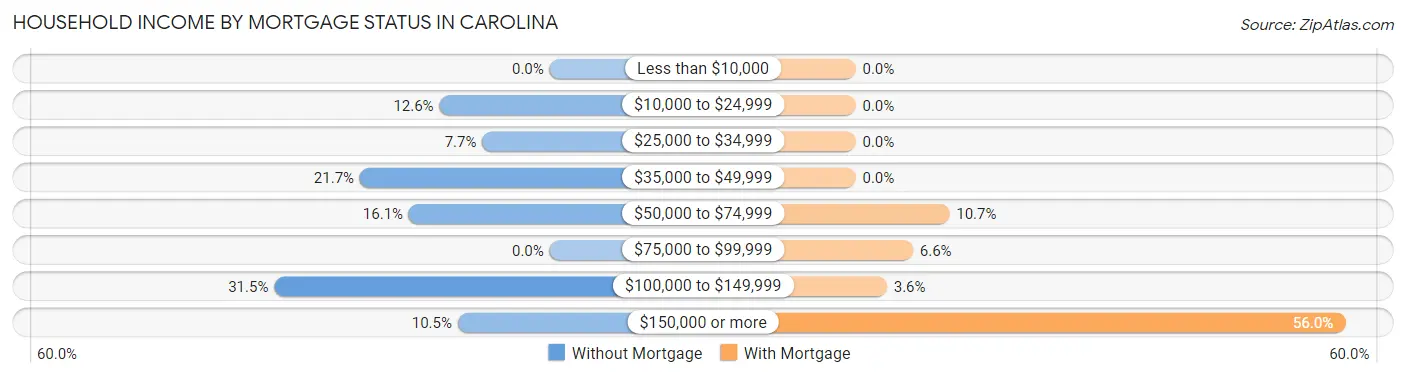
| Household Income | Without Mortgage | With Mortgage |
| Less than $10,000 | 0 (0.0%) | 0 (0.0%) |
| $10,000 to $24,999 | 18 (12.6%) | 0 (0.0%) |
| $25,000 to $34,999 | 11 (7.7%) | 0 (0.0%) |
| $35,000 to $49,999 | 31 (21.7%) | 0 (0.0%) |
| $50,000 to $74,999 | 23 (16.1%) | 18 (10.7%) |
| $75,000 to $99,999 | 0 (0.0%) | 11 (6.6%) |
| $100,000 to $149,999 | 45 (31.5%) | 6 (3.6%) |
| $150,000 or more | 15 (10.5%) | 94 (55.9%) |
| Total | 143 (100.0%) | 168 (100.0%) |
Property Value to Household Income Ratio in Carolina
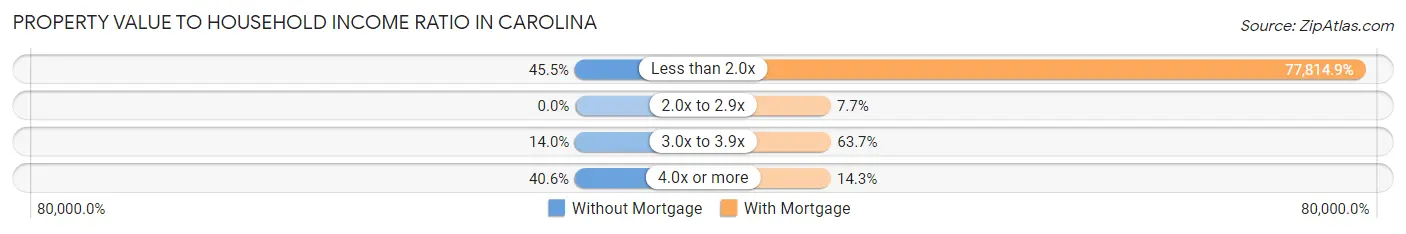
| Value-to-Income Ratio | Without Mortgage | With Mortgage |
| Less than 2.0x | 65 (45.5%) | 130,729 (77,814.9%) |
| 2.0x to 2.9x | 0 (0.0%) | 13 (7.7%) |
| 3.0x to 3.9x | 20 (14.0%) | 107 (63.7%) |
| 4.0x or more | 58 (40.6%) | 24 (14.3%) |
| Total | 143 (100.0%) | 168 (100.0%) |
Real Estate Taxes by Mortgage Status in Carolina
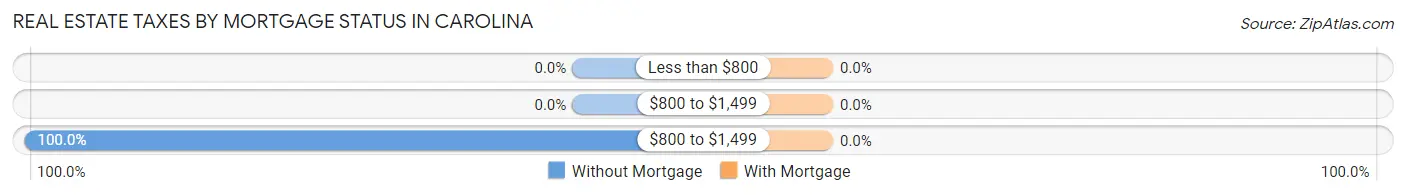
| Property Taxes | Without Mortgage | With Mortgage |
| Less than $800 | 0 (0.0%) | 0 (0.0%) |
| $800 to $1,499 | 0 (0.0%) | 0 (0.0%) |
| $800 to $1,499 | 143 (100.0%) | 0 (0.0%) |
| Total | 143 (100.0%) | 168 (100.0%) |
Health & Disability in Carolina
Health Insurance Coverage by Age in Carolina
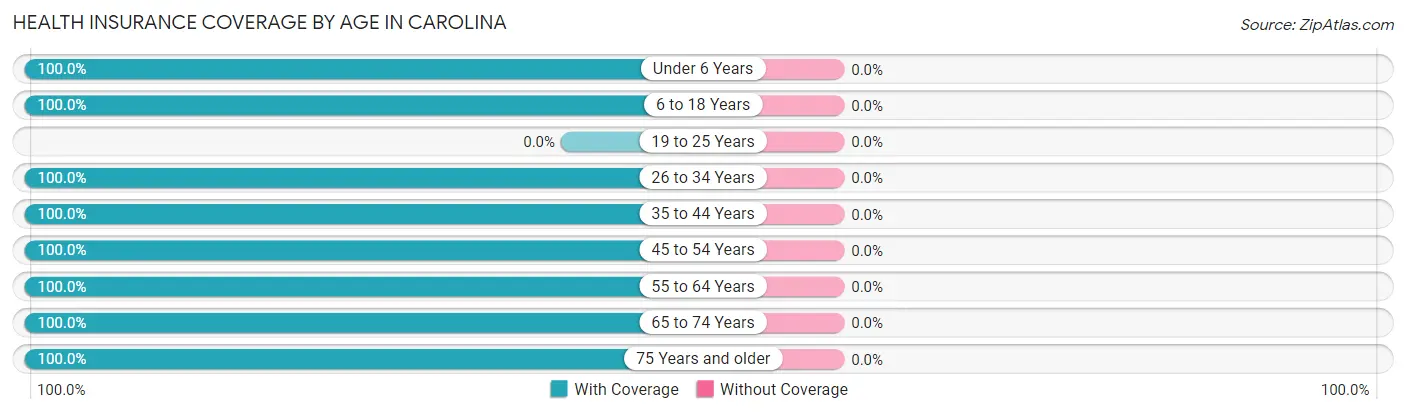
| Age Bracket | With Coverage | Without Coverage |
| Under 6 Years | 13 (100.0%) | 0 (0.0%) |
| 6 to 18 Years | 343 (100.0%) | 0 (0.0%) |
| 19 to 25 Years | 0 (0.0%) | 0 (0.0%) |
| 26 to 34 Years | 48 (100.0%) | 0 (0.0%) |
| 35 to 44 Years | 206 (100.0%) | 0 (0.0%) |
| 45 to 54 Years | 222 (100.0%) | 0 (0.0%) |
| 55 to 64 Years | 128 (100.0%) | 0 (0.0%) |
| 65 to 74 Years | 141 (100.0%) | 0 (0.0%) |
| 75 Years and older | 64 (100.0%) | 0 (0.0%) |
| Total | 1,165 (100.0%) | 0 (0.0%) |
Health Insurance Coverage by Citizenship Status in Carolina
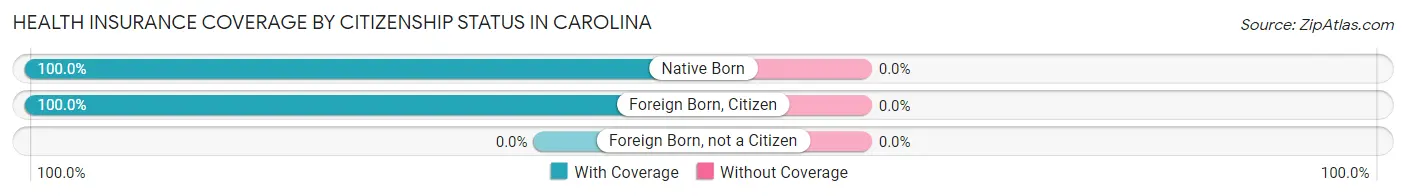
| Citizenship Status | With Coverage | Without Coverage |
| Native Born | 13 (100.0%) | 0 (0.0%) |
| Foreign Born, Citizen | 343 (100.0%) | 0 (0.0%) |
| Foreign Born, not a Citizen | 0 (0.0%) | 0 (0.0%) |
Health Insurance Coverage by Household Income in Carolina
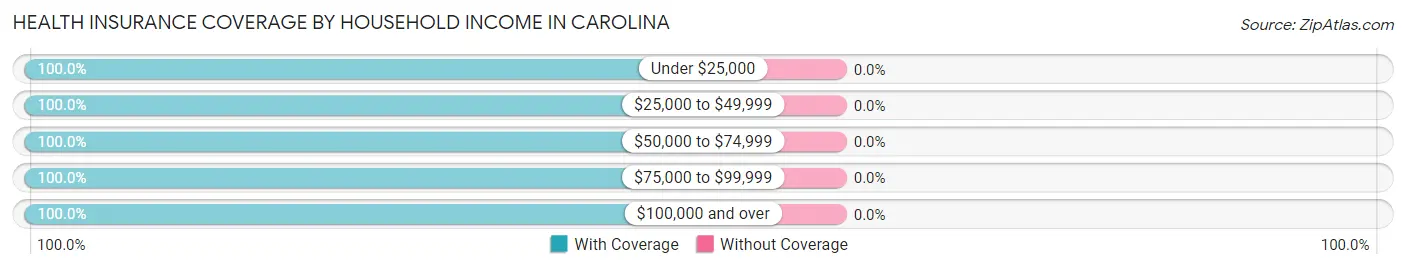
| Household Income | With Coverage | Without Coverage |
| Under $25,000 | 39 (100.0%) | 0 (0.0%) |
| $25,000 to $49,999 | 174 (100.0%) | 0 (0.0%) |
| $50,000 to $74,999 | 145 (100.0%) | 0 (0.0%) |
| $75,000 to $99,999 | 197 (100.0%) | 0 (0.0%) |
| $100,000 and over | 610 (100.0%) | 0 (0.0%) |
Public vs Private Health Insurance Coverage by Age in Carolina
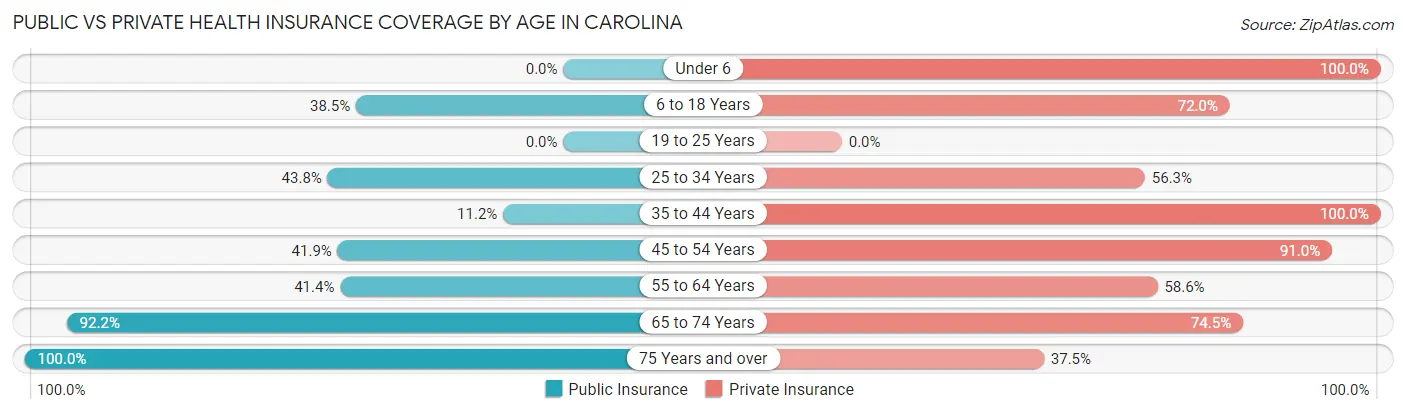
| Age Bracket | Public Insurance | Private Insurance |
| Under 6 | 0 (0.0%) | 13 (100.0%) |
| 6 to 18 Years | 132 (38.5%) | 247 (72.0%) |
| 19 to 25 Years | 0 (0.0%) | 0 (0.0%) |
| 25 to 34 Years | 21 (43.8%) | 27 (56.2%) |
| 35 to 44 Years | 23 (11.2%) | 206 (100.0%) |
| 45 to 54 Years | 93 (41.9%) | 202 (91.0%) |
| 55 to 64 Years | 53 (41.4%) | 75 (58.6%) |
| 65 to 74 Years | 130 (92.2%) | 105 (74.5%) |
| 75 Years and over | 64 (100.0%) | 24 (37.5%) |
| Total | 516 (44.3%) | 899 (77.2%) |
Disability Status by Sex by Age in Carolina
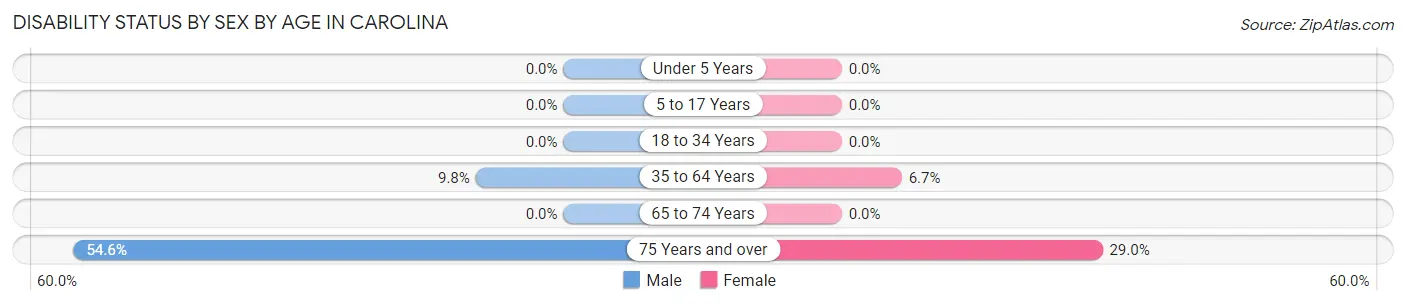
| Age Bracket | Male | Female |
| Under 5 Years | 0 (0.0%) | 0 (0.0%) |
| 5 to 17 Years | 0 (0.0%) | 0 (0.0%) |
| 18 to 34 Years | 0 (0.0%) | 0 (0.0%) |
| 35 to 64 Years | 25 (9.8%) | 20 (6.7%) |
| 65 to 74 Years | 0 (0.0%) | 0 (0.0%) |
| 75 Years and over | 18 (54.5%) | 9 (29.0%) |
Disability Class by Sex by Age in Carolina
Disability Class: Hearing Difficulty
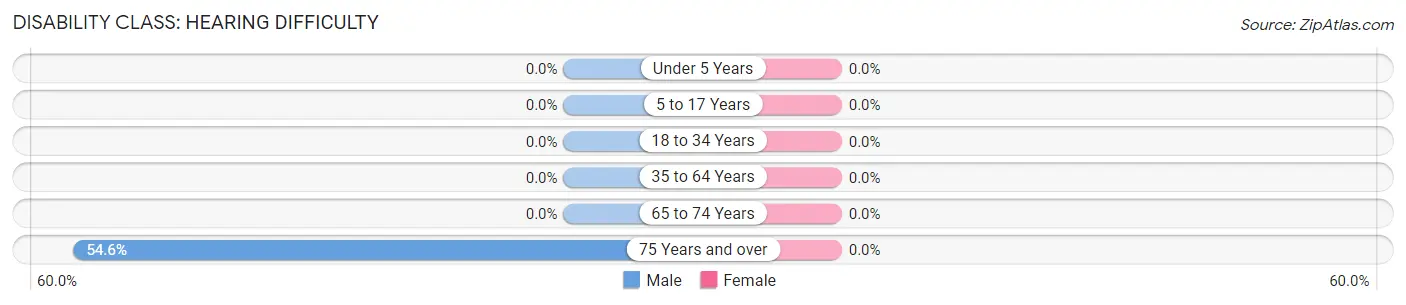
| Age Bracket | Male | Female |
| Under 5 Years | 0 (0.0%) | 0 (0.0%) |
| 5 to 17 Years | 0 (0.0%) | 0 (0.0%) |
| 18 to 34 Years | 0 (0.0%) | 0 (0.0%) |
| 35 to 64 Years | 0 (0.0%) | 0 (0.0%) |
| 65 to 74 Years | 0 (0.0%) | 0 (0.0%) |
| 75 Years and over | 18 (54.5%) | 0 (0.0%) |
Disability Class: Vision Difficulty

| Age Bracket | Male | Female |
| Under 5 Years | 0 (0.0%) | 0 (0.0%) |
| 5 to 17 Years | 0 (0.0%) | 0 (0.0%) |
| 18 to 34 Years | 0 (0.0%) | 0 (0.0%) |
| 35 to 64 Years | 0 (0.0%) | 0 (0.0%) |
| 65 to 74 Years | 0 (0.0%) | 0 (0.0%) |
| 75 Years and over | 18 (54.5%) | 0 (0.0%) |
Disability Class: Cognitive Difficulty
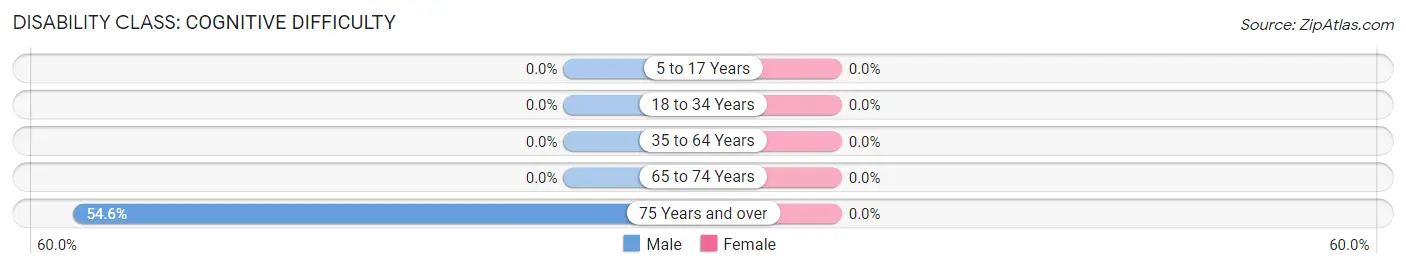
| Age Bracket | Male | Female |
| 5 to 17 Years | 0 (0.0%) | 0 (0.0%) |
| 18 to 34 Years | 0 (0.0%) | 0 (0.0%) |
| 35 to 64 Years | 0 (0.0%) | 0 (0.0%) |
| 65 to 74 Years | 0 (0.0%) | 0 (0.0%) |
| 75 Years and over | 18 (54.5%) | 0 (0.0%) |
Disability Class: Ambulatory Difficulty
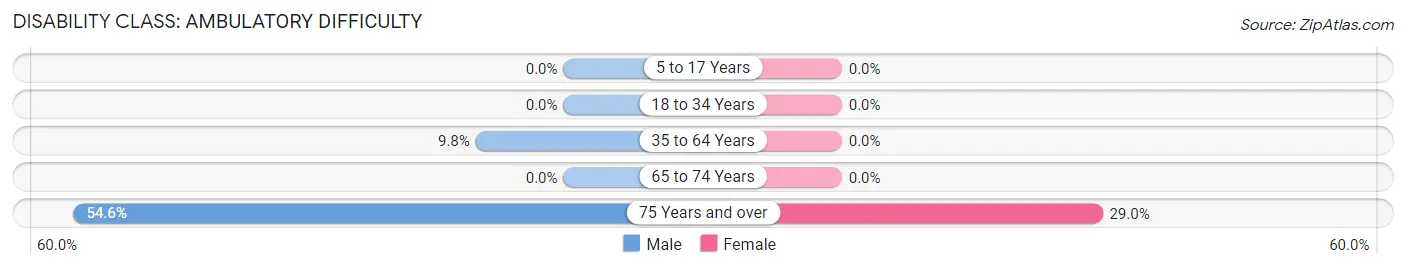
| Age Bracket | Male | Female |
| 5 to 17 Years | 0 (0.0%) | 0 (0.0%) |
| 18 to 34 Years | 0 (0.0%) | 0 (0.0%) |
| 35 to 64 Years | 25 (9.8%) | 0 (0.0%) |
| 65 to 74 Years | 0 (0.0%) | 0 (0.0%) |
| 75 Years and over | 18 (54.5%) | 9 (29.0%) |
Disability Class: Self-Care Difficulty
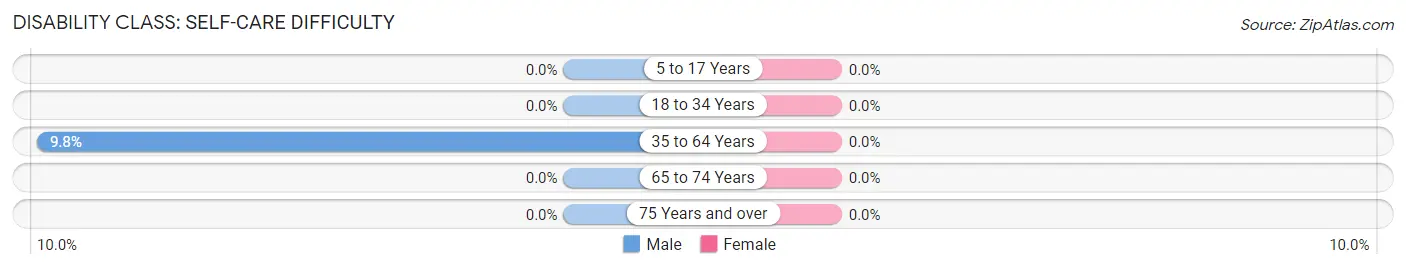
| Age Bracket | Male | Female |
| 5 to 17 Years | 0 (0.0%) | 0 (0.0%) |
| 18 to 34 Years | 0 (0.0%) | 0 (0.0%) |
| 35 to 64 Years | 25 (9.8%) | 0 (0.0%) |
| 65 to 74 Years | 0 (0.0%) | 0 (0.0%) |
| 75 Years and over | 0 (0.0%) | 0 (0.0%) |
Technology Access in Carolina
Computing Device Access in Carolina
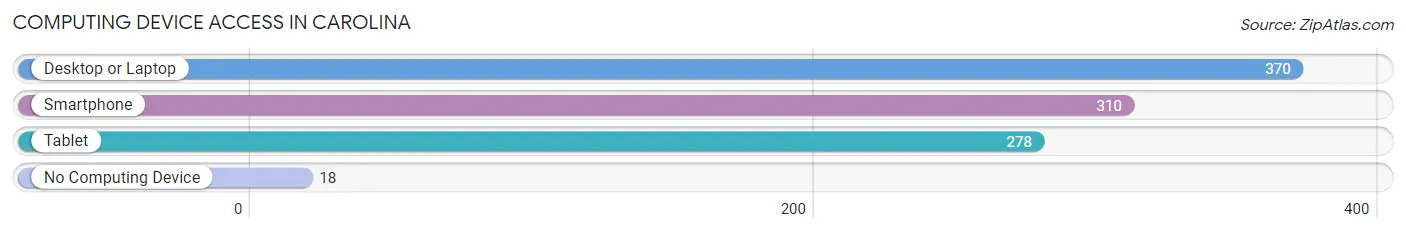
| Device Type | # Households | % Households |
| Desktop or Laptop | 370 | 95.4% |
| Smartphone | 310 | 79.9% |
| Tablet | 278 | 71.7% |
| No Computing Device | 18 | 4.6% |
| Total | 388 | 100.0% |
Internet Access in Carolina
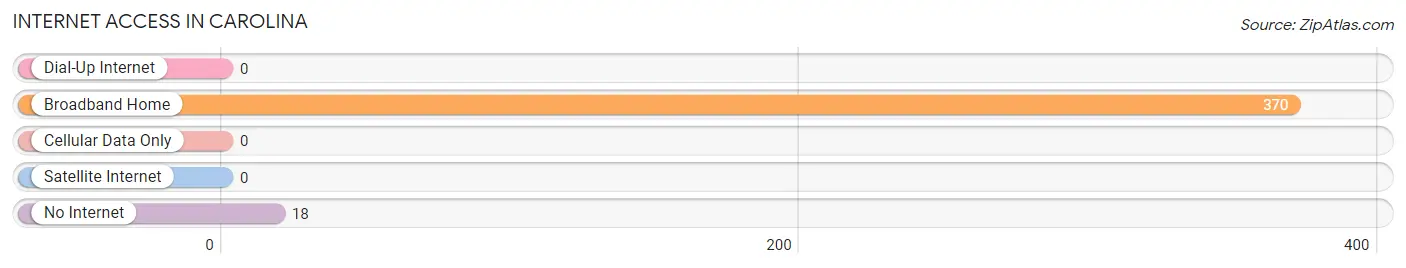
| Internet Type | # Households | % Households |
| Dial-Up Internet | 0 | 0.0% |
| Broadband Home | 370 | 95.4% |
| Cellular Data Only | 0 | 0.0% |
| Satellite Internet | 0 | 0.0% |
| No Internet | 18 | 4.6% |
| Total | 388 | 100.0% |
Carolina Summary
Carolina, Rhode Island is a small town located in the southwestern corner of the state. It is bordered by Connecticut to the west, Massachusetts to the north, and the Atlantic Ocean to the east and south. The town has a population of approximately 1,500 people and covers an area of about 8.5 square miles.
History
Carolina was first settled in 1663 by a group of English settlers from the nearby town of Providence. The town was originally known as “Carolina Plantation” and was part of the Providence Plantations. In 1731, the town was officially incorporated as “Carolina” and was named after the English colony of Carolina.
During the American Revolution, Carolina was a major supplier of food and supplies to the Continental Army. The town was also the site of a major battle between the British and American forces in 1778.
Geography
Carolina is located in the southwestern corner of Rhode Island, bordered by Connecticut to the west, Massachusetts to the north, and the Atlantic Ocean to the east and south. The town is situated on the Pawcatuck River, which flows into the Atlantic Ocean. The town is mostly rural, with a few small villages and hamlets scattered throughout.
The town is mostly flat, with some rolling hills in the northern part of town. The highest point in town is located at the intersection of Route 1 and Route 3, at an elevation of about 200 feet.
Economy
The economy of Carolina is largely based on agriculture and fishing. The town is home to several farms, which produce a variety of crops, including corn, potatoes, and hay. The town also has a thriving fishing industry, with several commercial fishing boats operating out of the town’s harbor.
In addition to agriculture and fishing, the town also has a small manufacturing sector. The town is home to several small businesses, including a furniture factory, a boat building company, and a metal fabrication shop.
Demographics
As of the 2010 census, the population of Carolina was 1,500 people. The racial makeup of the town was 94.2% White, 2.7% African American, 0.7% Native American, 0.7% Asian, and 1.7% from other races. The median household income was $50,000, and the median family income was $60,000.
The town is served by the Carolina School District, which consists of two elementary schools, one middle school, and one high school. The town also has a public library, a post office, and several churches.
Carolina is a small town with a rich history and a vibrant economy. The town is home to a diverse population and is a great place to live and work.
Common Questions
What is Per Capita Income in Carolina?
Per Capita income in Carolina is $32,499.
What is the Median Family Income in Carolina?
Median Family Income in Carolina is $105,677.
What is the Median Household income in Carolina?
Median Household Income in Carolina is $92,419.
What is Income or Wage Gap in Carolina?
Income or Wage Gap in Carolina is 46.0%.
Women in Carolina earn 54.0 cents for every dollar earned by a man.
What is Inequality or Gini Index in Carolina?
Inequality or Gini Index in Carolina is 0.35.
What is the Total Population of Carolina?
Total Population of Carolina is 1,165.
What is the Total Male Population of Carolina?
Total Male Population of Carolina is 524.
What is the Total Female Population of Carolina?
Total Female Population of Carolina is 641.
What is the Ratio of Males per 100 Females in Carolina?
There are 81.75 Males per 100 Females in Carolina.
What is the Ratio of Females per 100 Males in Carolina?
There are 122.33 Females per 100 Males in Carolina.
What is the Median Population Age in Carolina?
Median Population Age in Carolina is 43.5 Years.
What is the Average Family Size in Carolina
Average Family Size in Carolina is 3.7 People.
What is the Average Household Size in Carolina
Average Household Size in Carolina is 3.0 People.
How Large is the Labor Force in Carolina?
There are 586 People in the Labor Forcein in Carolina.
What is the Percentage of People in the Labor Force in Carolina?
62.9% of People are in the Labor Force in Carolina.
What is the Unemployment Rate in Carolina?
Unemployment Rate in Carolina is 6.1%.