Sheridan, CA Map & Demographics
Sheridan Map
Sheridan Overview
$26,481
PER CAPITA INCOME
$69,674
AVG FAMILY INCOME
$68,859
AVG HOUSEHOLD INCOME
0.37
INEQUALITY / GINI INDEX
1,397
TOTAL POPULATION
710
MALE POPULATION
687
FEMALE POPULATION
103.35
MALES / 100 FEMALES
96.76
FEMALES / 100 MALES
28.7
MEDIAN AGE
4.1
AVG FAMILY SIZE
4.0
AVG HOUSEHOLD SIZE
717
LABOR FORCE [ PEOPLE ]
75.9%
PERCENT IN LABOR FORCE
6.4%
UNEMPLOYMENT RATE
Sheridan Zip Codes
Income in Sheridan
Income Overview in Sheridan
Per Capita Income in Sheridan is $26,481, while median incomes of families and households are $69,674 and $68,859 respectively.
| Characteristic | Number | Measure |
| Per Capita Income | 1,397 | $26,481 |
| Median Family Income | 334 | $69,674 |
| Mean Family Income | 334 | $98,665 |
| Median Household Income | 349 | $68,859 |
| Mean Household Income | 349 | $95,944 |
| Income Deficit | 334 | $0 |
| Wage / Income Gap (%) | 1,397 | 0.00% |
| Wage / Income Gap ($) | 1,397 | 100.00¢ per $1 |
| Gini / Inequality Index | 1,397 | 0.37 |
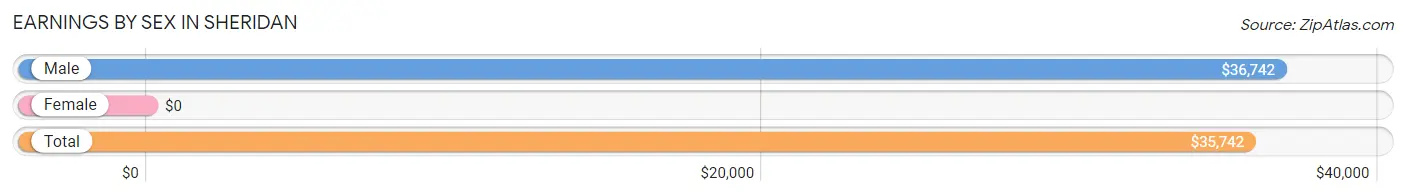
Earnings by Sex in Sheridan
| Sex | Number | Average Earnings |
| Male | 333 (45.3%) | $36,742 |
| Female | 402 (54.7%) | $0 |
| Total | 735 (100.0%) | $35,742 |
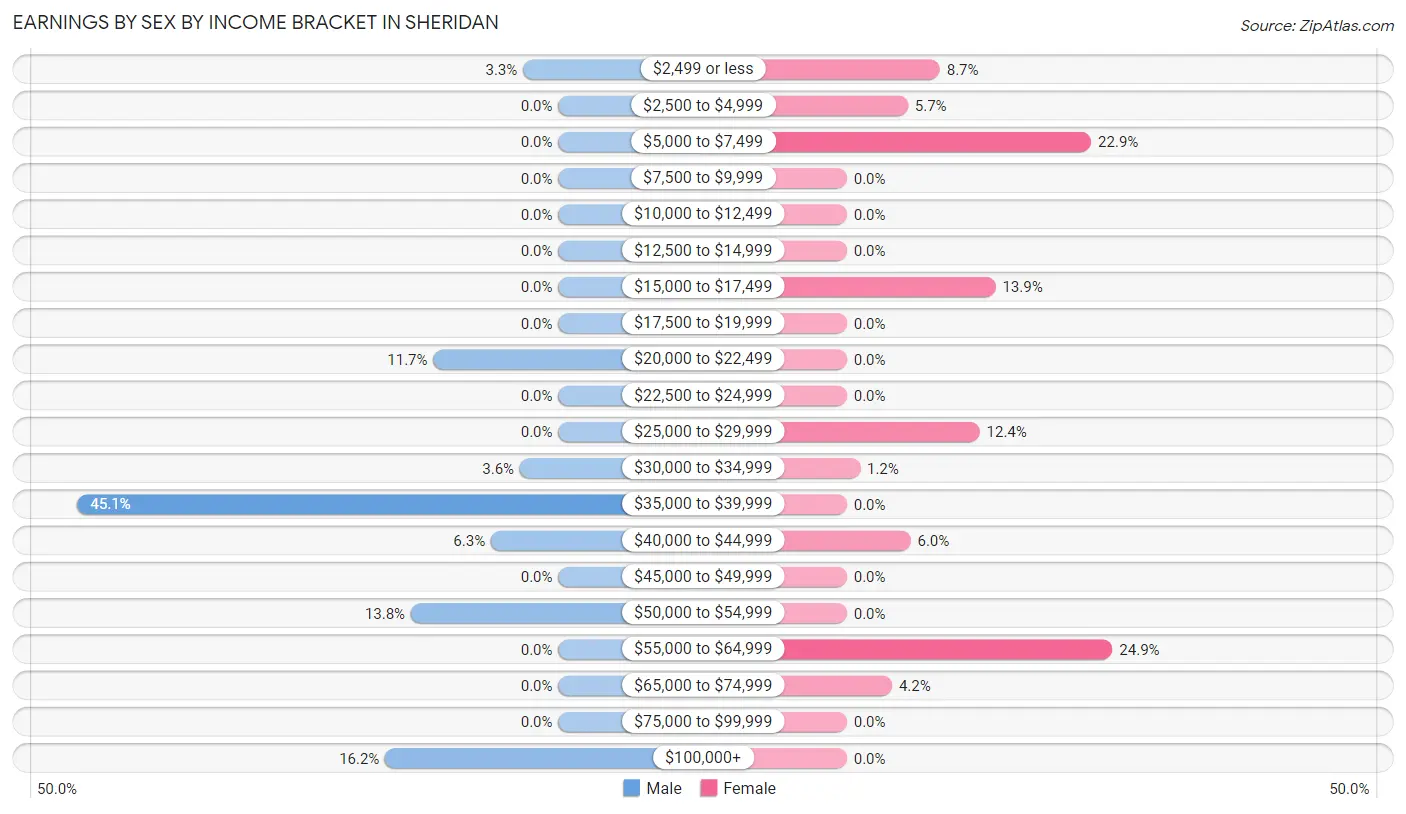
Earnings by Sex by Income Bracket in Sheridan
The most common earnings brackets in Sheridan are $35,000 to $39,999 for men (150 | 45.1%) and $55,000 to $64,999 for women (100 | 24.9%).
| Income | Male | Female |
| $2,499 or less | 11 (3.3%) | 35 (8.7%) |
| $2,500 to $4,999 | 0 (0.0%) | 23 (5.7%) |
| $5,000 to $7,499 | 0 (0.0%) | 92 (22.9%) |
| $7,500 to $9,999 | 0 (0.0%) | 0 (0.0%) |
| $10,000 to $12,499 | 0 (0.0%) | 0 (0.0%) |
| $12,500 to $14,999 | 0 (0.0%) | 0 (0.0%) |
| $15,000 to $17,499 | 0 (0.0%) | 56 (13.9%) |
| $17,500 to $19,999 | 0 (0.0%) | 0 (0.0%) |
| $20,000 to $22,499 | 39 (11.7%) | 0 (0.0%) |
| $22,500 to $24,999 | 0 (0.0%) | 0 (0.0%) |
| $25,000 to $29,999 | 0 (0.0%) | 50 (12.4%) |
| $30,000 to $34,999 | 12 (3.6%) | 5 (1.2%) |
| $35,000 to $39,999 | 150 (45.1%) | 0 (0.0%) |
| $40,000 to $44,999 | 21 (6.3%) | 24 (6.0%) |
| $45,000 to $49,999 | 0 (0.0%) | 0 (0.0%) |
| $50,000 to $54,999 | 46 (13.8%) | 0 (0.0%) |
| $55,000 to $64,999 | 0 (0.0%) | 100 (24.9%) |
| $65,000 to $74,999 | 0 (0.0%) | 17 (4.2%) |
| $75,000 to $99,999 | 0 (0.0%) | 0 (0.0%) |
| $100,000+ | 54 (16.2%) | 0 (0.0%) |
| Total | 333 (100.0%) | 402 (100.0%) |
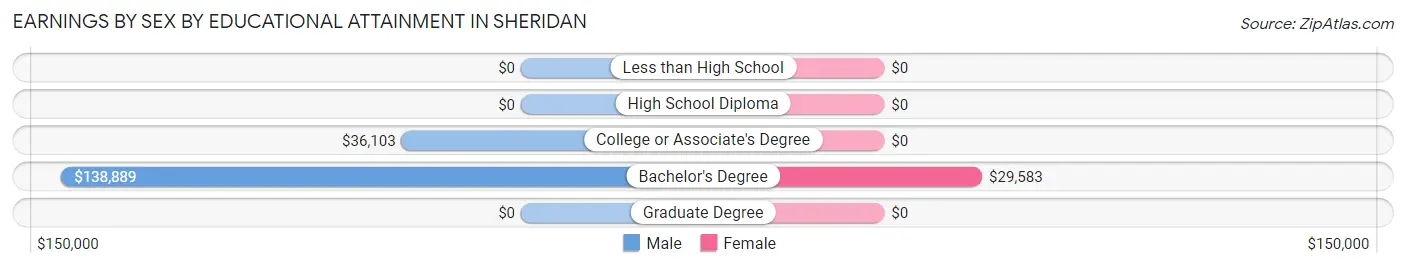
Earnings by Sex by Educational Attainment in Sheridan
Average earnings in Sheridan are $36,358 for men and $40,573 for women, a difference of 10.4%. Men with an educational attainment of bachelor's degree enjoy the highest average annual earnings of $138,889, while those with college or associate's degree education earn the least with $36,103. Women with an educational attainment of bachelor's degree earn the most with the average annual earnings of $29,583, while those with bachelor's degree education have the smallest earnings of $29,583.
| Educational Attainment | Male Income | Female Income |
| Less than High School | - | - |
| High School Diploma | - | - |
| College or Associate's Degree | $36,103 | $0 |
| Bachelor's Degree | $138,889 | $29,583 |
| Graduate Degree | - | - |
| Total | $36,358 | $40,573 |
Family Income in Sheridan
Family Income Brackets in Sheridan
According to the Sheridan family income data, there are 114 families falling into the $35,000 to $49,999 income range, which is the most common income bracket and makes up 34.1% of all families.
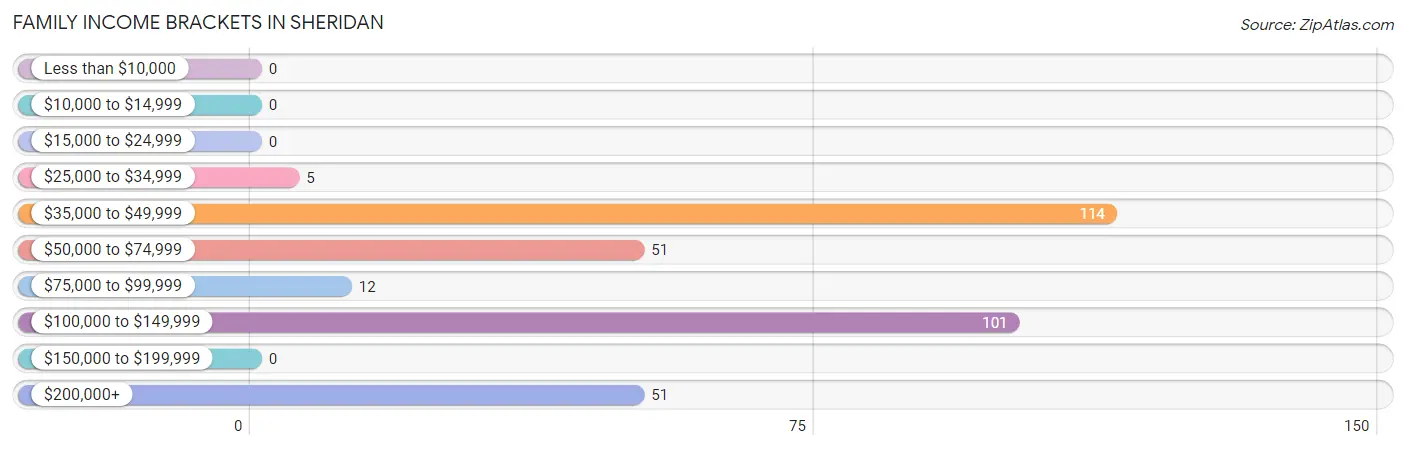
| Income Bracket | # Families | % Families |
| Less than $10,000 | 0 | 0.0% |
| $10,000 to $14,999 | 0 | 0.0% |
| $15,000 to $24,999 | 0 | 0.0% |
| $25,000 to $34,999 | 5 | 1.5% |
| $35,000 to $49,999 | 114 | 34.1% |
| $50,000 to $74,999 | 51 | 15.3% |
| $75,000 to $99,999 | 12 | 3.6% |
| $100,000 to $149,999 | 101 | 30.2% |
| $150,000 to $199,999 | 0 | 0.0% |
| $200,000+ | 51 | 15.3% |
Family Income by Famaliy Size in Sheridan
4-person families (91 | 27.3%) account for the highest median family income in Sheridan with $49,659 per family, while 4-person families (91 | 27.3%) have the highest median income of $12,415 per family member.
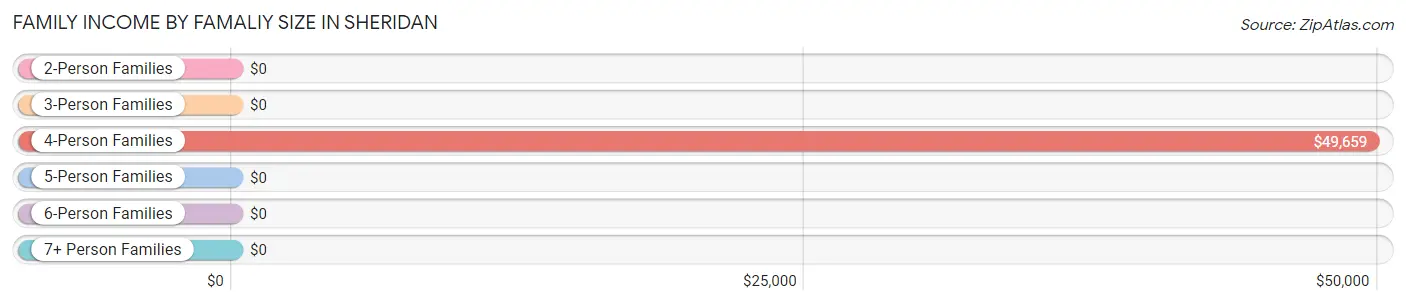
| Income Bracket | # Families | Median Income |
| 2-Person Families | 101 (30.2%) | $0 |
| 3-Person Families | 37 (11.1%) | $0 |
| 4-Person Families | 91 (27.3%) | $49,659 |
| 5-Person Families | 67 (20.1%) | $0 |
| 6-Person Families | 38 (11.4%) | $0 |
| 7+ Person Families | 0 (0.0%) | $0 |
| Total | 334 (100.0%) | $69,674 |
Family Income by Number of Earners in Sheridan
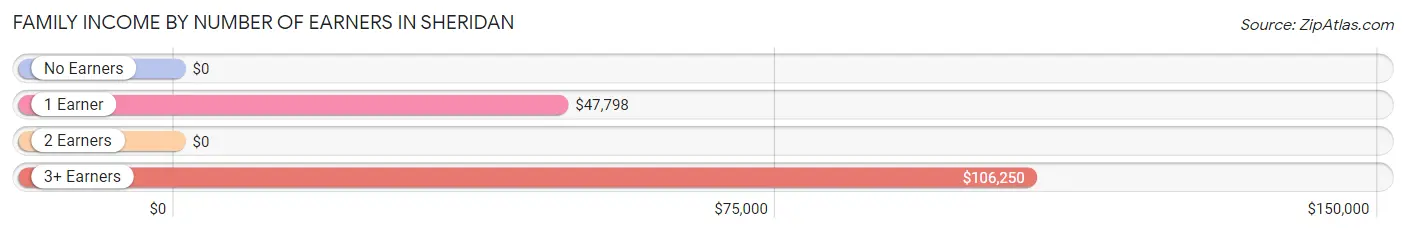
| Number of Earners | # Families | Median Income |
| No Earners | 28 (8.4%) | $0 |
| 1 Earner | 91 (27.3%) | $47,798 |
| 2 Earners | 114 (34.1%) | $0 |
| 3+ Earners | 101 (30.2%) | $106,250 |
| Total | 334 (100.0%) | $69,674 |
Household Income in Sheridan
Household Income Brackets in Sheridan
With 129 households falling in the category, the $35,000 to $49,999 income range is the most frequent in Sheridan, accounting for 37.0% of all households.
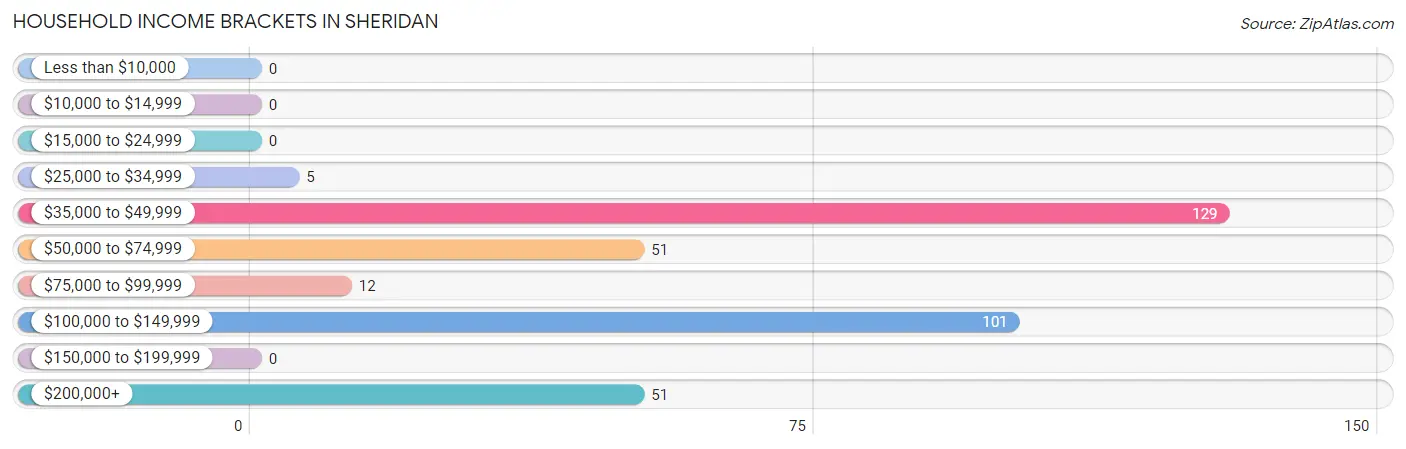
| Income Bracket | # Households | % Households |
| Less than $10,000 | 0 | 0.0% |
| $10,000 to $14,999 | 0 | 0.0% |
| $15,000 to $24,999 | 0 | 0.0% |
| $25,000 to $34,999 | 5 | 1.4% |
| $35,000 to $49,999 | 129 | 37.0% |
| $50,000 to $74,999 | 51 | 14.6% |
| $75,000 to $99,999 | 12 | 3.4% |
| $100,000 to $149,999 | 101 | 28.9% |
| $150,000 to $199,999 | 0 | 0.0% |
| $200,000+ | 51 | 14.6% |
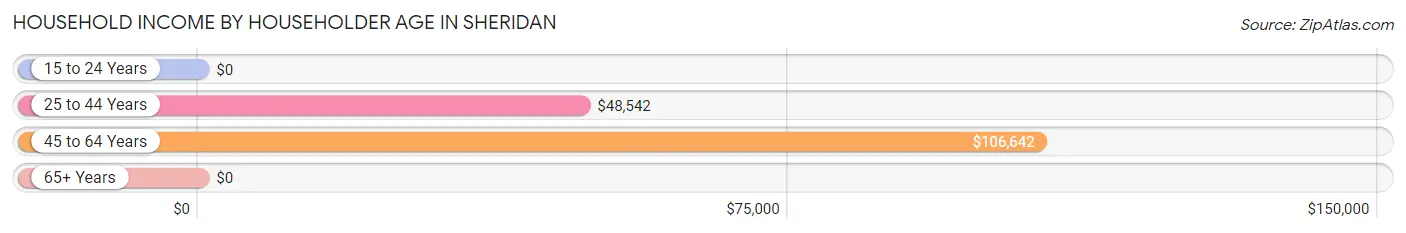
Household Income by Householder Age in Sheridan
The median household income in Sheridan is $68,859, with the highest median household income of $106,642 found in the 45 to 64 years age bracket for the primary householder. A total of 146 households (41.8%) fall into this category.
| Income Bracket | # Households | Median Income |
| 15 to 24 Years | 0 (0.0%) | $0 |
| 25 to 44 Years | 175 (50.1%) | $48,542 |
| 45 to 64 Years | 146 (41.8%) | $106,642 |
| 65+ Years | 28 (8.0%) | $0 |
| Total | 349 (100.0%) | $68,859 |
Poverty in Sheridan
Income Below Poverty by Sex and Age in Sheridan
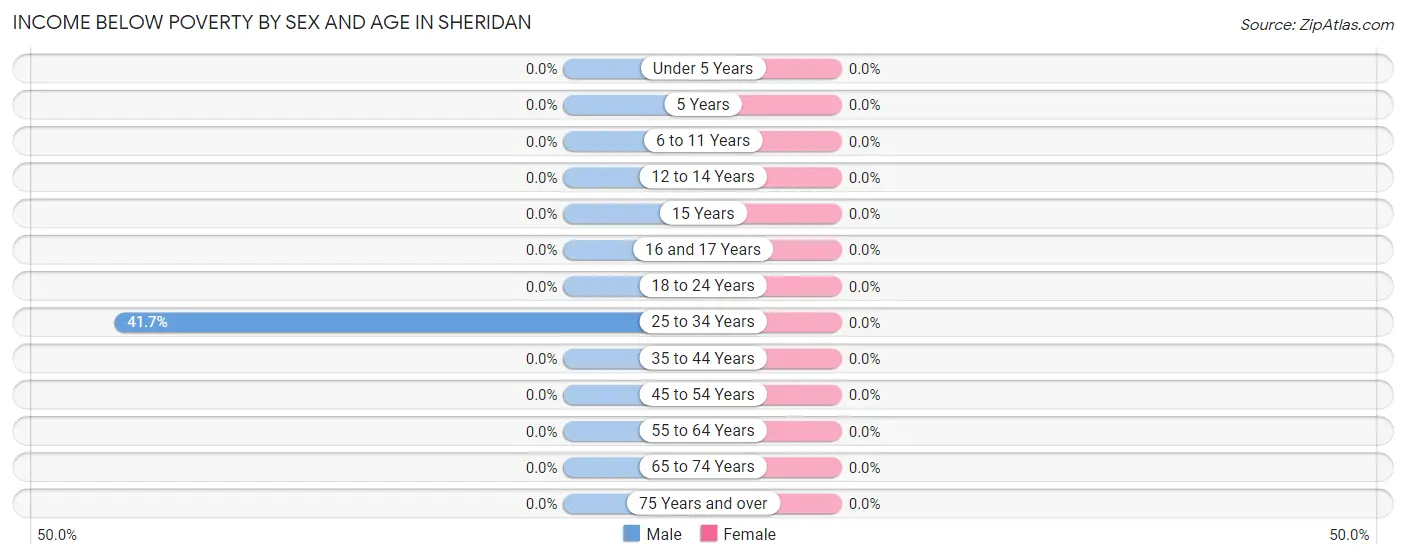
| Age Bracket | Male | Female |
| Under 5 Years | 0 (0.0%) | 0 (0.0%) |
| 5 Years | 0 (0.0%) | 0 (0.0%) |
| 6 to 11 Years | 0 (0.0%) | 0 (0.0%) |
| 12 to 14 Years | 0 (0.0%) | 0 (0.0%) |
| 15 Years | 0 (0.0%) | 0 (0.0%) |
| 16 and 17 Years | 0 (0.0%) | 0 (0.0%) |
| 18 to 24 Years | 0 (0.0%) | 0 (0.0%) |
| 25 to 34 Years | 20 (41.7%) | 0 (0.0%) |
| 35 to 44 Years | 0 (0.0%) | 0 (0.0%) |
| 45 to 54 Years | 0 (0.0%) | 0 (0.0%) |
| 55 to 64 Years | 0 (0.0%) | 0 (0.0%) |
| 65 to 74 Years | 0 (0.0%) | 0 (0.0%) |
| 75 Years and over | 0 (0.0%) | 0 (0.0%) |
| Total | 20 (2.8%) | 0 (0.0%) |
Income Above Poverty by Sex and Age in Sheridan
According to the poverty statistics in Sheridan, males aged 5 years and females aged under 5 years are the age groups that are most secure financially, with 100.0% of males and 100.0% of females in these age groups living above the poverty line.
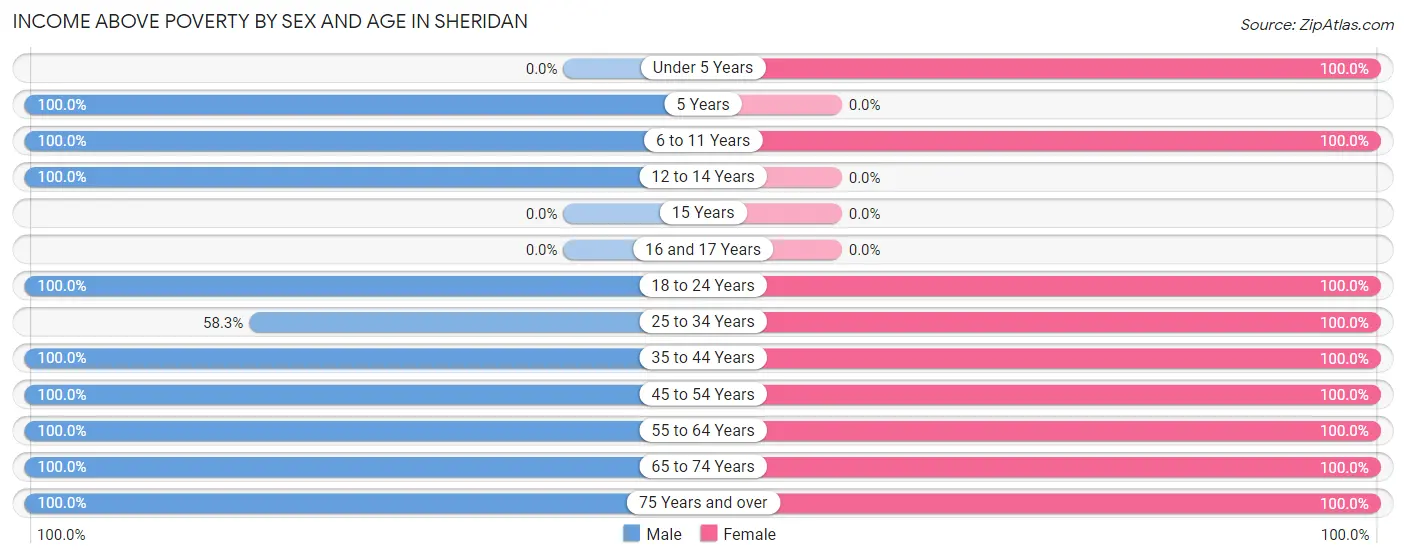
| Age Bracket | Male | Female |
| Under 5 Years | 0 (0.0%) | 77 (100.0%) |
| 5 Years | 52 (100.0%) | 0 (0.0%) |
| 6 to 11 Years | 116 (100.0%) | 64 (100.0%) |
| 12 to 14 Years | 143 (100.0%) | 0 (0.0%) |
| 15 Years | 0 (0.0%) | 0 (0.0%) |
| 16 and 17 Years | 0 (0.0%) | 0 (0.0%) |
| 18 to 24 Years | 46 (100.0%) | 131 (100.0%) |
| 25 to 34 Years | 28 (58.3%) | 105 (100.0%) |
| 35 to 44 Years | 92 (100.0%) | 94 (100.0%) |
| 45 to 54 Years | 137 (100.0%) | 84 (100.0%) |
| 55 to 64 Years | 45 (100.0%) | 74 (100.0%) |
| 65 to 74 Years | 18 (100.0%) | 33 (100.0%) |
| 75 Years and over | 13 (100.0%) | 25 (100.0%) |
| Total | 690 (97.2%) | 687 (100.0%) |
Income Below Poverty Among Married-Couple Families in Sheridan
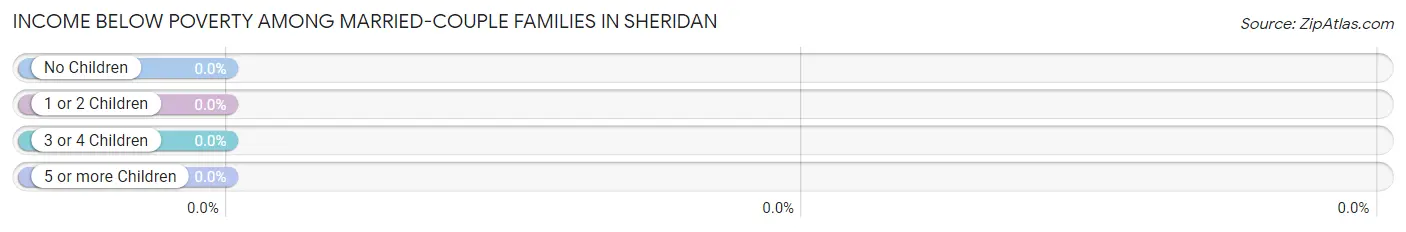
| Children | Above Poverty | Below Poverty |
| No Children | 101 (100.0%) | 0 (0.0%) |
| 1 or 2 Children | 157 (100.0%) | 0 (0.0%) |
| 3 or 4 Children | 21 (100.0%) | 0 (0.0%) |
| 5 or more Children | 0 (0.0%) | 0 (0.0%) |
| Total | 279 (100.0%) | 0 (0.0%) |
Income Below Poverty Among Single-Parent Households in Sheridan
| Children | Single Father | Single Mother |
| No Children | 0 (0.0%) | 0 (0.0%) |
| 1 or 2 Children | 0 (0.0%) | 0 (0.0%) |
| 3 or 4 Children | 0 (0.0%) | 0 (0.0%) |
| 5 or more Children | 0 (0.0%) | 0 (0.0%) |
| Total | 0 (0.0%) | 0 (0.0%) |
Income Below Poverty Among Married-Couple vs Single-Parent Households in Sheridan
| Children | Married-Couple Families | Single-Parent Households |
| No Children | 0 (0.0%) | 0 (0.0%) |
| 1 or 2 Children | 0 (0.0%) | 0 (0.0%) |
| 3 or 4 Children | 0 (0.0%) | 0 (0.0%) |
| 5 or more Children | 0 (0.0%) | 0 (0.0%) |
| Total | 0 (0.0%) | 0 (0.0%) |
Race in Sheridan
The most populous races in Sheridan are White / Caucasian (970 | 69.4%), Hispanic or Latino (499 | 35.7%), and Some other Race (361 | 25.8%).
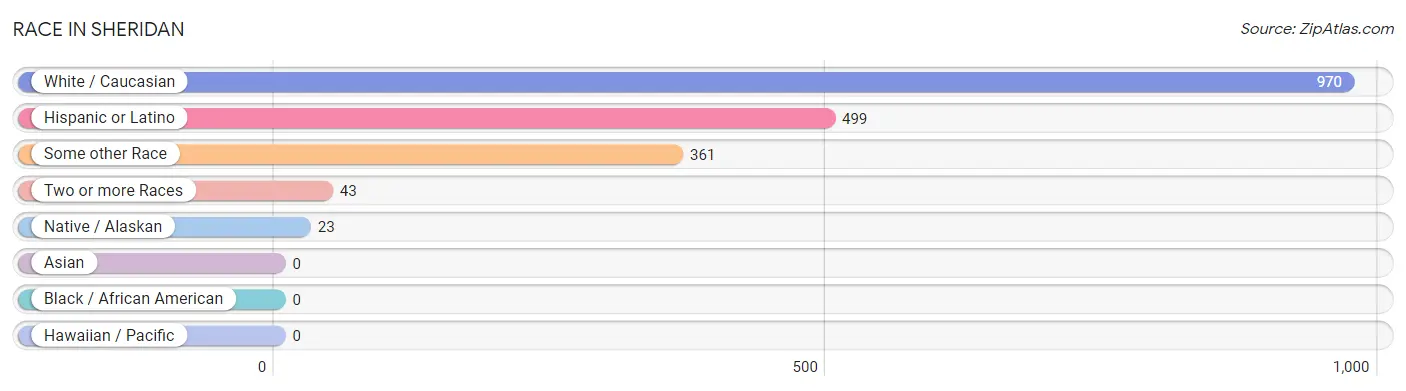
| Race | # Population | % Population |
| Asian | 0 | 0.0% |
| Black / African American | 0 | 0.0% |
| Hawaiian / Pacific | 0 | 0.0% |
| Hispanic or Latino | 499 | 35.7% |
| Native / Alaskan | 23 | 1.7% |
| White / Caucasian | 970 | 69.4% |
| Two or more Races | 43 | 3.1% |
| Some other Race | 361 | 25.8% |
| Total | 1,397 | 100.0% |
Ancestry in Sheridan
The most populous ancestries reported in Sheridan are Mexican (499 | 35.7%), English (188 | 13.5%), German (184 | 13.2%), Irish (184 | 13.2%), and Ukrainian (143 | 10.2%), together accounting for 85.8% of all Sheridan residents.
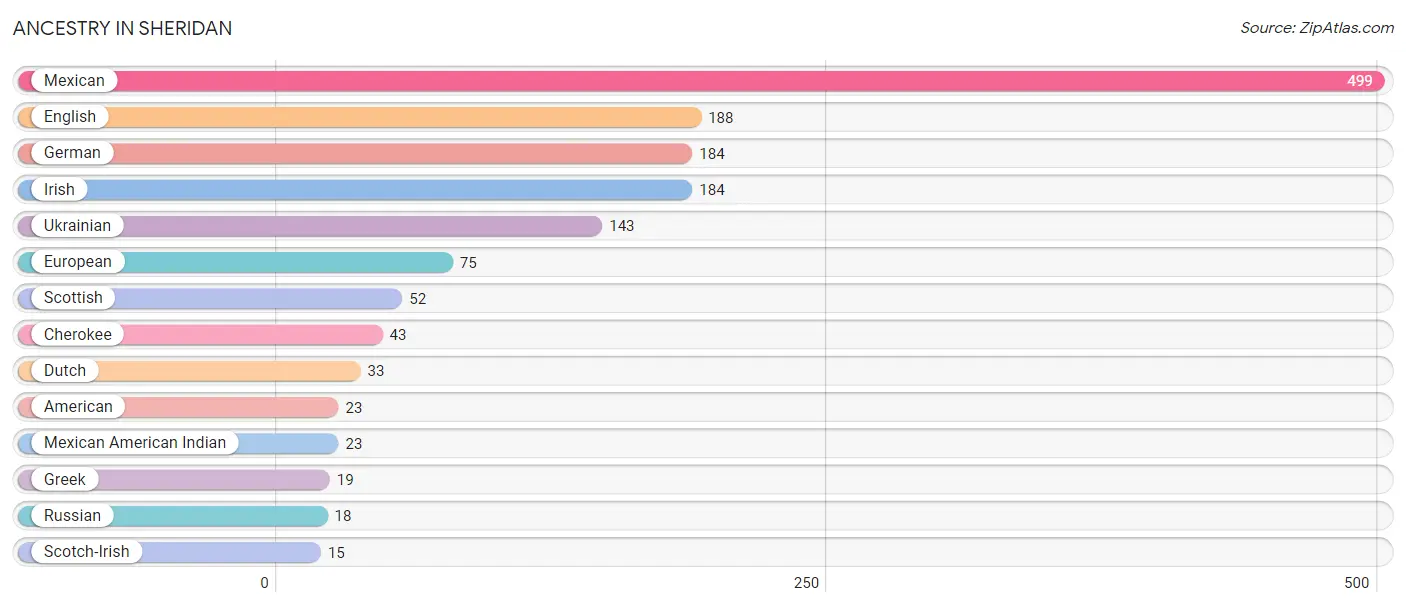
| Ancestry | # Population | % Population |
| American | 23 | 1.7% |
| Cherokee | 43 | 3.1% |
| Dutch | 33 | 2.4% |
| English | 188 | 13.5% |
| European | 75 | 5.4% |
| German | 184 | 13.2% |
| Greek | 19 | 1.4% |
| Irish | 184 | 13.2% |
| Mexican | 499 | 35.7% |
| Mexican American Indian | 23 | 1.7% |
| Russian | 18 | 1.3% |
| Scotch-Irish | 15 | 1.1% |
| Scottish | 52 | 3.7% |
| Ukrainian | 143 | 10.2% | View All 14 Rows |
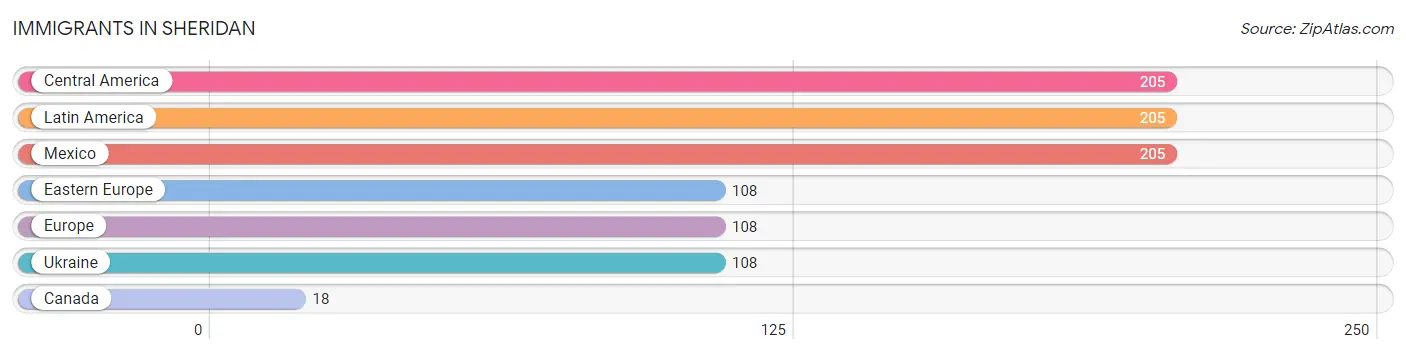
Immigrants in Sheridan
The most numerous immigrant groups reported in Sheridan came from Central America (205 | 14.7%), Latin America (205 | 14.7%), Mexico (205 | 14.7%), Eastern Europe (108 | 7.7%), and Europe (108 | 7.7%), together accounting for 59.5% of all Sheridan residents.
| Immigration Origin | # Population | % Population |
| Canada | 18 | 1.3% |
| Central America | 205 | 14.7% |
| Eastern Europe | 108 | 7.7% |
| Europe | 108 | 7.7% |
| Latin America | 205 | 14.7% |
| Mexico | 205 | 14.7% |
| Ukraine | 108 | 7.7% | View All 7 Rows |
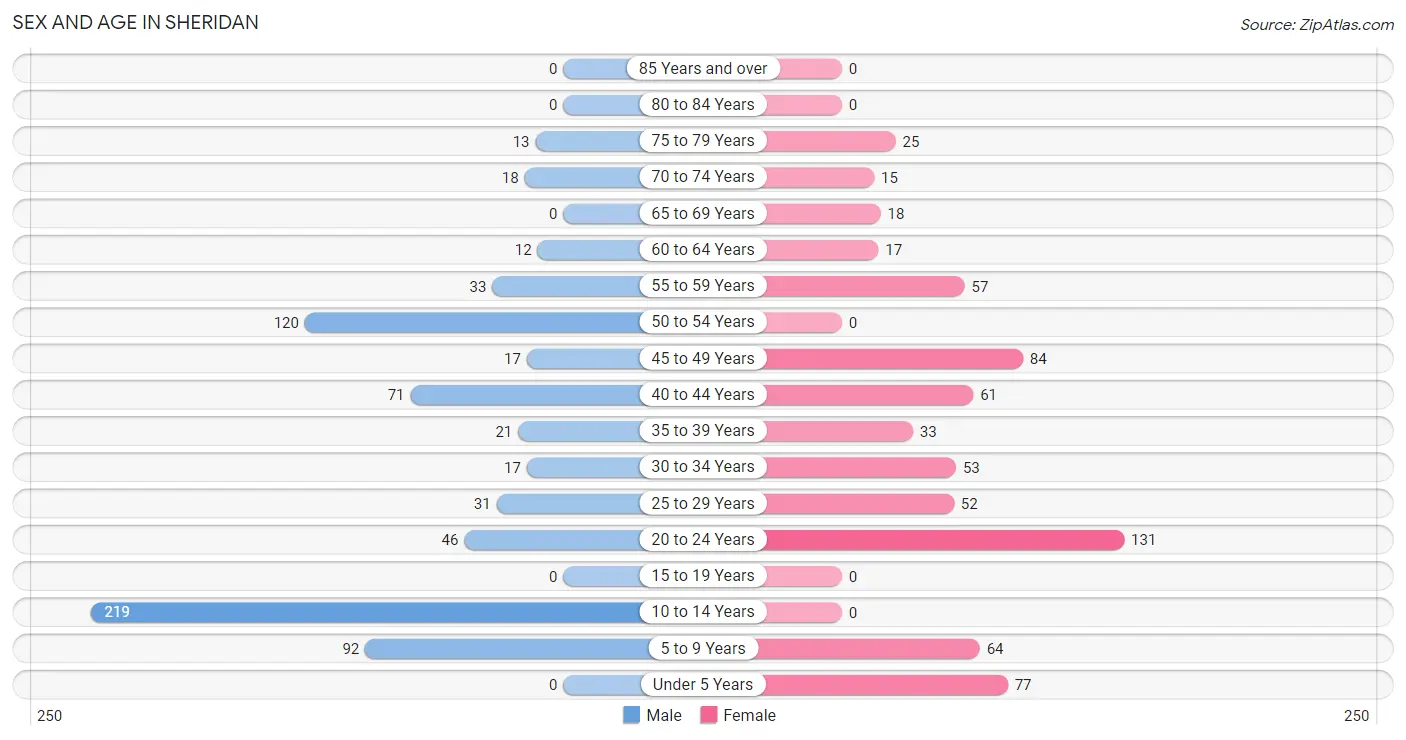
Sex and Age in Sheridan
Sex and Age in Sheridan
The most populous age groups in Sheridan are 10 to 14 Years (219 | 30.8%) for men and 20 to 24 Years (131 | 19.1%) for women.
| Age Bracket | Male | Female |
| Under 5 Years | 0 (0.0%) | 77 (11.2%) |
| 5 to 9 Years | 92 (13.0%) | 64 (9.3%) |
| 10 to 14 Years | 219 (30.8%) | 0 (0.0%) |
| 15 to 19 Years | 0 (0.0%) | 0 (0.0%) |
| 20 to 24 Years | 46 (6.5%) | 131 (19.1%) |
| 25 to 29 Years | 31 (4.4%) | 52 (7.6%) |
| 30 to 34 Years | 17 (2.4%) | 53 (7.7%) |
| 35 to 39 Years | 21 (3.0%) | 33 (4.8%) |
| 40 to 44 Years | 71 (10.0%) | 61 (8.9%) |
| 45 to 49 Years | 17 (2.4%) | 84 (12.2%) |
| 50 to 54 Years | 120 (16.9%) | 0 (0.0%) |
| 55 to 59 Years | 33 (4.6%) | 57 (8.3%) |
| 60 to 64 Years | 12 (1.7%) | 17 (2.5%) |
| 65 to 69 Years | 0 (0.0%) | 18 (2.6%) |
| 70 to 74 Years | 18 (2.5%) | 15 (2.2%) |
| 75 to 79 Years | 13 (1.8%) | 25 (3.6%) |
| 80 to 84 Years | 0 (0.0%) | 0 (0.0%) |
| 85 Years and over | 0 (0.0%) | 0 (0.0%) |
| Total | 710 (100.0%) | 687 (100.0%) |
Families and Households in Sheridan
Median Family Size in Sheridan
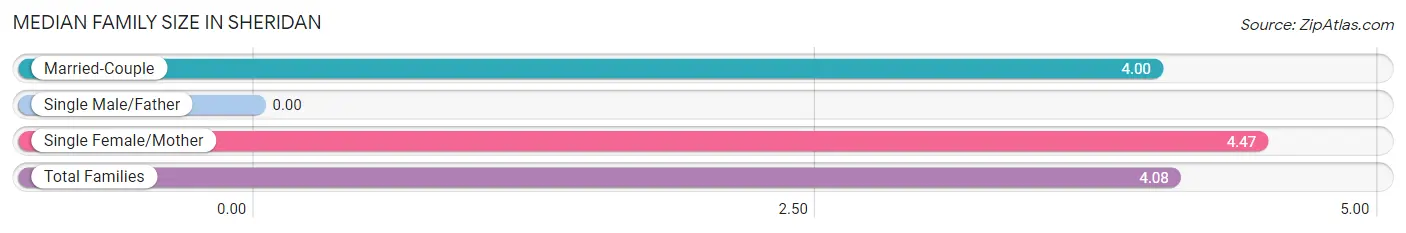
| Family Type | # Families | Family Size |
| Married-Couple | 279 (83.5%) | 4.00 |
| Single Male/Father | 0 (0.0%) | - |
| Single Female/Mother | 55 (16.5%) | 4.47 |
| Total Families | 334 (100.0%) | 4.08 |
Median Household Size in Sheridan
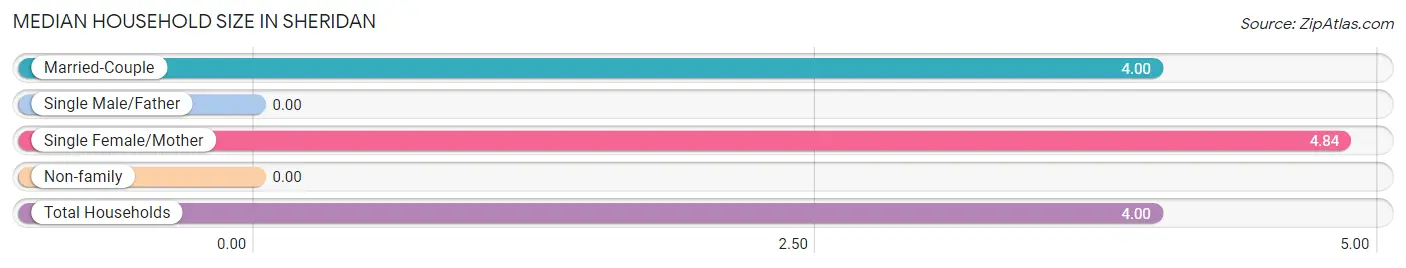
| Household Type | # Households | Household Size |
| Married-Couple | 279 (79.9%) | 4.00 |
| Single Male/Father | 0 (0.0%) | - |
| Single Female/Mother | 55 (15.8%) | 4.84 |
| Non-family | 15 (4.3%) | - |
| Total Households | 349 (100.0%) | 4.00 |
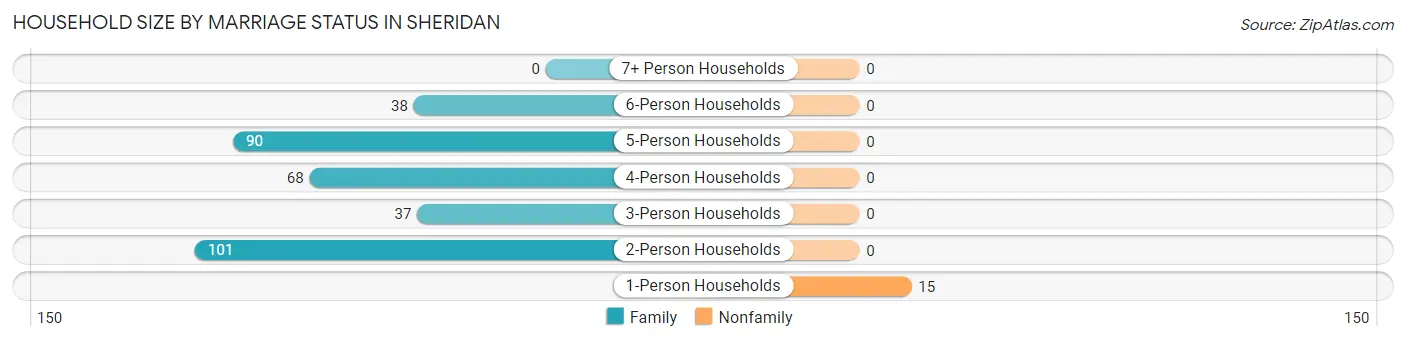
Household Size by Marriage Status in Sheridan
Out of a total of 349 households in Sheridan, 334 (95.7%) are family households, while 15 (4.3%) are nonfamily households. The most numerous type of family households are 2-person households, comprising 101, and the most common type of nonfamily households are 1-person households, comprising 15.
| Household Size | Family Households | Nonfamily Households |
| 1-Person Households | - | 15 (4.3%) |
| 2-Person Households | 101 (28.9%) | 0 (0.0%) |
| 3-Person Households | 37 (10.6%) | 0 (0.0%) |
| 4-Person Households | 68 (19.5%) | 0 (0.0%) |
| 5-Person Households | 90 (25.8%) | 0 (0.0%) |
| 6-Person Households | 38 (10.9%) | 0 (0.0%) |
| 7+ Person Households | 0 (0.0%) | 0 (0.0%) |
| Total | 334 (95.7%) | 15 (4.3%) |
Female Fertility in Sheridan
Fertility by Age in Sheridan
| Age Bracket | Women with Births | Births / 1,000 Women |
| 15 to 19 years | 0 (0.0%) | 0.0 |
| 20 to 34 years | 0 (0.0%) | 0.0 |
| 35 to 50 years | 0 (0.0%) | 0.0 |
| Total | 0 (0.0%) | 0.0 |
Fertility by Age by Marriage Status in Sheridan
| Age Bracket | Married | Unmarried |
| 15 to 19 years | 0 (0.0%) | 0 (0.0%) |
| 20 to 34 years | 0 (0.0%) | 0 (0.0%) |
| 35 to 50 years | 0 (0.0%) | 0 (0.0%) |
| Total | 0 (0.0%) | 0 (0.0%) |
Fertility by Education in Sheridan
| Educational Attainment | Women with Births | Births / 1,000 Women |
| Less than High School | 0 (0.0%) | 0.0 |
| High School Diploma | 0 (0.0%) | 0.0 |
| College or Associate's Degree | 0 (0.0%) | 0.0 |
| Bachelor's Degree | 0 (0.0%) | 0.0 |
| Graduate Degree | 0 (0.0%) | 0.0 |
| Total | 0 (0.0%) | 0.0 |
Fertility by Education by Marriage Status in Sheridan
| Educational Attainment | Married | Unmarried |
| Less than High School | 0 (0.0%) | 0 (0.0%) |
| High School Diploma | 0 (0.0%) | 0 (0.0%) |
| College or Associate's Degree | 0 (0.0%) | 0 (0.0%) |
| Bachelor's Degree | 0 (0.0%) | 0 (0.0%) |
| Graduate Degree | 0 (0.0%) | 0 (0.0%) |
| Total | 0 (0.0%) | 0 (0.0%) |
Employment Characteristics in Sheridan
Employment by Class of Employer in Sheridan
Among the 654 employed individuals in Sheridan, private company employees (539 | 82.4%), local government employees (33 | 5.1%), and state government employees (24 | 3.7%) make up the most common classes of employment.
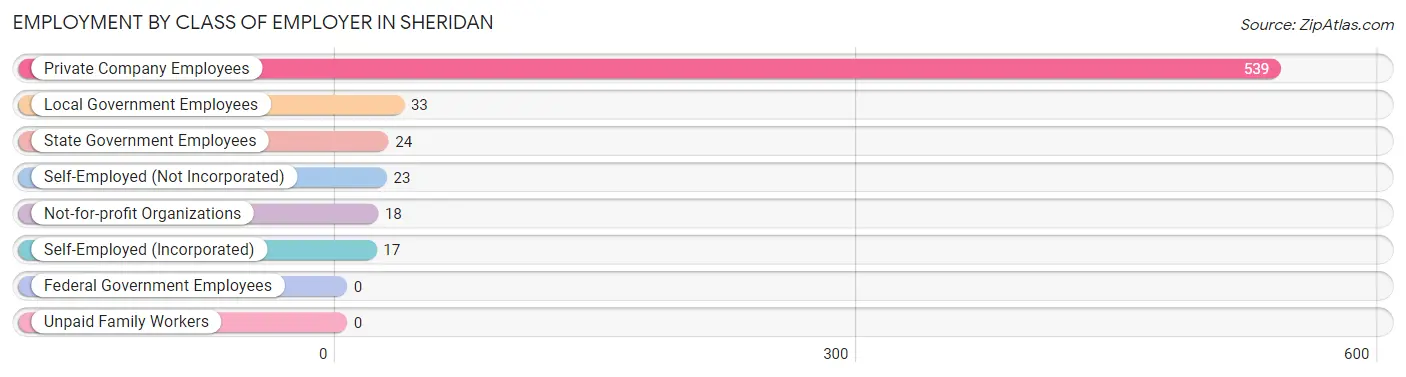
| Employer Class | # Employees | % Employees |
| Private Company Employees | 539 | 82.4% |
| Self-Employed (Incorporated) | 17 | 2.6% |
| Self-Employed (Not Incorporated) | 23 | 3.5% |
| Not-for-profit Organizations | 18 | 2.8% |
| Local Government Employees | 33 | 5.1% |
| State Government Employees | 24 | 3.7% |
| Federal Government Employees | 0 | 0.0% |
| Unpaid Family Workers | 0 | 0.0% |
| Total | 654 | 100.0% |
Employment Status by Age in Sheridan
According to the labor force statistics for Sheridan, out of the total population over 16 years of age (945), 75.9% or 717 individuals are in the labor force, with 6.4% or 46 of them unemployed. The age group with the highest labor force participation rate is 20 to 24 years, with 100.0% or 177 individuals in the labor force. Within the labor force, the 20 to 24 years age range has the highest percentage of unemployed individuals, with 26.0% or 46 of them being unemployed.
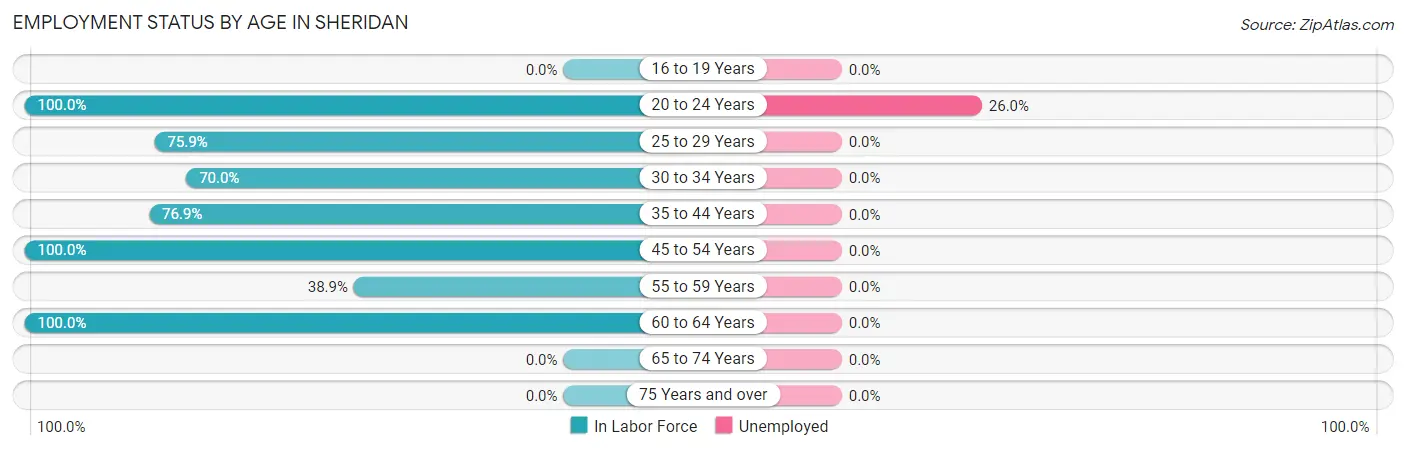
| Age Bracket | In Labor Force | Unemployed |
| 16 to 19 Years | 0 (0.0%) | 0 (0.0%) |
| 20 to 24 Years | 177 (100.0%) | 46 (26.0%) |
| 25 to 29 Years | 63 (75.9%) | 0 (0.0%) |
| 30 to 34 Years | 49 (70.0%) | 0 (0.0%) |
| 35 to 44 Years | 143 (76.9%) | 0 (0.0%) |
| 45 to 54 Years | 221 (100.0%) | 0 (0.0%) |
| 55 to 59 Years | 35 (38.9%) | 0 (0.0%) |
| 60 to 64 Years | 29 (100.0%) | 0 (0.0%) |
| 65 to 74 Years | 0 (0.0%) | 0 (0.0%) |
| 75 Years and over | 0 (0.0%) | 0 (0.0%) |
| Total | 717 (75.9%) | 46 (6.4%) |
Employment Status by Educational Attainment in Sheridan
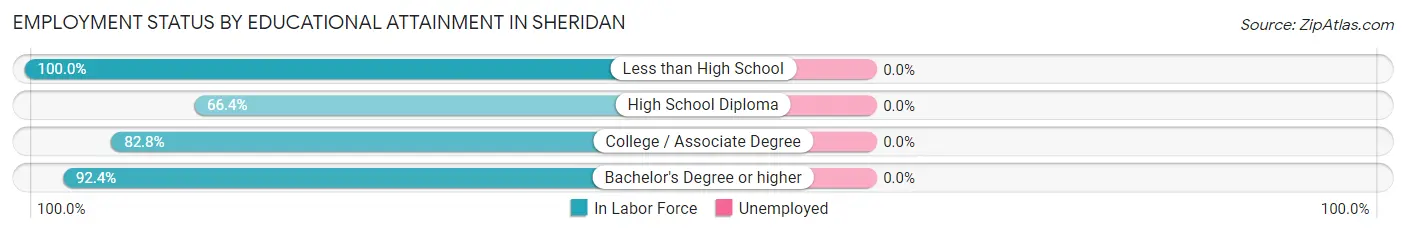
| Educational Attainment | In Labor Force | Unemployed |
| Less than High School | 52 (100.0%) | 0 (0.0%) |
| High School Diploma | 204 (66.4%) | 0 (0.0%) |
| College / Associate Degree | 101 (82.8%) | 0 (0.0%) |
| Bachelor's Degree or higher | 183 (92.4%) | 0 (0.0%) |
| Total | 540 (79.5%) | 0 (0.0%) |
Employment Occupations by Sex in Sheridan
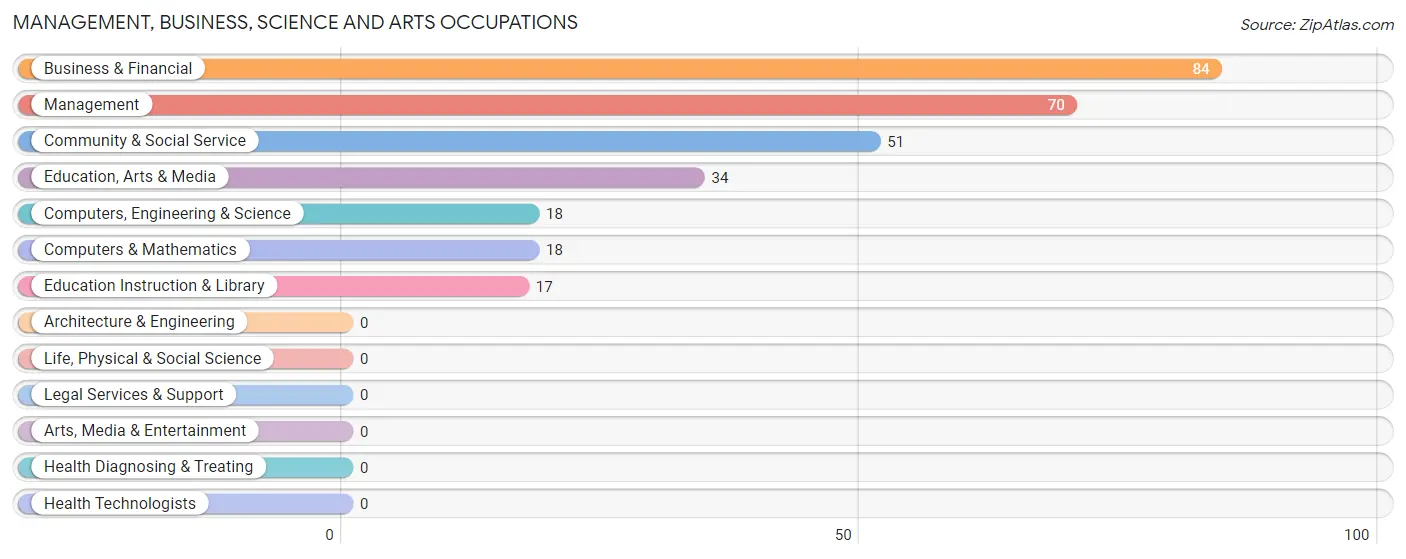
Management, Business, Science and Arts Occupations
The most common Management, Business, Science and Arts occupations in Sheridan are Business & Financial (84 | 12.5%), Management (70 | 10.4%), Community & Social Service (51 | 7.6%), Education, Arts & Media (34 | 5.1%), and Computers, Engineering & Science (18 | 2.7%).
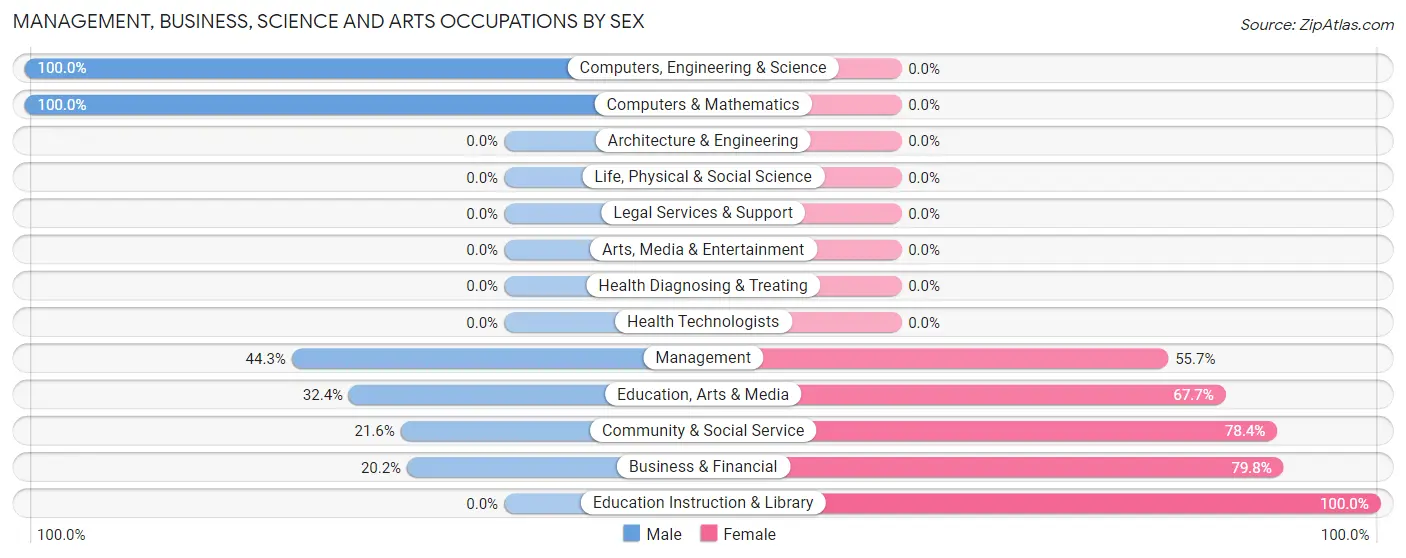
Management, Business, Science and Arts Occupations by Sex
Within the Management, Business, Science and Arts occupations in Sheridan, the most male-oriented occupations are Computers, Engineering & Science (100.0%), Computers & Mathematics (100.0%), and Management (44.3%), while the most female-oriented occupations are Education Instruction & Library (100.0%), Business & Financial (79.8%), and Community & Social Service (78.4%).
| Occupation | Male | Female |
| Management | 31 (44.3%) | 39 (55.7%) |
| Business & Financial | 17 (20.2%) | 67 (79.8%) |
| Computers, Engineering & Science | 18 (100.0%) | 0 (0.0%) |
| Computers & Mathematics | 18 (100.0%) | 0 (0.0%) |
| Architecture & Engineering | 0 (0.0%) | 0 (0.0%) |
| Life, Physical & Social Science | 0 (0.0%) | 0 (0.0%) |
| Community & Social Service | 11 (21.6%) | 40 (78.4%) |
| Education, Arts & Media | 11 (32.4%) | 23 (67.6%) |
| Legal Services & Support | 0 (0.0%) | 0 (0.0%) |
| Education Instruction & Library | 0 (0.0%) | 17 (100.0%) |
| Arts, Media & Entertainment | 0 (0.0%) | 0 (0.0%) |
| Health Diagnosing & Treating | 0 (0.0%) | 0 (0.0%) |
| Health Technologists | 0 (0.0%) | 0 (0.0%) |
| Total (Category) | 77 (34.5%) | 146 (65.5%) |
| Total (Overall) | 287 (42.8%) | 384 (57.2%) |
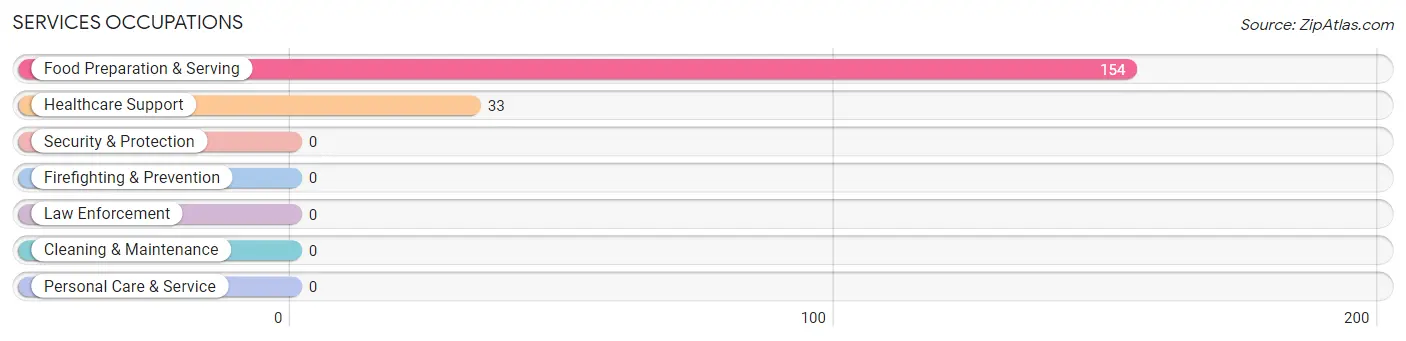
Services Occupations
The most common Services occupations in Sheridan are Food Preparation & Serving (154 | 23.0%), and Healthcare Support (33 | 4.9%).
Services Occupations by Sex
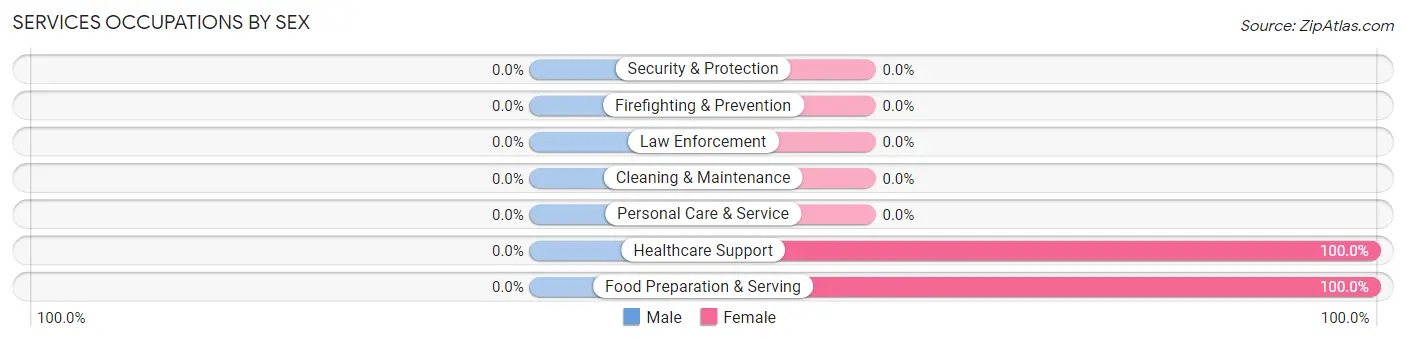
| Occupation | Male | Female |
| Healthcare Support | 0 (0.0%) | 33 (100.0%) |
| Security & Protection | 0 (0.0%) | 0 (0.0%) |
| Firefighting & Prevention | 0 (0.0%) | 0 (0.0%) |
| Law Enforcement | 0 (0.0%) | 0 (0.0%) |
| Food Preparation & Serving | 0 (0.0%) | 154 (100.0%) |
| Cleaning & Maintenance | 0 (0.0%) | 0 (0.0%) |
| Personal Care & Service | 0 (0.0%) | 0 (0.0%) |
| Total (Category) | 0 (0.0%) | 187 (100.0%) |
| Total (Overall) | 287 (42.8%) | 384 (57.2%) |
Sales and Office Occupations
The most common Sales and Office occupations in Sheridan are Sales & Related (55 | 8.2%), and Office & Administration (17 | 2.5%).
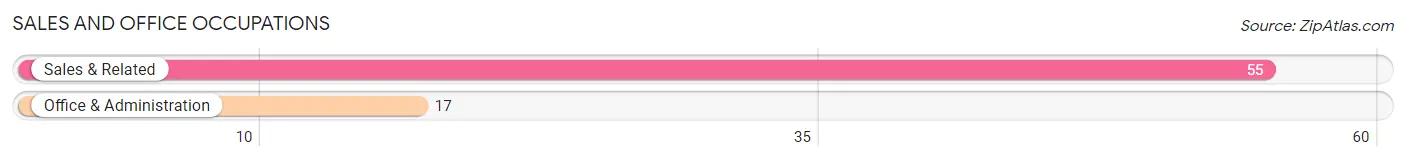
Sales and Office Occupations by Sex
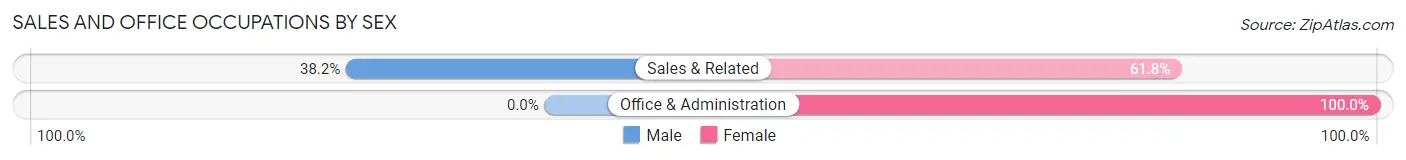
| Occupation | Male | Female |
| Sales & Related | 21 (38.2%) | 34 (61.8%) |
| Office & Administration | 0 (0.0%) | 17 (100.0%) |
| Total (Category) | 21 (29.2%) | 51 (70.8%) |
| Total (Overall) | 287 (42.8%) | 384 (57.2%) |
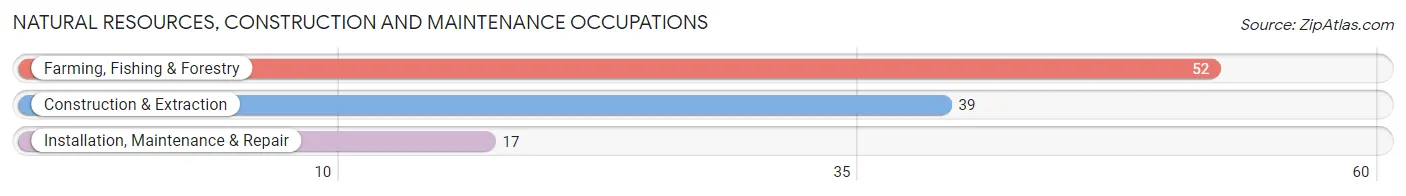
Natural Resources, Construction and Maintenance Occupations
The most common Natural Resources, Construction and Maintenance occupations in Sheridan are Farming, Fishing & Forestry (52 | 7.7%), Construction & Extraction (39 | 5.8%), and Installation, Maintenance & Repair (17 | 2.5%).
Natural Resources, Construction and Maintenance Occupations by Sex
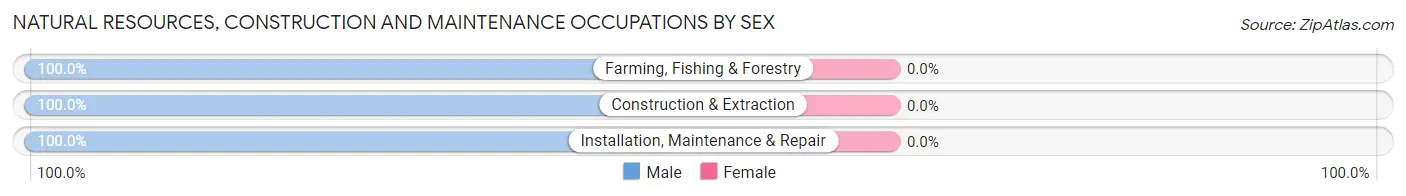
| Occupation | Male | Female |
| Farming, Fishing & Forestry | 52 (100.0%) | 0 (0.0%) |
| Construction & Extraction | 39 (100.0%) | 0 (0.0%) |
| Installation, Maintenance & Repair | 17 (100.0%) | 0 (0.0%) |
| Total (Category) | 108 (100.0%) | 0 (0.0%) |
| Total (Overall) | 287 (42.8%) | 384 (57.2%) |
Production, Transportation and Moving Occupations
The most common Production, Transportation and Moving occupations in Sheridan are , and Production (81 | 12.1%).
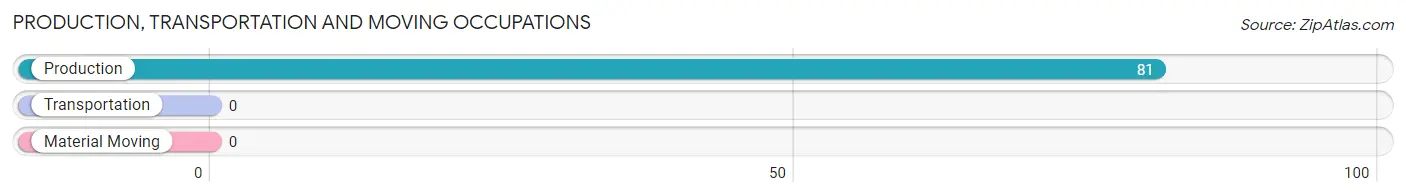
Production, Transportation and Moving Occupations by Sex
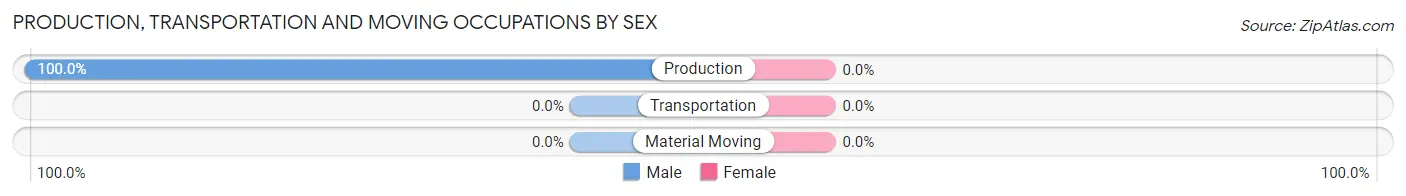
| Occupation | Male | Female |
| Production | 81 (100.0%) | 0 (0.0%) |
| Transportation | 0 (0.0%) | 0 (0.0%) |
| Material Moving | 0 (0.0%) | 0 (0.0%) |
| Total (Category) | 81 (100.0%) | 0 (0.0%) |
| Total (Overall) | 287 (42.8%) | 384 (57.2%) |
Employment Industries by Sex in Sheridan
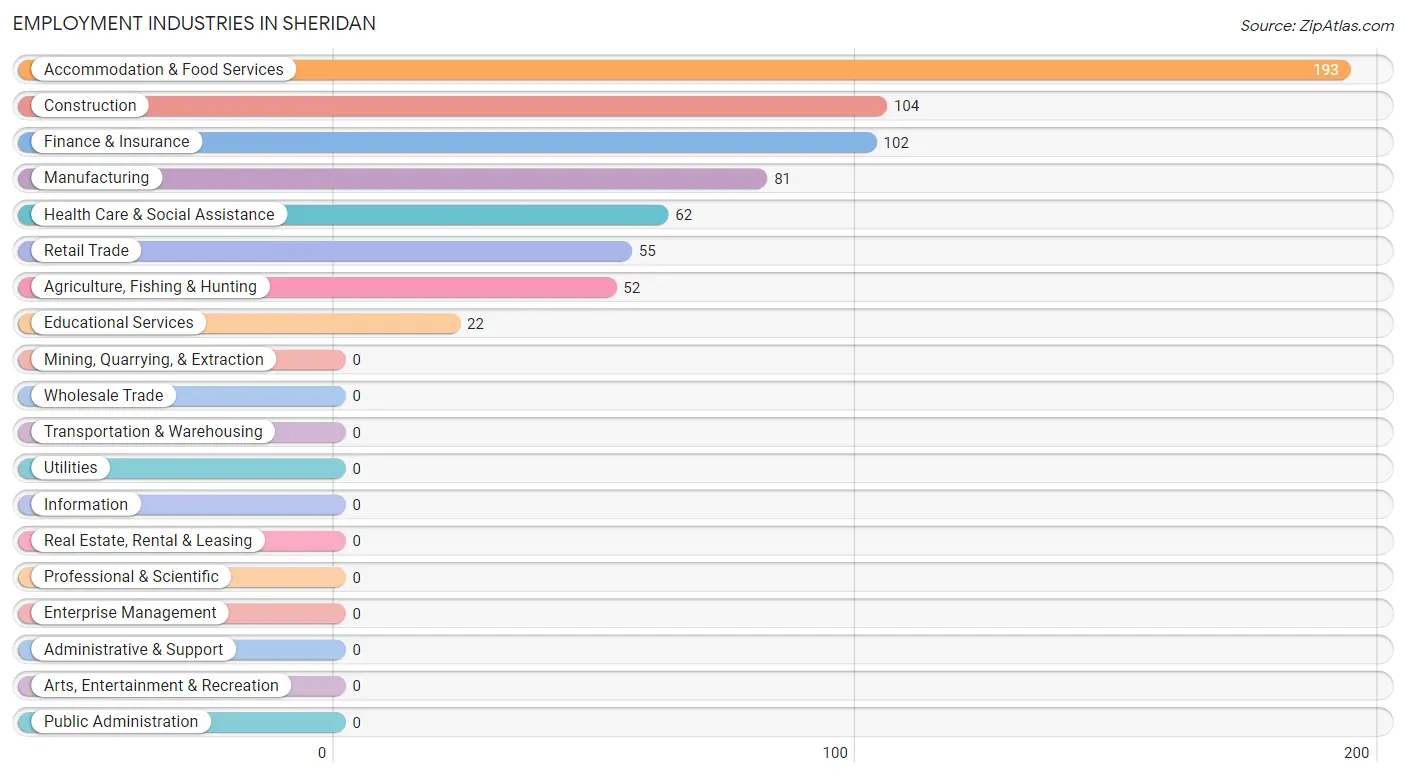
Employment Industries in Sheridan
The major employment industries in Sheridan include Accommodation & Food Services (193 | 28.8%), Construction (104 | 15.5%), Finance & Insurance (102 | 15.2%), Manufacturing (81 | 12.1%), and Health Care & Social Assistance (62 | 9.2%).
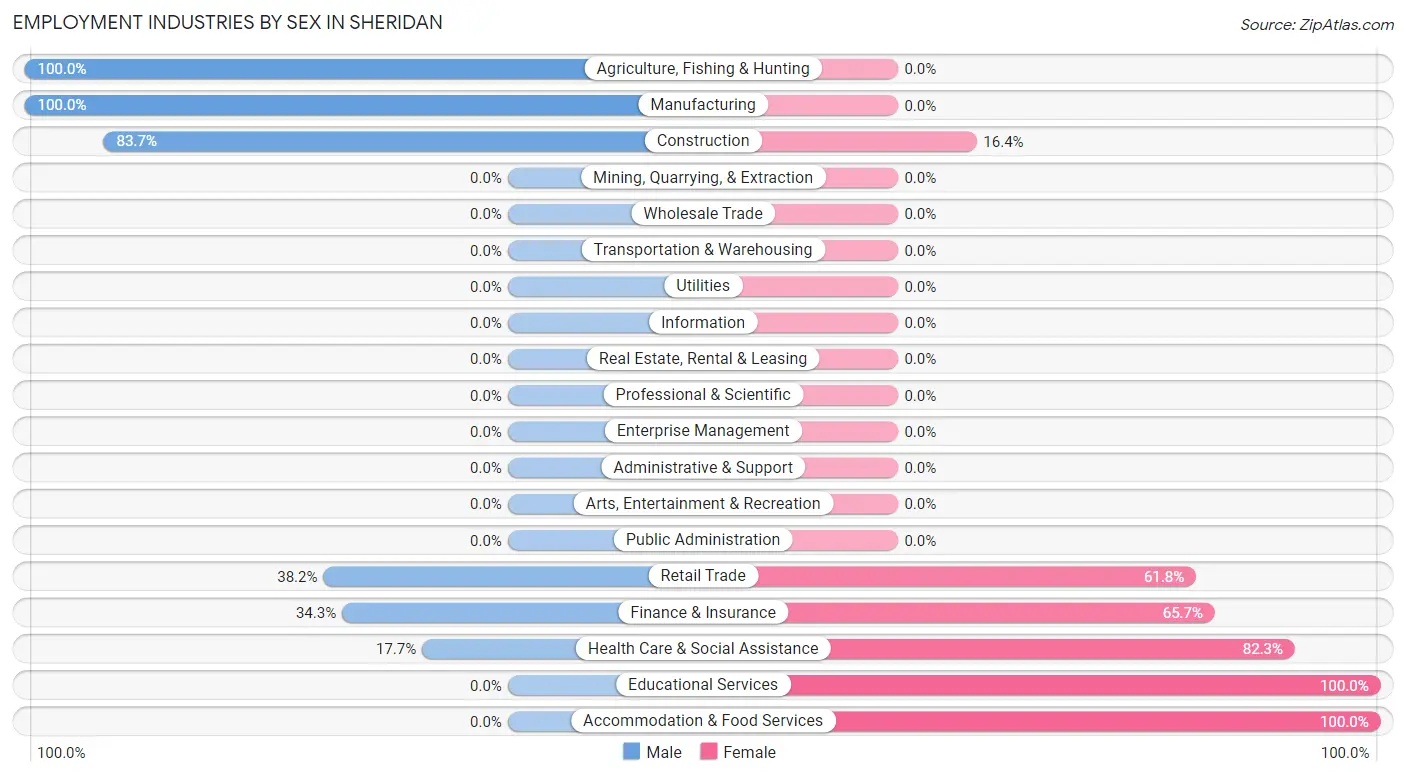
Employment Industries by Sex in Sheridan
The Sheridan industries that see more men than women are Agriculture, Fishing & Hunting (100.0%), Manufacturing (100.0%), and Construction (83.7%), whereas the industries that tend to have a higher number of women are Educational Services (100.0%), Accommodation & Food Services (100.0%), and Health Care & Social Assistance (82.3%).
| Industry | Male | Female |
| Agriculture, Fishing & Hunting | 52 (100.0%) | 0 (0.0%) |
| Mining, Quarrying, & Extraction | 0 (0.0%) | 0 (0.0%) |
| Construction | 87 (83.7%) | 17 (16.4%) |
| Manufacturing | 81 (100.0%) | 0 (0.0%) |
| Wholesale Trade | 0 (0.0%) | 0 (0.0%) |
| Retail Trade | 21 (38.2%) | 34 (61.8%) |
| Transportation & Warehousing | 0 (0.0%) | 0 (0.0%) |
| Utilities | 0 (0.0%) | 0 (0.0%) |
| Information | 0 (0.0%) | 0 (0.0%) |
| Finance & Insurance | 35 (34.3%) | 67 (65.7%) |
| Real Estate, Rental & Leasing | 0 (0.0%) | 0 (0.0%) |
| Professional & Scientific | 0 (0.0%) | 0 (0.0%) |
| Enterprise Management | 0 (0.0%) | 0 (0.0%) |
| Administrative & Support | 0 (0.0%) | 0 (0.0%) |
| Educational Services | 0 (0.0%) | 22 (100.0%) |
| Health Care & Social Assistance | 11 (17.7%) | 51 (82.3%) |
| Arts, Entertainment & Recreation | 0 (0.0%) | 0 (0.0%) |
| Accommodation & Food Services | 0 (0.0%) | 193 (100.0%) |
| Public Administration | 0 (0.0%) | 0 (0.0%) |
| Total | 287 (42.8%) | 384 (57.2%) |
Education in Sheridan
School Enrollment in Sheridan
The most common levels of schooling among the 560 students in Sheridan are college / undergraduate (173 | 30.9%), middle school (159 | 28.4%), and elementary school (104 | 18.6%).
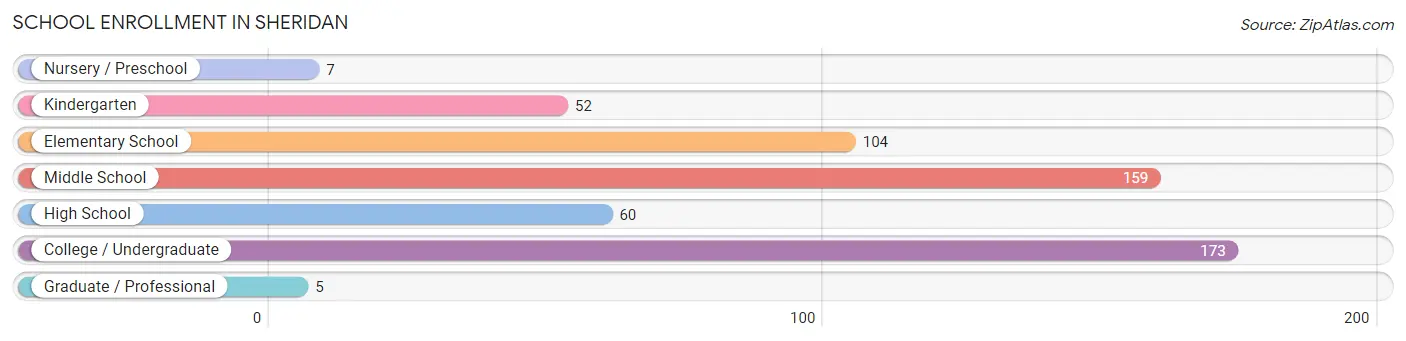
| School Level | # Students | % Students |
| Nursery / Preschool | 7 | 1.3% |
| Kindergarten | 52 | 9.3% |
| Elementary School | 104 | 18.6% |
| Middle School | 159 | 28.4% |
| High School | 60 | 10.7% |
| College / Undergraduate | 173 | 30.9% |
| Graduate / Professional | 5 | 0.9% |
| Total | 560 | 100.0% |
School Enrollment by Age by Funding Source in Sheridan
Out of a total of 560 students who are enrolled in schools in Sheridan, 43 (7.7%) attend a private institution, while the remaining 517 (92.3%) are enrolled in public schools. The age group of 5 to 9 year old has the highest likelihood of being enrolled in private schools, with 38 (24.4% in the age bracket) enrolled. Conversely, the age group of 3 to 4 year olds has the lowest likelihood of being enrolled in a private school, with 7 (100.0% in the age bracket) attending a public institution.
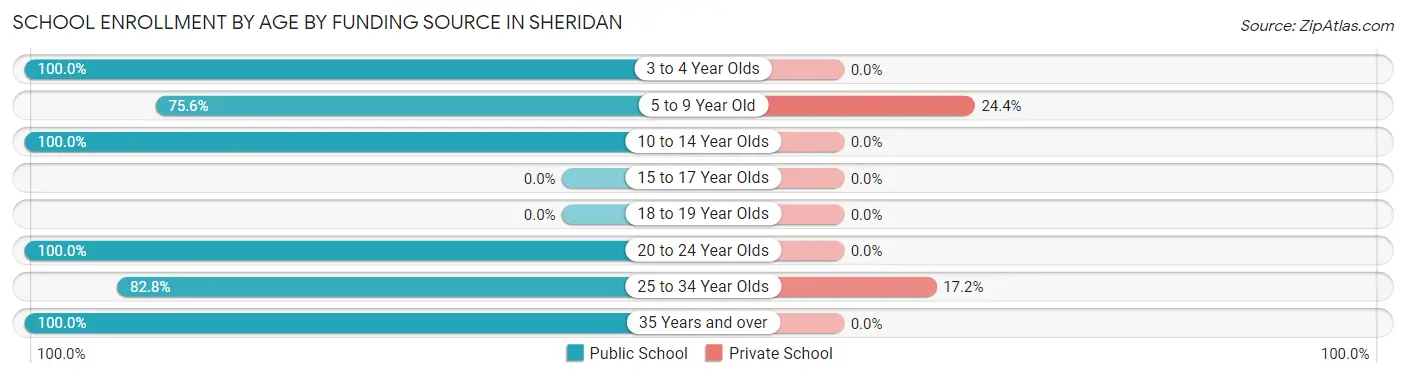
| Age Bracket | Public School | Private School |
| 3 to 4 Year Olds | 7 (100.0%) | 0 (0.0%) |
| 5 to 9 Year Old | 118 (75.6%) | 38 (24.4%) |
| 10 to 14 Year Olds | 219 (100.0%) | 0 (0.0%) |
| 15 to 17 Year Olds | 0 (0.0%) | 0 (0.0%) |
| 18 to 19 Year Olds | 0 (0.0%) | 0 (0.0%) |
| 20 to 24 Year Olds | 131 (100.0%) | 0 (0.0%) |
| 25 to 34 Year Olds | 24 (82.8%) | 5 (17.2%) |
| 35 Years and over | 18 (100.0%) | 0 (0.0%) |
| Total | 517 (92.3%) | 43 (7.7%) |
Educational Attainment by Field of Study in Sheridan
Business (68 | 31.9%), psychology (32 | 15.0%), science & technology (24 | 11.3%), engineering (19 | 8.9%), and multidisciplinary studies (18 | 8.5%) are the most common fields of study among 213 individuals in Sheridan who have obtained a bachelor's degree or higher.
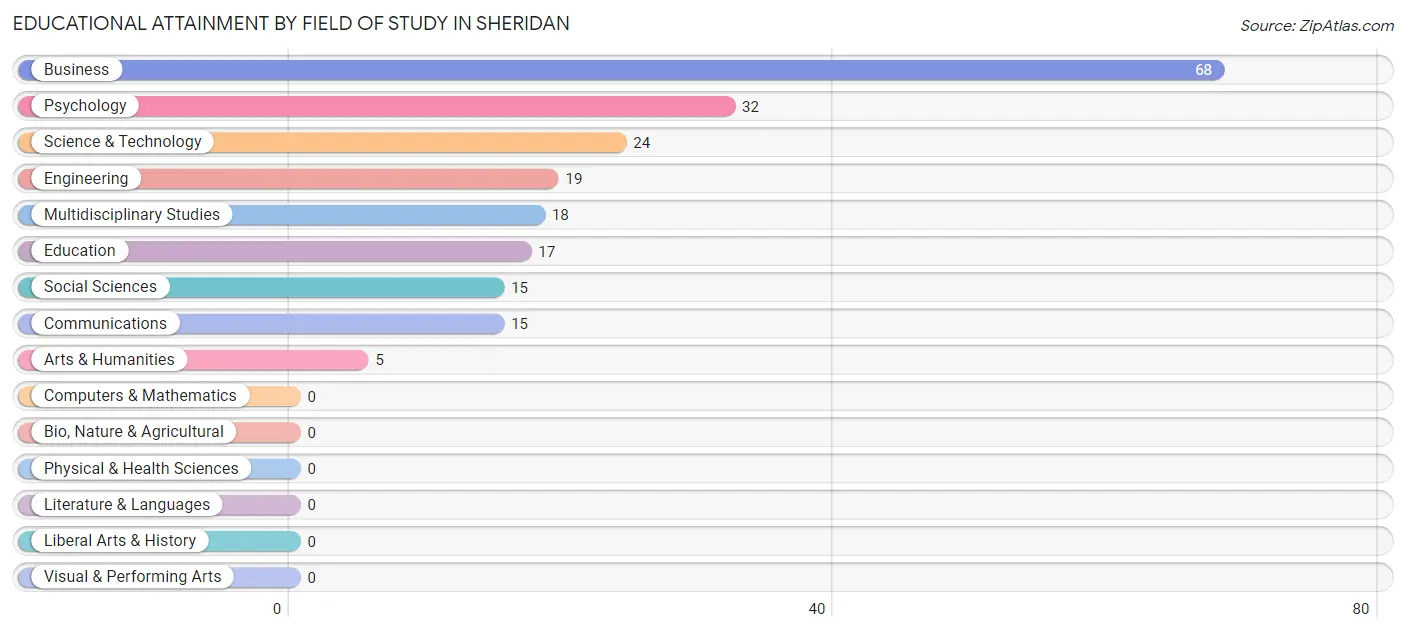
| Field of Study | # Graduates | % Graduates |
| Computers & Mathematics | 0 | 0.0% |
| Bio, Nature & Agricultural | 0 | 0.0% |
| Physical & Health Sciences | 0 | 0.0% |
| Psychology | 32 | 15.0% |
| Social Sciences | 15 | 7.0% |
| Engineering | 19 | 8.9% |
| Multidisciplinary Studies | 18 | 8.5% |
| Science & Technology | 24 | 11.3% |
| Business | 68 | 31.9% |
| Education | 17 | 8.0% |
| Literature & Languages | 0 | 0.0% |
| Liberal Arts & History | 0 | 0.0% |
| Visual & Performing Arts | 0 | 0.0% |
| Communications | 15 | 7.0% |
| Arts & Humanities | 5 | 2.4% |
| Total | 213 | 100.0% |
Transportation & Commute in Sheridan
Vehicle Availability by Sex in Sheridan
The most prevalent vehicle ownership categories in Sheridan are males with 2 vehicles (133, accounting for 46.3%) and females with 2 vehicles (56, making up 36.2%).
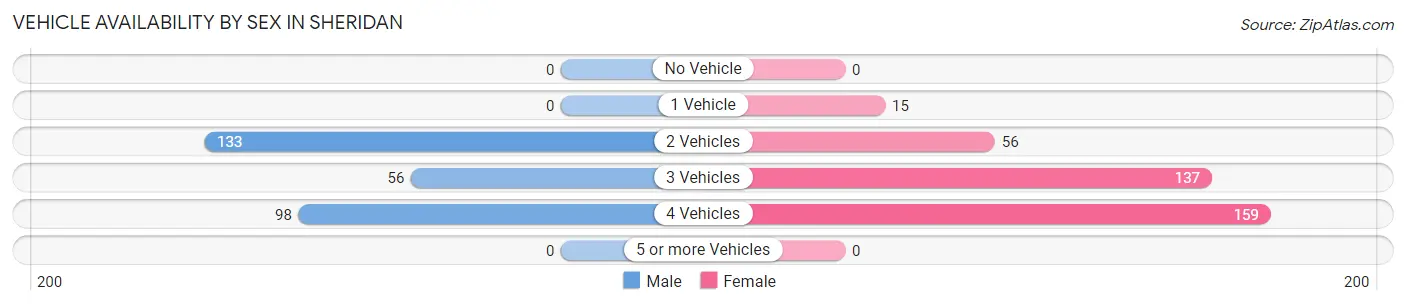
| Vehicles Available | Male | Female |
| No Vehicle | 0 (0.0%) | 0 (0.0%) |
| 1 Vehicle | 0 (0.0%) | 15 (4.1%) |
| 2 Vehicles | 133 (46.3%) | 56 (15.3%) |
| 3 Vehicles | 56 (19.5%) | 137 (37.3%) |
| 4 Vehicles | 98 (34.2%) | 159 (43.3%) |
| 5 or more Vehicles | 0 (0.0%) | 0 (0.0%) |
| Total | 287 (100.0%) | 367 (100.0%) |
Commute Time in Sheridan
The most frequently occuring commute durations in Sheridan are 10 to 14 minutes (173 commuters, 29.0%), 30 to 34 minutes (133 commuters, 22.3%), and 25 to 29 minutes (114 commuters, 19.1%).
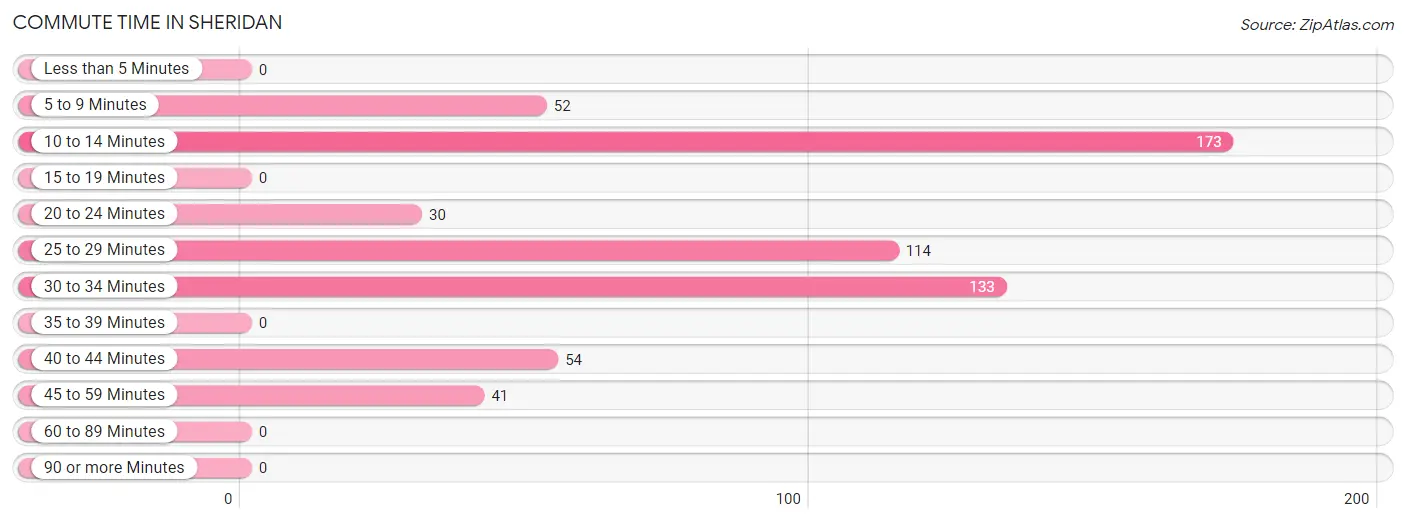
| Commute Time | # Commuters | % Commuters |
| Less than 5 Minutes | 0 | 0.0% |
| 5 to 9 Minutes | 52 | 8.7% |
| 10 to 14 Minutes | 173 | 29.0% |
| 15 to 19 Minutes | 0 | 0.0% |
| 20 to 24 Minutes | 30 | 5.0% |
| 25 to 29 Minutes | 114 | 19.1% |
| 30 to 34 Minutes | 133 | 22.3% |
| 35 to 39 Minutes | 0 | 0.0% |
| 40 to 44 Minutes | 54 | 9.0% |
| 45 to 59 Minutes | 41 | 6.9% |
| 60 to 89 Minutes | 0 | 0.0% |
| 90 or more Minutes | 0 | 0.0% |
Commute Time by Sex in Sheridan
The most common commute times in Sheridan are 10 to 14 minutes (81 commuters, 32.8%) for males and 30 to 34 minutes (105 commuters, 30.0%) for females.
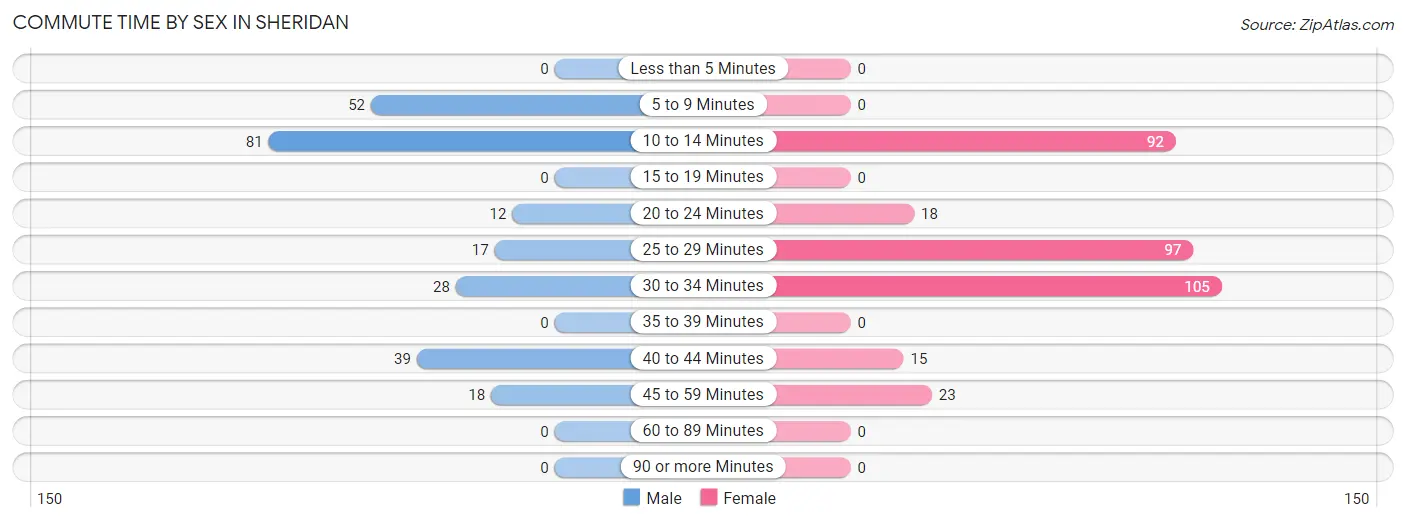
| Commute Time | Male | Female |
| Less than 5 Minutes | 0 (0.0%) | 0 (0.0%) |
| 5 to 9 Minutes | 52 (21.0%) | 0 (0.0%) |
| 10 to 14 Minutes | 81 (32.8%) | 92 (26.3%) |
| 15 to 19 Minutes | 0 (0.0%) | 0 (0.0%) |
| 20 to 24 Minutes | 12 (4.9%) | 18 (5.1%) |
| 25 to 29 Minutes | 17 (6.9%) | 97 (27.7%) |
| 30 to 34 Minutes | 28 (11.3%) | 105 (30.0%) |
| 35 to 39 Minutes | 0 (0.0%) | 0 (0.0%) |
| 40 to 44 Minutes | 39 (15.8%) | 15 (4.3%) |
| 45 to 59 Minutes | 18 (7.3%) | 23 (6.6%) |
| 60 to 89 Minutes | 0 (0.0%) | 0 (0.0%) |
| 90 or more Minutes | 0 (0.0%) | 0 (0.0%) |
Time of Departure to Work by Sex in Sheridan
The most frequent times of departure to work in Sheridan are 5:00 AM to 5:29 AM (108, 43.7%) for males and 10:00 AM to 10:59 AM (148, 42.3%) for females.
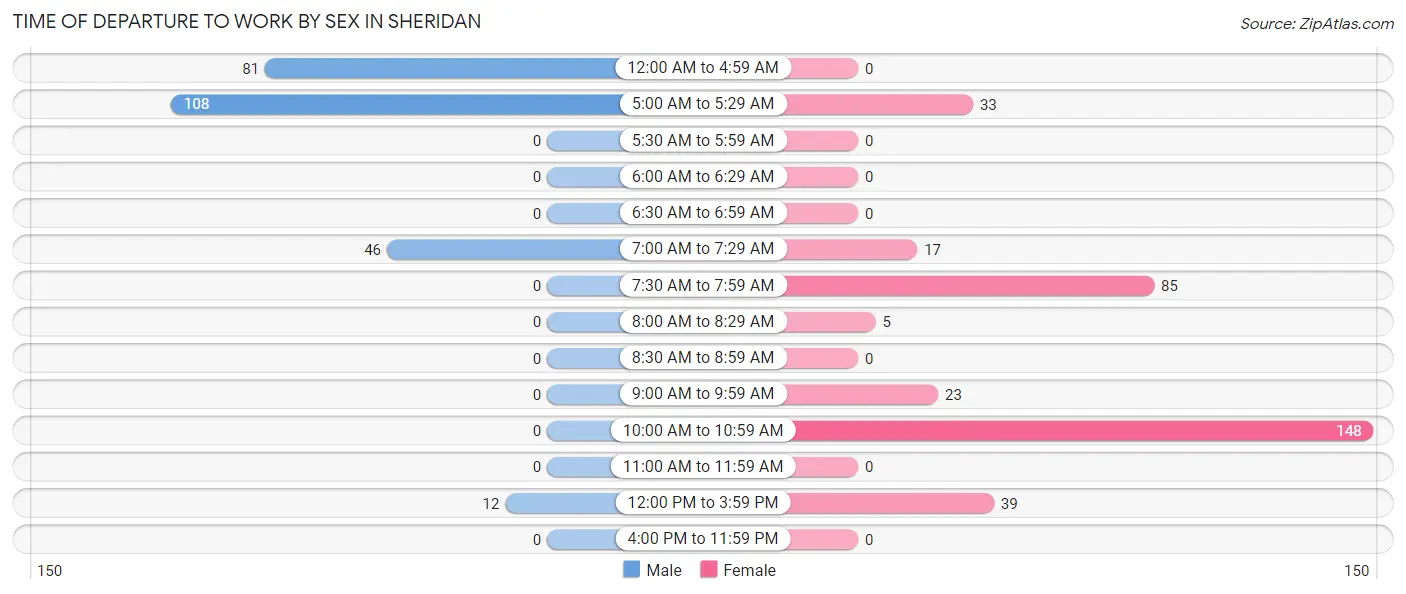
| Time of Departure | Male | Female |
| 12:00 AM to 4:59 AM | 81 (32.8%) | 0 (0.0%) |
| 5:00 AM to 5:29 AM | 108 (43.7%) | 33 (9.4%) |
| 5:30 AM to 5:59 AM | 0 (0.0%) | 0 (0.0%) |
| 6:00 AM to 6:29 AM | 0 (0.0%) | 0 (0.0%) |
| 6:30 AM to 6:59 AM | 0 (0.0%) | 0 (0.0%) |
| 7:00 AM to 7:29 AM | 46 (18.6%) | 17 (4.9%) |
| 7:30 AM to 7:59 AM | 0 (0.0%) | 85 (24.3%) |
| 8:00 AM to 8:29 AM | 0 (0.0%) | 5 (1.4%) |
| 8:30 AM to 8:59 AM | 0 (0.0%) | 0 (0.0%) |
| 9:00 AM to 9:59 AM | 0 (0.0%) | 23 (6.6%) |
| 10:00 AM to 10:59 AM | 0 (0.0%) | 148 (42.3%) |
| 11:00 AM to 11:59 AM | 0 (0.0%) | 0 (0.0%) |
| 12:00 PM to 3:59 PM | 12 (4.9%) | 39 (11.1%) |
| 4:00 PM to 11:59 PM | 0 (0.0%) | 0 (0.0%) |
| Total | 247 (100.0%) | 350 (100.0%) |
Housing Occupancy in Sheridan
Occupancy by Ownership in Sheridan
Of the total 349 dwellings in Sheridan, owner-occupied units account for 228 (65.3%), while renter-occupied units make up 121 (34.7%).
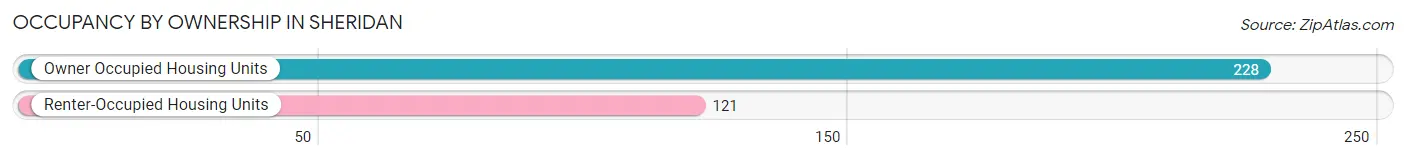
| Occupancy | # Housing Units | % Housing Units |
| Owner Occupied Housing Units | 228 | 65.3% |
| Renter-Occupied Housing Units | 121 | 34.7% |
| Total Occupied Housing Units | 349 | 100.0% |
Occupancy by Household Size in Sheridan
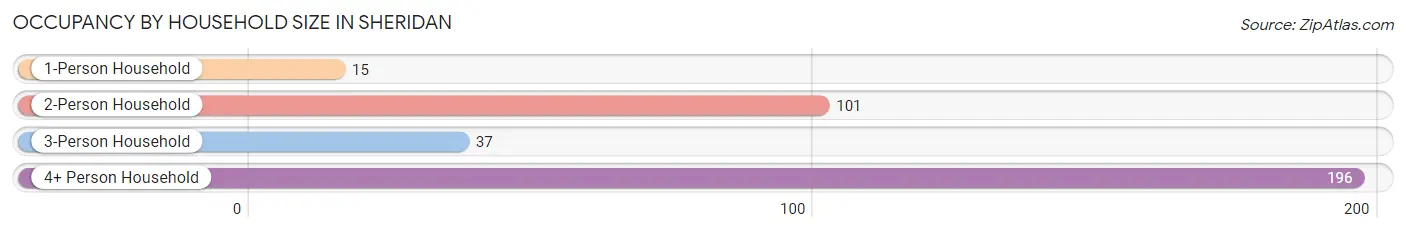
| Household Size | # Housing Units | % Housing Units |
| 1-Person Household | 15 | 4.3% |
| 2-Person Household | 101 | 28.9% |
| 3-Person Household | 37 | 10.6% |
| 4+ Person Household | 196 | 56.2% |
| Total Housing Units | 349 | 100.0% |
Occupancy by Ownership by Household Size in Sheridan
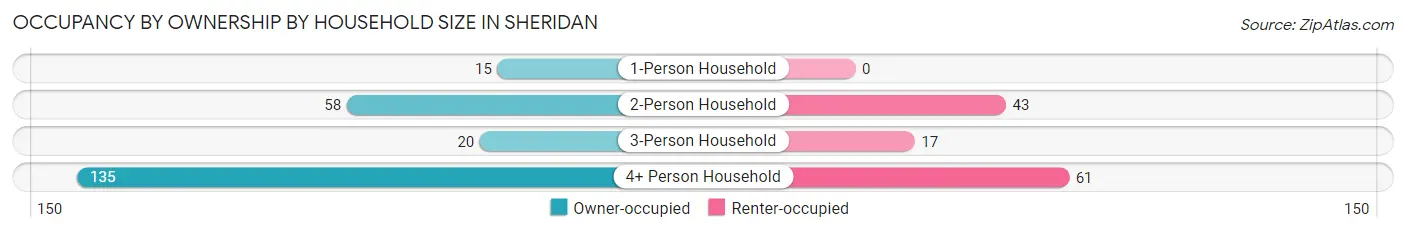
| Household Size | Owner-occupied | Renter-occupied |
| 1-Person Household | 15 (100.0%) | 0 (0.0%) |
| 2-Person Household | 58 (57.4%) | 43 (42.6%) |
| 3-Person Household | 20 (54.0%) | 17 (46.0%) |
| 4+ Person Household | 135 (68.9%) | 61 (31.1%) |
| Total Housing Units | 228 (65.3%) | 121 (34.7%) |
Occupancy by Educational Attainment in Sheridan
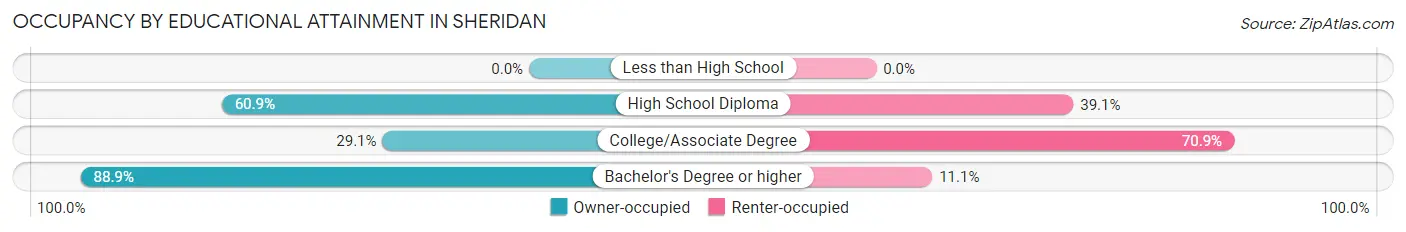
| Household Size | Owner-occupied | Renter-occupied |
| Less than High School | 0 (0.0%) | 0 (0.0%) |
| High School Diploma | 67 (60.9%) | 43 (39.1%) |
| College/Associate Degree | 25 (29.1%) | 61 (70.9%) |
| Bachelor's Degree or higher | 136 (88.9%) | 17 (11.1%) |
Occupancy by Age of Householder in Sheridan
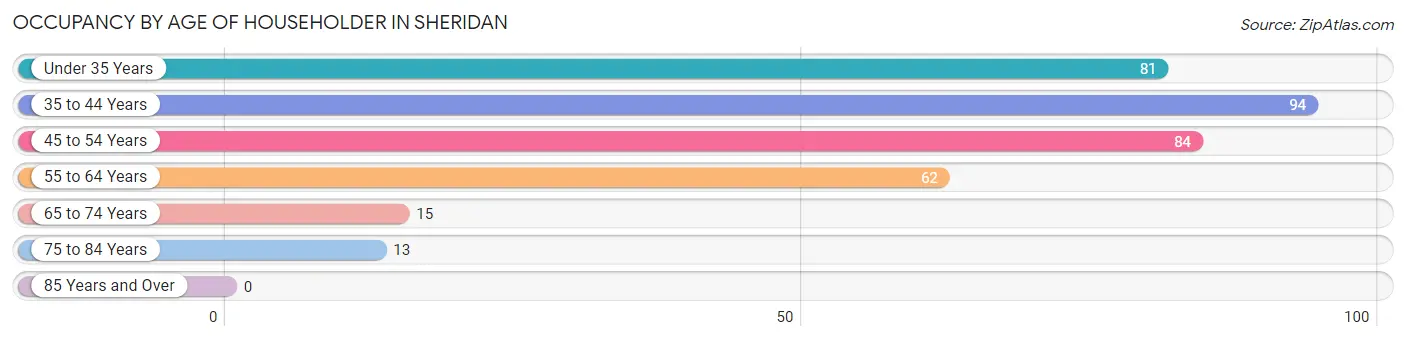
| Age Bracket | # Households | % Households |
| Under 35 Years | 81 | 23.2% |
| 35 to 44 Years | 94 | 26.9% |
| 45 to 54 Years | 84 | 24.1% |
| 55 to 64 Years | 62 | 17.8% |
| 65 to 74 Years | 15 | 4.3% |
| 75 to 84 Years | 13 | 3.7% |
| 85 Years and Over | 0 | 0.0% |
| Total | 349 | 100.0% |
Housing Finances in Sheridan
Median Income by Occupancy in Sheridan
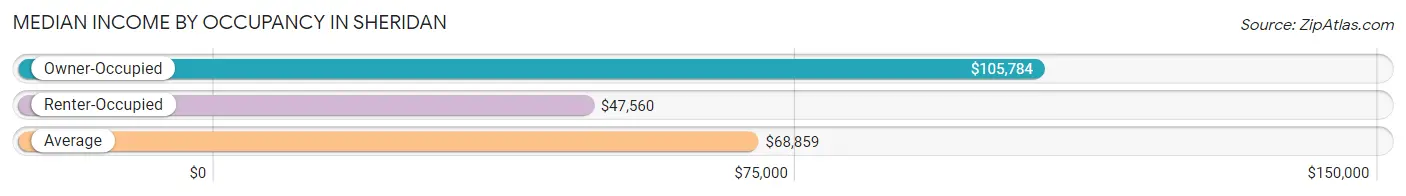
| Occupancy Type | # Households | Median Income |
| Owner-Occupied | 228 (65.3%) | $105,784 |
| Renter-Occupied | 121 (34.7%) | $47,560 |
| Average | 349 (100.0%) | $68,859 |
Occupancy by Householder Income Bracket in Sheridan
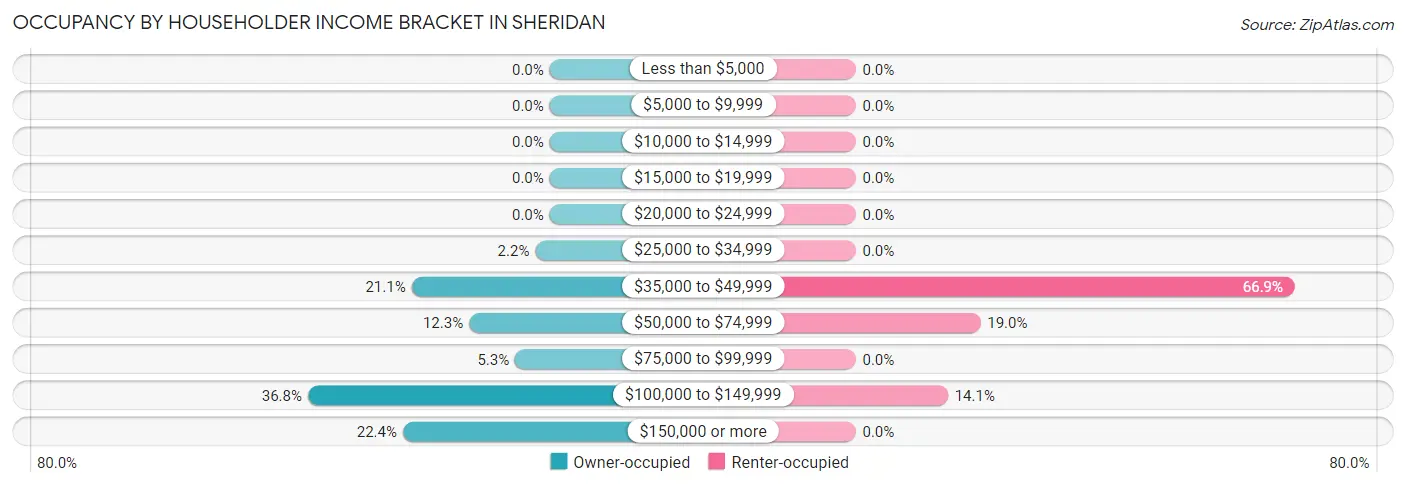
| Income Bracket | Owner-occupied | Renter-occupied |
| Less than $5,000 | 0 (0.0%) | 0 (0.0%) |
| $5,000 to $9,999 | 0 (0.0%) | 0 (0.0%) |
| $10,000 to $14,999 | 0 (0.0%) | 0 (0.0%) |
| $15,000 to $19,999 | 0 (0.0%) | 0 (0.0%) |
| $20,000 to $24,999 | 0 (0.0%) | 0 (0.0%) |
| $25,000 to $34,999 | 5 (2.2%) | 0 (0.0%) |
| $35,000 to $49,999 | 48 (21.0%) | 81 (66.9%) |
| $50,000 to $74,999 | 28 (12.3%) | 23 (19.0%) |
| $75,000 to $99,999 | 12 (5.3%) | 0 (0.0%) |
| $100,000 to $149,999 | 84 (36.8%) | 17 (14.1%) |
| $150,000 or more | 51 (22.4%) | 0 (0.0%) |
| Total | 228 (100.0%) | 121 (100.0%) |
Monthly Housing Cost Tiers in Sheridan
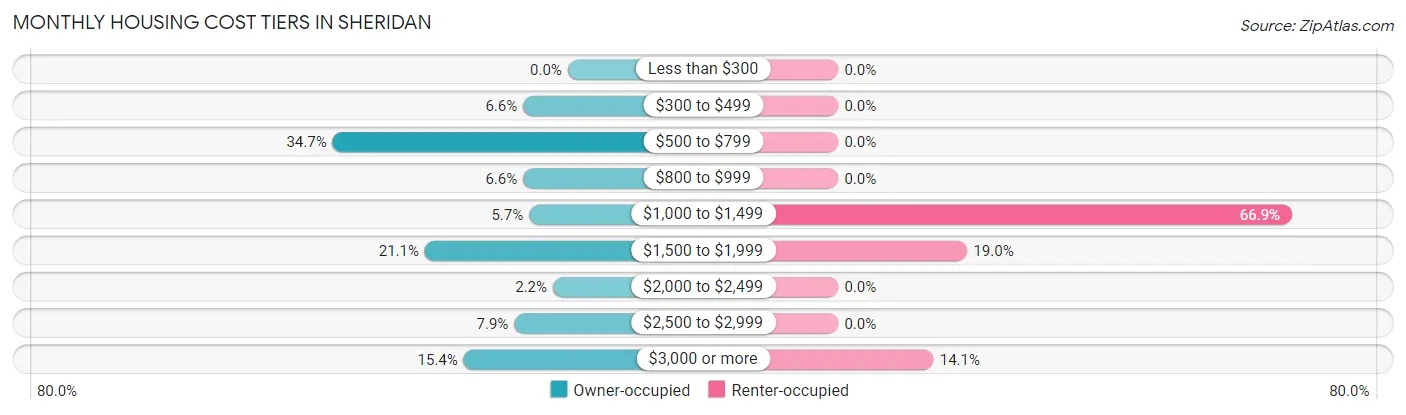
| Monthly Cost | Owner-occupied | Renter-occupied |
| Less than $300 | 0 (0.0%) | 0 (0.0%) |
| $300 to $499 | 15 (6.6%) | 0 (0.0%) |
| $500 to $799 | 79 (34.6%) | 0 (0.0%) |
| $800 to $999 | 15 (6.6%) | 0 (0.0%) |
| $1,000 to $1,499 | 13 (5.7%) | 81 (66.9%) |
| $1,500 to $1,999 | 48 (21.0%) | 23 (19.0%) |
| $2,000 to $2,499 | 5 (2.2%) | 0 (0.0%) |
| $2,500 to $2,999 | 18 (7.9%) | 0 (0.0%) |
| $3,000 or more | 35 (15.3%) | 17 (14.1%) |
| Total | 228 (100.0%) | 121 (100.0%) |
Physical Housing Characteristics in Sheridan
Housing Structures in Sheridan
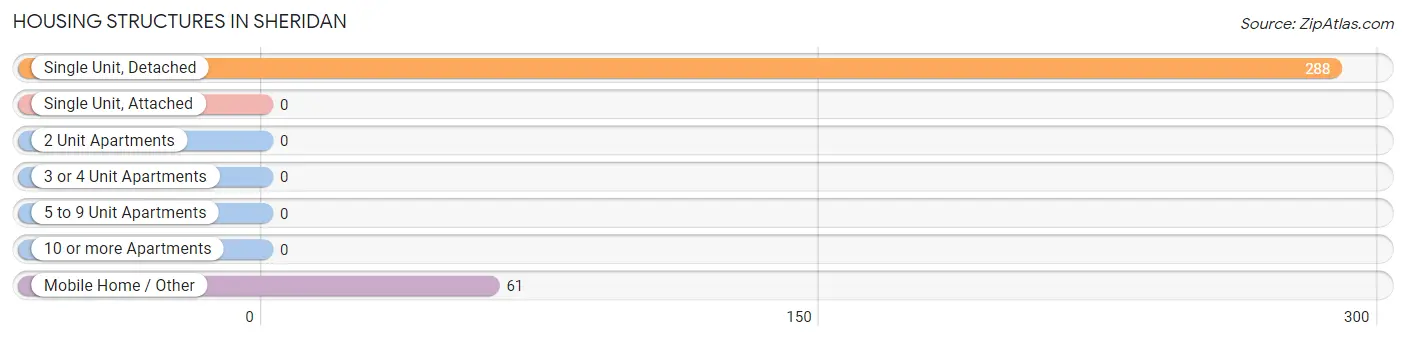
| Structure Type | # Housing Units | % Housing Units |
| Single Unit, Detached | 288 | 82.5% |
| Single Unit, Attached | 0 | 0.0% |
| 2 Unit Apartments | 0 | 0.0% |
| 3 or 4 Unit Apartments | 0 | 0.0% |
| 5 to 9 Unit Apartments | 0 | 0.0% |
| 10 or more Apartments | 0 | 0.0% |
| Mobile Home / Other | 61 | 17.5% |
| Total | 349 | 100.0% |
Housing Structures by Occupancy in Sheridan
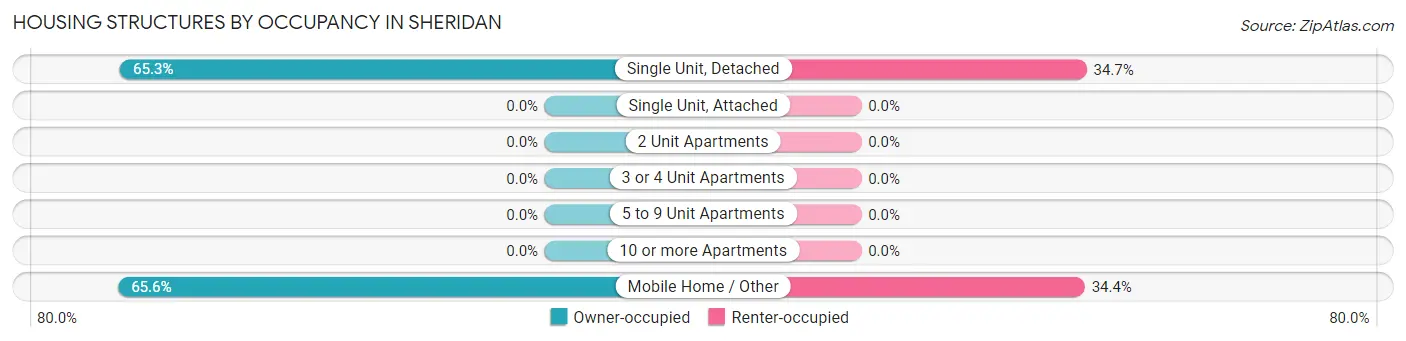
| Structure Type | Owner-occupied | Renter-occupied |
| Single Unit, Detached | 188 (65.3%) | 100 (34.7%) |
| Single Unit, Attached | 0 (0.0%) | 0 (0.0%) |
| 2 Unit Apartments | 0 (0.0%) | 0 (0.0%) |
| 3 or 4 Unit Apartments | 0 (0.0%) | 0 (0.0%) |
| 5 to 9 Unit Apartments | 0 (0.0%) | 0 (0.0%) |
| 10 or more Apartments | 0 (0.0%) | 0 (0.0%) |
| Mobile Home / Other | 40 (65.6%) | 21 (34.4%) |
| Total | 228 (65.3%) | 121 (34.7%) |
Housing Structures by Number of Rooms in Sheridan
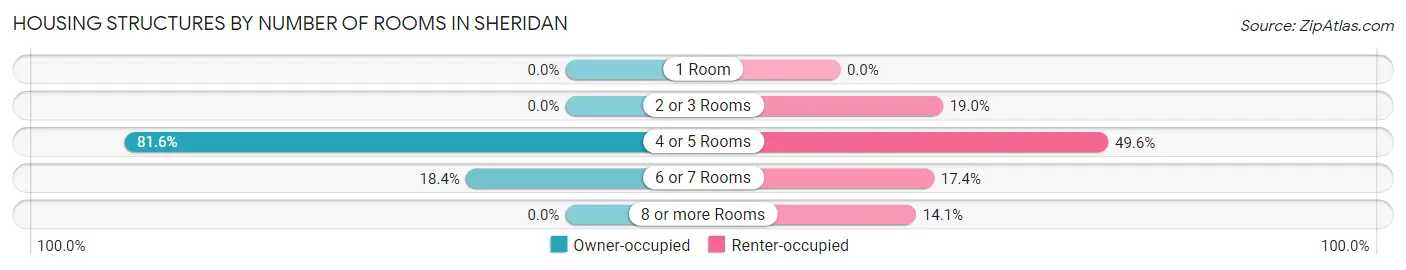
| Number of Rooms | Owner-occupied | Renter-occupied |
| 1 Room | 0 (0.0%) | 0 (0.0%) |
| 2 or 3 Rooms | 0 (0.0%) | 23 (19.0%) |
| 4 or 5 Rooms | 186 (81.6%) | 60 (49.6%) |
| 6 or 7 Rooms | 42 (18.4%) | 21 (17.4%) |
| 8 or more Rooms | 0 (0.0%) | 17 (14.1%) |
| Total | 228 (100.0%) | 121 (100.0%) |
Housing Structure by Heating Type in Sheridan
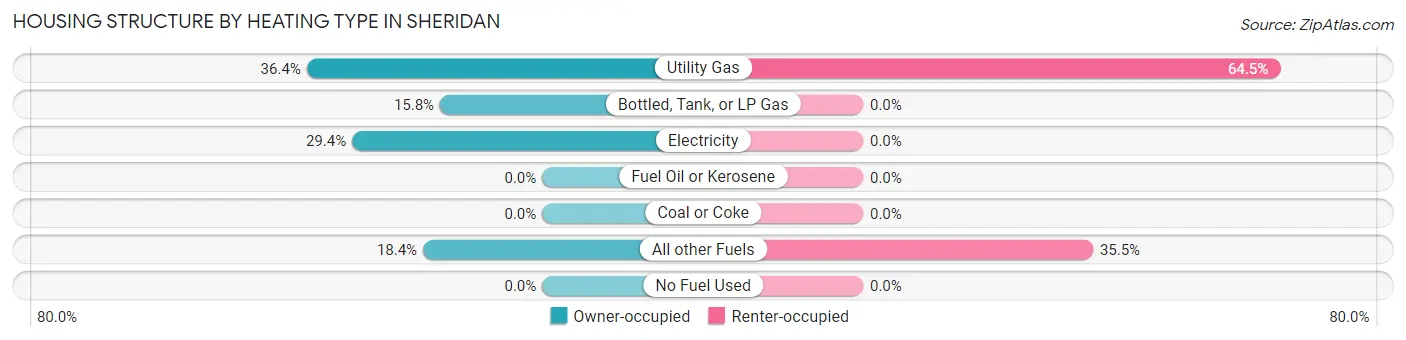
| Heating Type | Owner-occupied | Renter-occupied |
| Utility Gas | 83 (36.4%) | 78 (64.5%) |
| Bottled, Tank, or LP Gas | 36 (15.8%) | 0 (0.0%) |
| Electricity | 67 (29.4%) | 0 (0.0%) |
| Fuel Oil or Kerosene | 0 (0.0%) | 0 (0.0%) |
| Coal or Coke | 0 (0.0%) | 0 (0.0%) |
| All other Fuels | 42 (18.4%) | 43 (35.5%) |
| No Fuel Used | 0 (0.0%) | 0 (0.0%) |
| Total | 228 (100.0%) | 121 (100.0%) |
Household Vehicle Usage in Sheridan
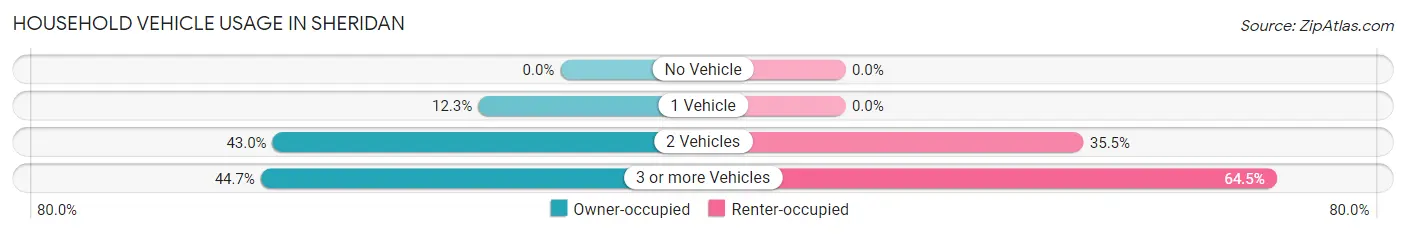
| Vehicles per Household | Owner-occupied | Renter-occupied |
| No Vehicle | 0 (0.0%) | 0 (0.0%) |
| 1 Vehicle | 28 (12.3%) | 0 (0.0%) |
| 2 Vehicles | 98 (43.0%) | 43 (35.5%) |
| 3 or more Vehicles | 102 (44.7%) | 78 (64.5%) |
| Total | 228 (100.0%) | 121 (100.0%) |
Real Estate & Mortgages in Sheridan
Real Estate and Mortgage Overview in Sheridan
| Characteristic | Without Mortgage | With Mortgage |
| Housing Units | 109 | 119 |
| Median Property Value | $336,600 | $380,300 |
| Median Household Income | $106,026 | $36 |
| Monthly Housing Costs | $550 | $35 |
| Real Estate Taxes | $2,590 | $0 |
Property Value by Mortgage Status in Sheridan
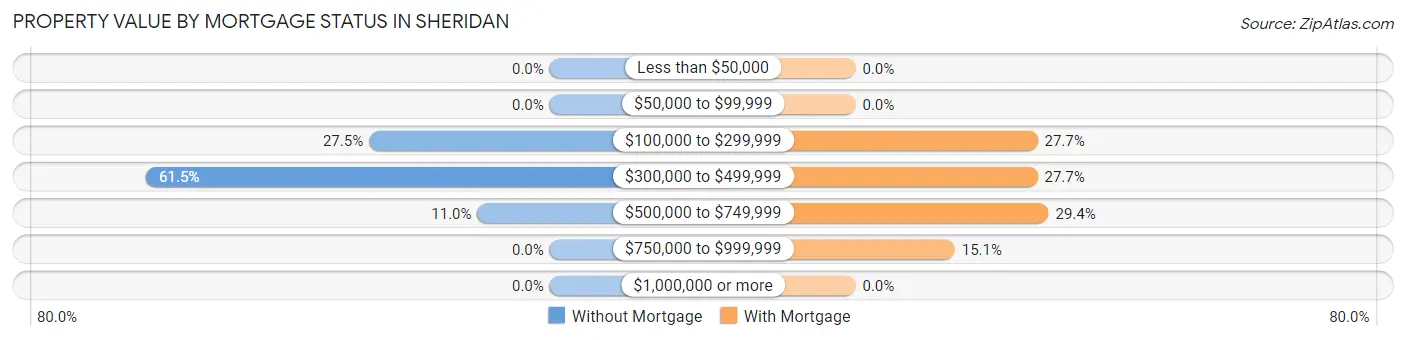
| Property Value | Without Mortgage | With Mortgage |
| Less than $50,000 | 0 (0.0%) | 0 (0.0%) |
| $50,000 to $99,999 | 0 (0.0%) | 0 (0.0%) |
| $100,000 to $299,999 | 30 (27.5%) | 33 (27.7%) |
| $300,000 to $499,999 | 67 (61.5%) | 33 (27.7%) |
| $500,000 to $749,999 | 12 (11.0%) | 35 (29.4%) |
| $750,000 to $999,999 | 0 (0.0%) | 18 (15.1%) |
| $1,000,000 or more | 0 (0.0%) | 0 (0.0%) |
| Total | 109 (100.0%) | 119 (100.0%) |
Household Income by Mortgage Status in Sheridan
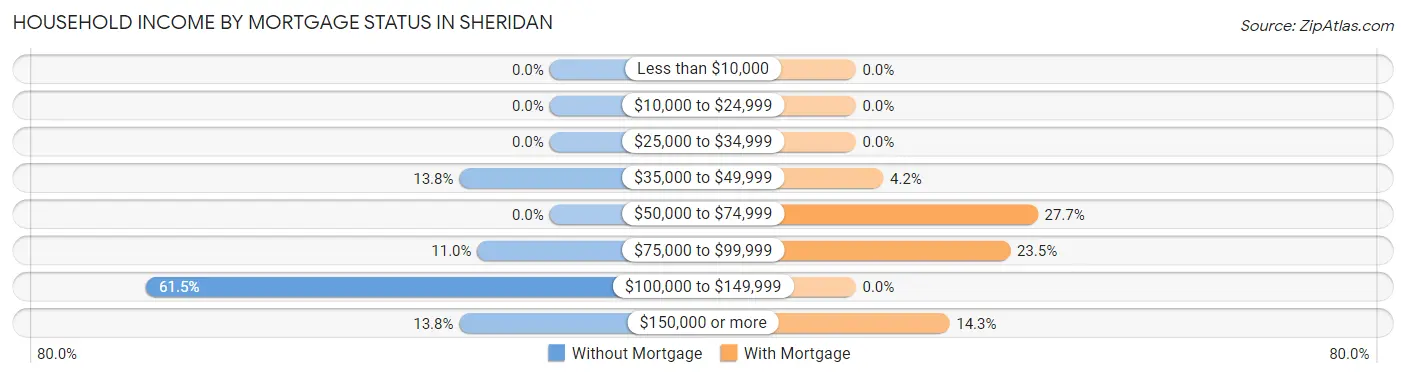
| Household Income | Without Mortgage | With Mortgage |
| Less than $10,000 | 0 (0.0%) | 0 (0.0%) |
| $10,000 to $24,999 | 0 (0.0%) | 0 (0.0%) |
| $25,000 to $34,999 | 0 (0.0%) | 0 (0.0%) |
| $35,000 to $49,999 | 15 (13.8%) | 5 (4.2%) |
| $50,000 to $74,999 | 0 (0.0%) | 33 (27.7%) |
| $75,000 to $99,999 | 12 (11.0%) | 28 (23.5%) |
| $100,000 to $149,999 | 67 (61.5%) | 0 (0.0%) |
| $150,000 or more | 15 (13.8%) | 17 (14.3%) |
| Total | 109 (100.0%) | 119 (100.0%) |
Property Value to Household Income Ratio in Sheridan
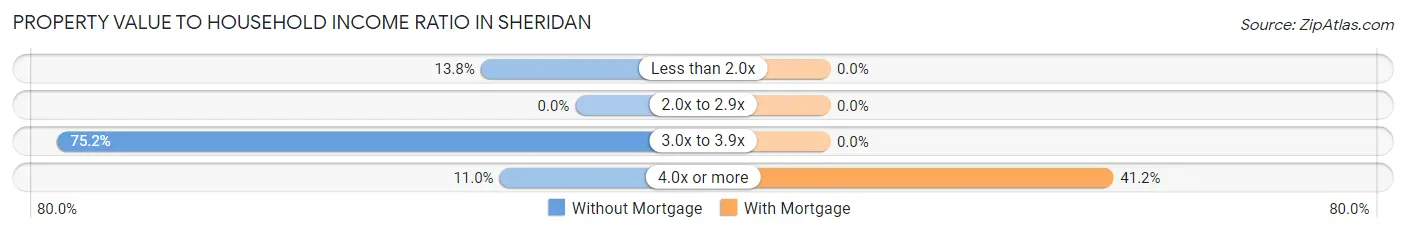
| Value-to-Income Ratio | Without Mortgage | With Mortgage |
| Less than 2.0x | 15 (13.8%) | 0 (0.0%) |
| 2.0x to 2.9x | 0 (0.0%) | 0 (0.0%) |
| 3.0x to 3.9x | 82 (75.2%) | 0 (0.0%) |
| 4.0x or more | 12 (11.0%) | 49 (41.2%) |
| Total | 109 (100.0%) | 119 (100.0%) |
Real Estate Taxes by Mortgage Status in Sheridan
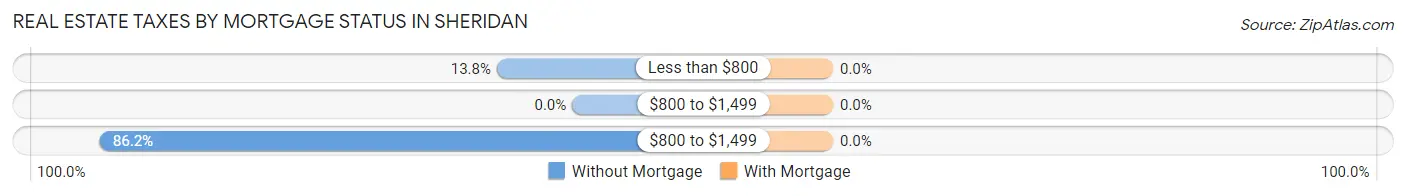
| Property Taxes | Without Mortgage | With Mortgage |
| Less than $800 | 15 (13.8%) | 0 (0.0%) |
| $800 to $1,499 | 0 (0.0%) | 0 (0.0%) |
| $800 to $1,499 | 94 (86.2%) | 0 (0.0%) |
| Total | 109 (100.0%) | 119 (100.0%) |
Health & Disability in Sheridan
Health Insurance Coverage by Age in Sheridan
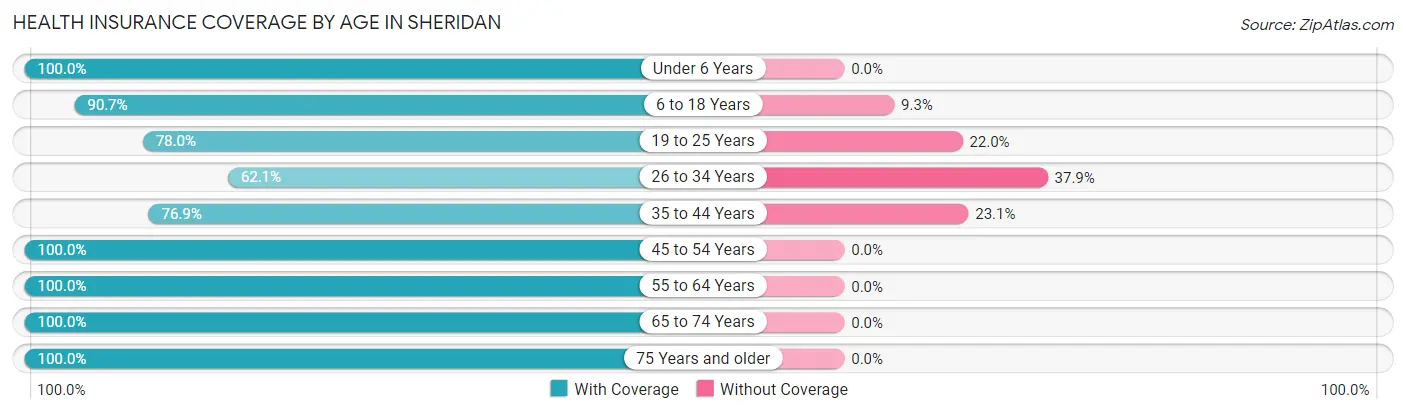
| Age Bracket | With Coverage | Without Coverage |
| Under 6 Years | 129 (100.0%) | 0 (0.0%) |
| 6 to 18 Years | 293 (90.7%) | 30 (9.3%) |
| 19 to 25 Years | 138 (78.0%) | 39 (22.0%) |
| 26 to 34 Years | 95 (62.1%) | 58 (37.9%) |
| 35 to 44 Years | 143 (76.9%) | 43 (23.1%) |
| 45 to 54 Years | 221 (100.0%) | 0 (0.0%) |
| 55 to 64 Years | 119 (100.0%) | 0 (0.0%) |
| 65 to 74 Years | 51 (100.0%) | 0 (0.0%) |
| 75 Years and older | 38 (100.0%) | 0 (0.0%) |
| Total | 1,227 (87.8%) | 170 (12.2%) |
Health Insurance Coverage by Citizenship Status in Sheridan
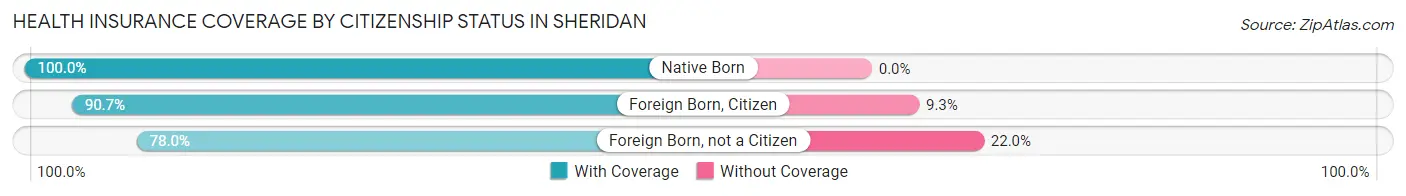
| Citizenship Status | With Coverage | Without Coverage |
| Native Born | 129 (100.0%) | 0 (0.0%) |
| Foreign Born, Citizen | 293 (90.7%) | 30 (9.3%) |
| Foreign Born, not a Citizen | 138 (78.0%) | 39 (22.0%) |
Health Insurance Coverage by Household Income in Sheridan
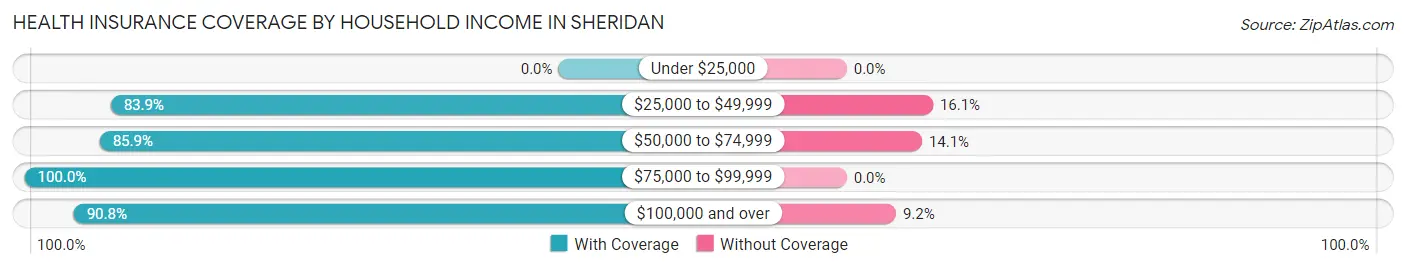
| Household Income | With Coverage | Without Coverage |
| Under $25,000 | 0 (0.0%) | 0 (0.0%) |
| $25,000 to $49,999 | 400 (83.9%) | 77 (16.1%) |
| $50,000 to $74,999 | 183 (85.9%) | 30 (14.1%) |
| $75,000 to $99,999 | 23 (100.0%) | 0 (0.0%) |
| $100,000 and over | 621 (90.8%) | 63 (9.2%) |
Public vs Private Health Insurance Coverage by Age in Sheridan
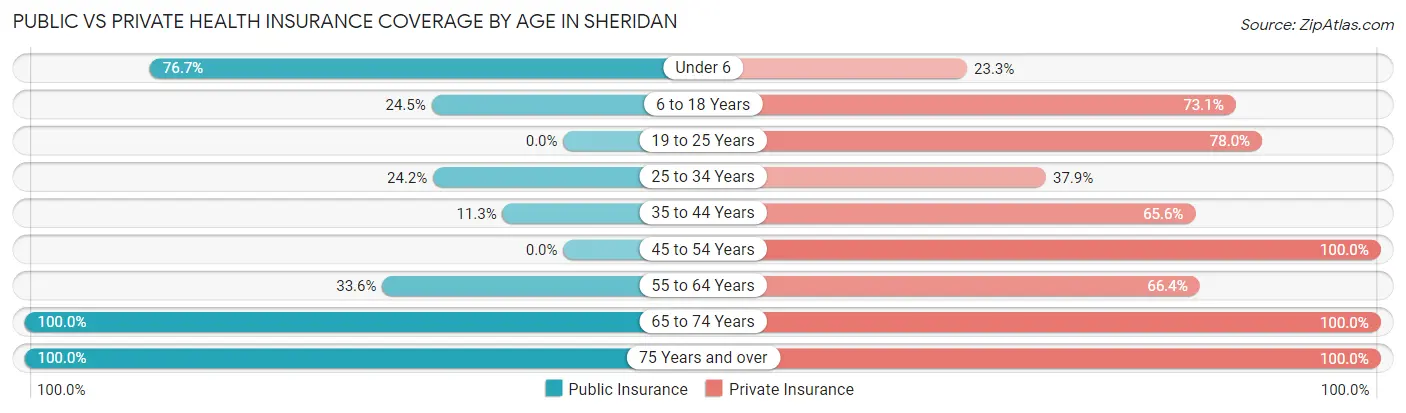
| Age Bracket | Public Insurance | Private Insurance |
| Under 6 | 99 (76.7%) | 30 (23.3%) |
| 6 to 18 Years | 79 (24.5%) | 236 (73.1%) |
| 19 to 25 Years | 0 (0.0%) | 138 (78.0%) |
| 25 to 34 Years | 37 (24.2%) | 58 (37.9%) |
| 35 to 44 Years | 21 (11.3%) | 122 (65.6%) |
| 45 to 54 Years | 0 (0.0%) | 221 (100.0%) |
| 55 to 64 Years | 40 (33.6%) | 79 (66.4%) |
| 65 to 74 Years | 51 (100.0%) | 51 (100.0%) |
| 75 Years and over | 38 (100.0%) | 38 (100.0%) |
| Total | 365 (26.1%) | 973 (69.7%) |
Disability Status by Sex by Age in Sheridan
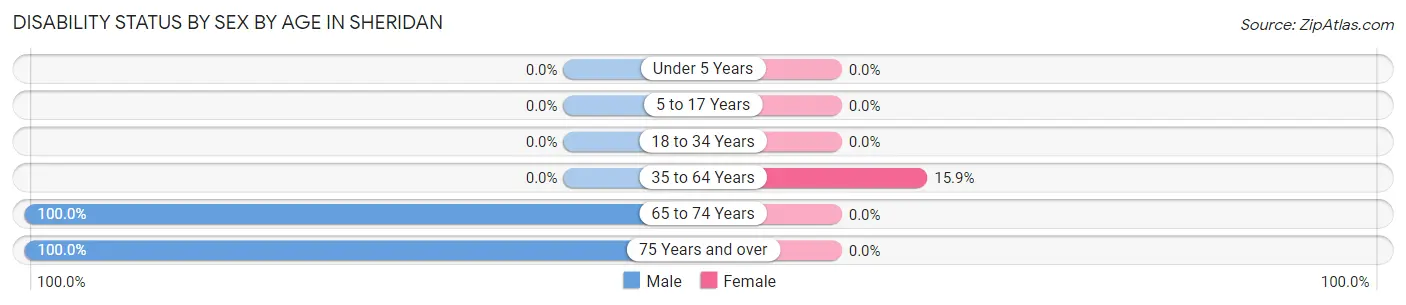
| Age Bracket | Male | Female |
| Under 5 Years | 0 (0.0%) | 0 (0.0%) |
| 5 to 17 Years | 0 (0.0%) | 0 (0.0%) |
| 18 to 34 Years | 0 (0.0%) | 0 (0.0%) |
| 35 to 64 Years | 0 (0.0%) | 40 (15.9%) |
| 65 to 74 Years | 18 (100.0%) | 0 (0.0%) |
| 75 Years and over | 13 (100.0%) | 0 (0.0%) |
Disability Class by Sex by Age in Sheridan
Disability Class: Hearing Difficulty
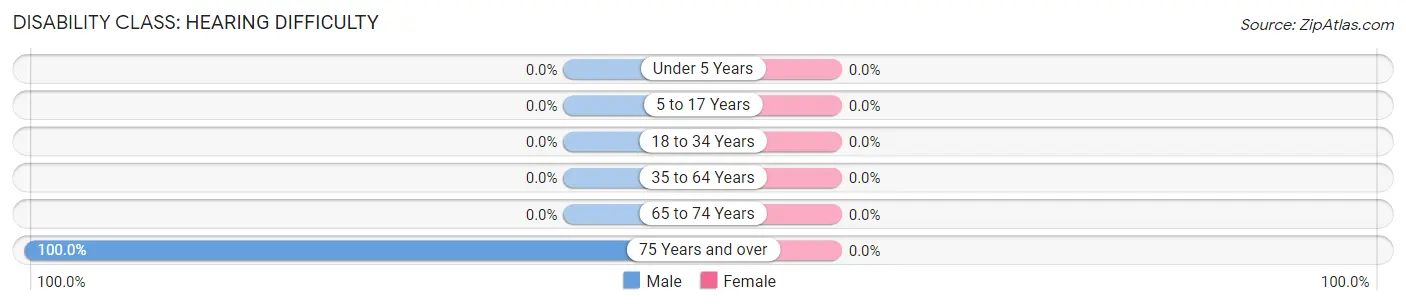
| Age Bracket | Male | Female |
| Under 5 Years | 0 (0.0%) | 0 (0.0%) |
| 5 to 17 Years | 0 (0.0%) | 0 (0.0%) |
| 18 to 34 Years | 0 (0.0%) | 0 (0.0%) |
| 35 to 64 Years | 0 (0.0%) | 0 (0.0%) |
| 65 to 74 Years | 0 (0.0%) | 0 (0.0%) |
| 75 Years and over | 13 (100.0%) | 0 (0.0%) |
Disability Class: Vision Difficulty
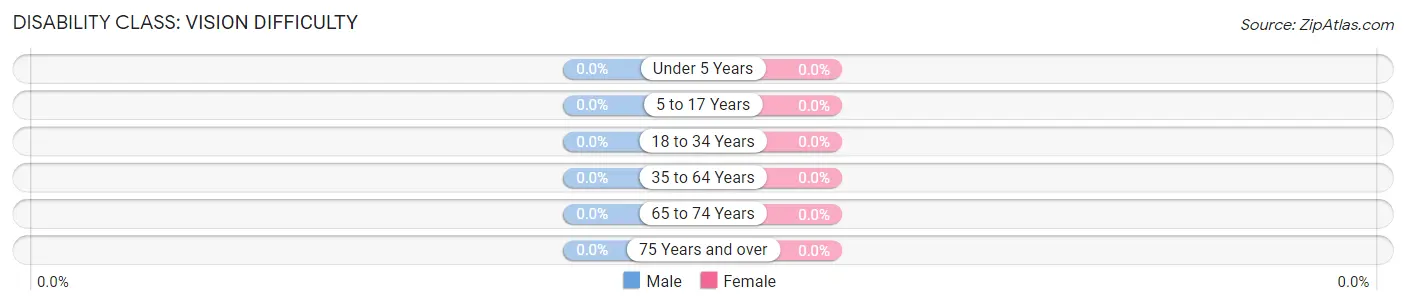
| Age Bracket | Male | Female |
| Under 5 Years | 0 (0.0%) | 0 (0.0%) |
| 5 to 17 Years | 0 (0.0%) | 0 (0.0%) |
| 18 to 34 Years | 0 (0.0%) | 0 (0.0%) |
| 35 to 64 Years | 0 (0.0%) | 0 (0.0%) |
| 65 to 74 Years | 0 (0.0%) | 0 (0.0%) |
| 75 Years and over | 0 (0.0%) | 0 (0.0%) |
Disability Class: Cognitive Difficulty
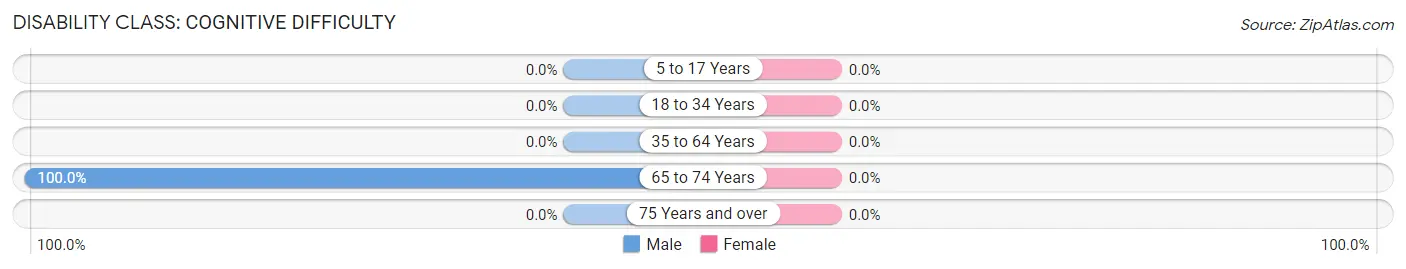
| Age Bracket | Male | Female |
| 5 to 17 Years | 0 (0.0%) | 0 (0.0%) |
| 18 to 34 Years | 0 (0.0%) | 0 (0.0%) |
| 35 to 64 Years | 0 (0.0%) | 0 (0.0%) |
| 65 to 74 Years | 18 (100.0%) | 0 (0.0%) |
| 75 Years and over | 0 (0.0%) | 0 (0.0%) |
Disability Class: Ambulatory Difficulty
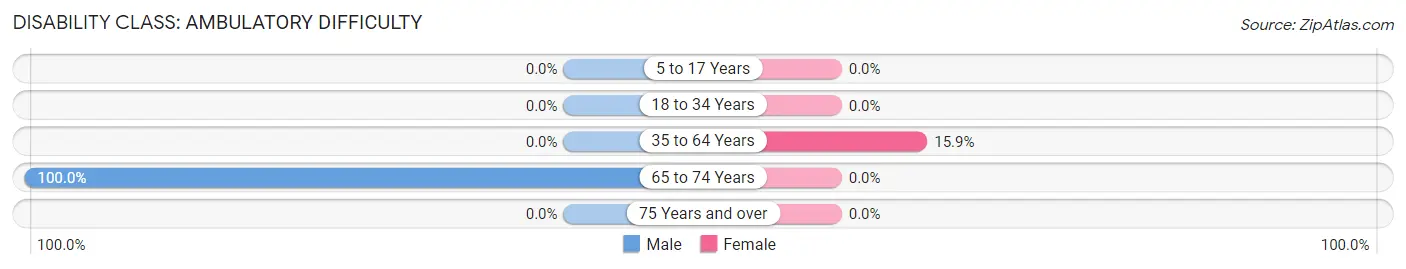
| Age Bracket | Male | Female |
| 5 to 17 Years | 0 (0.0%) | 0 (0.0%) |
| 18 to 34 Years | 0 (0.0%) | 0 (0.0%) |
| 35 to 64 Years | 0 (0.0%) | 40 (15.9%) |
| 65 to 74 Years | 18 (100.0%) | 0 (0.0%) |
| 75 Years and over | 0 (0.0%) | 0 (0.0%) |
Disability Class: Self-Care Difficulty
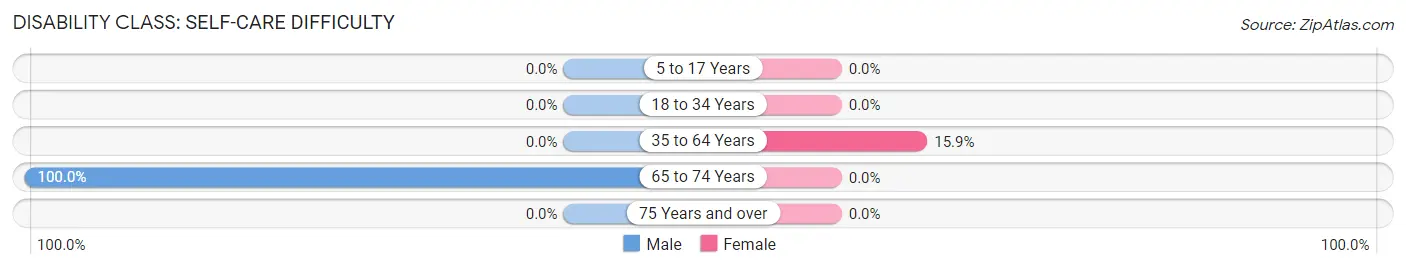
| Age Bracket | Male | Female |
| 5 to 17 Years | 0 (0.0%) | 0 (0.0%) |
| 18 to 34 Years | 0 (0.0%) | 0 (0.0%) |
| 35 to 64 Years | 0 (0.0%) | 40 (15.9%) |
| 65 to 74 Years | 18 (100.0%) | 0 (0.0%) |
| 75 Years and over | 0 (0.0%) | 0 (0.0%) |
Technology Access in Sheridan
Computing Device Access in Sheridan
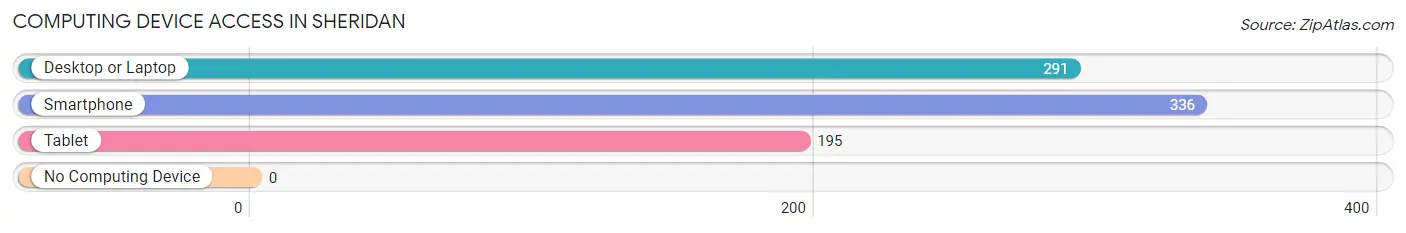
| Device Type | # Households | % Households |
| Desktop or Laptop | 291 | 83.4% |
| Smartphone | 336 | 96.3% |
| Tablet | 195 | 55.9% |
| No Computing Device | 0 | 0.0% |
| Total | 349 | 100.0% |
Internet Access in Sheridan
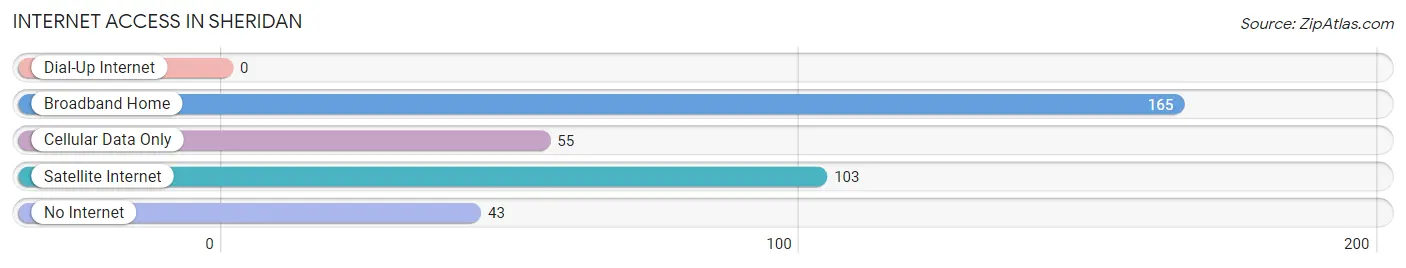
| Internet Type | # Households | % Households |
| Dial-Up Internet | 0 | 0.0% |
| Broadband Home | 165 | 47.3% |
| Cellular Data Only | 55 | 15.8% |
| Satellite Internet | 103 | 29.5% |
| No Internet | 43 | 12.3% |
| Total | 349 | 100.0% |
Sheridan Summary
Sheridan is a small town located in the Central Valley of California, in the county of Yolo. It is situated about 20 miles west of Sacramento, the state capital. The town has a population of about 2,000 people and is known for its agricultural production, particularly of tomatoes, melons, and other fruits and vegetables.
Geography
Sheridan is located in the Central Valley of California, in the county of Yolo. It is situated about 20 miles west of Sacramento, the state capital. The town is located on the banks of the Sacramento River, and is surrounded by rolling hills and farmland. The climate in the area is generally mild, with hot summers and cool winters.
Economy
Sheridan’s economy is largely based on agriculture. The town is known for its production of tomatoes, melons, and other fruits and vegetables. The town also has a number of small businesses, including restaurants, shops, and services. The town is also home to a number of wineries, which produce a variety of wines.
Demographics
As of the 2010 census, the population of Sheridan was 2,000 people. The racial makeup of the town was 75.2% White, 0.7% African American, 0.7% Native American, 0.7% Asian, 0.2% Pacific Islander, and 21.2% from other races. The median household income in the town was $45,000, and the median family income was $50,000.
History
Sheridan was founded in 1852 by a group of settlers from the East Coast. The town was named after General Philip Sheridan, a Civil War hero. The town grew quickly, and by the late 19th century, it was a thriving agricultural center. The town was also home to a number of wineries, which produced a variety of wines.
In the early 20th century, the town experienced a period of decline, as many of the farms and wineries closed. However, in the late 20th century, the town experienced a resurgence, as new businesses opened and the population began to grow. Today, Sheridan is a small but vibrant town, with a strong agricultural base and a growing number of businesses.
Common Questions
What is Per Capita Income in Sheridan?
Per Capita income in Sheridan is $26,481.
What is the Median Family Income in Sheridan?
Median Family Income in Sheridan is $69,674.
What is the Median Household income in Sheridan?
Median Household Income in Sheridan is $68,859.
What is Inequality or Gini Index in Sheridan?
Inequality or Gini Index in Sheridan is 0.37.
What is the Total Population of Sheridan?
Total Population of Sheridan is 1,397.
What is the Total Male Population of Sheridan?
Total Male Population of Sheridan is 710.
What is the Total Female Population of Sheridan?
Total Female Population of Sheridan is 687.
What is the Ratio of Males per 100 Females in Sheridan?
There are 103.35 Males per 100 Females in Sheridan.
What is the Ratio of Females per 100 Males in Sheridan?
There are 96.76 Females per 100 Males in Sheridan.
What is the Median Population Age in Sheridan?
Median Population Age in Sheridan is 28.7 Years.
What is the Average Family Size in Sheridan
Average Family Size in Sheridan is 4.1 People.
What is the Average Household Size in Sheridan
Average Household Size in Sheridan is 4.0 People.
How Large is the Labor Force in Sheridan?
There are 717 People in the Labor Forcein in Sheridan.
What is the Percentage of People in the Labor Force in Sheridan?
75.9% of People are in the Labor Force in Sheridan.
What is the Unemployment Rate in Sheridan?
Unemployment Rate in Sheridan is 6.4%.