Highland Lakes, NJ Map & Demographics
Highland Lakes Map
Highland Lakes Overview
$65,306
PER CAPITA INCOME
$135,938
AVG FAMILY INCOME
$122,527
AVG HOUSEHOLD INCOME
19.6%
WAGE / INCOME GAP [ % ]
80.4¢/ $1
WAGE / INCOME GAP [ $ ]
0.42
INEQUALITY / GINI INDEX
4,089
TOTAL POPULATION
2,318
MALE POPULATION
1,771
FEMALE POPULATION
130.89
MALES / 100 FEMALES
76.40
FEMALES / 100 MALES
44.7
MEDIAN AGE
2.9
AVG FAMILY SIZE
2.5
AVG HOUSEHOLD SIZE
2,641
LABOR FORCE [ PEOPLE ]
75.9%
PERCENT IN LABOR FORCE
9.5%
UNEMPLOYMENT RATE
Highland Lakes Zip Codes
Highland Lakes Area Codes
Income in Highland Lakes
Income Overview in Highland Lakes
Per Capita Income in Highland Lakes is $65,306, while median incomes of families and households are $135,938 and $122,527 respectively.
| Characteristic | Number | Measure |
| Per Capita Income | 4,089 | $65,306 |
| Median Family Income | 1,188 | $135,938 |
| Mean Family Income | 1,188 | $177,477 |
| Median Household Income | 1,647 | $122,527 |
| Mean Household Income | 1,647 | $163,132 |
| Income Deficit | 1,188 | $0 |
| Wage / Income Gap (%) | 4,089 | 19.62% |
| Wage / Income Gap ($) | 4,089 | 80.38¢ per $1 |
| Gini / Inequality Index | 4,089 | 0.42 |
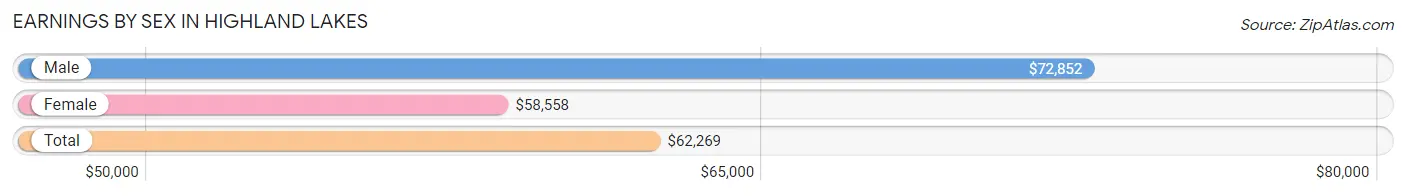
Earnings by Sex in Highland Lakes
Average Earnings in Highland Lakes are $62,269, $72,852 for men and $58,558 for women, a difference of 19.6%.
| Sex | Number | Average Earnings |
| Male | 1,562 (56.0%) | $72,852 |
| Female | 1,228 (44.0%) | $58,558 |
| Total | 2,790 (100.0%) | $62,269 |
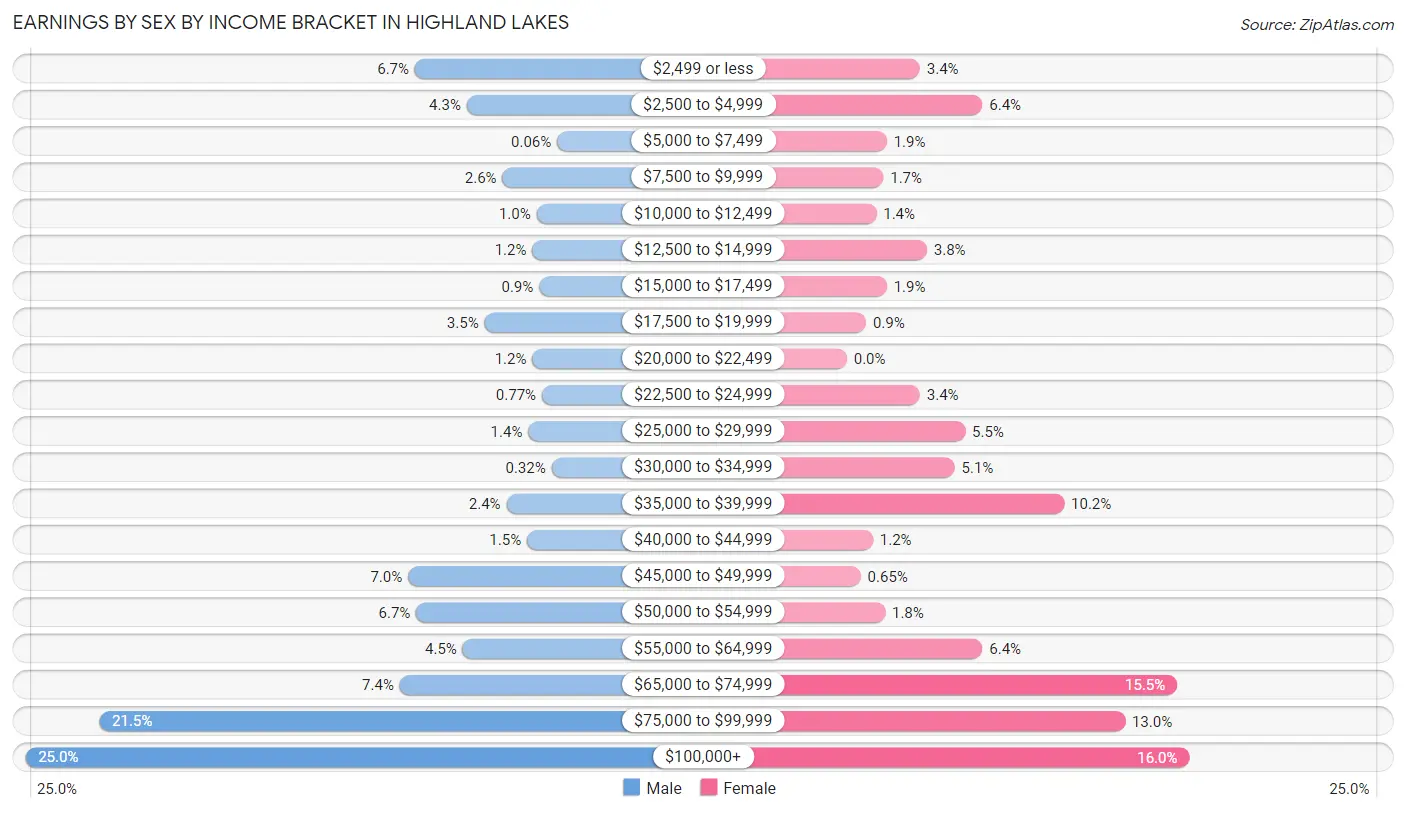
Earnings by Sex by Income Bracket in Highland Lakes
The most common earnings brackets in Highland Lakes are $100,000+ for men (390 | 25.0%) and $100,000+ for women (197 | 16.0%).
| Income | Male | Female |
| $2,499 or less | 105 (6.7%) | 42 (3.4%) |
| $2,500 to $4,999 | 67 (4.3%) | 78 (6.4%) |
| $5,000 to $7,499 | 1 (0.1%) | 23 (1.9%) |
| $7,500 to $9,999 | 41 (2.6%) | 21 (1.7%) |
| $10,000 to $12,499 | 16 (1.0%) | 17 (1.4%) |
| $12,500 to $14,999 | 19 (1.2%) | 46 (3.7%) |
| $15,000 to $17,499 | 14 (0.9%) | 23 (1.9%) |
| $17,500 to $19,999 | 54 (3.5%) | 11 (0.9%) |
| $20,000 to $22,499 | 19 (1.2%) | 0 (0.0%) |
| $22,500 to $24,999 | 12 (0.8%) | 42 (3.4%) |
| $25,000 to $29,999 | 22 (1.4%) | 68 (5.5%) |
| $30,000 to $34,999 | 5 (0.3%) | 62 (5.1%) |
| $35,000 to $39,999 | 38 (2.4%) | 125 (10.2%) |
| $40,000 to $44,999 | 23 (1.5%) | 15 (1.2%) |
| $45,000 to $49,999 | 110 (7.0%) | 8 (0.6%) |
| $50,000 to $54,999 | 104 (6.7%) | 22 (1.8%) |
| $55,000 to $64,999 | 70 (4.5%) | 78 (6.4%) |
| $65,000 to $74,999 | 116 (7.4%) | 190 (15.5%) |
| $75,000 to $99,999 | 336 (21.5%) | 160 (13.0%) |
| $100,000+ | 390 (25.0%) | 197 (16.0%) |
| Total | 1,562 (100.0%) | 1,228 (100.0%) |
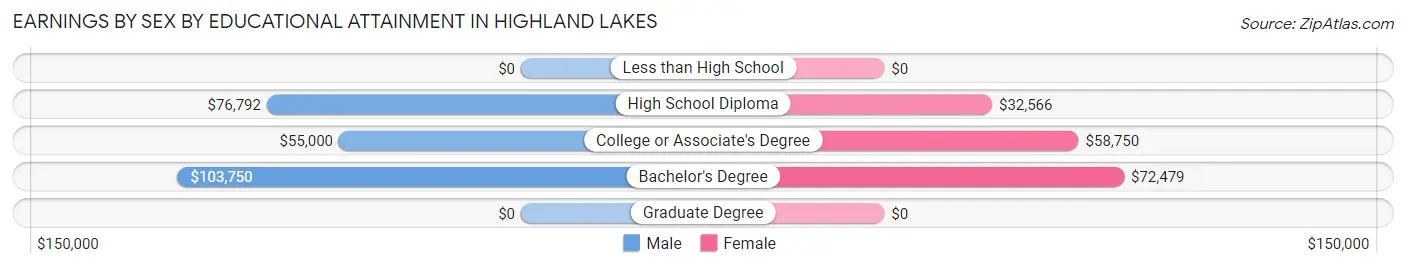
Earnings by Sex by Educational Attainment in Highland Lakes
Average earnings in Highland Lakes are $77,093 for men and $68,016 for women, a difference of 11.8%. Men with an educational attainment of bachelor's degree enjoy the highest average annual earnings of $103,750, while those with college or associate's degree education earn the least with $55,000. Women with an educational attainment of bachelor's degree earn the most with the average annual earnings of $72,479, while those with high school diploma education have the smallest earnings of $32,566.
| Educational Attainment | Male Income | Female Income |
| Less than High School | - | - |
| High School Diploma | $76,792 | $32,566 |
| College or Associate's Degree | $55,000 | $58,750 |
| Bachelor's Degree | $103,750 | $72,479 |
| Graduate Degree | - | - |
| Total | $77,093 | $68,016 |
Family Income in Highland Lakes
Family Income Brackets in Highland Lakes
According to the Highland Lakes family income data, there are 342 families falling into the $200,000+ income range, which is the most common income bracket and makes up 28.8% of all families.
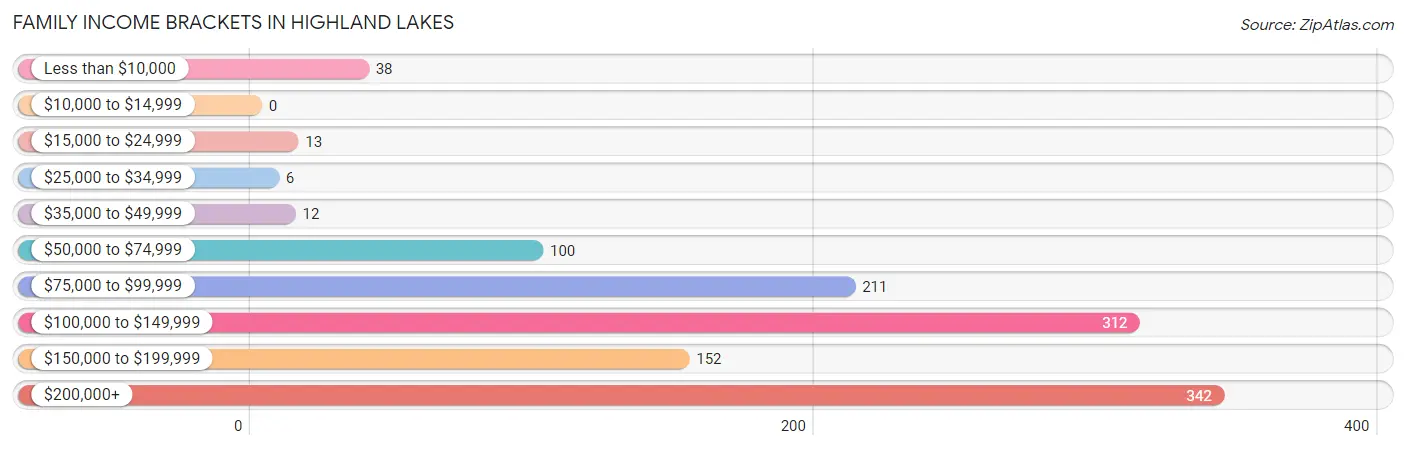
| Income Bracket | # Families | % Families |
| Less than $10,000 | 38 | 3.2% |
| $10,000 to $14,999 | 0 | 0.0% |
| $15,000 to $24,999 | 13 | 1.1% |
| $25,000 to $34,999 | 6 | 0.5% |
| $35,000 to $49,999 | 12 | 1.0% |
| $50,000 to $74,999 | 100 | 8.4% |
| $75,000 to $99,999 | 211 | 17.8% |
| $100,000 to $149,999 | 312 | 26.3% |
| $150,000 to $199,999 | 152 | 12.8% |
| $200,000+ | 342 | 28.8% |
Family Income by Famaliy Size in Highland Lakes
3-person families (446 | 37.5%) account for the highest median family income in Highland Lakes with $139,583 per family, while 2-person families (520 | 43.8%) have the highest median income of $57,927 per family member.
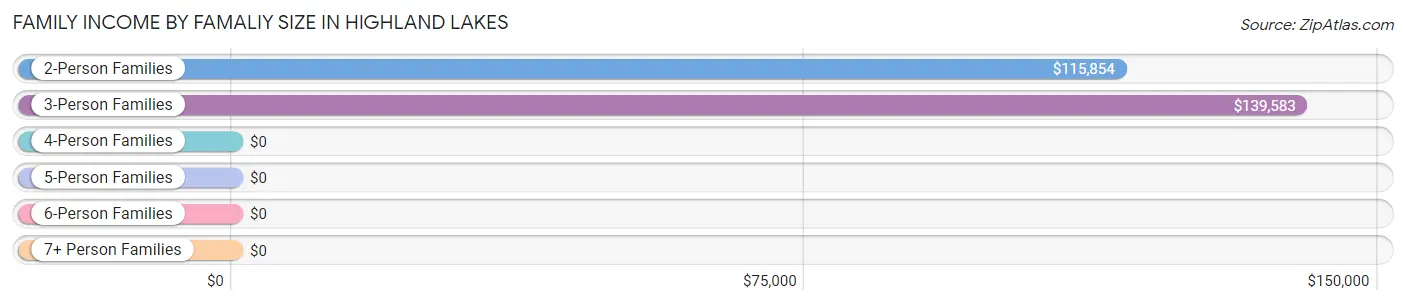
| Income Bracket | # Families | Median Income |
| 2-Person Families | 520 (43.8%) | $115,854 |
| 3-Person Families | 446 (37.5%) | $139,583 |
| 4-Person Families | 145 (12.2%) | $0 |
| 5-Person Families | 31 (2.6%) | $0 |
| 6-Person Families | 46 (3.9%) | $0 |
| 7+ Person Families | 0 (0.0%) | $0 |
| Total | 1,188 (100.0%) | $135,938 |
Family Income by Number of Earners in Highland Lakes
The median family income in Highland Lakes is $135,938, with families comprising 3+ earners (213) having the highest median family income of $248,614, while families with 1 earner (329) have the lowest median family income of $91,399, accounting for 17.9% and 27.7% of families, respectively.
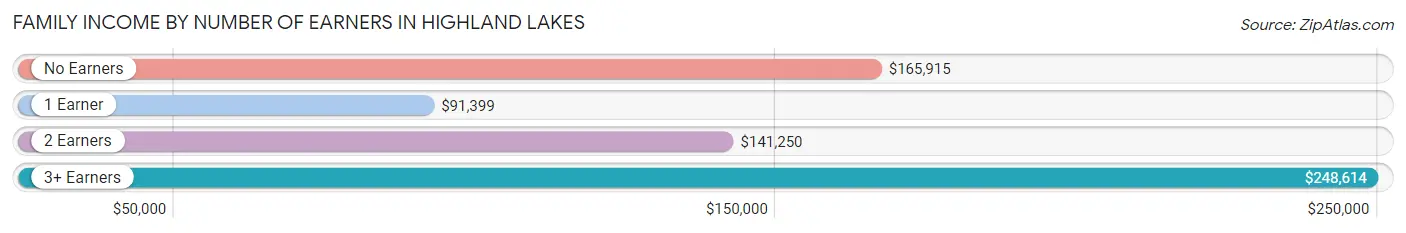
| Number of Earners | # Families | Median Income |
| No Earners | 108 (9.1%) | $165,915 |
| 1 Earner | 329 (27.7%) | $91,399 |
| 2 Earners | 538 (45.3%) | $141,250 |
| 3+ Earners | 213 (17.9%) | $248,614 |
| Total | 1,188 (100.0%) | $135,938 |
Household Income in Highland Lakes
Household Income Brackets in Highland Lakes
With 440 households falling in the category, the $100,000 to $149,999 income range is the most frequent in Highland Lakes, accounting for 26.7% of all households. In contrast, only 13 households (0.8%) fall into the $15,000 to $24,999 income bracket, making it the least populous group.
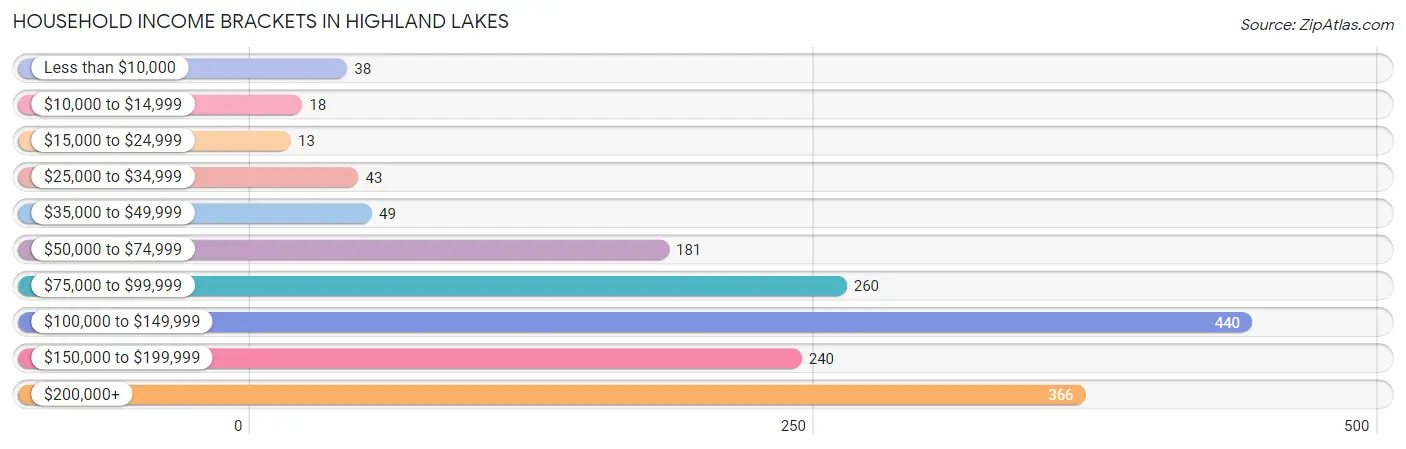
| Income Bracket | # Households | % Households |
| Less than $10,000 | 38 | 2.3% |
| $10,000 to $14,999 | 18 | 1.1% |
| $15,000 to $24,999 | 13 | 0.8% |
| $25,000 to $34,999 | 43 | 2.6% |
| $35,000 to $49,999 | 49 | 3.0% |
| $50,000 to $74,999 | 181 | 11.0% |
| $75,000 to $99,999 | 260 | 15.8% |
| $100,000 to $149,999 | 440 | 26.7% |
| $150,000 to $199,999 | 240 | 14.6% |
| $200,000+ | 366 | 22.2% |
Household Income by Householder Age in Highland Lakes
The median household income in Highland Lakes is $122,527, with the highest median household income of $143,393 found in the 45 to 64 years age bracket for the primary householder. A total of 774 households (47.0%) fall into this category. Meanwhile, the 15 to 24 years age bracket for the primary householder has the lowest median household income of $0, with 57 households (3.5%) in this group.
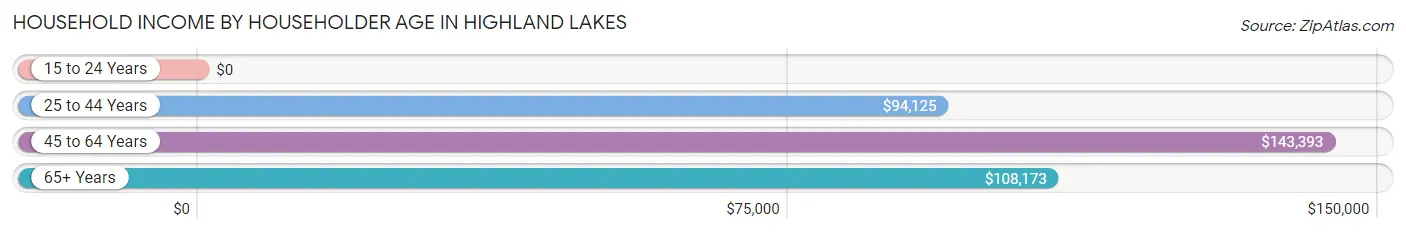
| Income Bracket | # Households | Median Income |
| 15 to 24 Years | 57 (3.5%) | $0 |
| 25 to 44 Years | 349 (21.2%) | $94,125 |
| 45 to 64 Years | 774 (47.0%) | $143,393 |
| 65+ Years | 467 (28.3%) | $108,173 |
| Total | 1,647 (100.0%) | $122,527 |
Poverty in Highland Lakes
Income Below Poverty by Sex and Age in Highland Lakes
With 3.8% poverty level for males and 3.8% for females among the residents of Highland Lakes, under 5 year old males and 18 to 24 year old females are the most vulnerable to poverty, with 30 males (14.8%) and 23 females (12.4%) in their respective age groups living below the poverty level.
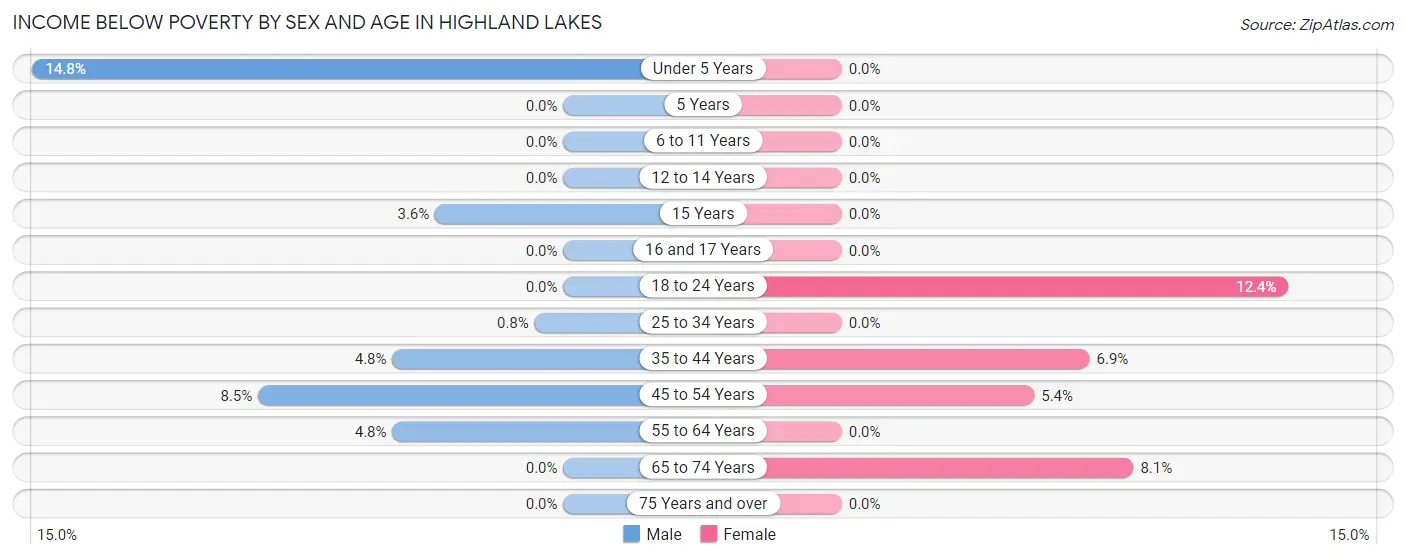
| Age Bracket | Male | Female |
| Under 5 Years | 30 (14.8%) | 0 (0.0%) |
| 5 Years | 0 (0.0%) | 0 (0.0%) |
| 6 to 11 Years | 0 (0.0%) | 0 (0.0%) |
| 12 to 14 Years | 0 (0.0%) | 0 (0.0%) |
| 15 Years | 1 (3.6%) | 0 (0.0%) |
| 16 and 17 Years | 0 (0.0%) | 0 (0.0%) |
| 18 to 24 Years | 0 (0.0%) | 23 (12.4%) |
| 25 to 34 Years | 2 (0.8%) | 0 (0.0%) |
| 35 to 44 Years | 14 (4.8%) | 18 (6.9%) |
| 45 to 54 Years | 21 (8.5%) | 14 (5.4%) |
| 55 to 64 Years | 20 (4.8%) | 0 (0.0%) |
| 65 to 74 Years | 0 (0.0%) | 13 (8.1%) |
| 75 Years and over | 0 (0.0%) | 0 (0.0%) |
| Total | 88 (3.8%) | 68 (3.8%) |
Income Above Poverty by Sex and Age in Highland Lakes
According to the poverty statistics in Highland Lakes, males aged 5 years and females aged under 5 years are the age groups that are most secure financially, with 100.0% of males and 100.0% of females in these age groups living above the poverty line.
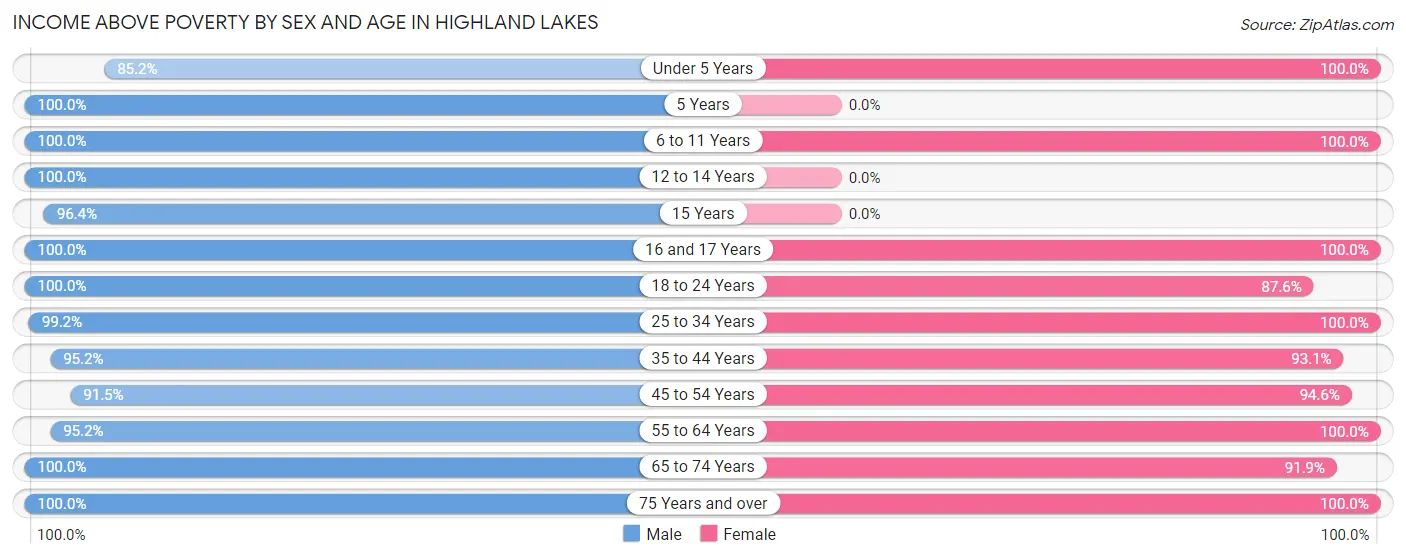
| Age Bracket | Male | Female |
| Under 5 Years | 173 (85.2%) | 80 (100.0%) |
| 5 Years | 28 (100.0%) | 0 (0.0%) |
| 6 to 11 Years | 48 (100.0%) | 185 (100.0%) |
| 12 to 14 Years | 38 (100.0%) | 0 (0.0%) |
| 15 Years | 27 (96.4%) | 0 (0.0%) |
| 16 and 17 Years | 163 (100.0%) | 15 (100.0%) |
| 18 to 24 Years | 135 (100.0%) | 162 (87.6%) |
| 25 to 34 Years | 248 (99.2%) | 144 (100.0%) |
| 35 to 44 Years | 280 (95.2%) | 243 (93.1%) |
| 45 to 54 Years | 226 (91.5%) | 247 (94.6%) |
| 55 to 64 Years | 400 (95.2%) | 374 (100.0%) |
| 65 to 74 Years | 374 (100.0%) | 147 (91.9%) |
| 75 Years and over | 90 (100.0%) | 106 (100.0%) |
| Total | 2,230 (96.2%) | 1,703 (96.2%) |
Income Below Poverty Among Married-Couple Families in Highland Lakes
The poverty statistics for married-couple families in Highland Lakes show that 1.8% or 15 of the total 827 families live below the poverty line. Families with no children have the highest poverty rate of 3.3%, comprising of 15 families. On the other hand, families with 1 or 2 children have the lowest poverty rate of 0.0%, which includes 0 families.
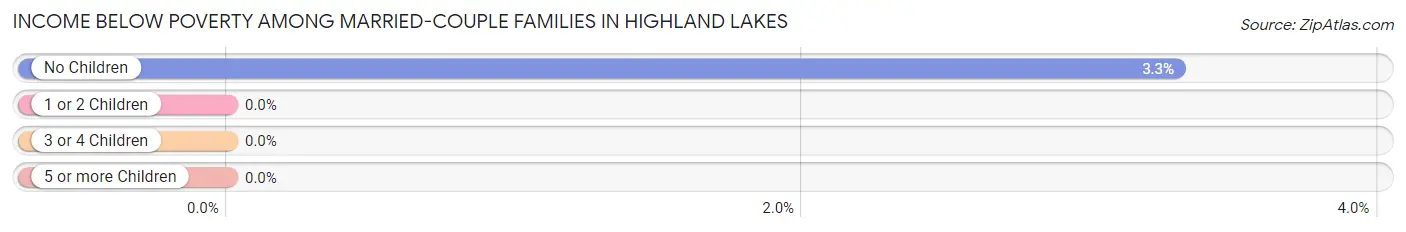
| Children | Above Poverty | Below Poverty |
| No Children | 440 (96.7%) | 15 (3.3%) |
| 1 or 2 Children | 362 (100.0%) | 0 (0.0%) |
| 3 or 4 Children | 10 (100.0%) | 0 (0.0%) |
| 5 or more Children | 0 (0.0%) | 0 (0.0%) |
| Total | 812 (98.2%) | 15 (1.8%) |
Income Below Poverty Among Single-Parent Households in Highland Lakes
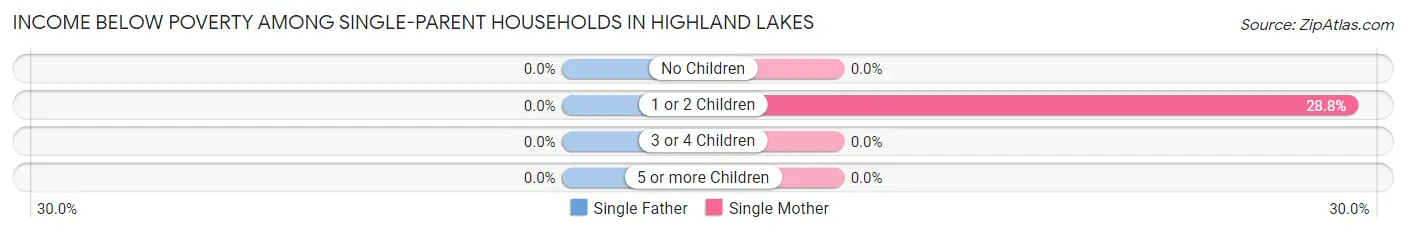
| Children | Single Father | Single Mother |
| No Children | 0 (0.0%) | 0 (0.0%) |
| 1 or 2 Children | 0 (0.0%) | 23 (28.7%) |
| 3 or 4 Children | 0 (0.0%) | 0 (0.0%) |
| 5 or more Children | 0 (0.0%) | 0 (0.0%) |
| Total | 0 (0.0%) | 23 (12.9%) |
Income Below Poverty Among Married-Couple vs Single-Parent Households in Highland Lakes
The poverty data for Highland Lakes shows that 15 of the married-couple family households (1.8%) and 23 of the single-parent households (6.4%) are living below the poverty level. Within the married-couple family households, those with no children have the highest poverty rate, with 15 households (3.3%) falling below the poverty line. Among the single-parent households, those with 1 or 2 children have the highest poverty rate, with 23 household (11.7%) living below poverty.
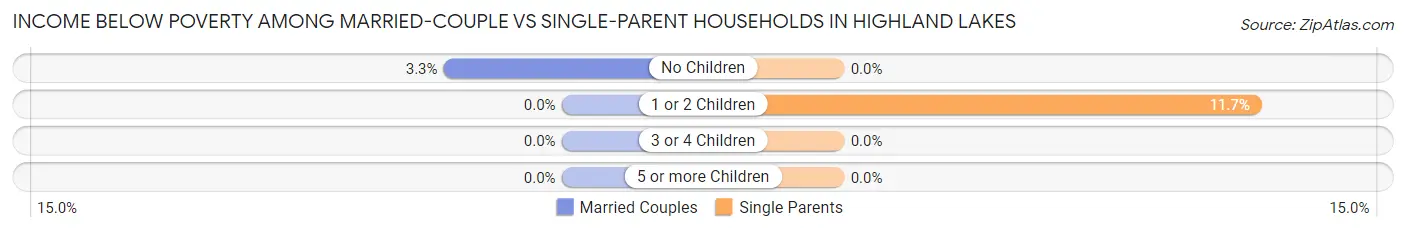
| Children | Married-Couple Families | Single-Parent Households |
| No Children | 15 (3.3%) | 0 (0.0%) |
| 1 or 2 Children | 0 (0.0%) | 23 (11.7%) |
| 3 or 4 Children | 0 (0.0%) | 0 (0.0%) |
| 5 or more Children | 0 (0.0%) | 0 (0.0%) |
| Total | 15 (1.8%) | 23 (6.4%) |
Race in Highland Lakes
The most populous races in Highland Lakes are White / Caucasian (3,823 | 93.5%), Hispanic or Latino (443 | 10.8%), and Two or more Races (213 | 5.2%).
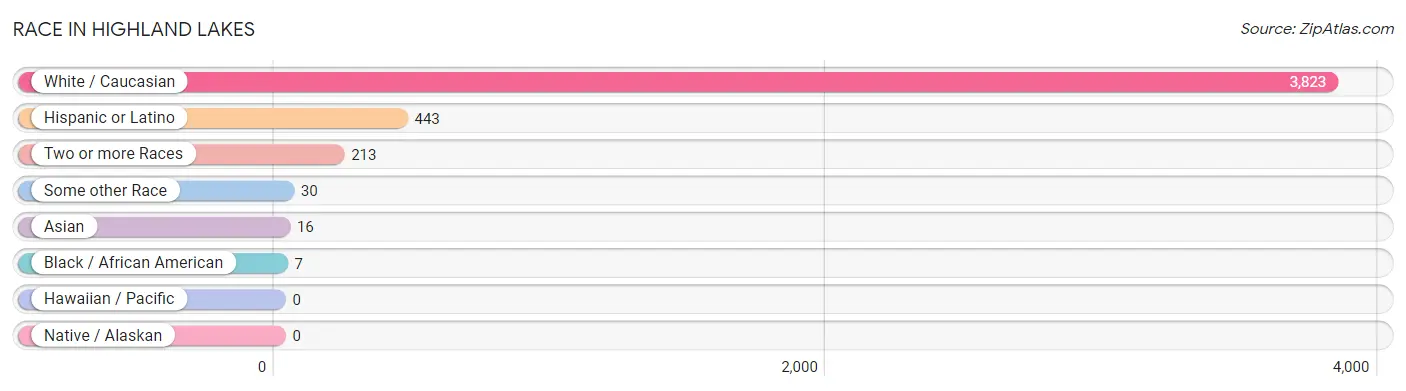
| Race | # Population | % Population |
| Asian | 16 | 0.4% |
| Black / African American | 7 | 0.2% |
| Hawaiian / Pacific | 0 | 0.0% |
| Hispanic or Latino | 443 | 10.8% |
| Native / Alaskan | 0 | 0.0% |
| White / Caucasian | 3,823 | 93.5% |
| Two or more Races | 213 | 5.2% |
| Some other Race | 30 | 0.7% |
| Total | 4,089 | 100.0% |
Ancestry in Highland Lakes
The most populous ancestries reported in Highland Lakes are Irish (1,066 | 26.1%), German (740 | 18.1%), Italian (722 | 17.7%), Polish (347 | 8.5%), and American (291 | 7.1%), together accounting for 77.4% of all Highland Lakes residents.
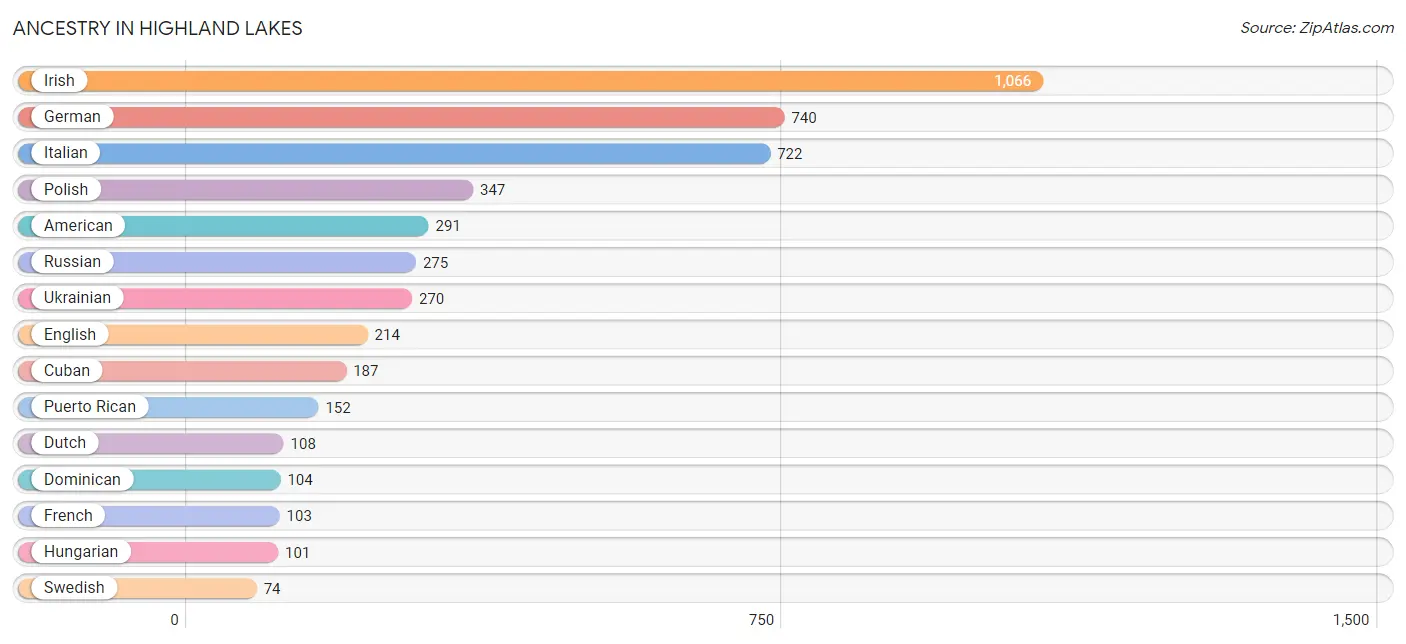
| Ancestry | # Population | % Population |
| American | 291 | 7.1% |
| Cherokee | 4 | 0.1% |
| Cuban | 187 | 4.6% |
| Czechoslovakian | 14 | 0.3% |
| Dominican | 104 | 2.5% |
| Dutch | 108 | 2.6% |
| Eastern European | 40 | 1.0% |
| English | 214 | 5.2% |
| European | 16 | 0.4% |
| Finnish | 13 | 0.3% |
| French | 103 | 2.5% |
| German | 740 | 18.1% |
| Hungarian | 101 | 2.5% |
| Indian (Asian) | 16 | 0.4% |
| Irish | 1,066 | 26.1% |
| Iroquois | 9 | 0.2% |
| Italian | 722 | 17.7% |
| Jamaican | 1 | 0.0% |
| Lithuanian | 6 | 0.2% |
| Native Hawaiian | 3 | 0.1% |
| Norwegian | 15 | 0.4% |
| Polish | 347 | 8.5% |
| Portuguese | 22 | 0.5% |
| Puerto Rican | 152 | 3.7% |
| Russian | 275 | 6.7% |
| Scottish | 46 | 1.1% |
| Swedish | 74 | 1.8% |
| Turkish | 15 | 0.4% |
| Ukrainian | 270 | 6.6% |
| Welsh | 13 | 0.3% |
| Yugoslavian | 9 | 0.2% | View All 31 Rows |
Immigrants in Highland Lakes
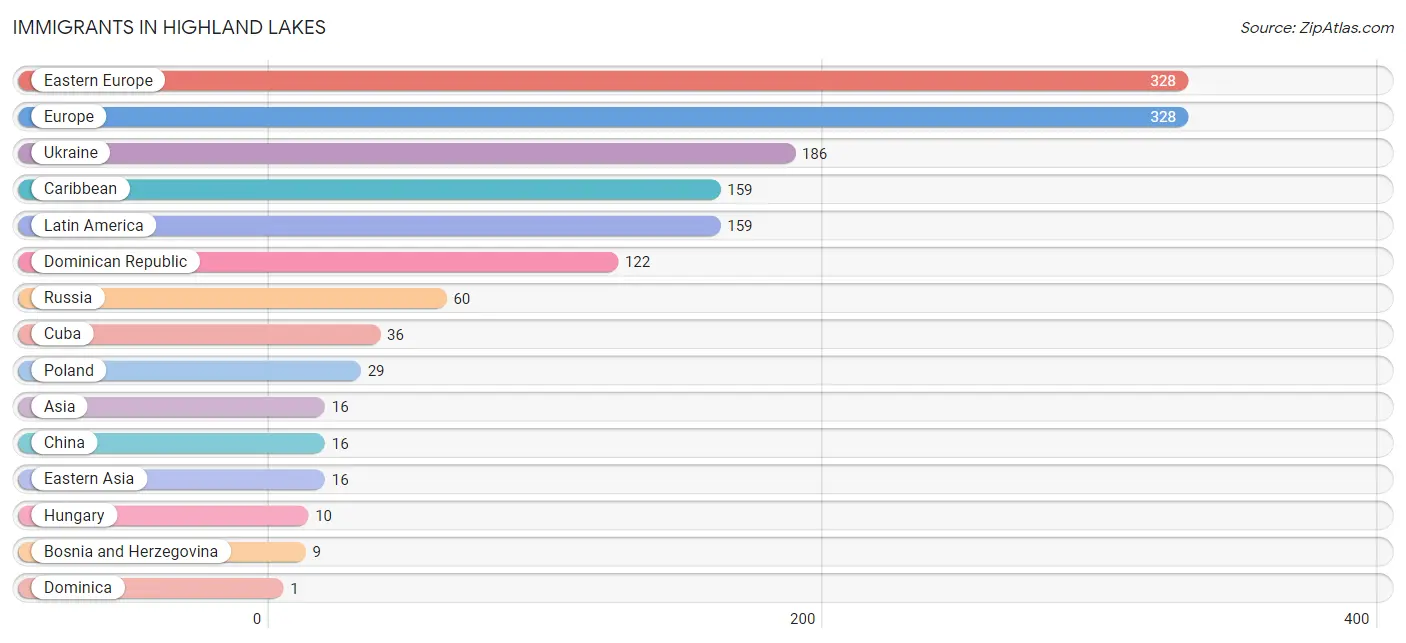
The most numerous immigrant groups reported in Highland Lakes came from Eastern Europe (328 | 8.0%), Europe (328 | 8.0%), Ukraine (186 | 4.5%), Caribbean (159 | 3.9%), and Latin America (159 | 3.9%), together accounting for 28.4% of all Highland Lakes residents.
| Immigration Origin | # Population | % Population |
| Asia | 16 | 0.4% |
| Bosnia and Herzegovina | 9 | 0.2% |
| Caribbean | 159 | 3.9% |
| China | 16 | 0.4% |
| Cuba | 36 | 0.9% |
| Dominica | 1 | 0.0% |
| Dominican Republic | 122 | 3.0% |
| Eastern Asia | 16 | 0.4% |
| Eastern Europe | 328 | 8.0% |
| Europe | 328 | 8.0% |
| Hungary | 10 | 0.2% |
| Latin America | 159 | 3.9% |
| Poland | 29 | 0.7% |
| Russia | 60 | 1.5% |
| Ukraine | 186 | 4.5% | View All 15 Rows |
Sex and Age in Highland Lakes
Sex and Age in Highland Lakes
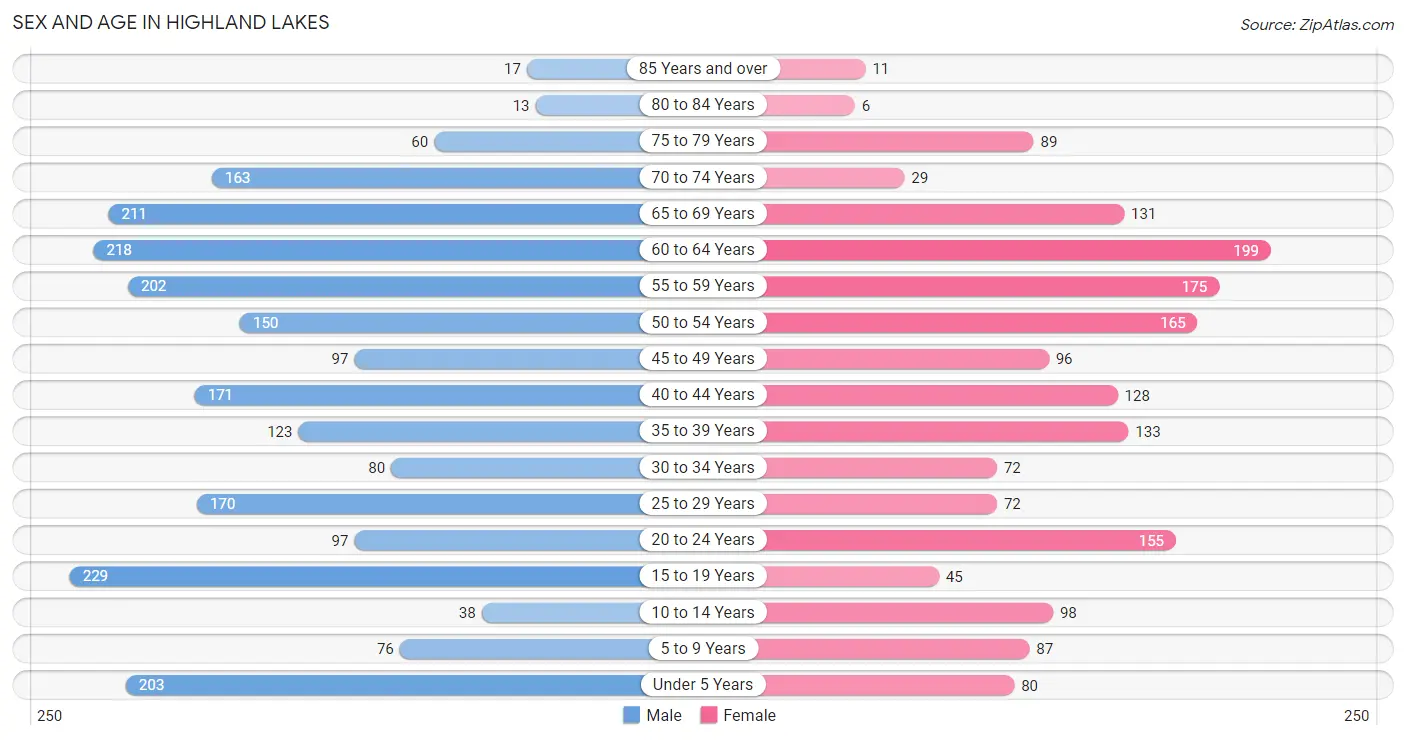
The most populous age groups in Highland Lakes are 15 to 19 Years (229 | 9.9%) for men and 60 to 64 Years (199 | 11.2%) for women.
| Age Bracket | Male | Female |
| Under 5 Years | 203 (8.8%) | 80 (4.5%) |
| 5 to 9 Years | 76 (3.3%) | 87 (4.9%) |
| 10 to 14 Years | 38 (1.6%) | 98 (5.5%) |
| 15 to 19 Years | 229 (9.9%) | 45 (2.5%) |
| 20 to 24 Years | 97 (4.2%) | 155 (8.7%) |
| 25 to 29 Years | 170 (7.3%) | 72 (4.1%) |
| 30 to 34 Years | 80 (3.5%) | 72 (4.1%) |
| 35 to 39 Years | 123 (5.3%) | 133 (7.5%) |
| 40 to 44 Years | 171 (7.4%) | 128 (7.2%) |
| 45 to 49 Years | 97 (4.2%) | 96 (5.4%) |
| 50 to 54 Years | 150 (6.5%) | 165 (9.3%) |
| 55 to 59 Years | 202 (8.7%) | 175 (9.9%) |
| 60 to 64 Years | 218 (9.4%) | 199 (11.2%) |
| 65 to 69 Years | 211 (9.1%) | 131 (7.4%) |
| 70 to 74 Years | 163 (7.0%) | 29 (1.6%) |
| 75 to 79 Years | 60 (2.6%) | 89 (5.0%) |
| 80 to 84 Years | 13 (0.6%) | 6 (0.3%) |
| 85 Years and over | 17 (0.7%) | 11 (0.6%) |
| Total | 2,318 (100.0%) | 1,771 (100.0%) |
Families and Households in Highland Lakes
Median Family Size in Highland Lakes
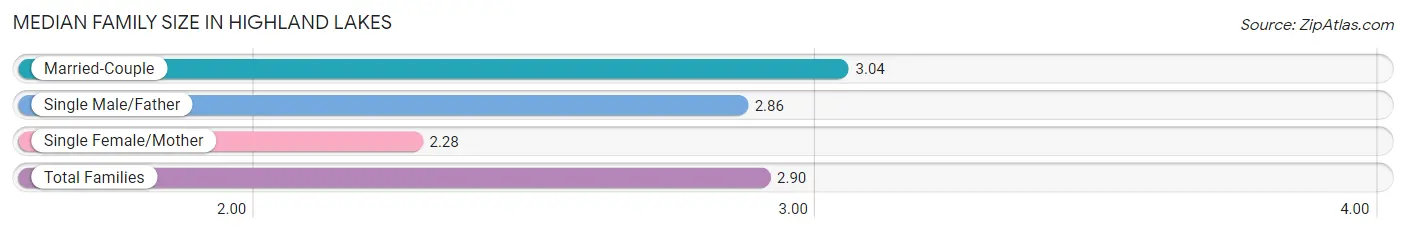
The median family size in Highland Lakes is 2.90 persons per family, with married-couple families (827 | 69.6%) accounting for the largest median family size of 3.04 persons per family. On the other hand, single female/mother families (178 | 15.0%) represent the smallest median family size with 2.28 persons per family.
| Family Type | # Families | Family Size |
| Married-Couple | 827 (69.6%) | 3.04 |
| Single Male/Father | 183 (15.4%) | 2.86 |
| Single Female/Mother | 178 (15.0%) | 2.28 |
| Total Families | 1,188 (100.0%) | 2.90 |
Median Household Size in Highland Lakes
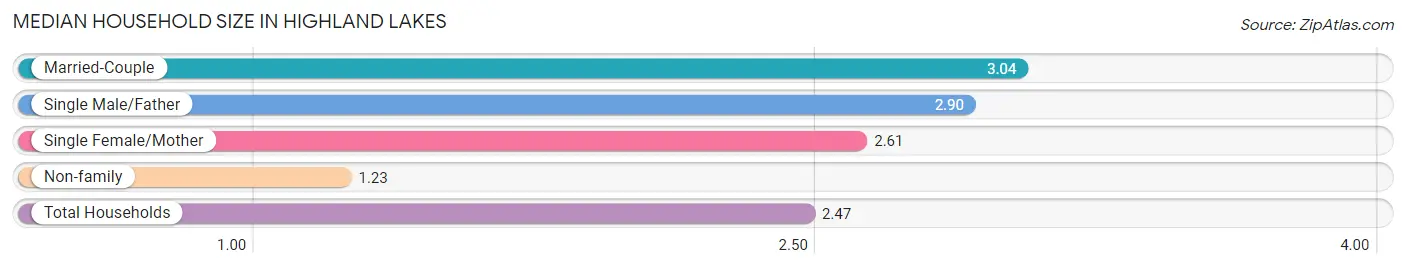
The median household size in Highland Lakes is 2.47 persons per household, with married-couple households (827 | 50.2%) accounting for the largest median household size of 3.04 persons per household. non-family households (459 | 27.9%) represent the smallest median household size with 1.23 persons per household.
| Household Type | # Households | Household Size |
| Married-Couple | 827 (50.2%) | 3.04 |
| Single Male/Father | 183 (11.1%) | 2.90 |
| Single Female/Mother | 178 (10.8%) | 2.61 |
| Non-family | 459 (27.9%) | 1.23 |
| Total Households | 1,647 (100.0%) | 2.47 |
Household Size by Marriage Status in Highland Lakes
Out of a total of 1,647 households in Highland Lakes, 1,188 (72.1%) are family households, while 459 (27.9%) are nonfamily households. The most numerous type of family households are 3-person households, comprising 510, and the most common type of nonfamily households are 1-person households, comprising 339.
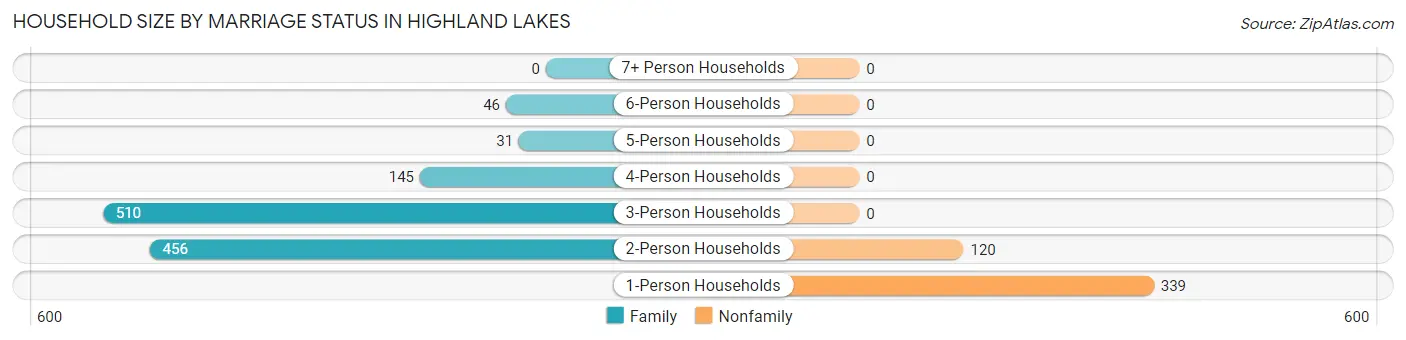
| Household Size | Family Households | Nonfamily Households |
| 1-Person Households | - | 339 (20.6%) |
| 2-Person Households | 456 (27.7%) | 120 (7.3%) |
| 3-Person Households | 510 (31.0%) | 0 (0.0%) |
| 4-Person Households | 145 (8.8%) | 0 (0.0%) |
| 5-Person Households | 31 (1.9%) | 0 (0.0%) |
| 6-Person Households | 46 (2.8%) | 0 (0.0%) |
| 7+ Person Households | 0 (0.0%) | 0 (0.0%) |
| Total | 1,188 (72.1%) | 459 (27.9%) |
Female Fertility in Highland Lakes
Fertility by Age in Highland Lakes
Average fertility rate in Highland Lakes is 202.0 births per 1,000 women. Women in the age bracket of 35 to 50 years have the highest fertility rate with 303.0 births per 1,000 women. Women in the age bracket of 35 to 50 years acount for 80.7% of all women with births.
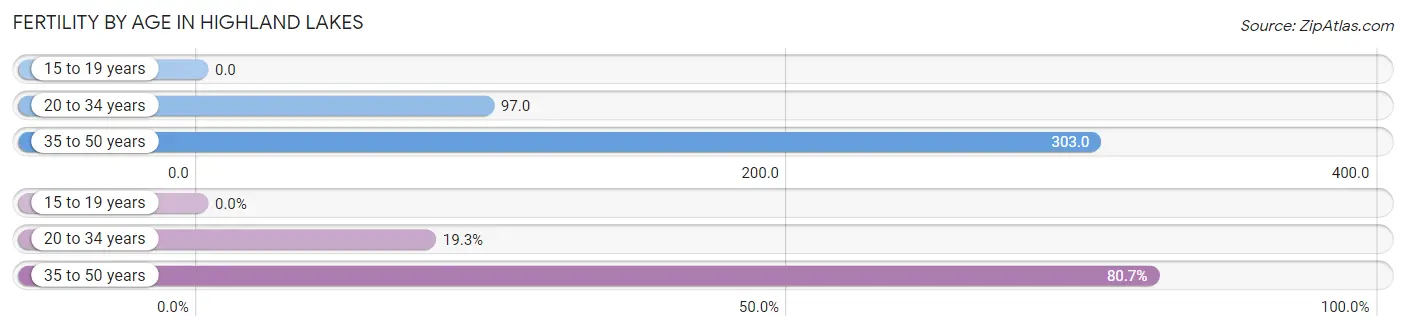
| Age Bracket | Women with Births | Births / 1,000 Women |
| 15 to 19 years | 0 (0.0%) | 0.0 |
| 20 to 34 years | 29 (19.3%) | 97.0 |
| 35 to 50 years | 121 (80.7%) | 303.0 |
| Total | 150 (100.0%) | 202.0 |
Fertility by Age by Marriage Status in Highland Lakes
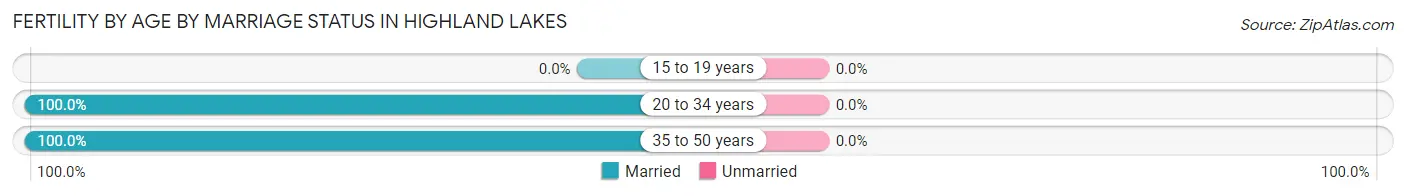
| Age Bracket | Married | Unmarried |
| 15 to 19 years | 0 (0.0%) | 0 (0.0%) |
| 20 to 34 years | 29 (100.0%) | 0 (0.0%) |
| 35 to 50 years | 121 (100.0%) | 0 (0.0%) |
| Total | 150 (100.0%) | 0 (0.0%) |
Fertility by Education in Highland Lakes
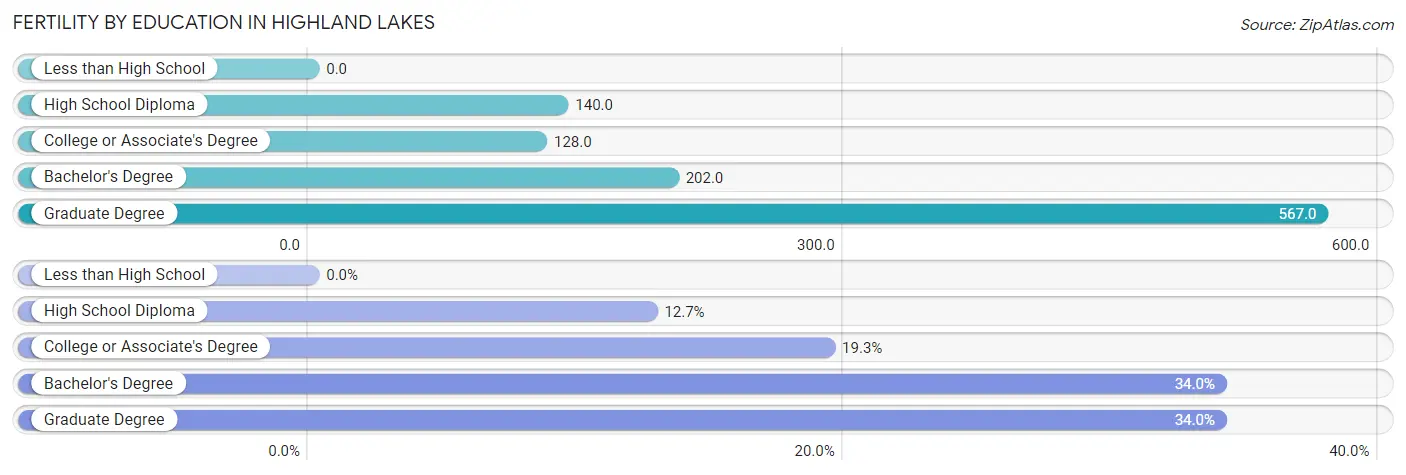
| Educational Attainment | Women with Births | Births / 1,000 Women |
| Less than High School | 0 (0.0%) | 0.0 |
| High School Diploma | 19 (12.7%) | 140.0 |
| College or Associate's Degree | 29 (19.3%) | 128.0 |
| Bachelor's Degree | 51 (34.0%) | 202.0 |
| Graduate Degree | 51 (34.0%) | 567.0 |
| Total | 150 (100.0%) | 202.0 |
Fertility by Education by Marriage Status in Highland Lakes
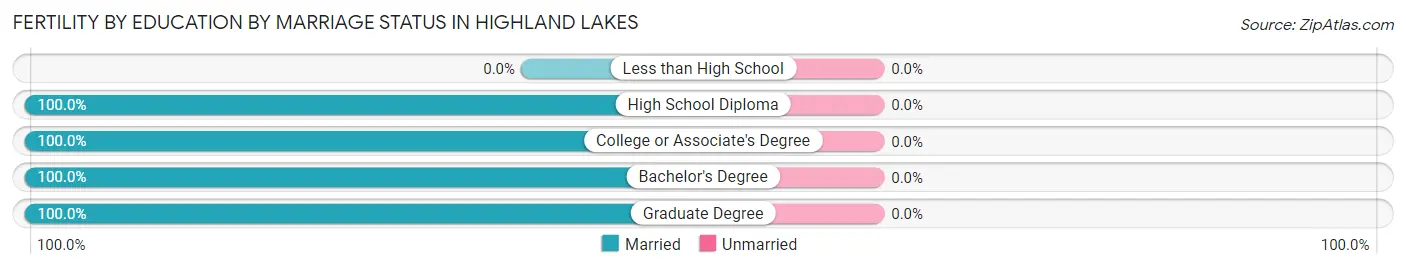
| Educational Attainment | Married | Unmarried |
| Less than High School | 0 (0.0%) | 0 (0.0%) |
| High School Diploma | 19 (100.0%) | 0 (0.0%) |
| College or Associate's Degree | 29 (100.0%) | 0 (0.0%) |
| Bachelor's Degree | 51 (100.0%) | 0 (0.0%) |
| Graduate Degree | 51 (100.0%) | 0 (0.0%) |
| Total | 150 (100.0%) | 0 (0.0%) |
Employment Characteristics in Highland Lakes
Employment by Class of Employer in Highland Lakes
Among the 2,308 employed individuals in Highland Lakes, private company employees (1,685 | 73.0%), local government employees (218 | 9.5%), and not-for-profit organizations (165 | 7.1%) make up the most common classes of employment.
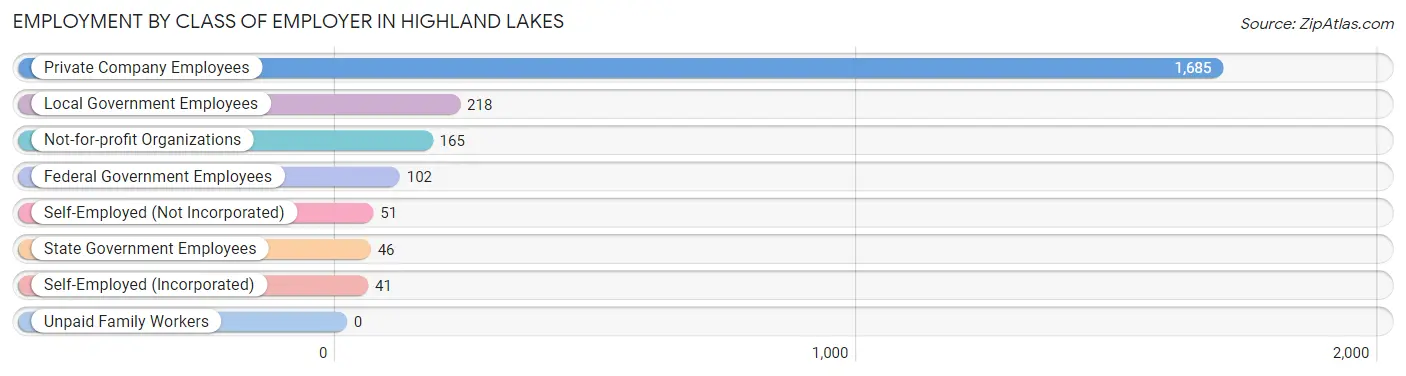
| Employer Class | # Employees | % Employees |
| Private Company Employees | 1,685 | 73.0% |
| Self-Employed (Incorporated) | 41 | 1.8% |
| Self-Employed (Not Incorporated) | 51 | 2.2% |
| Not-for-profit Organizations | 165 | 7.1% |
| Local Government Employees | 218 | 9.5% |
| State Government Employees | 46 | 2.0% |
| Federal Government Employees | 102 | 4.4% |
| Unpaid Family Workers | 0 | 0.0% |
| Total | 2,308 | 100.0% |
Employment Status by Age in Highland Lakes
According to the labor force statistics for Highland Lakes, out of the total population over 16 years of age (3,479), 75.9% or 2,641 individuals are in the labor force, with 9.5% or 251 of them unemployed. The age group with the highest labor force participation rate is 20 to 24 years, with 100.0% or 252 individuals in the labor force. Within the labor force, the 16 to 19 years age range has the highest percentage of unemployed individuals, with 78.3% or 72 of them being unemployed.
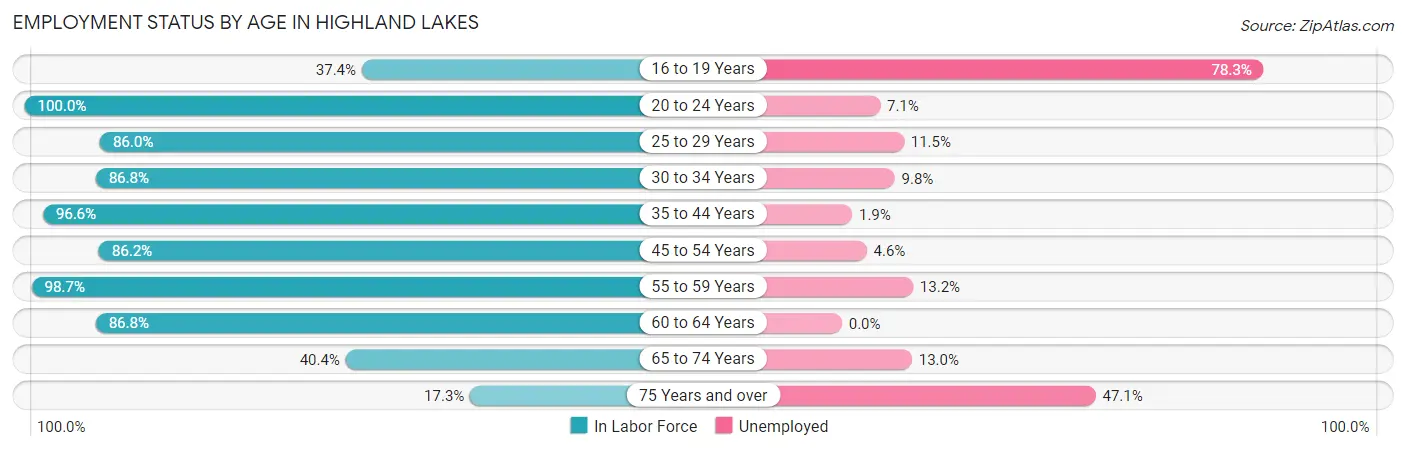
| Age Bracket | In Labor Force | Unemployed |
| 16 to 19 Years | 92 (37.4%) | 72 (78.3%) |
| 20 to 24 Years | 252 (100.0%) | 18 (7.1%) |
| 25 to 29 Years | 208 (86.0%) | 24 (11.5%) |
| 30 to 34 Years | 132 (86.8%) | 13 (9.8%) |
| 35 to 44 Years | 536 (96.6%) | 10 (1.9%) |
| 45 to 54 Years | 438 (86.2%) | 20 (4.6%) |
| 55 to 59 Years | 372 (98.7%) | 49 (13.2%) |
| 60 to 64 Years | 362 (86.8%) | 0 (0.0%) |
| 65 to 74 Years | 216 (40.4%) | 28 (13.0%) |
| 75 Years and over | 34 (17.3%) | 16 (47.1%) |
| Total | 2,641 (75.9%) | 251 (9.5%) |
Employment Status by Educational Attainment in Highland Lakes
According to labor force statistics for Highland Lakes, 91.0% of individuals (2,048) out of the total population between 25 and 64 years of age (2,251) are in the labor force, with 5.7% or 117 of them being unemployed. The group with the highest labor force participation rate are those with the educational attainment of high school diploma, with 96.0% or 618 individuals in the labor force. Within the labor force, individuals with high school diploma education have the highest percentage of unemployment, with 10.4% or 64 of them being unemployed.
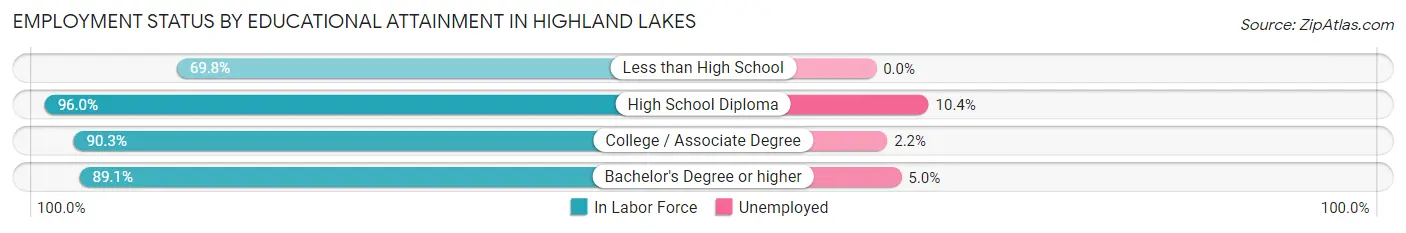
| Educational Attainment | In Labor Force | Unemployed |
| Less than High School | 37 (69.8%) | 0 (0.0%) |
| High School Diploma | 618 (96.0%) | 67 (10.4%) |
| College / Associate Degree | 631 (90.3%) | 15 (2.2%) |
| Bachelor's Degree or higher | 762 (89.1%) | 43 (5.0%) |
| Total | 2,048 (91.0%) | 128 (5.7%) |
Employment Occupations by Sex in Highland Lakes
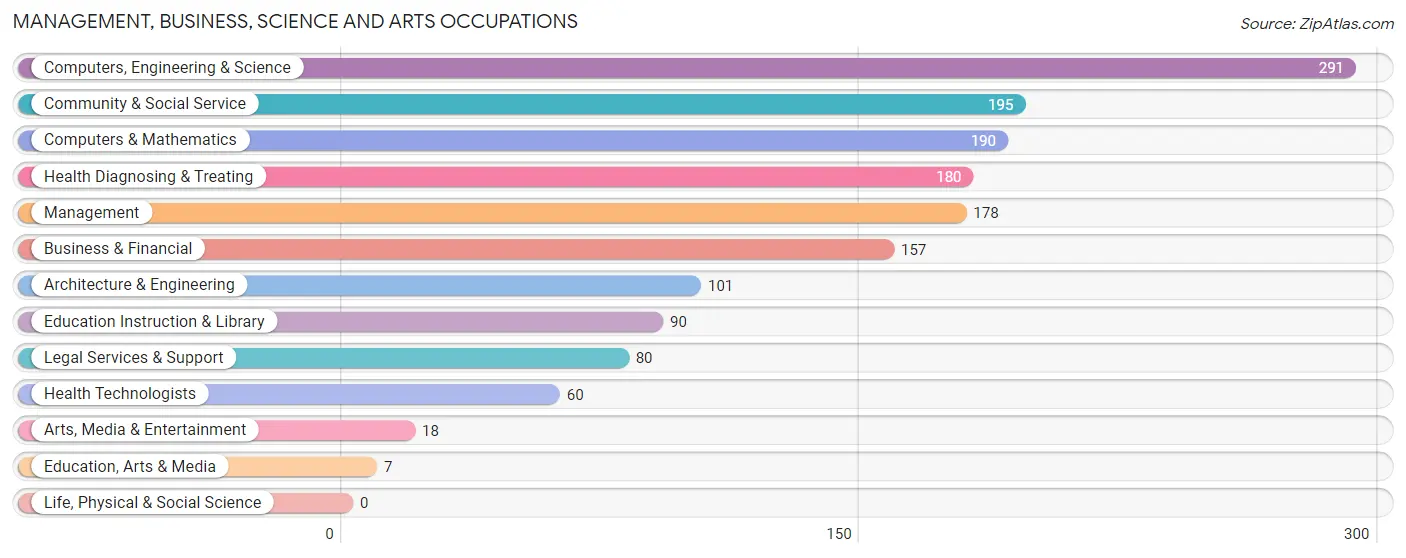
Management, Business, Science and Arts Occupations
The most common Management, Business, Science and Arts occupations in Highland Lakes are Computers, Engineering & Science (291 | 12.2%), Community & Social Service (195 | 8.2%), Computers & Mathematics (190 | 7.9%), Health Diagnosing & Treating (180 | 7.5%), and Management (178 | 7.4%).
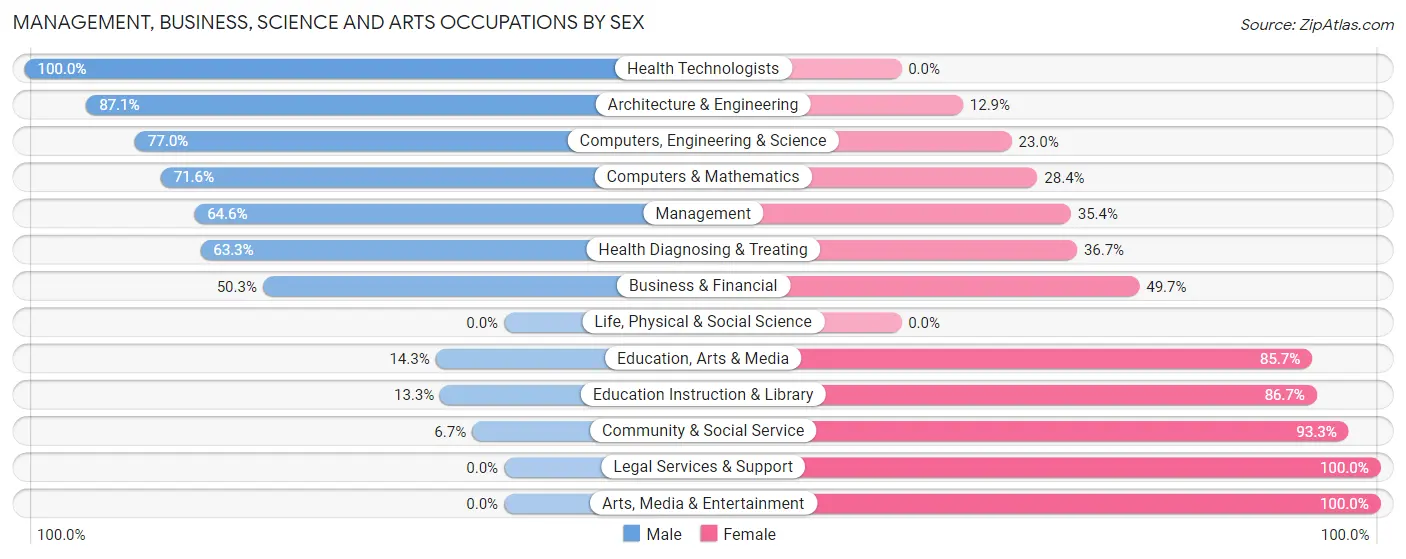
Management, Business, Science and Arts Occupations by Sex
Within the Management, Business, Science and Arts occupations in Highland Lakes, the most male-oriented occupations are Health Technologists (100.0%), Architecture & Engineering (87.1%), and Computers, Engineering & Science (77.0%), while the most female-oriented occupations are Legal Services & Support (100.0%), Arts, Media & Entertainment (100.0%), and Community & Social Service (93.3%).
| Occupation | Male | Female |
| Management | 115 (64.6%) | 63 (35.4%) |
| Business & Financial | 79 (50.3%) | 78 (49.7%) |
| Computers, Engineering & Science | 224 (77.0%) | 67 (23.0%) |
| Computers & Mathematics | 136 (71.6%) | 54 (28.4%) |
| Architecture & Engineering | 88 (87.1%) | 13 (12.9%) |
| Life, Physical & Social Science | 0 (0.0%) | 0 (0.0%) |
| Community & Social Service | 13 (6.7%) | 182 (93.3%) |
| Education, Arts & Media | 1 (14.3%) | 6 (85.7%) |
| Legal Services & Support | 0 (0.0%) | 80 (100.0%) |
| Education Instruction & Library | 12 (13.3%) | 78 (86.7%) |
| Arts, Media & Entertainment | 0 (0.0%) | 18 (100.0%) |
| Health Diagnosing & Treating | 114 (63.3%) | 66 (36.7%) |
| Health Technologists | 60 (100.0%) | 0 (0.0%) |
| Total (Category) | 545 (54.4%) | 456 (45.6%) |
| Total (Overall) | 1,342 (56.1%) | 1,050 (43.9%) |
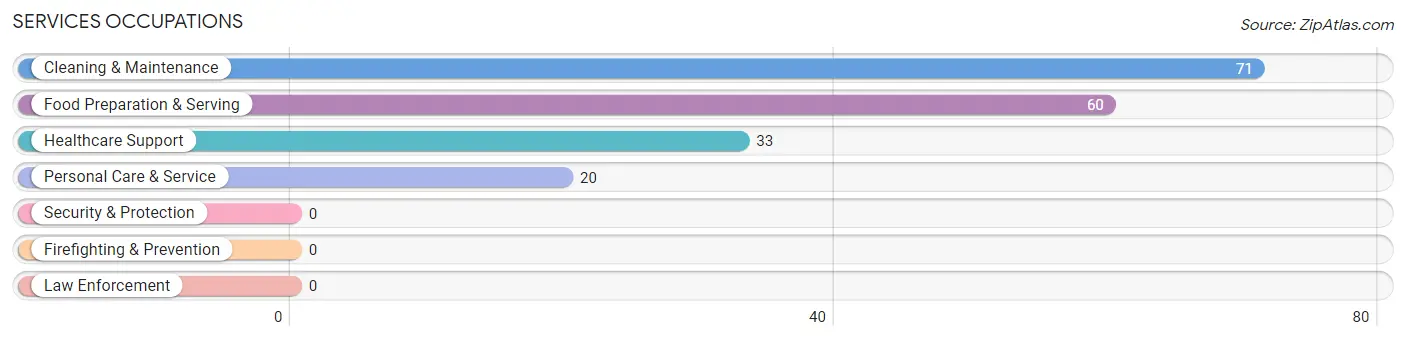
Services Occupations
The most common Services occupations in Highland Lakes are Cleaning & Maintenance (71 | 3.0%), Food Preparation & Serving (60 | 2.5%), Healthcare Support (33 | 1.4%), and Personal Care & Service (20 | 0.8%).
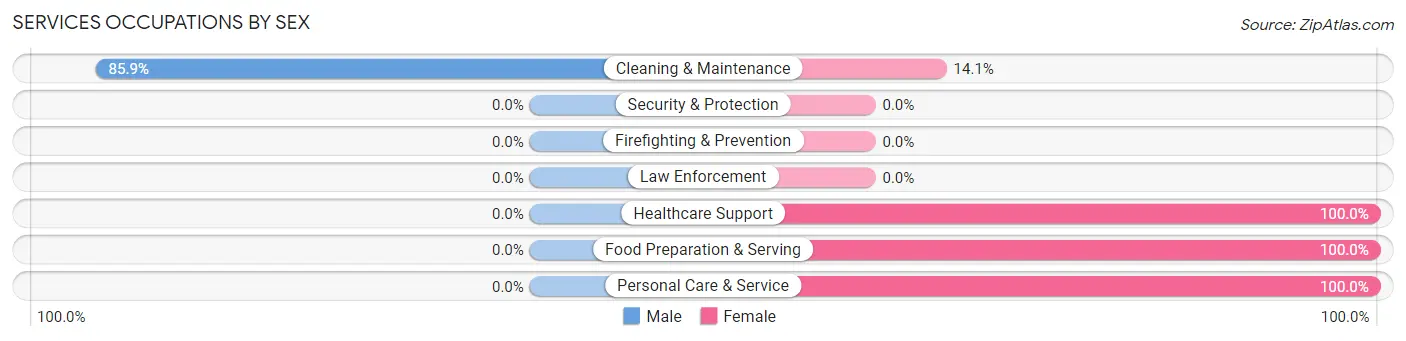
Services Occupations by Sex
| Occupation | Male | Female |
| Healthcare Support | 0 (0.0%) | 33 (100.0%) |
| Security & Protection | 0 (0.0%) | 0 (0.0%) |
| Firefighting & Prevention | 0 (0.0%) | 0 (0.0%) |
| Law Enforcement | 0 (0.0%) | 0 (0.0%) |
| Food Preparation & Serving | 0 (0.0%) | 60 (100.0%) |
| Cleaning & Maintenance | 61 (85.9%) | 10 (14.1%) |
| Personal Care & Service | 0 (0.0%) | 20 (100.0%) |
| Total (Category) | 61 (33.2%) | 123 (66.8%) |
| Total (Overall) | 1,342 (56.1%) | 1,050 (43.9%) |
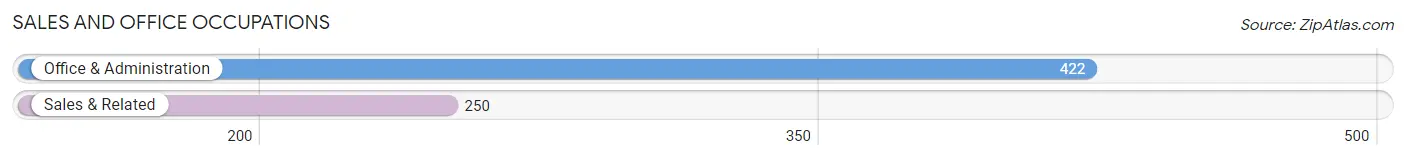
Sales and Office Occupations
The most common Sales and Office occupations in Highland Lakes are Office & Administration (422 | 17.6%), and Sales & Related (250 | 10.4%).
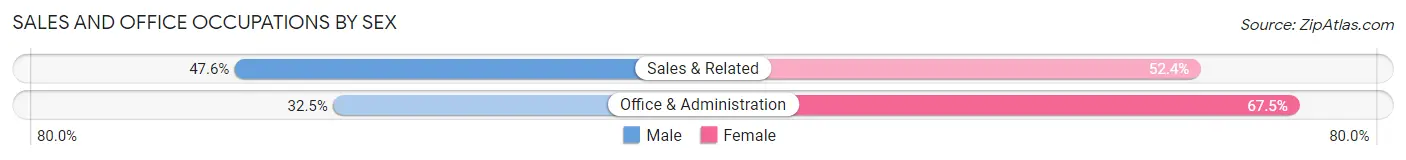
Sales and Office Occupations by Sex
| Occupation | Male | Female |
| Sales & Related | 119 (47.6%) | 131 (52.4%) |
| Office & Administration | 137 (32.5%) | 285 (67.5%) |
| Total (Category) | 256 (38.1%) | 416 (61.9%) |
| Total (Overall) | 1,342 (56.1%) | 1,050 (43.9%) |
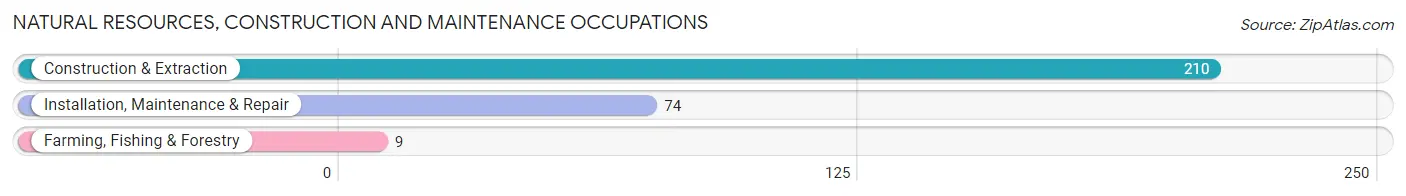
Natural Resources, Construction and Maintenance Occupations
The most common Natural Resources, Construction and Maintenance occupations in Highland Lakes are Construction & Extraction (210 | 8.8%), Installation, Maintenance & Repair (74 | 3.1%), and Farming, Fishing & Forestry (9 | 0.4%).
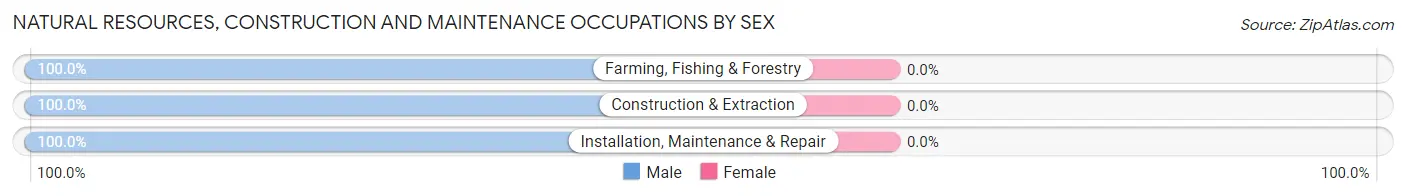
Natural Resources, Construction and Maintenance Occupations by Sex
| Occupation | Male | Female |
| Farming, Fishing & Forestry | 9 (100.0%) | 0 (0.0%) |
| Construction & Extraction | 210 (100.0%) | 0 (0.0%) |
| Installation, Maintenance & Repair | 74 (100.0%) | 0 (0.0%) |
| Total (Category) | 293 (100.0%) | 0 (0.0%) |
| Total (Overall) | 1,342 (56.1%) | 1,050 (43.9%) |
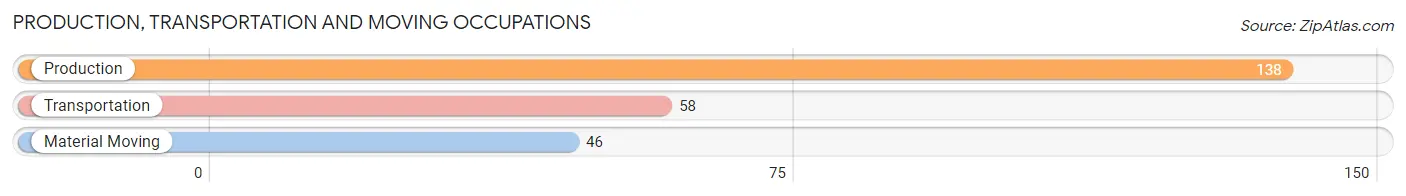
Production, Transportation and Moving Occupations
The most common Production, Transportation and Moving occupations in Highland Lakes are Production (138 | 5.8%), Transportation (58 | 2.4%), and Material Moving (46 | 1.9%).
Production, Transportation and Moving Occupations by Sex
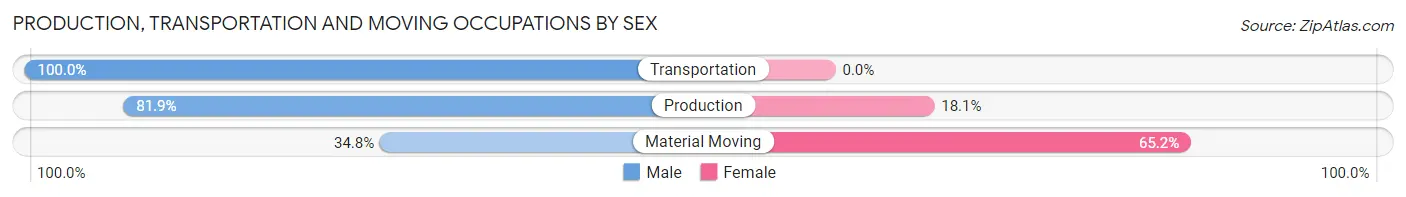
| Occupation | Male | Female |
| Production | 113 (81.9%) | 25 (18.1%) |
| Transportation | 58 (100.0%) | 0 (0.0%) |
| Material Moving | 16 (34.8%) | 30 (65.2%) |
| Total (Category) | 187 (77.3%) | 55 (22.7%) |
| Total (Overall) | 1,342 (56.1%) | 1,050 (43.9%) |
Employment Industries by Sex in Highland Lakes
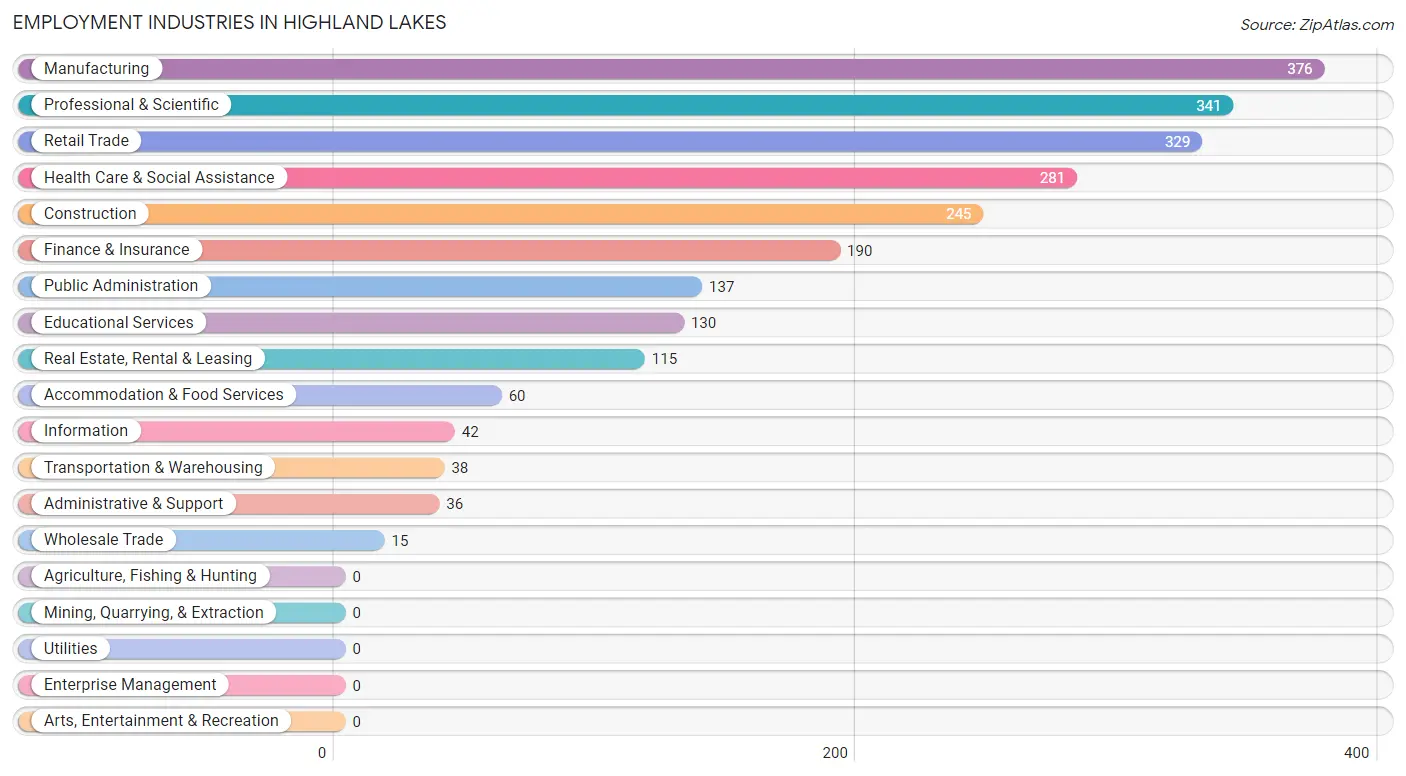
Employment Industries in Highland Lakes
The major employment industries in Highland Lakes include Manufacturing (376 | 15.7%), Professional & Scientific (341 | 14.3%), Retail Trade (329 | 13.8%), Health Care & Social Assistance (281 | 11.7%), and Construction (245 | 10.2%).
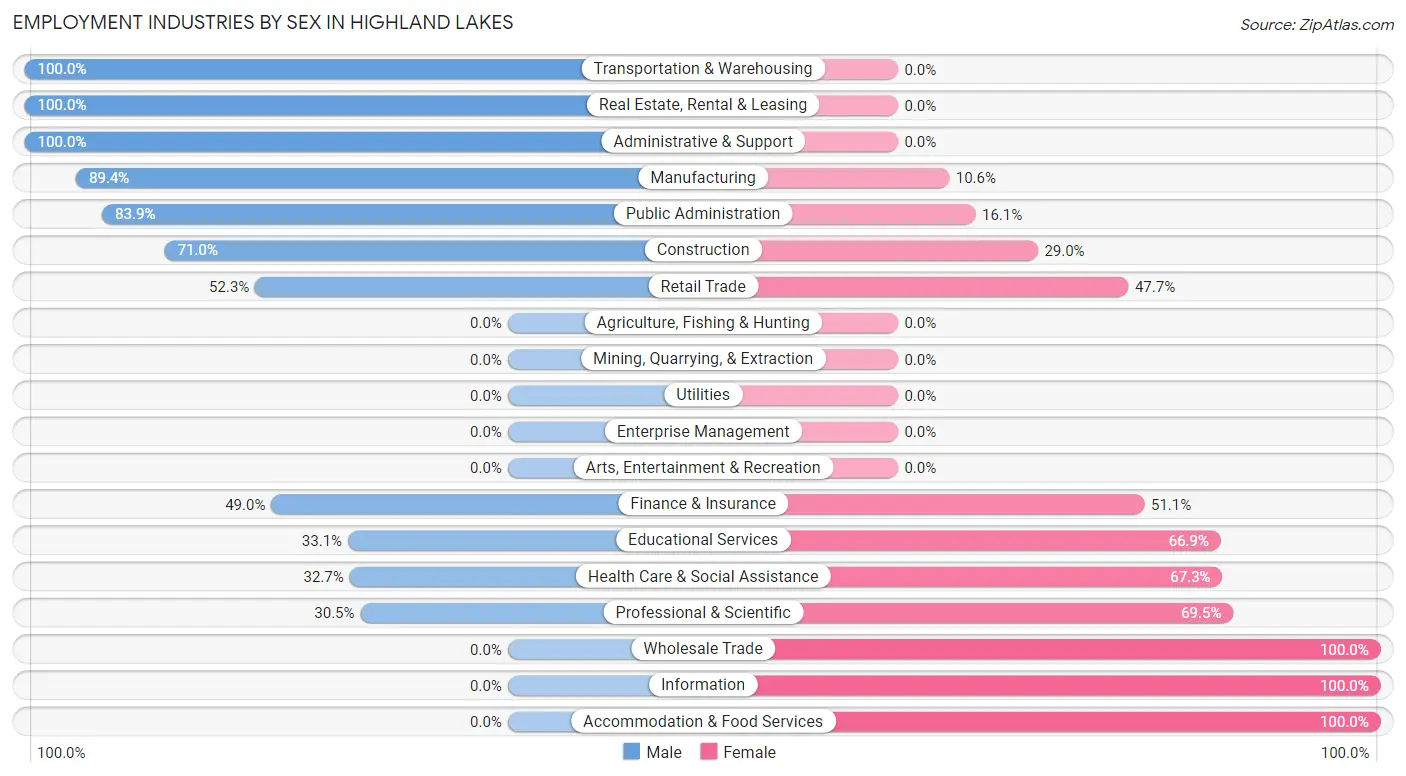
Employment Industries by Sex in Highland Lakes
The Highland Lakes industries that see more men than women are Transportation & Warehousing (100.0%), Real Estate, Rental & Leasing (100.0%), and Administrative & Support (100.0%), whereas the industries that tend to have a higher number of women are Wholesale Trade (100.0%), Information (100.0%), and Accommodation & Food Services (100.0%).
| Industry | Male | Female |
| Agriculture, Fishing & Hunting | 0 (0.0%) | 0 (0.0%) |
| Mining, Quarrying, & Extraction | 0 (0.0%) | 0 (0.0%) |
| Construction | 174 (71.0%) | 71 (29.0%) |
| Manufacturing | 336 (89.4%) | 40 (10.6%) |
| Wholesale Trade | 0 (0.0%) | 15 (100.0%) |
| Retail Trade | 172 (52.3%) | 157 (47.7%) |
| Transportation & Warehousing | 38 (100.0%) | 0 (0.0%) |
| Utilities | 0 (0.0%) | 0 (0.0%) |
| Information | 0 (0.0%) | 42 (100.0%) |
| Finance & Insurance | 93 (48.9%) | 97 (51.0%) |
| Real Estate, Rental & Leasing | 115 (100.0%) | 0 (0.0%) |
| Professional & Scientific | 104 (30.5%) | 237 (69.5%) |
| Enterprise Management | 0 (0.0%) | 0 (0.0%) |
| Administrative & Support | 36 (100.0%) | 0 (0.0%) |
| Educational Services | 43 (33.1%) | 87 (66.9%) |
| Health Care & Social Assistance | 92 (32.7%) | 189 (67.3%) |
| Arts, Entertainment & Recreation | 0 (0.0%) | 0 (0.0%) |
| Accommodation & Food Services | 0 (0.0%) | 60 (100.0%) |
| Public Administration | 115 (83.9%) | 22 (16.1%) |
| Total | 1,342 (56.1%) | 1,050 (43.9%) |
Education in Highland Lakes
School Enrollment in Highland Lakes
The most common levels of schooling among the 779 students in Highland Lakes are high school (225 | 28.9%), college / undergraduate (206 | 26.4%), and middle school (117 | 15.0%).
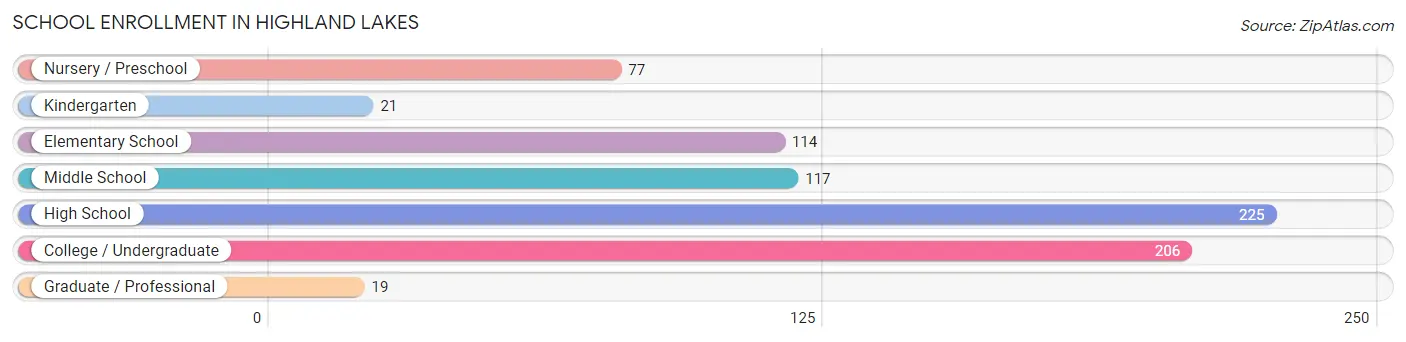
| School Level | # Students | % Students |
| Nursery / Preschool | 77 | 9.9% |
| Kindergarten | 21 | 2.7% |
| Elementary School | 114 | 14.6% |
| Middle School | 117 | 15.0% |
| High School | 225 | 28.9% |
| College / Undergraduate | 206 | 26.4% |
| Graduate / Professional | 19 | 2.4% |
| Total | 779 | 100.0% |
School Enrollment by Age by Funding Source in Highland Lakes
Out of a total of 779 students who are enrolled in schools in Highland Lakes, 133 (17.1%) attend a private institution, while the remaining 646 (82.9%) are enrolled in public schools. The age group of 3 to 4 year olds has the highest likelihood of being enrolled in private schools, with 49 (100.0% in the age bracket) enrolled. Conversely, the age group of 10 to 14 year olds has the lowest likelihood of being enrolled in a private school, with 136 (100.0% in the age bracket) attending a public institution.
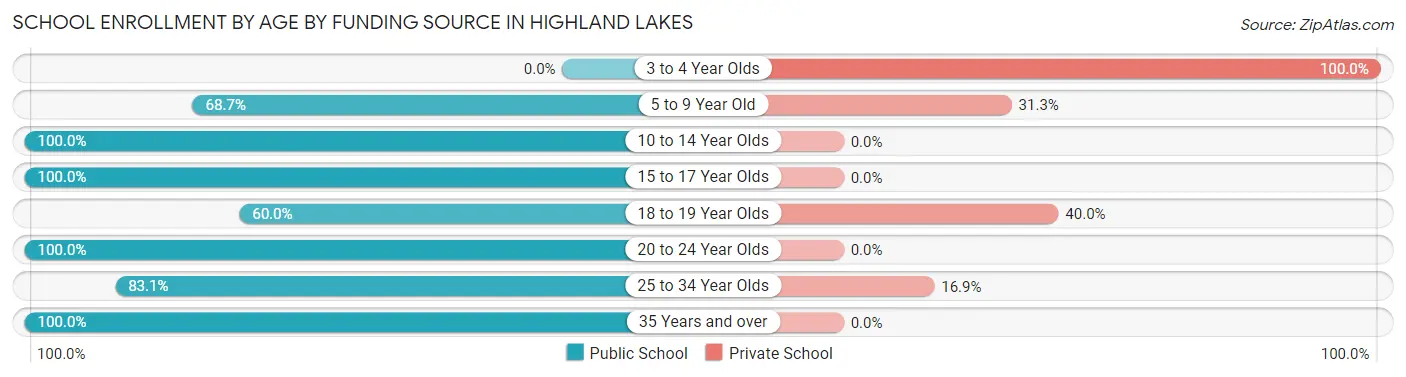
| Age Bracket | Public School | Private School |
| 3 to 4 Year Olds | 0 (0.0%) | 49 (100.0%) |
| 5 to 9 Year Old | 112 (68.7%) | 51 (31.3%) |
| 10 to 14 Year Olds | 136 (100.0%) | 0 (0.0%) |
| 15 to 17 Year Olds | 206 (100.0%) | 0 (0.0%) |
| 18 to 19 Year Olds | 30 (60.0%) | 20 (40.0%) |
| 20 to 24 Year Olds | 79 (100.0%) | 0 (0.0%) |
| 25 to 34 Year Olds | 64 (83.1%) | 13 (16.9%) |
| 35 Years and over | 19 (100.0%) | 0 (0.0%) |
| Total | 646 (82.9%) | 133 (17.1%) |
Educational Attainment by Field of Study in Highland Lakes
Business (272 | 17.6%), science & technology (161 | 10.4%), social sciences (158 | 10.2%), liberal arts & history (156 | 10.1%), and literature & languages (128 | 8.3%) are the most common fields of study among 1,549 individuals in Highland Lakes who have obtained a bachelor's degree or higher.
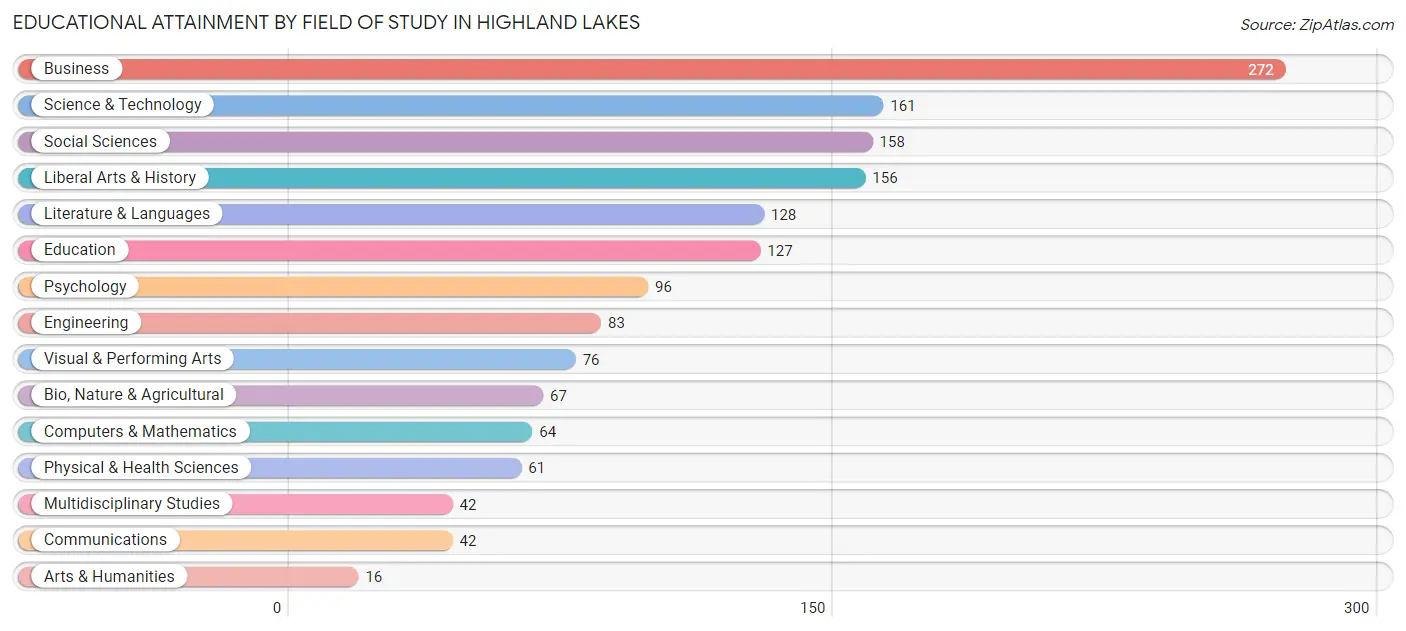
| Field of Study | # Graduates | % Graduates |
| Computers & Mathematics | 64 | 4.1% |
| Bio, Nature & Agricultural | 67 | 4.3% |
| Physical & Health Sciences | 61 | 3.9% |
| Psychology | 96 | 6.2% |
| Social Sciences | 158 | 10.2% |
| Engineering | 83 | 5.4% |
| Multidisciplinary Studies | 42 | 2.7% |
| Science & Technology | 161 | 10.4% |
| Business | 272 | 17.6% |
| Education | 127 | 8.2% |
| Literature & Languages | 128 | 8.3% |
| Liberal Arts & History | 156 | 10.1% |
| Visual & Performing Arts | 76 | 4.9% |
| Communications | 42 | 2.7% |
| Arts & Humanities | 16 | 1.0% |
| Total | 1,549 | 100.0% |
Transportation & Commute in Highland Lakes
Vehicle Availability by Sex in Highland Lakes
The most prevalent vehicle ownership categories in Highland Lakes are males with 2 vehicles (468, accounting for 36.1%) and females with 2 vehicles (374, making up 46.4%).
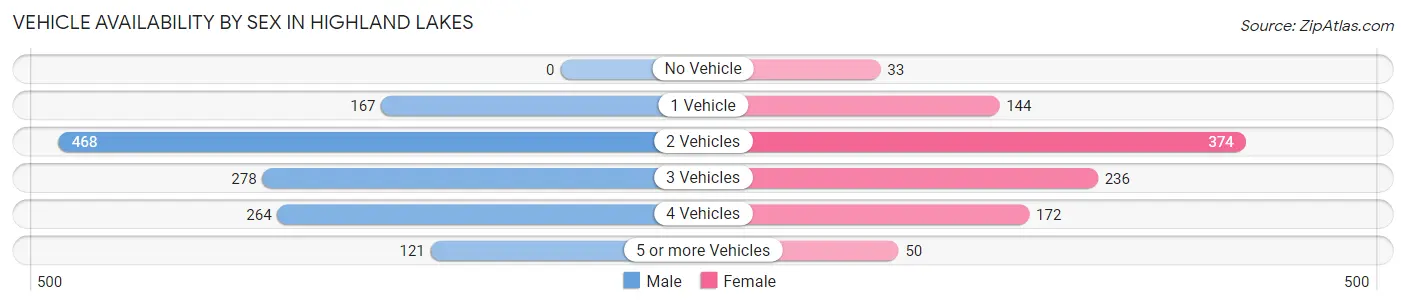
| Vehicles Available | Male | Female |
| No Vehicle | 0 (0.0%) | 33 (3.3%) |
| 1 Vehicle | 167 (12.9%) | 144 (14.3%) |
| 2 Vehicles | 468 (36.1%) | 374 (37.1%) |
| 3 Vehicles | 278 (21.4%) | 236 (23.4%) |
| 4 Vehicles | 264 (20.3%) | 172 (17.1%) |
| 5 or more Vehicles | 121 (9.3%) | 50 (5.0%) |
| Total | 1,298 (100.0%) | 1,009 (100.0%) |
Commute Time in Highland Lakes
The most frequently occuring commute durations in Highland Lakes are 60 to 89 minutes (462 commuters, 24.6%), 45 to 59 minutes (419 commuters, 22.4%), and 40 to 44 minutes (237 commuters, 12.6%).
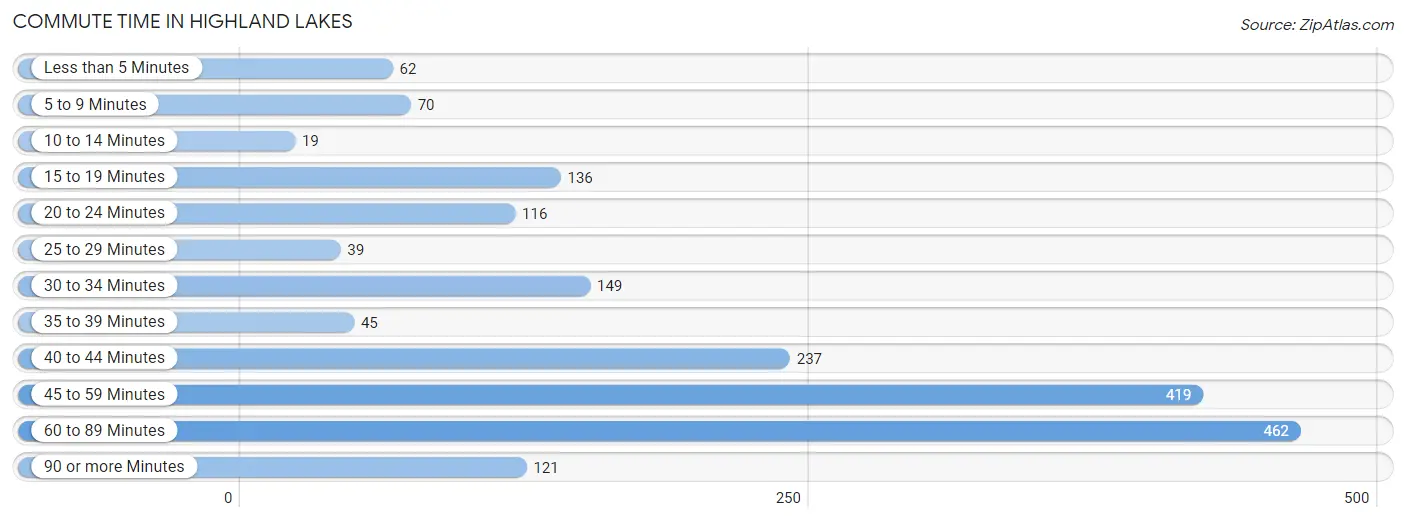
| Commute Time | # Commuters | % Commuters |
| Less than 5 Minutes | 62 | 3.3% |
| 5 to 9 Minutes | 70 | 3.7% |
| 10 to 14 Minutes | 19 | 1.0% |
| 15 to 19 Minutes | 136 | 7.2% |
| 20 to 24 Minutes | 116 | 6.2% |
| 25 to 29 Minutes | 39 | 2.1% |
| 30 to 34 Minutes | 149 | 8.0% |
| 35 to 39 Minutes | 45 | 2.4% |
| 40 to 44 Minutes | 237 | 12.6% |
| 45 to 59 Minutes | 419 | 22.4% |
| 60 to 89 Minutes | 462 | 24.6% |
| 90 or more Minutes | 121 | 6.5% |
Commute Time by Sex in Highland Lakes
The most common commute times in Highland Lakes are 45 to 59 minutes (284 commuters, 26.2%) for males and 60 to 89 minutes (197 commuters, 24.9%) for females.
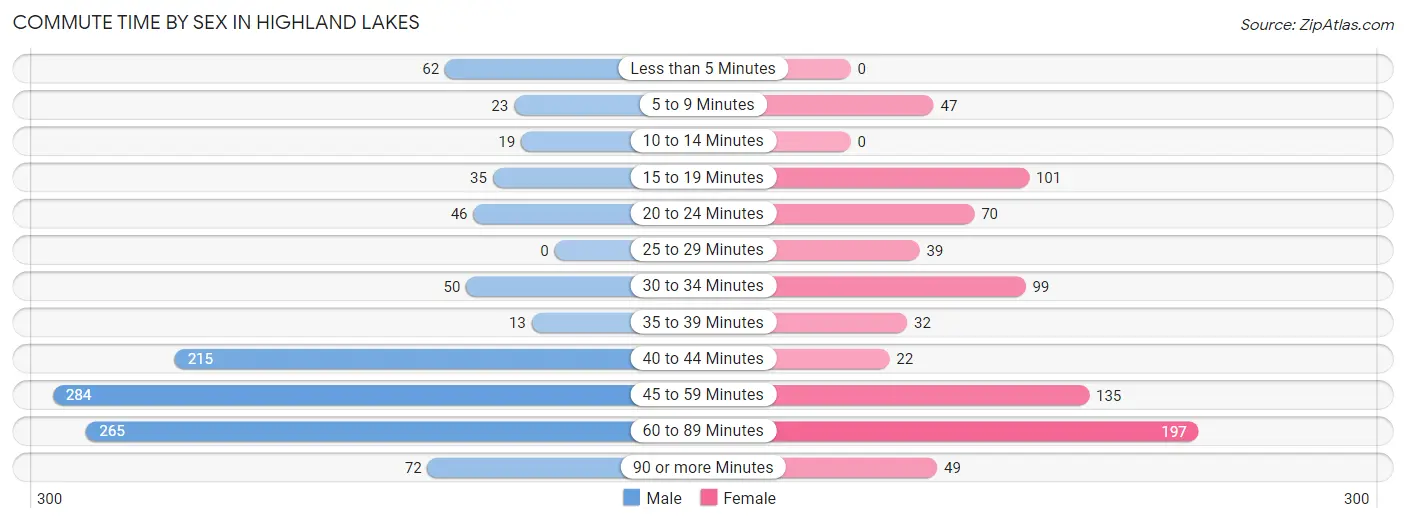
| Commute Time | Male | Female |
| Less than 5 Minutes | 62 (5.7%) | 0 (0.0%) |
| 5 to 9 Minutes | 23 (2.1%) | 47 (5.9%) |
| 10 to 14 Minutes | 19 (1.8%) | 0 (0.0%) |
| 15 to 19 Minutes | 35 (3.2%) | 101 (12.8%) |
| 20 to 24 Minutes | 46 (4.2%) | 70 (8.8%) |
| 25 to 29 Minutes | 0 (0.0%) | 39 (4.9%) |
| 30 to 34 Minutes | 50 (4.6%) | 99 (12.5%) |
| 35 to 39 Minutes | 13 (1.2%) | 32 (4.1%) |
| 40 to 44 Minutes | 215 (19.8%) | 22 (2.8%) |
| 45 to 59 Minutes | 284 (26.2%) | 135 (17.1%) |
| 60 to 89 Minutes | 265 (24.4%) | 197 (24.9%) |
| 90 or more Minutes | 72 (6.6%) | 49 (6.2%) |
Time of Departure to Work by Sex in Highland Lakes
The most frequent times of departure to work in Highland Lakes are 6:00 AM to 6:29 AM (263, 24.3%) for males and 8:00 AM to 8:29 AM (170, 21.5%) for females.
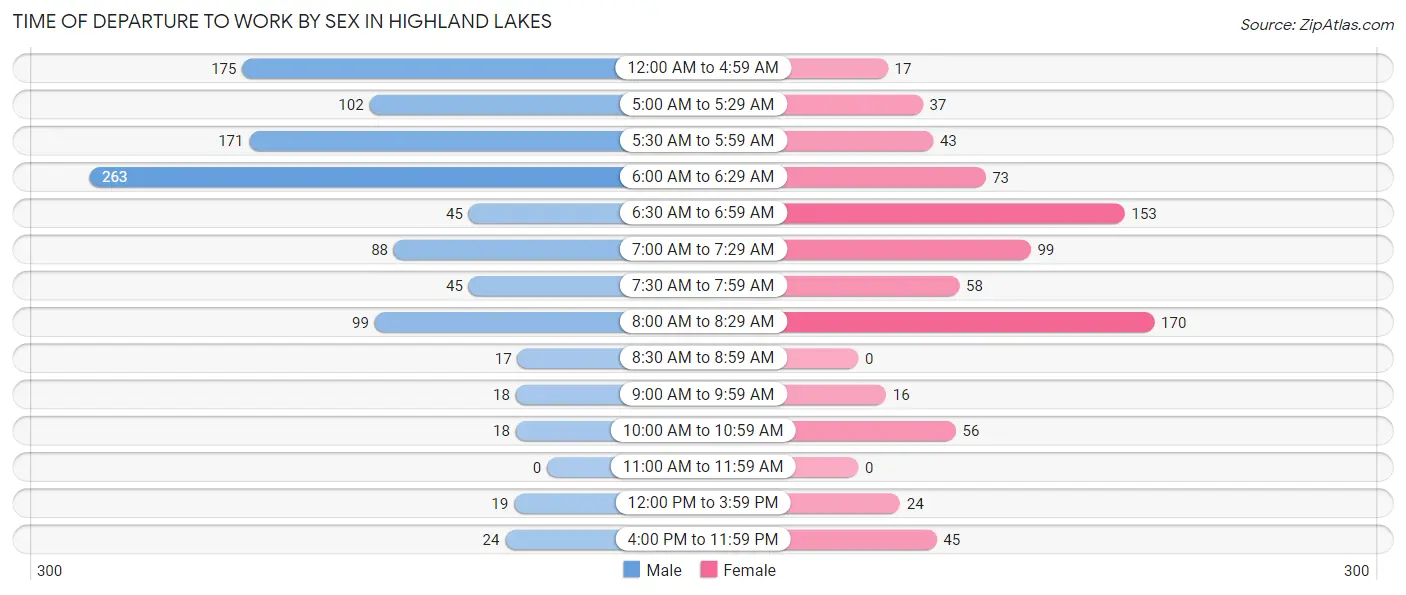
| Time of Departure | Male | Female |
| 12:00 AM to 4:59 AM | 175 (16.1%) | 17 (2.1%) |
| 5:00 AM to 5:29 AM | 102 (9.4%) | 37 (4.7%) |
| 5:30 AM to 5:59 AM | 171 (15.8%) | 43 (5.4%) |
| 6:00 AM to 6:29 AM | 263 (24.3%) | 73 (9.2%) |
| 6:30 AM to 6:59 AM | 45 (4.2%) | 153 (19.3%) |
| 7:00 AM to 7:29 AM | 88 (8.1%) | 99 (12.5%) |
| 7:30 AM to 7:59 AM | 45 (4.2%) | 58 (7.3%) |
| 8:00 AM to 8:29 AM | 99 (9.1%) | 170 (21.5%) |
| 8:30 AM to 8:59 AM | 17 (1.6%) | 0 (0.0%) |
| 9:00 AM to 9:59 AM | 18 (1.7%) | 16 (2.0%) |
| 10:00 AM to 10:59 AM | 18 (1.7%) | 56 (7.1%) |
| 11:00 AM to 11:59 AM | 0 (0.0%) | 0 (0.0%) |
| 12:00 PM to 3:59 PM | 19 (1.8%) | 24 (3.0%) |
| 4:00 PM to 11:59 PM | 24 (2.2%) | 45 (5.7%) |
| Total | 1,084 (100.0%) | 791 (100.0%) |
Housing Occupancy in Highland Lakes
Occupancy by Ownership in Highland Lakes
Of the total 1,647 dwellings in Highland Lakes, owner-occupied units account for 1,500 (91.1%), while renter-occupied units make up 147 (8.9%).
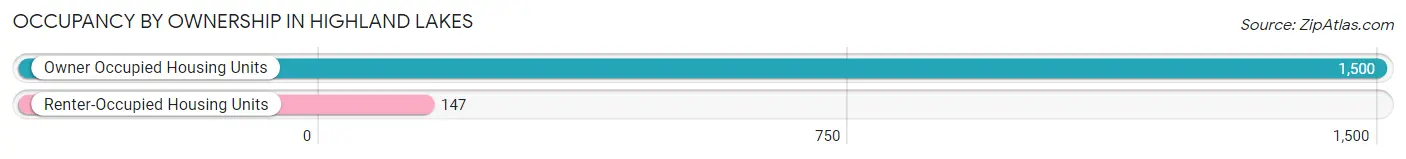
| Occupancy | # Housing Units | % Housing Units |
| Owner Occupied Housing Units | 1,500 | 91.1% |
| Renter-Occupied Housing Units | 147 | 8.9% |
| Total Occupied Housing Units | 1,647 | 100.0% |
Occupancy by Household Size in Highland Lakes
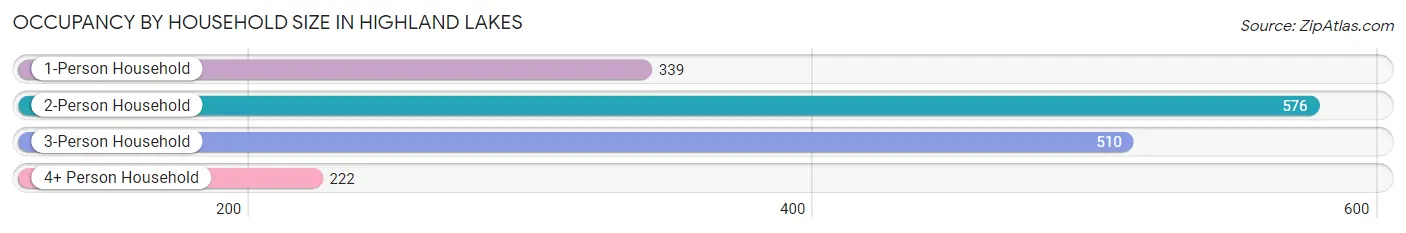
| Household Size | # Housing Units | % Housing Units |
| 1-Person Household | 339 | 20.6% |
| 2-Person Household | 576 | 35.0% |
| 3-Person Household | 510 | 31.0% |
| 4+ Person Household | 222 | 13.5% |
| Total Housing Units | 1,647 | 100.0% |
Occupancy by Ownership by Household Size in Highland Lakes
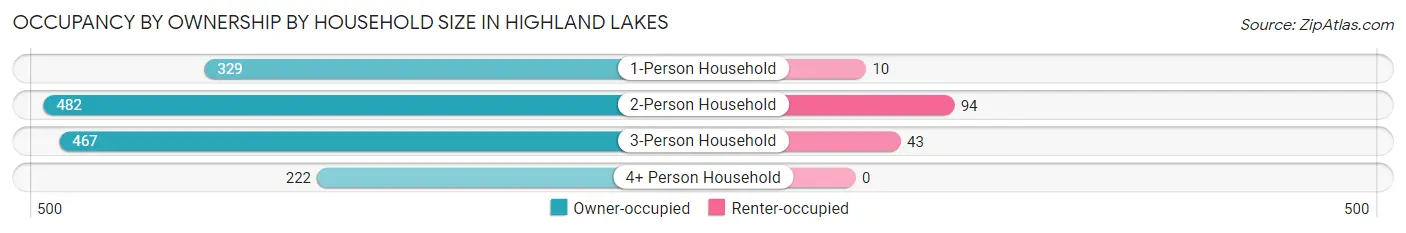
| Household Size | Owner-occupied | Renter-occupied |
| 1-Person Household | 329 (97.1%) | 10 (2.9%) |
| 2-Person Household | 482 (83.7%) | 94 (16.3%) |
| 3-Person Household | 467 (91.6%) | 43 (8.4%) |
| 4+ Person Household | 222 (100.0%) | 0 (0.0%) |
| Total Housing Units | 1,500 (91.1%) | 147 (8.9%) |
Occupancy by Educational Attainment in Highland Lakes
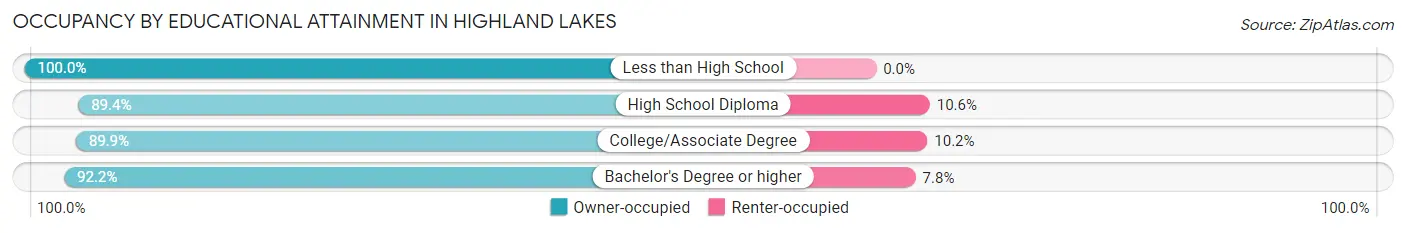
| Household Size | Owner-occupied | Renter-occupied |
| Less than High School | 39 (100.0%) | 0 (0.0%) |
| High School Diploma | 336 (89.4%) | 40 (10.6%) |
| College/Associate Degree | 407 (89.8%) | 46 (10.2%) |
| Bachelor's Degree or higher | 718 (92.2%) | 61 (7.8%) |
Occupancy by Age of Householder in Highland Lakes
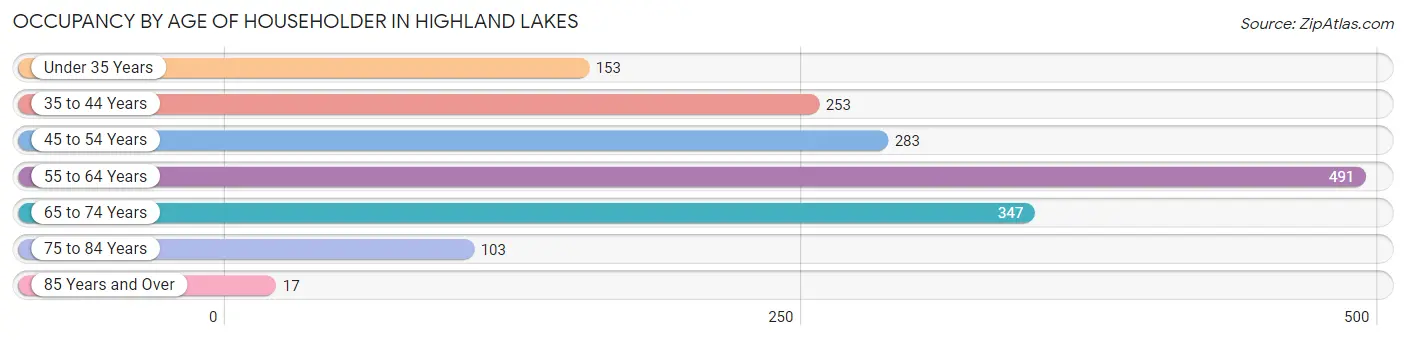
| Age Bracket | # Households | % Households |
| Under 35 Years | 153 | 9.3% |
| 35 to 44 Years | 253 | 15.4% |
| 45 to 54 Years | 283 | 17.2% |
| 55 to 64 Years | 491 | 29.8% |
| 65 to 74 Years | 347 | 21.1% |
| 75 to 84 Years | 103 | 6.2% |
| 85 Years and Over | 17 | 1.0% |
| Total | 1,647 | 100.0% |
Housing Finances in Highland Lakes
Median Income by Occupancy in Highland Lakes
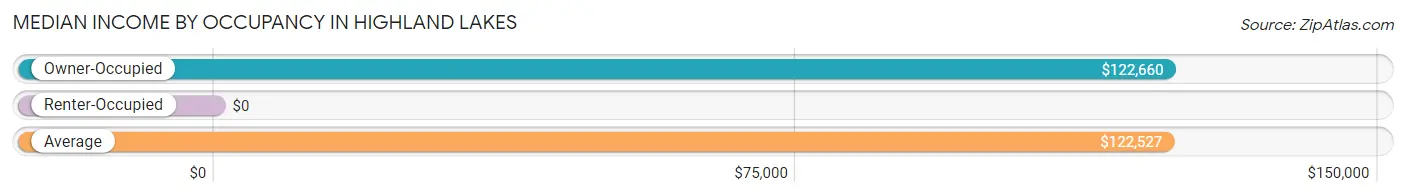
| Occupancy Type | # Households | Median Income |
| Owner-Occupied | 1,500 (91.1%) | $122,660 |
| Renter-Occupied | 147 (8.9%) | $0 |
| Average | 1,647 (100.0%) | $122,527 |
Occupancy by Householder Income Bracket in Highland Lakes
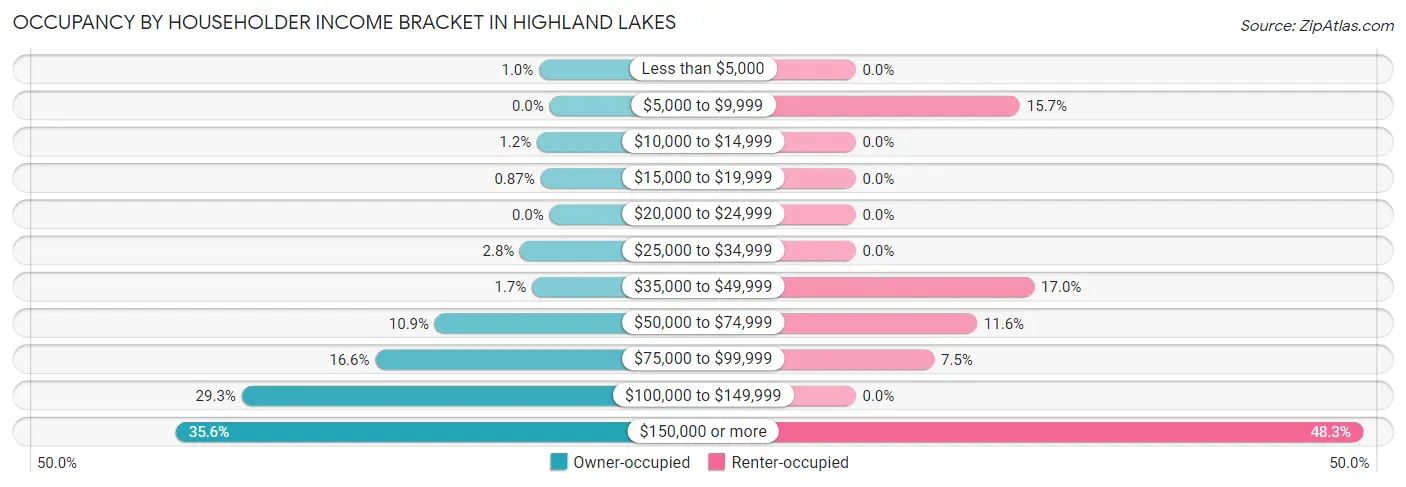
| Income Bracket | Owner-occupied | Renter-occupied |
| Less than $5,000 | 15 (1.0%) | 0 (0.0%) |
| $5,000 to $9,999 | 0 (0.0%) | 23 (15.7%) |
| $10,000 to $14,999 | 18 (1.2%) | 0 (0.0%) |
| $15,000 to $19,999 | 13 (0.9%) | 0 (0.0%) |
| $20,000 to $24,999 | 0 (0.0%) | 0 (0.0%) |
| $25,000 to $34,999 | 42 (2.8%) | 0 (0.0%) |
| $35,000 to $49,999 | 25 (1.7%) | 25 (17.0%) |
| $50,000 to $74,999 | 164 (10.9%) | 17 (11.6%) |
| $75,000 to $99,999 | 249 (16.6%) | 11 (7.5%) |
| $100,000 to $149,999 | 440 (29.3%) | 0 (0.0%) |
| $150,000 or more | 534 (35.6%) | 71 (48.3%) |
| Total | 1,500 (100.0%) | 147 (100.0%) |
Monthly Housing Cost Tiers in Highland Lakes
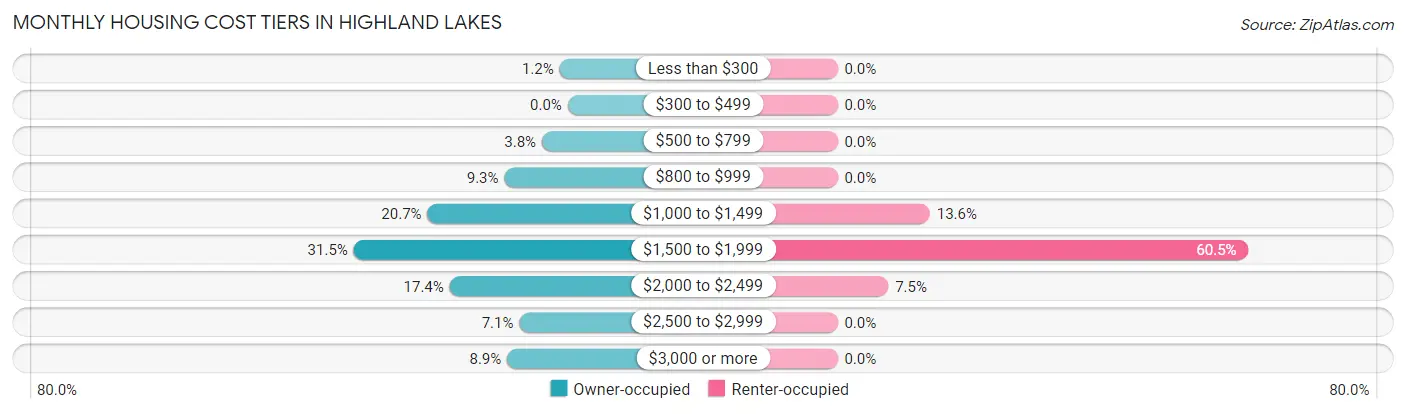
| Monthly Cost | Owner-occupied | Renter-occupied |
| Less than $300 | 18 (1.2%) | 0 (0.0%) |
| $300 to $499 | 0 (0.0%) | 0 (0.0%) |
| $500 to $799 | 57 (3.8%) | 0 (0.0%) |
| $800 to $999 | 140 (9.3%) | 0 (0.0%) |
| $1,000 to $1,499 | 310 (20.7%) | 20 (13.6%) |
| $1,500 to $1,999 | 473 (31.5%) | 89 (60.5%) |
| $2,000 to $2,499 | 261 (17.4%) | 11 (7.5%) |
| $2,500 to $2,999 | 107 (7.1%) | 0 (0.0%) |
| $3,000 or more | 134 (8.9%) | 0 (0.0%) |
| Total | 1,500 (100.0%) | 147 (100.0%) |
Physical Housing Characteristics in Highland Lakes
Housing Structures in Highland Lakes
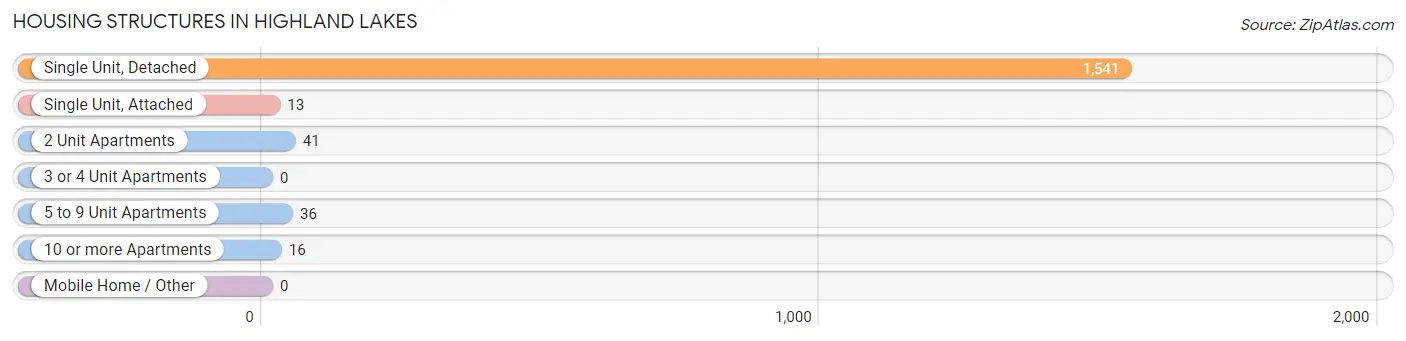
| Structure Type | # Housing Units | % Housing Units |
| Single Unit, Detached | 1,541 | 93.6% |
| Single Unit, Attached | 13 | 0.8% |
| 2 Unit Apartments | 41 | 2.5% |
| 3 or 4 Unit Apartments | 0 | 0.0% |
| 5 to 9 Unit Apartments | 36 | 2.2% |
| 10 or more Apartments | 16 | 1.0% |
| Mobile Home / Other | 0 | 0.0% |
| Total | 1,647 | 100.0% |
Housing Structures by Occupancy in Highland Lakes
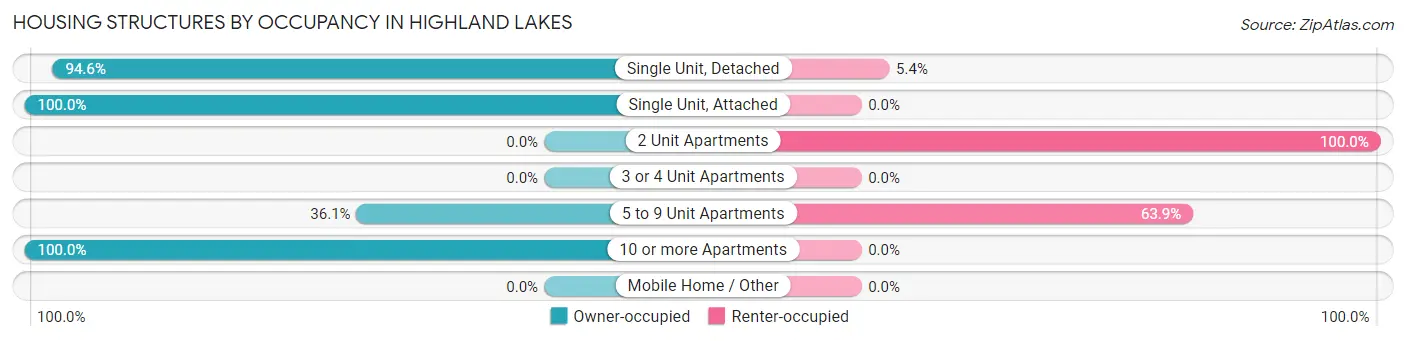
| Structure Type | Owner-occupied | Renter-occupied |
| Single Unit, Detached | 1,458 (94.6%) | 83 (5.4%) |
| Single Unit, Attached | 13 (100.0%) | 0 (0.0%) |
| 2 Unit Apartments | 0 (0.0%) | 41 (100.0%) |
| 3 or 4 Unit Apartments | 0 (0.0%) | 0 (0.0%) |
| 5 to 9 Unit Apartments | 13 (36.1%) | 23 (63.9%) |
| 10 or more Apartments | 16 (100.0%) | 0 (0.0%) |
| Mobile Home / Other | 0 (0.0%) | 0 (0.0%) |
| Total | 1,500 (91.1%) | 147 (8.9%) |
Housing Structures by Number of Rooms in Highland Lakes
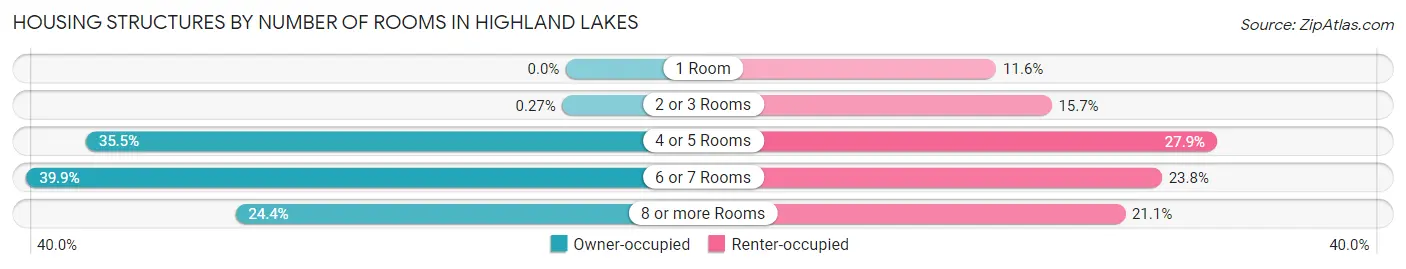
| Number of Rooms | Owner-occupied | Renter-occupied |
| 1 Room | 0 (0.0%) | 17 (11.6%) |
| 2 or 3 Rooms | 4 (0.3%) | 23 (15.7%) |
| 4 or 5 Rooms | 532 (35.5%) | 41 (27.9%) |
| 6 or 7 Rooms | 598 (39.9%) | 35 (23.8%) |
| 8 or more Rooms | 366 (24.4%) | 31 (21.1%) |
| Total | 1,500 (100.0%) | 147 (100.0%) |
Housing Structure by Heating Type in Highland Lakes
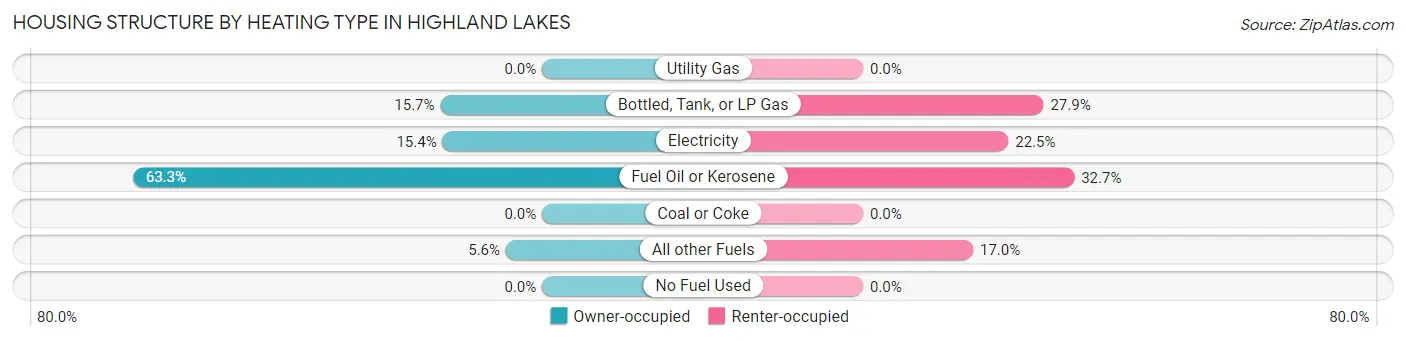
| Heating Type | Owner-occupied | Renter-occupied |
| Utility Gas | 0 (0.0%) | 0 (0.0%) |
| Bottled, Tank, or LP Gas | 236 (15.7%) | 41 (27.9%) |
| Electricity | 231 (15.4%) | 33 (22.5%) |
| Fuel Oil or Kerosene | 949 (63.3%) | 48 (32.7%) |
| Coal or Coke | 0 (0.0%) | 0 (0.0%) |
| All other Fuels | 84 (5.6%) | 25 (17.0%) |
| No Fuel Used | 0 (0.0%) | 0 (0.0%) |
| Total | 1,500 (100.0%) | 147 (100.0%) |
Household Vehicle Usage in Highland Lakes
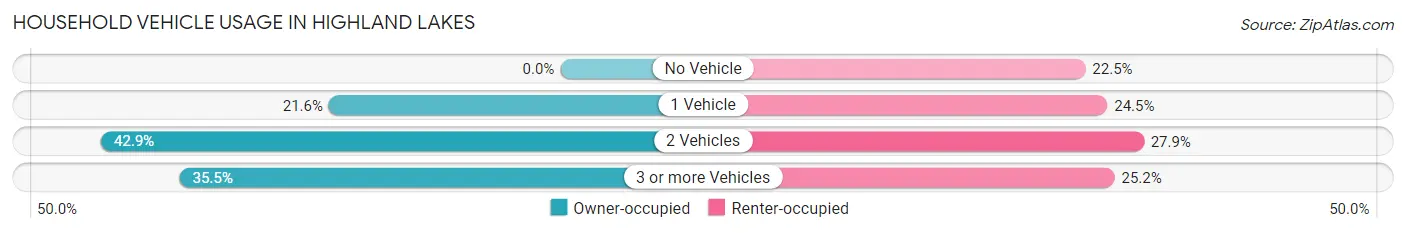
| Vehicles per Household | Owner-occupied | Renter-occupied |
| No Vehicle | 0 (0.0%) | 33 (22.5%) |
| 1 Vehicle | 324 (21.6%) | 36 (24.5%) |
| 2 Vehicles | 643 (42.9%) | 41 (27.9%) |
| 3 or more Vehicles | 533 (35.5%) | 37 (25.2%) |
| Total | 1,500 (100.0%) | 147 (100.0%) |
Real Estate & Mortgages in Highland Lakes
Real Estate and Mortgage Overview in Highland Lakes
| Characteristic | Without Mortgage | With Mortgage |
| Housing Units | 282 | 1,218 |
| Median Property Value | $304,700 | $275,500 |
| Median Household Income | $126,250 | $416 |
| Monthly Housing Costs | $1,031 | $134 |
| Real Estate Taxes | $6,988 | $28 |
Property Value by Mortgage Status in Highland Lakes
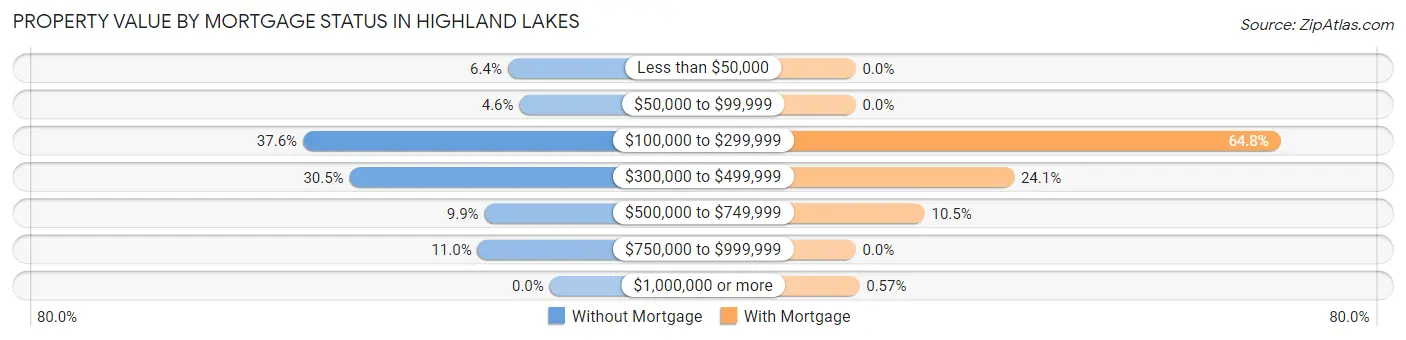
| Property Value | Without Mortgage | With Mortgage |
| Less than $50,000 | 18 (6.4%) | 0 (0.0%) |
| $50,000 to $99,999 | 13 (4.6%) | 0 (0.0%) |
| $100,000 to $299,999 | 106 (37.6%) | 789 (64.8%) |
| $300,000 to $499,999 | 86 (30.5%) | 294 (24.1%) |
| $500,000 to $749,999 | 28 (9.9%) | 128 (10.5%) |
| $750,000 to $999,999 | 31 (11.0%) | 0 (0.0%) |
| $1,000,000 or more | 0 (0.0%) | 7 (0.6%) |
| Total | 282 (100.0%) | 1,218 (100.0%) |
Household Income by Mortgage Status in Highland Lakes
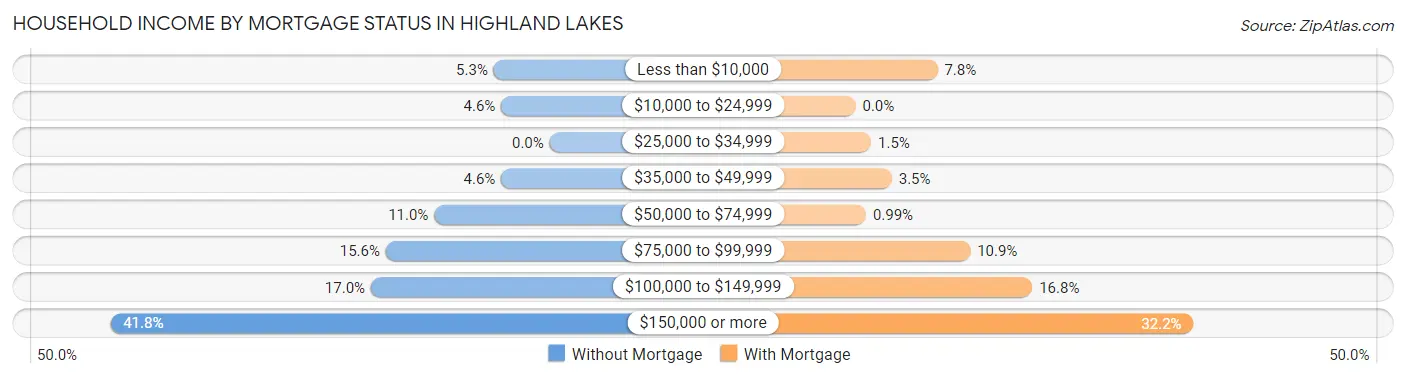
| Household Income | Without Mortgage | With Mortgage |
| Less than $10,000 | 15 (5.3%) | 95 (7.8%) |
| $10,000 to $24,999 | 13 (4.6%) | 0 (0.0%) |
| $25,000 to $34,999 | 0 (0.0%) | 18 (1.5%) |
| $35,000 to $49,999 | 13 (4.6%) | 42 (3.5%) |
| $50,000 to $74,999 | 31 (11.0%) | 12 (1.0%) |
| $75,000 to $99,999 | 44 (15.6%) | 133 (10.9%) |
| $100,000 to $149,999 | 48 (17.0%) | 205 (16.8%) |
| $150,000 or more | 118 (41.8%) | 392 (32.2%) |
| Total | 282 (100.0%) | 1,218 (100.0%) |
Property Value to Household Income Ratio in Highland Lakes
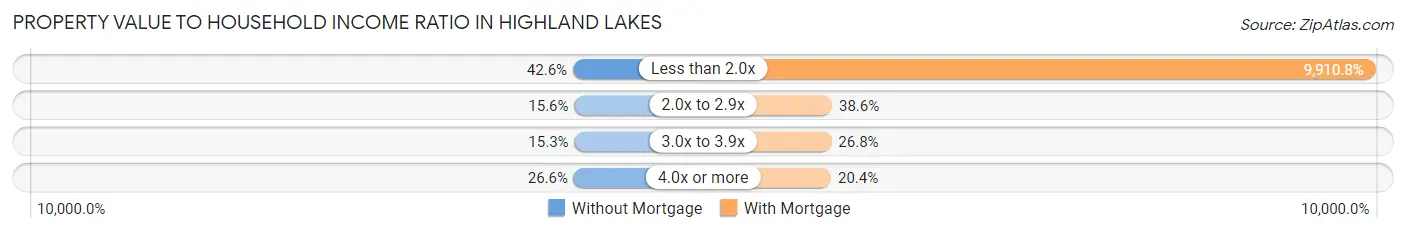
| Value-to-Income Ratio | Without Mortgage | With Mortgage |
| Less than 2.0x | 120 (42.5%) | 120,714 (9,910.8%) |
| 2.0x to 2.9x | 44 (15.6%) | 470 (38.6%) |
| 3.0x to 3.9x | 43 (15.2%) | 326 (26.8%) |
| 4.0x or more | 75 (26.6%) | 249 (20.4%) |
| Total | 282 (100.0%) | 1,218 (100.0%) |
Real Estate Taxes by Mortgage Status in Highland Lakes
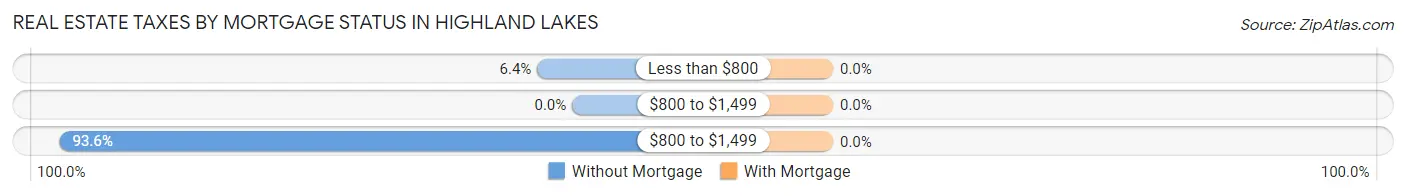
| Property Taxes | Without Mortgage | With Mortgage |
| Less than $800 | 18 (6.4%) | 0 (0.0%) |
| $800 to $1,499 | 0 (0.0%) | 0 (0.0%) |
| $800 to $1,499 | 264 (93.6%) | 0 (0.0%) |
| Total | 282 (100.0%) | 1,218 (100.0%) |
Health & Disability in Highland Lakes
Health Insurance Coverage by Age in Highland Lakes
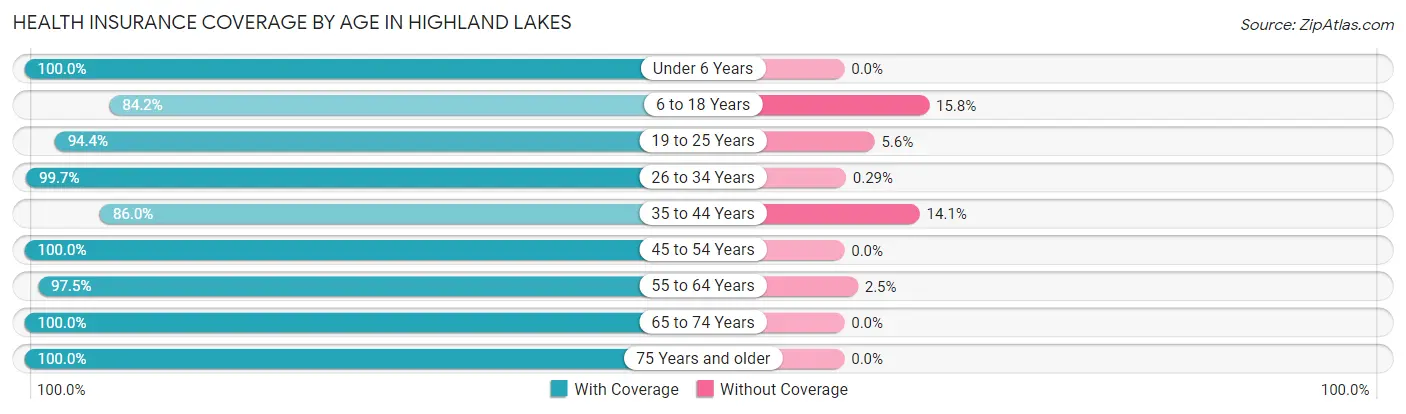
| Age Bracket | With Coverage | Without Coverage |
| Under 6 Years | 311 (100.0%) | 0 (0.0%) |
| 6 to 18 Years | 442 (84.2%) | 83 (15.8%) |
| 19 to 25 Years | 302 (94.4%) | 18 (5.6%) |
| 26 to 34 Years | 345 (99.7%) | 1 (0.3%) |
| 35 to 44 Years | 477 (86.0%) | 78 (14.1%) |
| 45 to 54 Years | 508 (100.0%) | 0 (0.0%) |
| 55 to 64 Years | 774 (97.5%) | 20 (2.5%) |
| 65 to 74 Years | 534 (100.0%) | 0 (0.0%) |
| 75 Years and older | 196 (100.0%) | 0 (0.0%) |
| Total | 3,889 (95.1%) | 200 (4.9%) |
Health Insurance Coverage by Citizenship Status in Highland Lakes
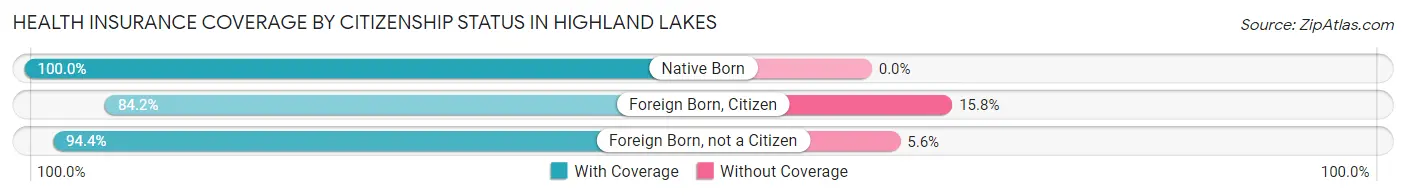
| Citizenship Status | With Coverage | Without Coverage |
| Native Born | 311 (100.0%) | 0 (0.0%) |
| Foreign Born, Citizen | 442 (84.2%) | 83 (15.8%) |
| Foreign Born, not a Citizen | 302 (94.4%) | 18 (5.6%) |
Health Insurance Coverage by Household Income in Highland Lakes

| Household Income | With Coverage | Without Coverage |
| Under $25,000 | 110 (89.4%) | 13 (10.6%) |
| $25,000 to $49,999 | 136 (81.9%) | 30 (18.1%) |
| $50,000 to $74,999 | 336 (100.0%) | 0 (0.0%) |
| $75,000 to $99,999 | 669 (100.0%) | 0 (0.0%) |
| $100,000 and over | 2,624 (94.4%) | 156 (5.6%) |
Public vs Private Health Insurance Coverage by Age in Highland Lakes
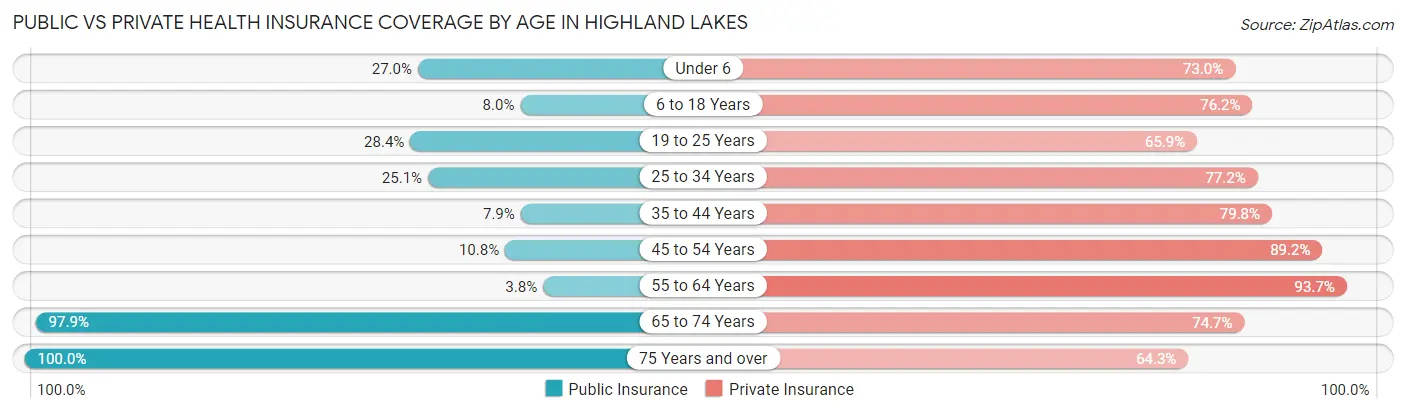
| Age Bracket | Public Insurance | Private Insurance |
| Under 6 | 84 (27.0%) | 227 (73.0%) |
| 6 to 18 Years | 42 (8.0%) | 400 (76.2%) |
| 19 to 25 Years | 91 (28.4%) | 211 (65.9%) |
| 25 to 34 Years | 87 (25.1%) | 267 (77.2%) |
| 35 to 44 Years | 44 (7.9%) | 443 (79.8%) |
| 45 to 54 Years | 55 (10.8%) | 453 (89.2%) |
| 55 to 64 Years | 30 (3.8%) | 744 (93.7%) |
| 65 to 74 Years | 523 (97.9%) | 399 (74.7%) |
| 75 Years and over | 196 (100.0%) | 126 (64.3%) |
| Total | 1,152 (28.2%) | 3,270 (80.0%) |
Disability Status by Sex by Age in Highland Lakes
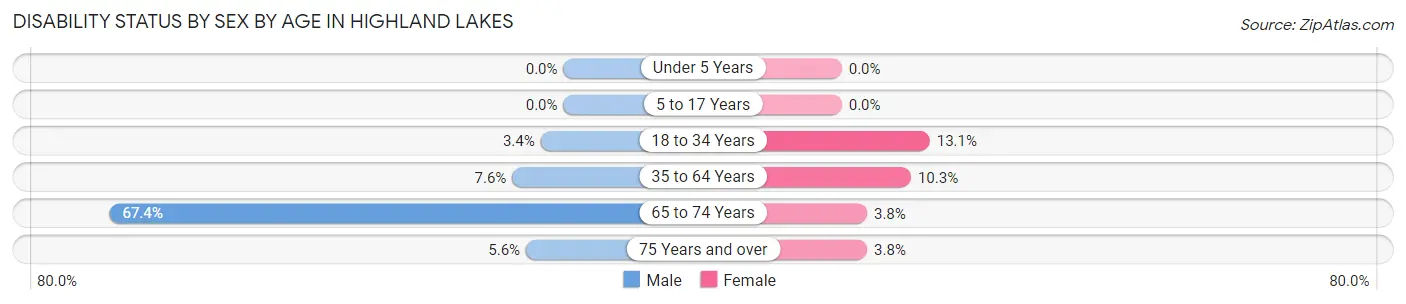
| Age Bracket | Male | Female |
| Under 5 Years | 0 (0.0%) | 0 (0.0%) |
| 5 to 17 Years | 0 (0.0%) | 0 (0.0%) |
| 18 to 34 Years | 13 (3.4%) | 43 (13.1%) |
| 35 to 64 Years | 73 (7.6%) | 92 (10.3%) |
| 65 to 74 Years | 252 (67.4%) | 6 (3.7%) |
| 75 Years and over | 5 (5.6%) | 4 (3.8%) |
Disability Class by Sex by Age in Highland Lakes
Disability Class: Hearing Difficulty
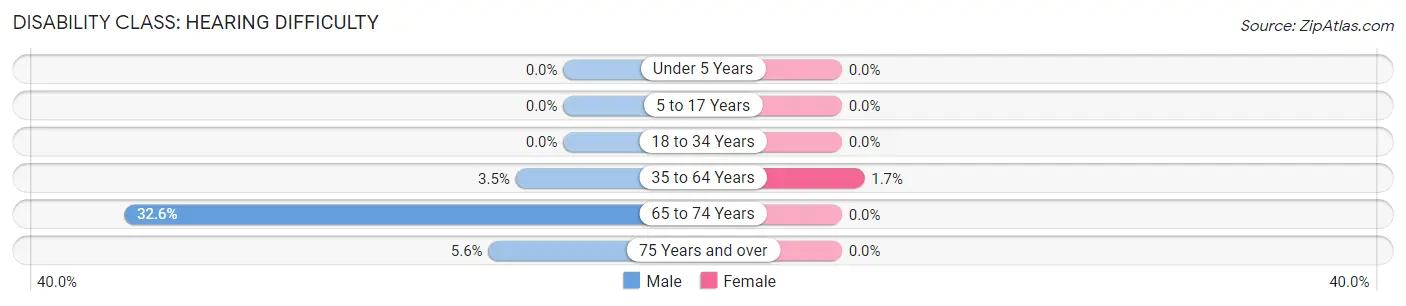
| Age Bracket | Male | Female |
| Under 5 Years | 0 (0.0%) | 0 (0.0%) |
| 5 to 17 Years | 0 (0.0%) | 0 (0.0%) |
| 18 to 34 Years | 0 (0.0%) | 0 (0.0%) |
| 35 to 64 Years | 34 (3.5%) | 15 (1.7%) |
| 65 to 74 Years | 122 (32.6%) | 0 (0.0%) |
| 75 Years and over | 5 (5.6%) | 0 (0.0%) |
Disability Class: Vision Difficulty
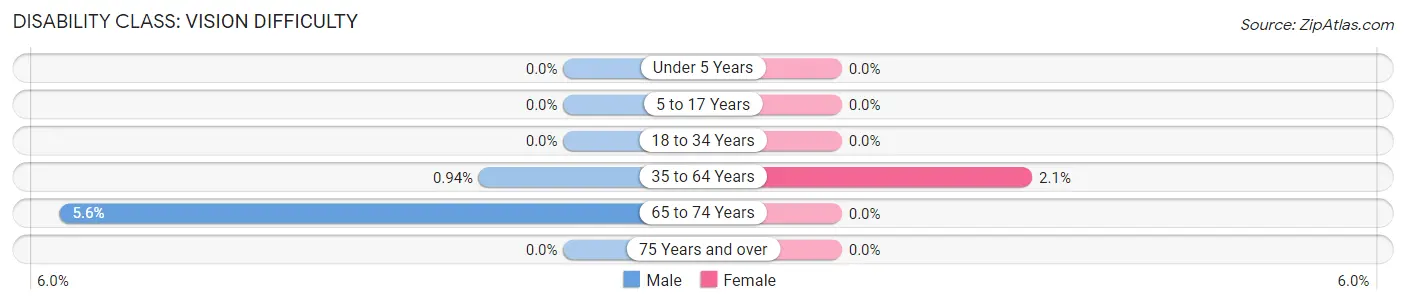
| Age Bracket | Male | Female |
| Under 5 Years | 0 (0.0%) | 0 (0.0%) |
| 5 to 17 Years | 0 (0.0%) | 0 (0.0%) |
| 18 to 34 Years | 0 (0.0%) | 0 (0.0%) |
| 35 to 64 Years | 9 (0.9%) | 19 (2.1%) |
| 65 to 74 Years | 21 (5.6%) | 0 (0.0%) |
| 75 Years and over | 0 (0.0%) | 0 (0.0%) |
Disability Class: Cognitive Difficulty
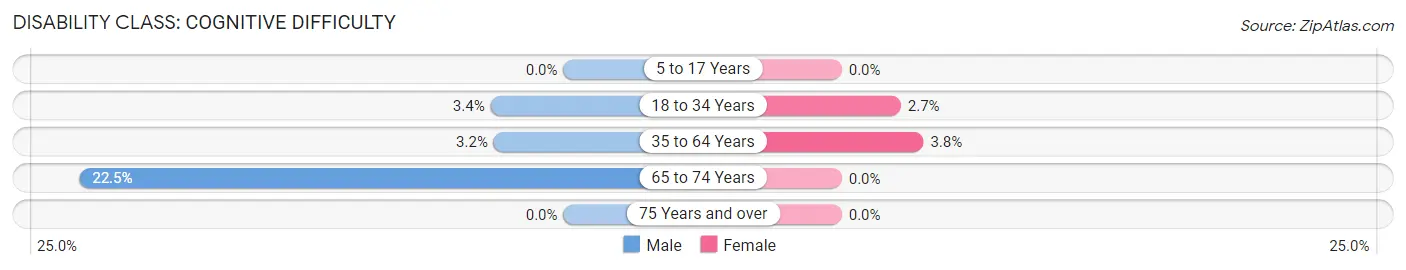
| Age Bracket | Male | Female |
| 5 to 17 Years | 0 (0.0%) | 0 (0.0%) |
| 18 to 34 Years | 13 (3.4%) | 9 (2.7%) |
| 35 to 64 Years | 31 (3.2%) | 34 (3.8%) |
| 65 to 74 Years | 84 (22.5%) | 0 (0.0%) |
| 75 Years and over | 0 (0.0%) | 0 (0.0%) |
Disability Class: Ambulatory Difficulty
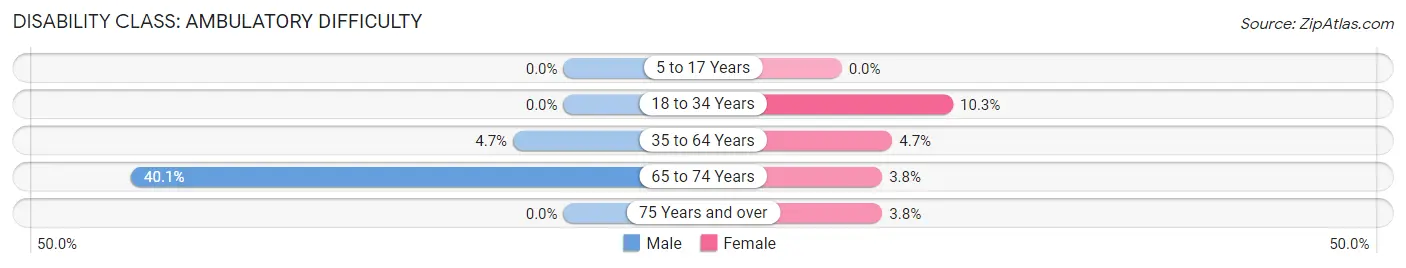
| Age Bracket | Male | Female |
| 5 to 17 Years | 0 (0.0%) | 0 (0.0%) |
| 18 to 34 Years | 0 (0.0%) | 34 (10.3%) |
| 35 to 64 Years | 45 (4.7%) | 42 (4.7%) |
| 65 to 74 Years | 150 (40.1%) | 6 (3.7%) |
| 75 Years and over | 0 (0.0%) | 4 (3.8%) |
Disability Class: Self-Care Difficulty
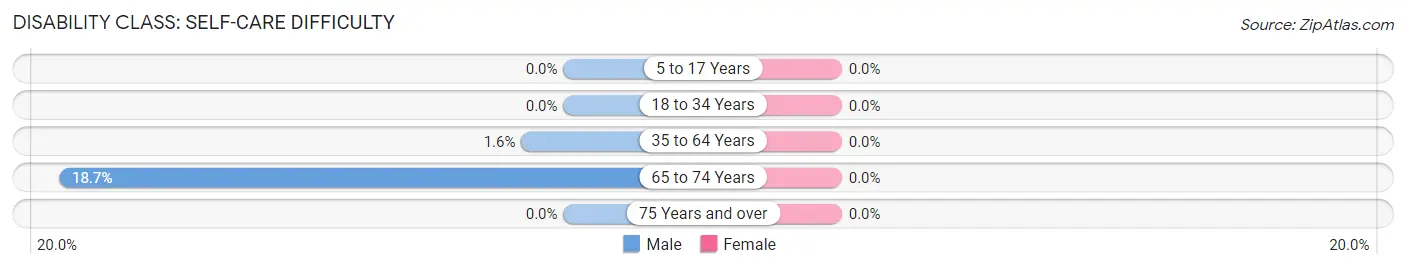
| Age Bracket | Male | Female |
| 5 to 17 Years | 0 (0.0%) | 0 (0.0%) |
| 18 to 34 Years | 0 (0.0%) | 0 (0.0%) |
| 35 to 64 Years | 15 (1.6%) | 0 (0.0%) |
| 65 to 74 Years | 70 (18.7%) | 0 (0.0%) |
| 75 Years and over | 0 (0.0%) | 0 (0.0%) |
Technology Access in Highland Lakes
Computing Device Access in Highland Lakes
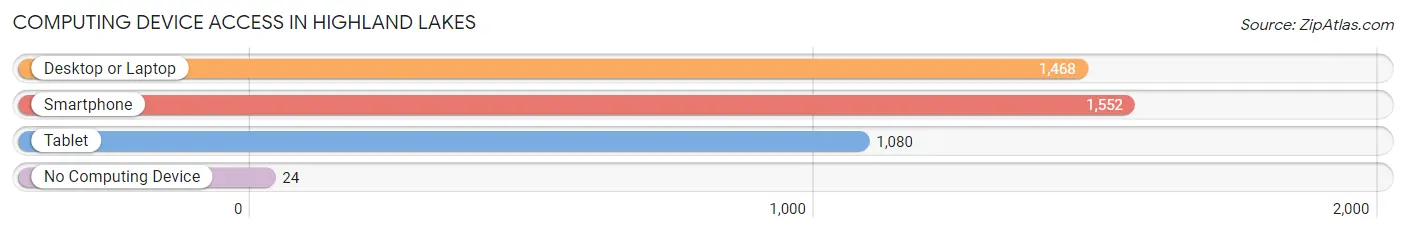
| Device Type | # Households | % Households |
| Desktop or Laptop | 1,468 | 89.1% |
| Smartphone | 1,552 | 94.2% |
| Tablet | 1,080 | 65.6% |
| No Computing Device | 24 | 1.5% |
| Total | 1,647 | 100.0% |
Internet Access in Highland Lakes
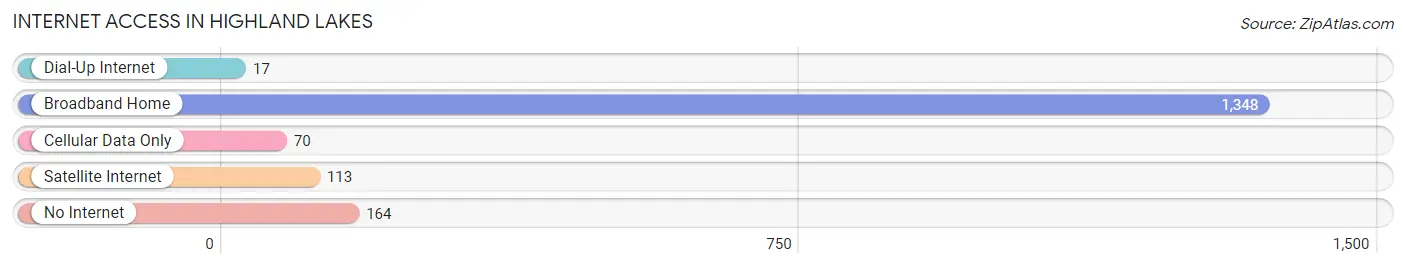
| Internet Type | # Households | % Households |
| Dial-Up Internet | 17 | 1.0% |
| Broadband Home | 1,348 | 81.9% |
| Cellular Data Only | 70 | 4.3% |
| Satellite Internet | 113 | 6.9% |
| No Internet | 164 | 10.0% |
| Total | 1,647 | 100.0% |
Highland Lakes Summary
Highland Lakes, NJ is a small borough located in Passaic County, New Jersey. It is situated in the Ramapo Mountains, and is part of the New York metropolitan area. The borough was incorporated in 1922, and has a population of approximately 2,000 people.
Geography
Highland Lakes is located in the Ramapo Mountains, which are part of the Appalachian Mountains. The borough is situated in the northern part of Passaic County, and is bordered by the towns of Ringwood, Wanaque, and West Milford. The borough is approximately 25 miles northwest of New York City, and is accessible via Route 23. The borough is situated at an elevation of 1,000 feet, and has a total area of 2.2 square miles.
The borough is home to several lakes, including Lake Wanda, Lake Glenmere, and Lake Ocquittunk. These lakes are popular for fishing, swimming, and boating. The borough is also home to several parks, including the Highland Lakes County Park, which offers hiking trails, picnic areas, and a playground.
Demographics
As of the 2010 census, the population of Highland Lakes was 2,000 people. The racial makeup of the borough was 94.2% White, 1.2% African American, 0.2% Native American, 1.2% Asian, and 3.2% from other races. The median household income was $76,250, and the median family income was $87,500.
Economy
Highland Lakes is a primarily residential community, and the majority of its residents are employed in the service industry. The borough is home to several small businesses, including restaurants, retail stores, and professional services. The borough is also home to several corporate offices, including a regional office of the New Jersey Department of Transportation.
The borough is home to several recreational facilities, including golf courses, tennis courts, and a ski resort. The borough is also home to several campgrounds, which attract visitors from all over the region.
Conclusion
Highland Lakes, NJ is a small borough located in Passaic County, New Jersey. It is situated in the Ramapo Mountains, and is part of the New York metropolitan area. The borough was incorporated in 1922, and has a population of approximately 2,000 people. The borough is home to several lakes, parks, and recreational facilities, and is a primarily residential community. The majority of its residents are employed in the service industry, and the borough is home to several small businesses and corporate offices.
Common Questions
What is Per Capita Income in Highland Lakes?
Per Capita income in Highland Lakes is $65,306.
What is the Median Family Income in Highland Lakes?
Median Family Income in Highland Lakes is $135,938.
What is the Median Household income in Highland Lakes?
Median Household Income in Highland Lakes is $122,527.
What is Income or Wage Gap in Highland Lakes?
Income or Wage Gap in Highland Lakes is 19.6%.
Women in Highland Lakes earn 80.4 cents for every dollar earned by a man.
What is Inequality or Gini Index in Highland Lakes?
Inequality or Gini Index in Highland Lakes is 0.42.
What is the Total Population of Highland Lakes?
Total Population of Highland Lakes is 4,089.
What is the Total Male Population of Highland Lakes?
Total Male Population of Highland Lakes is 2,318.
What is the Total Female Population of Highland Lakes?
Total Female Population of Highland Lakes is 1,771.
What is the Ratio of Males per 100 Females in Highland Lakes?
There are 130.89 Males per 100 Females in Highland Lakes.
What is the Ratio of Females per 100 Males in Highland Lakes?
There are 76.40 Females per 100 Males in Highland Lakes.
What is the Median Population Age in Highland Lakes?
Median Population Age in Highland Lakes is 44.7 Years.
What is the Average Family Size in Highland Lakes
Average Family Size in Highland Lakes is 2.9 People.
What is the Average Household Size in Highland Lakes
Average Household Size in Highland Lakes is 2.5 People.
How Large is the Labor Force in Highland Lakes?
There are 2,641 People in the Labor Forcein in Highland Lakes.
What is the Percentage of People in the Labor Force in Highland Lakes?
75.9% of People are in the Labor Force in Highland Lakes.
What is the Unemployment Rate in Highland Lakes?
Unemployment Rate in Highland Lakes is 9.5%.