Hockinson, WA Map & Demographics
Hockinson Map
Hockinson Overview
$56,948
PER CAPITA INCOME
$128,365
AVG FAMILY INCOME
$126,189
AVG HOUSEHOLD INCOME
33.6%
WAGE / INCOME GAP [ % ]
66.4¢/ $1
WAGE / INCOME GAP [ $ ]
0.43
INEQUALITY / GINI INDEX
5,833
TOTAL POPULATION
3,140
MALE POPULATION
2,693
FEMALE POPULATION
116.60
MALES / 100 FEMALES
85.76
FEMALES / 100 MALES
46.4
MEDIAN AGE
3.4
AVG FAMILY SIZE
2.9
AVG HOUSEHOLD SIZE
2,613
LABOR FORCE [ PEOPLE ]
55.2%
PERCENT IN LABOR FORCE
2.1%
UNEMPLOYMENT RATE
Income in Hockinson
Income Overview in Hockinson
Per Capita Income in Hockinson is $56,948, while median incomes of families and households are $128,365 and $126,189 respectively.
| Characteristic | Number | Measure |
| Per Capita Income | 5,833 | $56,948 |
| Median Family Income | 1,476 | $128,365 |
| Mean Family Income | 1,476 | $168,630 |
| Median Household Income | 1,990 | $126,189 |
| Mean Household Income | 1,990 | $163,017 |
| Income Deficit | 1,476 | $0 |
| Wage / Income Gap (%) | 5,833 | 33.57% |
| Wage / Income Gap ($) | 5,833 | 66.43¢ per $1 |
| Gini / Inequality Index | 5,833 | 0.43 |
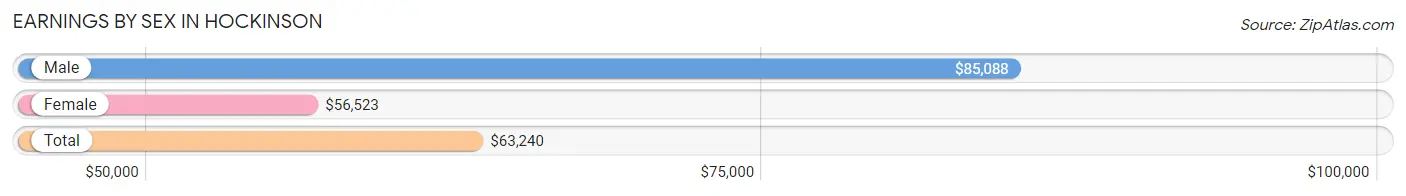
Earnings by Sex in Hockinson
Average Earnings in Hockinson are $63,240, $85,088 for men and $56,523 for women, a difference of 33.6%.
| Sex | Number | Average Earnings |
| Male | 1,534 (56.0%) | $85,088 |
| Female | 1,205 (44.0%) | $56,523 |
| Total | 2,739 (100.0%) | $63,240 |
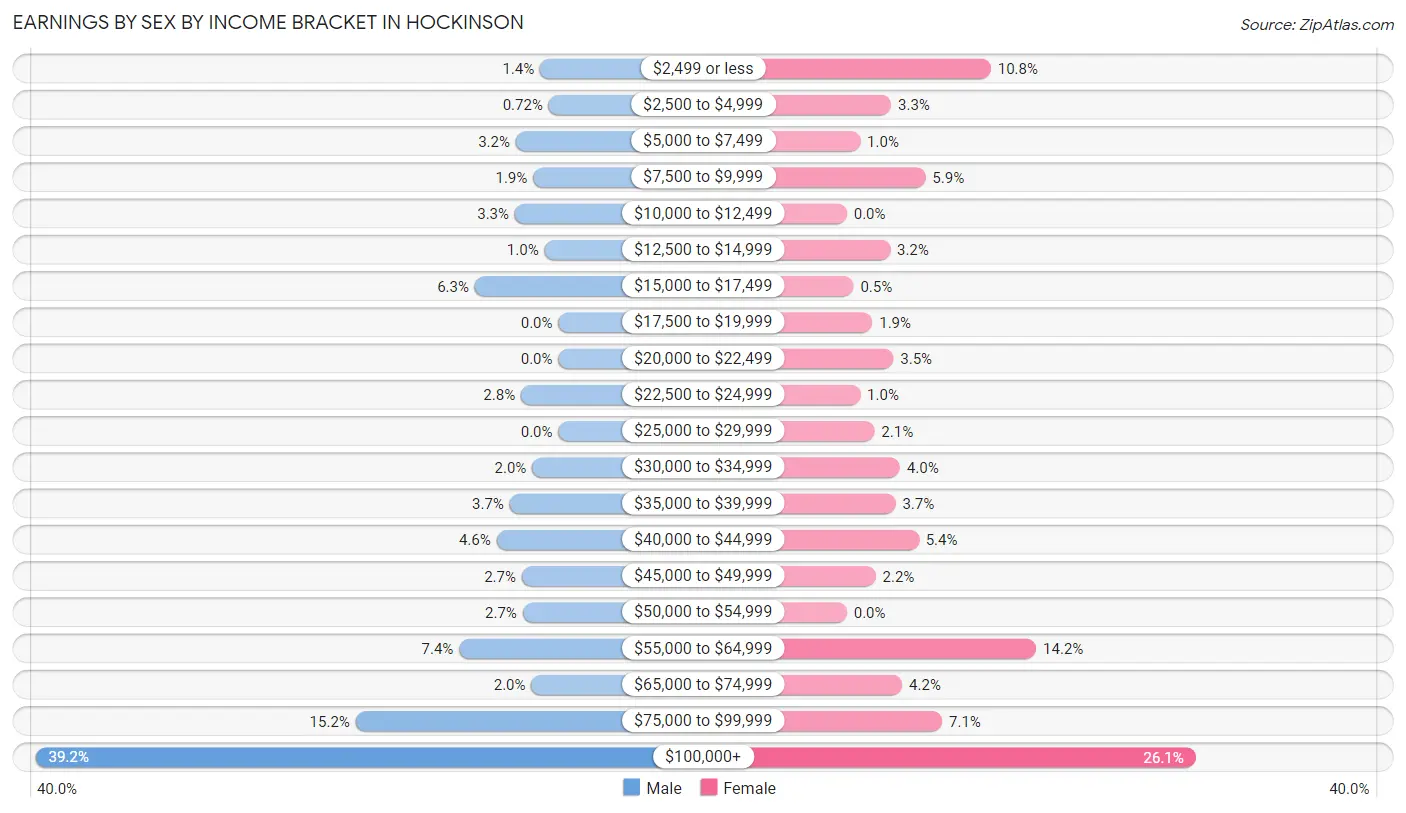
Earnings by Sex by Income Bracket in Hockinson
The most common earnings brackets in Hockinson are $100,000+ for men (601 | 39.2%) and $100,000+ for women (315 | 26.1%).
| Income | Male | Female |
| $2,499 or less | 21 (1.4%) | 130 (10.8%) |
| $2,500 to $4,999 | 11 (0.7%) | 40 (3.3%) |
| $5,000 to $7,499 | 49 (3.2%) | 12 (1.0%) |
| $7,500 to $9,999 | 29 (1.9%) | 71 (5.9%) |
| $10,000 to $12,499 | 50 (3.3%) | 0 (0.0%) |
| $12,500 to $14,999 | 16 (1.0%) | 39 (3.2%) |
| $15,000 to $17,499 | 96 (6.3%) | 6 (0.5%) |
| $17,500 to $19,999 | 0 (0.0%) | 23 (1.9%) |
| $20,000 to $22,499 | 0 (0.0%) | 42 (3.5%) |
| $22,500 to $24,999 | 43 (2.8%) | 12 (1.0%) |
| $25,000 to $29,999 | 0 (0.0%) | 25 (2.1%) |
| $30,000 to $34,999 | 30 (2.0%) | 48 (4.0%) |
| $35,000 to $39,999 | 56 (3.6%) | 44 (3.6%) |
| $40,000 to $44,999 | 71 (4.6%) | 65 (5.4%) |
| $45,000 to $49,999 | 42 (2.7%) | 26 (2.2%) |
| $50,000 to $54,999 | 41 (2.7%) | 0 (0.0%) |
| $55,000 to $64,999 | 114 (7.4%) | 171 (14.2%) |
| $65,000 to $74,999 | 31 (2.0%) | 50 (4.2%) |
| $75,000 to $99,999 | 233 (15.2%) | 86 (7.1%) |
| $100,000+ | 601 (39.2%) | 315 (26.1%) |
| Total | 1,534 (100.0%) | 1,205 (100.0%) |
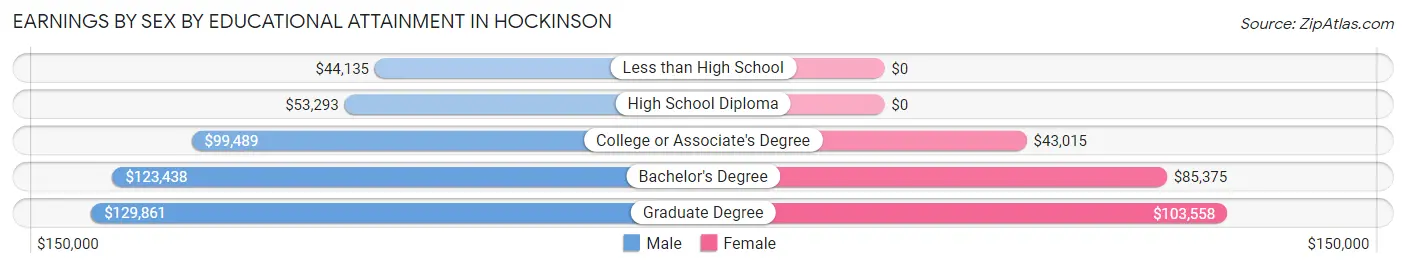
Earnings by Sex by Educational Attainment in Hockinson
Average earnings in Hockinson are $91,042 for men and $58,536 for women, a difference of 35.7%. Men with an educational attainment of graduate degree enjoy the highest average annual earnings of $129,861, while those with less than high school education earn the least with $44,135. Women with an educational attainment of graduate degree earn the most with the average annual earnings of $103,558, while those with college or associate's degree education have the smallest earnings of $43,015.
| Educational Attainment | Male Income | Female Income |
| Less than High School | $44,135 | $0 |
| High School Diploma | $53,293 | $0 |
| College or Associate's Degree | $99,489 | $43,015 |
| Bachelor's Degree | $123,438 | $85,375 |
| Graduate Degree | $129,861 | $103,558 |
| Total | $91,042 | $58,536 |
Family Income in Hockinson
Family Income Brackets in Hockinson
According to the Hockinson family income data, there are 427 families falling into the $200,000+ income range, which is the most common income bracket and makes up 28.9% of all families.
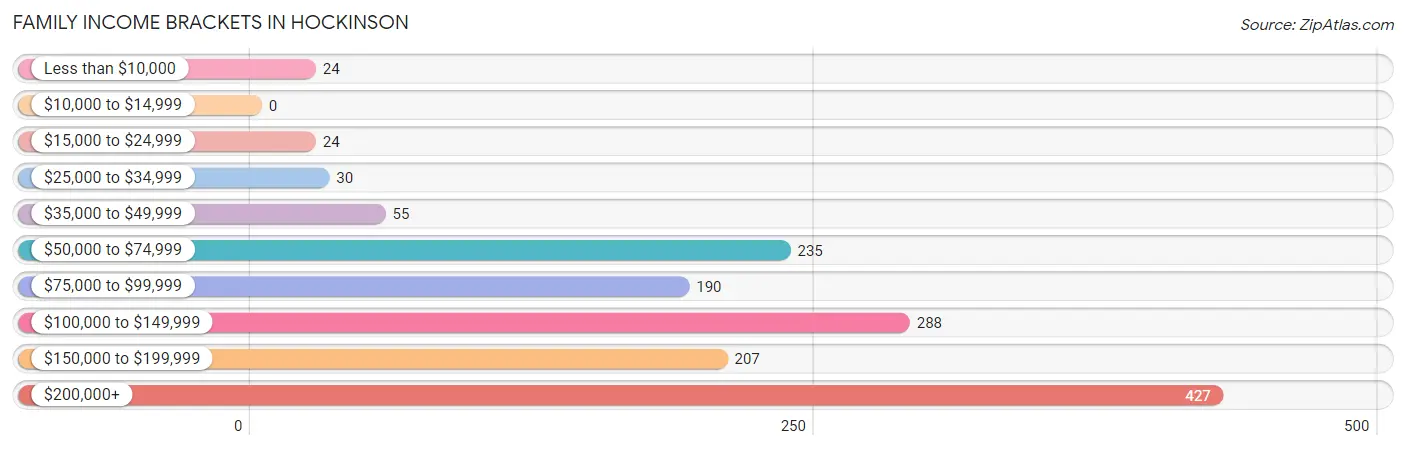
| Income Bracket | # Families | % Families |
| Less than $10,000 | 24 | 1.6% |
| $10,000 to $14,999 | 0 | 0.0% |
| $15,000 to $24,999 | 24 | 1.6% |
| $25,000 to $34,999 | 30 | 2.0% |
| $35,000 to $49,999 | 55 | 3.7% |
| $50,000 to $74,999 | 235 | 15.9% |
| $75,000 to $99,999 | 190 | 12.9% |
| $100,000 to $149,999 | 288 | 19.5% |
| $150,000 to $199,999 | 207 | 14.0% |
| $200,000+ | 427 | 28.9% |
Family Income by Famaliy Size in Hockinson
5-person families (193 | 13.1%) account for the highest median family income in Hockinson with $250,001 per family, while 2-person families (714 | 48.4%) have the highest median income of $53,100 per family member.
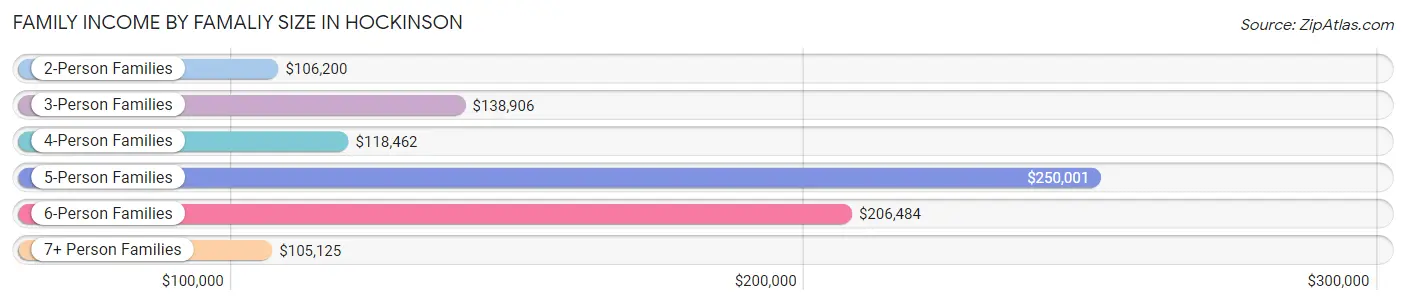
| Income Bracket | # Families | Median Income |
| 2-Person Families | 714 (48.4%) | $106,200 |
| 3-Person Families | 239 (16.2%) | $138,906 |
| 4-Person Families | 198 (13.4%) | $118,462 |
| 5-Person Families | 193 (13.1%) | $250,001 |
| 6-Person Families | 53 (3.6%) | $206,484 |
| 7+ Person Families | 79 (5.3%) | $105,125 |
| Total | 1,476 (100.0%) | $128,365 |
Family Income by Number of Earners in Hockinson
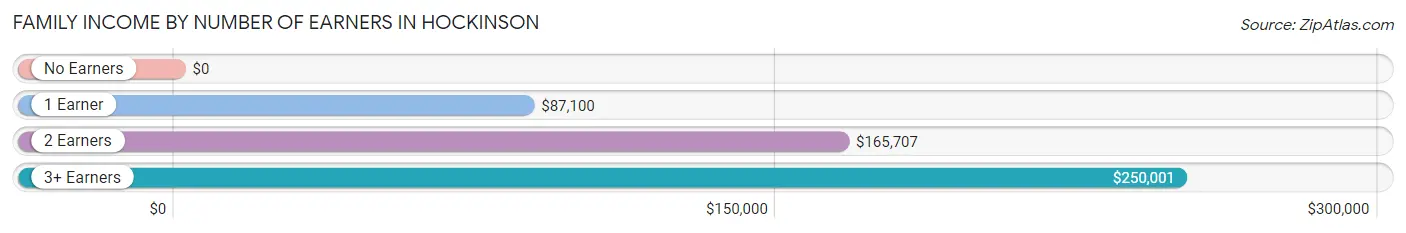
| Number of Earners | # Families | Median Income |
| No Earners | 290 (19.7%) | $0 |
| 1 Earner | 410 (27.8%) | $87,100 |
| 2 Earners | 647 (43.8%) | $165,707 |
| 3+ Earners | 129 (8.7%) | $250,001 |
| Total | 1,476 (100.0%) | $128,365 |
Household Income in Hockinson
Household Income Brackets in Hockinson
With 525 households falling in the category, the $200,000+ income range is the most frequent in Hockinson, accounting for 26.4% of all households. In contrast, only 24 households (1.2%) fall into the less than $10,000 income bracket, making it the least populous group.
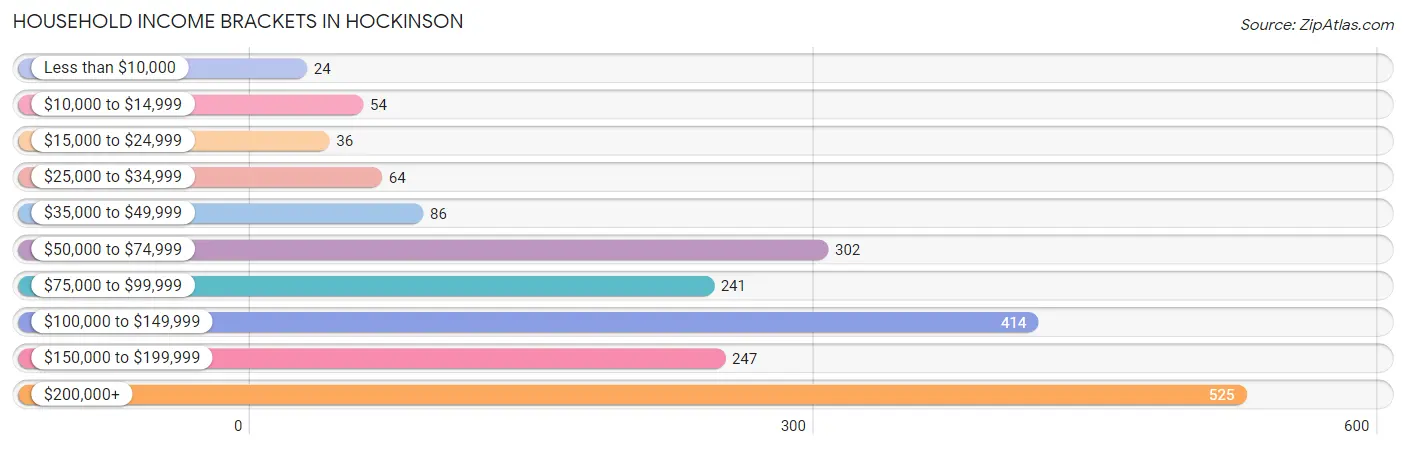
| Income Bracket | # Households | % Households |
| Less than $10,000 | 24 | 1.2% |
| $10,000 to $14,999 | 54 | 2.7% |
| $15,000 to $24,999 | 36 | 1.8% |
| $25,000 to $34,999 | 64 | 3.2% |
| $35,000 to $49,999 | 86 | 4.3% |
| $50,000 to $74,999 | 302 | 15.2% |
| $75,000 to $99,999 | 241 | 12.1% |
| $100,000 to $149,999 | 414 | 20.8% |
| $150,000 to $199,999 | 247 | 12.4% |
| $200,000+ | 525 | 26.4% |
Household Income by Householder Age in Hockinson
The median household income in Hockinson is $126,189, with the highest median household income of $163,077 found in the 25 to 44 years age bracket for the primary householder. A total of 336 households (16.9%) fall into this category. Meanwhile, the 15 to 24 years age bracket for the primary householder has the lowest median household income of $0, with 13 households (0.6%) in this group.
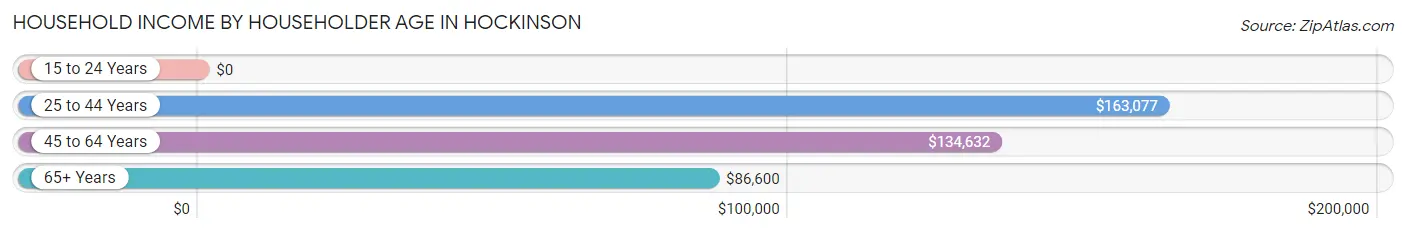
| Income Bracket | # Households | Median Income |
| 15 to 24 Years | 13 (0.6%) | $0 |
| 25 to 44 Years | 336 (16.9%) | $163,077 |
| 45 to 64 Years | 967 (48.6%) | $134,632 |
| 65+ Years | 674 (33.9%) | $86,600 |
| Total | 1,990 (100.0%) | $126,189 |
Poverty in Hockinson
Income Below Poverty by Sex and Age in Hockinson
With 2.3% poverty level for males and 4.7% for females among the residents of Hockinson, under 5 year old males and 12 to 14 year old females are the most vulnerable to poverty, with 10 males (6.4%) and 10 females (19.2%) in their respective age groups living below the poverty level.
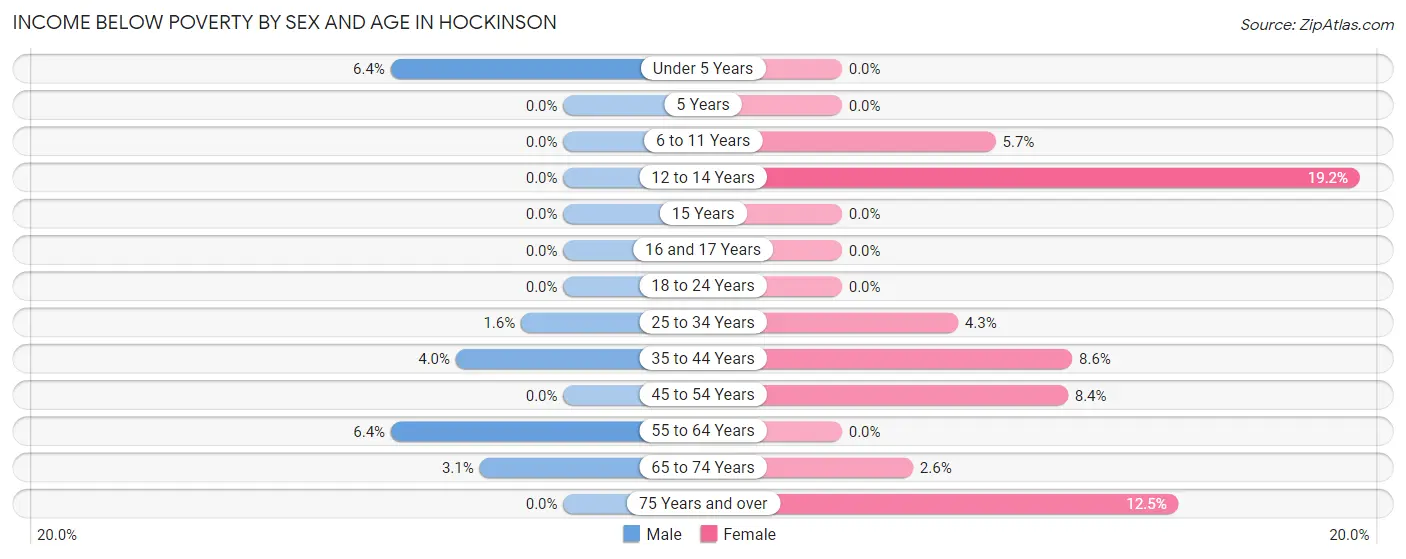
| Age Bracket | Male | Female |
| Under 5 Years | 10 (6.4%) | 0 (0.0%) |
| 5 Years | 0 (0.0%) | 0 (0.0%) |
| 6 to 11 Years | 0 (0.0%) | 10 (5.7%) |
| 12 to 14 Years | 0 (0.0%) | 10 (19.2%) |
| 15 Years | 0 (0.0%) | 0 (0.0%) |
| 16 and 17 Years | 0 (0.0%) | 0 (0.0%) |
| 18 to 24 Years | 0 (0.0%) | 0 (0.0%) |
| 25 to 34 Years | 4 (1.6%) | 10 (4.3%) |
| 35 to 44 Years | 11 (4.0%) | 23 (8.6%) |
| 45 to 54 Years | 0 (0.0%) | 38 (8.4%) |
| 55 to 64 Years | 33 (6.4%) | 0 (0.0%) |
| 65 to 74 Years | 15 (3.1%) | 12 (2.6%) |
| 75 Years and over | 0 (0.0%) | 24 (12.5%) |
| Total | 73 (2.3%) | 127 (4.7%) |
Income Above Poverty by Sex and Age in Hockinson
According to the poverty statistics in Hockinson, males aged 5 years and females aged under 5 years are the age groups that are most secure financially, with 100.0% of males and 100.0% of females in these age groups living above the poverty line.
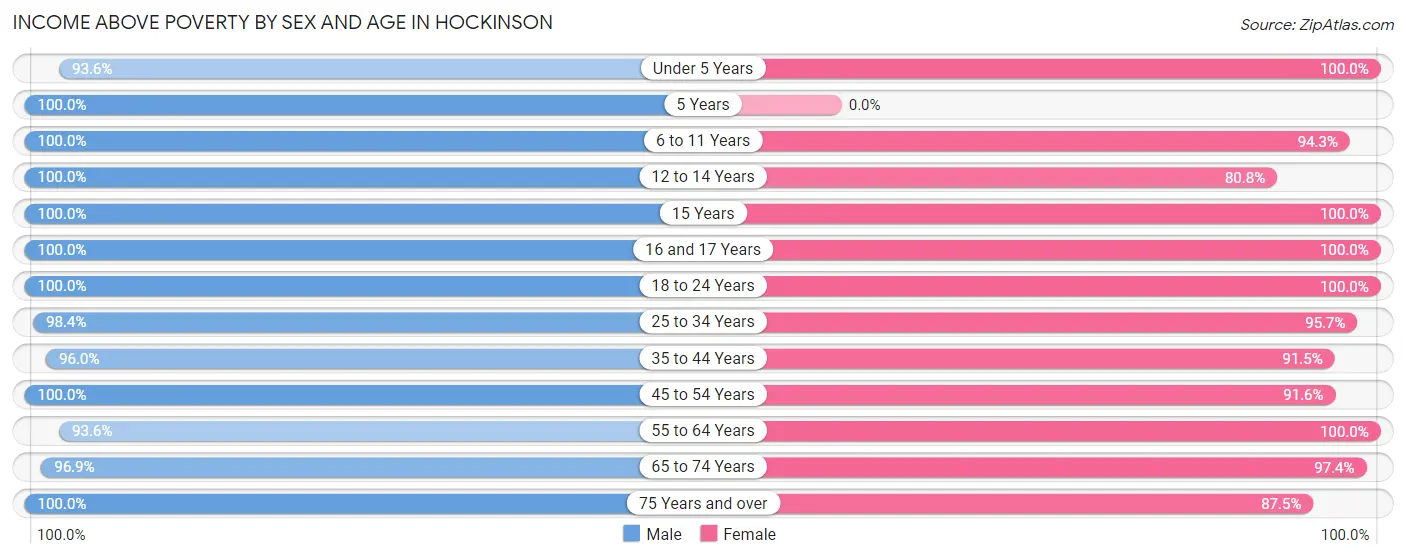
| Age Bracket | Male | Female |
| Under 5 Years | 146 (93.6%) | 156 (100.0%) |
| 5 Years | 20 (100.0%) | 0 (0.0%) |
| 6 to 11 Years | 190 (100.0%) | 165 (94.3%) |
| 12 to 14 Years | 163 (100.0%) | 42 (80.8%) |
| 15 Years | 126 (100.0%) | 62 (100.0%) |
| 16 and 17 Years | 172 (100.0%) | 56 (100.0%) |
| 18 to 24 Years | 198 (100.0%) | 166 (100.0%) |
| 25 to 34 Years | 251 (98.4%) | 222 (95.7%) |
| 35 to 44 Years | 265 (96.0%) | 246 (91.4%) |
| 45 to 54 Years | 494 (100.0%) | 415 (91.6%) |
| 55 to 64 Years | 483 (93.6%) | 417 (100.0%) |
| 65 to 74 Years | 468 (96.9%) | 442 (97.4%) |
| 75 Years and over | 89 (100.0%) | 168 (87.5%) |
| Total | 3,065 (97.7%) | 2,557 (95.3%) |
Income Below Poverty Among Married-Couple Families in Hockinson
The poverty statistics for married-couple families in Hockinson show that 2.4% or 33 of the total 1,365 families live below the poverty line. Families with 3 or 4 children have the highest poverty rate of 5.5%, comprising of 10 families. On the other hand, families with 1 or 2 children have the lowest poverty rate of 0.0%, which includes 0 families.
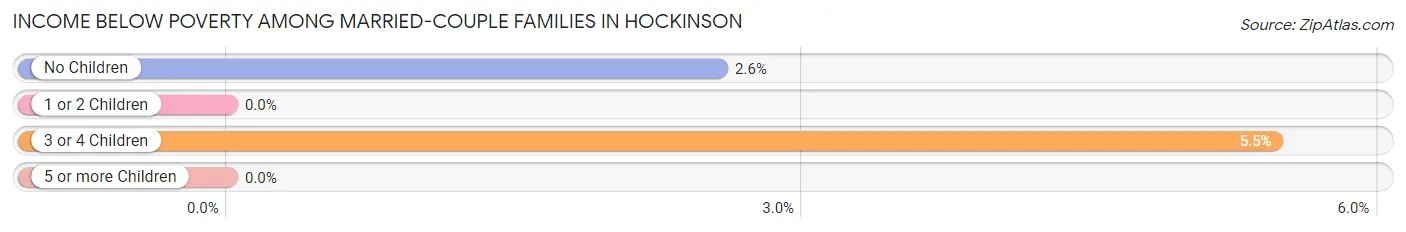
| Children | Above Poverty | Below Poverty |
| No Children | 875 (97.4%) | 23 (2.6%) |
| 1 or 2 Children | 253 (100.0%) | 0 (0.0%) |
| 3 or 4 Children | 173 (94.5%) | 10 (5.5%) |
| 5 or more Children | 31 (100.0%) | 0 (0.0%) |
| Total | 1,332 (97.6%) | 33 (2.4%) |
Income Below Poverty Among Single-Parent Households in Hockinson
| Children | Single Father | Single Mother |
| No Children | 0 (0.0%) | 0 (0.0%) |
| 1 or 2 Children | 0 (0.0%) | 0 (0.0%) |
| 3 or 4 Children | 0 (0.0%) | 0 (0.0%) |
| 5 or more Children | 0 (0.0%) | 0 (0.0%) |
| Total | 0 (0.0%) | 0 (0.0%) |
Income Below Poverty Among Married-Couple vs Single-Parent Households in Hockinson
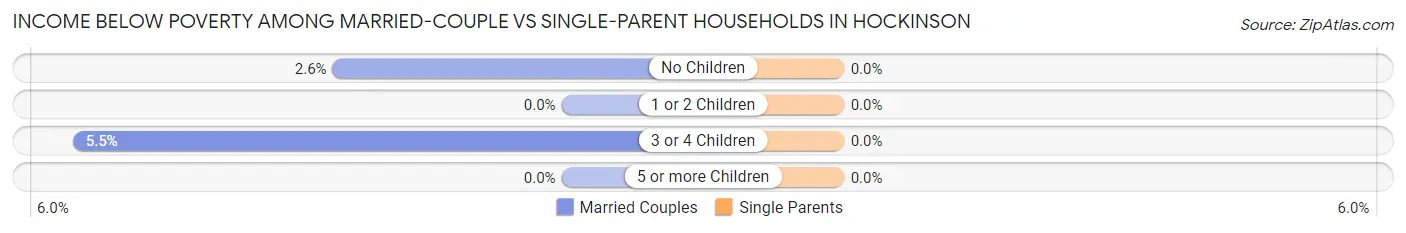
| Children | Married-Couple Families | Single-Parent Households |
| No Children | 23 (2.6%) | 0 (0.0%) |
| 1 or 2 Children | 0 (0.0%) | 0 (0.0%) |
| 3 or 4 Children | 10 (5.5%) | 0 (0.0%) |
| 5 or more Children | 0 (0.0%) | 0 (0.0%) |
| Total | 33 (2.4%) | 0 (0.0%) |
Race in Hockinson
The most populous races in Hockinson are White / Caucasian (5,554 | 95.2%), Two or more Races (160 | 2.7%), and Black / African American (46 | 0.8%).
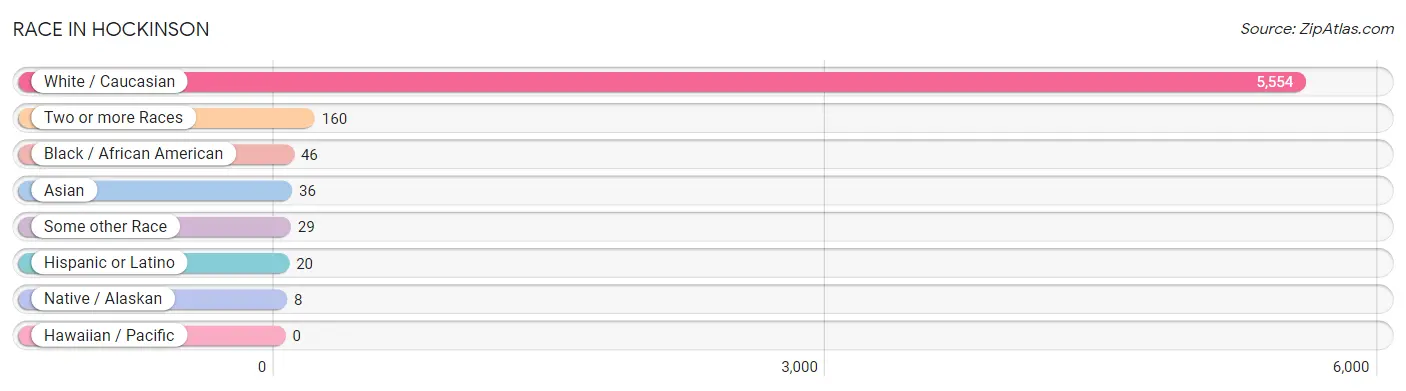
| Race | # Population | % Population |
| Asian | 36 | 0.6% |
| Black / African American | 46 | 0.8% |
| Hawaiian / Pacific | 0 | 0.0% |
| Hispanic or Latino | 20 | 0.3% |
| Native / Alaskan | 8 | 0.1% |
| White / Caucasian | 5,554 | 95.2% |
| Two or more Races | 160 | 2.7% |
| Some other Race | 29 | 0.5% |
| Total | 5,833 | 100.0% |
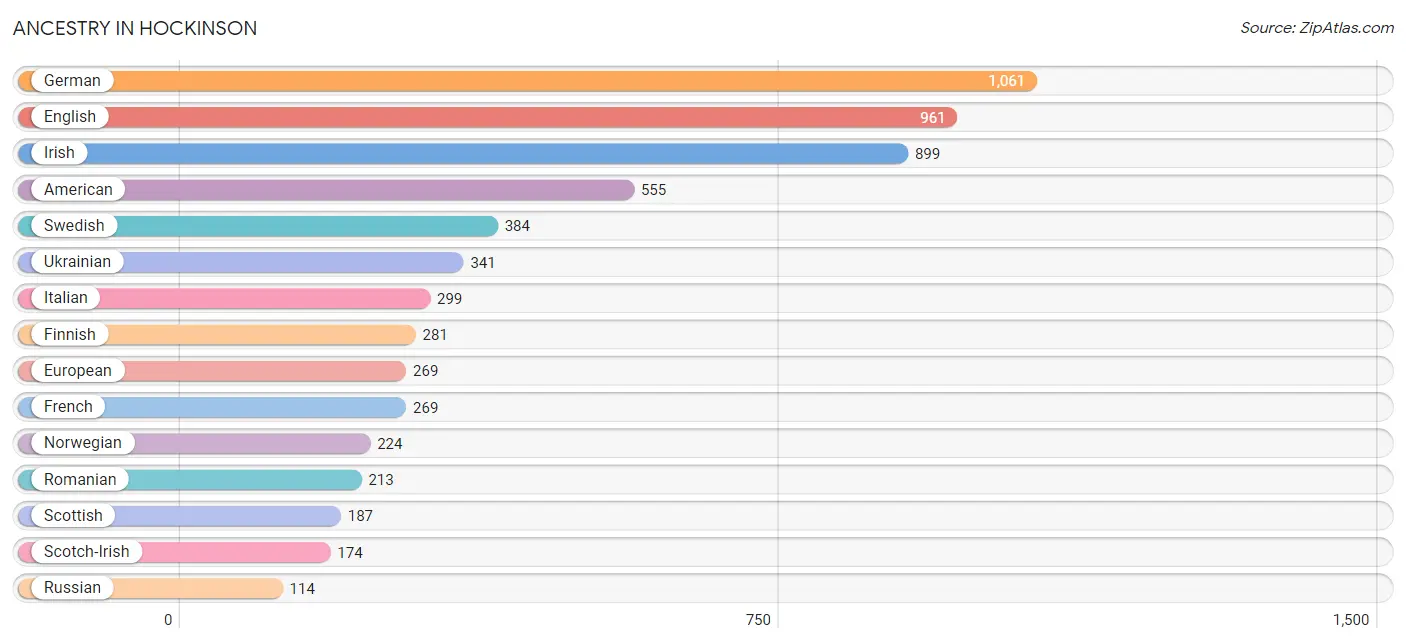
Ancestry in Hockinson
The most populous ancestries reported in Hockinson are German (1,061 | 18.2%), English (961 | 16.5%), Irish (899 | 15.4%), American (555 | 9.5%), and Swedish (384 | 6.6%), together accounting for 66.2% of all Hockinson residents.
| Ancestry | # Population | % Population |
| African | 32 | 0.5% |
| Aleut | 1 | 0.0% |
| American | 555 | 9.5% |
| British | 14 | 0.2% |
| Cherokee | 14 | 0.2% |
| Choctaw | 48 | 0.8% |
| Croatian | 43 | 0.7% |
| Czech | 42 | 0.7% |
| Danish | 36 | 0.6% |
| Dutch | 66 | 1.1% |
| Eastern European | 24 | 0.4% |
| English | 961 | 16.5% |
| European | 269 | 4.6% |
| Finnish | 281 | 4.8% |
| French | 269 | 4.6% |
| French Canadian | 47 | 0.8% |
| German | 1,061 | 18.2% |
| Hungarian | 27 | 0.5% |
| Icelander | 14 | 0.2% |
| Indian (Asian) | 18 | 0.3% |
| Indonesian | 14 | 0.2% |
| Irish | 899 | 15.4% |
| Italian | 299 | 5.1% |
| Korean | 6 | 0.1% |
| Lithuanian | 8 | 0.1% |
| Mexican | 13 | 0.2% |
| Northern European | 21 | 0.4% |
| Norwegian | 224 | 3.8% |
| Pakistani | 23 | 0.4% |
| Pennsylvania German | 81 | 1.4% |
| Polish | 69 | 1.2% |
| Romanian | 213 | 3.6% |
| Russian | 114 | 1.9% |
| Scandinavian | 67 | 1.1% |
| Scotch-Irish | 174 | 3.0% |
| Scottish | 187 | 3.2% |
| Slavic | 8 | 0.1% |
| Spaniard | 7 | 0.1% |
| Sri Lankan | 16 | 0.3% |
| Subsaharan African | 32 | 0.5% |
| Swedish | 384 | 6.6% |
| Swiss | 25 | 0.4% |
| Ukrainian | 341 | 5.9% |
| Welsh | 16 | 0.3% | View All 44 Rows |
Immigrants in Hockinson
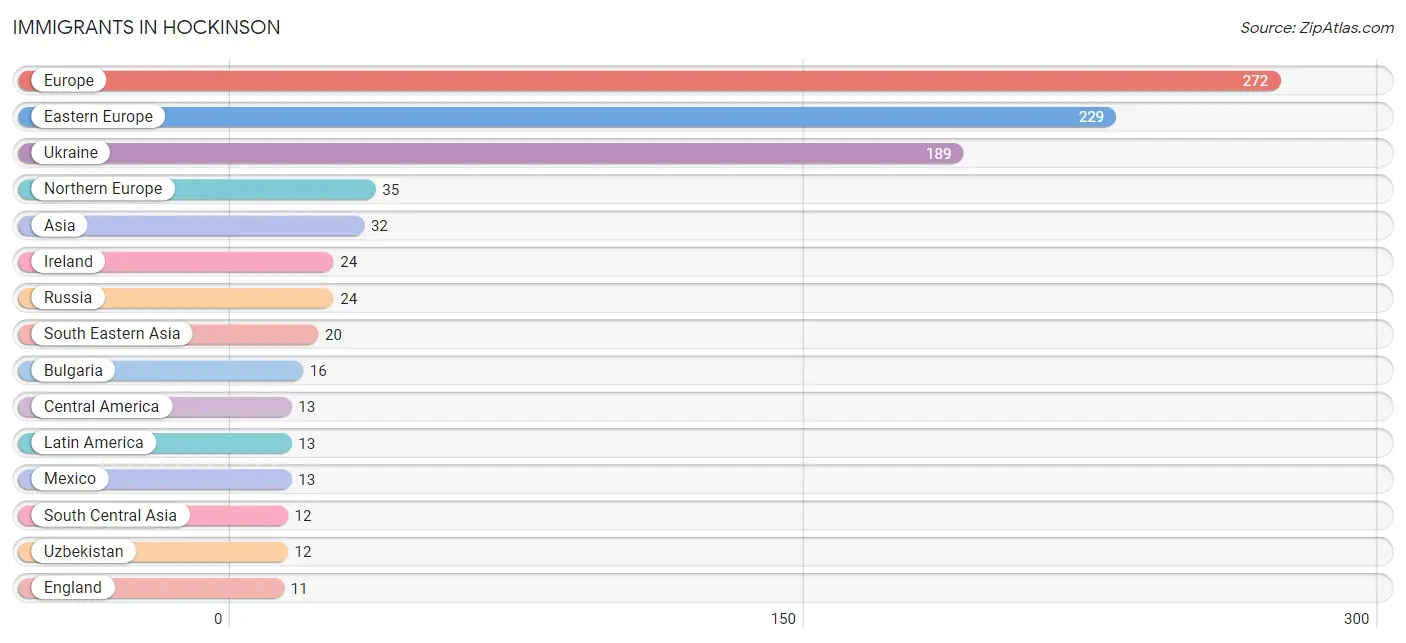
The most numerous immigrant groups reported in Hockinson came from Europe (272 | 4.7%), Eastern Europe (229 | 3.9%), Ukraine (189 | 3.2%), Northern Europe (35 | 0.6%), and Asia (32 | 0.5%), together accounting for 13.0% of all Hockinson residents.
| Immigration Origin | # Population | % Population |
| Asia | 32 | 0.5% |
| Bulgaria | 16 | 0.3% |
| Central America | 13 | 0.2% |
| Eastern Europe | 229 | 3.9% |
| England | 11 | 0.2% |
| Europe | 272 | 4.7% |
| Germany | 8 | 0.1% |
| Ireland | 24 | 0.4% |
| Latin America | 13 | 0.2% |
| Mexico | 13 | 0.2% |
| Northern Europe | 35 | 0.6% |
| Philippines | 6 | 0.1% |
| Russia | 24 | 0.4% |
| South Central Asia | 12 | 0.2% |
| South Eastern Asia | 20 | 0.3% |
| Ukraine | 189 | 3.2% |
| Uzbekistan | 12 | 0.2% |
| Western Europe | 8 | 0.1% | View All 18 Rows |
Sex and Age in Hockinson
Sex and Age in Hockinson
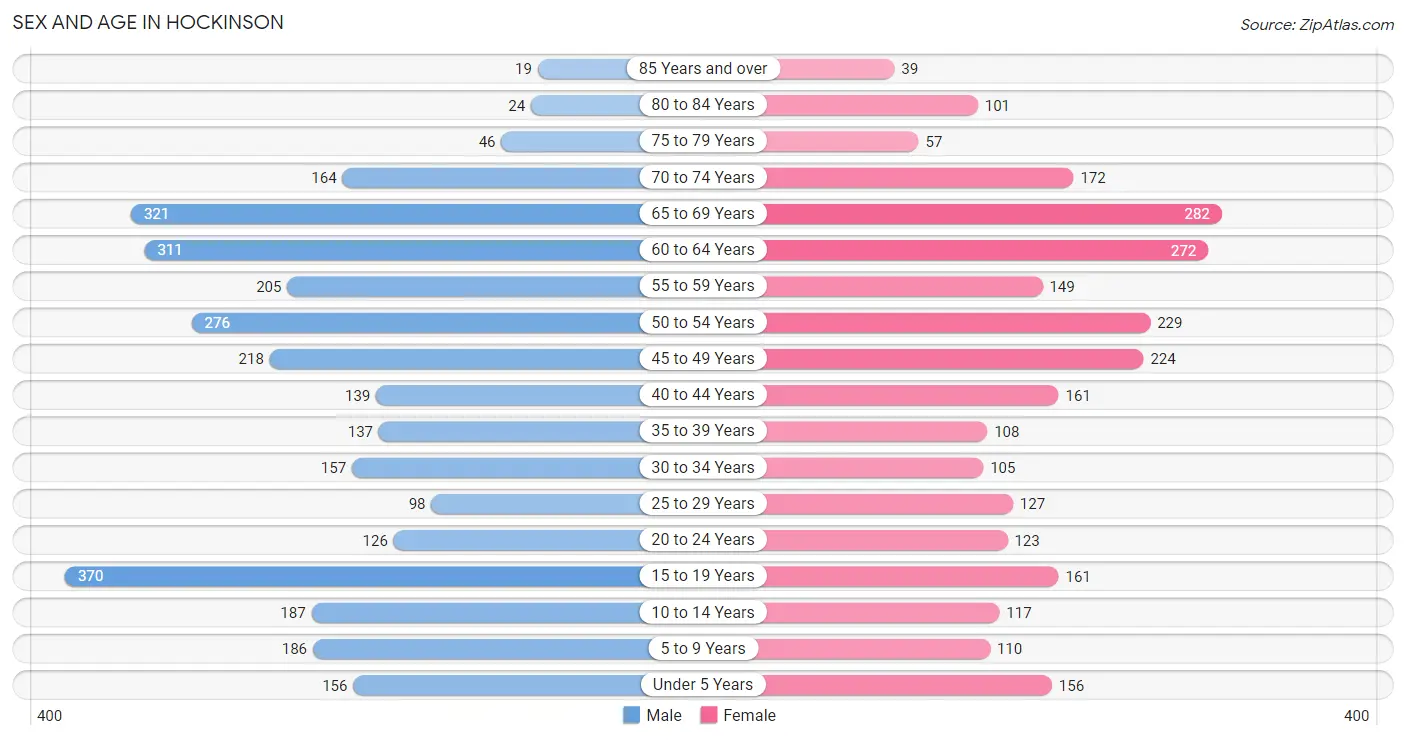
The most populous age groups in Hockinson are 15 to 19 Years (370 | 11.8%) for men and 65 to 69 Years (282 | 10.5%) for women.
| Age Bracket | Male | Female |
| Under 5 Years | 156 (5.0%) | 156 (5.8%) |
| 5 to 9 Years | 186 (5.9%) | 110 (4.1%) |
| 10 to 14 Years | 187 (6.0%) | 117 (4.3%) |
| 15 to 19 Years | 370 (11.8%) | 161 (6.0%) |
| 20 to 24 Years | 126 (4.0%) | 123 (4.6%) |
| 25 to 29 Years | 98 (3.1%) | 127 (4.7%) |
| 30 to 34 Years | 157 (5.0%) | 105 (3.9%) |
| 35 to 39 Years | 137 (4.4%) | 108 (4.0%) |
| 40 to 44 Years | 139 (4.4%) | 161 (6.0%) |
| 45 to 49 Years | 218 (6.9%) | 224 (8.3%) |
| 50 to 54 Years | 276 (8.8%) | 229 (8.5%) |
| 55 to 59 Years | 205 (6.5%) | 149 (5.5%) |
| 60 to 64 Years | 311 (9.9%) | 272 (10.1%) |
| 65 to 69 Years | 321 (10.2%) | 282 (10.5%) |
| 70 to 74 Years | 164 (5.2%) | 172 (6.4%) |
| 75 to 79 Years | 46 (1.5%) | 57 (2.1%) |
| 80 to 84 Years | 24 (0.8%) | 101 (3.7%) |
| 85 Years and over | 19 (0.6%) | 39 (1.5%) |
| Total | 3,140 (100.0%) | 2,693 (100.0%) |
Families and Households in Hockinson
Median Family Size in Hockinson
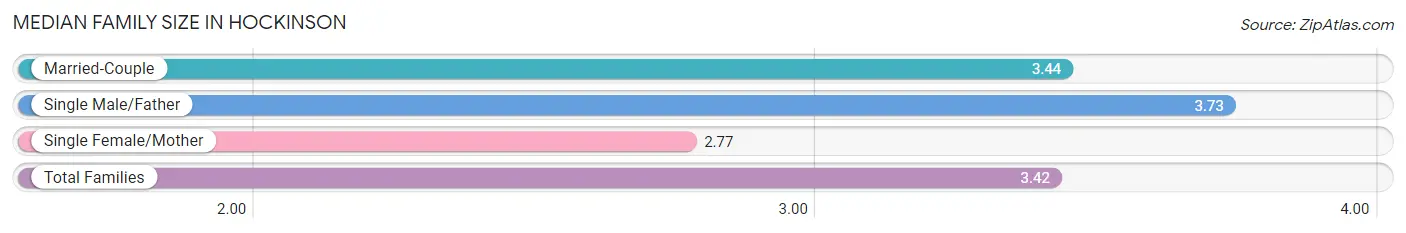
The median family size in Hockinson is 3.42 persons per family, with single male/father families (49 | 3.3%) accounting for the largest median family size of 3.73 persons per family. On the other hand, single female/mother families (62 | 4.2%) represent the smallest median family size with 2.77 persons per family.
| Family Type | # Families | Family Size |
| Married-Couple | 1,365 (92.5%) | 3.44 |
| Single Male/Father | 49 (3.3%) | 3.73 |
| Single Female/Mother | 62 (4.2%) | 2.77 |
| Total Families | 1,476 (100.0%) | 3.42 |
Median Household Size in Hockinson
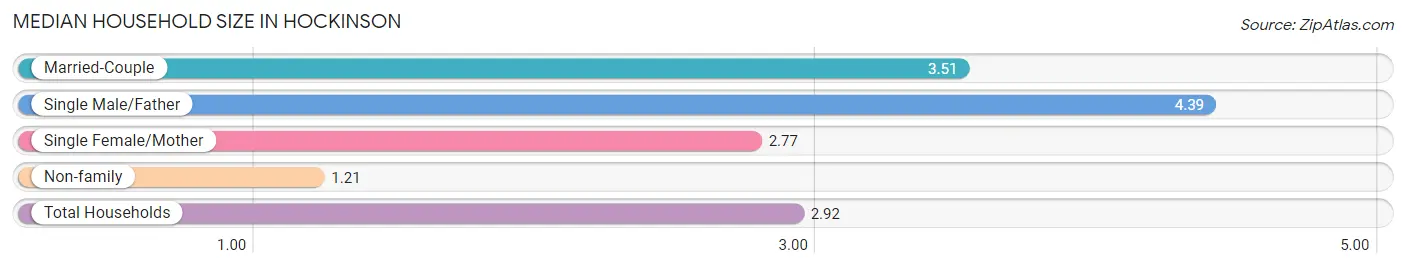
The median household size in Hockinson is 2.92 persons per household, with single male/father households (49 | 2.5%) accounting for the largest median household size of 4.39 persons per household. non-family households (514 | 25.8%) represent the smallest median household size with 1.21 persons per household.
| Household Type | # Households | Household Size |
| Married-Couple | 1,365 (68.6%) | 3.51 |
| Single Male/Father | 49 (2.5%) | 4.39 |
| Single Female/Mother | 62 (3.1%) | 2.77 |
| Non-family | 514 (25.8%) | 1.21 |
| Total Households | 1,990 (100.0%) | 2.92 |
Household Size by Marriage Status in Hockinson
Out of a total of 1,990 households in Hockinson, 1,476 (74.2%) are family households, while 514 (25.8%) are nonfamily households. The most numerous type of family households are 2-person households, comprising 691, and the most common type of nonfamily households are 1-person households, comprising 404.
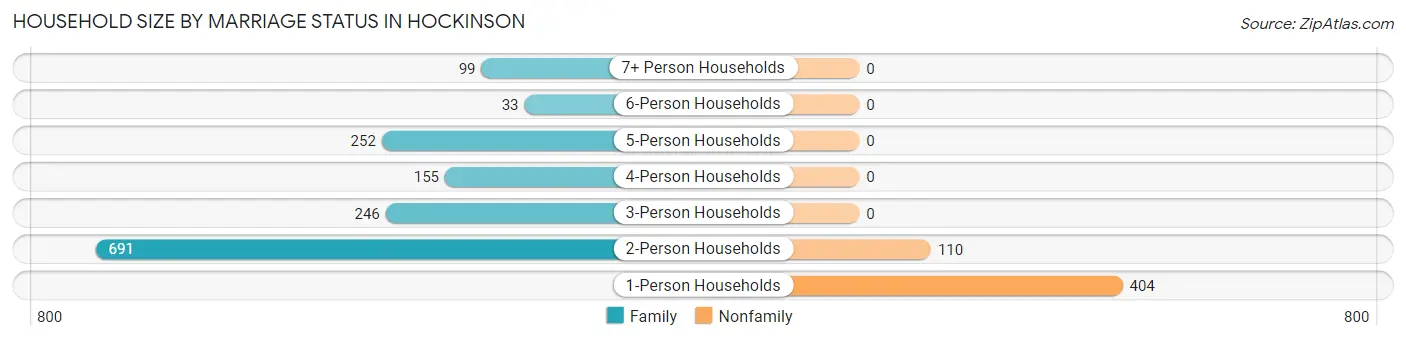
| Household Size | Family Households | Nonfamily Households |
| 1-Person Households | - | 404 (20.3%) |
| 2-Person Households | 691 (34.7%) | 110 (5.5%) |
| 3-Person Households | 246 (12.4%) | 0 (0.0%) |
| 4-Person Households | 155 (7.8%) | 0 (0.0%) |
| 5-Person Households | 252 (12.7%) | 0 (0.0%) |
| 6-Person Households | 33 (1.7%) | 0 (0.0%) |
| 7+ Person Households | 99 (5.0%) | 0 (0.0%) |
| Total | 1,476 (74.2%) | 514 (25.8%) |
Female Fertility in Hockinson
Fertility by Age in Hockinson
Average fertility rate in Hockinson is 71.0 births per 1,000 women. Women in the age bracket of 20 to 34 years have the highest fertility rate with 208.0 births per 1,000 women. Women in the age bracket of 20 to 34 years acount for 100.0% of all women with births.
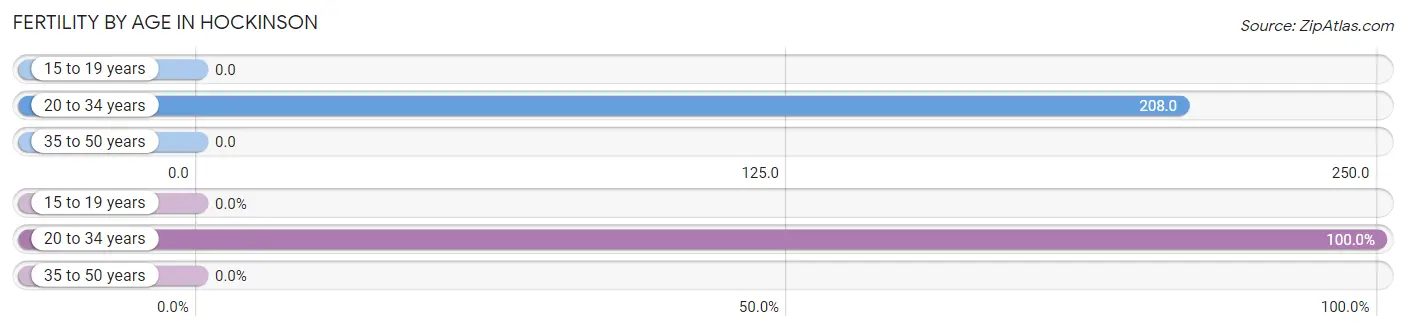
| Age Bracket | Women with Births | Births / 1,000 Women |
| 15 to 19 years | 0 (0.0%) | 0.0 |
| 20 to 34 years | 74 (100.0%) | 208.0 |
| 35 to 50 years | 0 (0.0%) | 0.0 |
| Total | 74 (100.0%) | 71.0 |
Fertility by Age by Marriage Status in Hockinson
74.3% of women with births (74) in Hockinson are married. The highest percentage of unmarried women with births falls into 20 to 34 years age bracket with 25.7% of them unmarried at the time of birth, while the lowest percentage of unmarried women with births belong to 20 to 34 years age bracket with 25.7% of them unmarried.
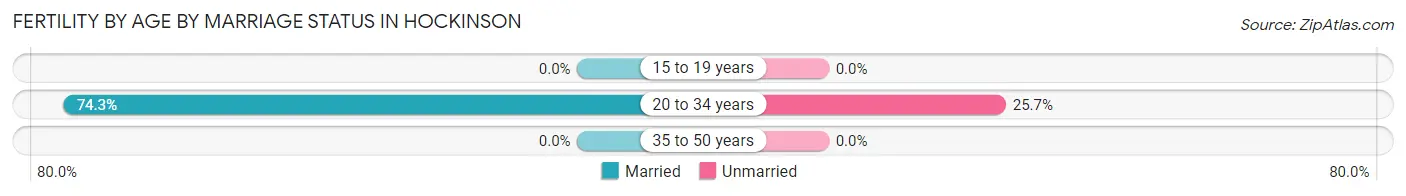
| Age Bracket | Married | Unmarried |
| 15 to 19 years | 0 (0.0%) | 0 (0.0%) |
| 20 to 34 years | 55 (74.3%) | 19 (25.7%) |
| 35 to 50 years | 0 (0.0%) | 0 (0.0%) |
| Total | 55 (74.3%) | 19 (25.7%) |
Fertility by Education in Hockinson
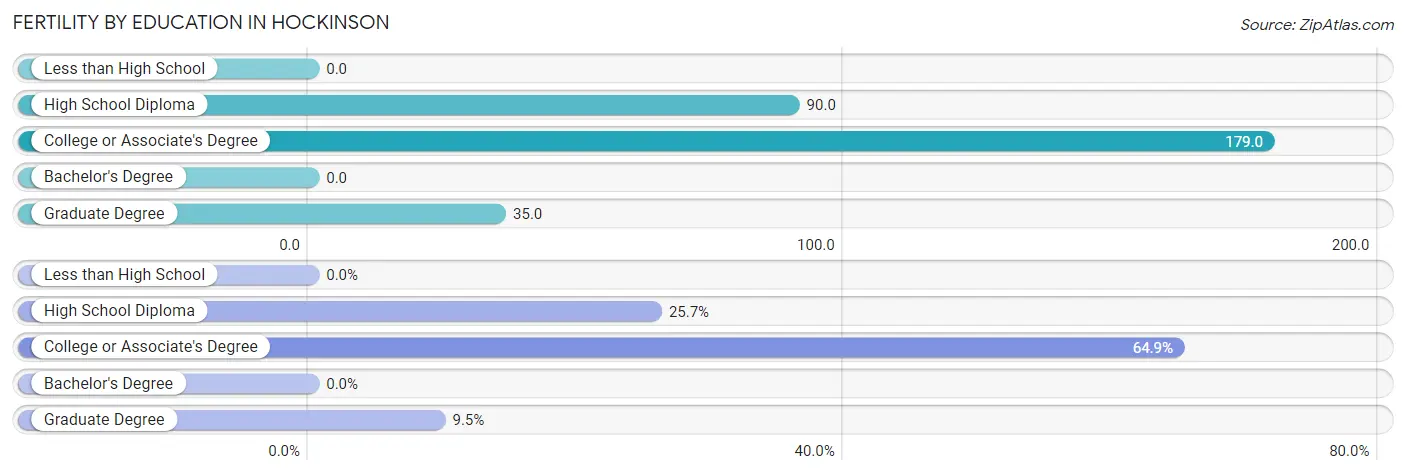
| Educational Attainment | Women with Births | Births / 1,000 Women |
| Less than High School | 0 (0.0%) | 0.0 |
| High School Diploma | 19 (25.7%) | 90.0 |
| College or Associate's Degree | 48 (64.9%) | 179.0 |
| Bachelor's Degree | 0 (0.0%) | 0.0 |
| Graduate Degree | 7 (9.5%) | 35.0 |
| Total | 74 (100.0%) | 71.0 |
Fertility by Education by Marriage Status in Hockinson
25.7% of women with births in Hockinson are unmarried. Women with the educational attainment of college or associate's degree are most likely to be married with 100.0% of them married at childbirth, while women with the educational attainment of high school diploma are least likely to be married with 100.0% of them unmarried at childbirth.
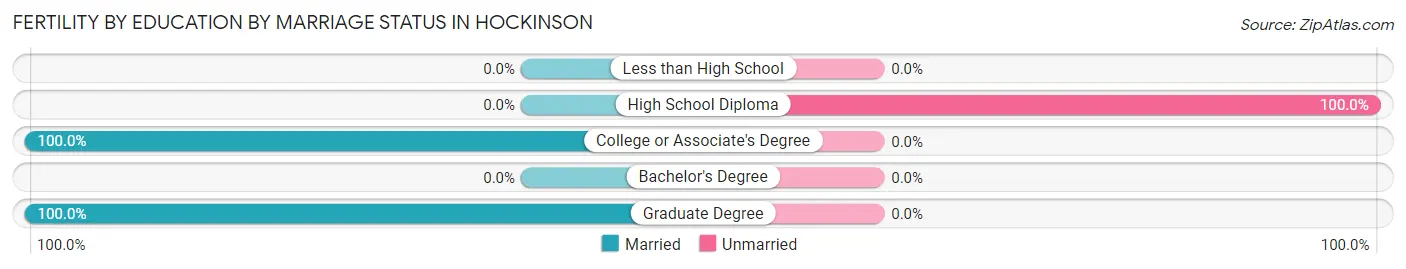
| Educational Attainment | Married | Unmarried |
| Less than High School | 0 (0.0%) | 0 (0.0%) |
| High School Diploma | 0 (0.0%) | 19 (100.0%) |
| College or Associate's Degree | 48 (100.0%) | 0 (0.0%) |
| Bachelor's Degree | 0 (0.0%) | 0 (0.0%) |
| Graduate Degree | 7 (100.0%) | 0 (0.0%) |
| Total | 55 (74.3%) | 19 (25.7%) |
Employment Characteristics in Hockinson
Employment by Class of Employer in Hockinson
Among the 2,518 employed individuals in Hockinson, private company employees (1,237 | 49.1%), self-employed (incorporated) (424 | 16.8%), and self-employed (not incorporated) (214 | 8.5%) make up the most common classes of employment.
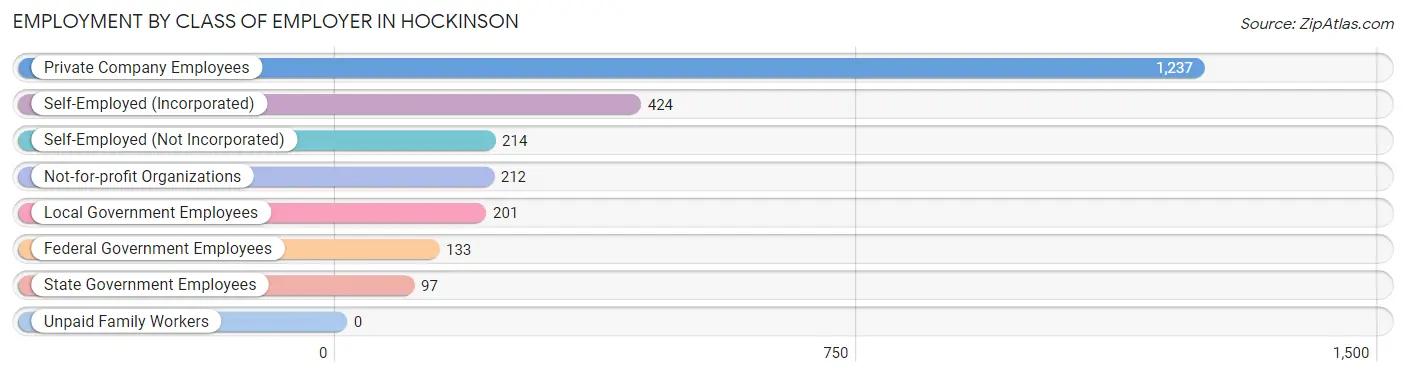
| Employer Class | # Employees | % Employees |
| Private Company Employees | 1,237 | 49.1% |
| Self-Employed (Incorporated) | 424 | 16.8% |
| Self-Employed (Not Incorporated) | 214 | 8.5% |
| Not-for-profit Organizations | 212 | 8.4% |
| Local Government Employees | 201 | 8.0% |
| State Government Employees | 97 | 3.8% |
| Federal Government Employees | 133 | 5.3% |
| Unpaid Family Workers | 0 | 0.0% |
| Total | 2,518 | 100.0% |
Employment Status by Age in Hockinson
According to the labor force statistics for Hockinson, out of the total population over 16 years of age (4,733), 55.2% or 2,613 individuals are in the labor force, with 2.1% or 55 of them unemployed. The age group with the highest labor force participation rate is 25 to 29 years, with 91.1% or 205 individuals in the labor force. Within the labor force, the 16 to 19 years age range has the highest percentage of unemployed individuals, with 34.3% or 12 of them being unemployed.
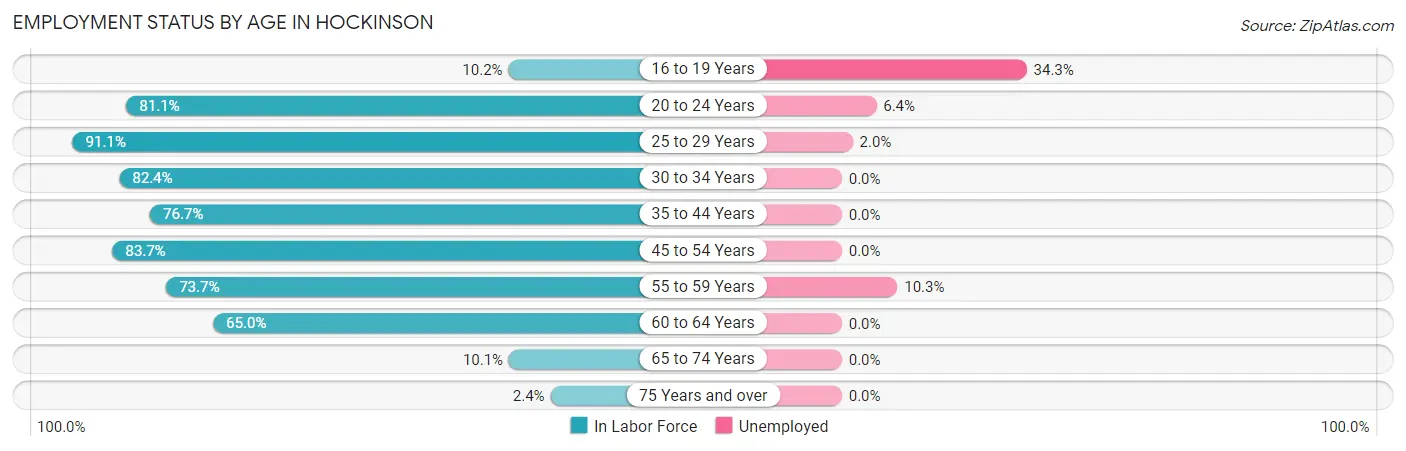
| Age Bracket | In Labor Force | Unemployed |
| 16 to 19 Years | 35 (10.2%) | 12 (34.3%) |
| 20 to 24 Years | 202 (81.1%) | 13 (6.4%) |
| 25 to 29 Years | 205 (91.1%) | 4 (2.0%) |
| 30 to 34 Years | 216 (82.4%) | 0 (0.0%) |
| 35 to 44 Years | 418 (76.7%) | 0 (0.0%) |
| 45 to 54 Years | 793 (83.7%) | 0 (0.0%) |
| 55 to 59 Years | 261 (73.7%) | 27 (10.3%) |
| 60 to 64 Years | 379 (65.0%) | 0 (0.0%) |
| 65 to 74 Years | 95 (10.1%) | 0 (0.0%) |
| 75 Years and over | 7 (2.4%) | 0 (0.0%) |
| Total | 2,613 (55.2%) | 55 (2.1%) |
Employment Status by Educational Attainment in Hockinson
According to labor force statistics for Hockinson, 77.9% of individuals (2,272) out of the total population between 25 and 64 years of age (2,916) are in the labor force, with 1.4% or 32 of them being unemployed. The group with the highest labor force participation rate are those with the educational attainment of bachelor's degree or higher, with 87.2% or 1,101 individuals in the labor force. Within the labor force, individuals with bachelor's degree or higher education have the highest percentage of unemployment, with 2.5% or 28 of them being unemployed.
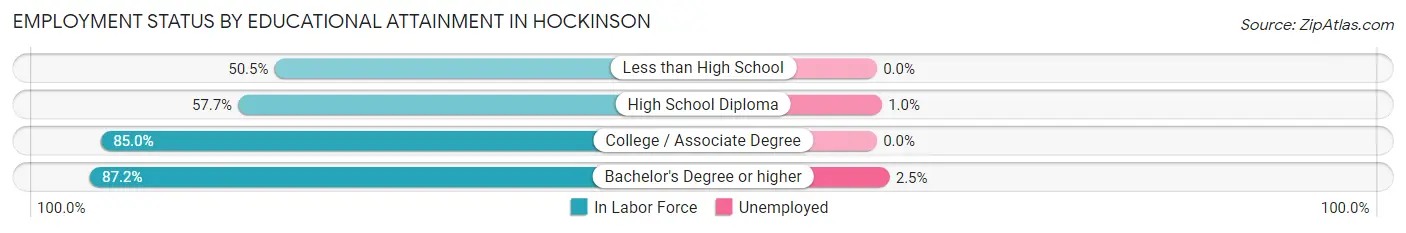
| Educational Attainment | In Labor Force | Unemployed |
| Less than High School | 54 (50.5%) | 0 (0.0%) |
| High School Diploma | 416 (57.7%) | 7 (1.0%) |
| College / Associate Degree | 701 (85.0%) | 0 (0.0%) |
| Bachelor's Degree or higher | 1,101 (87.2%) | 32 (2.5%) |
| Total | 2,272 (77.9%) | 41 (1.4%) |
Employment Occupations by Sex in Hockinson
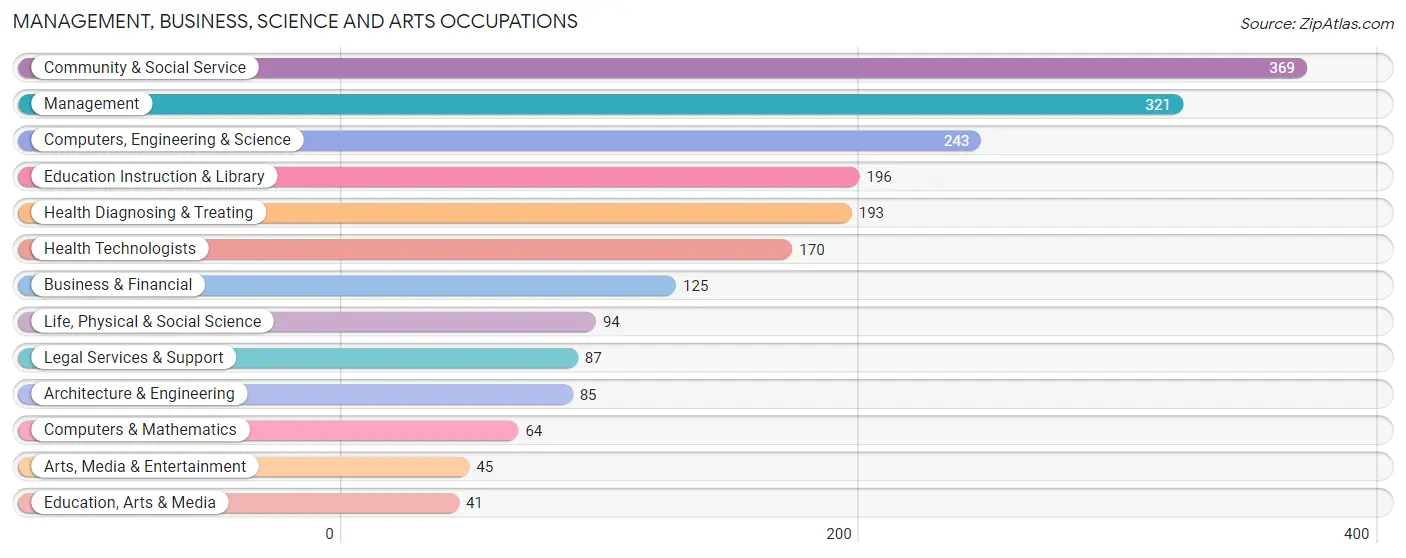
Management, Business, Science and Arts Occupations
The most common Management, Business, Science and Arts occupations in Hockinson are Community & Social Service (369 | 14.4%), Management (321 | 12.6%), Computers, Engineering & Science (243 | 9.5%), Education Instruction & Library (196 | 7.7%), and Health Diagnosing & Treating (193 | 7.5%).
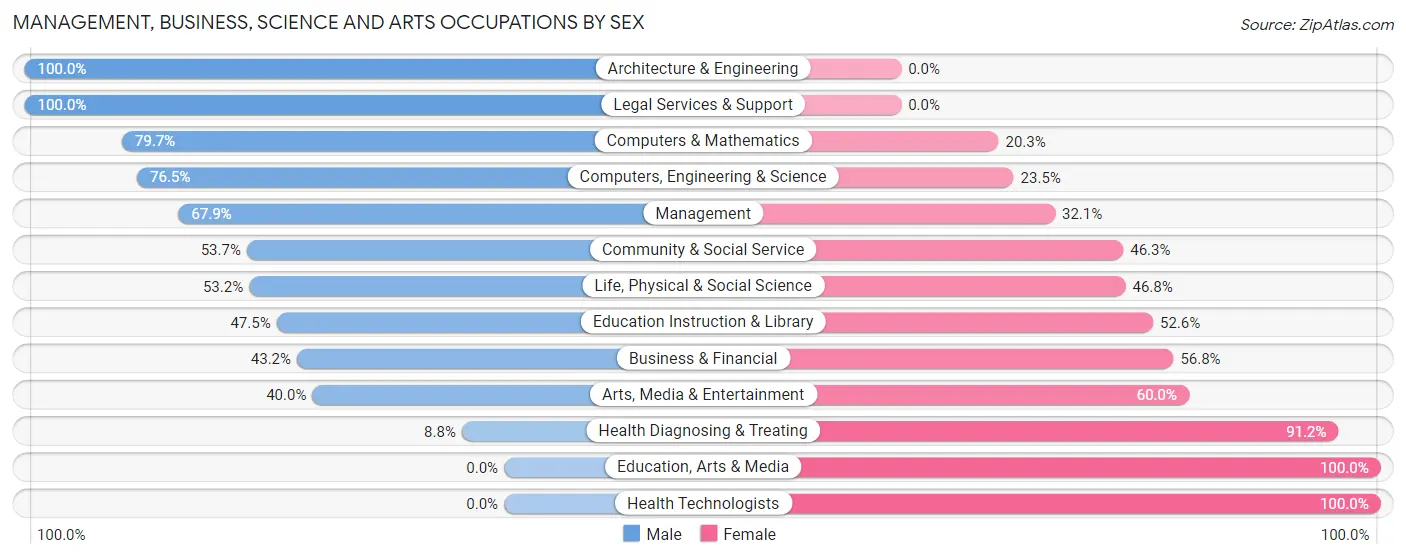
Management, Business, Science and Arts Occupations by Sex
Within the Management, Business, Science and Arts occupations in Hockinson, the most male-oriented occupations are Architecture & Engineering (100.0%), Legal Services & Support (100.0%), and Computers & Mathematics (79.7%), while the most female-oriented occupations are Education, Arts & Media (100.0%), Health Technologists (100.0%), and Health Diagnosing & Treating (91.2%).
| Occupation | Male | Female |
| Management | 218 (67.9%) | 103 (32.1%) |
| Business & Financial | 54 (43.2%) | 71 (56.8%) |
| Computers, Engineering & Science | 186 (76.5%) | 57 (23.5%) |
| Computers & Mathematics | 51 (79.7%) | 13 (20.3%) |
| Architecture & Engineering | 85 (100.0%) | 0 (0.0%) |
| Life, Physical & Social Science | 50 (53.2%) | 44 (46.8%) |
| Community & Social Service | 198 (53.7%) | 171 (46.3%) |
| Education, Arts & Media | 0 (0.0%) | 41 (100.0%) |
| Legal Services & Support | 87 (100.0%) | 0 (0.0%) |
| Education Instruction & Library | 93 (47.4%) | 103 (52.5%) |
| Arts, Media & Entertainment | 18 (40.0%) | 27 (60.0%) |
| Health Diagnosing & Treating | 17 (8.8%) | 176 (91.2%) |
| Health Technologists | 0 (0.0%) | 170 (100.0%) |
| Total (Category) | 673 (53.8%) | 578 (46.2%) |
| Total (Overall) | 1,457 (57.0%) | 1,098 (43.0%) |
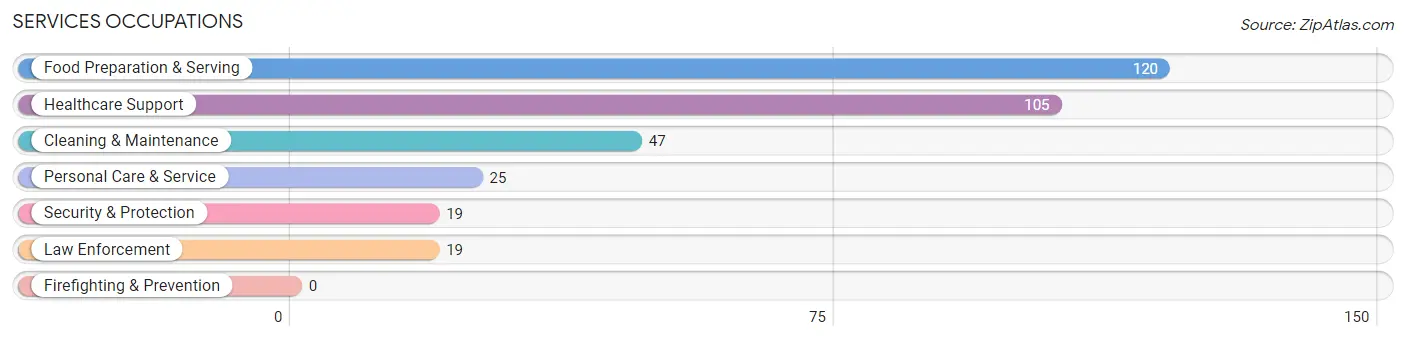
Services Occupations
The most common Services occupations in Hockinson are Food Preparation & Serving (120 | 4.7%), Healthcare Support (105 | 4.1%), Cleaning & Maintenance (47 | 1.8%), Personal Care & Service (25 | 1.0%), and Security & Protection (19 | 0.7%).
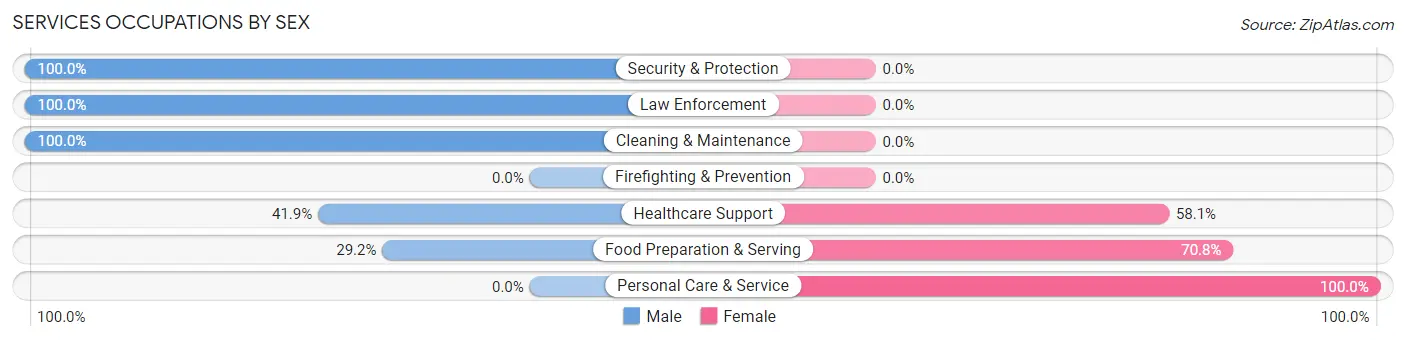
Services Occupations by Sex
Within the Services occupations in Hockinson, the most male-oriented occupations are Security & Protection (100.0%), Law Enforcement (100.0%), and Cleaning & Maintenance (100.0%), while the most female-oriented occupations are Personal Care & Service (100.0%), Food Preparation & Serving (70.8%), and Healthcare Support (58.1%).
| Occupation | Male | Female |
| Healthcare Support | 44 (41.9%) | 61 (58.1%) |
| Security & Protection | 19 (100.0%) | 0 (0.0%) |
| Firefighting & Prevention | 0 (0.0%) | 0 (0.0%) |
| Law Enforcement | 19 (100.0%) | 0 (0.0%) |
| Food Preparation & Serving | 35 (29.2%) | 85 (70.8%) |
| Cleaning & Maintenance | 47 (100.0%) | 0 (0.0%) |
| Personal Care & Service | 0 (0.0%) | 25 (100.0%) |
| Total (Category) | 145 (45.9%) | 171 (54.1%) |
| Total (Overall) | 1,457 (57.0%) | 1,098 (43.0%) |
Sales and Office Occupations
The most common Sales and Office occupations in Hockinson are Office & Administration (298 | 11.7%), and Sales & Related (181 | 7.1%).
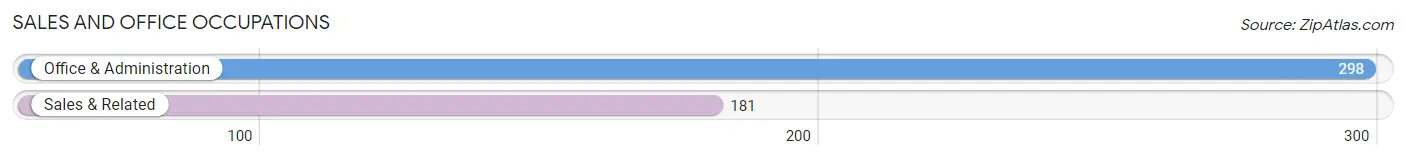
Sales and Office Occupations by Sex
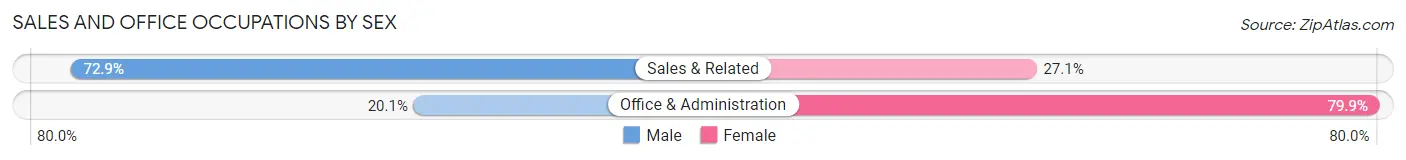
| Occupation | Male | Female |
| Sales & Related | 132 (72.9%) | 49 (27.1%) |
| Office & Administration | 60 (20.1%) | 238 (79.9%) |
| Total (Category) | 192 (40.1%) | 287 (59.9%) |
| Total (Overall) | 1,457 (57.0%) | 1,098 (43.0%) |
Natural Resources, Construction and Maintenance Occupations
The most common Natural Resources, Construction and Maintenance occupations in Hockinson are Construction & Extraction (155 | 6.1%), and Installation, Maintenance & Repair (138 | 5.4%).
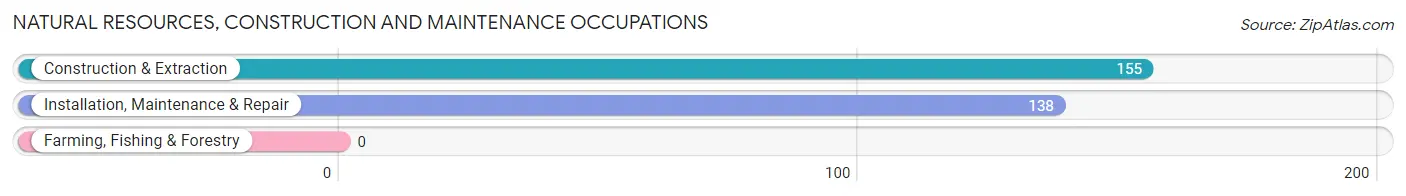
Natural Resources, Construction and Maintenance Occupations by Sex
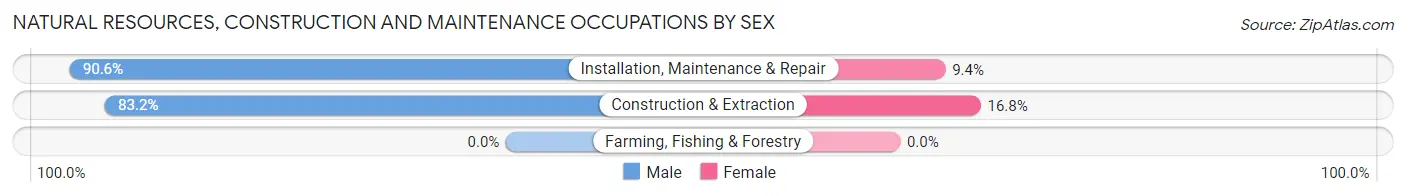
| Occupation | Male | Female |
| Farming, Fishing & Forestry | 0 (0.0%) | 0 (0.0%) |
| Construction & Extraction | 129 (83.2%) | 26 (16.8%) |
| Installation, Maintenance & Repair | 125 (90.6%) | 13 (9.4%) |
| Total (Category) | 254 (86.7%) | 39 (13.3%) |
| Total (Overall) | 1,457 (57.0%) | 1,098 (43.0%) |
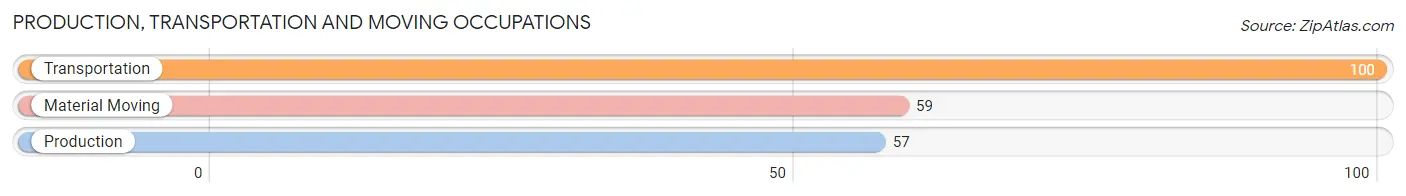
Production, Transportation and Moving Occupations
The most common Production, Transportation and Moving occupations in Hockinson are Transportation (100 | 3.9%), Material Moving (59 | 2.3%), and Production (57 | 2.2%).
Production, Transportation and Moving Occupations by Sex
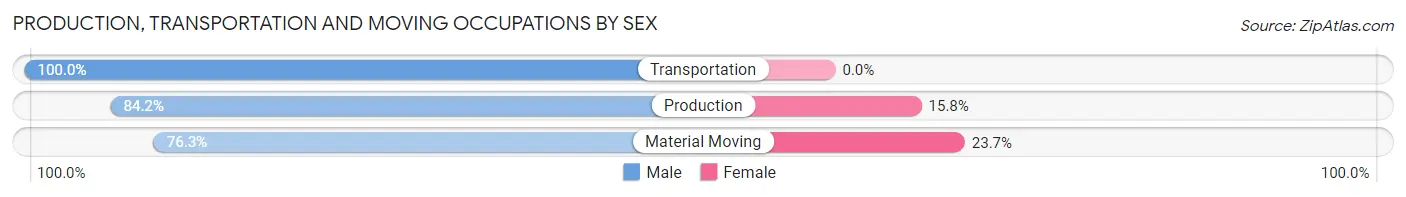
| Occupation | Male | Female |
| Production | 48 (84.2%) | 9 (15.8%) |
| Transportation | 100 (100.0%) | 0 (0.0%) |
| Material Moving | 45 (76.3%) | 14 (23.7%) |
| Total (Category) | 193 (89.3%) | 23 (10.6%) |
| Total (Overall) | 1,457 (57.0%) | 1,098 (43.0%) |
Employment Industries by Sex in Hockinson
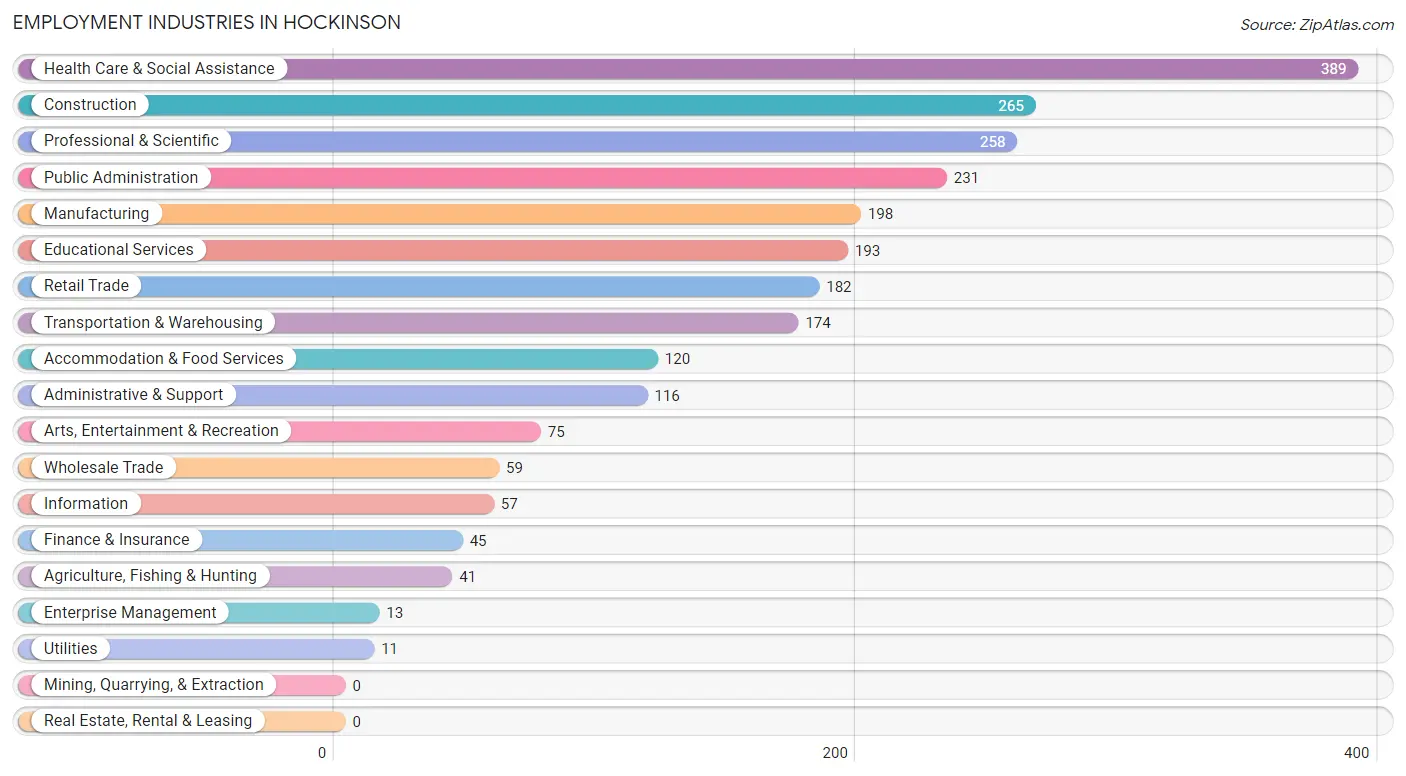
Employment Industries in Hockinson
The major employment industries in Hockinson include Health Care & Social Assistance (389 | 15.2%), Construction (265 | 10.4%), Professional & Scientific (258 | 10.1%), Public Administration (231 | 9.0%), and Manufacturing (198 | 7.7%).
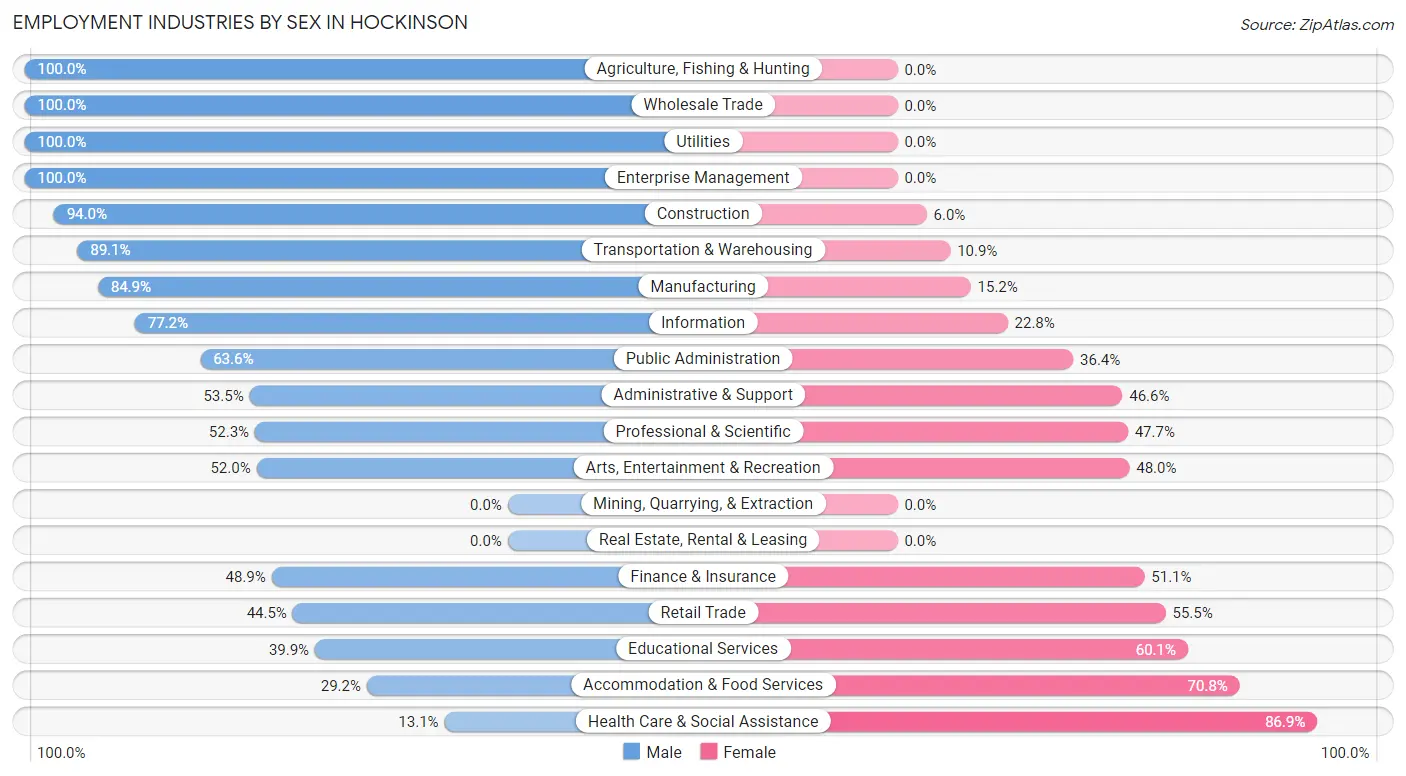
Employment Industries by Sex in Hockinson
The Hockinson industries that see more men than women are Agriculture, Fishing & Hunting (100.0%), Wholesale Trade (100.0%), and Utilities (100.0%), whereas the industries that tend to have a higher number of women are Health Care & Social Assistance (86.9%), Accommodation & Food Services (70.8%), and Educational Services (60.1%).
| Industry | Male | Female |
| Agriculture, Fishing & Hunting | 41 (100.0%) | 0 (0.0%) |
| Mining, Quarrying, & Extraction | 0 (0.0%) | 0 (0.0%) |
| Construction | 249 (94.0%) | 16 (6.0%) |
| Manufacturing | 168 (84.9%) | 30 (15.1%) |
| Wholesale Trade | 59 (100.0%) | 0 (0.0%) |
| Retail Trade | 81 (44.5%) | 101 (55.5%) |
| Transportation & Warehousing | 155 (89.1%) | 19 (10.9%) |
| Utilities | 11 (100.0%) | 0 (0.0%) |
| Information | 44 (77.2%) | 13 (22.8%) |
| Finance & Insurance | 22 (48.9%) | 23 (51.1%) |
| Real Estate, Rental & Leasing | 0 (0.0%) | 0 (0.0%) |
| Professional & Scientific | 135 (52.3%) | 123 (47.7%) |
| Enterprise Management | 13 (100.0%) | 0 (0.0%) |
| Administrative & Support | 62 (53.4%) | 54 (46.6%) |
| Educational Services | 77 (39.9%) | 116 (60.1%) |
| Health Care & Social Assistance | 51 (13.1%) | 338 (86.9%) |
| Arts, Entertainment & Recreation | 39 (52.0%) | 36 (48.0%) |
| Accommodation & Food Services | 35 (29.2%) | 85 (70.8%) |
| Public Administration | 147 (63.6%) | 84 (36.4%) |
| Total | 1,457 (57.0%) | 1,098 (43.0%) |
Education in Hockinson
School Enrollment in Hockinson
The most common levels of schooling among the 1,213 students in Hockinson are high school (520 | 42.9%), middle school (264 | 21.8%), and elementary school (259 | 21.3%).
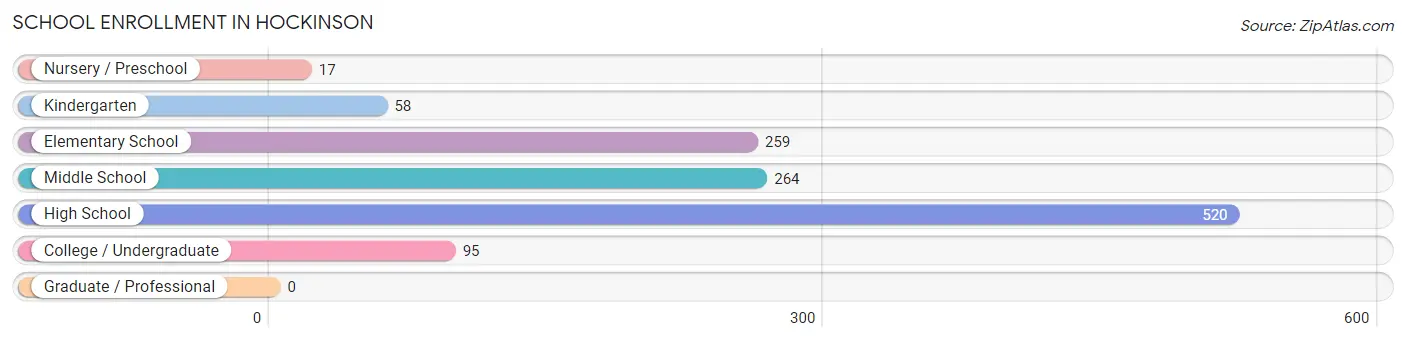
| School Level | # Students | % Students |
| Nursery / Preschool | 17 | 1.4% |
| Kindergarten | 58 | 4.8% |
| Elementary School | 259 | 21.3% |
| Middle School | 264 | 21.8% |
| High School | 520 | 42.9% |
| College / Undergraduate | 95 | 7.8% |
| Graduate / Professional | 0 | 0.0% |
| Total | 1,213 | 100.0% |
School Enrollment by Age by Funding Source in Hockinson
Out of a total of 1,213 students who are enrolled in schools in Hockinson, 114 (9.4%) attend a private institution, while the remaining 1,099 (90.6%) are enrolled in public schools. The age group of 20 to 24 year olds has the highest likelihood of being enrolled in private schools, with 32 (46.4% in the age bracket) enrolled. Conversely, the age group of 3 to 4 year olds has the lowest likelihood of being enrolled in a private school, with 17 (100.0% in the age bracket) attending a public institution.
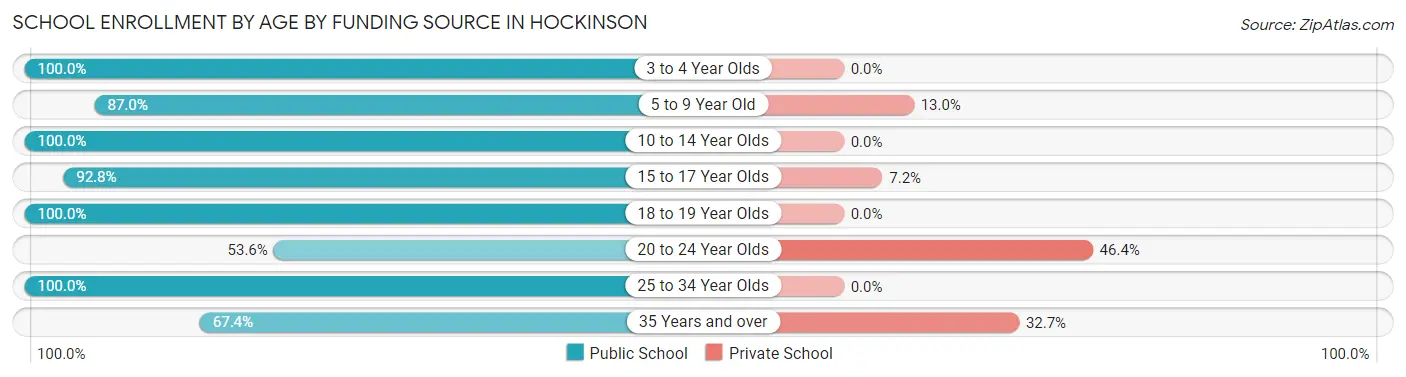
| Age Bracket | Public School | Private School |
| 3 to 4 Year Olds | 17 (100.0%) | 0 (0.0%) |
| 5 to 9 Year Old | 240 (87.0%) | 36 (13.0%) |
| 10 to 14 Year Olds | 280 (100.0%) | 0 (0.0%) |
| 15 to 17 Year Olds | 386 (92.8%) | 30 (7.2%) |
| 18 to 19 Year Olds | 93 (100.0%) | 0 (0.0%) |
| 20 to 24 Year Olds | 37 (53.6%) | 32 (46.4%) |
| 25 to 34 Year Olds | 13 (100.0%) | 0 (0.0%) |
| 35 Years and over | 33 (67.3%) | 16 (32.7%) |
| Total | 1,099 (90.6%) | 114 (9.4%) |
Educational Attainment by Field of Study in Hockinson
Business (453 | 25.0%), bio, nature & agricultural (289 | 16.0%), education (221 | 12.2%), engineering (135 | 7.4%), and arts & humanities (135 | 7.4%) are the most common fields of study among 1,811 individuals in Hockinson who have obtained a bachelor's degree or higher.
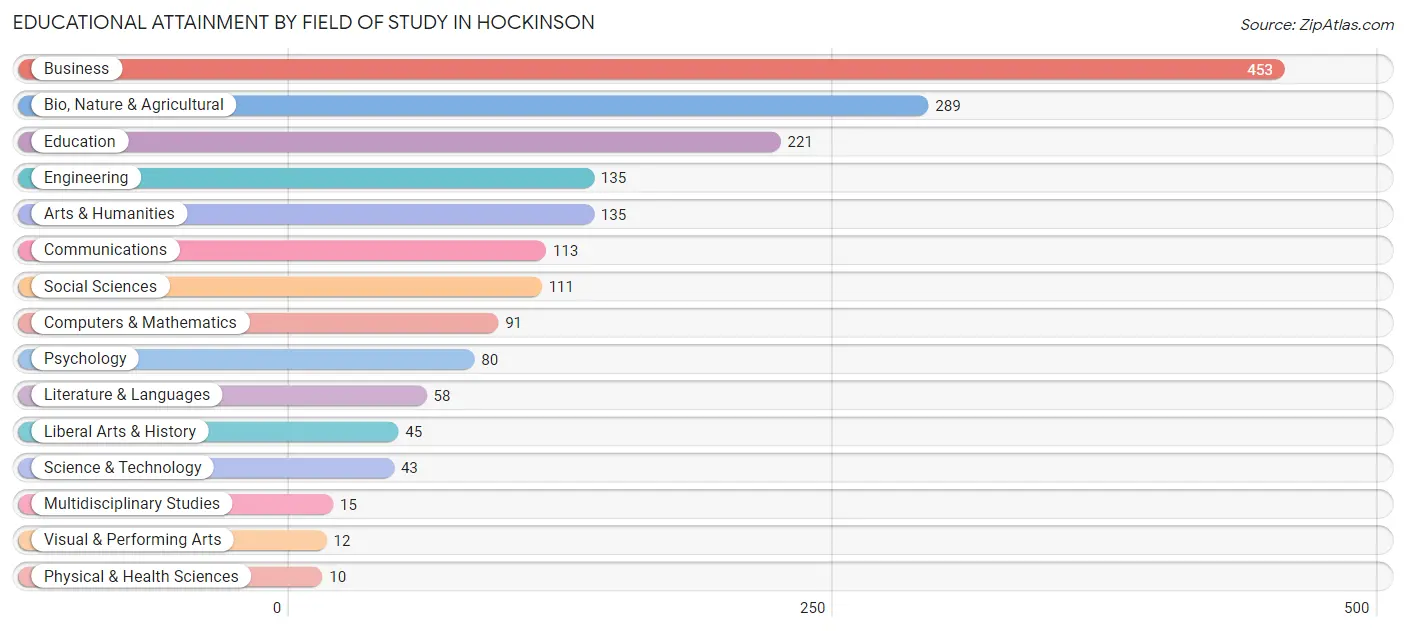
| Field of Study | # Graduates | % Graduates |
| Computers & Mathematics | 91 | 5.0% |
| Bio, Nature & Agricultural | 289 | 16.0% |
| Physical & Health Sciences | 10 | 0.5% |
| Psychology | 80 | 4.4% |
| Social Sciences | 111 | 6.1% |
| Engineering | 135 | 7.4% |
| Multidisciplinary Studies | 15 | 0.8% |
| Science & Technology | 43 | 2.4% |
| Business | 453 | 25.0% |
| Education | 221 | 12.2% |
| Literature & Languages | 58 | 3.2% |
| Liberal Arts & History | 45 | 2.5% |
| Visual & Performing Arts | 12 | 0.7% |
| Communications | 113 | 6.2% |
| Arts & Humanities | 135 | 7.4% |
| Total | 1,811 | 100.0% |
Transportation & Commute in Hockinson
Vehicle Availability by Sex in Hockinson
The most prevalent vehicle ownership categories in Hockinson are males with 3 vehicles (441, accounting for 30.5%) and females with 3 vehicles (347, making up 41.2%).
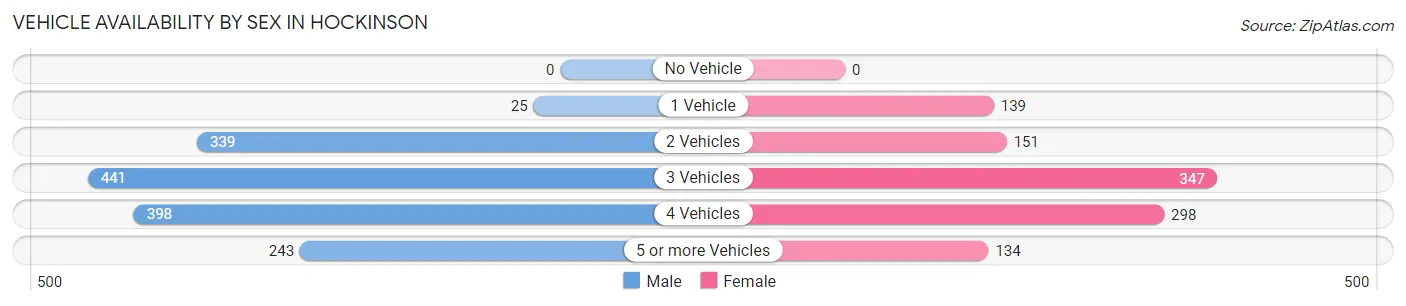
| Vehicles Available | Male | Female |
| No Vehicle | 0 (0.0%) | 0 (0.0%) |
| 1 Vehicle | 25 (1.7%) | 139 (13.0%) |
| 2 Vehicles | 339 (23.4%) | 151 (14.1%) |
| 3 Vehicles | 441 (30.5%) | 347 (32.5%) |
| 4 Vehicles | 398 (27.5%) | 298 (27.9%) |
| 5 or more Vehicles | 243 (16.8%) | 134 (12.5%) |
| Total | 1,446 (100.0%) | 1,069 (100.0%) |
Commute Time in Hockinson
The most frequently occuring commute durations in Hockinson are 25 to 29 minutes (376 commuters, 19.0%), 15 to 19 minutes (361 commuters, 18.2%), and 30 to 34 minutes (306 commuters, 15.4%).
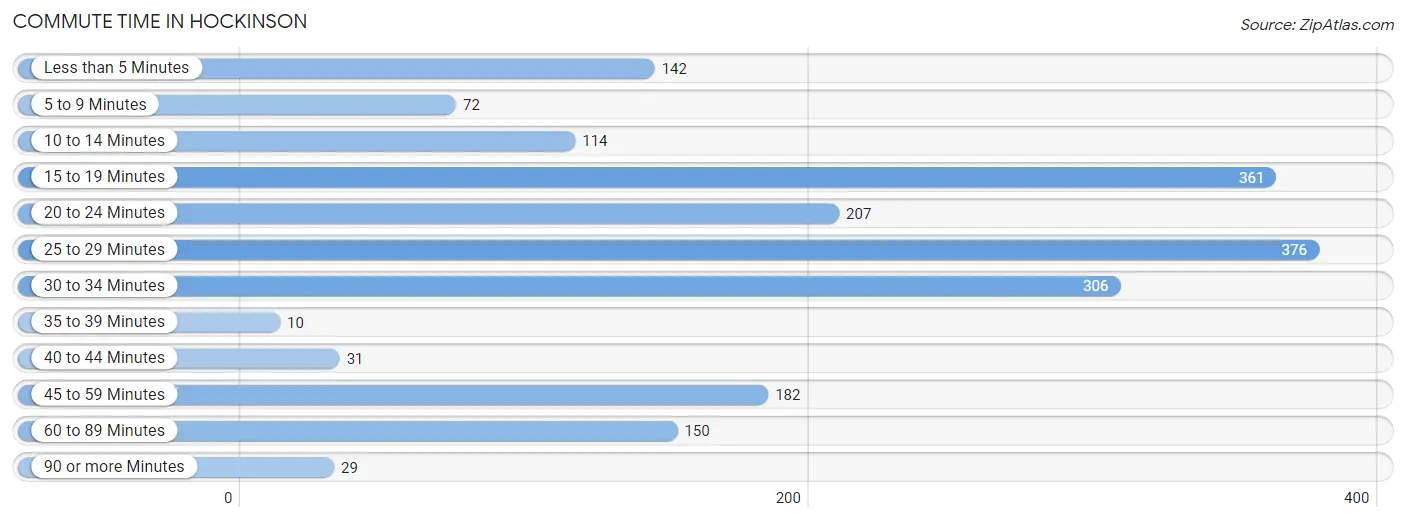
| Commute Time | # Commuters | % Commuters |
| Less than 5 Minutes | 142 | 7.2% |
| 5 to 9 Minutes | 72 | 3.6% |
| 10 to 14 Minutes | 114 | 5.8% |
| 15 to 19 Minutes | 361 | 18.2% |
| 20 to 24 Minutes | 207 | 10.4% |
| 25 to 29 Minutes | 376 | 19.0% |
| 30 to 34 Minutes | 306 | 15.4% |
| 35 to 39 Minutes | 10 | 0.5% |
| 40 to 44 Minutes | 31 | 1.6% |
| 45 to 59 Minutes | 182 | 9.2% |
| 60 to 89 Minutes | 150 | 7.6% |
| 90 or more Minutes | 29 | 1.5% |
Commute Time by Sex in Hockinson
The most common commute times in Hockinson are 15 to 19 minutes (234 commuters, 21.1%) for males and 25 to 29 minutes (169 commuters, 19.4%) for females.
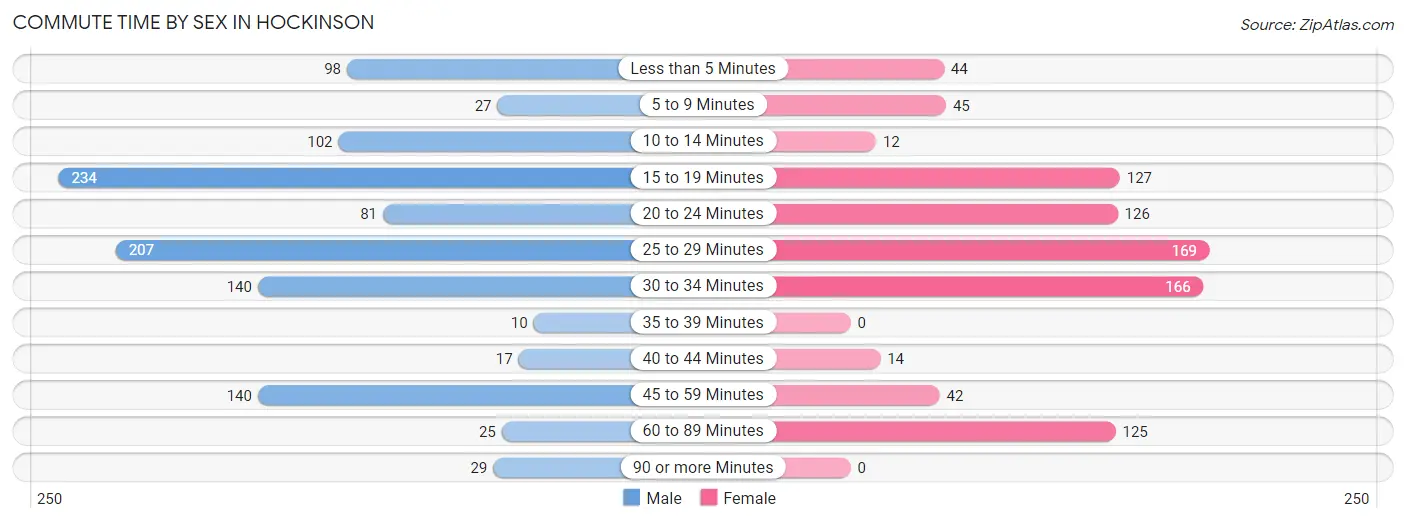
| Commute Time | Male | Female |
| Less than 5 Minutes | 98 (8.8%) | 44 (5.1%) |
| 5 to 9 Minutes | 27 (2.4%) | 45 (5.2%) |
| 10 to 14 Minutes | 102 (9.2%) | 12 (1.4%) |
| 15 to 19 Minutes | 234 (21.1%) | 127 (14.6%) |
| 20 to 24 Minutes | 81 (7.3%) | 126 (14.5%) |
| 25 to 29 Minutes | 207 (18.6%) | 169 (19.4%) |
| 30 to 34 Minutes | 140 (12.6%) | 166 (19.1%) |
| 35 to 39 Minutes | 10 (0.9%) | 0 (0.0%) |
| 40 to 44 Minutes | 17 (1.5%) | 14 (1.6%) |
| 45 to 59 Minutes | 140 (12.6%) | 42 (4.8%) |
| 60 to 89 Minutes | 25 (2.2%) | 125 (14.4%) |
| 90 or more Minutes | 29 (2.6%) | 0 (0.0%) |
Time of Departure to Work by Sex in Hockinson
The most frequent times of departure to work in Hockinson are 8:00 AM to 8:29 AM (231, 20.8%) for males and 4:00 PM to 11:59 PM (157, 18.0%) for females.
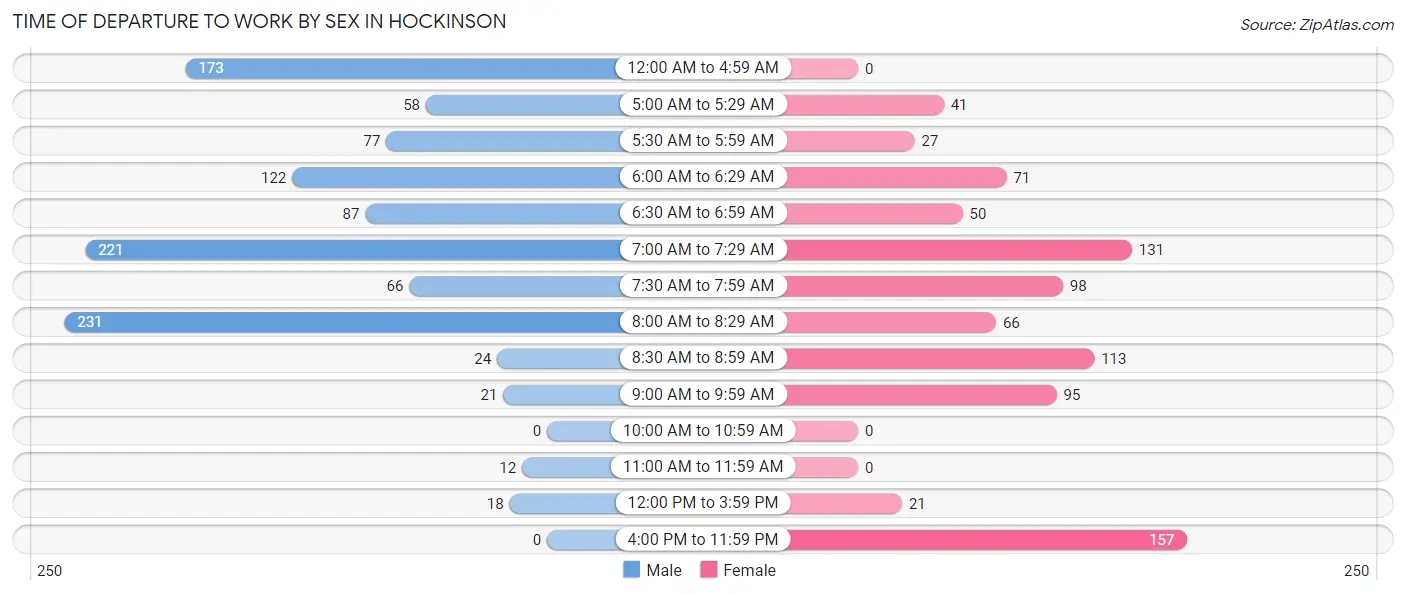
| Time of Departure | Male | Female |
| 12:00 AM to 4:59 AM | 173 (15.6%) | 0 (0.0%) |
| 5:00 AM to 5:29 AM | 58 (5.2%) | 41 (4.7%) |
| 5:30 AM to 5:59 AM | 77 (6.9%) | 27 (3.1%) |
| 6:00 AM to 6:29 AM | 122 (11.0%) | 71 (8.2%) |
| 6:30 AM to 6:59 AM | 87 (7.8%) | 50 (5.8%) |
| 7:00 AM to 7:29 AM | 221 (19.9%) | 131 (15.1%) |
| 7:30 AM to 7:59 AM | 66 (5.9%) | 98 (11.3%) |
| 8:00 AM to 8:29 AM | 231 (20.8%) | 66 (7.6%) |
| 8:30 AM to 8:59 AM | 24 (2.2%) | 113 (13.0%) |
| 9:00 AM to 9:59 AM | 21 (1.9%) | 95 (10.9%) |
| 10:00 AM to 10:59 AM | 0 (0.0%) | 0 (0.0%) |
| 11:00 AM to 11:59 AM | 12 (1.1%) | 0 (0.0%) |
| 12:00 PM to 3:59 PM | 18 (1.6%) | 21 (2.4%) |
| 4:00 PM to 11:59 PM | 0 (0.0%) | 157 (18.0%) |
| Total | 1,110 (100.0%) | 870 (100.0%) |
Housing Occupancy in Hockinson
Occupancy by Ownership in Hockinson
Of the total 1,990 dwellings in Hockinson, owner-occupied units account for 1,792 (90.0%), while renter-occupied units make up 198 (10.0%).
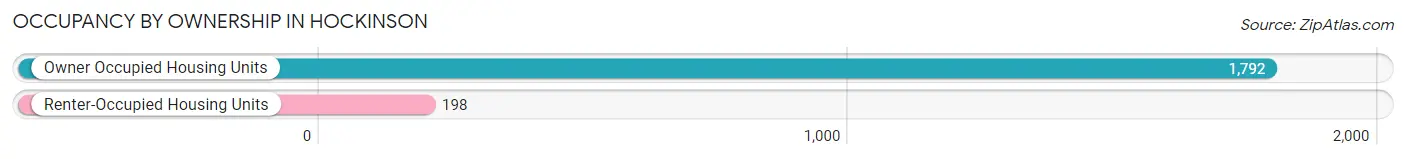
| Occupancy | # Housing Units | % Housing Units |
| Owner Occupied Housing Units | 1,792 | 90.0% |
| Renter-Occupied Housing Units | 198 | 10.0% |
| Total Occupied Housing Units | 1,990 | 100.0% |
Occupancy by Household Size in Hockinson
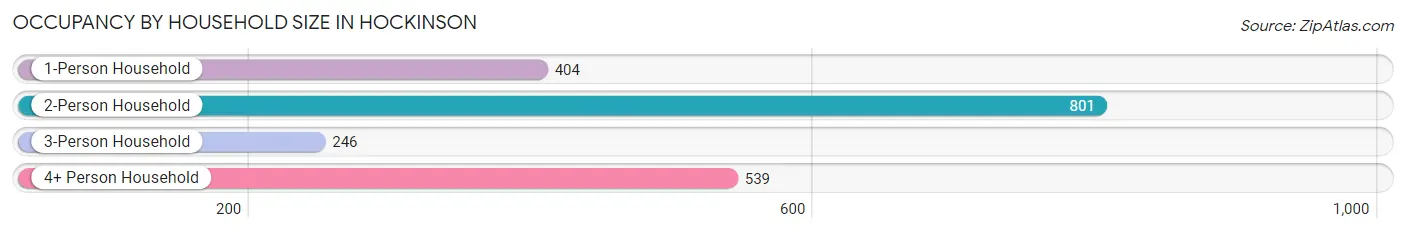
| Household Size | # Housing Units | % Housing Units |
| 1-Person Household | 404 | 20.3% |
| 2-Person Household | 801 | 40.3% |
| 3-Person Household | 246 | 12.4% |
| 4+ Person Household | 539 | 27.1% |
| Total Housing Units | 1,990 | 100.0% |
Occupancy by Ownership by Household Size in Hockinson
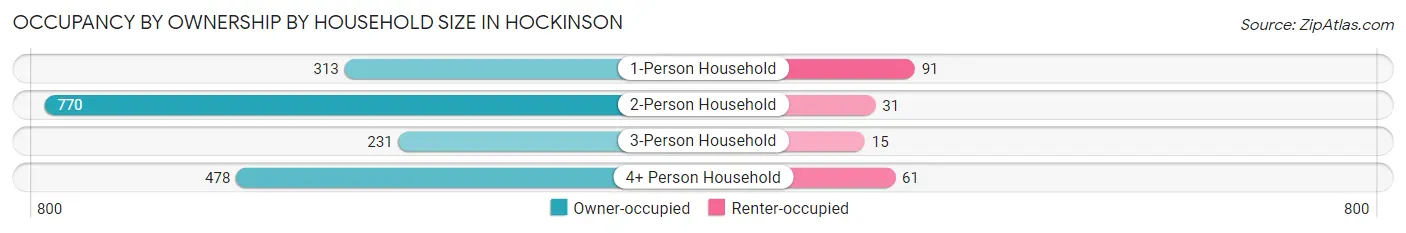
| Household Size | Owner-occupied | Renter-occupied |
| 1-Person Household | 313 (77.5%) | 91 (22.5%) |
| 2-Person Household | 770 (96.1%) | 31 (3.9%) |
| 3-Person Household | 231 (93.9%) | 15 (6.1%) |
| 4+ Person Household | 478 (88.7%) | 61 (11.3%) |
| Total Housing Units | 1,792 (90.0%) | 198 (10.0%) |
Occupancy by Educational Attainment in Hockinson
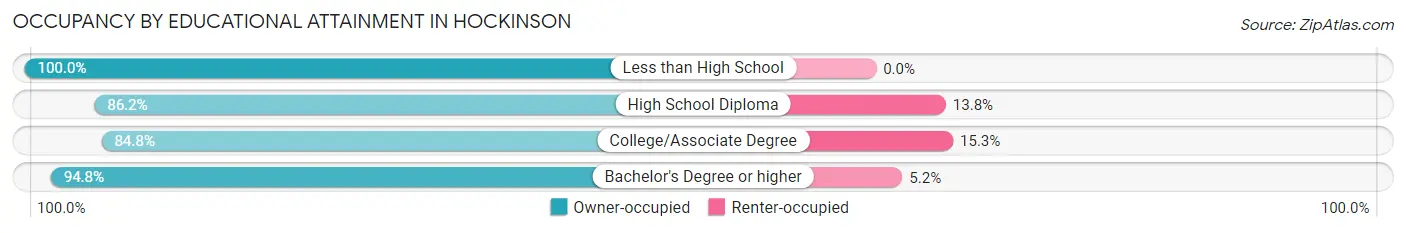
| Household Size | Owner-occupied | Renter-occupied |
| Less than High School | 84 (100.0%) | 0 (0.0%) |
| High School Diploma | 349 (86.2%) | 56 (13.8%) |
| College/Associate Degree | 539 (84.8%) | 97 (15.2%) |
| Bachelor's Degree or higher | 820 (94.8%) | 45 (5.2%) |
Occupancy by Age of Householder in Hockinson
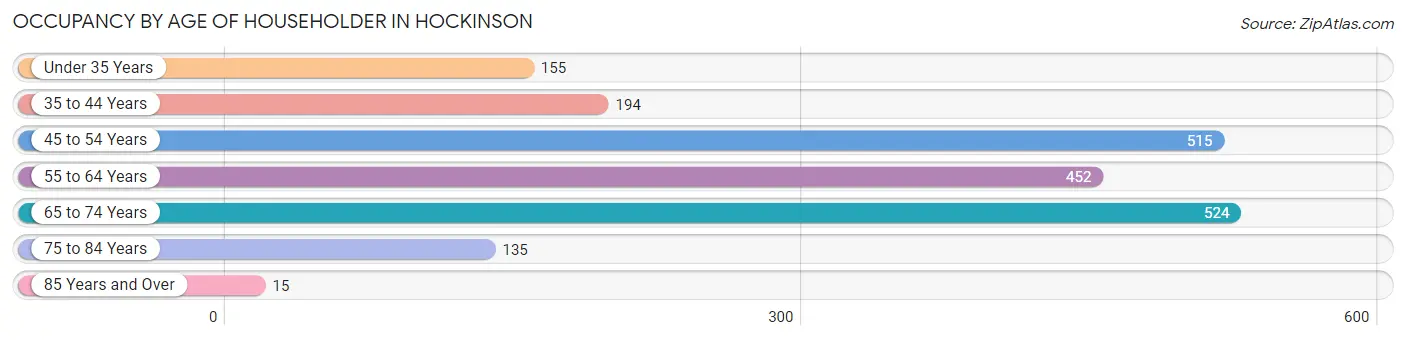
| Age Bracket | # Households | % Households |
| Under 35 Years | 155 | 7.8% |
| 35 to 44 Years | 194 | 9.8% |
| 45 to 54 Years | 515 | 25.9% |
| 55 to 64 Years | 452 | 22.7% |
| 65 to 74 Years | 524 | 26.3% |
| 75 to 84 Years | 135 | 6.8% |
| 85 Years and Over | 15 | 0.7% |
| Total | 1,990 | 100.0% |
Housing Finances in Hockinson
Median Income by Occupancy in Hockinson
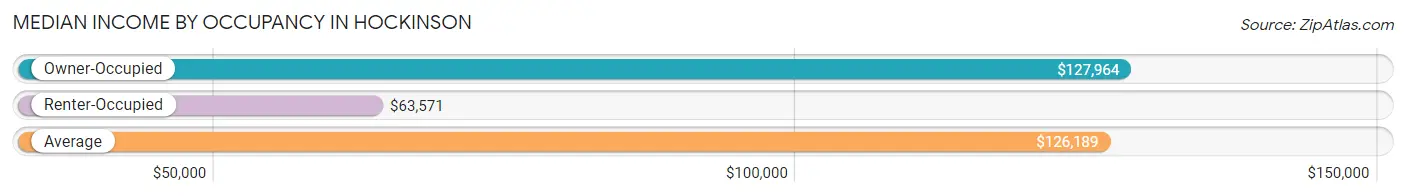
| Occupancy Type | # Households | Median Income |
| Owner-Occupied | 1,792 (90.0%) | $127,964 |
| Renter-Occupied | 198 (10.0%) | $63,571 |
| Average | 1,990 (100.0%) | $126,189 |
Occupancy by Householder Income Bracket in Hockinson
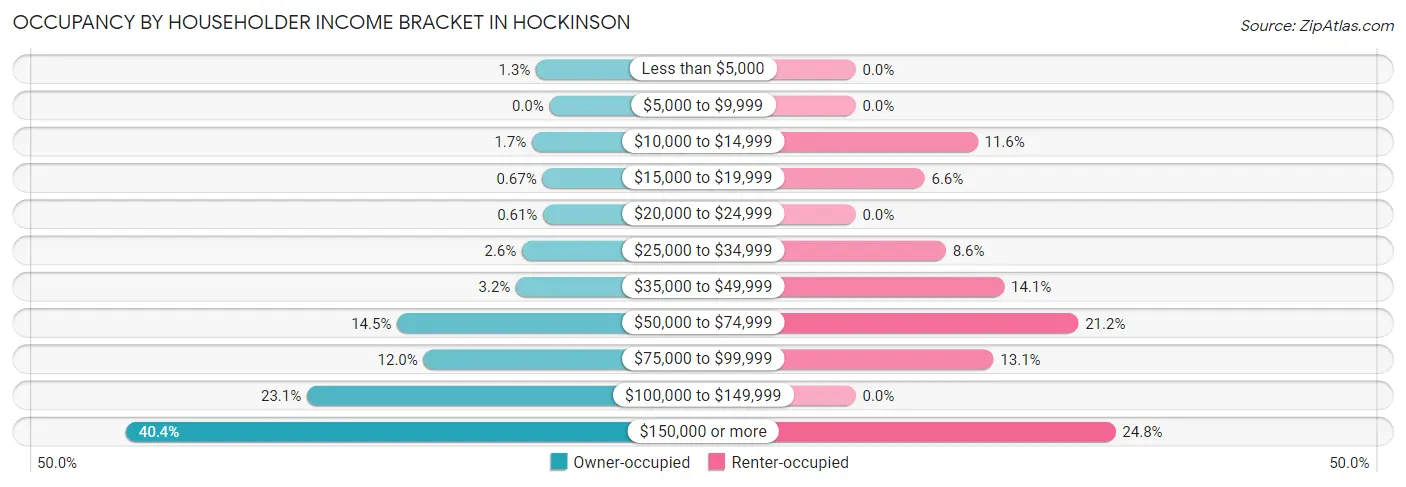
| Income Bracket | Owner-occupied | Renter-occupied |
| Less than $5,000 | 23 (1.3%) | 0 (0.0%) |
| $5,000 to $9,999 | 0 (0.0%) | 0 (0.0%) |
| $10,000 to $14,999 | 30 (1.7%) | 23 (11.6%) |
| $15,000 to $19,999 | 12 (0.7%) | 13 (6.6%) |
| $20,000 to $24,999 | 11 (0.6%) | 0 (0.0%) |
| $25,000 to $34,999 | 47 (2.6%) | 17 (8.6%) |
| $35,000 to $49,999 | 57 (3.2%) | 28 (14.1%) |
| $50,000 to $74,999 | 260 (14.5%) | 42 (21.2%) |
| $75,000 to $99,999 | 215 (12.0%) | 26 (13.1%) |
| $100,000 to $149,999 | 414 (23.1%) | 0 (0.0%) |
| $150,000 or more | 723 (40.4%) | 49 (24.7%) |
| Total | 1,792 (100.0%) | 198 (100.0%) |
Monthly Housing Cost Tiers in Hockinson
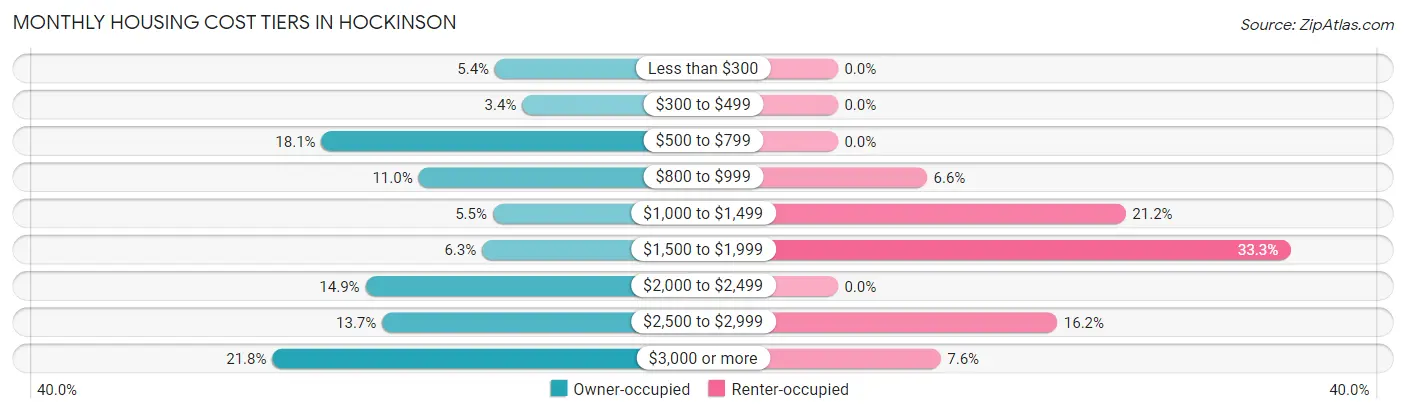
| Monthly Cost | Owner-occupied | Renter-occupied |
| Less than $300 | 96 (5.4%) | 0 (0.0%) |
| $300 to $499 | 60 (3.4%) | 0 (0.0%) |
| $500 to $799 | 325 (18.1%) | 0 (0.0%) |
| $800 to $999 | 197 (11.0%) | 13 (6.6%) |
| $1,000 to $1,499 | 99 (5.5%) | 42 (21.2%) |
| $1,500 to $1,999 | 113 (6.3%) | 66 (33.3%) |
| $2,000 to $2,499 | 267 (14.9%) | 0 (0.0%) |
| $2,500 to $2,999 | 245 (13.7%) | 32 (16.2%) |
| $3,000 or more | 390 (21.8%) | 15 (7.6%) |
| Total | 1,792 (100.0%) | 198 (100.0%) |
Physical Housing Characteristics in Hockinson
Housing Structures in Hockinson
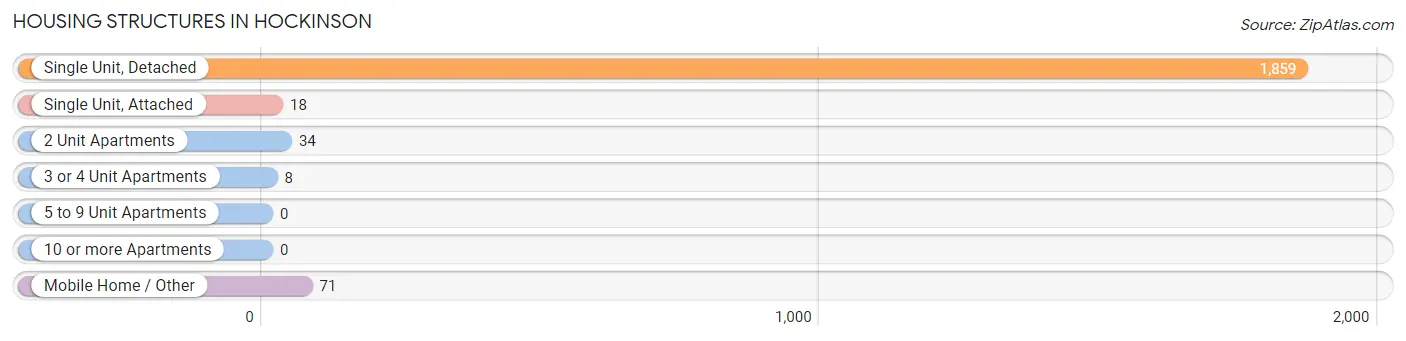
| Structure Type | # Housing Units | % Housing Units |
| Single Unit, Detached | 1,859 | 93.4% |
| Single Unit, Attached | 18 | 0.9% |
| 2 Unit Apartments | 34 | 1.7% |
| 3 or 4 Unit Apartments | 8 | 0.4% |
| 5 to 9 Unit Apartments | 0 | 0.0% |
| 10 or more Apartments | 0 | 0.0% |
| Mobile Home / Other | 71 | 3.6% |
| Total | 1,990 | 100.0% |
Housing Structures by Occupancy in Hockinson
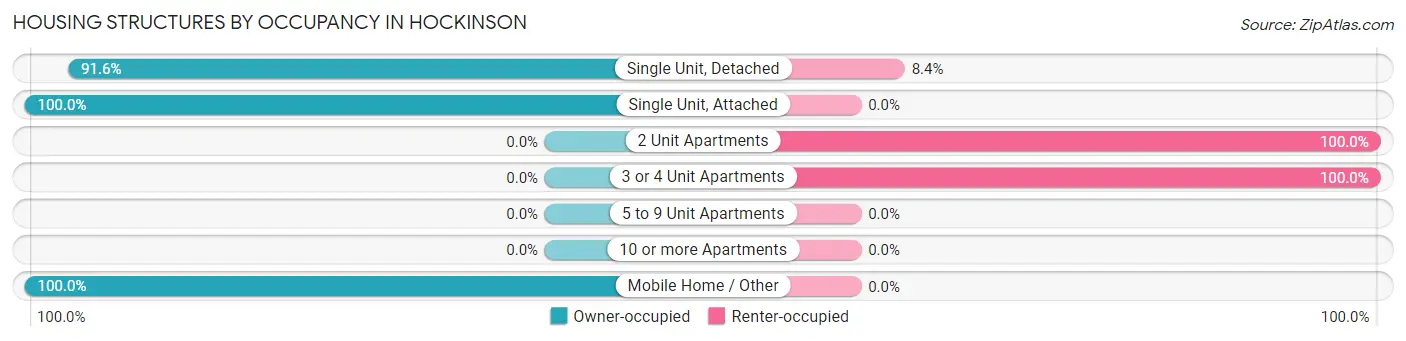
| Structure Type | Owner-occupied | Renter-occupied |
| Single Unit, Detached | 1,703 (91.6%) | 156 (8.4%) |
| Single Unit, Attached | 18 (100.0%) | 0 (0.0%) |
| 2 Unit Apartments | 0 (0.0%) | 34 (100.0%) |
| 3 or 4 Unit Apartments | 0 (0.0%) | 8 (100.0%) |
| 5 to 9 Unit Apartments | 0 (0.0%) | 0 (0.0%) |
| 10 or more Apartments | 0 (0.0%) | 0 (0.0%) |
| Mobile Home / Other | 71 (100.0%) | 0 (0.0%) |
| Total | 1,792 (90.0%) | 198 (10.0%) |
Housing Structures by Number of Rooms in Hockinson
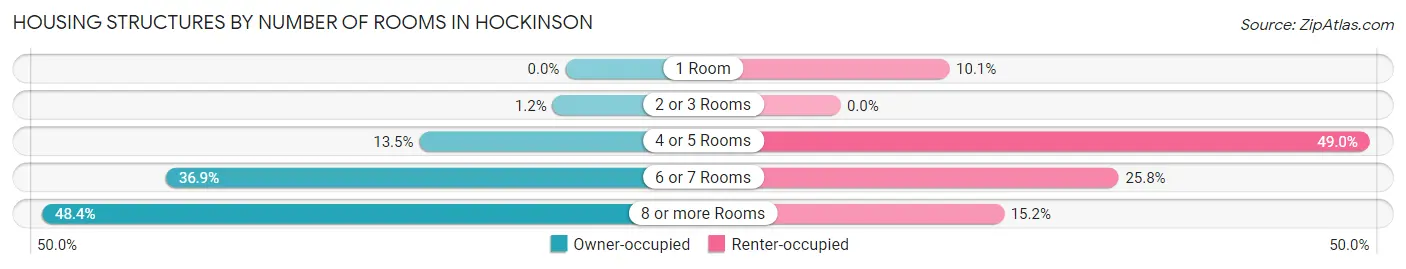
| Number of Rooms | Owner-occupied | Renter-occupied |
| 1 Room | 0 (0.0%) | 20 (10.1%) |
| 2 or 3 Rooms | 21 (1.2%) | 0 (0.0%) |
| 4 or 5 Rooms | 242 (13.5%) | 97 (49.0%) |
| 6 or 7 Rooms | 662 (36.9%) | 51 (25.8%) |
| 8 or more Rooms | 867 (48.4%) | 30 (15.1%) |
| Total | 1,792 (100.0%) | 198 (100.0%) |
Housing Structure by Heating Type in Hockinson
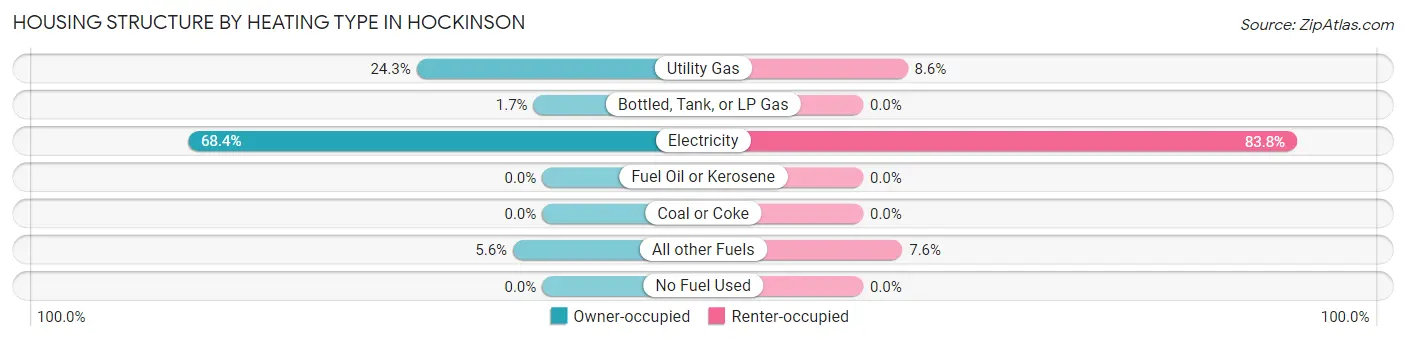
| Heating Type | Owner-occupied | Renter-occupied |
| Utility Gas | 435 (24.3%) | 17 (8.6%) |
| Bottled, Tank, or LP Gas | 30 (1.7%) | 0 (0.0%) |
| Electricity | 1,226 (68.4%) | 166 (83.8%) |
| Fuel Oil or Kerosene | 0 (0.0%) | 0 (0.0%) |
| Coal or Coke | 0 (0.0%) | 0 (0.0%) |
| All other Fuels | 101 (5.6%) | 15 (7.6%) |
| No Fuel Used | 0 (0.0%) | 0 (0.0%) |
| Total | 1,792 (100.0%) | 198 (100.0%) |
Household Vehicle Usage in Hockinson
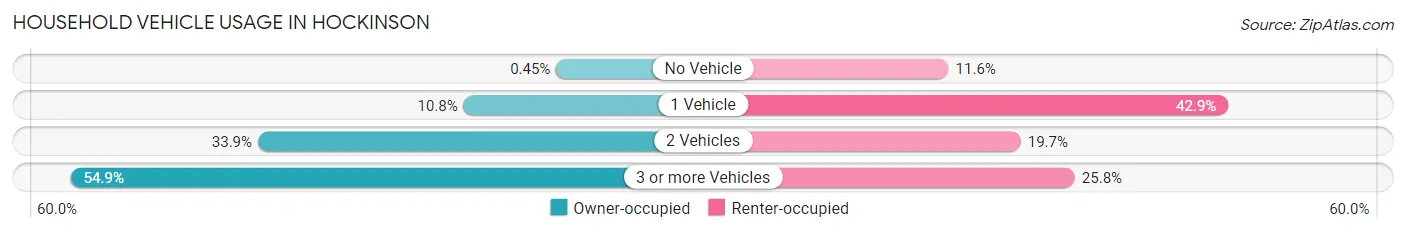
| Vehicles per Household | Owner-occupied | Renter-occupied |
| No Vehicle | 8 (0.4%) | 23 (11.6%) |
| 1 Vehicle | 194 (10.8%) | 85 (42.9%) |
| 2 Vehicles | 607 (33.9%) | 39 (19.7%) |
| 3 or more Vehicles | 983 (54.8%) | 51 (25.8%) |
| Total | 1,792 (100.0%) | 198 (100.0%) |
Real Estate & Mortgages in Hockinson
Real Estate and Mortgage Overview in Hockinson
| Characteristic | Without Mortgage | With Mortgage |
| Housing Units | 759 | 1,033 |
| Median Property Value | $615,400 | $622,100 |
| Median Household Income | $85,504 | $558 |
| Monthly Housing Costs | $746 | $390 |
| Real Estate Taxes | $5,531 | $31 |
Property Value by Mortgage Status in Hockinson
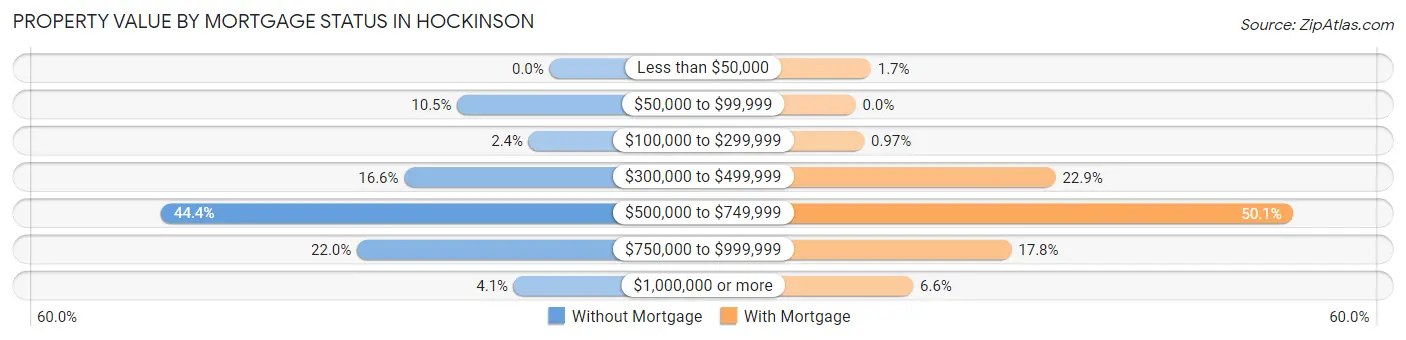
| Property Value | Without Mortgage | With Mortgage |
| Less than $50,000 | 0 (0.0%) | 18 (1.7%) |
| $50,000 to $99,999 | 80 (10.5%) | 0 (0.0%) |
| $100,000 to $299,999 | 18 (2.4%) | 10 (1.0%) |
| $300,000 to $499,999 | 126 (16.6%) | 236 (22.9%) |
| $500,000 to $749,999 | 337 (44.4%) | 517 (50.0%) |
| $750,000 to $999,999 | 167 (22.0%) | 184 (17.8%) |
| $1,000,000 or more | 31 (4.1%) | 68 (6.6%) |
| Total | 759 (100.0%) | 1,033 (100.0%) |
Household Income by Mortgage Status in Hockinson
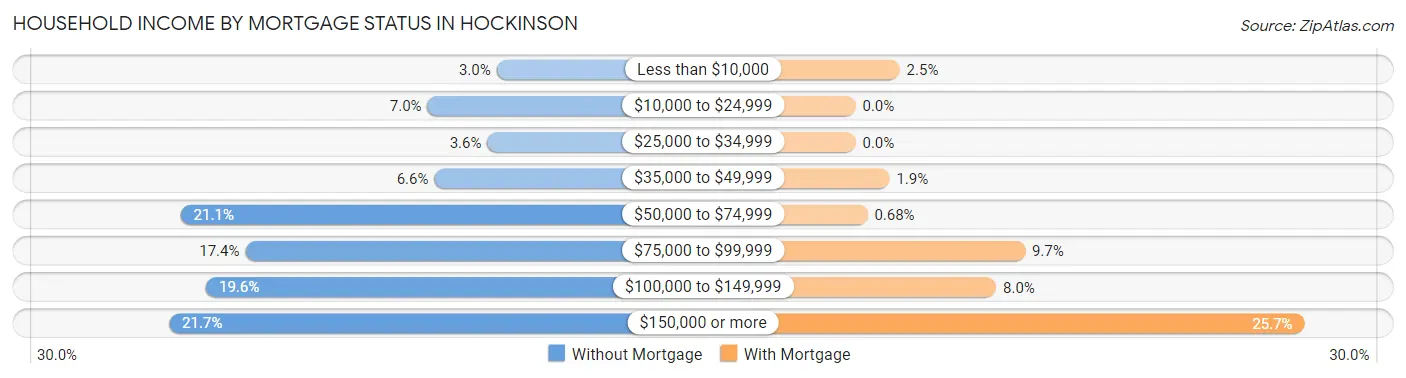
| Household Income | Without Mortgage | With Mortgage |
| Less than $10,000 | 23 (3.0%) | 26 (2.5%) |
| $10,000 to $24,999 | 53 (7.0%) | 0 (0.0%) |
| $25,000 to $34,999 | 27 (3.6%) | 0 (0.0%) |
| $35,000 to $49,999 | 50 (6.6%) | 20 (1.9%) |
| $50,000 to $74,999 | 160 (21.1%) | 7 (0.7%) |
| $75,000 to $99,999 | 132 (17.4%) | 100 (9.7%) |
| $100,000 to $149,999 | 149 (19.6%) | 83 (8.0%) |
| $150,000 or more | 165 (21.7%) | 265 (25.7%) |
| Total | 759 (100.0%) | 1,033 (100.0%) |
Property Value to Household Income Ratio in Hockinson
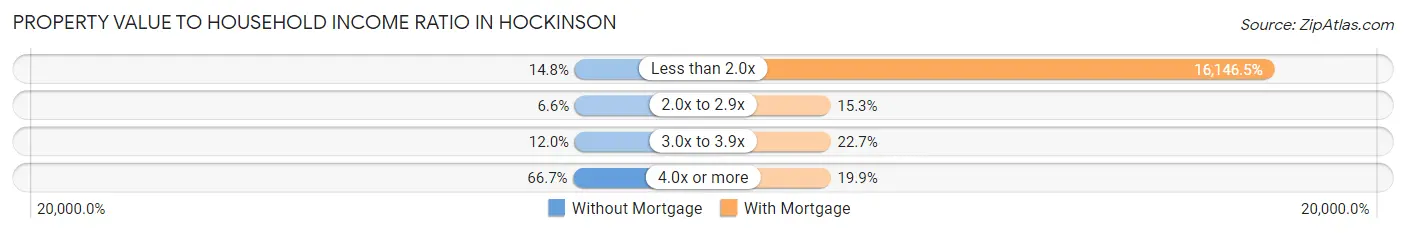
| Value-to-Income Ratio | Without Mortgage | With Mortgage |
| Less than 2.0x | 112 (14.8%) | 166,793 (16,146.5%) |
| 2.0x to 2.9x | 50 (6.6%) | 158 (15.3%) |
| 3.0x to 3.9x | 91 (12.0%) | 234 (22.7%) |
| 4.0x or more | 506 (66.7%) | 206 (19.9%) |
| Total | 759 (100.0%) | 1,033 (100.0%) |
Real Estate Taxes by Mortgage Status in Hockinson
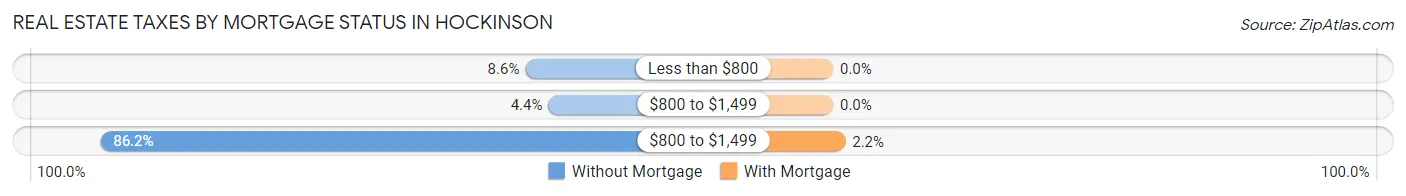
| Property Taxes | Without Mortgage | With Mortgage |
| Less than $800 | 65 (8.6%) | 0 (0.0%) |
| $800 to $1,499 | 33 (4.3%) | 0 (0.0%) |
| $800 to $1,499 | 654 (86.2%) | 23 (2.2%) |
| Total | 759 (100.0%) | 1,033 (100.0%) |
Health & Disability in Hockinson
Health Insurance Coverage by Age in Hockinson
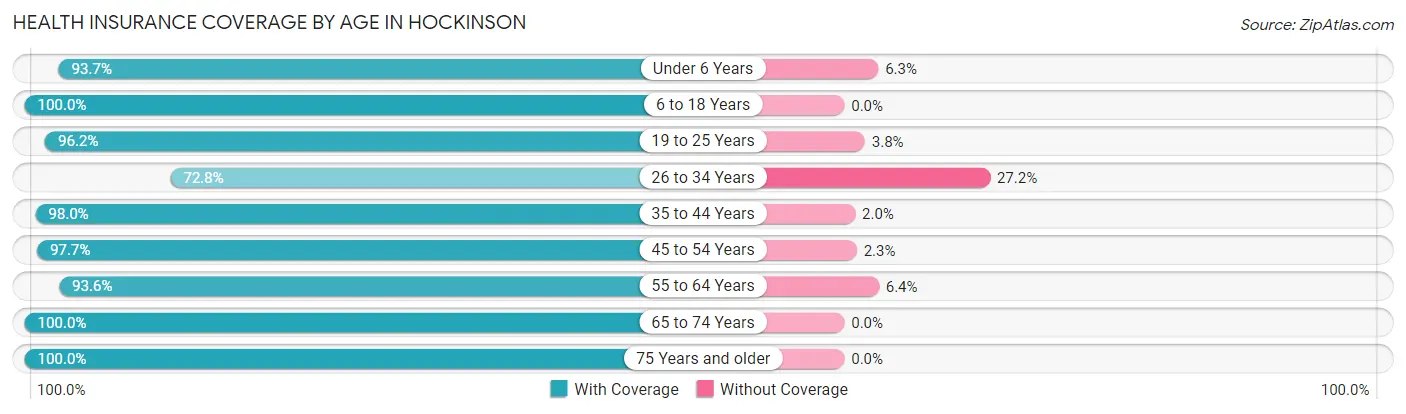
| Age Bracket | With Coverage | Without Coverage |
| Under 6 Years | 311 (93.7%) | 21 (6.3%) |
| 6 to 18 Years | 1,100 (100.0%) | 0 (0.0%) |
| 19 to 25 Years | 276 (96.2%) | 11 (3.8%) |
| 26 to 34 Years | 335 (72.8%) | 125 (27.2%) |
| 35 to 44 Years | 534 (98.0%) | 11 (2.0%) |
| 45 to 54 Years | 925 (97.7%) | 22 (2.3%) |
| 55 to 64 Years | 873 (93.6%) | 60 (6.4%) |
| 65 to 74 Years | 937 (100.0%) | 0 (0.0%) |
| 75 Years and older | 281 (100.0%) | 0 (0.0%) |
| Total | 5,572 (95.7%) | 250 (4.3%) |
Health Insurance Coverage by Citizenship Status in Hockinson
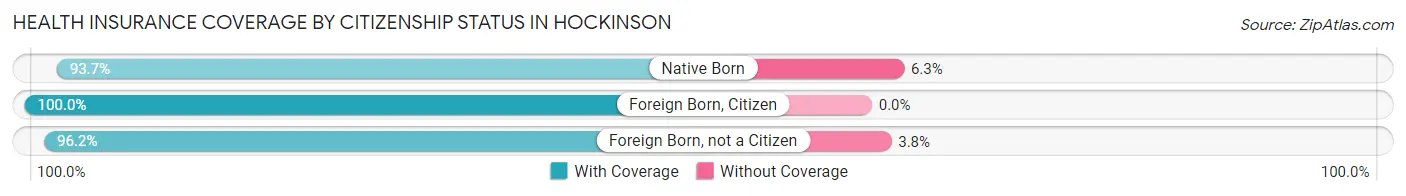
| Citizenship Status | With Coverage | Without Coverage |
| Native Born | 311 (93.7%) | 21 (6.3%) |
| Foreign Born, Citizen | 1,100 (100.0%) | 0 (0.0%) |
| Foreign Born, not a Citizen | 276 (96.2%) | 11 (3.8%) |
Health Insurance Coverage by Household Income in Hockinson
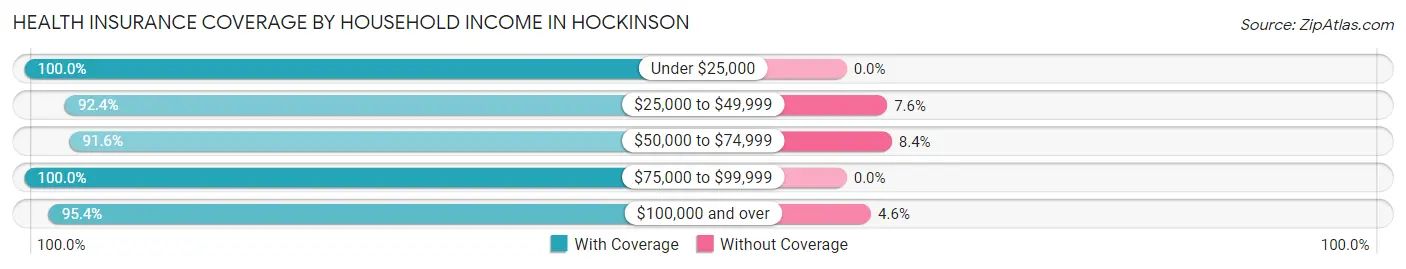
| Household Income | With Coverage | Without Coverage |
| Under $25,000 | 168 (100.0%) | 0 (0.0%) |
| $25,000 to $49,999 | 256 (92.4%) | 21 (7.6%) |
| $50,000 to $74,999 | 564 (91.6%) | 52 (8.4%) |
| $75,000 to $99,999 | 862 (100.0%) | 0 (0.0%) |
| $100,000 and over | 3,702 (95.4%) | 177 (4.6%) |
Public vs Private Health Insurance Coverage by Age in Hockinson
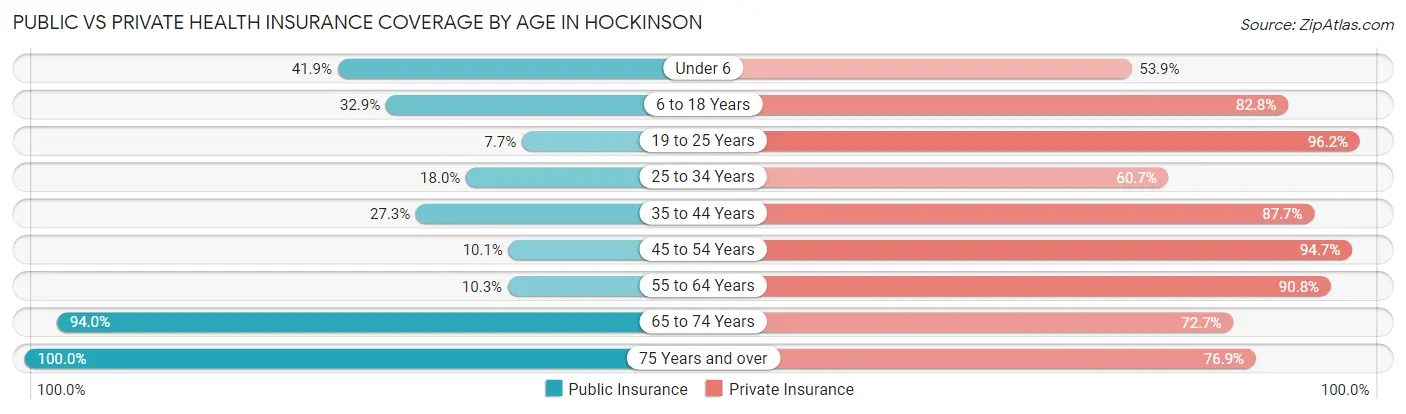
| Age Bracket | Public Insurance | Private Insurance |
| Under 6 | 139 (41.9%) | 179 (53.9%) |
| 6 to 18 Years | 362 (32.9%) | 911 (82.8%) |
| 19 to 25 Years | 22 (7.7%) | 276 (96.2%) |
| 25 to 34 Years | 83 (18.0%) | 279 (60.7%) |
| 35 to 44 Years | 149 (27.3%) | 478 (87.7%) |
| 45 to 54 Years | 96 (10.1%) | 897 (94.7%) |
| 55 to 64 Years | 96 (10.3%) | 847 (90.8%) |
| 65 to 74 Years | 881 (94.0%) | 681 (72.7%) |
| 75 Years and over | 281 (100.0%) | 216 (76.9%) |
| Total | 2,109 (36.2%) | 4,764 (81.8%) |
Disability Status by Sex by Age in Hockinson
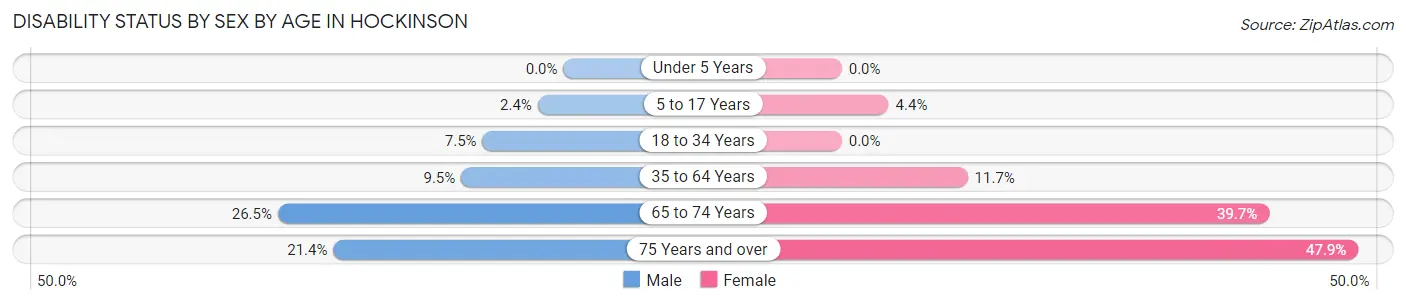
| Age Bracket | Male | Female |
| Under 5 Years | 0 (0.0%) | 0 (0.0%) |
| 5 to 17 Years | 16 (2.4%) | 15 (4.3%) |
| 18 to 34 Years | 34 (7.5%) | 0 (0.0%) |
| 35 to 64 Years | 122 (9.5%) | 133 (11.7%) |
| 65 to 74 Years | 128 (26.5%) | 180 (39.7%) |
| 75 Years and over | 19 (21.3%) | 92 (47.9%) |
Disability Class by Sex by Age in Hockinson
Disability Class: Hearing Difficulty
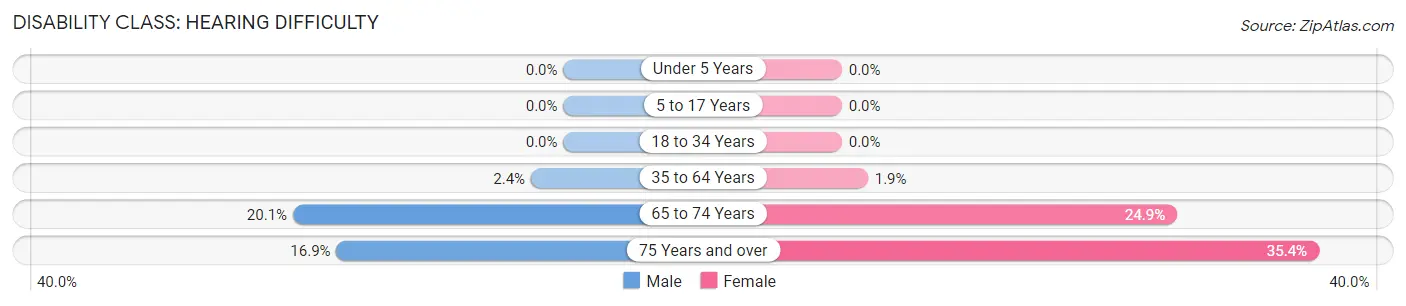
| Age Bracket | Male | Female |
| Under 5 Years | 0 (0.0%) | 0 (0.0%) |
| 5 to 17 Years | 0 (0.0%) | 0 (0.0%) |
| 18 to 34 Years | 0 (0.0%) | 0 (0.0%) |
| 35 to 64 Years | 31 (2.4%) | 22 (1.9%) |
| 65 to 74 Years | 97 (20.1%) | 113 (24.9%) |
| 75 Years and over | 15 (16.9%) | 68 (35.4%) |
Disability Class: Vision Difficulty
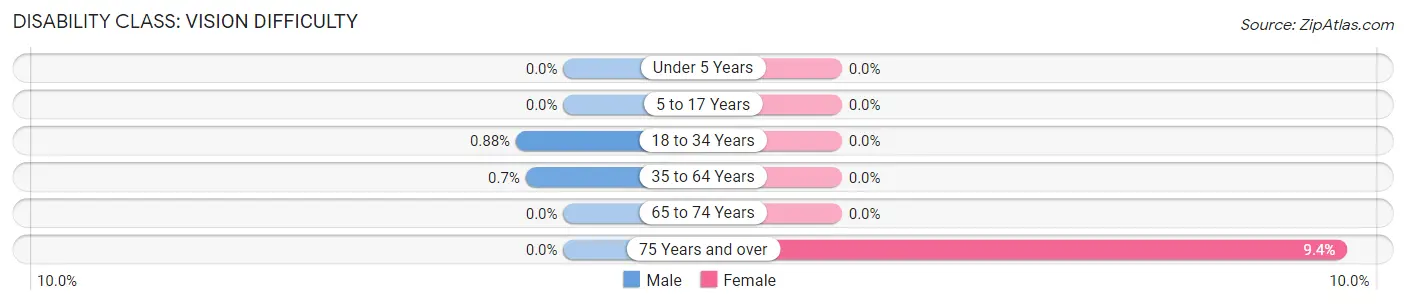
| Age Bracket | Male | Female |
| Under 5 Years | 0 (0.0%) | 0 (0.0%) |
| 5 to 17 Years | 0 (0.0%) | 0 (0.0%) |
| 18 to 34 Years | 4 (0.9%) | 0 (0.0%) |
| 35 to 64 Years | 9 (0.7%) | 0 (0.0%) |
| 65 to 74 Years | 0 (0.0%) | 0 (0.0%) |
| 75 Years and over | 0 (0.0%) | 18 (9.4%) |
Disability Class: Cognitive Difficulty
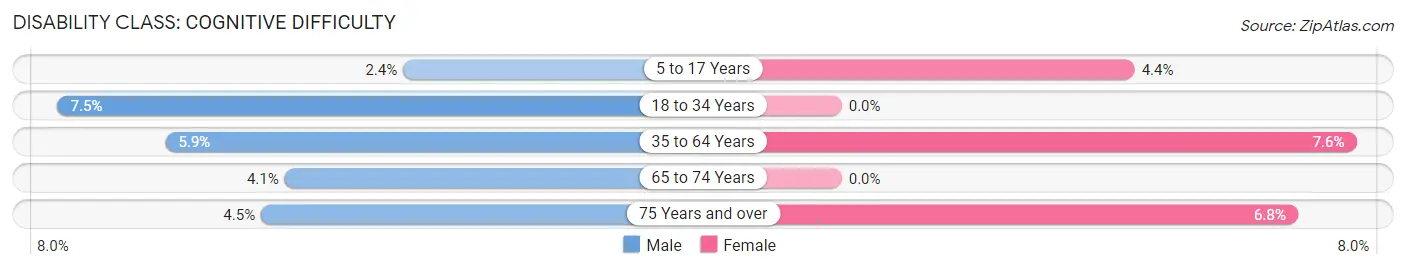
| Age Bracket | Male | Female |
| 5 to 17 Years | 16 (2.4%) | 15 (4.3%) |
| 18 to 34 Years | 34 (7.5%) | 0 (0.0%) |
| 35 to 64 Years | 76 (5.9%) | 87 (7.6%) |
| 65 to 74 Years | 20 (4.1%) | 0 (0.0%) |
| 75 Years and over | 4 (4.5%) | 13 (6.8%) |
Disability Class: Ambulatory Difficulty
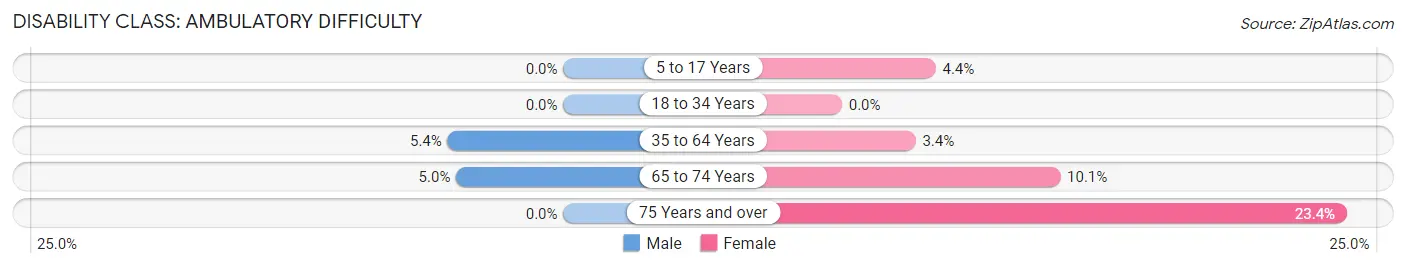
| Age Bracket | Male | Female |
| 5 to 17 Years | 0 (0.0%) | 15 (4.3%) |
| 18 to 34 Years | 0 (0.0%) | 0 (0.0%) |
| 35 to 64 Years | 69 (5.4%) | 39 (3.4%) |
| 65 to 74 Years | 24 (5.0%) | 46 (10.1%) |
| 75 Years and over | 0 (0.0%) | 45 (23.4%) |
Disability Class: Self-Care Difficulty
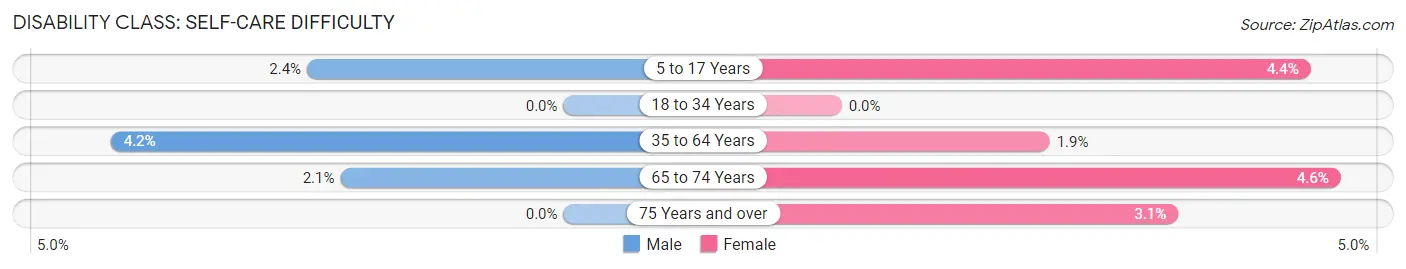
| Age Bracket | Male | Female |
| 5 to 17 Years | 16 (2.4%) | 15 (4.3%) |
| 18 to 34 Years | 0 (0.0%) | 0 (0.0%) |
| 35 to 64 Years | 54 (4.2%) | 22 (1.9%) |
| 65 to 74 Years | 10 (2.1%) | 21 (4.6%) |
| 75 Years and over | 0 (0.0%) | 6 (3.1%) |
Technology Access in Hockinson
Computing Device Access in Hockinson
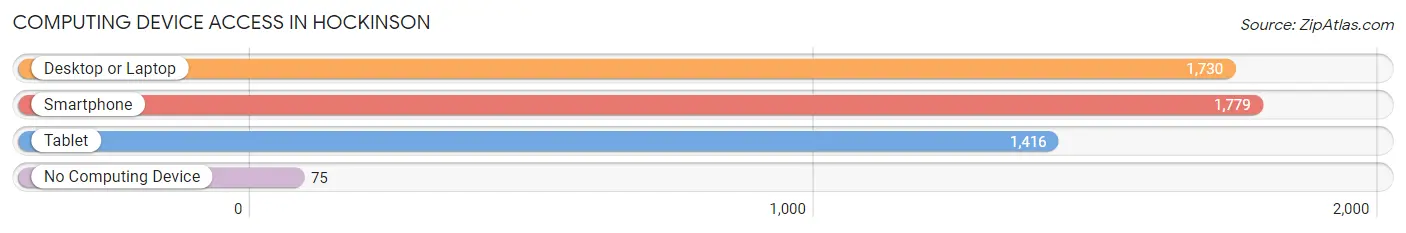
| Device Type | # Households | % Households |
| Desktop or Laptop | 1,730 | 86.9% |
| Smartphone | 1,779 | 89.4% |
| Tablet | 1,416 | 71.2% |
| No Computing Device | 75 | 3.8% |
| Total | 1,990 | 100.0% |
Internet Access in Hockinson
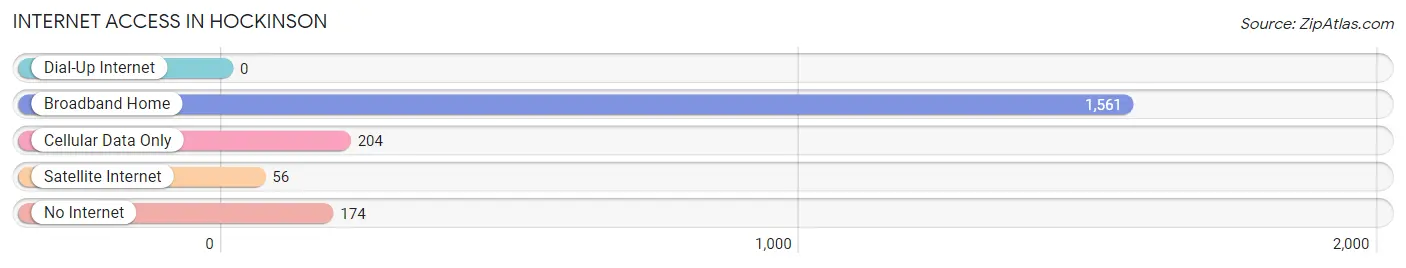
| Internet Type | # Households | % Households |
| Dial-Up Internet | 0 | 0.0% |
| Broadband Home | 1,561 | 78.4% |
| Cellular Data Only | 204 | 10.2% |
| Satellite Internet | 56 | 2.8% |
| No Internet | 174 | 8.7% |
| Total | 1,990 | 100.0% |
Hockinson Summary
Hockinson is a small unincorporated community located in Clark County, Washington, United States. It is situated in the foothills of the Cascade Mountains, approximately 20 miles northeast of Vancouver. The population of Hockinson was estimated to be 1,845 in 2019.
History
Hockinson was first settled in the late 1800s by a group of German immigrants. The town was named after the Hockinson family, who were among the first settlers. The Hockinson family owned a large amount of land in the area, and the town was built around their homestead.
The first post office in Hockinson was established in 1891. The town was officially incorporated in 1909.
Geography
Hockinson is located in the foothills of the Cascade Mountains, approximately 20 miles northeast of Vancouver. The town is situated on the banks of the East Fork of the Lewis River. The terrain is mostly flat, with some rolling hills. The climate is mild, with temperatures ranging from the mid-30s in the winter to the mid-80s in the summer.
Economy
Hockinson’s economy is largely based on agriculture. The town is home to several farms, which produce a variety of crops, including apples, cherries, and hay. The town also has a few small businesses, including a grocery store, a hardware store, and a restaurant.
Demographics
As of 2019, the population of Hockinson was estimated to be 1,845. The racial makeup of the town was 94.3% White, 1.2% Hispanic or Latino, 0.7% Asian, 0.4% African American, 0.2% Native American, and 3.2% from other races. The median household income was $60,938, and the median age was 43.
Conclusion
Hockinson is a small unincorporated community located in Clark County, Washington, United States. It is situated in the foothills of the Cascade Mountains, approximately 20 miles northeast of Vancouver. The population of Hockinson was estimated to be 1,845 in 2019. The town’s economy is largely based on agriculture, and the town is home to several farms, which produce a variety of crops. The racial makeup of the town was 94.3% White, 1.2% Hispanic or Latino, 0.7% Asian, 0.4% African American, 0.2% Native American, and 3.2% from other races. The median household income was $60,938, and the median age was 43.
Common Questions
What is Per Capita Income in Hockinson?
Per Capita income in Hockinson is $56,948.
What is the Median Family Income in Hockinson?
Median Family Income in Hockinson is $128,365.
What is the Median Household income in Hockinson?
Median Household Income in Hockinson is $126,189.
What is Income or Wage Gap in Hockinson?
Income or Wage Gap in Hockinson is 33.6%.
Women in Hockinson earn 66.4 cents for every dollar earned by a man.
What is Inequality or Gini Index in Hockinson?
Inequality or Gini Index in Hockinson is 0.43.
What is the Total Population of Hockinson?
Total Population of Hockinson is 5,833.
What is the Total Male Population of Hockinson?
Total Male Population of Hockinson is 3,140.
What is the Total Female Population of Hockinson?
Total Female Population of Hockinson is 2,693.
What is the Ratio of Males per 100 Females in Hockinson?
There are 116.60 Males per 100 Females in Hockinson.
What is the Ratio of Females per 100 Males in Hockinson?
There are 85.76 Females per 100 Males in Hockinson.
What is the Median Population Age in Hockinson?
Median Population Age in Hockinson is 46.4 Years.
What is the Average Family Size in Hockinson
Average Family Size in Hockinson is 3.4 People.
What is the Average Household Size in Hockinson
Average Household Size in Hockinson is 2.9 People.
How Large is the Labor Force in Hockinson?
There are 2,613 People in the Labor Forcein in Hockinson.
What is the Percentage of People in the Labor Force in Hockinson?
55.2% of People are in the Labor Force in Hockinson.
What is the Unemployment Rate in Hockinson?
Unemployment Rate in Hockinson is 2.1%.