Honesdale borough, PA Map & Demographics
Honesdale borough Overview
$24,910
PER CAPITA INCOME
$59,518
AVG FAMILY INCOME
$34,700
AVG HOUSEHOLD INCOME
15.4%
WAGE / INCOME GAP [ % ]
84.6¢/ $1
WAGE / INCOME GAP [ $ ]
0.39
INEQUALITY / GINI INDEX
4,469
TOTAL POPULATION
2,083
MALE POPULATION
2,386
FEMALE POPULATION
87.30
MALES / 100 FEMALES
114.55
FEMALES / 100 MALES
42.5
MEDIAN AGE
3.2
AVG FAMILY SIZE
2.1
AVG HOUSEHOLD SIZE
2,126
LABOR FORCE [ PEOPLE ]
54.3%
PERCENT IN LABOR FORCE
9.4%
UNEMPLOYMENT RATE
Income in Honesdale borough
Income Overview in Honesdale borough
Per Capita Income in Honesdale borough is $24,910, while median incomes of families and households are $59,518 and $34,700 respectively.
| Characteristic | Number | Measure |
| Per Capita Income | 4,469 | $24,910 |
| Median Family Income | 794 | $59,518 |
| Mean Family Income | 794 | $67,734 |
| Median Household Income | 2,137 | $34,700 |
| Mean Household Income | 2,137 | $47,792 |
| Income Deficit | 794 | $0 |
| Wage / Income Gap (%) | 4,469 | 15.36% |
| Wage / Income Gap ($) | 4,469 | 84.64¢ per $1 |
| Gini / Inequality Index | 4,469 | 0.39 |
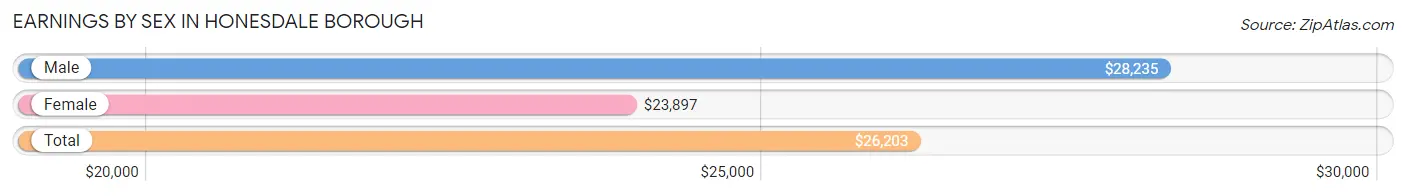
Earnings by Sex in Honesdale borough
Average Earnings in Honesdale borough are $26,203, $28,235 for men and $23,897 for women, a difference of 15.4%.
| Sex | Number | Average Earnings |
| Male | 1,024 (46.3%) | $28,235 |
| Female | 1,186 (53.7%) | $23,897 |
| Total | 2,210 (100.0%) | $26,203 |
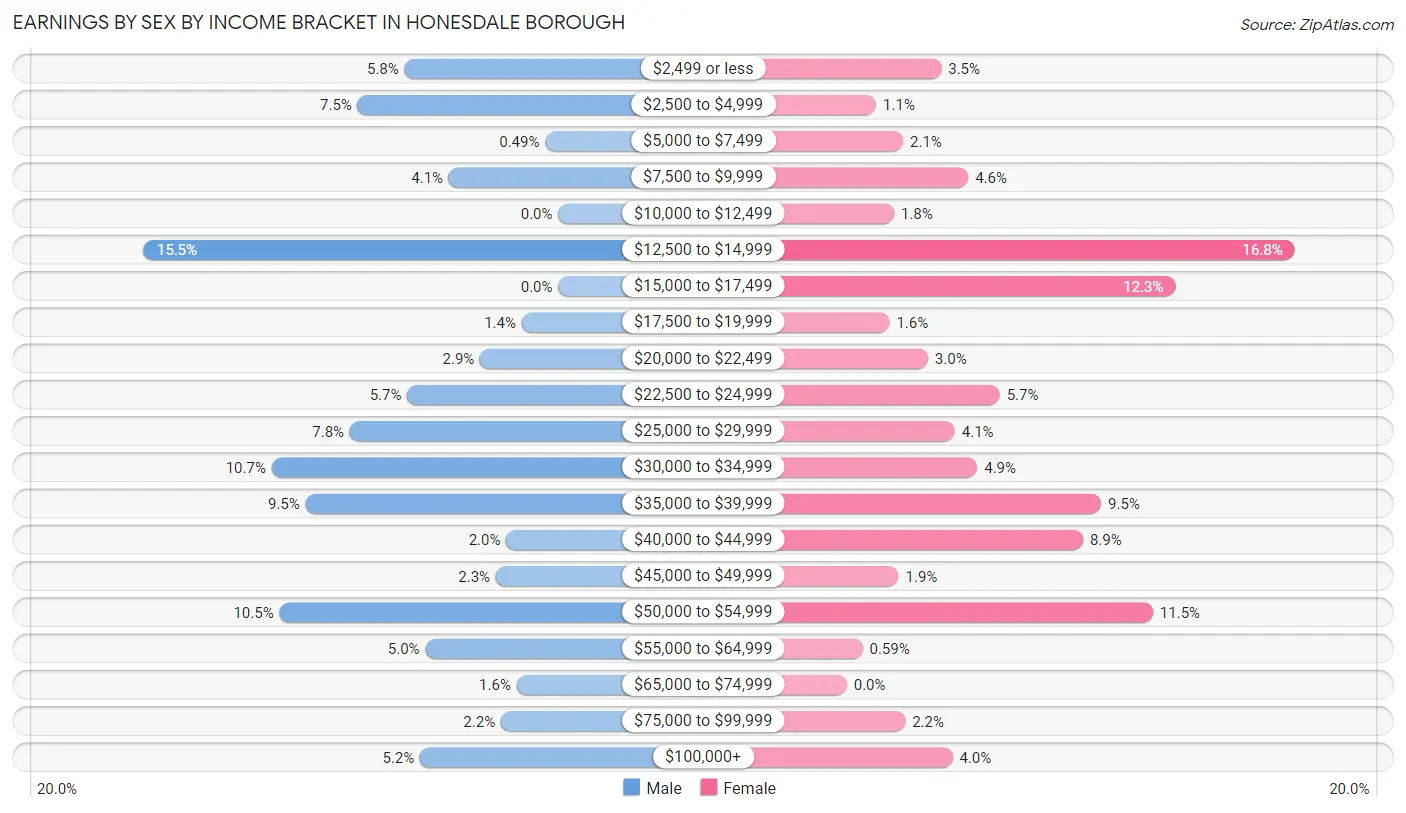
Earnings by Sex by Income Bracket in Honesdale borough
The most common earnings brackets in Honesdale borough are $12,500 to $14,999 for men (159 | 15.5%) and $12,500 to $14,999 for women (199 | 16.8%).
| Income | Male | Female |
| $2,499 or less | 59 (5.8%) | 42 (3.5%) |
| $2,500 to $4,999 | 77 (7.5%) | 13 (1.1%) |
| $5,000 to $7,499 | 5 (0.5%) | 25 (2.1%) |
| $7,500 to $9,999 | 42 (4.1%) | 54 (4.5%) |
| $10,000 to $12,499 | 0 (0.0%) | 21 (1.8%) |
| $12,500 to $14,999 | 159 (15.5%) | 199 (16.8%) |
| $15,000 to $17,499 | 0 (0.0%) | 146 (12.3%) |
| $17,500 to $19,999 | 14 (1.4%) | 19 (1.6%) |
| $20,000 to $22,499 | 30 (2.9%) | 36 (3.0%) |
| $22,500 to $24,999 | 58 (5.7%) | 68 (5.7%) |
| $25,000 to $29,999 | 80 (7.8%) | 48 (4.1%) |
| $30,000 to $34,999 | 110 (10.7%) | 58 (4.9%) |
| $35,000 to $39,999 | 97 (9.5%) | 113 (9.5%) |
| $40,000 to $44,999 | 20 (1.9%) | 105 (8.8%) |
| $45,000 to $49,999 | 24 (2.3%) | 23 (1.9%) |
| $50,000 to $54,999 | 107 (10.4%) | 136 (11.5%) |
| $55,000 to $64,999 | 51 (5.0%) | 7 (0.6%) |
| $65,000 to $74,999 | 16 (1.6%) | 0 (0.0%) |
| $75,000 to $99,999 | 22 (2.1%) | 26 (2.2%) |
| $100,000+ | 53 (5.2%) | 47 (4.0%) |
| Total | 1,024 (100.0%) | 1,186 (100.0%) |
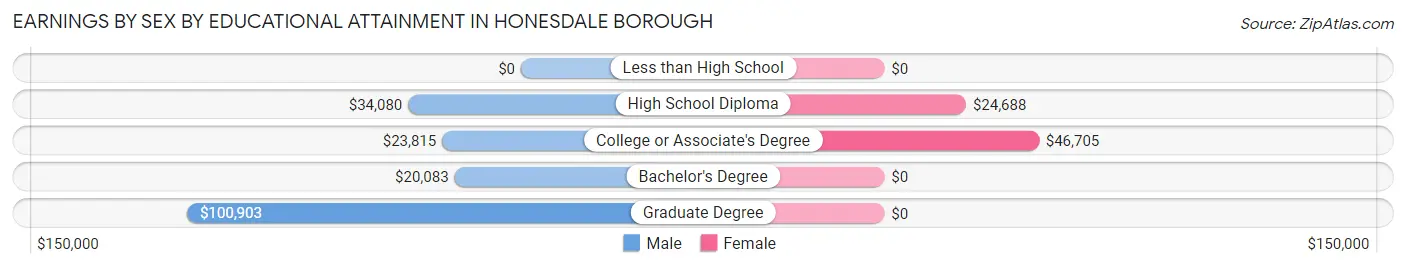
Earnings by Sex by Educational Attainment in Honesdale borough
Average earnings in Honesdale borough are $33,614 for men and $35,017 for women, a difference of 4.0%. Men with an educational attainment of graduate degree enjoy the highest average annual earnings of $100,903, while those with bachelor's degree education earn the least with $20,083. Women with an educational attainment of college or associate's degree earn the most with the average annual earnings of $46,705, while those with high school diploma education have the smallest earnings of $24,688.
| Educational Attainment | Male Income | Female Income |
| Less than High School | - | - |
| High School Diploma | $34,080 | $24,688 |
| College or Associate's Degree | $23,815 | $46,705 |
| Bachelor's Degree | $20,083 | $0 |
| Graduate Degree | $100,903 | $0 |
| Total | $33,614 | $35,017 |
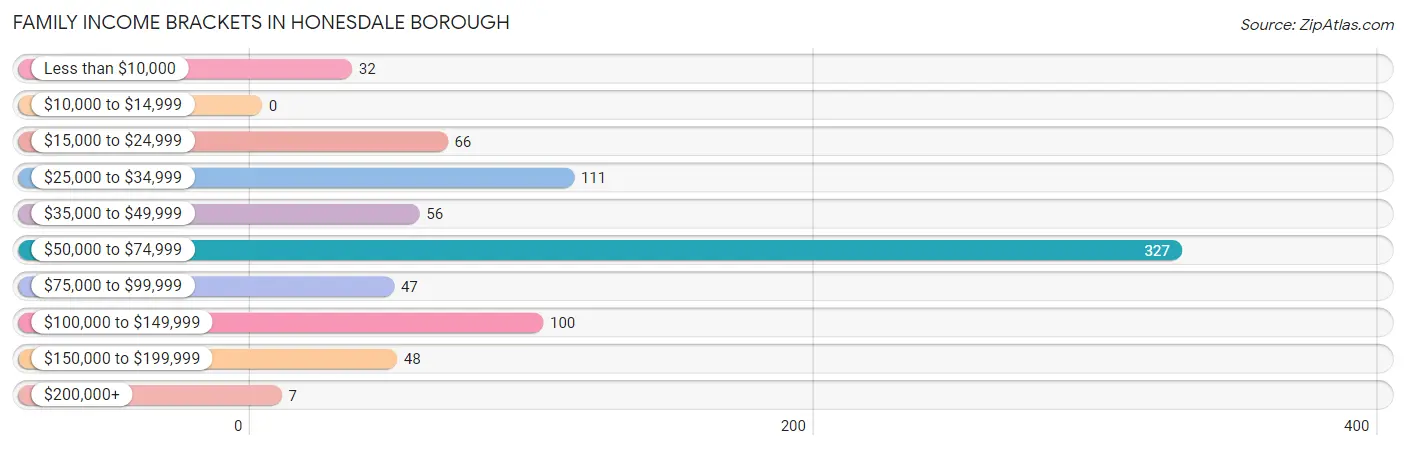
Family Income in Honesdale borough
Family Income Brackets in Honesdale borough
According to the Honesdale borough family income data, there are 327 families falling into the $50,000 to $74,999 income range, which is the most common income bracket and makes up 41.2% of all families.
| Income Bracket | # Families | % Families |
| Less than $10,000 | 32 | 4.0% |
| $10,000 to $14,999 | 0 | 0.0% |
| $15,000 to $24,999 | 66 | 8.3% |
| $25,000 to $34,999 | 111 | 14.0% |
| $35,000 to $49,999 | 56 | 7.1% |
| $50,000 to $74,999 | 327 | 41.2% |
| $75,000 to $99,999 | 47 | 5.9% |
| $100,000 to $149,999 | 100 | 12.6% |
| $150,000 to $199,999 | 48 | 6.0% |
| $200,000+ | 7 | 0.9% |
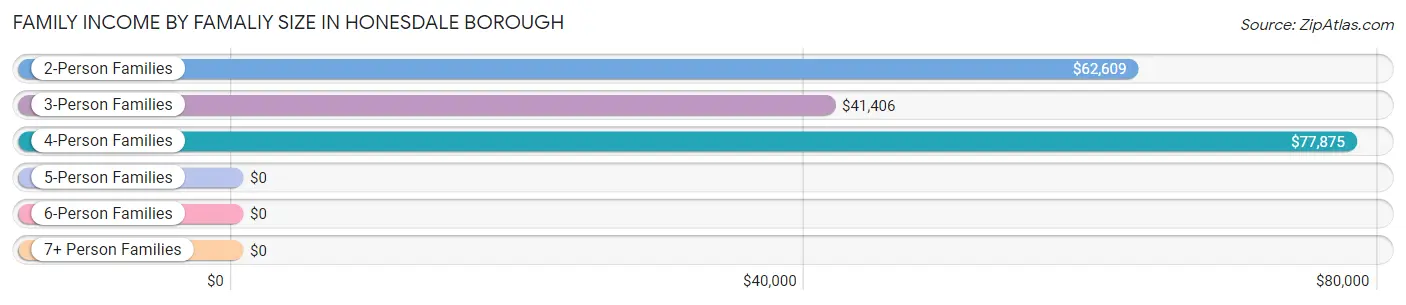
Family Income by Famaliy Size in Honesdale borough
4-person families (150 | 18.9%) account for the highest median family income in Honesdale borough with $77,875 per family, while 2-person families (448 | 56.4%) have the highest median income of $31,304 per family member.
| Income Bracket | # Families | Median Income |
| 2-Person Families | 448 (56.4%) | $62,609 |
| 3-Person Families | 149 (18.8%) | $41,406 |
| 4-Person Families | 150 (18.9%) | $77,875 |
| 5-Person Families | 0 (0.0%) | $0 |
| 6-Person Families | 47 (5.9%) | $0 |
| 7+ Person Families | 0 (0.0%) | $0 |
| Total | 794 (100.0%) | $59,518 |
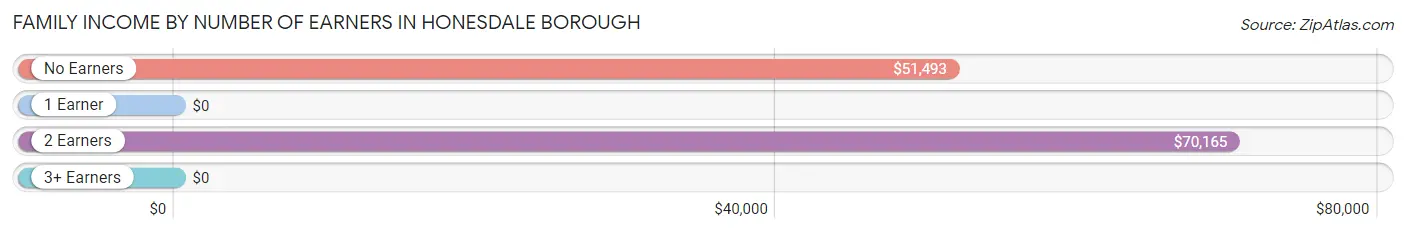
Family Income by Number of Earners in Honesdale borough
| Number of Earners | # Families | Median Income |
| No Earners | 165 (20.8%) | $51,493 |
| 1 Earner | 226 (28.5%) | $0 |
| 2 Earners | 335 (42.2%) | $70,165 |
| 3+ Earners | 68 (8.6%) | $0 |
| Total | 794 (100.0%) | $59,518 |
Household Income in Honesdale borough
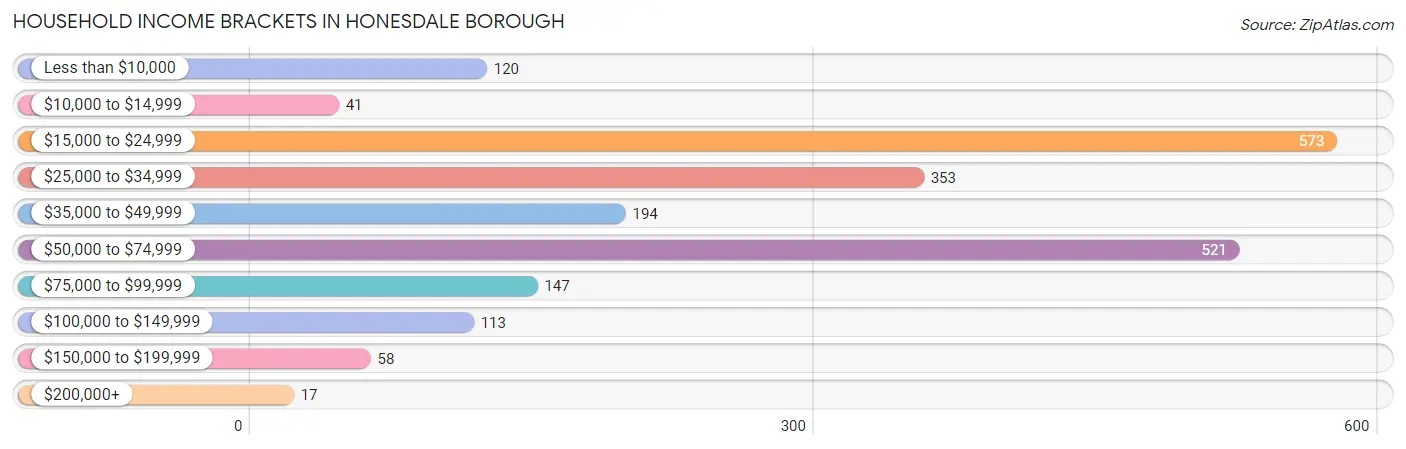
Household Income Brackets in Honesdale borough
With 573 households falling in the category, the $15,000 to $24,999 income range is the most frequent in Honesdale borough, accounting for 26.8% of all households. In contrast, only 17 households (0.8%) fall into the $200,000+ income bracket, making it the least populous group.
| Income Bracket | # Households | % Households |
| Less than $10,000 | 120 | 5.6% |
| $10,000 to $14,999 | 41 | 1.9% |
| $15,000 to $24,999 | 573 | 26.8% |
| $25,000 to $34,999 | 353 | 16.5% |
| $35,000 to $49,999 | 194 | 9.1% |
| $50,000 to $74,999 | 521 | 24.4% |
| $75,000 to $99,999 | 147 | 6.9% |
| $100,000 to $149,999 | 113 | 5.3% |
| $150,000 to $199,999 | 58 | 2.7% |
| $200,000+ | 17 | 0.8% |
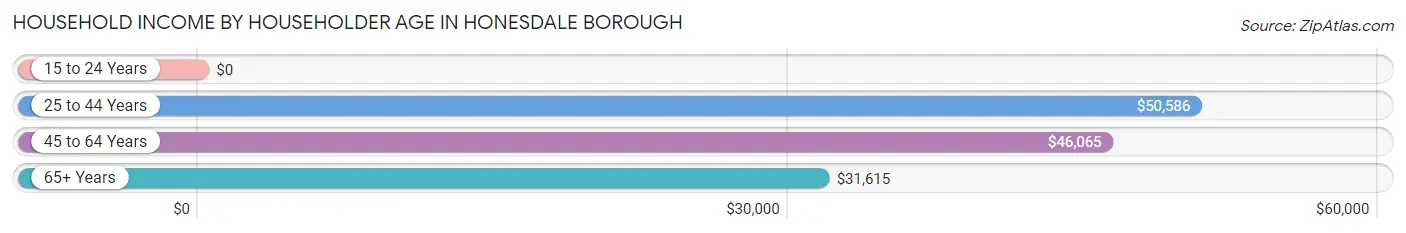
Household Income by Householder Age in Honesdale borough
The median household income in Honesdale borough is $34,700, with the highest median household income of $50,586 found in the 25 to 44 years age bracket for the primary householder. A total of 641 households (30.0%) fall into this category. Meanwhile, the 15 to 24 years age bracket for the primary householder has the lowest median household income of $0, with 62 households (2.9%) in this group.
| Income Bracket | # Households | Median Income |
| 15 to 24 Years | 62 (2.9%) | $0 |
| 25 to 44 Years | 641 (30.0%) | $50,586 |
| 45 to 64 Years | 687 (32.2%) | $46,065 |
| 65+ Years | 747 (35.0%) | $31,615 |
| Total | 2,137 (100.0%) | $34,700 |
Poverty in Honesdale borough
Income Below Poverty by Sex and Age in Honesdale borough
With 30.9% poverty level for males and 11.3% for females among the residents of Honesdale borough, 16 and 17 year old males and 12 to 14 year old females are the most vulnerable to poverty, with 62 males (82.7%) and 39 females (65.0%) in their respective age groups living below the poverty level.
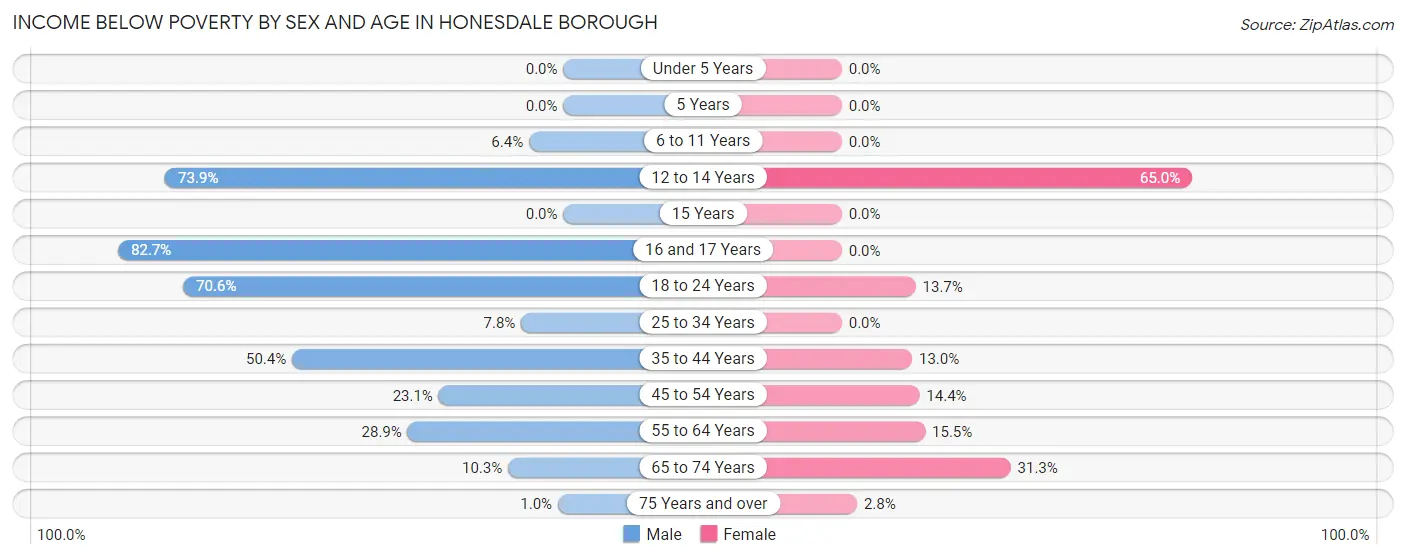
| Age Bracket | Male | Female |
| Under 5 Years | 0 (0.0%) | 0 (0.0%) |
| 5 Years | 0 (0.0%) | 0 (0.0%) |
| 6 to 11 Years | 9 (6.4%) | 0 (0.0%) |
| 12 to 14 Years | 34 (73.9%) | 39 (65.0%) |
| 15 Years | 0 (0.0%) | 0 (0.0%) |
| 16 and 17 Years | 62 (82.7%) | 0 (0.0%) |
| 18 to 24 Years | 144 (70.6%) | 40 (13.7%) |
| 25 to 34 Years | 22 (7.8%) | 0 (0.0%) |
| 35 to 44 Years | 209 (50.4%) | 33 (13.0%) |
| 45 to 54 Years | 28 (23.1%) | 34 (14.4%) |
| 55 to 64 Years | 109 (28.9%) | 62 (15.5%) |
| 65 to 74 Years | 23 (10.3%) | 47 (31.3%) |
| 75 Years and over | 1 (1.0%) | 13 (2.8%) |
| Total | 641 (30.9%) | 268 (11.3%) |
Income Above Poverty by Sex and Age in Honesdale borough
According to the poverty statistics in Honesdale borough, males aged under 5 years and females aged under 5 years are the age groups that are most secure financially, with 100.0% of males and 100.0% of females in these age groups living above the poverty line.
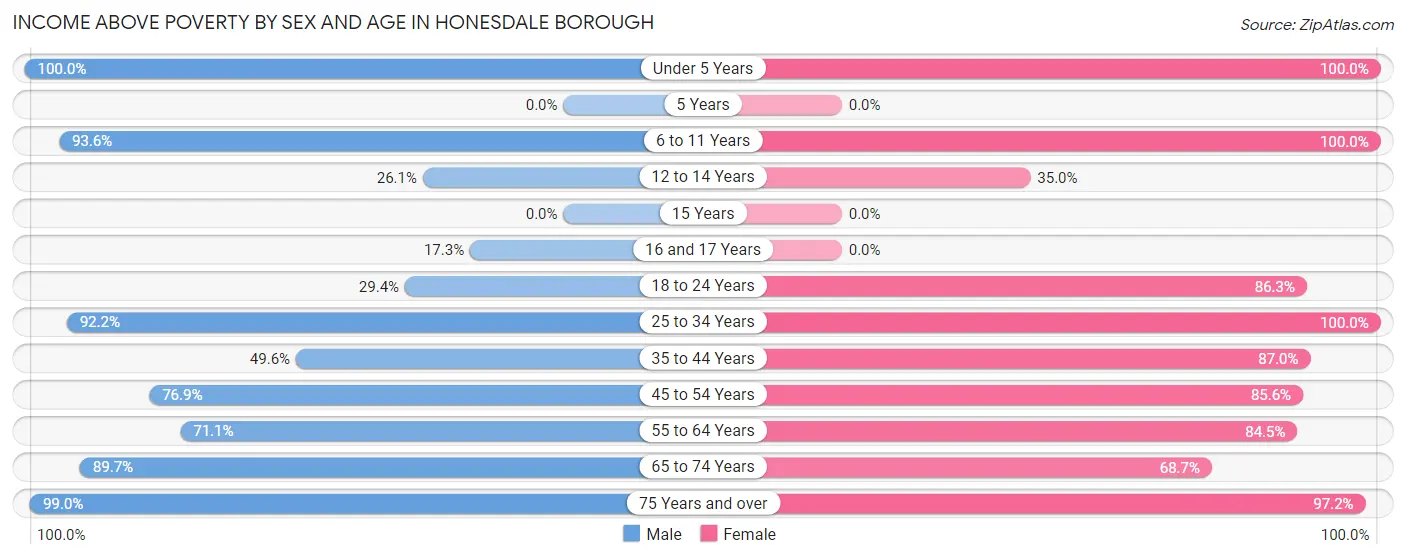
| Age Bracket | Male | Female |
| Under 5 Years | 94 (100.0%) | 38 (100.0%) |
| 5 Years | 0 (0.0%) | 0 (0.0%) |
| 6 to 11 Years | 132 (93.6%) | 163 (100.0%) |
| 12 to 14 Years | 12 (26.1%) | 21 (35.0%) |
| 15 Years | 0 (0.0%) | 0 (0.0%) |
| 16 and 17 Years | 13 (17.3%) | 0 (0.0%) |
| 18 to 24 Years | 60 (29.4%) | 252 (86.3%) |
| 25 to 34 Years | 259 (92.2%) | 325 (100.0%) |
| 35 to 44 Years | 206 (49.6%) | 220 (87.0%) |
| 45 to 54 Years | 93 (76.9%) | 202 (85.6%) |
| 55 to 64 Years | 268 (71.1%) | 339 (84.5%) |
| 65 to 74 Years | 201 (89.7%) | 103 (68.7%) |
| 75 Years and over | 98 (99.0%) | 450 (97.2%) |
| Total | 1,436 (69.1%) | 2,113 (88.7%) |
Income Below Poverty Among Married-Couple Families in Honesdale borough
The poverty statistics for married-couple families in Honesdale borough show that 13.6% or 72 of the total 530 families live below the poverty line. Families with 1 or 2 children have the highest poverty rate of 22.0%, comprising of 36 families. On the other hand, families with no children have the lowest poverty rate of 9.8%, which includes 36 families.
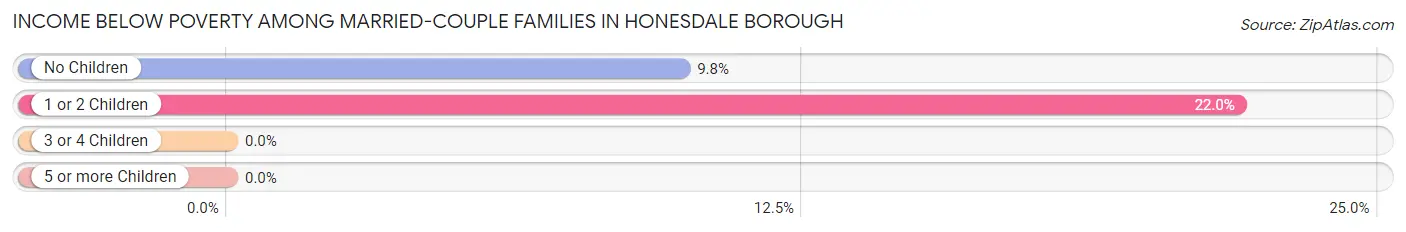
| Children | Above Poverty | Below Poverty |
| No Children | 330 (90.2%) | 36 (9.8%) |
| 1 or 2 Children | 128 (78.0%) | 36 (22.0%) |
| 3 or 4 Children | 0 (0.0%) | 0 (0.0%) |
| 5 or more Children | 0 (0.0%) | 0 (0.0%) |
| Total | 458 (86.4%) | 72 (13.6%) |
Income Below Poverty Among Single-Parent Households in Honesdale borough
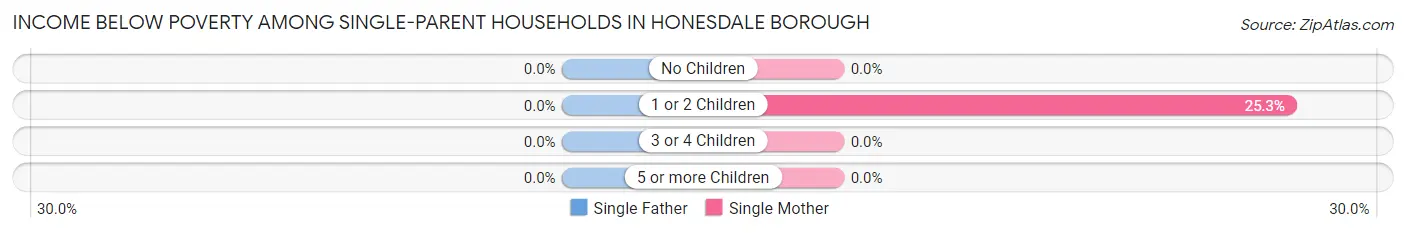
| Children | Single Father | Single Mother |
| No Children | 0 (0.0%) | 0 (0.0%) |
| 1 or 2 Children | 0 (0.0%) | 40 (25.3%) |
| 3 or 4 Children | 0 (0.0%) | 0 (0.0%) |
| 5 or more Children | 0 (0.0%) | 0 (0.0%) |
| Total | 0 (0.0%) | 40 (15.8%) |
Income Below Poverty Among Married-Couple vs Single-Parent Households in Honesdale borough
The poverty data for Honesdale borough shows that 72 of the married-couple family households (13.6%) and 40 of the single-parent households (15.1%) are living below the poverty level. Within the married-couple family households, those with 1 or 2 children have the highest poverty rate, with 36 households (22.0%) falling below the poverty line. Among the single-parent households, those with 1 or 2 children have the highest poverty rate, with 40 household (23.7%) living below poverty.
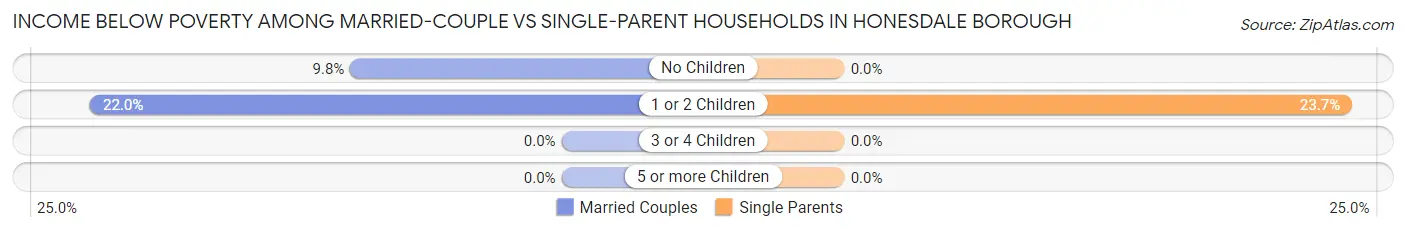
| Children | Married-Couple Families | Single-Parent Households |
| No Children | 36 (9.8%) | 0 (0.0%) |
| 1 or 2 Children | 36 (22.0%) | 40 (23.7%) |
| 3 or 4 Children | 0 (0.0%) | 0 (0.0%) |
| 5 or more Children | 0 (0.0%) | 0 (0.0%) |
| Total | 72 (13.6%) | 40 (15.1%) |
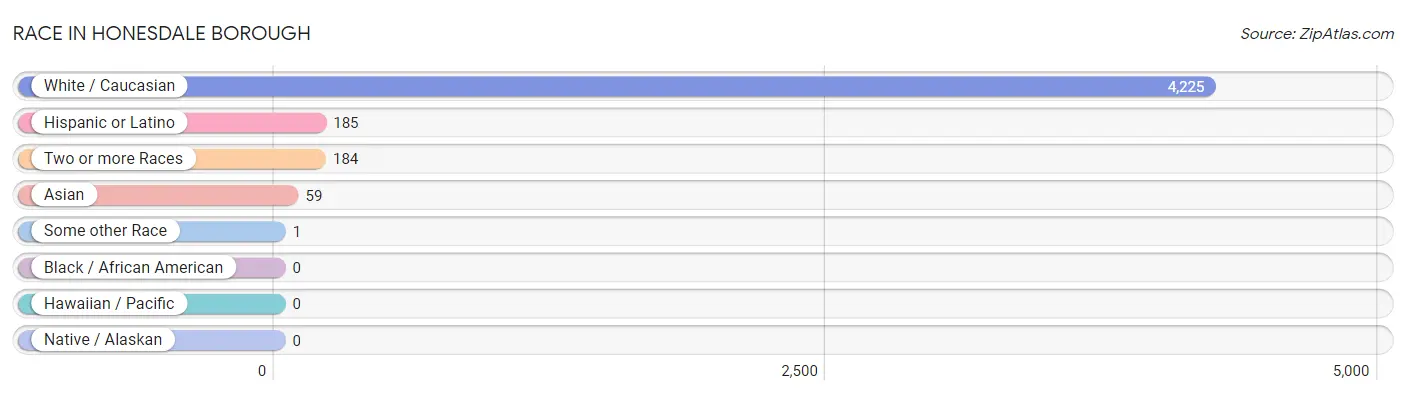
Race in Honesdale borough
The most populous races in Honesdale borough are White / Caucasian (4,225 | 94.5%), Hispanic or Latino (185 | 4.1%), and Two or more Races (184 | 4.1%).
| Race | # Population | % Population |
| Asian | 59 | 1.3% |
| Black / African American | 0 | 0.0% |
| Hawaiian / Pacific | 0 | 0.0% |
| Hispanic or Latino | 185 | 4.1% |
| Native / Alaskan | 0 | 0.0% |
| White / Caucasian | 4,225 | 94.5% |
| Two or more Races | 184 | 4.1% |
| Some other Race | 1 | 0.0% |
| Total | 4,469 | 100.0% |
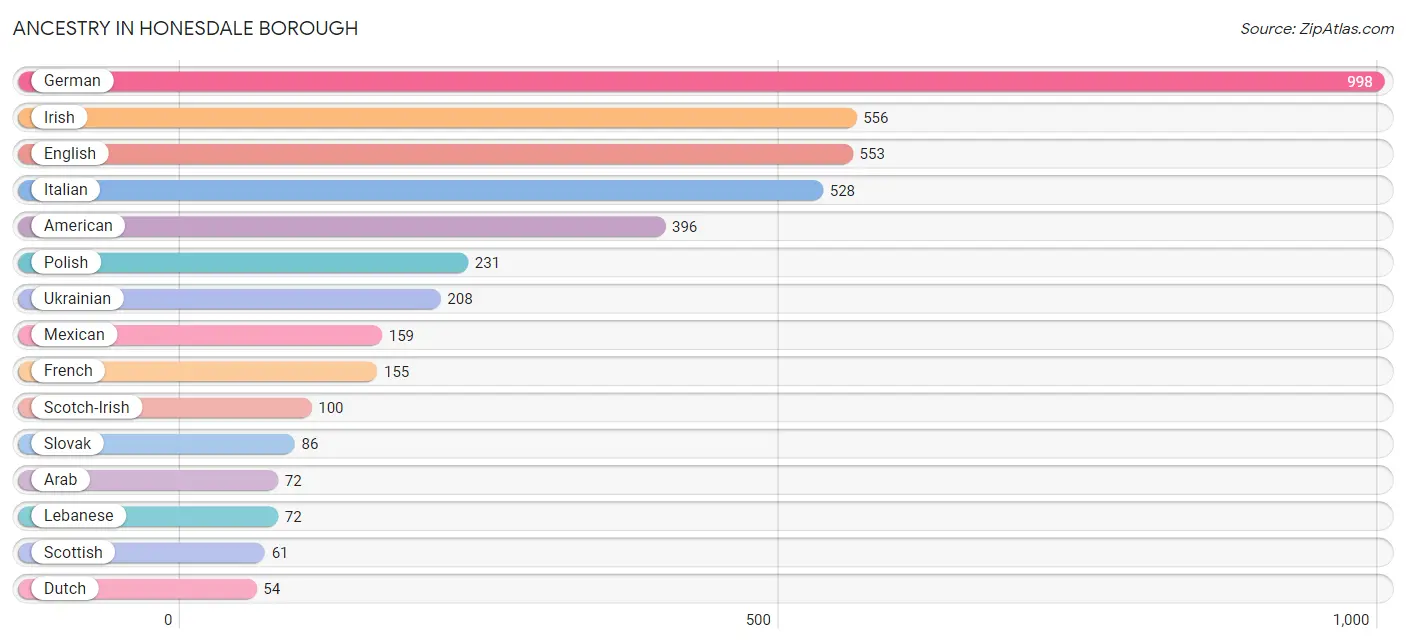
Ancestry in Honesdale borough
The most populous ancestries reported in Honesdale borough are German (998 | 22.3%), Irish (556 | 12.4%), English (553 | 12.4%), Italian (528 | 11.8%), and American (396 | 8.9%), together accounting for 67.8% of all Honesdale borough residents.
| Ancestry | # Population | % Population |
| American | 396 | 8.9% |
| Apache | 8 | 0.2% |
| Arab | 72 | 1.6% |
| Austrian | 16 | 0.4% |
| British | 19 | 0.4% |
| Cherokee | 6 | 0.1% |
| Dutch | 54 | 1.2% |
| English | 553 | 12.4% |
| European | 26 | 0.6% |
| Finnish | 24 | 0.5% |
| French | 155 | 3.5% |
| French Canadian | 21 | 0.5% |
| German | 998 | 22.3% |
| Greek | 11 | 0.3% |
| Hungarian | 49 | 1.1% |
| Irish | 556 | 12.4% |
| Iroquois | 16 | 0.4% |
| Italian | 528 | 11.8% |
| Lebanese | 72 | 1.6% |
| Lithuanian | 26 | 0.6% |
| Mexican | 159 | 3.6% |
| Norwegian | 14 | 0.3% |
| Pennsylvania German | 28 | 0.6% |
| Polish | 231 | 5.2% |
| Puerto Rican | 26 | 0.6% |
| Russian | 24 | 0.5% |
| Scotch-Irish | 100 | 2.2% |
| Scottish | 61 | 1.4% |
| Slovak | 86 | 1.9% |
| Swedish | 16 | 0.4% |
| Swiss | 24 | 0.5% |
| Ukrainian | 208 | 4.6% |
| Welsh | 14 | 0.3% | View All 33 Rows |
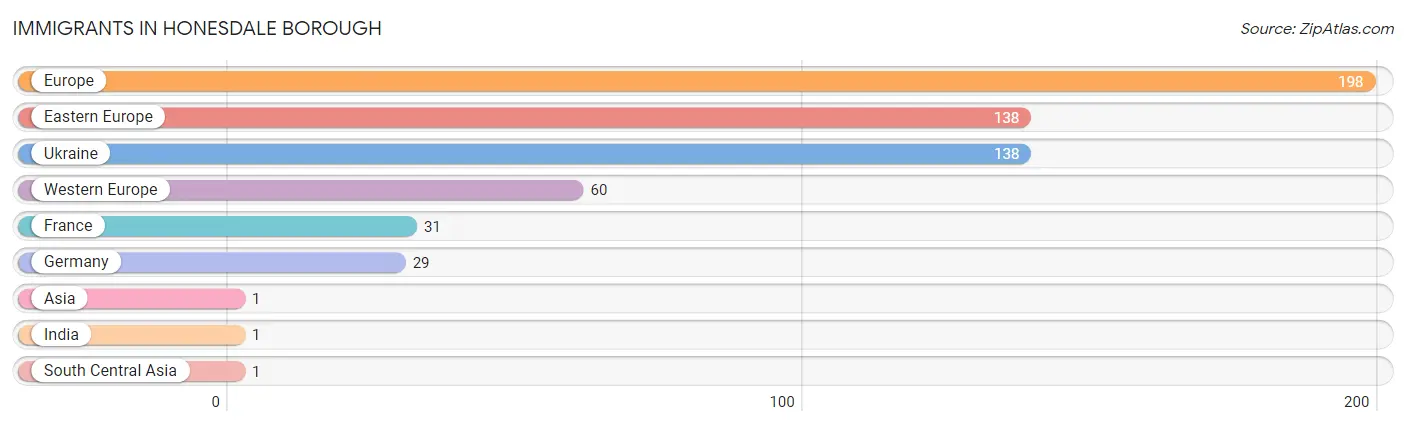
Immigrants in Honesdale borough
The most numerous immigrant groups reported in Honesdale borough came from Europe (198 | 4.4%), Eastern Europe (138 | 3.1%), Ukraine (138 | 3.1%), Western Europe (60 | 1.3%), and France (31 | 0.7%), together accounting for 12.6% of all Honesdale borough residents.
| Immigration Origin | # Population | % Population |
| Asia | 1 | 0.0% |
| Eastern Europe | 138 | 3.1% |
| Europe | 198 | 4.4% |
| France | 31 | 0.7% |
| Germany | 29 | 0.6% |
| India | 1 | 0.0% |
| South Central Asia | 1 | 0.0% |
| Ukraine | 138 | 3.1% |
| Western Europe | 60 | 1.3% | View All 9 Rows |
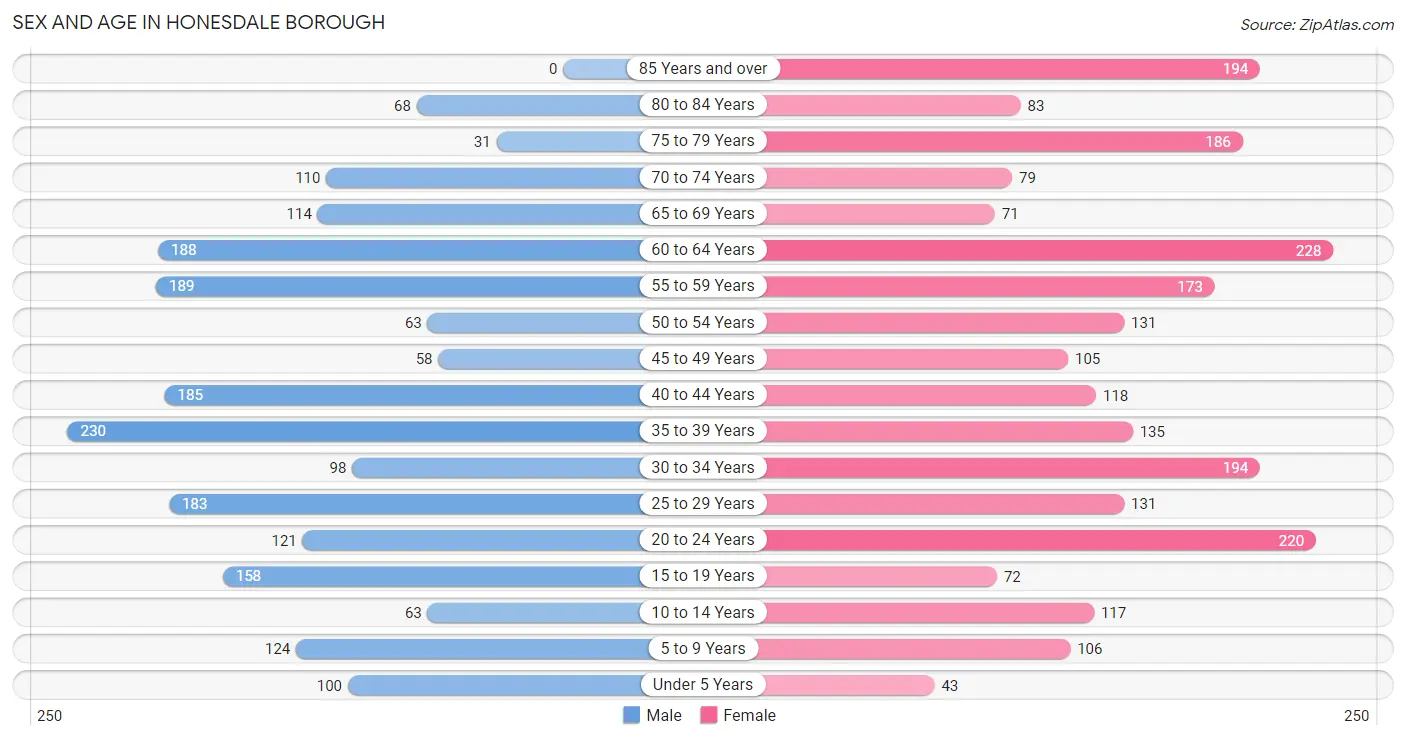
Sex and Age in Honesdale borough
Sex and Age in Honesdale borough
The most populous age groups in Honesdale borough are 35 to 39 Years (230 | 11.0%) for men and 60 to 64 Years (228 | 9.6%) for women.
| Age Bracket | Male | Female |
| Under 5 Years | 100 (4.8%) | 43 (1.8%) |
| 5 to 9 Years | 124 (5.9%) | 106 (4.4%) |
| 10 to 14 Years | 63 (3.0%) | 117 (4.9%) |
| 15 to 19 Years | 158 (7.6%) | 72 (3.0%) |
| 20 to 24 Years | 121 (5.8%) | 220 (9.2%) |
| 25 to 29 Years | 183 (8.8%) | 131 (5.5%) |
| 30 to 34 Years | 98 (4.7%) | 194 (8.1%) |
| 35 to 39 Years | 230 (11.0%) | 135 (5.7%) |
| 40 to 44 Years | 185 (8.9%) | 118 (5.0%) |
| 45 to 49 Years | 58 (2.8%) | 105 (4.4%) |
| 50 to 54 Years | 63 (3.0%) | 131 (5.5%) |
| 55 to 59 Years | 189 (9.1%) | 173 (7.2%) |
| 60 to 64 Years | 188 (9.0%) | 228 (9.6%) |
| 65 to 69 Years | 114 (5.5%) | 71 (3.0%) |
| 70 to 74 Years | 110 (5.3%) | 79 (3.3%) |
| 75 to 79 Years | 31 (1.5%) | 186 (7.8%) |
| 80 to 84 Years | 68 (3.3%) | 83 (3.5%) |
| 85 Years and over | 0 (0.0%) | 194 (8.1%) |
| Total | 2,083 (100.0%) | 2,386 (100.0%) |
Families and Households in Honesdale borough
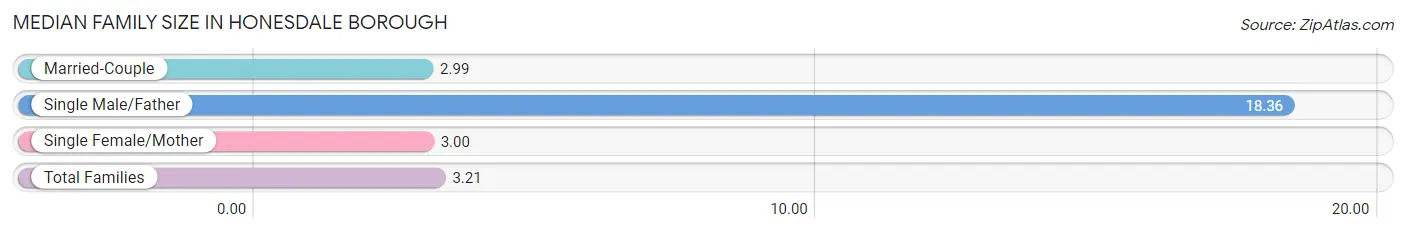
Median Family Size in Honesdale borough
The median family size in Honesdale borough is 3.21 persons per family, with single male/father families (11 | 1.4%) accounting for the largest median family size of 18.36 persons per family. On the other hand, married-couple families (530 | 66.7%) represent the smallest median family size with 2.99 persons per family.
| Family Type | # Families | Family Size |
| Married-Couple | 530 (66.7%) | 2.99 |
| Single Male/Father | 11 (1.4%) | 18.36 |
| Single Female/Mother | 253 (31.9%) | 3.00 |
| Total Families | 794 (100.0%) | 3.21 |
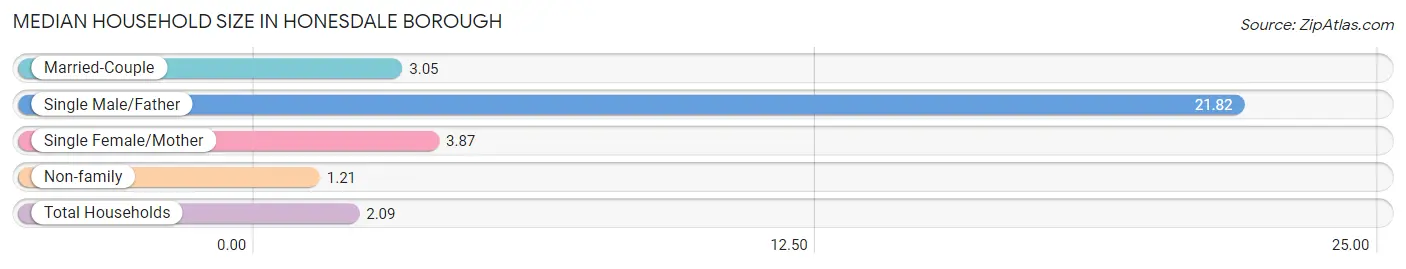
Median Household Size in Honesdale borough
The median household size in Honesdale borough is 2.09 persons per household, with single male/father households (11 | 0.5%) accounting for the largest median household size of 21.82 persons per household. non-family households (1,343 | 62.8%) represent the smallest median household size with 1.21 persons per household.
| Household Type | # Households | Household Size |
| Married-Couple | 530 (24.8%) | 3.05 |
| Single Male/Father | 11 (0.5%) | 21.82 |
| Single Female/Mother | 253 (11.8%) | 3.87 |
| Non-family | 1,343 (62.8%) | 1.21 |
| Total Households | 2,137 (100.0%) | 2.09 |
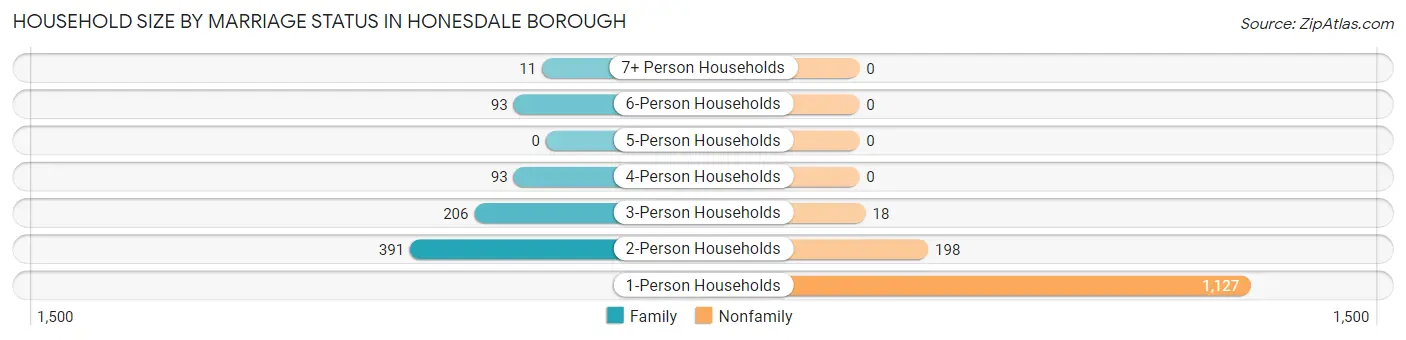
Household Size by Marriage Status in Honesdale borough
Out of a total of 2,137 households in Honesdale borough, 794 (37.1%) are family households, while 1,343 (62.8%) are nonfamily households. The most numerous type of family households are 2-person households, comprising 391, and the most common type of nonfamily households are 1-person households, comprising 1,127.
| Household Size | Family Households | Nonfamily Households |
| 1-Person Households | - | 1,127 (52.7%) |
| 2-Person Households | 391 (18.3%) | 198 (9.3%) |
| 3-Person Households | 206 (9.6%) | 18 (0.8%) |
| 4-Person Households | 93 (4.3%) | 0 (0.0%) |
| 5-Person Households | 0 (0.0%) | 0 (0.0%) |
| 6-Person Households | 93 (4.3%) | 0 (0.0%) |
| 7+ Person Households | 11 (0.5%) | 0 (0.0%) |
| Total | 794 (37.1%) | 1,343 (62.8%) |
Female Fertility in Honesdale borough
Fertility by Age in Honesdale borough
Average fertility rate in Honesdale borough is 7.0 births per 1,000 women. Women in the age bracket of 20 to 34 years have the highest fertility rate with 13.0 births per 1,000 women. Women in the age bracket of 20 to 34 years acount for 100.0% of all women with births.
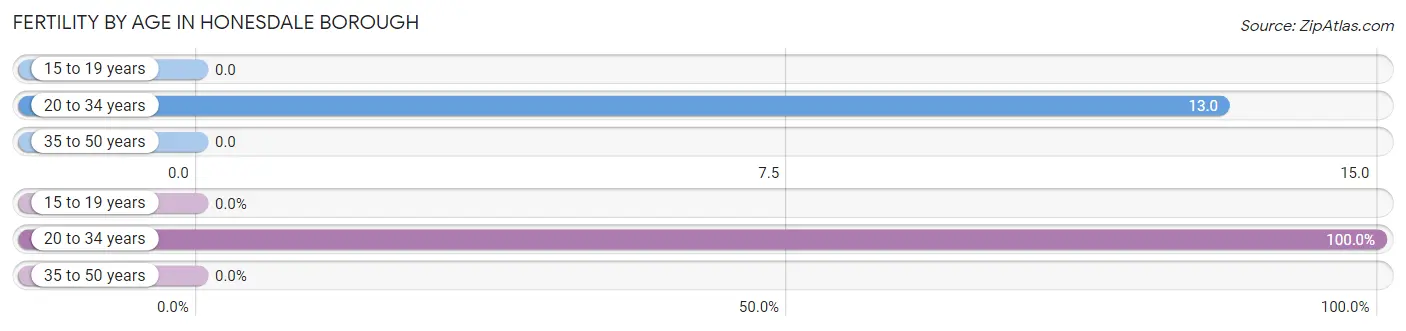
| Age Bracket | Women with Births | Births / 1,000 Women |
| 15 to 19 years | 0 (0.0%) | 0.0 |
| 20 to 34 years | 7 (100.0%) | 13.0 |
| 35 to 50 years | 0 (0.0%) | 0.0 |
| Total | 7 (100.0%) | 7.0 |
Fertility by Age by Marriage Status in Honesdale borough
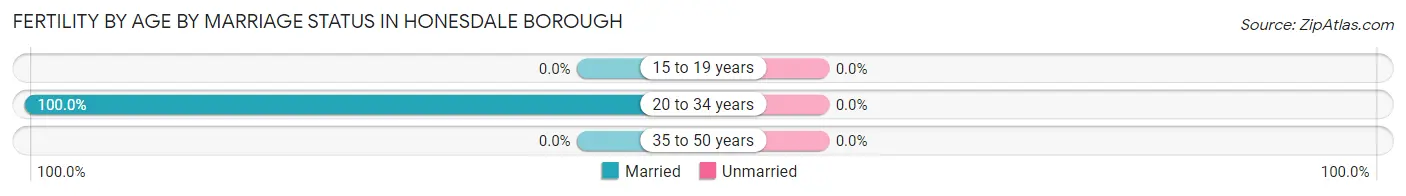
| Age Bracket | Married | Unmarried |
| 15 to 19 years | 0 (0.0%) | 0 (0.0%) |
| 20 to 34 years | 7 (100.0%) | 0 (0.0%) |
| 35 to 50 years | 0 (0.0%) | 0 (0.0%) |
| Total | 7 (100.0%) | 0 (0.0%) |
Fertility by Education in Honesdale borough
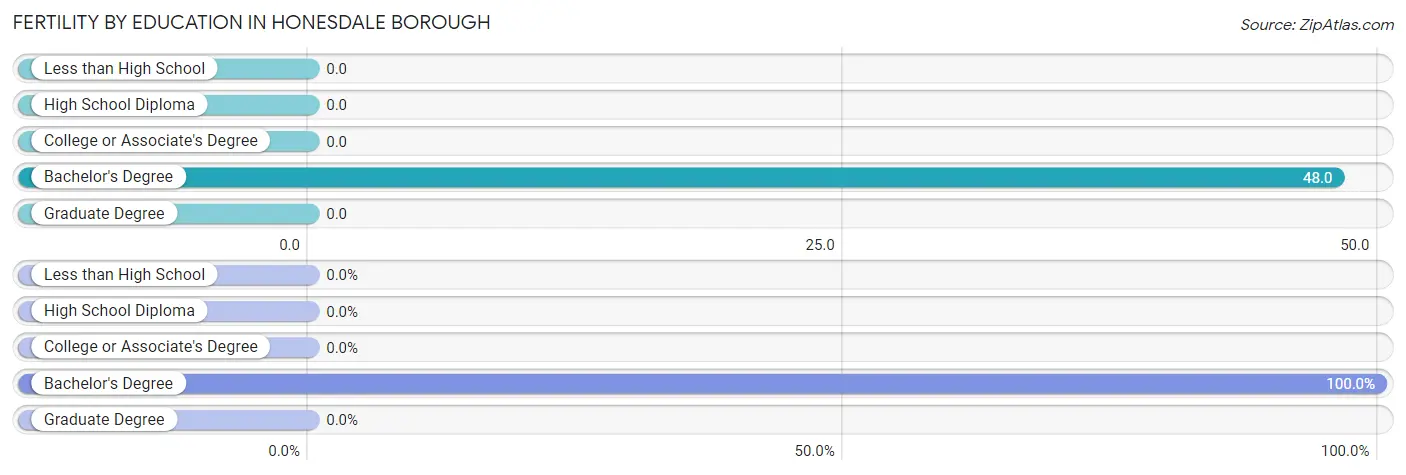
| Educational Attainment | Women with Births | Births / 1,000 Women |
| Less than High School | 0 (0.0%) | 0.0 |
| High School Diploma | 0 (0.0%) | 0.0 |
| College or Associate's Degree | 0 (0.0%) | 0.0 |
| Bachelor's Degree | 7 (100.0%) | 48.0 |
| Graduate Degree | 0 (0.0%) | 0.0 |
| Total | 7 (100.0%) | 7.0 |
Fertility by Education by Marriage Status in Honesdale borough
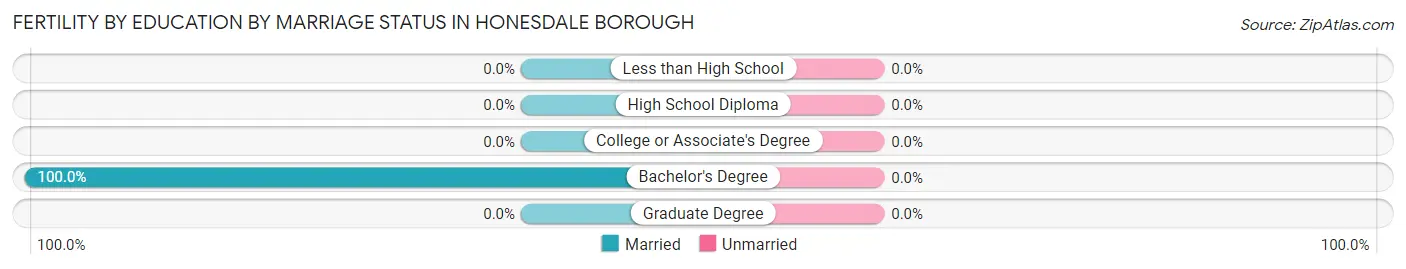
| Educational Attainment | Married | Unmarried |
| Less than High School | 0 (0.0%) | 0 (0.0%) |
| High School Diploma | 0 (0.0%) | 0 (0.0%) |
| College or Associate's Degree | 0 (0.0%) | 0 (0.0%) |
| Bachelor's Degree | 7 (100.0%) | 0 (0.0%) |
| Graduate Degree | 0 (0.0%) | 0 (0.0%) |
| Total | 7 (100.0%) | 0 (0.0%) |
Employment Characteristics in Honesdale borough
Employment by Class of Employer in Honesdale borough
Among the 1,914 employed individuals in Honesdale borough, private company employees (1,524 | 79.6%), local government employees (142 | 7.4%), and not-for-profit organizations (128 | 6.7%) make up the most common classes of employment.
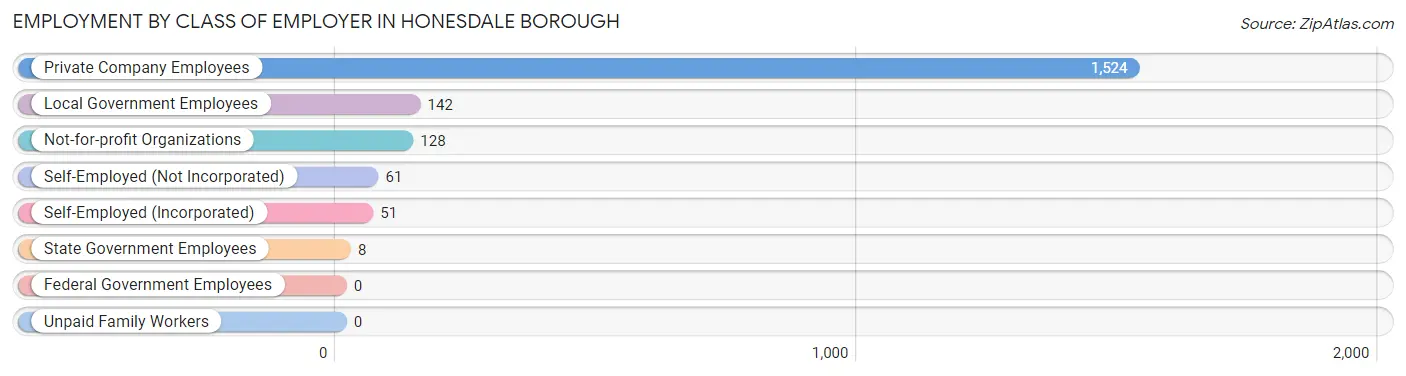
| Employer Class | # Employees | % Employees |
| Private Company Employees | 1,524 | 79.6% |
| Self-Employed (Incorporated) | 51 | 2.7% |
| Self-Employed (Not Incorporated) | 61 | 3.2% |
| Not-for-profit Organizations | 128 | 6.7% |
| Local Government Employees | 142 | 7.4% |
| State Government Employees | 8 | 0.4% |
| Federal Government Employees | 0 | 0.0% |
| Unpaid Family Workers | 0 | 0.0% |
| Total | 1,914 | 100.0% |
Employment Status by Age in Honesdale borough
According to the labor force statistics for Honesdale borough, out of the total population over 16 years of age (3,916), 54.3% or 2,126 individuals are in the labor force, with 9.4% or 200 of them unemployed. The age group with the highest labor force participation rate is 30 to 34 years, with 100.0% or 292 individuals in the labor force. Within the labor force, the 20 to 24 years age range has the highest percentage of unemployed individuals, with 56.6% or 138 of them being unemployed.
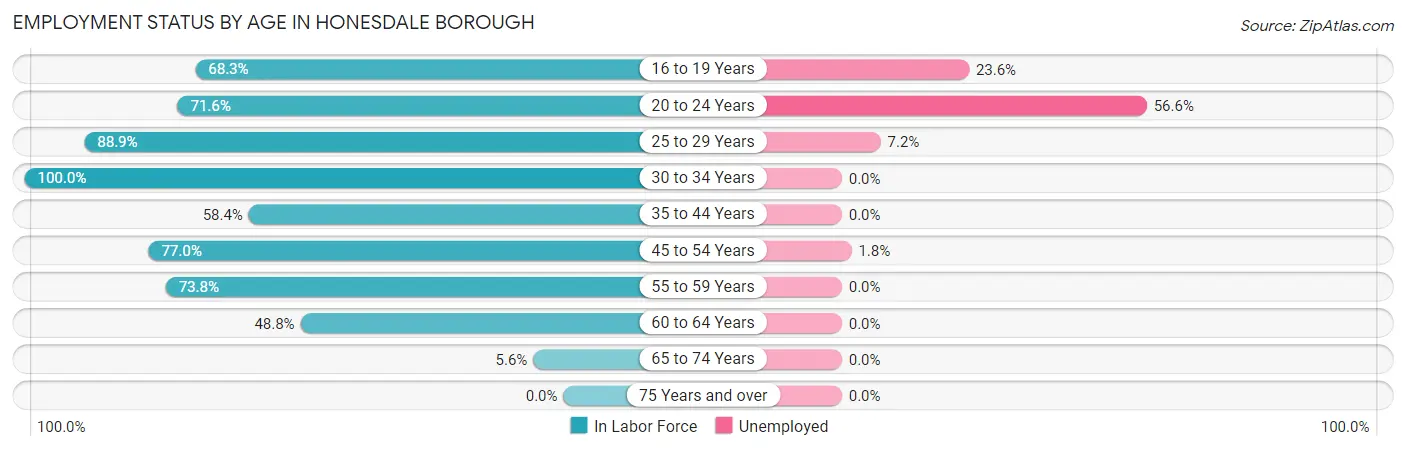
| Age Bracket | In Labor Force | Unemployed |
| 16 to 19 Years | 157 (68.3%) | 37 (23.6%) |
| 20 to 24 Years | 244 (71.6%) | 138 (56.6%) |
| 25 to 29 Years | 279 (88.9%) | 20 (7.2%) |
| 30 to 34 Years | 292 (100.0%) | 0 (0.0%) |
| 35 to 44 Years | 390 (58.4%) | 0 (0.0%) |
| 45 to 54 Years | 275 (77.0%) | 5 (1.8%) |
| 55 to 59 Years | 267 (73.8%) | 0 (0.0%) |
| 60 to 64 Years | 203 (48.8%) | 0 (0.0%) |
| 65 to 74 Years | 21 (5.6%) | 0 (0.0%) |
| 75 Years and over | 0 (0.0%) | 0 (0.0%) |
| Total | 2,126 (54.3%) | 200 (9.4%) |
Employment Status by Educational Attainment in Honesdale borough
According to labor force statistics for Honesdale borough, 70.8% of individuals (1,706) out of the total population between 25 and 64 years of age (2,409) are in the labor force, with 1.5% or 26 of them being unemployed. The group with the highest labor force participation rate are those with the educational attainment of college / associate degree, with 85.5% or 584 individuals in the labor force. Within the labor force, individuals with high school diploma education have the highest percentage of unemployment, with 3.0% or 20 of them being unemployed.
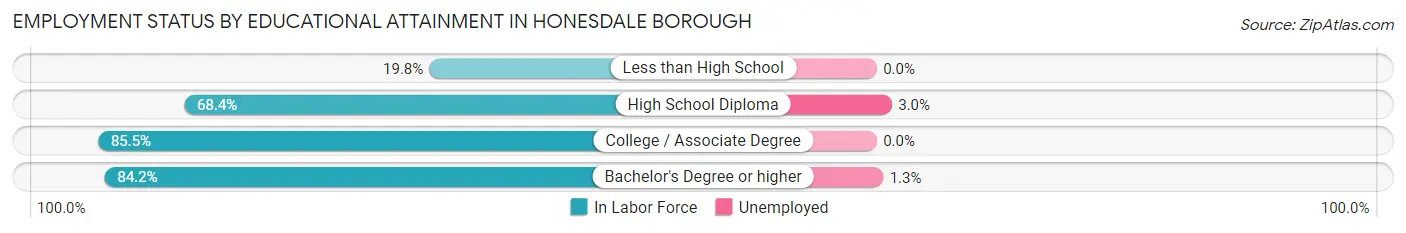
| Educational Attainment | In Labor Force | Unemployed |
| Less than High School | 54 (19.8%) | 0 (0.0%) |
| High School Diploma | 673 (68.4%) | 30 (3.0%) |
| College / Associate Degree | 584 (85.5%) | 0 (0.0%) |
| Bachelor's Degree or higher | 395 (84.2%) | 6 (1.3%) |
| Total | 1,706 (70.8%) | 36 (1.5%) |
Employment Occupations by Sex in Honesdale borough
Management, Business, Science and Arts Occupations
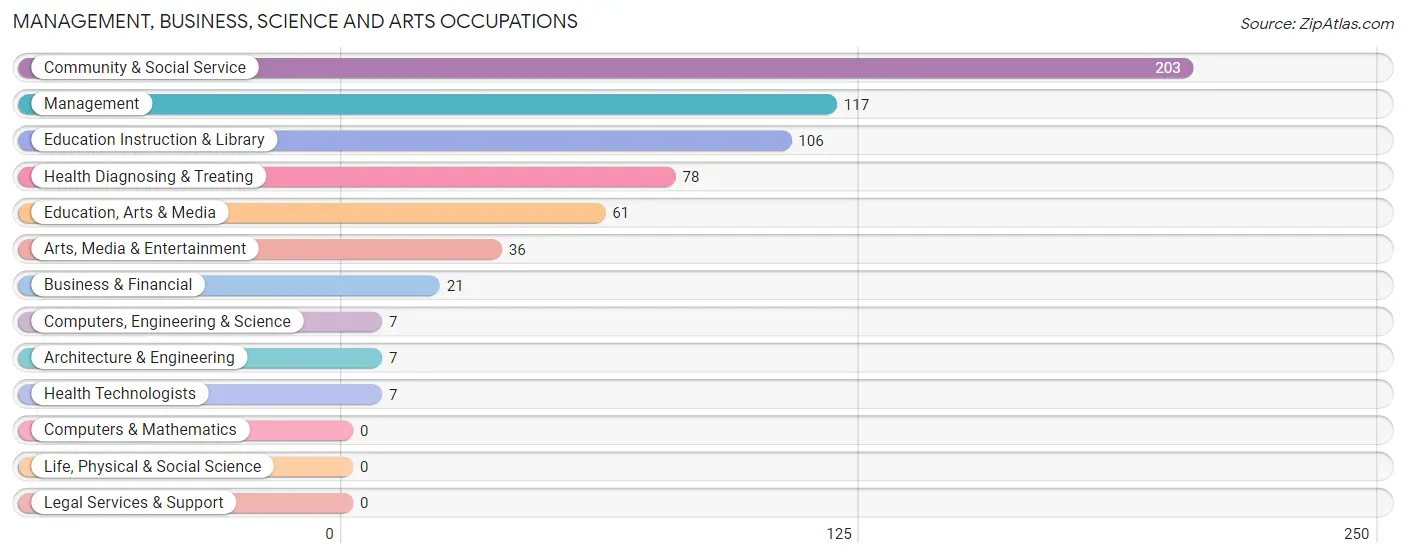
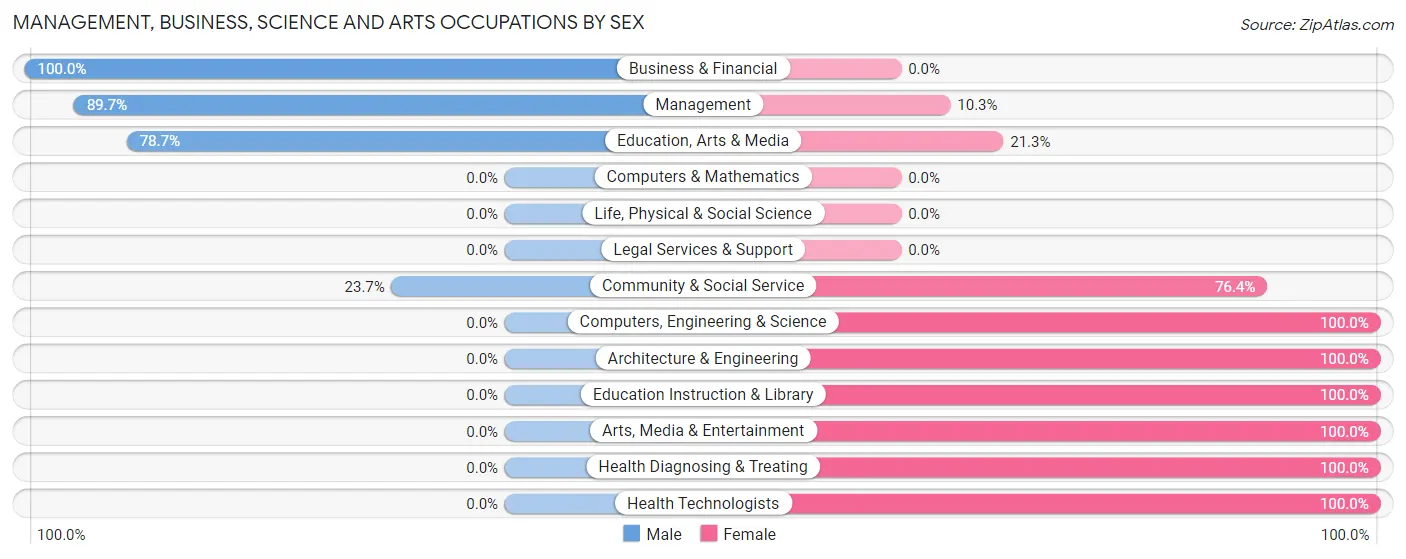
The most common Management, Business, Science and Arts occupations in Honesdale borough are Community & Social Service (203 | 10.5%), Management (117 | 6.1%), Education Instruction & Library (106 | 5.5%), Health Diagnosing & Treating (78 | 4.1%), and Education, Arts & Media (61 | 3.2%).
Management, Business, Science and Arts Occupations by Sex
Within the Management, Business, Science and Arts occupations in Honesdale borough, the most male-oriented occupations are Business & Financial (100.0%), Management (89.7%), and Education, Arts & Media (78.7%), while the most female-oriented occupations are Computers, Engineering & Science (100.0%), Architecture & Engineering (100.0%), and Education Instruction & Library (100.0%).
| Occupation | Male | Female |
| Management | 105 (89.7%) | 12 (10.3%) |
| Business & Financial | 21 (100.0%) | 0 (0.0%) |
| Computers, Engineering & Science | 0 (0.0%) | 7 (100.0%) |
| Computers & Mathematics | 0 (0.0%) | 0 (0.0%) |
| Architecture & Engineering | 0 (0.0%) | 7 (100.0%) |
| Life, Physical & Social Science | 0 (0.0%) | 0 (0.0%) |
| Community & Social Service | 48 (23.6%) | 155 (76.3%) |
| Education, Arts & Media | 48 (78.7%) | 13 (21.3%) |
| Legal Services & Support | 0 (0.0%) | 0 (0.0%) |
| Education Instruction & Library | 0 (0.0%) | 106 (100.0%) |
| Arts, Media & Entertainment | 0 (0.0%) | 36 (100.0%) |
| Health Diagnosing & Treating | 0 (0.0%) | 78 (100.0%) |
| Health Technologists | 0 (0.0%) | 7 (100.0%) |
| Total (Category) | 174 (40.8%) | 252 (59.2%) |
| Total (Overall) | 922 (47.8%) | 1,006 (52.2%) |
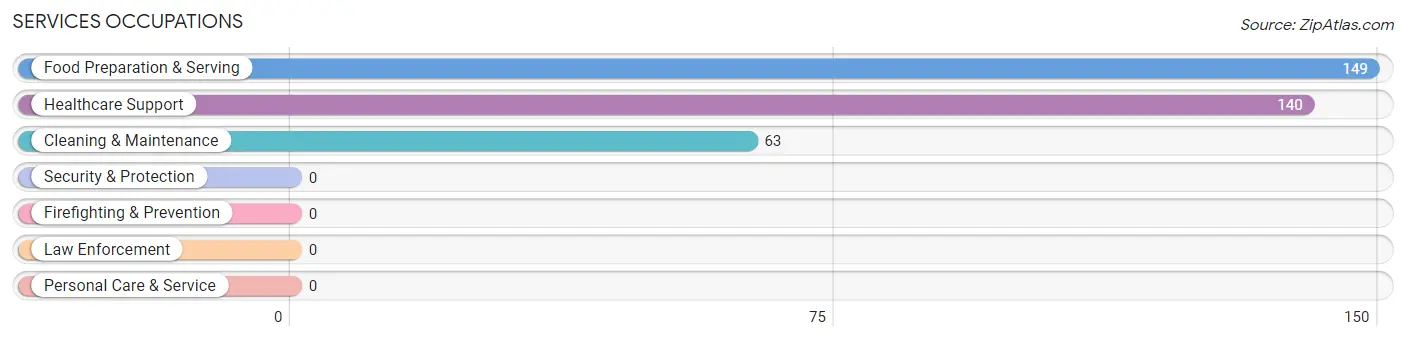
Services Occupations
The most common Services occupations in Honesdale borough are Food Preparation & Serving (149 | 7.7%), Healthcare Support (140 | 7.3%), and Cleaning & Maintenance (63 | 3.3%).
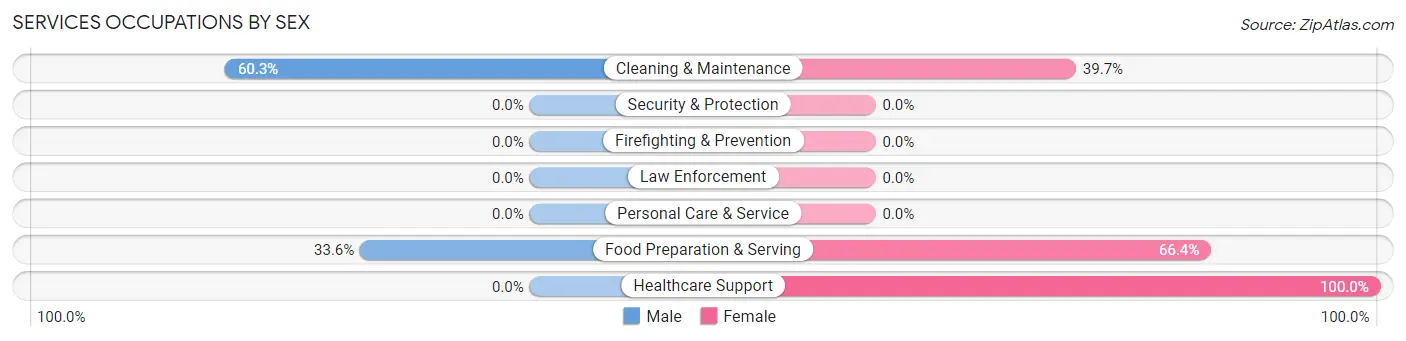
Services Occupations by Sex
Within the Services occupations in Honesdale borough, the most male-oriented occupations are Cleaning & Maintenance (60.3%), and Food Preparation & Serving (33.6%), while the most female-oriented occupations are Healthcare Support (100.0%), Food Preparation & Serving (66.4%), and Cleaning & Maintenance (39.7%).
| Occupation | Male | Female |
| Healthcare Support | 0 (0.0%) | 140 (100.0%) |
| Security & Protection | 0 (0.0%) | 0 (0.0%) |
| Firefighting & Prevention | 0 (0.0%) | 0 (0.0%) |
| Law Enforcement | 0 (0.0%) | 0 (0.0%) |
| Food Preparation & Serving | 50 (33.6%) | 99 (66.4%) |
| Cleaning & Maintenance | 38 (60.3%) | 25 (39.7%) |
| Personal Care & Service | 0 (0.0%) | 0 (0.0%) |
| Total (Category) | 88 (25.0%) | 264 (75.0%) |
| Total (Overall) | 922 (47.8%) | 1,006 (52.2%) |
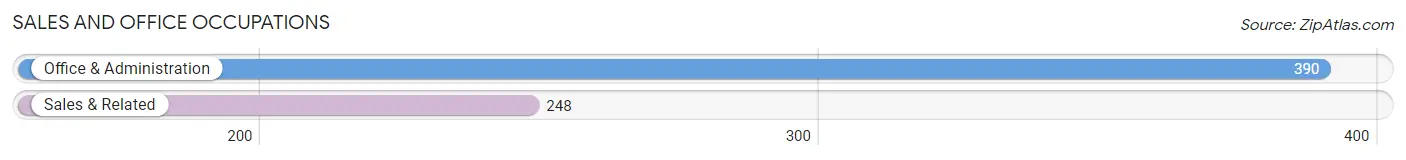
Sales and Office Occupations
The most common Sales and Office occupations in Honesdale borough are Office & Administration (390 | 20.2%), and Sales & Related (248 | 12.9%).
Sales and Office Occupations by Sex
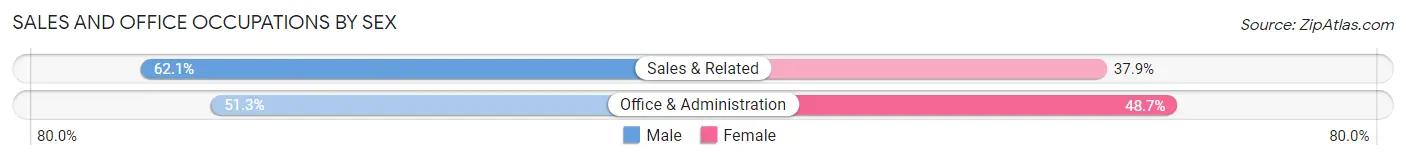
| Occupation | Male | Female |
| Sales & Related | 154 (62.1%) | 94 (37.9%) |
| Office & Administration | 200 (51.3%) | 190 (48.7%) |
| Total (Category) | 354 (55.5%) | 284 (44.5%) |
| Total (Overall) | 922 (47.8%) | 1,006 (52.2%) |
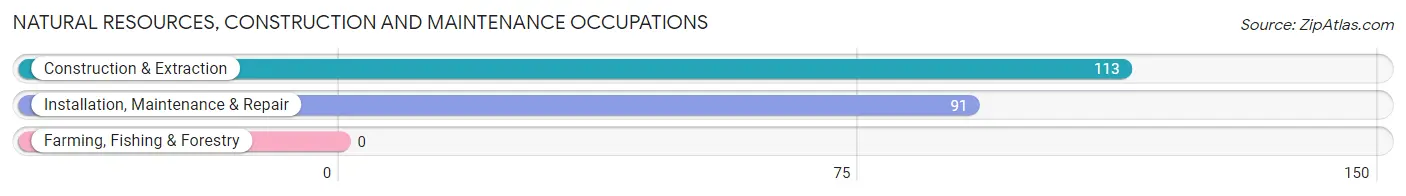
Natural Resources, Construction and Maintenance Occupations
The most common Natural Resources, Construction and Maintenance occupations in Honesdale borough are Construction & Extraction (113 | 5.9%), and Installation, Maintenance & Repair (91 | 4.7%).
Natural Resources, Construction and Maintenance Occupations by Sex
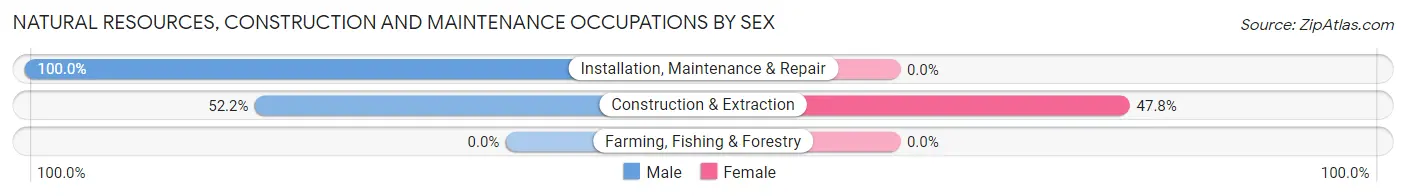
| Occupation | Male | Female |
| Farming, Fishing & Forestry | 0 (0.0%) | 0 (0.0%) |
| Construction & Extraction | 59 (52.2%) | 54 (47.8%) |
| Installation, Maintenance & Repair | 91 (100.0%) | 0 (0.0%) |
| Total (Category) | 150 (73.5%) | 54 (26.5%) |
| Total (Overall) | 922 (47.8%) | 1,006 (52.2%) |
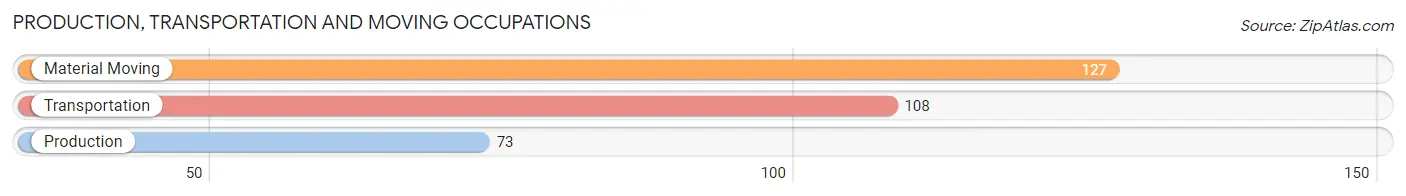
Production, Transportation and Moving Occupations
The most common Production, Transportation and Moving occupations in Honesdale borough are Material Moving (127 | 6.6%), Transportation (108 | 5.6%), and Production (73 | 3.8%).
Production, Transportation and Moving Occupations by Sex
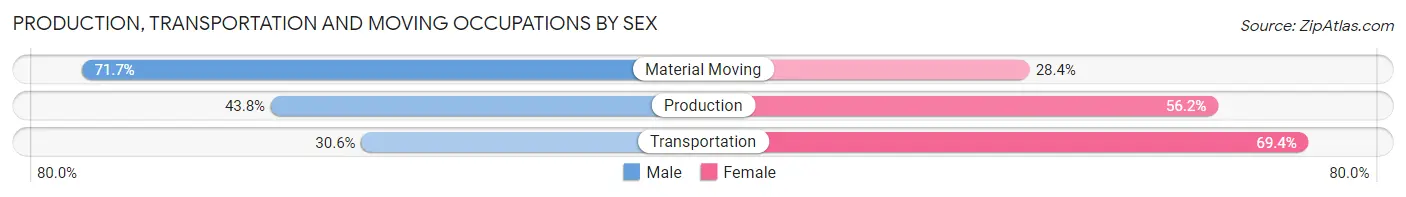
| Occupation | Male | Female |
| Production | 32 (43.8%) | 41 (56.2%) |
| Transportation | 33 (30.6%) | 75 (69.4%) |
| Material Moving | 91 (71.7%) | 36 (28.3%) |
| Total (Category) | 156 (50.6%) | 152 (49.3%) |
| Total (Overall) | 922 (47.8%) | 1,006 (52.2%) |
Employment Industries by Sex in Honesdale borough
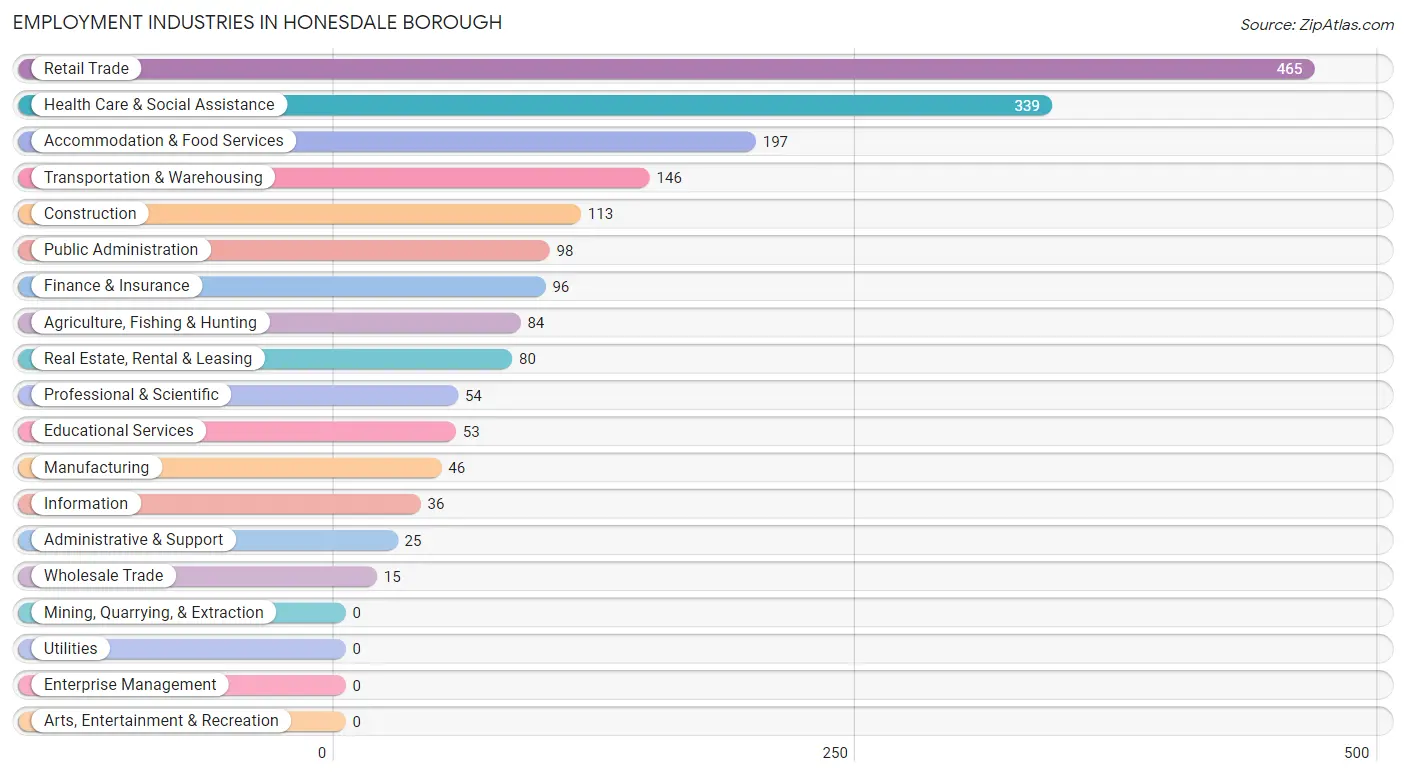
Employment Industries in Honesdale borough
The major employment industries in Honesdale borough include Retail Trade (465 | 24.1%), Health Care & Social Assistance (339 | 17.6%), Accommodation & Food Services (197 | 10.2%), Transportation & Warehousing (146 | 7.6%), and Construction (113 | 5.9%).
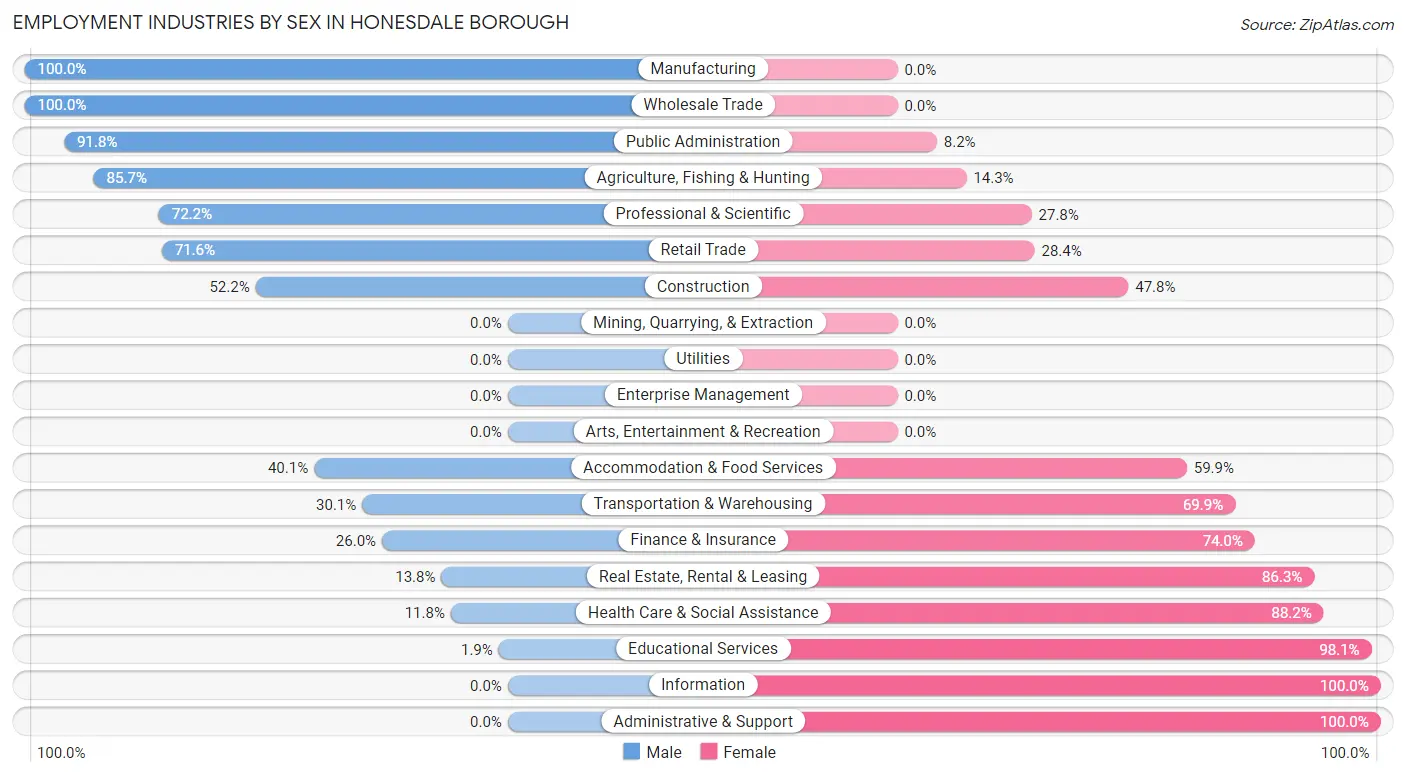
Employment Industries by Sex in Honesdale borough
The Honesdale borough industries that see more men than women are Manufacturing (100.0%), Wholesale Trade (100.0%), and Public Administration (91.8%), whereas the industries that tend to have a higher number of women are Information (100.0%), Administrative & Support (100.0%), and Educational Services (98.1%).
| Industry | Male | Female |
| Agriculture, Fishing & Hunting | 72 (85.7%) | 12 (14.3%) |
| Mining, Quarrying, & Extraction | 0 (0.0%) | 0 (0.0%) |
| Construction | 59 (52.2%) | 54 (47.8%) |
| Manufacturing | 46 (100.0%) | 0 (0.0%) |
| Wholesale Trade | 15 (100.0%) | 0 (0.0%) |
| Retail Trade | 333 (71.6%) | 132 (28.4%) |
| Transportation & Warehousing | 44 (30.1%) | 102 (69.9%) |
| Utilities | 0 (0.0%) | 0 (0.0%) |
| Information | 0 (0.0%) | 36 (100.0%) |
| Finance & Insurance | 25 (26.0%) | 71 (74.0%) |
| Real Estate, Rental & Leasing | 11 (13.8%) | 69 (86.3%) |
| Professional & Scientific | 39 (72.2%) | 15 (27.8%) |
| Enterprise Management | 0 (0.0%) | 0 (0.0%) |
| Administrative & Support | 0 (0.0%) | 25 (100.0%) |
| Educational Services | 1 (1.9%) | 52 (98.1%) |
| Health Care & Social Assistance | 40 (11.8%) | 299 (88.2%) |
| Arts, Entertainment & Recreation | 0 (0.0%) | 0 (0.0%) |
| Accommodation & Food Services | 79 (40.1%) | 118 (59.9%) |
| Public Administration | 90 (91.8%) | 8 (8.2%) |
| Total | 922 (47.8%) | 1,006 (52.2%) |
Education in Honesdale borough
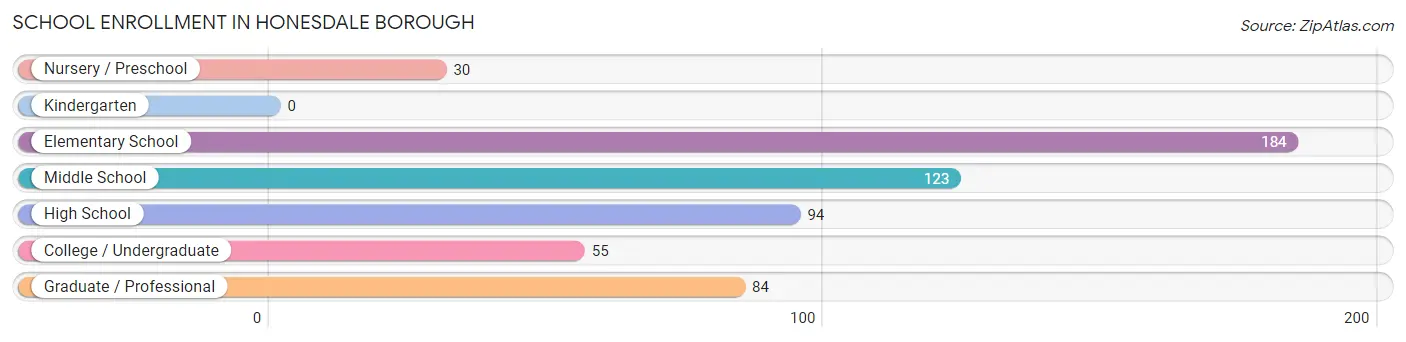
School Enrollment in Honesdale borough
The most common levels of schooling among the 570 students in Honesdale borough are elementary school (184 | 32.3%), middle school (123 | 21.6%), and high school (94 | 16.5%).
| School Level | # Students | % Students |
| Nursery / Preschool | 30 | 5.3% |
| Kindergarten | 0 | 0.0% |
| Elementary School | 184 | 32.3% |
| Middle School | 123 | 21.6% |
| High School | 94 | 16.5% |
| College / Undergraduate | 55 | 9.7% |
| Graduate / Professional | 84 | 14.7% |
| Total | 570 | 100.0% |
School Enrollment by Age by Funding Source in Honesdale borough
Out of a total of 570 students who are enrolled in schools in Honesdale borough, 173 (30.4%) attend a private institution, while the remaining 397 (69.6%) are enrolled in public schools. The age group of 3 to 4 year olds has the highest likelihood of being enrolled in private schools, with 30 (100.0% in the age bracket) enrolled. Conversely, the age group of 10 to 14 year olds has the lowest likelihood of being enrolled in a private school, with 123 (100.0% in the age bracket) attending a public institution.
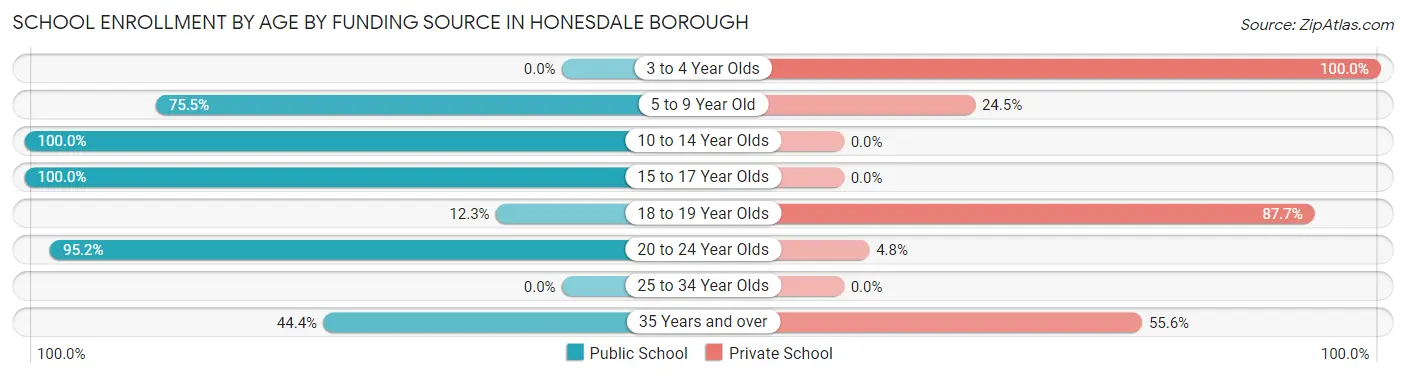
| Age Bracket | Public School | Private School |
| 3 to 4 Year Olds | 0 (0.0%) | 30 (100.0%) |
| 5 to 9 Year Old | 139 (75.5%) | 45 (24.5%) |
| 10 to 14 Year Olds | 123 (100.0%) | 0 (0.0%) |
| 15 to 17 Year Olds | 75 (100.0%) | 0 (0.0%) |
| 18 to 19 Year Olds | 8 (12.3%) | 57 (87.7%) |
| 20 to 24 Year Olds | 20 (95.2%) | 1 (4.8%) |
| 25 to 34 Year Olds | 0 (0.0%) | 0 (0.0%) |
| 35 Years and over | 32 (44.4%) | 40 (55.6%) |
| Total | 397 (69.6%) | 173 (30.4%) |
Educational Attainment by Field of Study in Honesdale borough
Business (171 | 23.0%), education (169 | 22.7%), liberal arts & history (100 | 13.4%), psychology (76 | 10.2%), and computers & mathematics (45 | 6.0%) are the most common fields of study among 745 individuals in Honesdale borough who have obtained a bachelor's degree or higher.
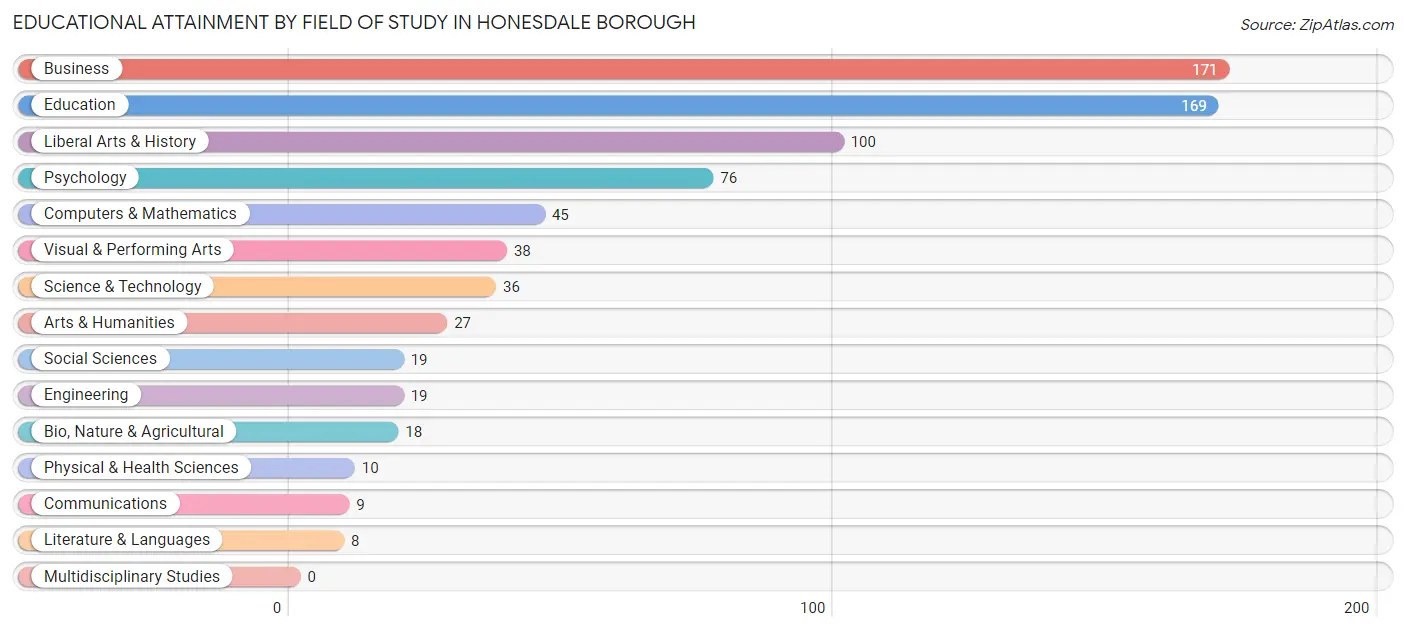
| Field of Study | # Graduates | % Graduates |
| Computers & Mathematics | 45 | 6.0% |
| Bio, Nature & Agricultural | 18 | 2.4% |
| Physical & Health Sciences | 10 | 1.3% |
| Psychology | 76 | 10.2% |
| Social Sciences | 19 | 2.5% |
| Engineering | 19 | 2.5% |
| Multidisciplinary Studies | 0 | 0.0% |
| Science & Technology | 36 | 4.8% |
| Business | 171 | 23.0% |
| Education | 169 | 22.7% |
| Literature & Languages | 8 | 1.1% |
| Liberal Arts & History | 100 | 13.4% |
| Visual & Performing Arts | 38 | 5.1% |
| Communications | 9 | 1.2% |
| Arts & Humanities | 27 | 3.6% |
| Total | 745 | 100.0% |
Transportation & Commute in Honesdale borough
Vehicle Availability by Sex in Honesdale borough
The most prevalent vehicle ownership categories in Honesdale borough are males with 2 vehicles (397, accounting for 43.8%) and females with 2 vehicles (436, making up 39.5%).
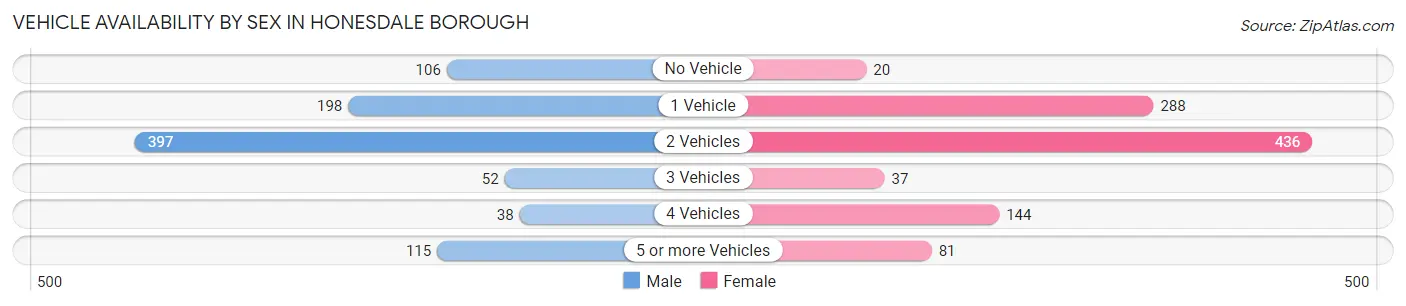
| Vehicles Available | Male | Female |
| No Vehicle | 106 (11.7%) | 20 (2.0%) |
| 1 Vehicle | 198 (21.8%) | 288 (28.6%) |
| 2 Vehicles | 397 (43.8%) | 436 (43.3%) |
| 3 Vehicles | 52 (5.7%) | 37 (3.7%) |
| 4 Vehicles | 38 (4.2%) | 144 (14.3%) |
| 5 or more Vehicles | 115 (12.7%) | 81 (8.1%) |
| Total | 906 (100.0%) | 1,006 (100.0%) |
Commute Time in Honesdale borough
The most frequently occuring commute durations in Honesdale borough are 10 to 14 minutes (490 commuters, 28.6%), 5 to 9 minutes (423 commuters, 24.7%), and 20 to 24 minutes (178 commuters, 10.4%).
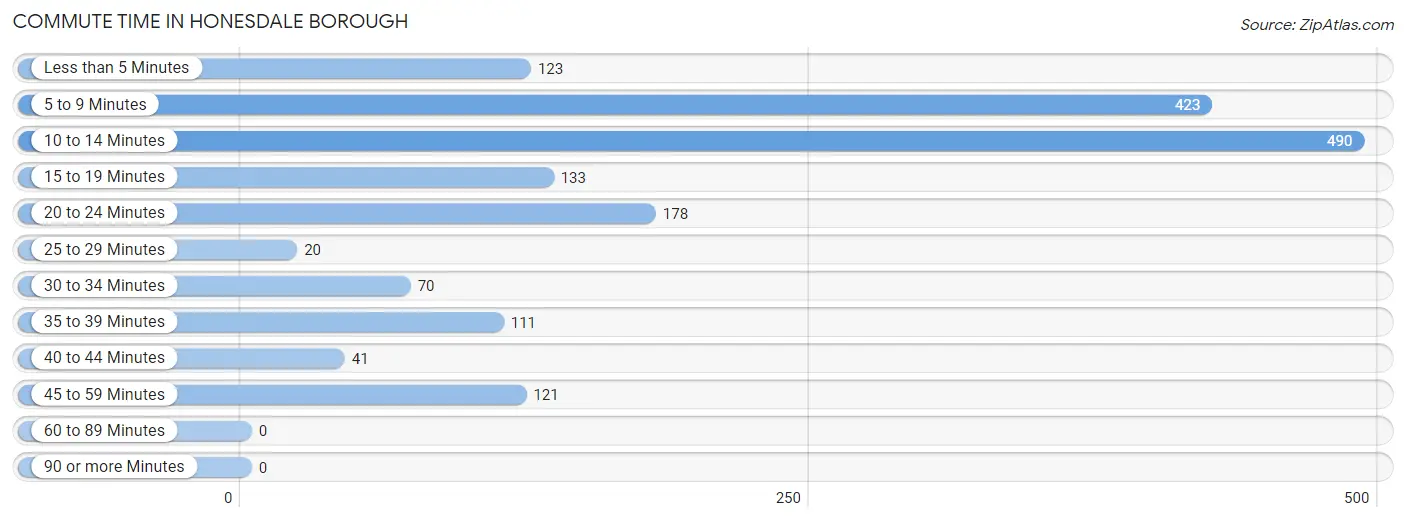
| Commute Time | # Commuters | % Commuters |
| Less than 5 Minutes | 123 | 7.2% |
| 5 to 9 Minutes | 423 | 24.7% |
| 10 to 14 Minutes | 490 | 28.6% |
| 15 to 19 Minutes | 133 | 7.8% |
| 20 to 24 Minutes | 178 | 10.4% |
| 25 to 29 Minutes | 20 | 1.2% |
| 30 to 34 Minutes | 70 | 4.1% |
| 35 to 39 Minutes | 111 | 6.5% |
| 40 to 44 Minutes | 41 | 2.4% |
| 45 to 59 Minutes | 121 | 7.1% |
| 60 to 89 Minutes | 0 | 0.0% |
| 90 or more Minutes | 0 | 0.0% |
Commute Time by Sex in Honesdale borough
The most common commute times in Honesdale borough are 5 to 9 minutes (246 commuters, 30.8%) for males and 10 to 14 minutes (281 commuters, 30.8%) for females.
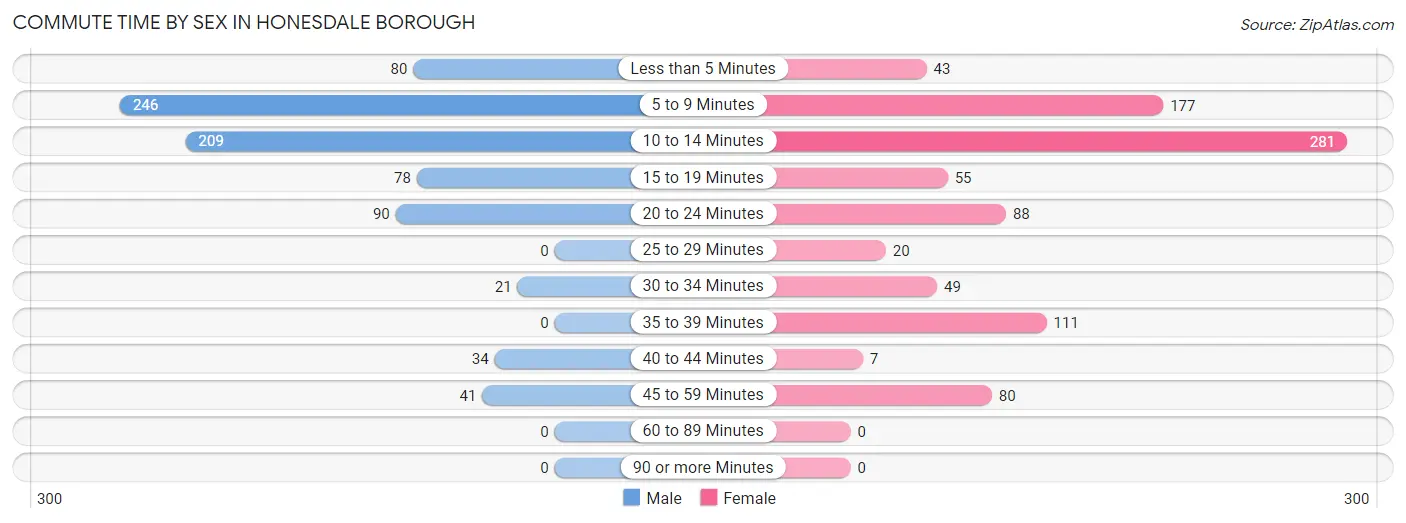
| Commute Time | Male | Female |
| Less than 5 Minutes | 80 (10.0%) | 43 (4.7%) |
| 5 to 9 Minutes | 246 (30.8%) | 177 (19.4%) |
| 10 to 14 Minutes | 209 (26.2%) | 281 (30.8%) |
| 15 to 19 Minutes | 78 (9.8%) | 55 (6.0%) |
| 20 to 24 Minutes | 90 (11.3%) | 88 (9.7%) |
| 25 to 29 Minutes | 0 (0.0%) | 20 (2.2%) |
| 30 to 34 Minutes | 21 (2.6%) | 49 (5.4%) |
| 35 to 39 Minutes | 0 (0.0%) | 111 (12.2%) |
| 40 to 44 Minutes | 34 (4.3%) | 7 (0.8%) |
| 45 to 59 Minutes | 41 (5.1%) | 80 (8.8%) |
| 60 to 89 Minutes | 0 (0.0%) | 0 (0.0%) |
| 90 or more Minutes | 0 (0.0%) | 0 (0.0%) |
Time of Departure to Work by Sex in Honesdale borough
The most frequent times of departure to work in Honesdale borough are 7:00 AM to 7:29 AM (268, 33.5%) for males and 8:00 AM to 8:29 AM (192, 21.1%) for females.
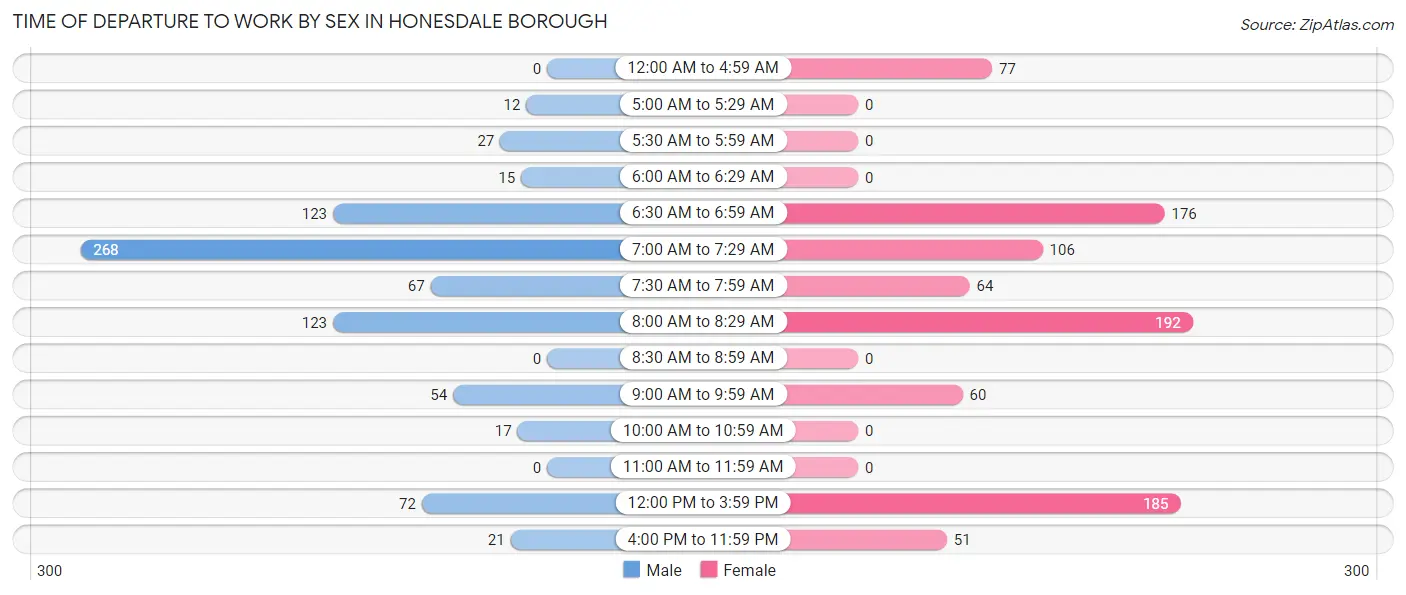
| Time of Departure | Male | Female |
| 12:00 AM to 4:59 AM | 0 (0.0%) | 77 (8.5%) |
| 5:00 AM to 5:29 AM | 12 (1.5%) | 0 (0.0%) |
| 5:30 AM to 5:59 AM | 27 (3.4%) | 0 (0.0%) |
| 6:00 AM to 6:29 AM | 15 (1.9%) | 0 (0.0%) |
| 6:30 AM to 6:59 AM | 123 (15.4%) | 176 (19.3%) |
| 7:00 AM to 7:29 AM | 268 (33.5%) | 106 (11.6%) |
| 7:30 AM to 7:59 AM | 67 (8.4%) | 64 (7.0%) |
| 8:00 AM to 8:29 AM | 123 (15.4%) | 192 (21.1%) |
| 8:30 AM to 8:59 AM | 0 (0.0%) | 0 (0.0%) |
| 9:00 AM to 9:59 AM | 54 (6.8%) | 60 (6.6%) |
| 10:00 AM to 10:59 AM | 17 (2.1%) | 0 (0.0%) |
| 11:00 AM to 11:59 AM | 0 (0.0%) | 0 (0.0%) |
| 12:00 PM to 3:59 PM | 72 (9.0%) | 185 (20.3%) |
| 4:00 PM to 11:59 PM | 21 (2.6%) | 51 (5.6%) |
| Total | 799 (100.0%) | 911 (100.0%) |
Housing Occupancy in Honesdale borough
Occupancy by Ownership in Honesdale borough
Of the total 2,137 dwellings in Honesdale borough, owner-occupied units account for 1,184 (55.4%), while renter-occupied units make up 953 (44.6%).
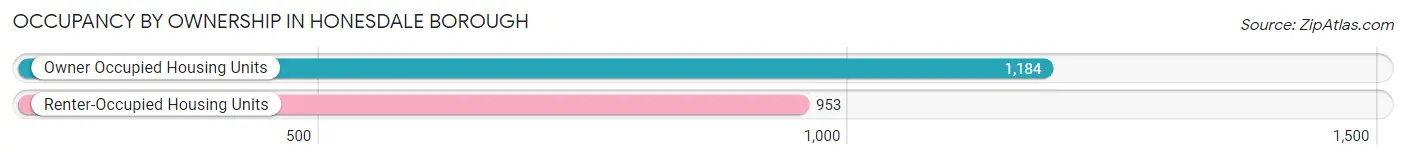
| Occupancy | # Housing Units | % Housing Units |
| Owner Occupied Housing Units | 1,184 | 55.4% |
| Renter-Occupied Housing Units | 953 | 44.6% |
| Total Occupied Housing Units | 2,137 | 100.0% |
Occupancy by Household Size in Honesdale borough
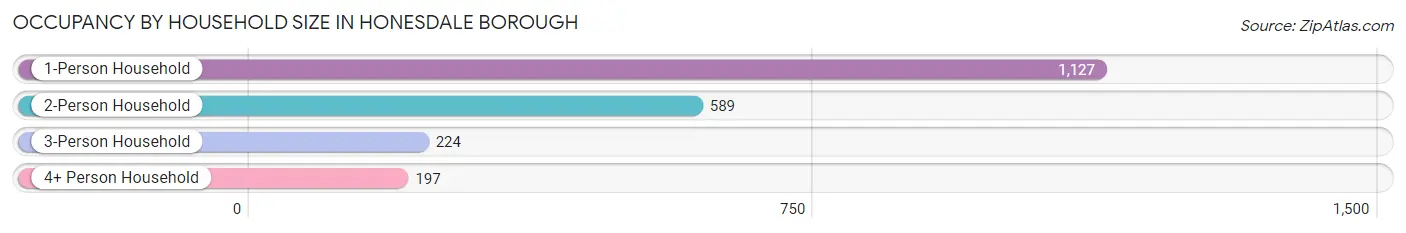
| Household Size | # Housing Units | % Housing Units |
| 1-Person Household | 1,127 | 52.7% |
| 2-Person Household | 589 | 27.6% |
| 3-Person Household | 224 | 10.5% |
| 4+ Person Household | 197 | 9.2% |
| Total Housing Units | 2,137 | 100.0% |
Occupancy by Ownership by Household Size in Honesdale borough
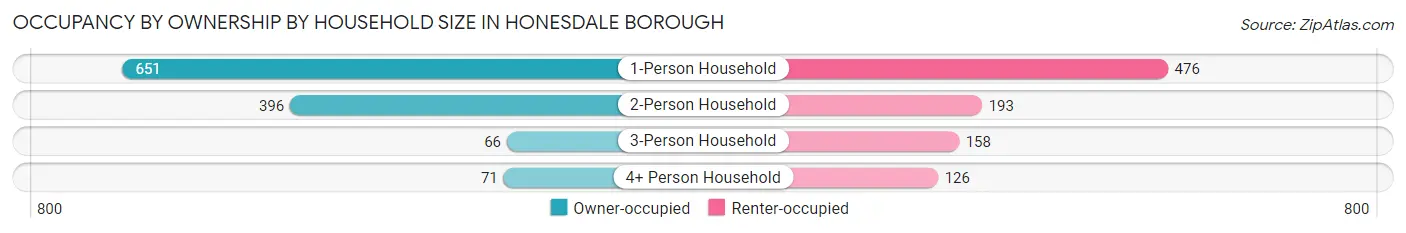
| Household Size | Owner-occupied | Renter-occupied |
| 1-Person Household | 651 (57.8%) | 476 (42.2%) |
| 2-Person Household | 396 (67.2%) | 193 (32.8%) |
| 3-Person Household | 66 (29.5%) | 158 (70.5%) |
| 4+ Person Household | 71 (36.0%) | 126 (64.0%) |
| Total Housing Units | 1,184 (55.4%) | 953 (44.6%) |
Occupancy by Educational Attainment in Honesdale borough
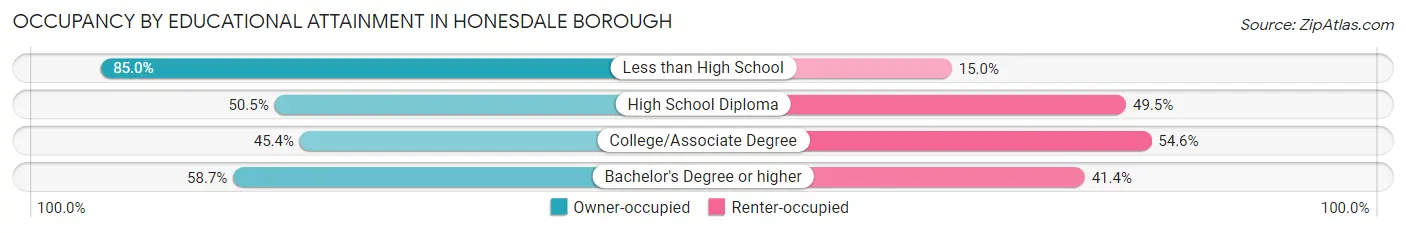
| Household Size | Owner-occupied | Renter-occupied |
| Less than High School | 221 (85.0%) | 39 (15.0%) |
| High School Diploma | 439 (50.5%) | 431 (49.5%) |
| College/Associate Degree | 229 (45.4%) | 275 (54.6%) |
| Bachelor's Degree or higher | 295 (58.7%) | 208 (41.3%) |
Occupancy by Age of Householder in Honesdale borough
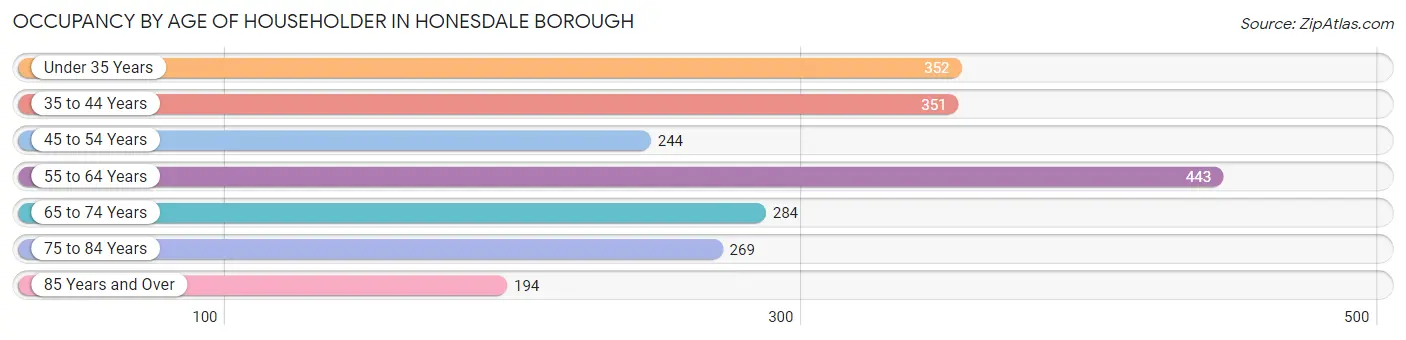
| Age Bracket | # Households | % Households |
| Under 35 Years | 352 | 16.5% |
| 35 to 44 Years | 351 | 16.4% |
| 45 to 54 Years | 244 | 11.4% |
| 55 to 64 Years | 443 | 20.7% |
| 65 to 74 Years | 284 | 13.3% |
| 75 to 84 Years | 269 | 12.6% |
| 85 Years and Over | 194 | 9.1% |
| Total | 2,137 | 100.0% |
Housing Finances in Honesdale borough
Median Income by Occupancy in Honesdale borough
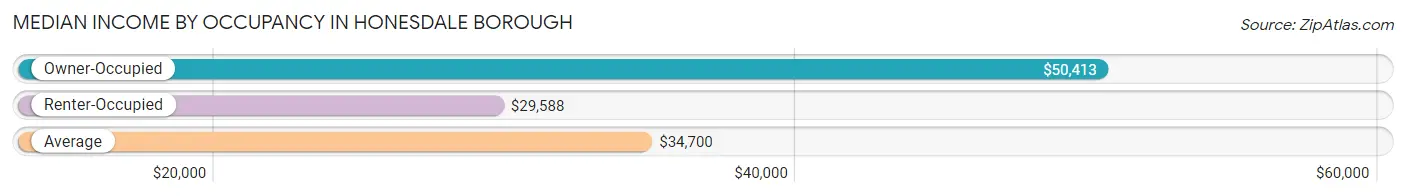
| Occupancy Type | # Households | Median Income |
| Owner-Occupied | 1,184 (55.4%) | $50,413 |
| Renter-Occupied | 953 (44.6%) | $29,588 |
| Average | 2,137 (100.0%) | $34,700 |
Occupancy by Householder Income Bracket in Honesdale borough
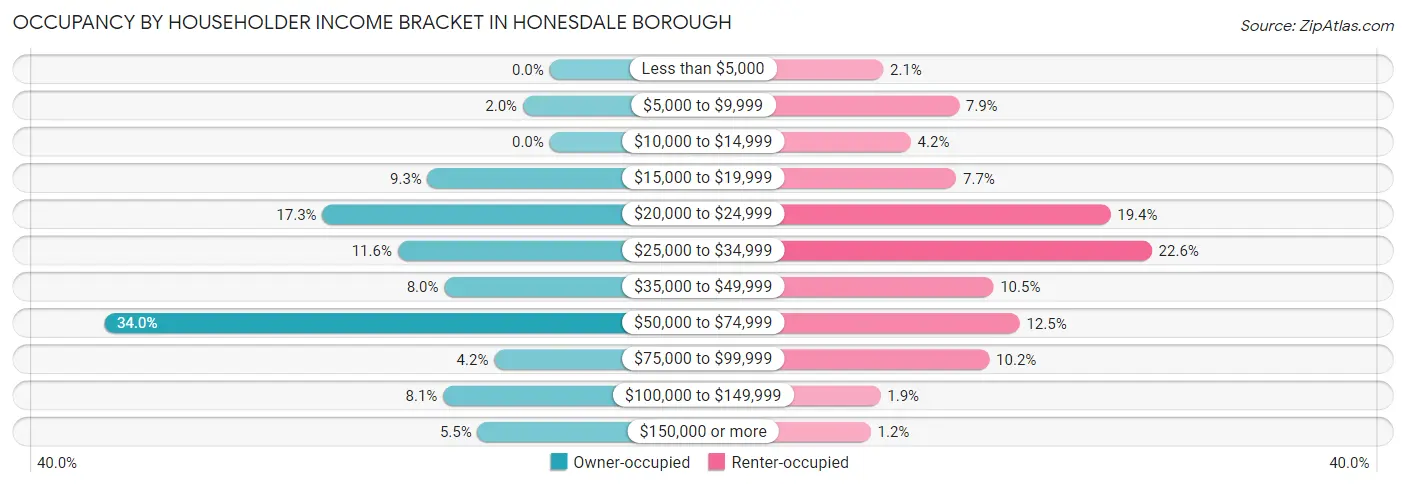
| Income Bracket | Owner-occupied | Renter-occupied |
| Less than $5,000 | 0 (0.0%) | 20 (2.1%) |
| $5,000 to $9,999 | 24 (2.0%) | 75 (7.9%) |
| $10,000 to $14,999 | 0 (0.0%) | 40 (4.2%) |
| $15,000 to $19,999 | 110 (9.3%) | 73 (7.7%) |
| $20,000 to $24,999 | 205 (17.3%) | 185 (19.4%) |
| $25,000 to $34,999 | 137 (11.6%) | 215 (22.6%) |
| $35,000 to $49,999 | 95 (8.0%) | 100 (10.5%) |
| $50,000 to $74,999 | 402 (34.0%) | 119 (12.5%) |
| $75,000 to $99,999 | 50 (4.2%) | 97 (10.2%) |
| $100,000 to $149,999 | 96 (8.1%) | 18 (1.9%) |
| $150,000 or more | 65 (5.5%) | 11 (1.1%) |
| Total | 1,184 (100.0%) | 953 (100.0%) |
Monthly Housing Cost Tiers in Honesdale borough
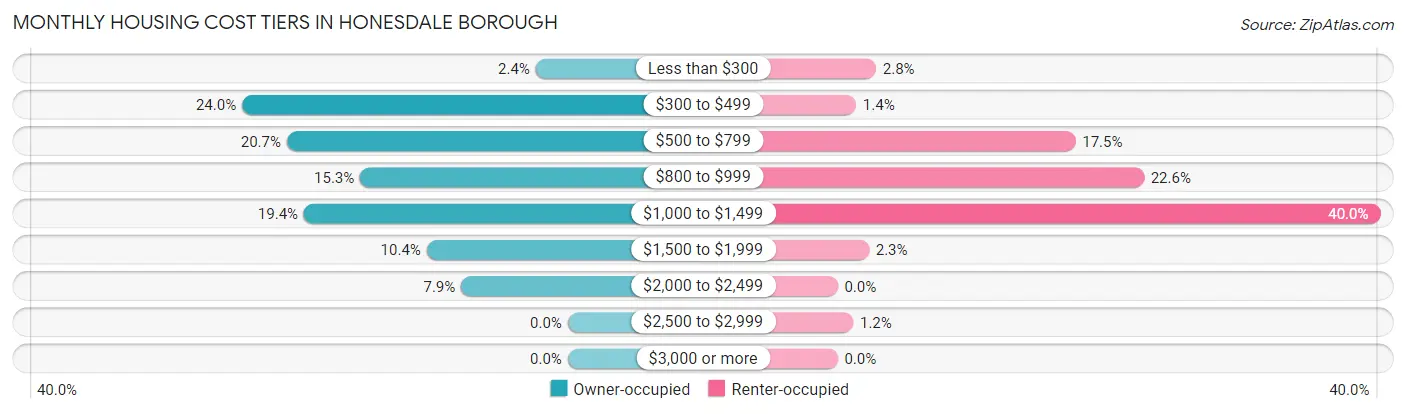
| Monthly Cost | Owner-occupied | Renter-occupied |
| Less than $300 | 28 (2.4%) | 27 (2.8%) |
| $300 to $499 | 284 (24.0%) | 13 (1.4%) |
| $500 to $799 | 245 (20.7%) | 167 (17.5%) |
| $800 to $999 | 181 (15.3%) | 215 (22.6%) |
| $1,000 to $1,499 | 230 (19.4%) | 381 (40.0%) |
| $1,500 to $1,999 | 123 (10.4%) | 22 (2.3%) |
| $2,000 to $2,499 | 93 (7.9%) | 0 (0.0%) |
| $2,500 to $2,999 | 0 (0.0%) | 11 (1.1%) |
| $3,000 or more | 0 (0.0%) | 0 (0.0%) |
| Total | 1,184 (100.0%) | 953 (100.0%) |
Physical Housing Characteristics in Honesdale borough
Housing Structures in Honesdale borough
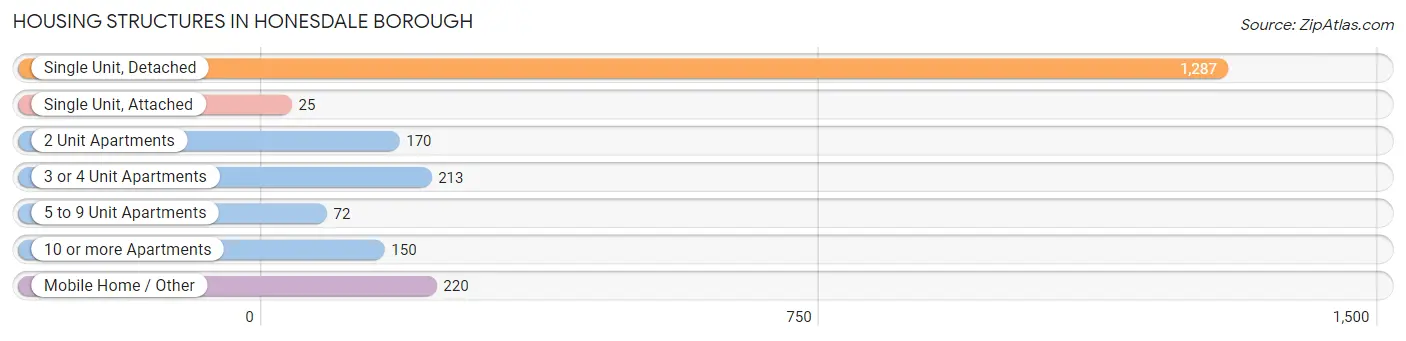
| Structure Type | # Housing Units | % Housing Units |
| Single Unit, Detached | 1,287 | 60.2% |
| Single Unit, Attached | 25 | 1.2% |
| 2 Unit Apartments | 170 | 8.0% |
| 3 or 4 Unit Apartments | 213 | 10.0% |
| 5 to 9 Unit Apartments | 72 | 3.4% |
| 10 or more Apartments | 150 | 7.0% |
| Mobile Home / Other | 220 | 10.3% |
| Total | 2,137 | 100.0% |
Housing Structures by Occupancy in Honesdale borough
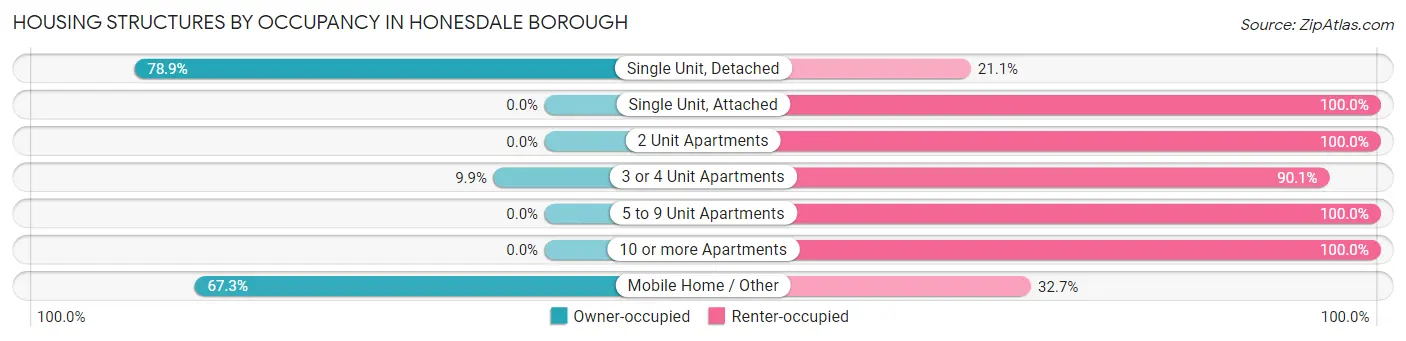
| Structure Type | Owner-occupied | Renter-occupied |
| Single Unit, Detached | 1,015 (78.9%) | 272 (21.1%) |
| Single Unit, Attached | 0 (0.0%) | 25 (100.0%) |
| 2 Unit Apartments | 0 (0.0%) | 170 (100.0%) |
| 3 or 4 Unit Apartments | 21 (9.9%) | 192 (90.1%) |
| 5 to 9 Unit Apartments | 0 (0.0%) | 72 (100.0%) |
| 10 or more Apartments | 0 (0.0%) | 150 (100.0%) |
| Mobile Home / Other | 148 (67.3%) | 72 (32.7%) |
| Total | 1,184 (55.4%) | 953 (44.6%) |
Housing Structures by Number of Rooms in Honesdale borough
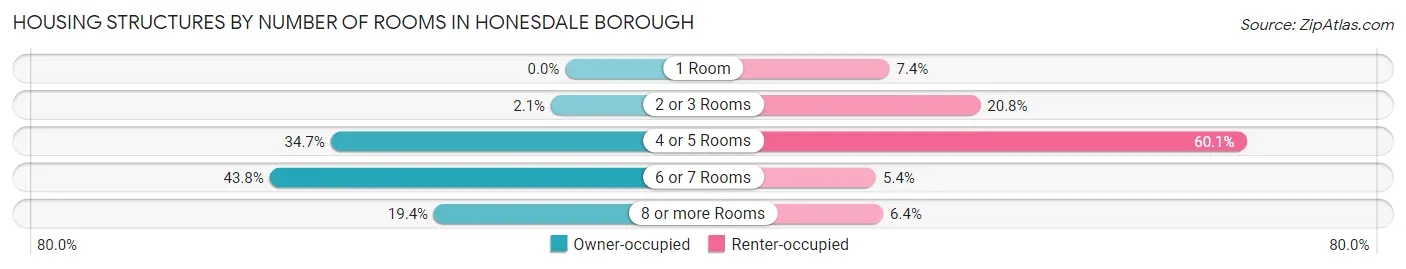
| Number of Rooms | Owner-occupied | Renter-occupied |
| 1 Room | 0 (0.0%) | 70 (7.3%) |
| 2 or 3 Rooms | 25 (2.1%) | 198 (20.8%) |
| 4 or 5 Rooms | 411 (34.7%) | 573 (60.1%) |
| 6 or 7 Rooms | 518 (43.8%) | 51 (5.3%) |
| 8 or more Rooms | 230 (19.4%) | 61 (6.4%) |
| Total | 1,184 (100.0%) | 953 (100.0%) |
Housing Structure by Heating Type in Honesdale borough
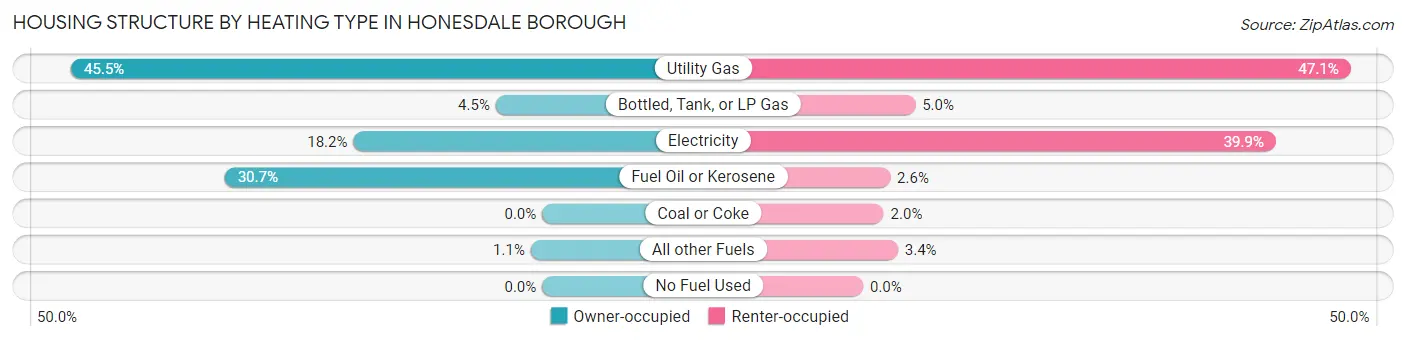
| Heating Type | Owner-occupied | Renter-occupied |
| Utility Gas | 539 (45.5%) | 449 (47.1%) |
| Bottled, Tank, or LP Gas | 53 (4.5%) | 48 (5.0%) |
| Electricity | 216 (18.2%) | 380 (39.9%) |
| Fuel Oil or Kerosene | 363 (30.7%) | 25 (2.6%) |
| Coal or Coke | 0 (0.0%) | 19 (2.0%) |
| All other Fuels | 13 (1.1%) | 32 (3.4%) |
| No Fuel Used | 0 (0.0%) | 0 (0.0%) |
| Total | 1,184 (100.0%) | 953 (100.0%) |
Household Vehicle Usage in Honesdale borough
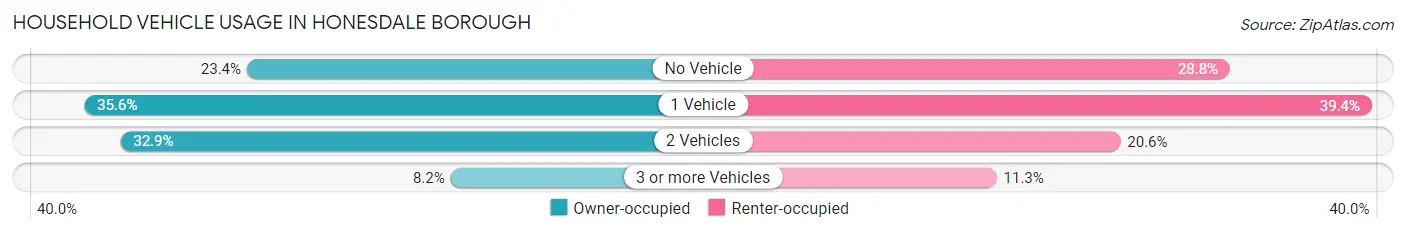
| Vehicles per Household | Owner-occupied | Renter-occupied |
| No Vehicle | 277 (23.4%) | 274 (28.7%) |
| 1 Vehicle | 421 (35.6%) | 375 (39.4%) |
| 2 Vehicles | 389 (32.9%) | 196 (20.6%) |
| 3 or more Vehicles | 97 (8.2%) | 108 (11.3%) |
| Total | 1,184 (100.0%) | 953 (100.0%) |
Real Estate & Mortgages in Honesdale borough
Real Estate and Mortgage Overview in Honesdale borough
| Characteristic | Without Mortgage | With Mortgage |
| Housing Units | 602 | 582 |
| Median Property Value | $141,400 | $146,500 |
| Median Household Income | $27,381 | $46 |
| Monthly Housing Costs | $495 | $0 |
| Real Estate Taxes | $1,345 | $55 |
Property Value by Mortgage Status in Honesdale borough
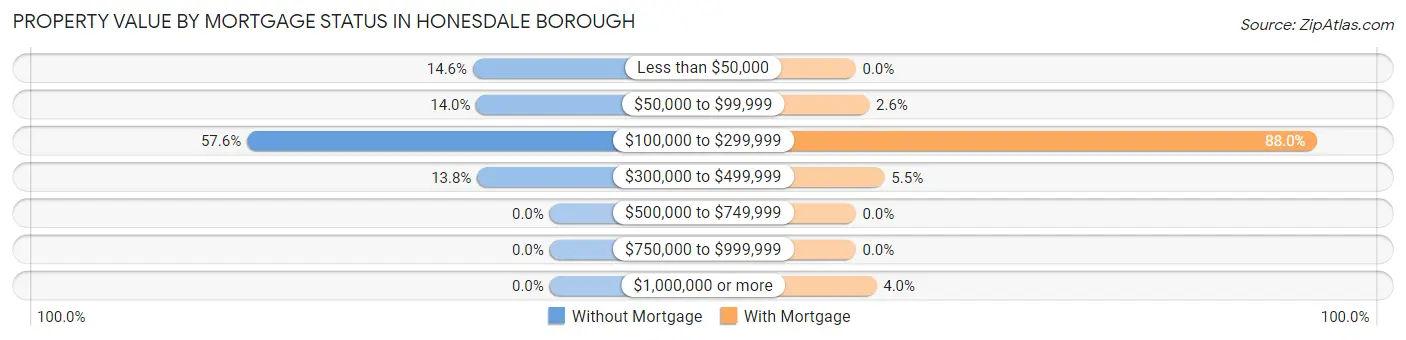
| Property Value | Without Mortgage | With Mortgage |
| Less than $50,000 | 88 (14.6%) | 0 (0.0%) |
| $50,000 to $99,999 | 84 (14.0%) | 15 (2.6%) |
| $100,000 to $299,999 | 347 (57.6%) | 512 (88.0%) |
| $300,000 to $499,999 | 83 (13.8%) | 32 (5.5%) |
| $500,000 to $749,999 | 0 (0.0%) | 0 (0.0%) |
| $750,000 to $999,999 | 0 (0.0%) | 0 (0.0%) |
| $1,000,000 or more | 0 (0.0%) | 23 (4.0%) |
| Total | 602 (100.0%) | 582 (100.0%) |
Household Income by Mortgage Status in Honesdale borough
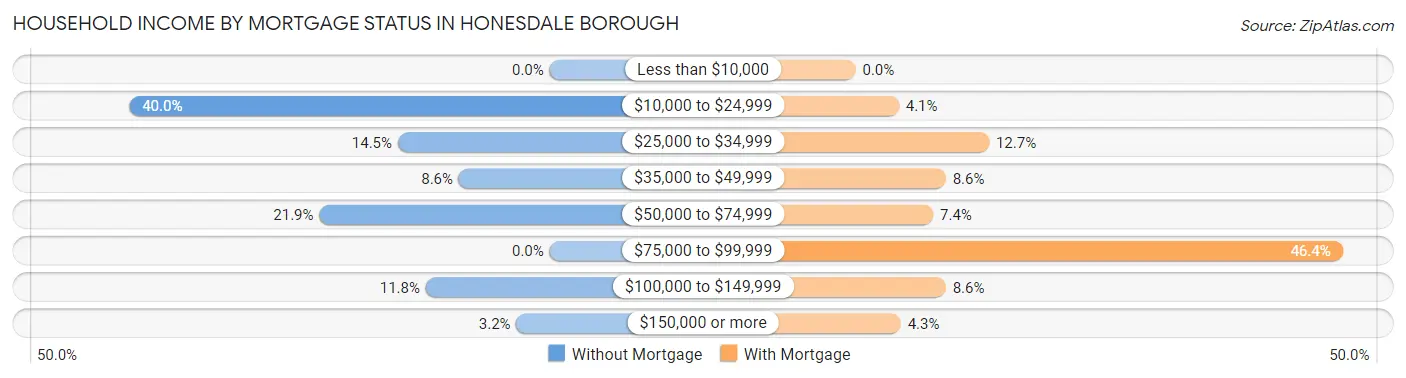
| Household Income | Without Mortgage | With Mortgage |
| Less than $10,000 | 0 (0.0%) | 0 (0.0%) |
| $10,000 to $24,999 | 241 (40.0%) | 24 (4.1%) |
| $25,000 to $34,999 | 87 (14.4%) | 74 (12.7%) |
| $35,000 to $49,999 | 52 (8.6%) | 50 (8.6%) |
| $50,000 to $74,999 | 132 (21.9%) | 43 (7.4%) |
| $75,000 to $99,999 | 0 (0.0%) | 270 (46.4%) |
| $100,000 to $149,999 | 71 (11.8%) | 50 (8.6%) |
| $150,000 or more | 19 (3.2%) | 25 (4.3%) |
| Total | 602 (100.0%) | 582 (100.0%) |
Property Value to Household Income Ratio in Honesdale borough
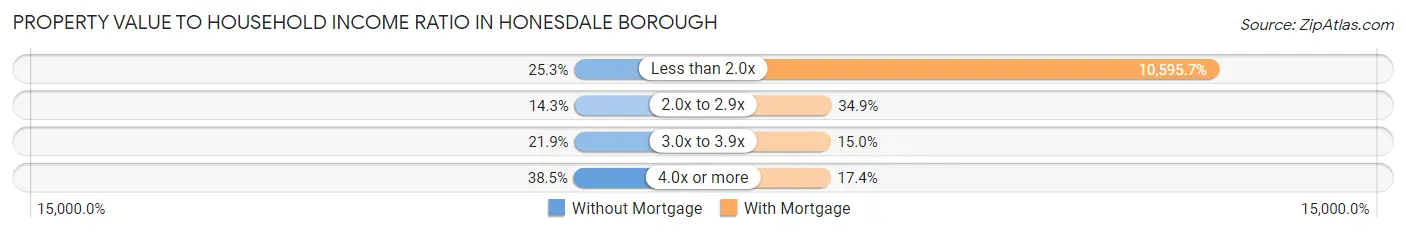
| Value-to-Income Ratio | Without Mortgage | With Mortgage |
| Less than 2.0x | 152 (25.3%) | 61,667 (10,595.7%) |
| 2.0x to 2.9x | 86 (14.3%) | 203 (34.9%) |
| 3.0x to 3.9x | 132 (21.9%) | 87 (14.9%) |
| 4.0x or more | 232 (38.5%) | 101 (17.3%) |
| Total | 602 (100.0%) | 582 (100.0%) |
Real Estate Taxes by Mortgage Status in Honesdale borough
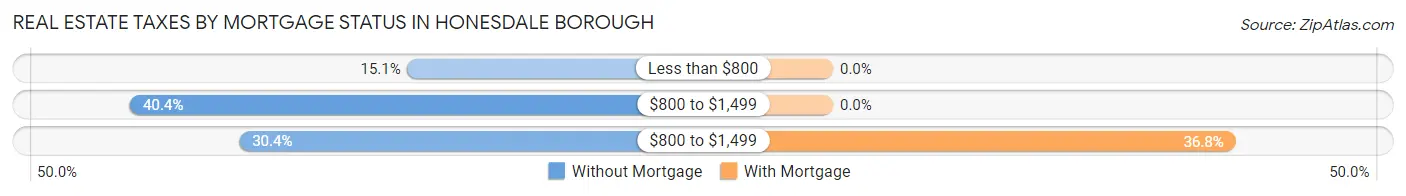
| Property Taxes | Without Mortgage | With Mortgage |
| Less than $800 | 91 (15.1%) | 0 (0.0%) |
| $800 to $1,499 | 243 (40.4%) | 0 (0.0%) |
| $800 to $1,499 | 183 (30.4%) | 214 (36.8%) |
| Total | 602 (100.0%) | 582 (100.0%) |
Health & Disability in Honesdale borough
Health Insurance Coverage by Age in Honesdale borough
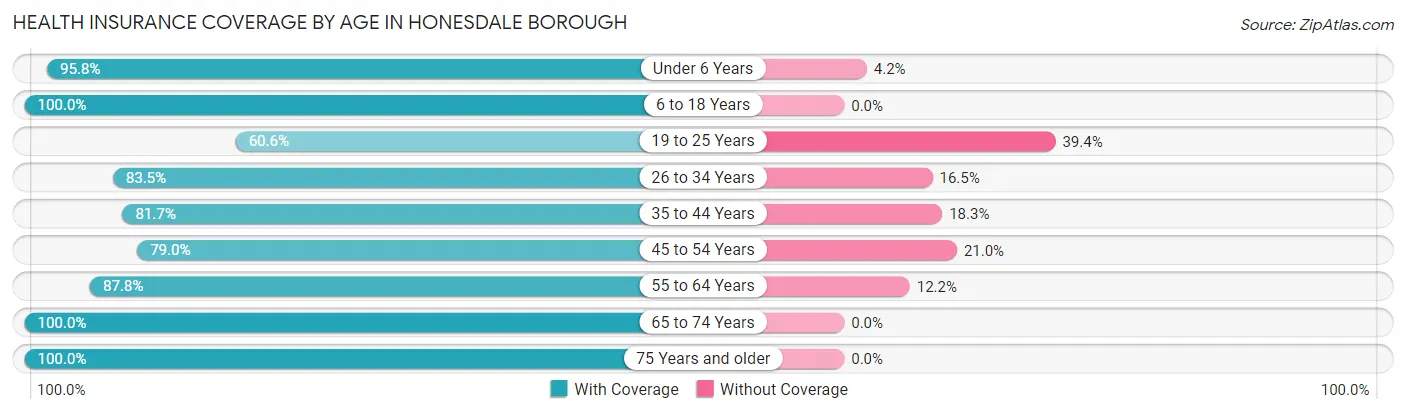
| Age Bracket | With Coverage | Without Coverage |
| Under 6 Years | 137 (95.8%) | 6 (4.2%) |
| 6 to 18 Years | 549 (100.0%) | 0 (0.0%) |
| 19 to 25 Years | 331 (60.6%) | 215 (39.4%) |
| 26 to 34 Years | 411 (83.5%) | 81 (16.5%) |
| 35 to 44 Years | 546 (81.7%) | 122 (18.3%) |
| 45 to 54 Years | 282 (79.0%) | 75 (21.0%) |
| 55 to 64 Years | 683 (87.8%) | 95 (12.2%) |
| 65 to 74 Years | 374 (100.0%) | 0 (0.0%) |
| 75 Years and older | 562 (100.0%) | 0 (0.0%) |
| Total | 3,875 (86.7%) | 594 (13.3%) |
Health Insurance Coverage by Citizenship Status in Honesdale borough
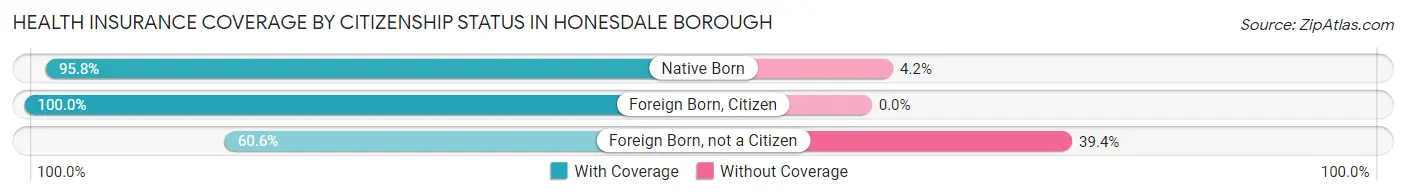
| Citizenship Status | With Coverage | Without Coverage |
| Native Born | 137 (95.8%) | 6 (4.2%) |
| Foreign Born, Citizen | 549 (100.0%) | 0 (0.0%) |
| Foreign Born, not a Citizen | 331 (60.6%) | 215 (39.4%) |
Health Insurance Coverage by Household Income in Honesdale borough
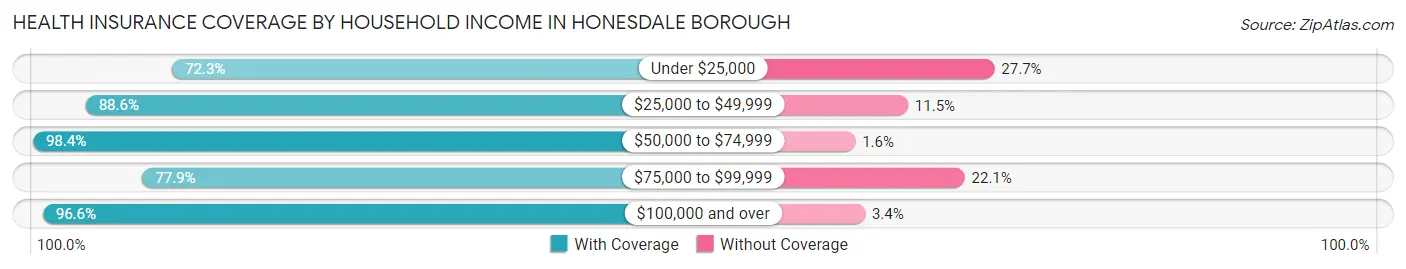
| Household Income | With Coverage | Without Coverage |
| Under $25,000 | 756 (72.3%) | 289 (27.7%) |
| $25,000 to $49,999 | 928 (88.5%) | 120 (11.5%) |
| $50,000 to $74,999 | 994 (98.4%) | 16 (1.6%) |
| $75,000 to $99,999 | 512 (77.9%) | 145 (22.1%) |
| $100,000 and over | 680 (96.6%) | 24 (3.4%) |
Public vs Private Health Insurance Coverage by Age in Honesdale borough
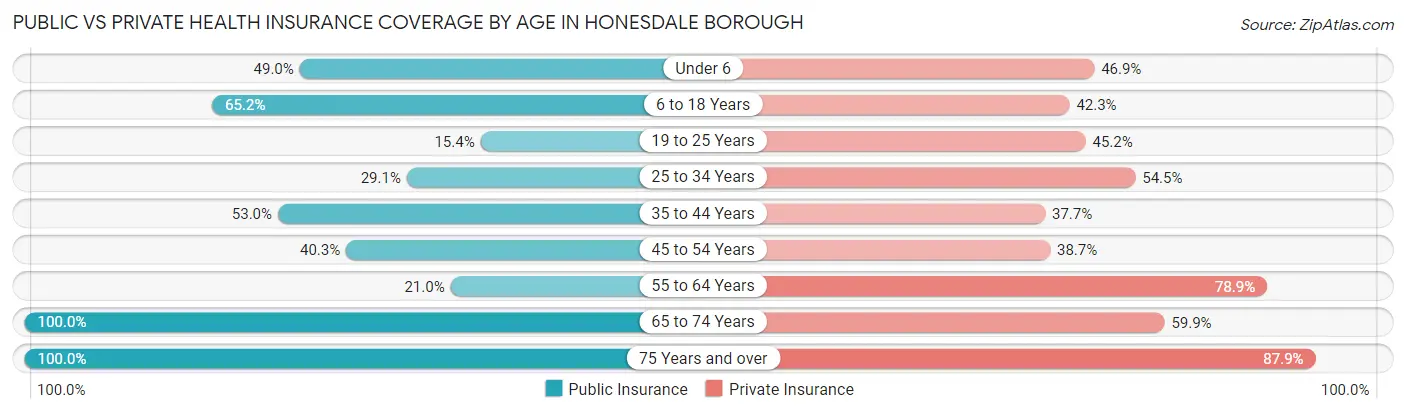
| Age Bracket | Public Insurance | Private Insurance |
| Under 6 | 70 (48.9%) | 67 (46.9%) |
| 6 to 18 Years | 358 (65.2%) | 232 (42.3%) |
| 19 to 25 Years | 84 (15.4%) | 247 (45.2%) |
| 25 to 34 Years | 143 (29.1%) | 268 (54.5%) |
| 35 to 44 Years | 354 (53.0%) | 252 (37.7%) |
| 45 to 54 Years | 144 (40.3%) | 138 (38.7%) |
| 55 to 64 Years | 163 (20.9%) | 614 (78.9%) |
| 65 to 74 Years | 374 (100.0%) | 224 (59.9%) |
| 75 Years and over | 562 (100.0%) | 494 (87.9%) |
| Total | 2,252 (50.4%) | 2,536 (56.8%) |
Disability Status by Sex by Age in Honesdale borough
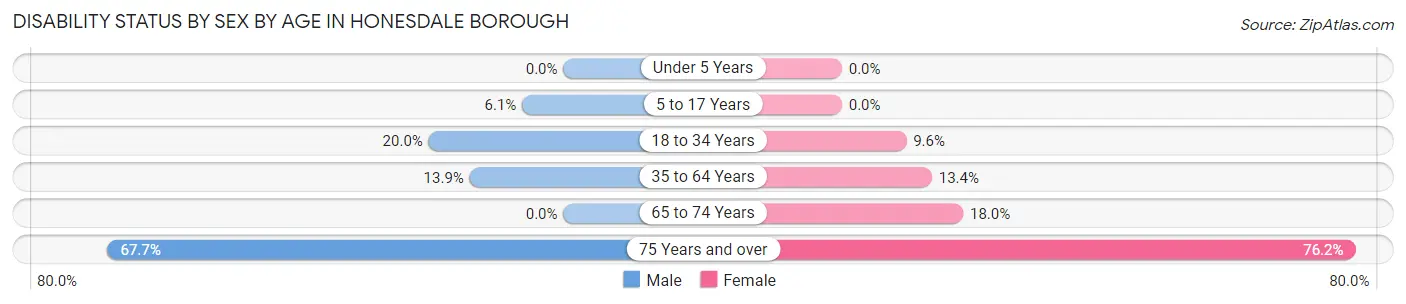
| Age Bracket | Male | Female |
| Under 5 Years | 0 (0.0%) | 0 (0.0%) |
| 5 to 17 Years | 16 (6.1%) | 0 (0.0%) |
| 18 to 34 Years | 97 (20.0%) | 59 (9.6%) |
| 35 to 64 Years | 127 (13.9%) | 119 (13.4%) |
| 65 to 74 Years | 0 (0.0%) | 27 (18.0%) |
| 75 Years and over | 67 (67.7%) | 353 (76.2%) |
Disability Class by Sex by Age in Honesdale borough
Disability Class: Hearing Difficulty
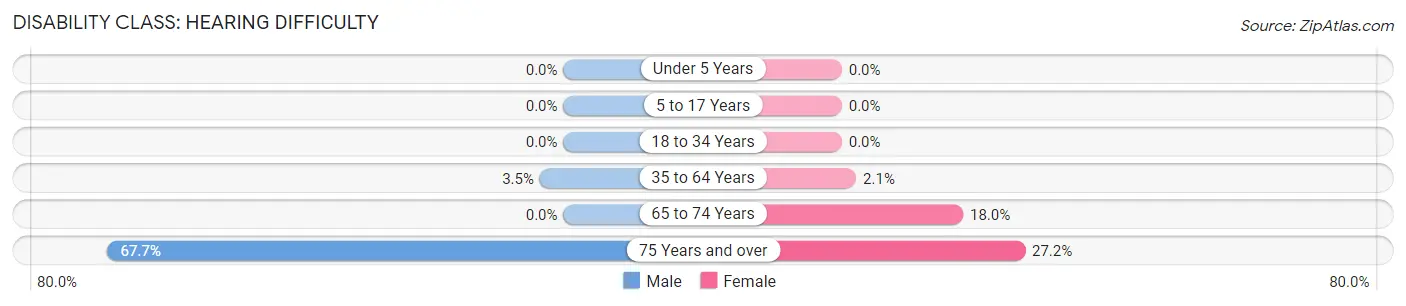
| Age Bracket | Male | Female |
| Under 5 Years | 0 (0.0%) | 0 (0.0%) |
| 5 to 17 Years | 0 (0.0%) | 0 (0.0%) |
| 18 to 34 Years | 0 (0.0%) | 0 (0.0%) |
| 35 to 64 Years | 32 (3.5%) | 19 (2.1%) |
| 65 to 74 Years | 0 (0.0%) | 27 (18.0%) |
| 75 Years and over | 67 (67.7%) | 126 (27.2%) |
Disability Class: Vision Difficulty
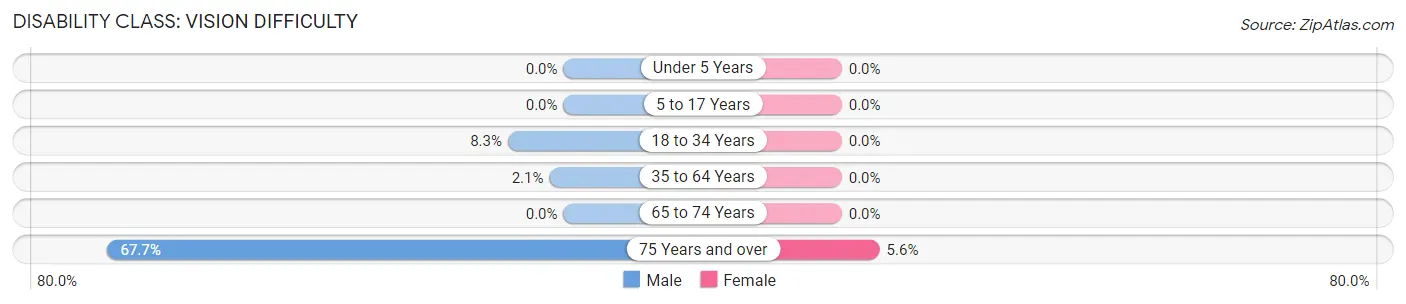
| Age Bracket | Male | Female |
| Under 5 Years | 0 (0.0%) | 0 (0.0%) |
| 5 to 17 Years | 0 (0.0%) | 0 (0.0%) |
| 18 to 34 Years | 40 (8.3%) | 0 (0.0%) |
| 35 to 64 Years | 19 (2.1%) | 0 (0.0%) |
| 65 to 74 Years | 0 (0.0%) | 0 (0.0%) |
| 75 Years and over | 67 (67.7%) | 26 (5.6%) |
Disability Class: Cognitive Difficulty
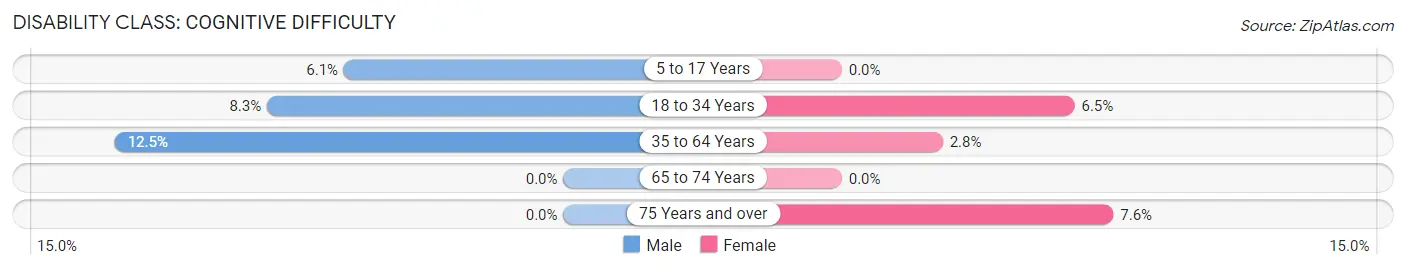
| Age Bracket | Male | Female |
| 5 to 17 Years | 16 (6.1%) | 0 (0.0%) |
| 18 to 34 Years | 40 (8.3%) | 40 (6.5%) |
| 35 to 64 Years | 114 (12.5%) | 25 (2.8%) |
| 65 to 74 Years | 0 (0.0%) | 0 (0.0%) |
| 75 Years and over | 0 (0.0%) | 35 (7.6%) |
Disability Class: Ambulatory Difficulty
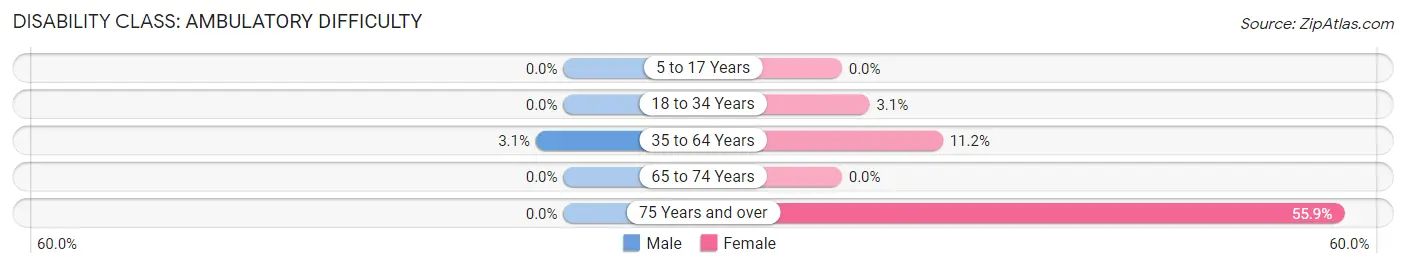
| Age Bracket | Male | Female |
| 5 to 17 Years | 0 (0.0%) | 0 (0.0%) |
| 18 to 34 Years | 0 (0.0%) | 19 (3.1%) |
| 35 to 64 Years | 28 (3.1%) | 100 (11.2%) |
| 65 to 74 Years | 0 (0.0%) | 0 (0.0%) |
| 75 Years and over | 0 (0.0%) | 259 (55.9%) |
Disability Class: Self-Care Difficulty
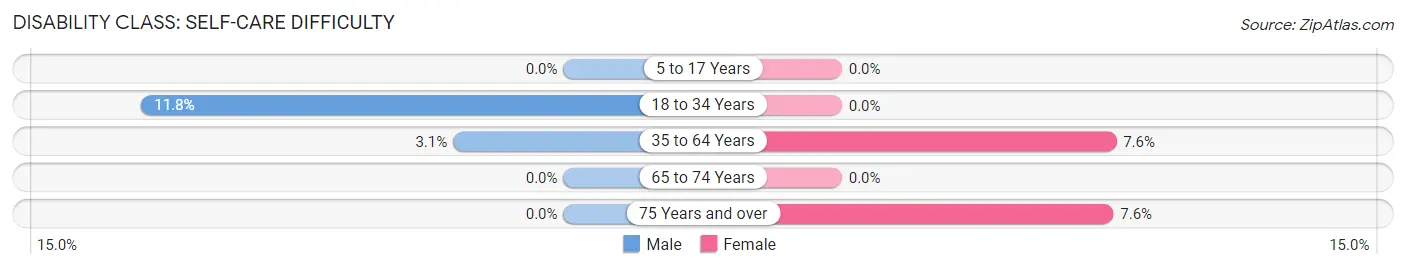
| Age Bracket | Male | Female |
| 5 to 17 Years | 0 (0.0%) | 0 (0.0%) |
| 18 to 34 Years | 57 (11.7%) | 0 (0.0%) |
| 35 to 64 Years | 28 (3.1%) | 68 (7.6%) |
| 65 to 74 Years | 0 (0.0%) | 0 (0.0%) |
| 75 Years and over | 0 (0.0%) | 35 (7.6%) |
Technology Access in Honesdale borough
Computing Device Access in Honesdale borough
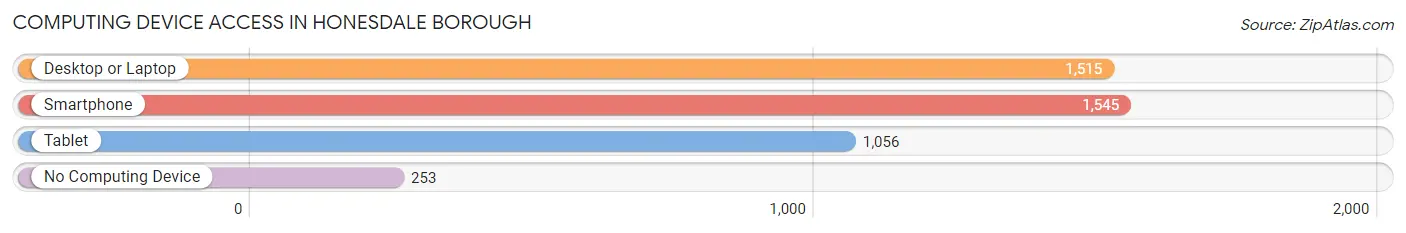
| Device Type | # Households | % Households |
| Desktop or Laptop | 1,515 | 70.9% |
| Smartphone | 1,545 | 72.3% |
| Tablet | 1,056 | 49.4% |
| No Computing Device | 253 | 11.8% |
| Total | 2,137 | 100.0% |
Internet Access in Honesdale borough
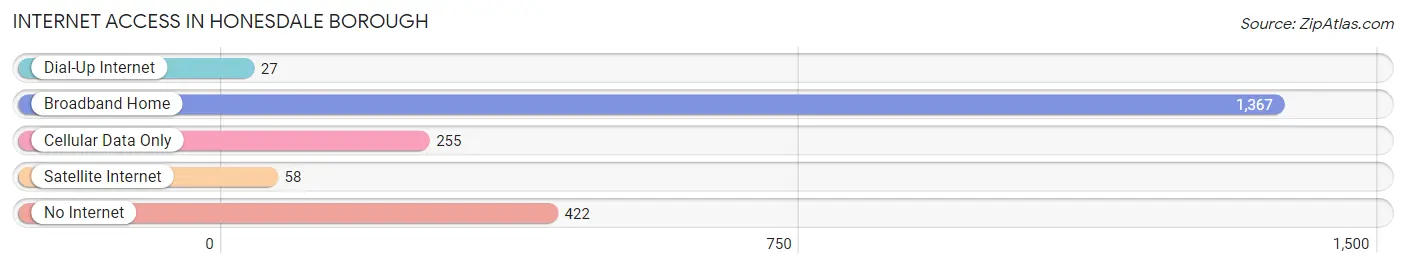
| Internet Type | # Households | % Households |
| Dial-Up Internet | 27 | 1.3% |
| Broadband Home | 1,367 | 64.0% |
| Cellular Data Only | 255 | 11.9% |
| Satellite Internet | 58 | 2.7% |
| No Internet | 422 | 19.8% |
| Total | 2,137 | 100.0% |
Honesdale borough Summary
Honesdale Borough is a borough located in Wayne County, Pennsylvania. It is situated in the northeastern corner of the state, approximately 90 miles northwest of New York City. The borough is situated in the Pocono Mountains and is the county seat of Wayne County. The population of Honesdale Borough was 4,480 at the 2010 census.
History
Honesdale Borough was founded in 1826 by Philip Hone, a prominent New York City banker and entrepreneur. Hone purchased the land from the local Native American tribes and named the area after himself. The town was incorporated in 1831 and quickly became a major hub for the coal and lumber industries. The Delaware and Hudson Canal was built in 1828 to transport coal from the mines in Carbondale to the Hudson River. The canal was a major success and helped to spur the growth of the town.
The Stourbridge Lion, the first locomotive to run in the United States, was tested on the Delaware and Hudson Canal in 1829. The locomotive was built in England and shipped to Honesdale for the test run. The success of the test run helped to spur the development of the railroad industry in the United States.
The town was also home to the first commercial steam-powered sawmill in the United States. The mill was built in 1829 and was powered by the steam engine from the Stourbridge Lion. The mill was a major success and helped to spur the growth of the lumber industry in the area.
Geography
Honesdale Borough is located at 41°31'N 75°14'W (41.5167, -75.2333). According to the United States Census Bureau, the borough has a total area of 1.2 square miles (3.1 km2), all of it land.
The borough is situated in the Pocono Mountains and is surrounded by the Lackawaxen River to the north, the Dyberry Creek to the east, and the Wallenpaupack Creek to the south. The borough is located approximately 90 miles northwest of New York City and is accessible via Interstate 84 and U.S. Route 6.
Economy
Honesdale Borough is a small rural community with a population of 4,480 as of the 2010 census. The borough is home to a variety of small businesses, including restaurants, retail stores, and professional services. The borough is also home to a number of manufacturing companies, including a paper mill, a plastics factory, and a metal fabrication plant.
The borough is also home to a number of tourist attractions, including the Stourbridge Lion Monument, the Wayne County Historical Society Museum, and the Honesdale National Bank. The borough is also home to a number of outdoor recreation areas, including the Lackawaxen River, the Dyberry Creek, and the Wallenpaupack Creek.
Demographics
As of the 2010 census, the population of Honesdale Borough was 4,480. The racial makeup of the borough was 97.2% White, 0.7% African American, 0.2% Native American, 0.4% Asian, 0.1% Pacific Islander, 0.4% from other races, and 1.0% from two or more races. Hispanic or Latino of any race were 1.7% of the population.
The median income for a household in the borough was $41,944, and the median income for a family was $50,938. The per capita income for the borough was $20,945. About 8.2% of families and 10.3% of the population were below the poverty line, including 14.2% of those under age 18 and 6.2% of those age 65 or over.
Common Questions
What is Per Capita Income in Honesdale borough?
Per Capita income in Honesdale borough is $24,910.
What is the Median Family Income in Honesdale borough?
Median Family Income in Honesdale borough is $59,518.
What is the Median Household income in Honesdale borough?
Median Household Income in Honesdale borough is $34,700.
What is Income or Wage Gap in Honesdale borough?
Income or Wage Gap in Honesdale borough is 15.4%.
Women in Honesdale borough earn 84.6 cents for every dollar earned by a man.
What is Inequality or Gini Index in Honesdale borough?
Inequality or Gini Index in Honesdale borough is 0.39.
What is the Total Population of Honesdale borough?
Total Population of Honesdale borough is 4,469.
What is the Total Male Population of Honesdale borough?
Total Male Population of Honesdale borough is 2,083.
What is the Total Female Population of Honesdale borough?
Total Female Population of Honesdale borough is 2,386.
What is the Ratio of Males per 100 Females in Honesdale borough?
There are 87.30 Males per 100 Females in Honesdale borough.
What is the Ratio of Females per 100 Males in Honesdale borough?
There are 114.55 Females per 100 Males in Honesdale borough.
What is the Median Population Age in Honesdale borough?
Median Population Age in Honesdale borough is 42.5 Years.
What is the Average Family Size in Honesdale borough
Average Family Size in Honesdale borough is 3.2 People.
What is the Average Household Size in Honesdale borough
Average Household Size in Honesdale borough is 2.1 People.
How Large is the Labor Force in Honesdale borough?
There are 2,126 People in the Labor Forcein in Honesdale borough.
What is the Percentage of People in the Labor Force in Honesdale borough?
54.3% of People are in the Labor Force in Honesdale borough.
What is the Unemployment Rate in Honesdale borough?
Unemployment Rate in Honesdale borough is 9.4%.