Wofford Heights, CA Map & Demographics
Wofford Heights Map
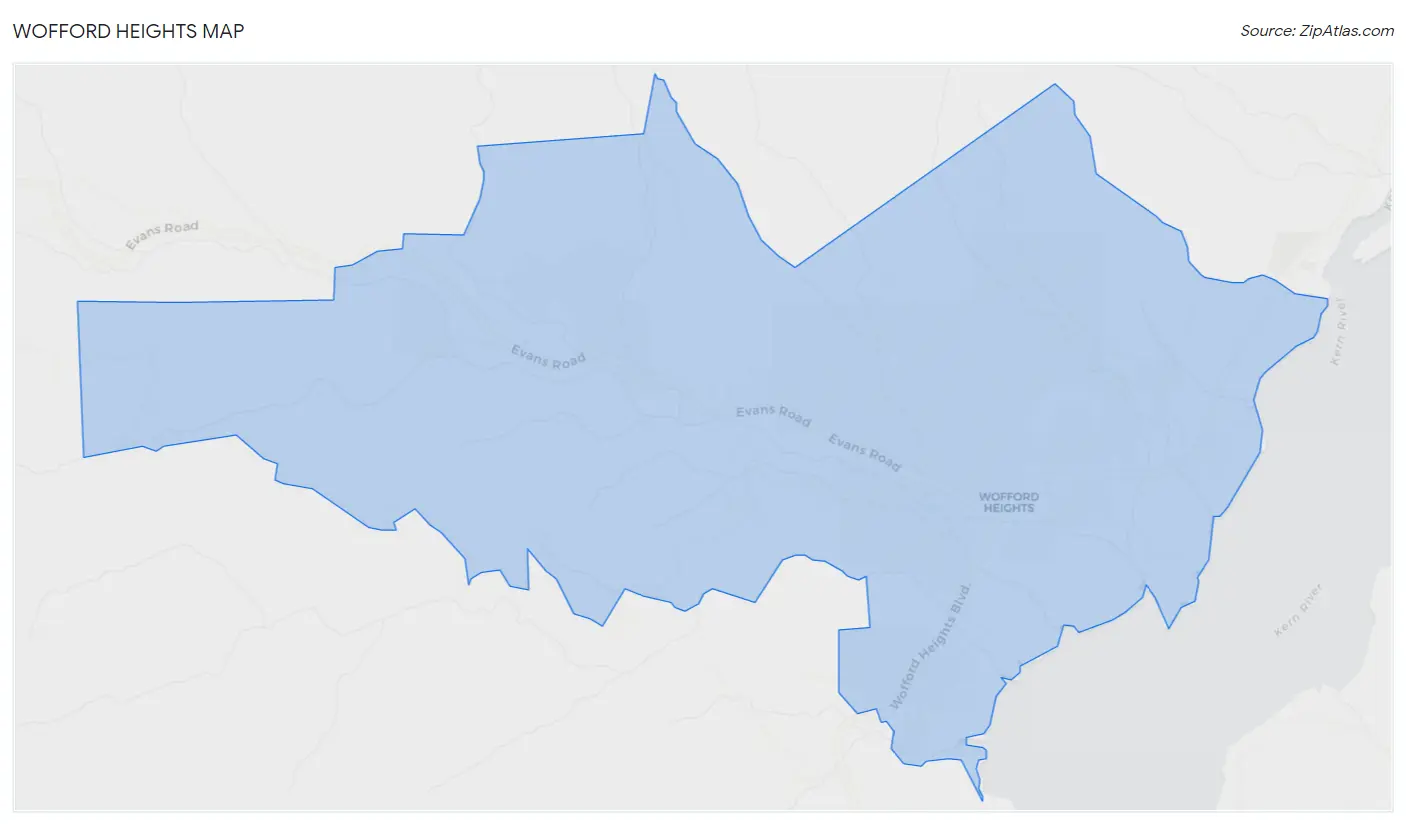
Wofford Heights Overview
$30,853
PER CAPITA INCOME
$35,068
AVG FAMILY INCOME
$36,614
AVG HOUSEHOLD INCOME
0.51
INEQUALITY / GINI INDEX
2,267
TOTAL POPULATION
1,060
MALE POPULATION
1,207
FEMALE POPULATION
87.82
MALES / 100 FEMALES
113.87
FEMALES / 100 MALES
59.8
MEDIAN AGE
2.4
AVG FAMILY SIZE
1.9
AVG HOUSEHOLD SIZE
520
LABOR FORCE [ PEOPLE ]
24.2%
PERCENT IN LABOR FORCE
6.0%
UNEMPLOYMENT RATE
Wofford Heights Zip Codes
Income in Wofford Heights
Income Overview in Wofford Heights
Per Capita Income in Wofford Heights is $30,853, while median incomes of families and households are $35,068 and $36,614 respectively.
| Characteristic | Number | Measure |
| Per Capita Income | 2,267 | $30,853 |
| Median Family Income | 663 | $35,068 |
| Mean Family Income | 663 | $66,665 |
| Median Household Income | 1,211 | $36,614 |
| Mean Household Income | 1,211 | $56,131 |
| Income Deficit | 663 | $0 |
| Wage / Income Gap (%) | 2,267 | 0.00% |
| Wage / Income Gap ($) | 2,267 | 100.00¢ per $1 |
| Gini / Inequality Index | 2,267 | 0.51 |
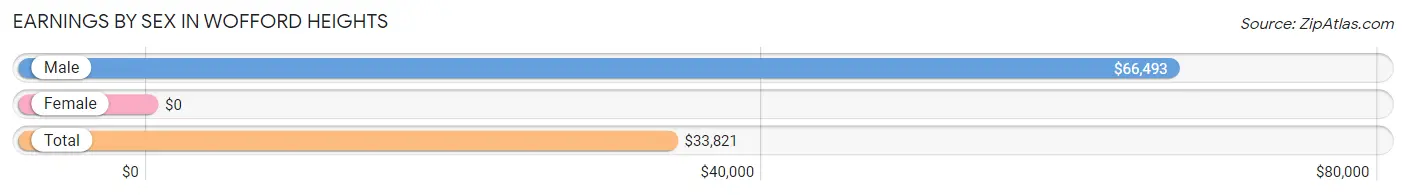
Earnings by Sex in Wofford Heights
| Sex | Number | Average Earnings |
| Male | 198 (38.2%) | $66,493 |
| Female | 321 (61.9%) | $0 |
| Total | 519 (100.0%) | $33,821 |
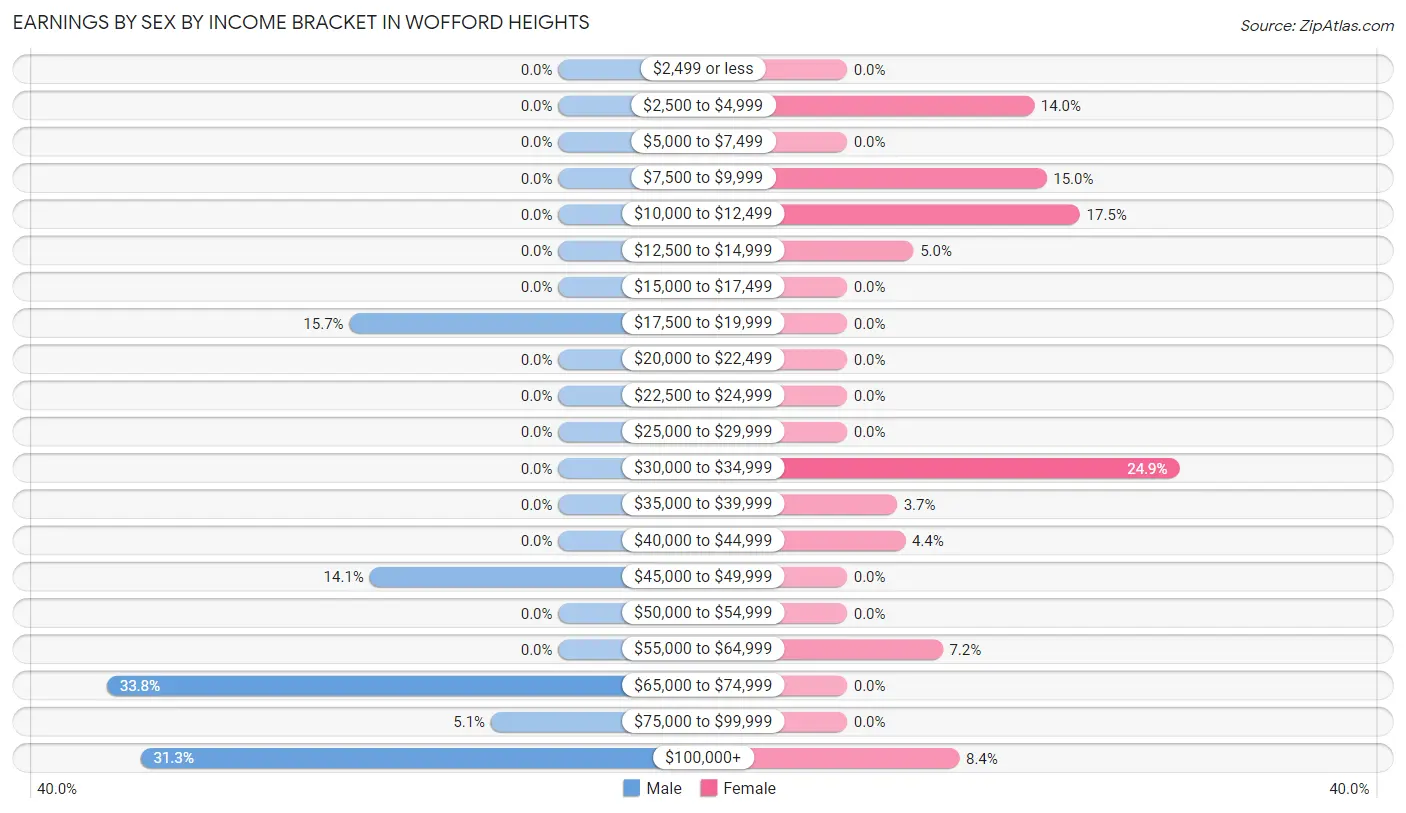
Earnings by Sex by Income Bracket in Wofford Heights
The most common earnings brackets in Wofford Heights are $65,000 to $74,999 for men (67 | 33.8%) and $30,000 to $34,999 for women (80 | 24.9%).
| Income | Male | Female |
| $2,499 or less | 0 (0.0%) | 0 (0.0%) |
| $2,500 to $4,999 | 0 (0.0%) | 45 (14.0%) |
| $5,000 to $7,499 | 0 (0.0%) | 0 (0.0%) |
| $7,500 to $9,999 | 0 (0.0%) | 48 (14.9%) |
| $10,000 to $12,499 | 0 (0.0%) | 56 (17.4%) |
| $12,500 to $14,999 | 0 (0.0%) | 16 (5.0%) |
| $15,000 to $17,499 | 0 (0.0%) | 0 (0.0%) |
| $17,500 to $19,999 | 31 (15.7%) | 0 (0.0%) |
| $20,000 to $22,499 | 0 (0.0%) | 0 (0.0%) |
| $22,500 to $24,999 | 0 (0.0%) | 0 (0.0%) |
| $25,000 to $29,999 | 0 (0.0%) | 0 (0.0%) |
| $30,000 to $34,999 | 0 (0.0%) | 80 (24.9%) |
| $35,000 to $39,999 | 0 (0.0%) | 12 (3.7%) |
| $40,000 to $44,999 | 0 (0.0%) | 14 (4.4%) |
| $45,000 to $49,999 | 28 (14.1%) | 0 (0.0%) |
| $50,000 to $54,999 | 0 (0.0%) | 0 (0.0%) |
| $55,000 to $64,999 | 0 (0.0%) | 23 (7.2%) |
| $65,000 to $74,999 | 67 (33.8%) | 0 (0.0%) |
| $75,000 to $99,999 | 10 (5.1%) | 0 (0.0%) |
| $100,000+ | 62 (31.3%) | 27 (8.4%) |
| Total | 198 (100.0%) | 321 (100.0%) |
Earnings by Sex by Educational Attainment in Wofford Heights
| Educational Attainment | Male Income | Female Income |
| Less than High School | - | - |
| High School Diploma | - | - |
| College or Associate's Degree | - | - |
| Bachelor's Degree | - | - |
| Graduate Degree | - | - |
| Total | $67,071 | $0 |
Family Income in Wofford Heights
Family Income Brackets in Wofford Heights
According to the Wofford Heights family income data, there are 151 families falling into the $25,000 to $34,999 income range, which is the most common income bracket and makes up 22.8% of all families.
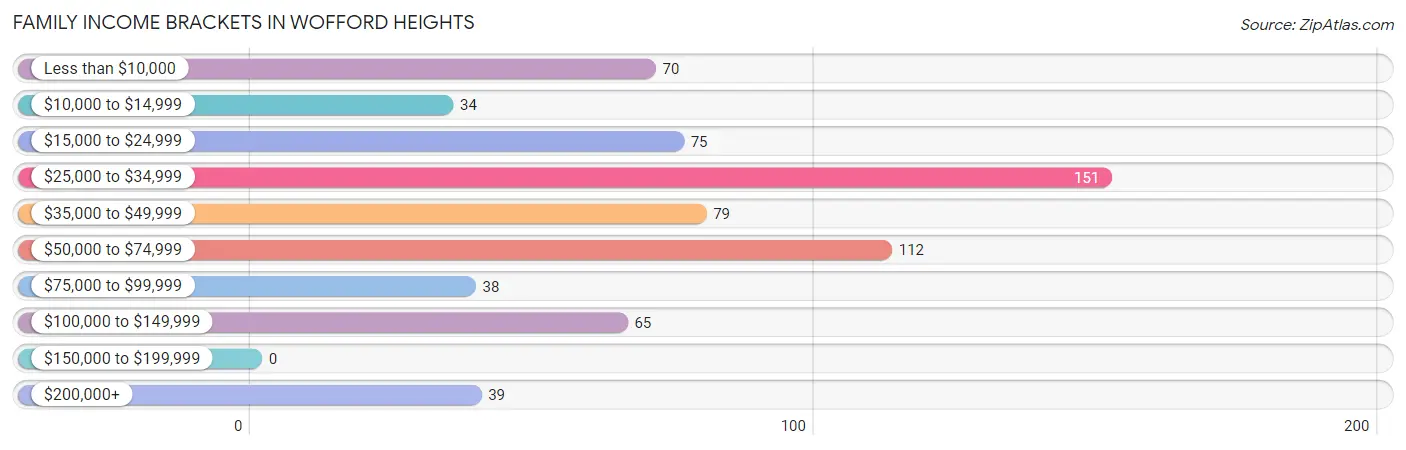
| Income Bracket | # Families | % Families |
| Less than $10,000 | 70 | 10.6% |
| $10,000 to $14,999 | 34 | 5.1% |
| $15,000 to $24,999 | 75 | 11.3% |
| $25,000 to $34,999 | 151 | 22.8% |
| $35,000 to $49,999 | 79 | 11.9% |
| $50,000 to $74,999 | 112 | 16.9% |
| $75,000 to $99,999 | 38 | 5.7% |
| $100,000 to $149,999 | 65 | 9.8% |
| $150,000 to $199,999 | 0 | 0.0% |
| $200,000+ | 39 | 5.9% |
Family Income by Famaliy Size in Wofford Heights
2-person families (602 | 90.8%) account for the highest median family income in Wofford Heights with $34,714 per family, while 2-person families (602 | 90.8%) have the highest median income of $17,357 per family member.
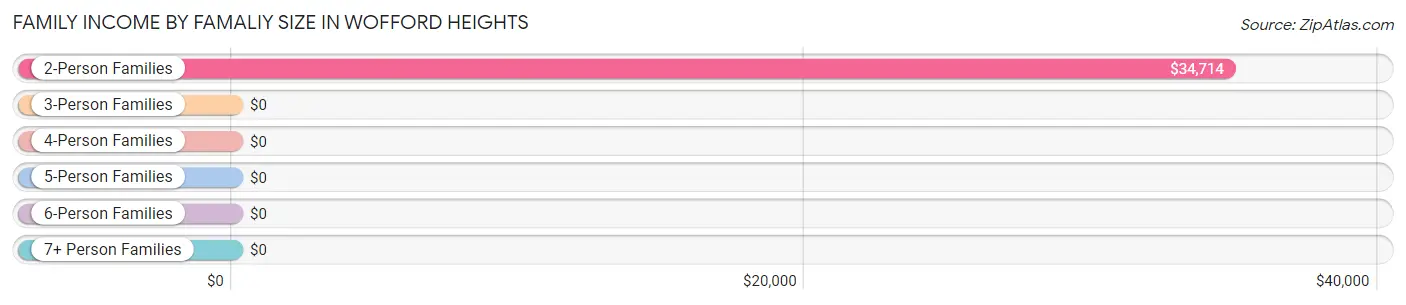
| Income Bracket | # Families | Median Income |
| 2-Person Families | 602 (90.8%) | $34,714 |
| 3-Person Families | 28 (4.2%) | $0 |
| 4-Person Families | 0 (0.0%) | $0 |
| 5-Person Families | 0 (0.0%) | $0 |
| 6-Person Families | 25 (3.8%) | $0 |
| 7+ Person Families | 8 (1.2%) | $0 |
| Total | 663 (100.0%) | $35,068 |
Family Income by Number of Earners in Wofford Heights
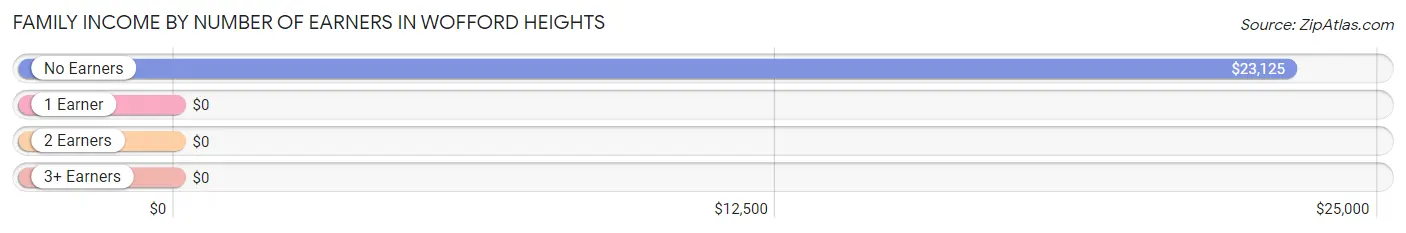
| Number of Earners | # Families | Median Income |
| No Earners | 346 (52.2%) | $23,125 |
| 1 Earner | 264 (39.8%) | $0 |
| 2 Earners | 53 (8.0%) | $0 |
| 3+ Earners | 0 (0.0%) | $0 |
| Total | 663 (100.0%) | $35,068 |
Household Income in Wofford Heights
Household Income Brackets in Wofford Heights
With 270 households falling in the category, the $50,000 to $74,999 income range is the most frequent in Wofford Heights, accounting for 22.3% of all households.
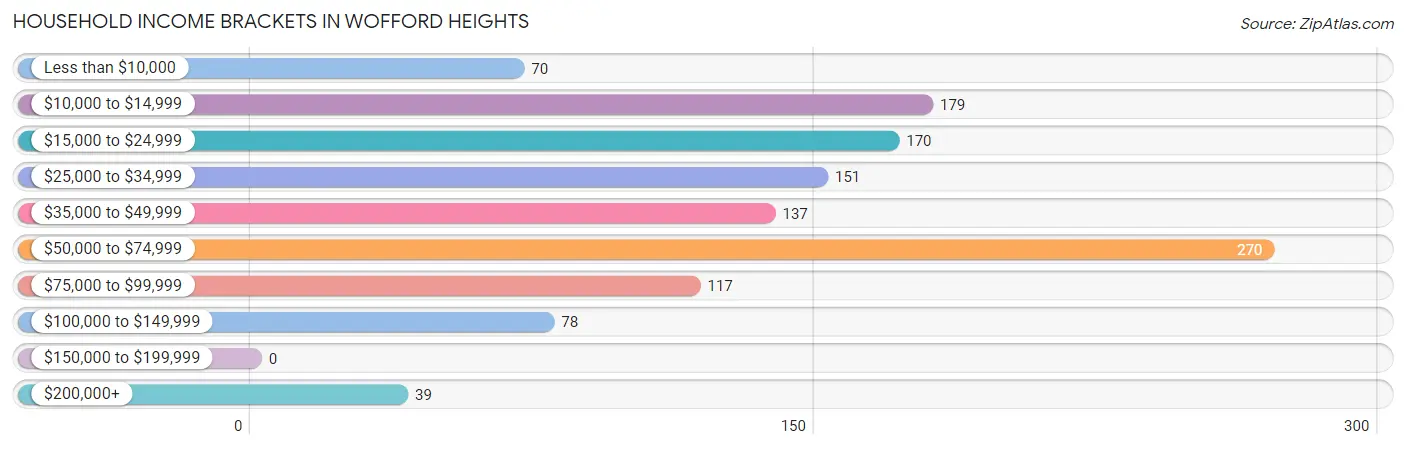
| Income Bracket | # Households | % Households |
| Less than $10,000 | 70 | 5.8% |
| $10,000 to $14,999 | 179 | 14.8% |
| $15,000 to $24,999 | 170 | 14.0% |
| $25,000 to $34,999 | 151 | 12.5% |
| $35,000 to $49,999 | 137 | 11.3% |
| $50,000 to $74,999 | 270 | 22.3% |
| $75,000 to $99,999 | 117 | 9.7% |
| $100,000 to $149,999 | 78 | 6.4% |
| $150,000 to $199,999 | 0 | 0.0% |
| $200,000+ | 39 | 3.2% |
Household Income by Householder Age in Wofford Heights
The median household income in Wofford Heights is $36,614, with the highest median household income of $57,589 found in the 25 to 44 years age bracket for the primary householder. A total of 188 households (15.5%) fall into this category.
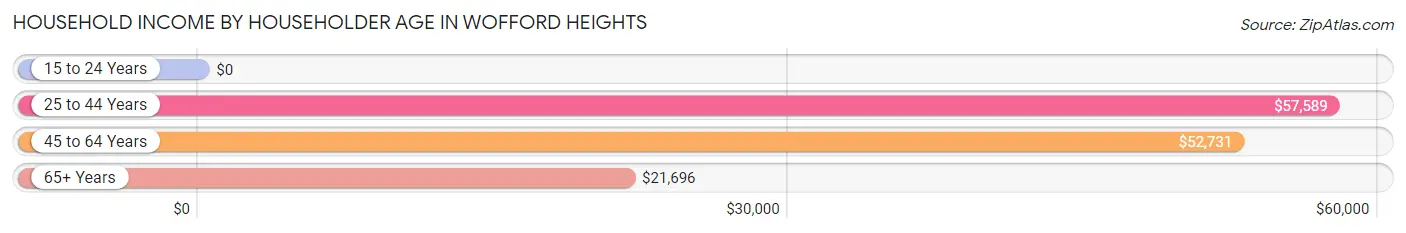
| Income Bracket | # Households | Median Income |
| 15 to 24 Years | 0 (0.0%) | $0 |
| 25 to 44 Years | 188 (15.5%) | $57,589 |
| 45 to 64 Years | 435 (35.9%) | $52,731 |
| 65+ Years | 588 (48.5%) | $21,696 |
| Total | 1,211 (100.0%) | $36,614 |
Poverty in Wofford Heights
Income Below Poverty by Sex and Age in Wofford Heights
With 23.0% poverty level for males and 26.3% for females among the residents of Wofford Heights, 12 to 14 year old males and 12 to 14 year old females are the most vulnerable to poverty, with 24 males (100.0%) and 26 females (100.0%) in their respective age groups living below the poverty level.
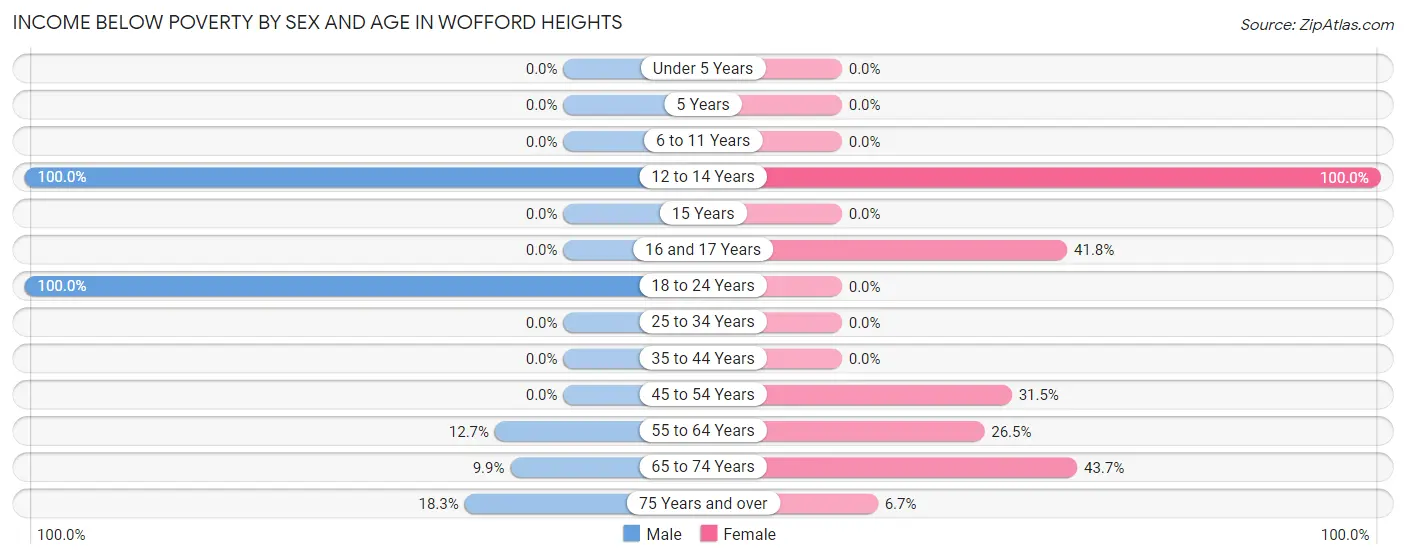
| Age Bracket | Male | Female |
| Under 5 Years | 0 (0.0%) | 0 (0.0%) |
| 5 Years | 0 (0.0%) | 0 (0.0%) |
| 6 to 11 Years | 0 (0.0%) | 0 (0.0%) |
| 12 to 14 Years | 24 (100.0%) | 26 (100.0%) |
| 15 Years | 0 (0.0%) | 0 (0.0%) |
| 16 and 17 Years | 0 (0.0%) | 23 (41.8%) |
| 18 to 24 Years | 139 (100.0%) | 0 (0.0%) |
| 25 to 34 Years | 0 (0.0%) | 0 (0.0%) |
| 35 to 44 Years | 0 (0.0%) | 0 (0.0%) |
| 45 to 54 Years | 0 (0.0%) | 41 (31.5%) |
| 55 to 64 Years | 30 (12.7%) | 96 (26.5%) |
| 65 to 74 Years | 20 (9.9%) | 117 (43.7%) |
| 75 Years and over | 31 (18.3%) | 14 (6.7%) |
| Total | 244 (23.0%) | 317 (26.3%) |
Income Above Poverty by Sex and Age in Wofford Heights
According to the poverty statistics in Wofford Heights, males aged 6 to 11 years and females aged under 5 years are the age groups that are most secure financially, with 100.0% of males and 100.0% of females in these age groups living above the poverty line.
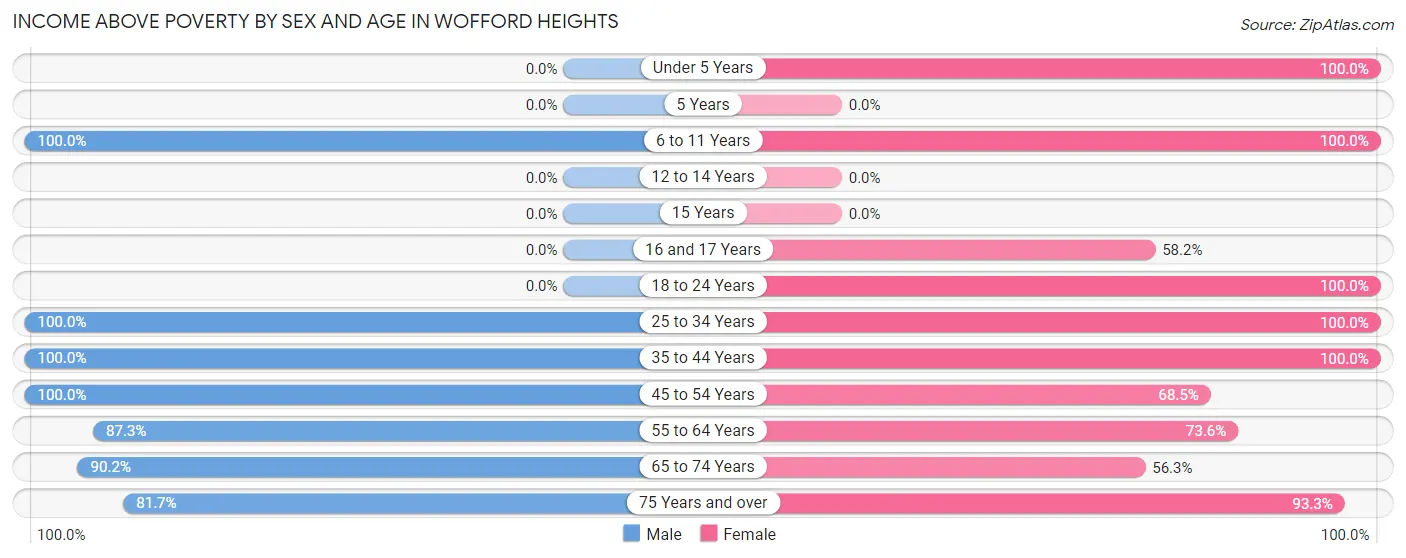
| Age Bracket | Male | Female |
| Under 5 Years | 0 (0.0%) | 16 (100.0%) |
| 5 Years | 0 (0.0%) | 0 (0.0%) |
| 6 to 11 Years | 36 (100.0%) | 16 (100.0%) |
| 12 to 14 Years | 0 (0.0%) | 0 (0.0%) |
| 15 Years | 0 (0.0%) | 0 (0.0%) |
| 16 and 17 Years | 0 (0.0%) | 32 (58.2%) |
| 18 to 24 Years | 0 (0.0%) | 31 (100.0%) |
| 25 to 34 Years | 36 (100.0%) | 48 (100.0%) |
| 35 to 44 Years | 163 (100.0%) | 44 (100.0%) |
| 45 to 54 Years | 54 (100.0%) | 89 (68.5%) |
| 55 to 64 Years | 206 (87.3%) | 267 (73.6%) |
| 65 to 74 Years | 183 (90.1%) | 151 (56.3%) |
| 75 Years and over | 138 (81.7%) | 196 (93.3%) |
| Total | 816 (77.0%) | 890 (73.7%) |
Income Below Poverty Among Married-Couple Families in Wofford Heights
The poverty statistics for married-couple families in Wofford Heights show that 3.3% or 12 of the total 361 families live below the poverty line. Families with no children have the highest poverty rate of 3.6%, comprising of 12 families. On the other hand, families with 1 or 2 children have the lowest poverty rate of 0.0%, which includes 0 families.
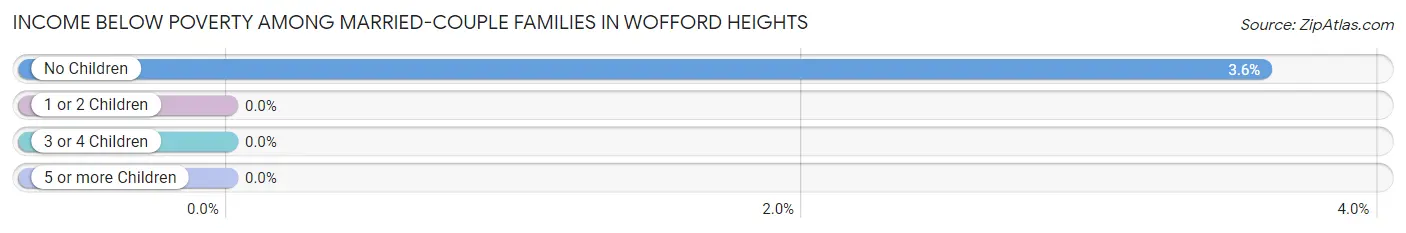
| Children | Above Poverty | Below Poverty |
| No Children | 321 (96.4%) | 12 (3.6%) |
| 1 or 2 Children | 28 (100.0%) | 0 (0.0%) |
| 3 or 4 Children | 0 (0.0%) | 0 (0.0%) |
| 5 or more Children | 0 (0.0%) | 0 (0.0%) |
| Total | 349 (96.7%) | 12 (3.3%) |
Income Below Poverty Among Single-Parent Households in Wofford Heights
According to the poverty data in Wofford Heights, 38.5% or 10 single-father households and 38.8% or 107 single-mother households are living below the poverty line. Among single-father households, those with no children have the highest poverty rate, with 10 households (55.6%) experiencing poverty. Likewise, among single-mother households, those with 3 or 4 children have the highest poverty rate, with 25 households (100.0%) falling below the poverty line.
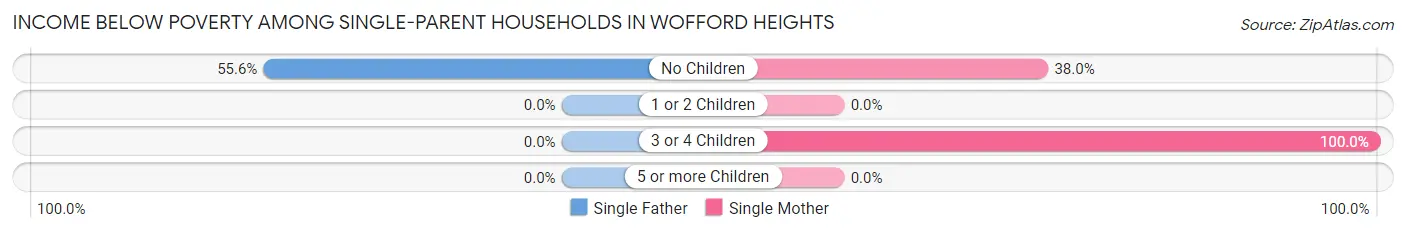
| Children | Single Father | Single Mother |
| No Children | 10 (55.6%) | 82 (38.0%) |
| 1 or 2 Children | 0 (0.0%) | 0 (0.0%) |
| 3 or 4 Children | 0 (0.0%) | 25 (100.0%) |
| 5 or more Children | 0 (0.0%) | 0 (0.0%) |
| Total | 10 (38.5%) | 107 (38.8%) |
Income Below Poverty Among Married-Couple vs Single-Parent Households in Wofford Heights
The poverty data for Wofford Heights shows that 12 of the married-couple family households (3.3%) and 117 of the single-parent households (38.7%) are living below the poverty level. Within the married-couple family households, those with no children have the highest poverty rate, with 12 households (3.6%) falling below the poverty line. Among the single-parent households, those with 3 or 4 children have the highest poverty rate, with 25 household (100.0%) living below poverty.
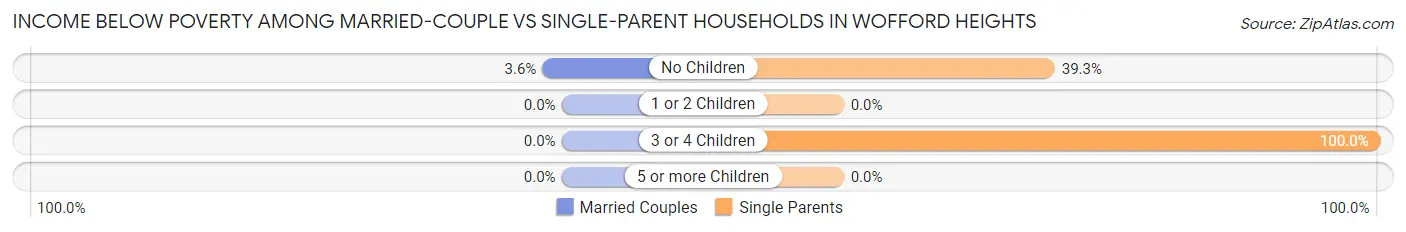
| Children | Married-Couple Families | Single-Parent Households |
| No Children | 12 (3.6%) | 92 (39.3%) |
| 1 or 2 Children | 0 (0.0%) | 0 (0.0%) |
| 3 or 4 Children | 0 (0.0%) | 25 (100.0%) |
| 5 or more Children | 0 (0.0%) | 0 (0.0%) |
| Total | 12 (3.3%) | 117 (38.7%) |
Race in Wofford Heights
The most populous races in Wofford Heights are White / Caucasian (2,012 | 88.7%), Hispanic or Latino (240 | 10.6%), and Some other Race (130 | 5.7%).
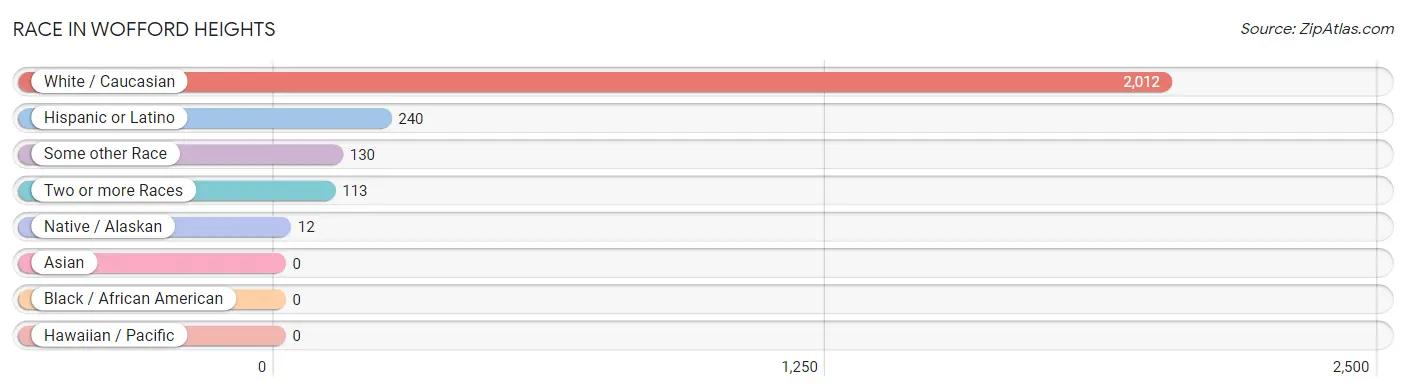
| Race | # Population | % Population |
| Asian | 0 | 0.0% |
| Black / African American | 0 | 0.0% |
| Hawaiian / Pacific | 0 | 0.0% |
| Hispanic or Latino | 240 | 10.6% |
| Native / Alaskan | 12 | 0.5% |
| White / Caucasian | 2,012 | 88.7% |
| Two or more Races | 113 | 5.0% |
| Some other Race | 130 | 5.7% |
| Total | 2,267 | 100.0% |
Ancestry in Wofford Heights
The most populous ancestries reported in Wofford Heights are American (539 | 23.8%), Irish (429 | 18.9%), German (399 | 17.6%), Mexican (230 | 10.2%), and English (150 | 6.6%), together accounting for 77.1% of all Wofford Heights residents.
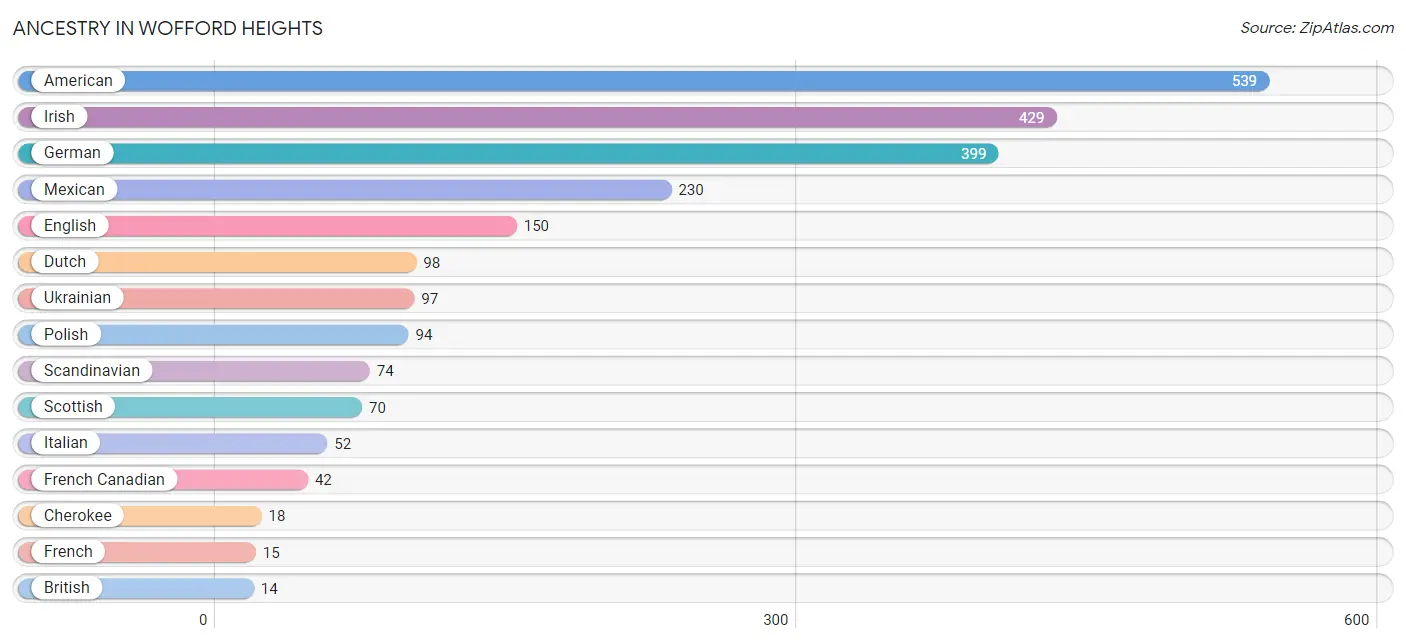
| Ancestry | # Population | % Population |
| American | 539 | 23.8% |
| British | 14 | 0.6% |
| Central American | 10 | 0.4% |
| Cherokee | 18 | 0.8% |
| Dutch | 98 | 4.3% |
| English | 150 | 6.6% |
| European | 11 | 0.5% |
| French | 15 | 0.7% |
| French Canadian | 42 | 1.8% |
| German | 399 | 17.6% |
| Irish | 429 | 18.9% |
| Italian | 52 | 2.3% |
| Lithuanian | 11 | 0.5% |
| Mexican | 230 | 10.2% |
| Polish | 94 | 4.2% |
| Salvadoran | 10 | 0.4% |
| Scandinavian | 74 | 3.3% |
| Scottish | 70 | 3.1% |
| Ukrainian | 97 | 4.3% | View All 19 Rows |
Immigrants in Wofford Heights
The most numerous immigrant groups reported in Wofford Heights came from Europe (147 | 6.5%), Eastern Europe (124 | 5.5%), Ukraine (97 | 4.3%), Poland (27 | 1.2%), and Northern Europe (23 | 1.0%), together accounting for 18.4% of all Wofford Heights residents.
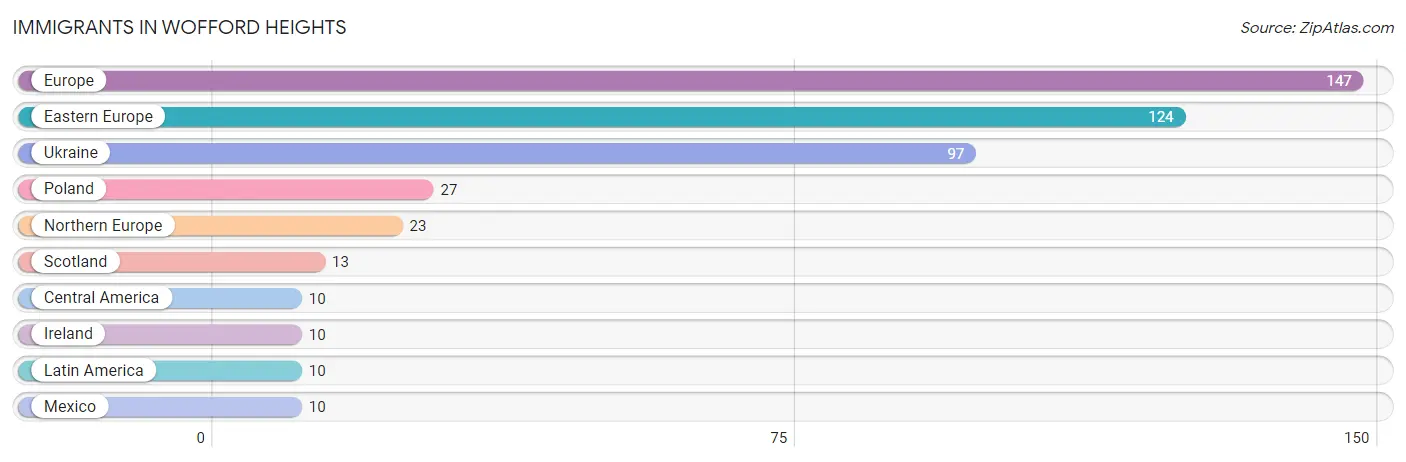
| Immigration Origin | # Population | % Population |
| Central America | 10 | 0.4% |
| Eastern Europe | 124 | 5.5% |
| Europe | 147 | 6.5% |
| Ireland | 10 | 0.4% |
| Latin America | 10 | 0.4% |
| Mexico | 10 | 0.4% |
| Northern Europe | 23 | 1.0% |
| Poland | 27 | 1.2% |
| Scotland | 13 | 0.6% |
| Ukraine | 97 | 4.3% | View All 10 Rows |
Sex and Age in Wofford Heights
Sex and Age in Wofford Heights
The most populous age groups in Wofford Heights are 20 to 24 Years (139 | 13.1%) for men and 55 to 59 Years (218 | 18.1%) for women.
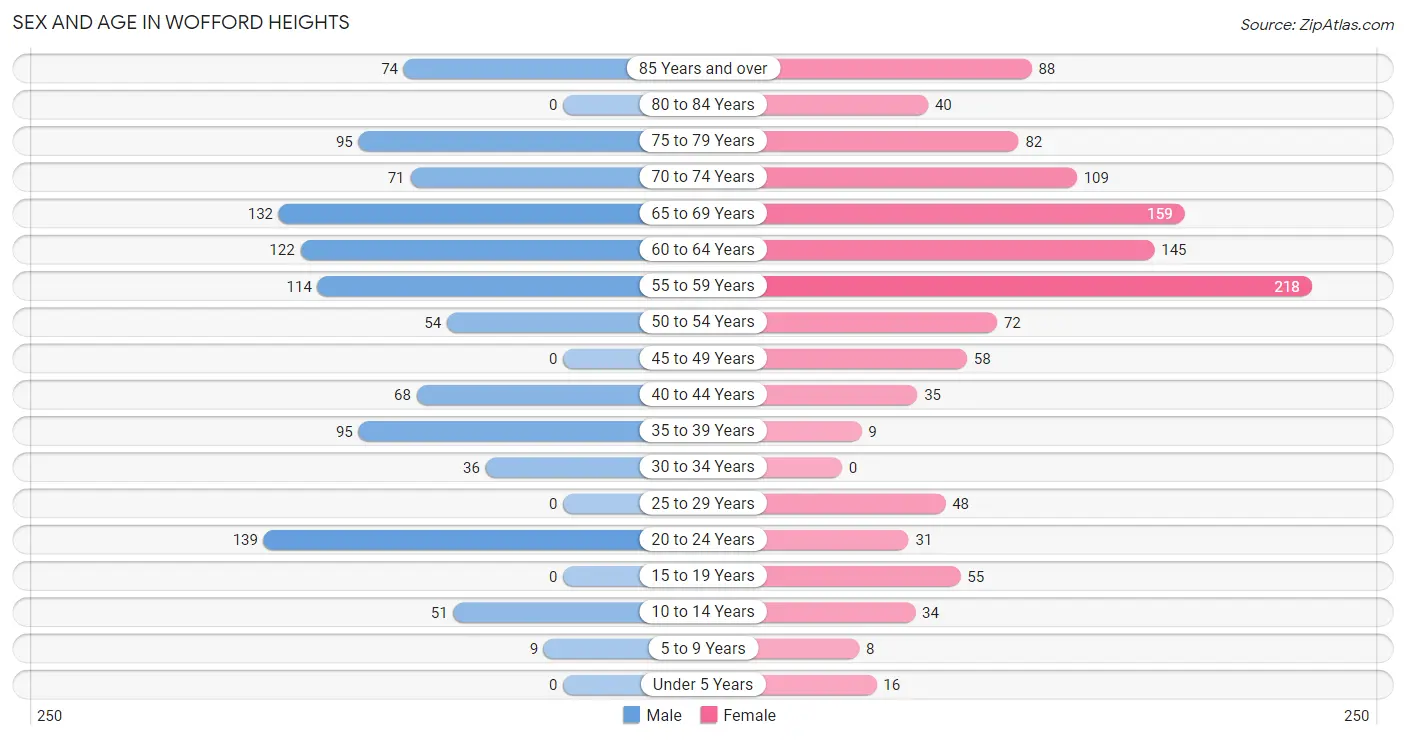
| Age Bracket | Male | Female |
| Under 5 Years | 0 (0.0%) | 16 (1.3%) |
| 5 to 9 Years | 9 (0.9%) | 8 (0.7%) |
| 10 to 14 Years | 51 (4.8%) | 34 (2.8%) |
| 15 to 19 Years | 0 (0.0%) | 55 (4.6%) |
| 20 to 24 Years | 139 (13.1%) | 31 (2.6%) |
| 25 to 29 Years | 0 (0.0%) | 48 (4.0%) |
| 30 to 34 Years | 36 (3.4%) | 0 (0.0%) |
| 35 to 39 Years | 95 (9.0%) | 9 (0.7%) |
| 40 to 44 Years | 68 (6.4%) | 35 (2.9%) |
| 45 to 49 Years | 0 (0.0%) | 58 (4.8%) |
| 50 to 54 Years | 54 (5.1%) | 72 (6.0%) |
| 55 to 59 Years | 114 (10.7%) | 218 (18.1%) |
| 60 to 64 Years | 122 (11.5%) | 145 (12.0%) |
| 65 to 69 Years | 132 (12.4%) | 159 (13.2%) |
| 70 to 74 Years | 71 (6.7%) | 109 (9.0%) |
| 75 to 79 Years | 95 (9.0%) | 82 (6.8%) |
| 80 to 84 Years | 0 (0.0%) | 40 (3.3%) |
| 85 Years and over | 74 (7.0%) | 88 (7.3%) |
| Total | 1,060 (100.0%) | 1,207 (100.0%) |
Families and Households in Wofford Heights
Median Family Size in Wofford Heights
The median family size in Wofford Heights is 2.41 persons per family, with single male/father families (26 | 3.9%) accounting for the largest median family size of 4.15 persons per family. On the other hand, married-couple families (361 | 54.4%) represent the smallest median family size with 2.16 persons per family.
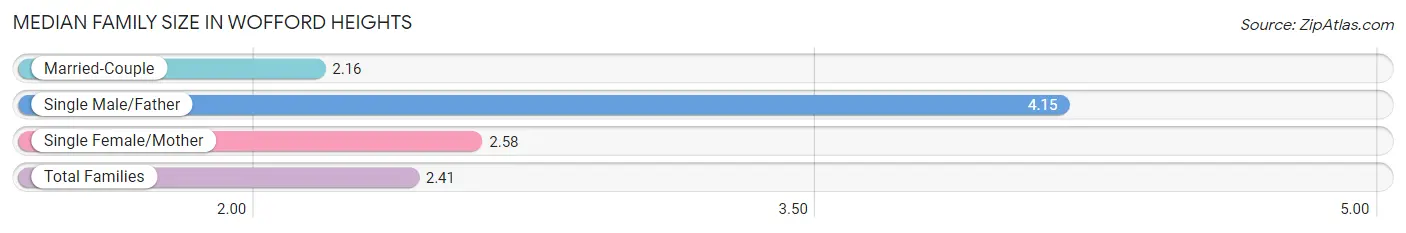
| Family Type | # Families | Family Size |
| Married-Couple | 361 (54.4%) | 2.16 |
| Single Male/Father | 26 (3.9%) | 4.15 |
| Single Female/Mother | 276 (41.6%) | 2.58 |
| Total Families | 663 (100.0%) | 2.41 |
Median Household Size in Wofford Heights
The median household size in Wofford Heights is 1.87 persons per household, with single male/father households (26 | 2.1%) accounting for the largest median household size of 4.15 persons per household. non-family households (548 | 45.3%) represent the smallest median household size with 1.16 persons per household.
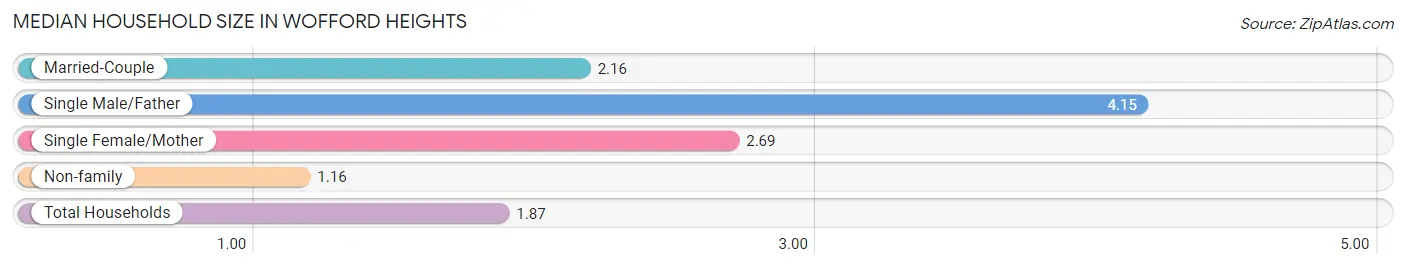
| Household Type | # Households | Household Size |
| Married-Couple | 361 (29.8%) | 2.16 |
| Single Male/Father | 26 (2.1%) | 4.15 |
| Single Female/Mother | 276 (22.8%) | 2.69 |
| Non-family | 548 (45.3%) | 1.16 |
| Total Households | 1,211 (100.0%) | 1.87 |
Household Size by Marriage Status in Wofford Heights
Out of a total of 1,211 households in Wofford Heights, 663 (54.7%) are family households, while 548 (45.3%) are nonfamily households. The most numerous type of family households are 2-person households, comprising 575, and the most common type of nonfamily households are 1-person households, comprising 471.
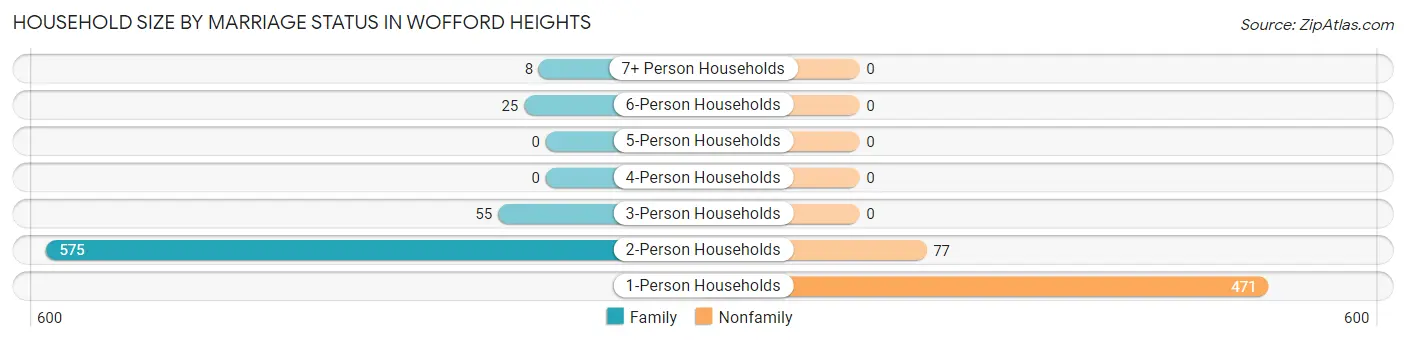
| Household Size | Family Households | Nonfamily Households |
| 1-Person Households | - | 471 (38.9%) |
| 2-Person Households | 575 (47.5%) | 77 (6.4%) |
| 3-Person Households | 55 (4.5%) | 0 (0.0%) |
| 4-Person Households | 0 (0.0%) | 0 (0.0%) |
| 5-Person Households | 0 (0.0%) | 0 (0.0%) |
| 6-Person Households | 25 (2.1%) | 0 (0.0%) |
| 7+ Person Households | 8 (0.7%) | 0 (0.0%) |
| Total | 663 (54.7%) | 548 (45.3%) |
Female Fertility in Wofford Heights
Fertility by Age in Wofford Heights
| Age Bracket | Women with Births | Births / 1,000 Women |
| 15 to 19 years | 0 (0.0%) | 0.0 |
| 20 to 34 years | 0 (0.0%) | 0.0 |
| 35 to 50 years | 0 (0.0%) | 0.0 |
| Total | 0 (0.0%) | 0.0 |
Fertility by Age by Marriage Status in Wofford Heights
| Age Bracket | Married | Unmarried |
| 15 to 19 years | 0 (0.0%) | 0 (0.0%) |
| 20 to 34 years | 0 (0.0%) | 0 (0.0%) |
| 35 to 50 years | 0 (0.0%) | 0 (0.0%) |
| Total | 0 (0.0%) | 0 (0.0%) |
Fertility by Education in Wofford Heights
| Educational Attainment | Women with Births | Births / 1,000 Women |
| Less than High School | 0 (0.0%) | 0.0 |
| High School Diploma | 0 (0.0%) | 0.0 |
| College or Associate's Degree | 0 (0.0%) | 0.0 |
| Bachelor's Degree | 0 (0.0%) | 0.0 |
| Graduate Degree | 0 (0.0%) | 0.0 |
| Total | 0 (0.0%) | 0.0 |
Fertility by Education by Marriage Status in Wofford Heights
| Educational Attainment | Married | Unmarried |
| Less than High School | 0 (0.0%) | 0 (0.0%) |
| High School Diploma | 0 (0.0%) | 0 (0.0%) |
| College or Associate's Degree | 0 (0.0%) | 0 (0.0%) |
| Bachelor's Degree | 0 (0.0%) | 0 (0.0%) |
| Graduate Degree | 0 (0.0%) | 0 (0.0%) |
| Total | 0 (0.0%) | 0 (0.0%) |
Employment Characteristics in Wofford Heights
Employment by Class of Employer in Wofford Heights
Among the 488 employed individuals in Wofford Heights, private company employees (258 | 52.9%), local government employees (98 | 20.1%), and federal government employees (90 | 18.4%) make up the most common classes of employment.
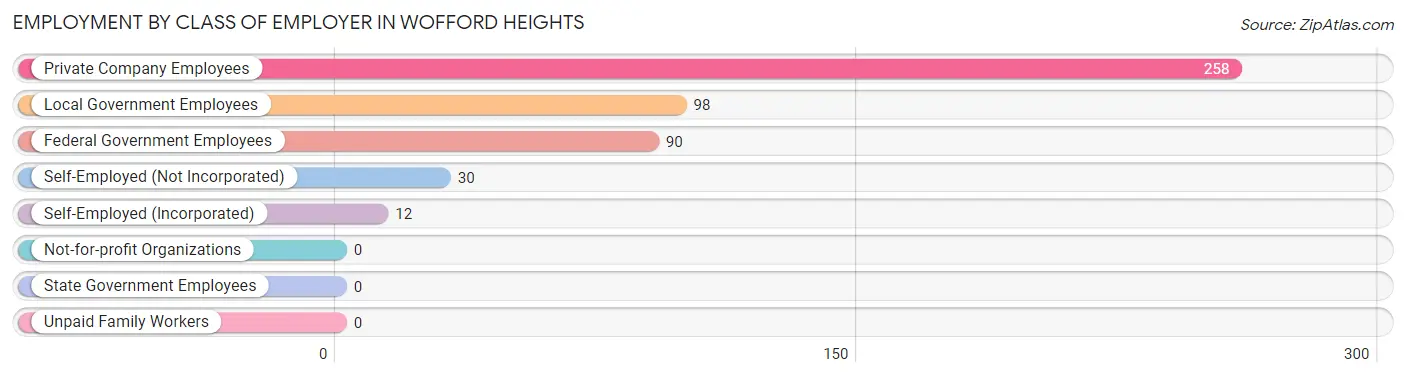
| Employer Class | # Employees | % Employees |
| Private Company Employees | 258 | 52.9% |
| Self-Employed (Incorporated) | 12 | 2.5% |
| Self-Employed (Not Incorporated) | 30 | 6.1% |
| Not-for-profit Organizations | 0 | 0.0% |
| Local Government Employees | 98 | 20.1% |
| State Government Employees | 0 | 0.0% |
| Federal Government Employees | 90 | 18.4% |
| Unpaid Family Workers | 0 | 0.0% |
| Total | 488 | 100.0% |
Employment Status by Age in Wofford Heights
According to the labor force statistics for Wofford Heights, out of the total population over 16 years of age (2,149), 24.2% or 520 individuals are in the labor force, with 6.0% or 31 of them unemployed. The age group with the highest labor force participation rate is 25 to 29 years, with 100.0% or 48 individuals in the labor force. Within the labor force, the 20 to 24 years age range has the highest percentage of unemployed individuals, with 50.0% or 31 of them being unemployed.
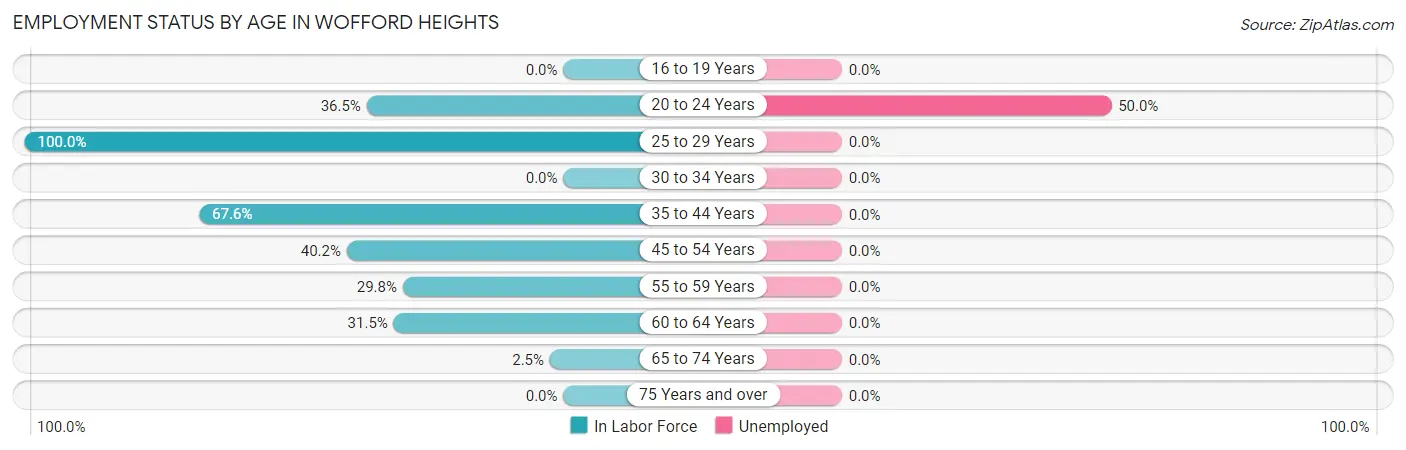
| Age Bracket | In Labor Force | Unemployed |
| 16 to 19 Years | 0 (0.0%) | 0 (0.0%) |
| 20 to 24 Years | 62 (36.5%) | 31 (50.0%) |
| 25 to 29 Years | 48 (100.0%) | 0 (0.0%) |
| 30 to 34 Years | 0 (0.0%) | 0 (0.0%) |
| 35 to 44 Years | 140 (67.6%) | 0 (0.0%) |
| 45 to 54 Years | 74 (40.2%) | 0 (0.0%) |
| 55 to 59 Years | 99 (29.8%) | 0 (0.0%) |
| 60 to 64 Years | 84 (31.5%) | 0 (0.0%) |
| 65 to 74 Years | 12 (2.5%) | 0 (0.0%) |
| 75 Years and over | 0 (0.0%) | 0 (0.0%) |
| Total | 520 (24.2%) | 31 (6.0%) |
Employment Status by Educational Attainment in Wofford Heights
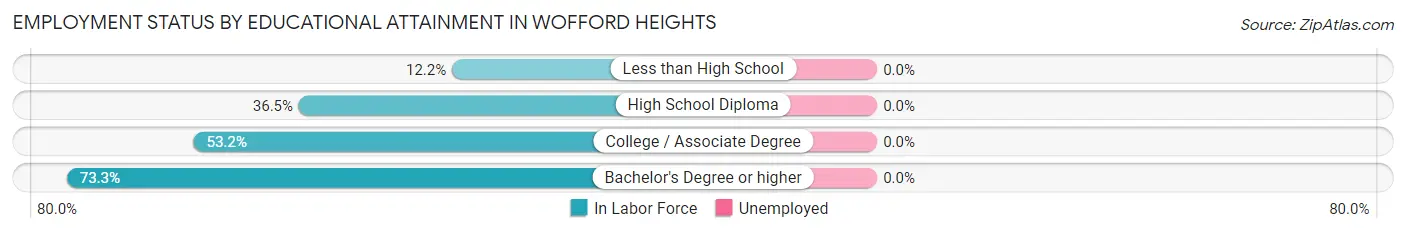
| Educational Attainment | In Labor Force | Unemployed |
| Less than High School | 16 (12.2%) | 0 (0.0%) |
| High School Diploma | 192 (36.5%) | 0 (0.0%) |
| College / Associate Degree | 182 (53.2%) | 0 (0.0%) |
| Bachelor's Degree or higher | 55 (73.3%) | 0 (0.0%) |
| Total | 445 (41.4%) | 0 (0.0%) |
Employment Occupations by Sex in Wofford Heights
Management, Business, Science and Arts Occupations
The most common Management, Business, Science and Arts occupations in Wofford Heights are Community & Social Service (110 | 22.5%), and Education Instruction & Library (110 | 22.5%).
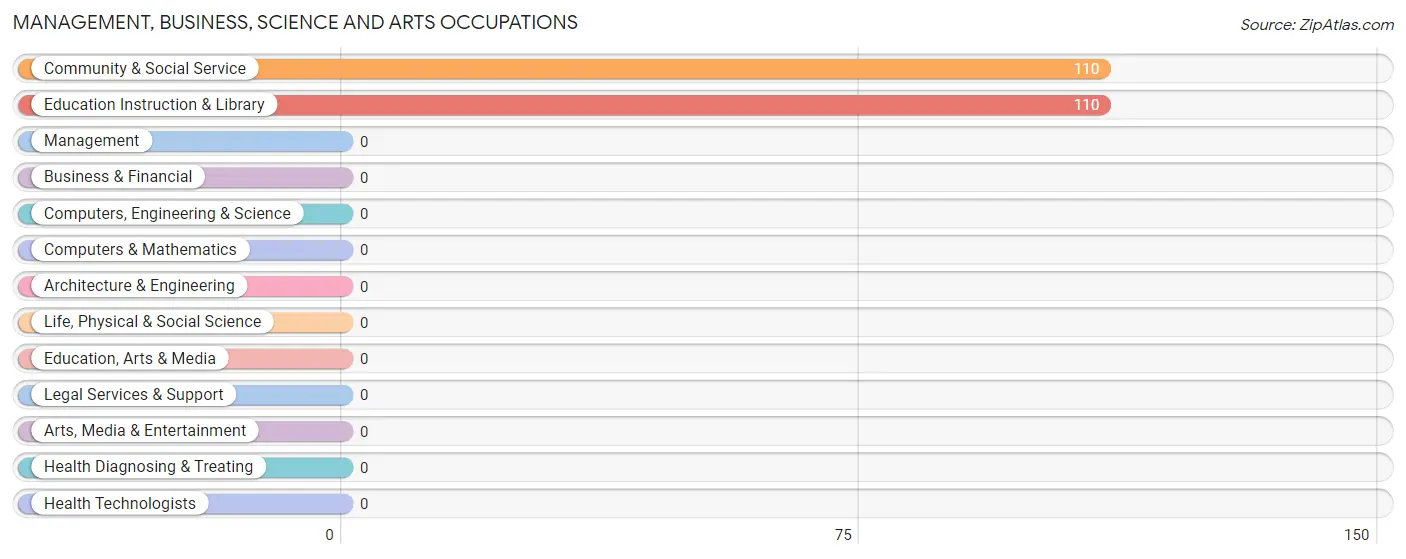
Management, Business, Science and Arts Occupations by Sex
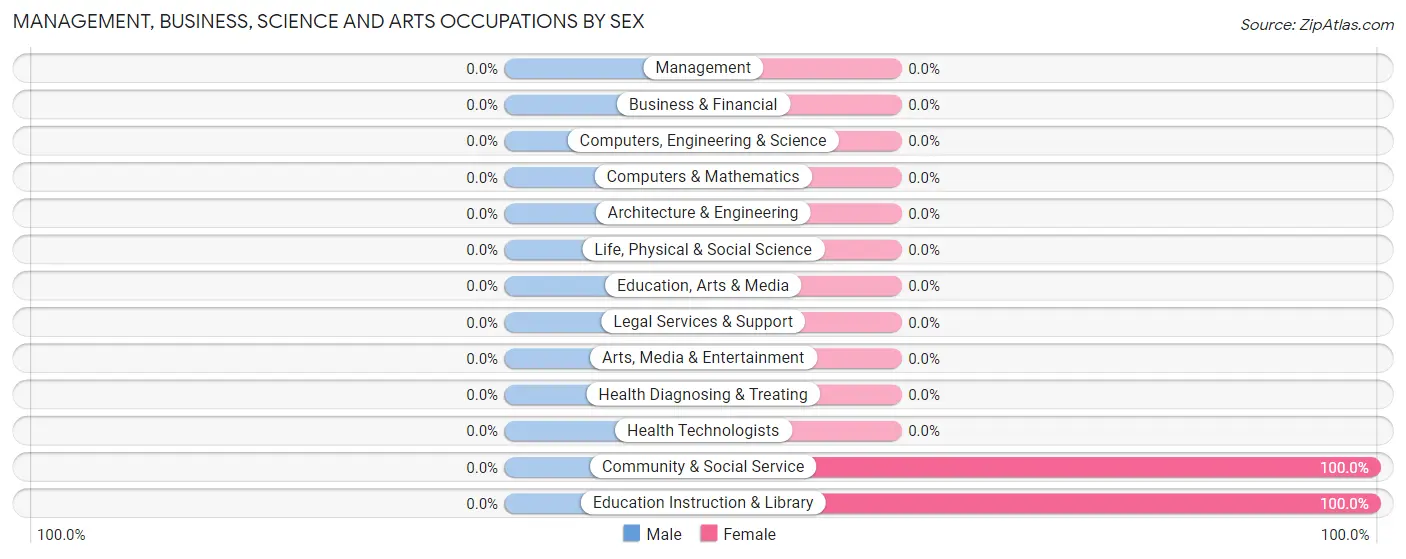
| Occupation | Male | Female |
| Management | 0 (0.0%) | 0 (0.0%) |
| Business & Financial | 0 (0.0%) | 0 (0.0%) |
| Computers, Engineering & Science | 0 (0.0%) | 0 (0.0%) |
| Computers & Mathematics | 0 (0.0%) | 0 (0.0%) |
| Architecture & Engineering | 0 (0.0%) | 0 (0.0%) |
| Life, Physical & Social Science | 0 (0.0%) | 0 (0.0%) |
| Community & Social Service | 0 (0.0%) | 110 (100.0%) |
| Education, Arts & Media | 0 (0.0%) | 0 (0.0%) |
| Legal Services & Support | 0 (0.0%) | 0 (0.0%) |
| Education Instruction & Library | 0 (0.0%) | 110 (100.0%) |
| Arts, Media & Entertainment | 0 (0.0%) | 0 (0.0%) |
| Health Diagnosing & Treating | 0 (0.0%) | 0 (0.0%) |
| Health Technologists | 0 (0.0%) | 0 (0.0%) |
| Total (Category) | 0 (0.0%) | 110 (100.0%) |
| Total (Overall) | 167 (34.2%) | 321 (65.8%) |
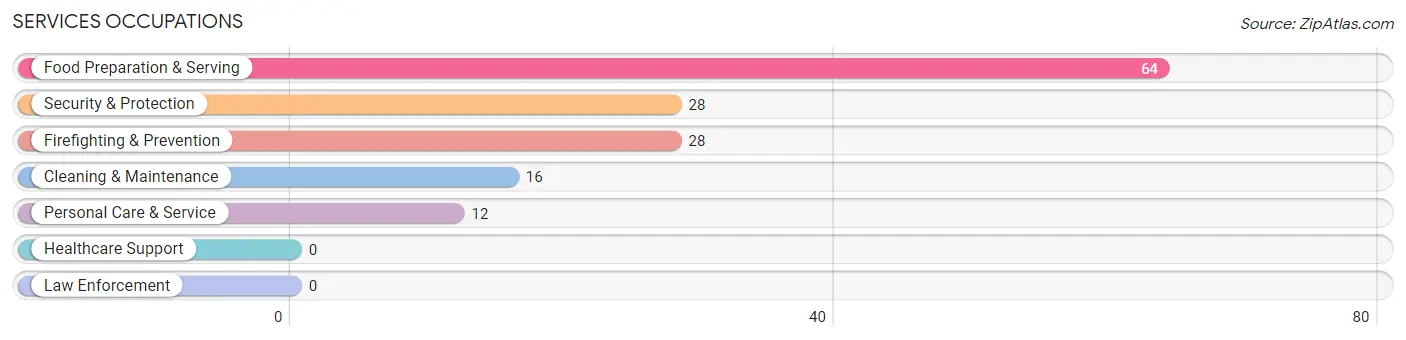
Services Occupations
The most common Services occupations in Wofford Heights are Food Preparation & Serving (64 | 13.1%), Security & Protection (28 | 5.7%), Firefighting & Prevention (28 | 5.7%), Cleaning & Maintenance (16 | 3.3%), and Personal Care & Service (12 | 2.5%).
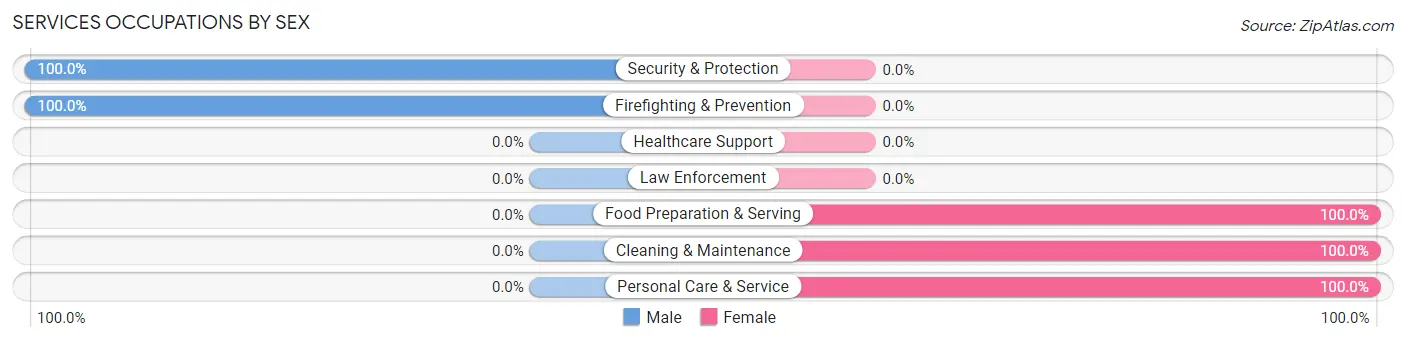
Services Occupations by Sex
Within the Services occupations in Wofford Heights, the most male-oriented occupations are Security & Protection (100.0%), and Firefighting & Prevention (100.0%), while the most female-oriented occupations are Food Preparation & Serving (100.0%), Cleaning & Maintenance (100.0%), and Personal Care & Service (100.0%).
| Occupation | Male | Female |
| Healthcare Support | 0 (0.0%) | 0 (0.0%) |
| Security & Protection | 28 (100.0%) | 0 (0.0%) |
| Firefighting & Prevention | 28 (100.0%) | 0 (0.0%) |
| Law Enforcement | 0 (0.0%) | 0 (0.0%) |
| Food Preparation & Serving | 0 (0.0%) | 64 (100.0%) |
| Cleaning & Maintenance | 0 (0.0%) | 16 (100.0%) |
| Personal Care & Service | 0 (0.0%) | 12 (100.0%) |
| Total (Category) | 28 (23.3%) | 92 (76.7%) |
| Total (Overall) | 167 (34.2%) | 321 (65.8%) |
Sales and Office Occupations
The most common Sales and Office occupations in Wofford Heights are Office & Administration (68 | 13.9%), and Sales & Related (51 | 10.4%).
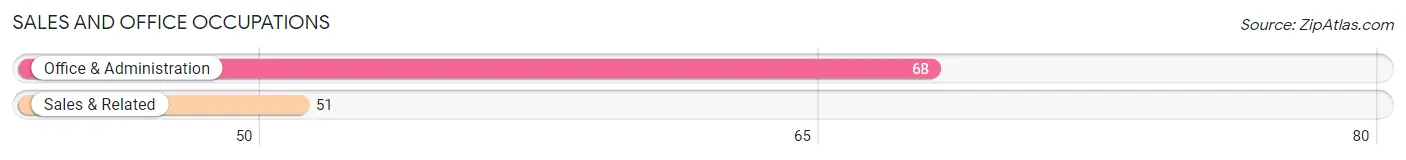
Sales and Office Occupations by Sex
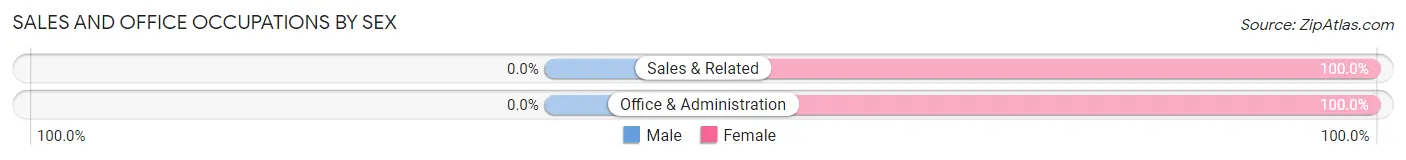
| Occupation | Male | Female |
| Sales & Related | 0 (0.0%) | 51 (100.0%) |
| Office & Administration | 0 (0.0%) | 68 (100.0%) |
| Total (Category) | 0 (0.0%) | 119 (100.0%) |
| Total (Overall) | 167 (34.2%) | 321 (65.8%) |
Natural Resources, Construction and Maintenance Occupations
The most common Natural Resources, Construction and Maintenance occupations in Wofford Heights are Farming, Fishing & Forestry (62 | 12.7%), and Construction & Extraction (10 | 2.1%).
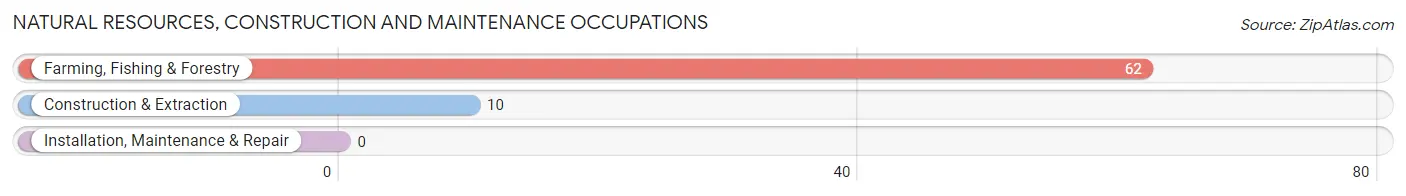
Natural Resources, Construction and Maintenance Occupations by Sex
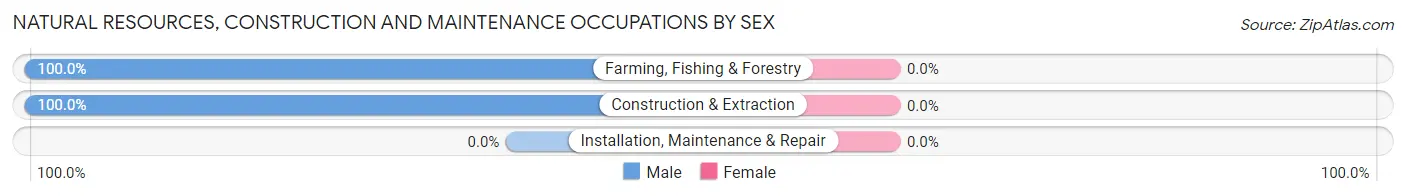
| Occupation | Male | Female |
| Farming, Fishing & Forestry | 62 (100.0%) | 0 (0.0%) |
| Construction & Extraction | 10 (100.0%) | 0 (0.0%) |
| Installation, Maintenance & Repair | 0 (0.0%) | 0 (0.0%) |
| Total (Category) | 72 (100.0%) | 0 (0.0%) |
| Total (Overall) | 167 (34.2%) | 321 (65.8%) |
Production, Transportation and Moving Occupations
The most common Production, Transportation and Moving occupations in Wofford Heights are , and Production (67 | 13.7%).
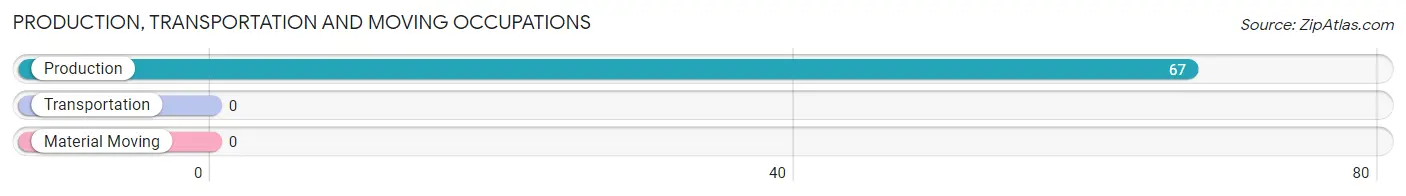
Production, Transportation and Moving Occupations by Sex
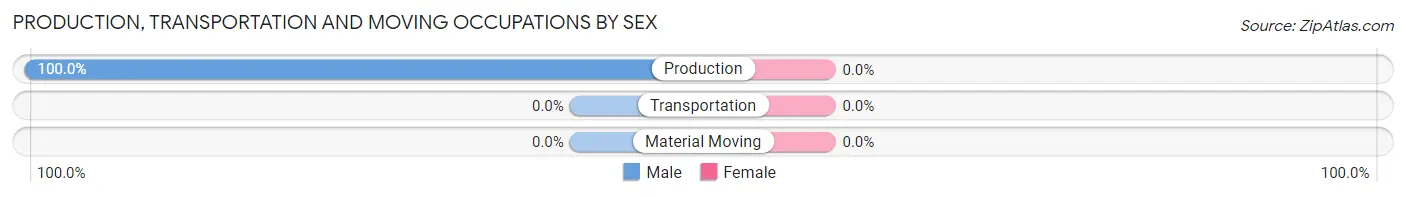
| Occupation | Male | Female |
| Production | 67 (100.0%) | 0 (0.0%) |
| Transportation | 0 (0.0%) | 0 (0.0%) |
| Material Moving | 0 (0.0%) | 0 (0.0%) |
| Total (Category) | 67 (100.0%) | 0 (0.0%) |
| Total (Overall) | 167 (34.2%) | 321 (65.8%) |
Employment Industries by Sex in Wofford Heights
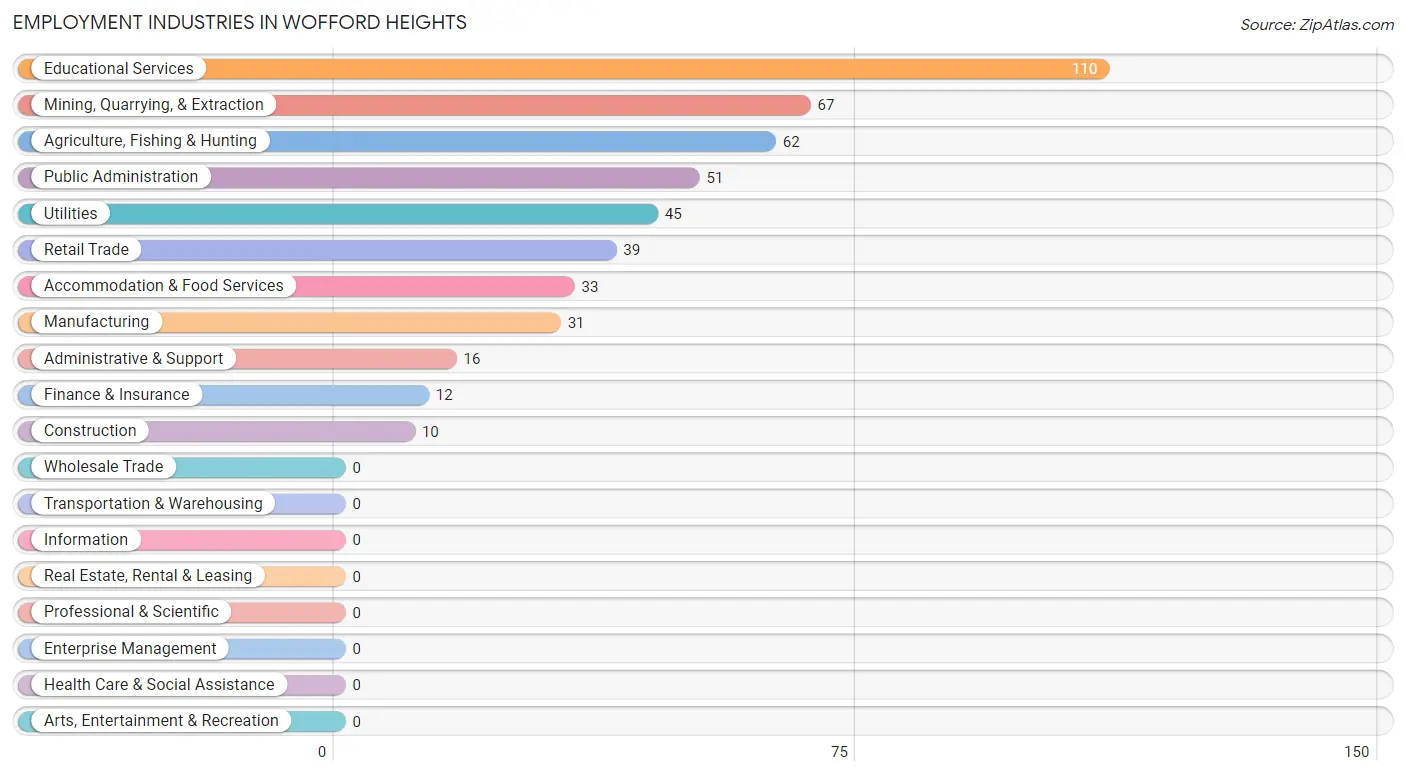
Employment Industries in Wofford Heights
The major employment industries in Wofford Heights include Educational Services (110 | 22.5%), Mining, Quarrying, & Extraction (67 | 13.7%), Agriculture, Fishing & Hunting (62 | 12.7%), Public Administration (51 | 10.4%), and Utilities (45 | 9.2%).
Employment Industries by Sex in Wofford Heights
The Wofford Heights industries that see more men than women are Agriculture, Fishing & Hunting (100.0%), Mining, Quarrying, & Extraction (100.0%), and Construction (100.0%), whereas the industries that tend to have a higher number of women are Manufacturing (100.0%), Retail Trade (100.0%), and Utilities (100.0%).
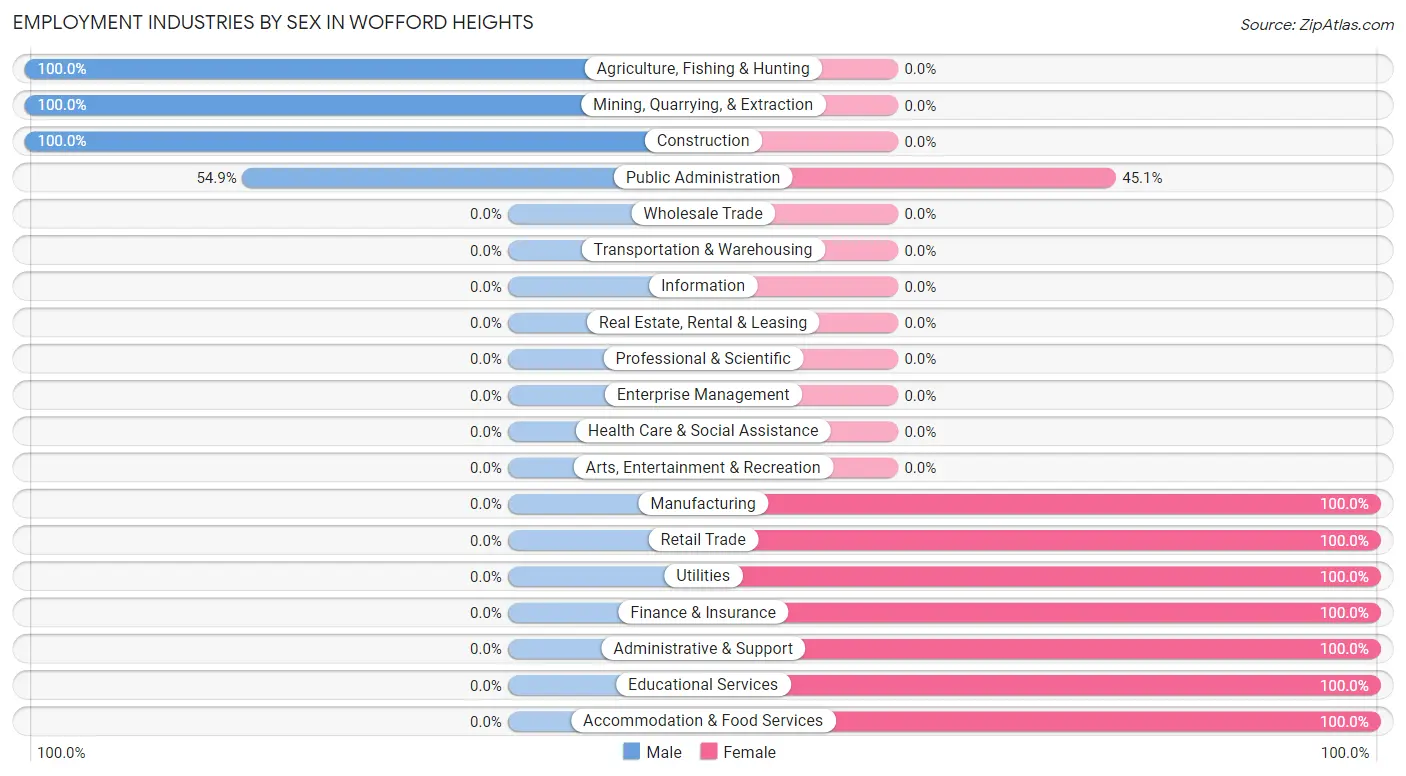
| Industry | Male | Female |
| Agriculture, Fishing & Hunting | 62 (100.0%) | 0 (0.0%) |
| Mining, Quarrying, & Extraction | 67 (100.0%) | 0 (0.0%) |
| Construction | 10 (100.0%) | 0 (0.0%) |
| Manufacturing | 0 (0.0%) | 31 (100.0%) |
| Wholesale Trade | 0 (0.0%) | 0 (0.0%) |
| Retail Trade | 0 (0.0%) | 39 (100.0%) |
| Transportation & Warehousing | 0 (0.0%) | 0 (0.0%) |
| Utilities | 0 (0.0%) | 45 (100.0%) |
| Information | 0 (0.0%) | 0 (0.0%) |
| Finance & Insurance | 0 (0.0%) | 12 (100.0%) |
| Real Estate, Rental & Leasing | 0 (0.0%) | 0 (0.0%) |
| Professional & Scientific | 0 (0.0%) | 0 (0.0%) |
| Enterprise Management | 0 (0.0%) | 0 (0.0%) |
| Administrative & Support | 0 (0.0%) | 16 (100.0%) |
| Educational Services | 0 (0.0%) | 110 (100.0%) |
| Health Care & Social Assistance | 0 (0.0%) | 0 (0.0%) |
| Arts, Entertainment & Recreation | 0 (0.0%) | 0 (0.0%) |
| Accommodation & Food Services | 0 (0.0%) | 33 (100.0%) |
| Public Administration | 28 (54.9%) | 23 (45.1%) |
| Total | 167 (34.2%) | 321 (65.8%) |
Education in Wofford Heights
School Enrollment in Wofford Heights
The most common levels of schooling among the 165 students in Wofford Heights are high school (79 | 47.9%), middle school (53 | 32.1%), and elementary school (25 | 15.1%).
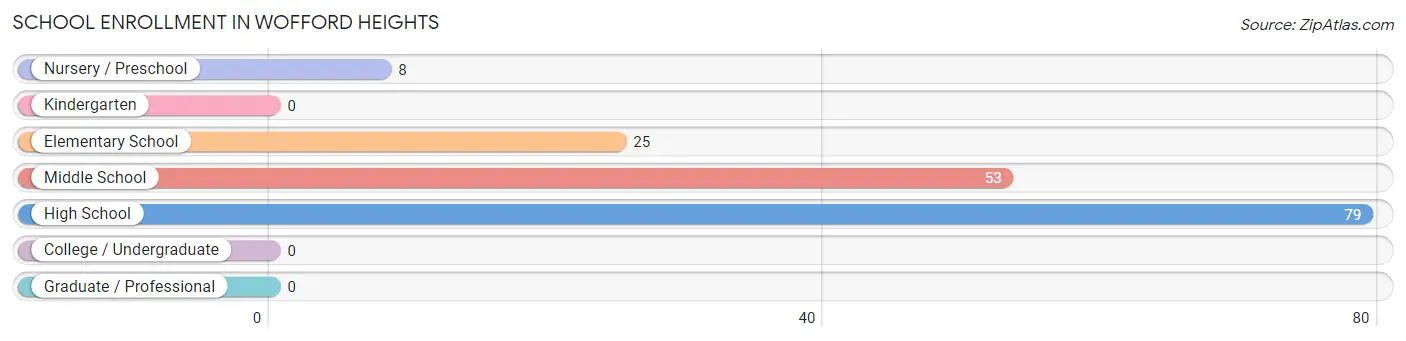
| School Level | # Students | % Students |
| Nursery / Preschool | 8 | 4.9% |
| Kindergarten | 0 | 0.0% |
| Elementary School | 25 | 15.1% |
| Middle School | 53 | 32.1% |
| High School | 79 | 47.9% |
| College / Undergraduate | 0 | 0.0% |
| Graduate / Professional | 0 | 0.0% |
| Total | 165 | 100.0% |
School Enrollment by Age by Funding Source in Wofford Heights
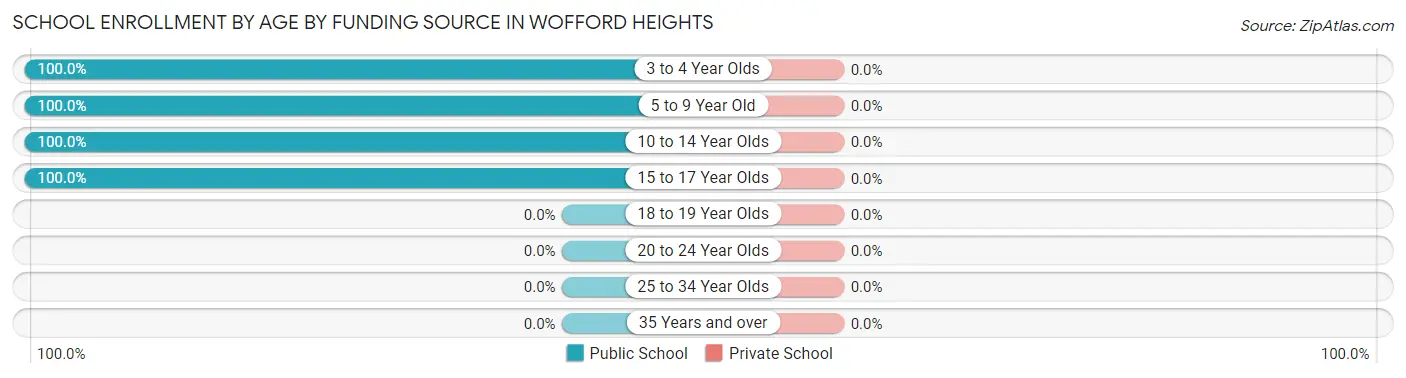
| Age Bracket | Public School | Private School |
| 3 to 4 Year Olds | 8 (100.0%) | 0 (0.0%) |
| 5 to 9 Year Old | 17 (100.0%) | 0 (0.0%) |
| 10 to 14 Year Olds | 85 (100.0%) | 0 (0.0%) |
| 15 to 17 Year Olds | 55 (100.0%) | 0 (0.0%) |
| 18 to 19 Year Olds | 0 (0.0%) | 0 (0.0%) |
| 20 to 24 Year Olds | 0 (0.0%) | 0 (0.0%) |
| 25 to 34 Year Olds | 0 (0.0%) | 0 (0.0%) |
| 35 Years and over | 0 (0.0%) | 0 (0.0%) |
| Total | 165 (100.0%) | 0 (0.0%) |
Educational Attainment by Field of Study in Wofford Heights
Bio, nature & agricultural (63 | 34.2%), business (34 | 18.5%), computers & mathematics (28 | 15.2%), education (27 | 14.7%), and arts & humanities (12 | 6.5%) are the most common fields of study among 184 individuals in Wofford Heights who have obtained a bachelor's degree or higher.
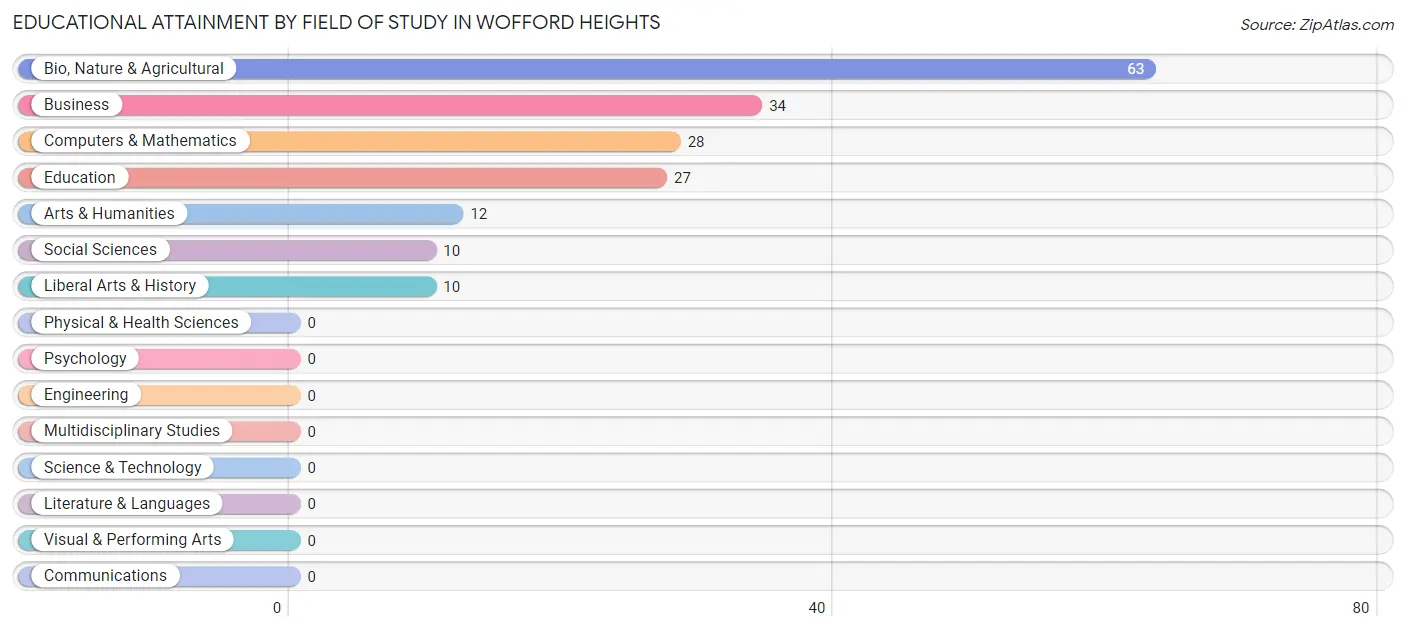
| Field of Study | # Graduates | % Graduates |
| Computers & Mathematics | 28 | 15.2% |
| Bio, Nature & Agricultural | 63 | 34.2% |
| Physical & Health Sciences | 0 | 0.0% |
| Psychology | 0 | 0.0% |
| Social Sciences | 10 | 5.4% |
| Engineering | 0 | 0.0% |
| Multidisciplinary Studies | 0 | 0.0% |
| Science & Technology | 0 | 0.0% |
| Business | 34 | 18.5% |
| Education | 27 | 14.7% |
| Literature & Languages | 0 | 0.0% |
| Liberal Arts & History | 10 | 5.4% |
| Visual & Performing Arts | 0 | 0.0% |
| Communications | 0 | 0.0% |
| Arts & Humanities | 12 | 6.5% |
| Total | 184 | 100.0% |
Transportation & Commute in Wofford Heights
Vehicle Availability by Sex in Wofford Heights
The most prevalent vehicle ownership categories in Wofford Heights are males with 2 vehicles (105, accounting for 62.9%) and females with 2 vehicles (99, making up 32.7%).
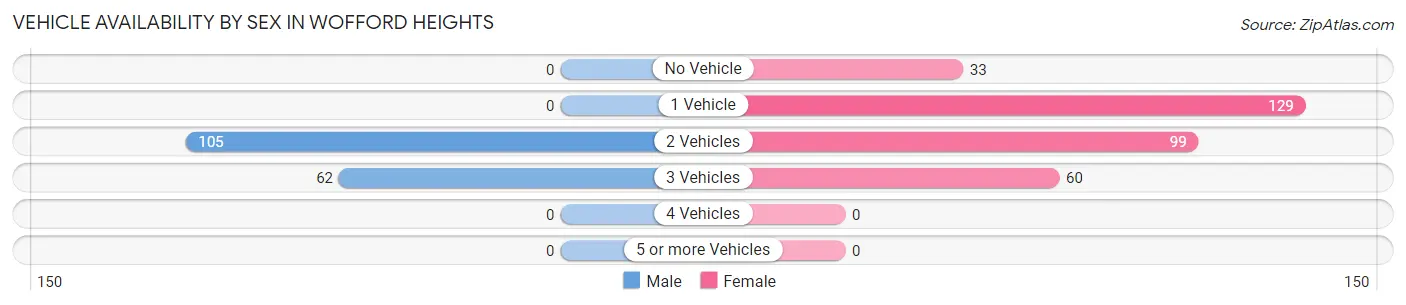
| Vehicles Available | Male | Female |
| No Vehicle | 0 (0.0%) | 33 (10.3%) |
| 1 Vehicle | 0 (0.0%) | 129 (40.2%) |
| 2 Vehicles | 105 (62.9%) | 99 (30.8%) |
| 3 Vehicles | 62 (37.1%) | 60 (18.7%) |
| 4 Vehicles | 0 (0.0%) | 0 (0.0%) |
| 5 or more Vehicles | 0 (0.0%) | 0 (0.0%) |
| Total | 167 (100.0%) | 321 (100.0%) |
Commute Time in Wofford Heights
The most frequently occuring commute durations in Wofford Heights are 20 to 24 minutes (127 commuters, 26.7%), 10 to 14 minutes (115 commuters, 24.2%), and 15 to 19 minutes (105 commuters, 22.1%).
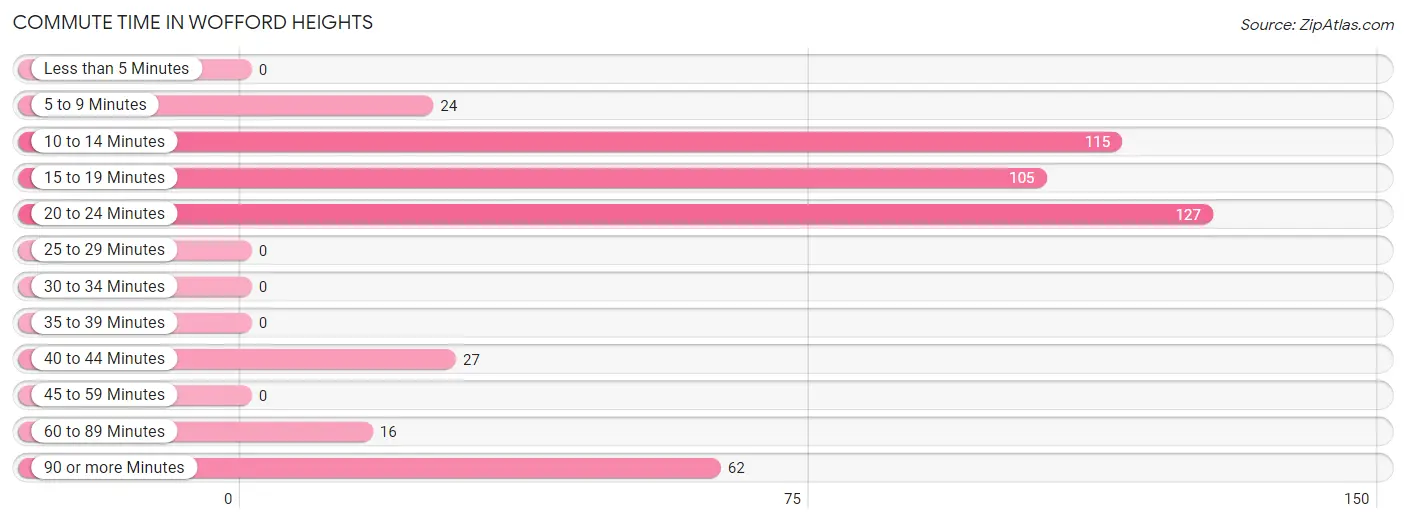
| Commute Time | # Commuters | % Commuters |
| Less than 5 Minutes | 0 | 0.0% |
| 5 to 9 Minutes | 24 | 5.0% |
| 10 to 14 Minutes | 115 | 24.2% |
| 15 to 19 Minutes | 105 | 22.1% |
| 20 to 24 Minutes | 127 | 26.7% |
| 25 to 29 Minutes | 0 | 0.0% |
| 30 to 34 Minutes | 0 | 0.0% |
| 35 to 39 Minutes | 0 | 0.0% |
| 40 to 44 Minutes | 27 | 5.7% |
| 45 to 59 Minutes | 0 | 0.0% |
| 60 to 89 Minutes | 16 | 3.4% |
| 90 or more Minutes | 62 | 13.0% |
Commute Time by Sex in Wofford Heights
The most common commute times in Wofford Heights are 20 to 24 minutes (67 commuters, 40.1%) for males and 15 to 19 minutes (105 commuters, 34.0%) for females.
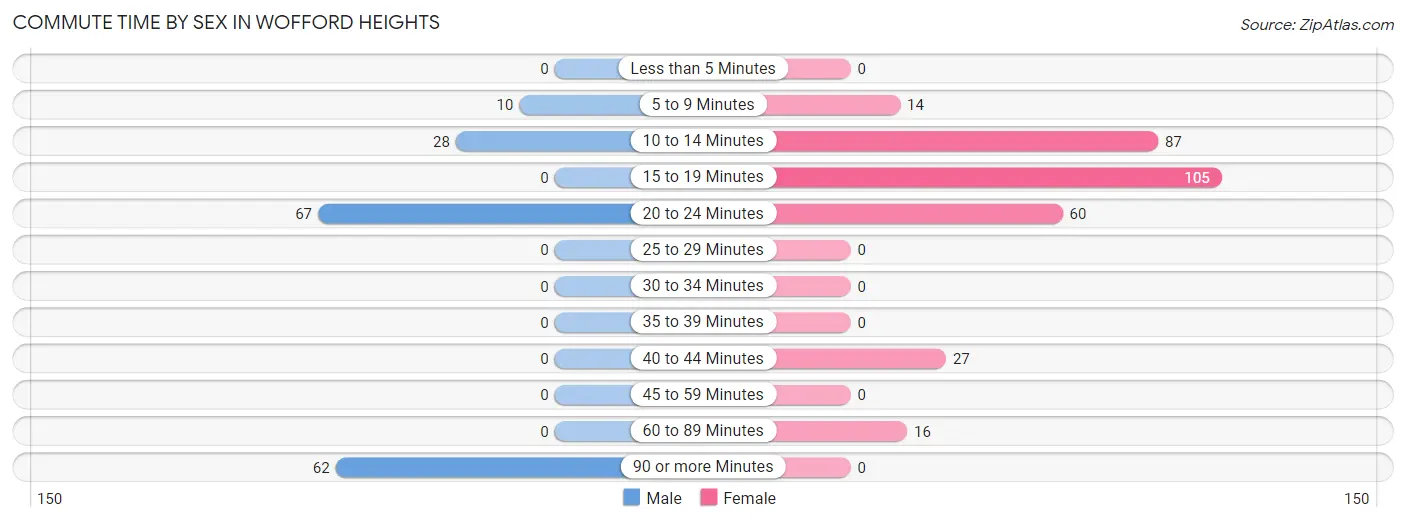
| Commute Time | Male | Female |
| Less than 5 Minutes | 0 (0.0%) | 0 (0.0%) |
| 5 to 9 Minutes | 10 (6.0%) | 14 (4.5%) |
| 10 to 14 Minutes | 28 (16.8%) | 87 (28.2%) |
| 15 to 19 Minutes | 0 (0.0%) | 105 (34.0%) |
| 20 to 24 Minutes | 67 (40.1%) | 60 (19.4%) |
| 25 to 29 Minutes | 0 (0.0%) | 0 (0.0%) |
| 30 to 34 Minutes | 0 (0.0%) | 0 (0.0%) |
| 35 to 39 Minutes | 0 (0.0%) | 0 (0.0%) |
| 40 to 44 Minutes | 0 (0.0%) | 27 (8.7%) |
| 45 to 59 Minutes | 0 (0.0%) | 0 (0.0%) |
| 60 to 89 Minutes | 0 (0.0%) | 16 (5.2%) |
| 90 or more Minutes | 62 (37.1%) | 0 (0.0%) |
Time of Departure to Work by Sex in Wofford Heights
The most frequent times of departure to work in Wofford Heights are 5:30 AM to 5:59 AM (67, 40.1%) for males and 7:00 AM to 7:29 AM (101, 32.7%) for females.
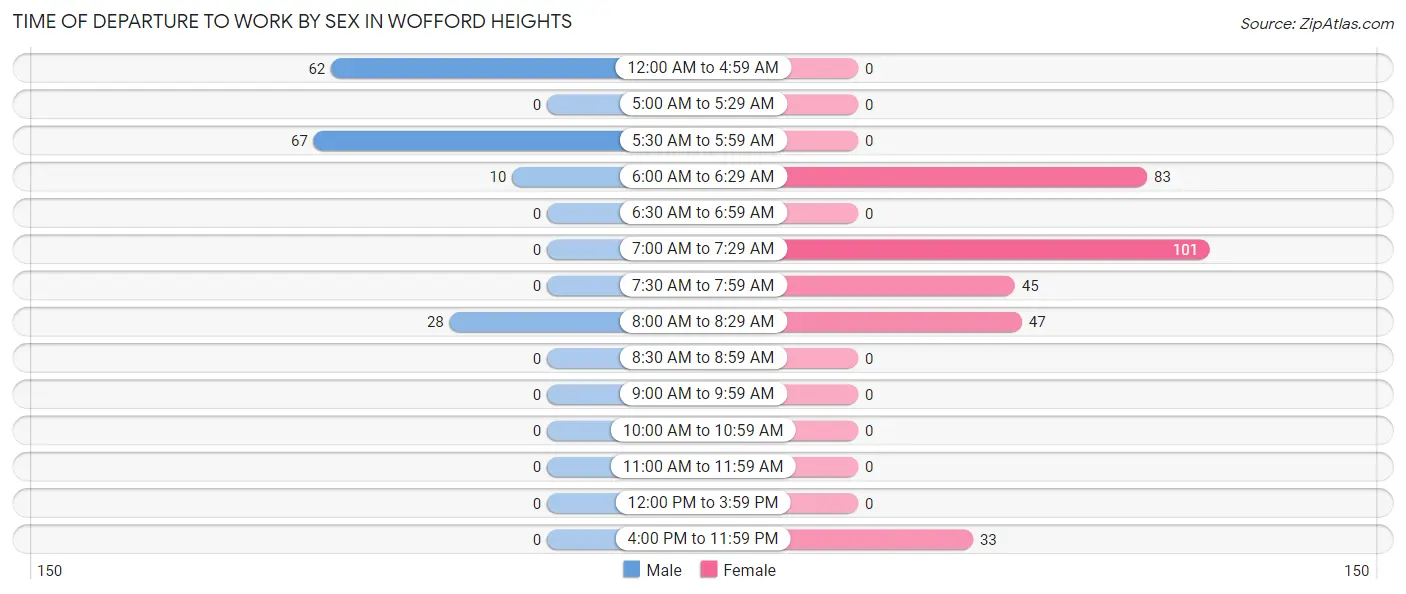
| Time of Departure | Male | Female |
| 12:00 AM to 4:59 AM | 62 (37.1%) | 0 (0.0%) |
| 5:00 AM to 5:29 AM | 0 (0.0%) | 0 (0.0%) |
| 5:30 AM to 5:59 AM | 67 (40.1%) | 0 (0.0%) |
| 6:00 AM to 6:29 AM | 10 (6.0%) | 83 (26.9%) |
| 6:30 AM to 6:59 AM | 0 (0.0%) | 0 (0.0%) |
| 7:00 AM to 7:29 AM | 0 (0.0%) | 101 (32.7%) |
| 7:30 AM to 7:59 AM | 0 (0.0%) | 45 (14.6%) |
| 8:00 AM to 8:29 AM | 28 (16.8%) | 47 (15.2%) |
| 8:30 AM to 8:59 AM | 0 (0.0%) | 0 (0.0%) |
| 9:00 AM to 9:59 AM | 0 (0.0%) | 0 (0.0%) |
| 10:00 AM to 10:59 AM | 0 (0.0%) | 0 (0.0%) |
| 11:00 AM to 11:59 AM | 0 (0.0%) | 0 (0.0%) |
| 12:00 PM to 3:59 PM | 0 (0.0%) | 0 (0.0%) |
| 4:00 PM to 11:59 PM | 0 (0.0%) | 33 (10.7%) |
| Total | 167 (100.0%) | 309 (100.0%) |
Housing Occupancy in Wofford Heights
Occupancy by Ownership in Wofford Heights
Of the total 1,211 dwellings in Wofford Heights, owner-occupied units account for 901 (74.4%), while renter-occupied units make up 310 (25.6%).
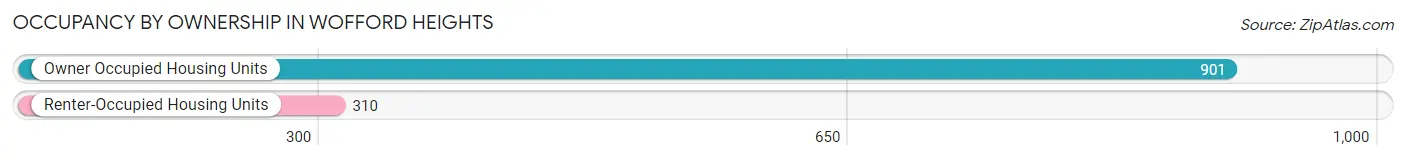
| Occupancy | # Housing Units | % Housing Units |
| Owner Occupied Housing Units | 901 | 74.4% |
| Renter-Occupied Housing Units | 310 | 25.6% |
| Total Occupied Housing Units | 1,211 | 100.0% |
Occupancy by Household Size in Wofford Heights
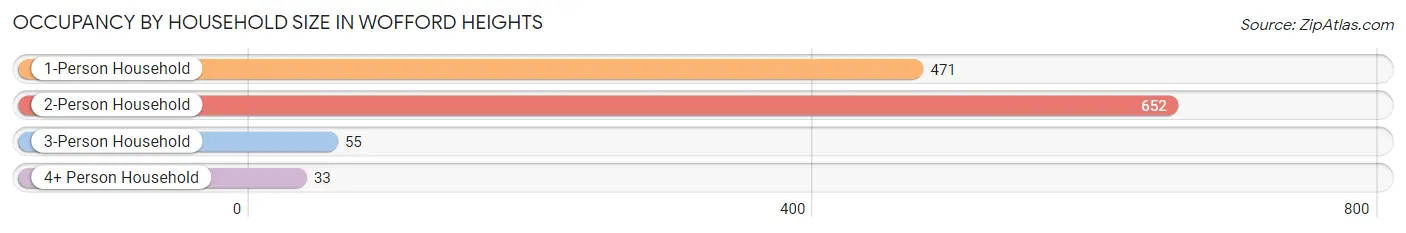
| Household Size | # Housing Units | % Housing Units |
| 1-Person Household | 471 | 38.9% |
| 2-Person Household | 652 | 53.8% |
| 3-Person Household | 55 | 4.5% |
| 4+ Person Household | 33 | 2.7% |
| Total Housing Units | 1,211 | 100.0% |
Occupancy by Ownership by Household Size in Wofford Heights
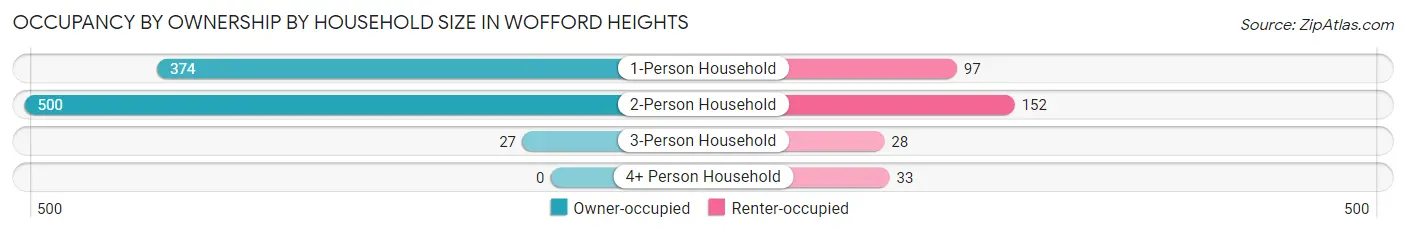
| Household Size | Owner-occupied | Renter-occupied |
| 1-Person Household | 374 (79.4%) | 97 (20.6%) |
| 2-Person Household | 500 (76.7%) | 152 (23.3%) |
| 3-Person Household | 27 (49.1%) | 28 (50.9%) |
| 4+ Person Household | 0 (0.0%) | 33 (100.0%) |
| Total Housing Units | 901 (74.4%) | 310 (25.6%) |
Occupancy by Educational Attainment in Wofford Heights
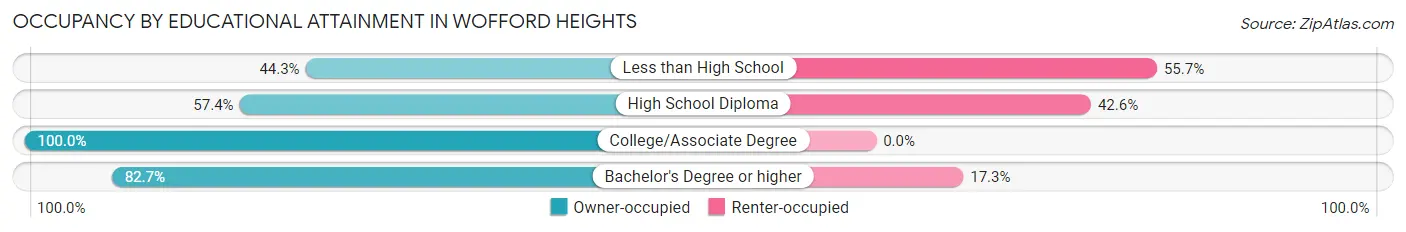
| Household Size | Owner-occupied | Renter-occupied |
| Less than High School | 78 (44.3%) | 98 (55.7%) |
| High School Diploma | 248 (57.4%) | 184 (42.6%) |
| College/Associate Degree | 441 (100.0%) | 0 (0.0%) |
| Bachelor's Degree or higher | 134 (82.7%) | 28 (17.3%) |
Occupancy by Age of Householder in Wofford Heights
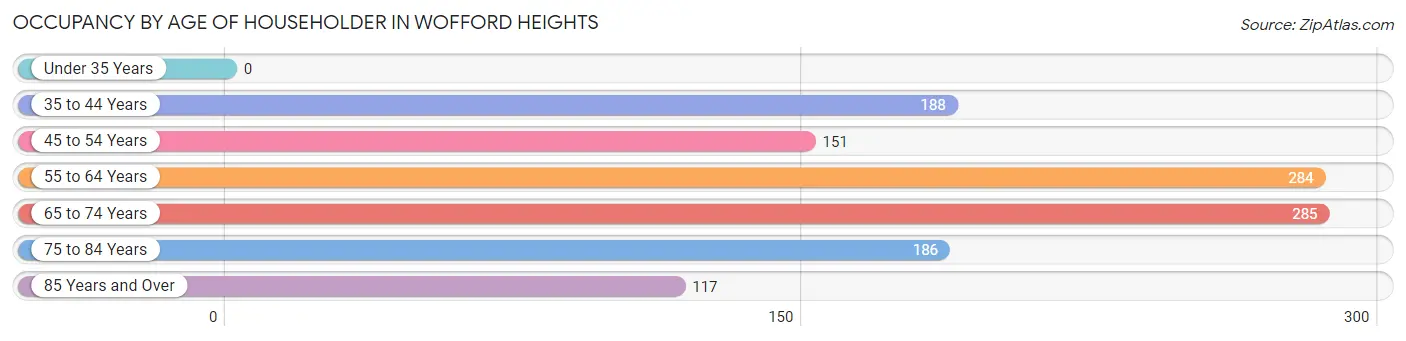
| Age Bracket | # Households | % Households |
| Under 35 Years | 0 | 0.0% |
| 35 to 44 Years | 188 | 15.5% |
| 45 to 54 Years | 151 | 12.5% |
| 55 to 64 Years | 284 | 23.4% |
| 65 to 74 Years | 285 | 23.5% |
| 75 to 84 Years | 186 | 15.4% |
| 85 Years and Over | 117 | 9.7% |
| Total | 1,211 | 100.0% |
Housing Finances in Wofford Heights
Median Income by Occupancy in Wofford Heights
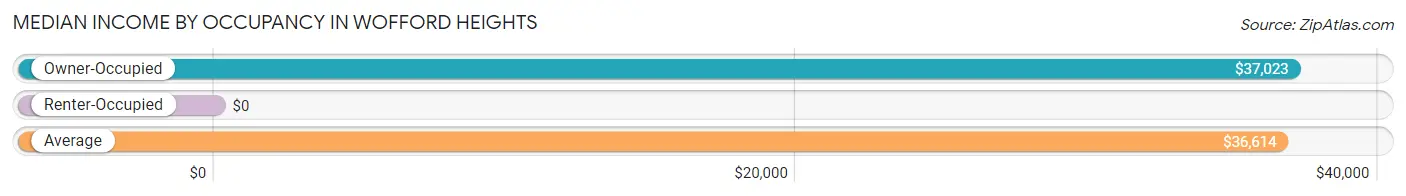
| Occupancy Type | # Households | Median Income |
| Owner-Occupied | 901 (74.4%) | $37,023 |
| Renter-Occupied | 310 (25.6%) | $0 |
| Average | 1,211 (100.0%) | $36,614 |
Occupancy by Householder Income Bracket in Wofford Heights
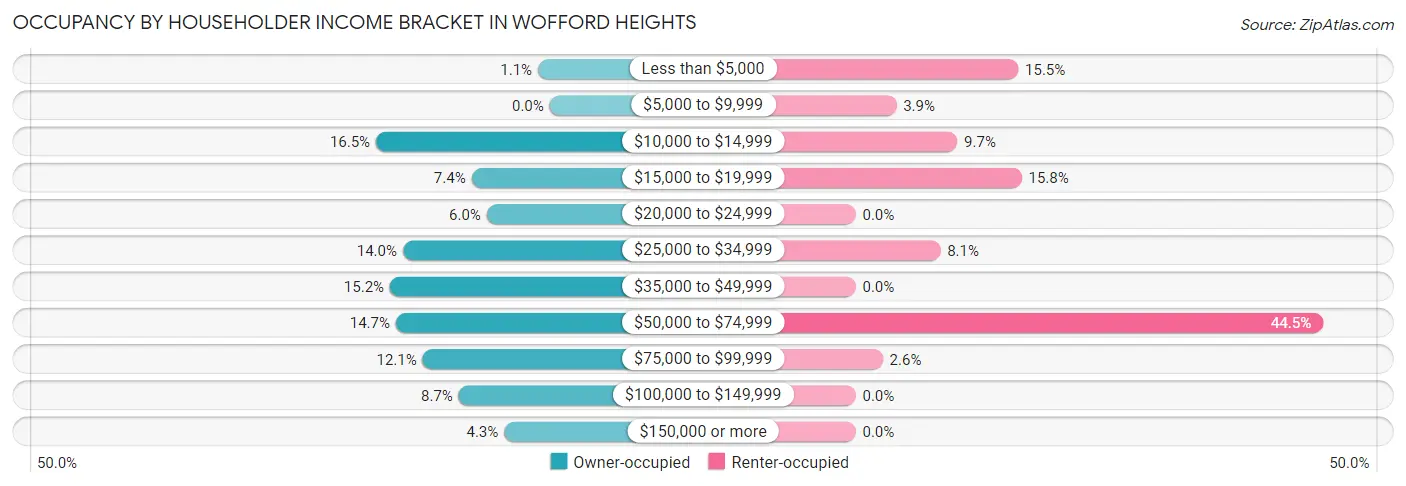
| Income Bracket | Owner-occupied | Renter-occupied |
| Less than $5,000 | 10 (1.1%) | 48 (15.5%) |
| $5,000 to $9,999 | 0 (0.0%) | 12 (3.9%) |
| $10,000 to $14,999 | 149 (16.5%) | 30 (9.7%) |
| $15,000 to $19,999 | 67 (7.4%) | 49 (15.8%) |
| $20,000 to $24,999 | 54 (6.0%) | 0 (0.0%) |
| $25,000 to $34,999 | 126 (14.0%) | 25 (8.1%) |
| $35,000 to $49,999 | 137 (15.2%) | 0 (0.0%) |
| $50,000 to $74,999 | 132 (14.6%) | 138 (44.5%) |
| $75,000 to $99,999 | 109 (12.1%) | 8 (2.6%) |
| $100,000 to $149,999 | 78 (8.7%) | 0 (0.0%) |
| $150,000 or more | 39 (4.3%) | 0 (0.0%) |
| Total | 901 (100.0%) | 310 (100.0%) |
Monthly Housing Cost Tiers in Wofford Heights
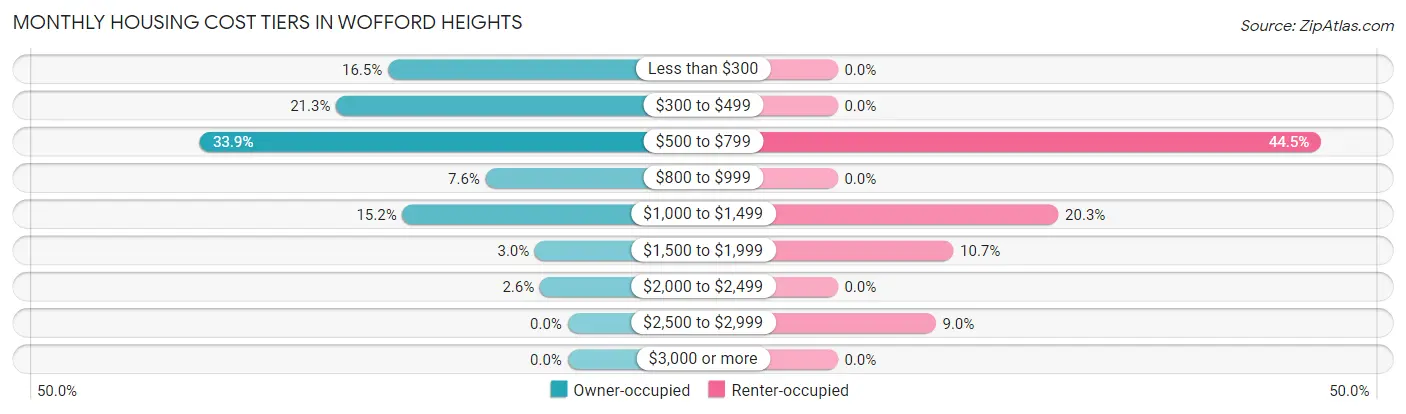
| Monthly Cost | Owner-occupied | Renter-occupied |
| Less than $300 | 149 (16.5%) | 0 (0.0%) |
| $300 to $499 | 192 (21.3%) | 0 (0.0%) |
| $500 to $799 | 305 (33.9%) | 138 (44.5%) |
| $800 to $999 | 68 (7.5%) | 0 (0.0%) |
| $1,000 to $1,499 | 137 (15.2%) | 63 (20.3%) |
| $1,500 to $1,999 | 27 (3.0%) | 33 (10.6%) |
| $2,000 to $2,499 | 23 (2.5%) | 0 (0.0%) |
| $2,500 to $2,999 | 0 (0.0%) | 28 (9.0%) |
| $3,000 or more | 0 (0.0%) | 0 (0.0%) |
| Total | 901 (100.0%) | 310 (100.0%) |
Physical Housing Characteristics in Wofford Heights
Housing Structures in Wofford Heights
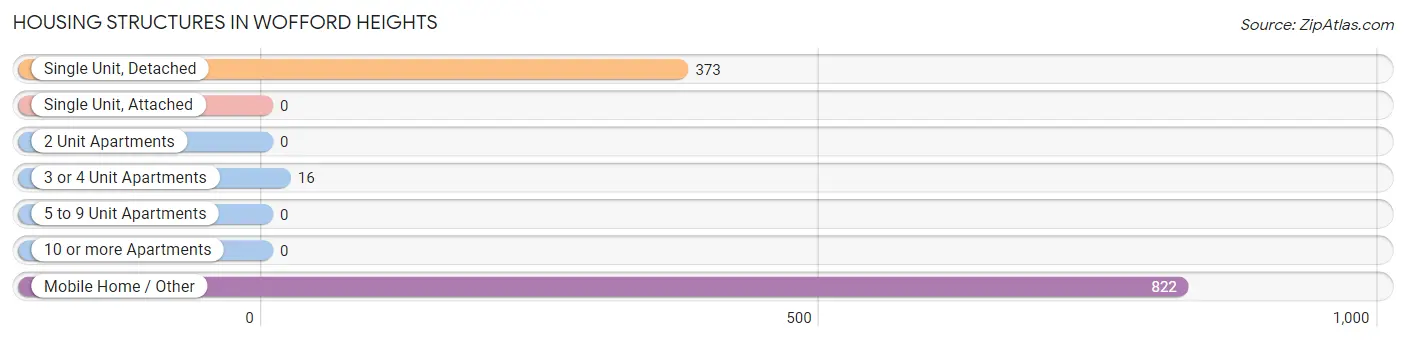
| Structure Type | # Housing Units | % Housing Units |
| Single Unit, Detached | 373 | 30.8% |
| Single Unit, Attached | 0 | 0.0% |
| 2 Unit Apartments | 0 | 0.0% |
| 3 or 4 Unit Apartments | 16 | 1.3% |
| 5 to 9 Unit Apartments | 0 | 0.0% |
| 10 or more Apartments | 0 | 0.0% |
| Mobile Home / Other | 822 | 67.9% |
| Total | 1,211 | 100.0% |
Housing Structures by Occupancy in Wofford Heights
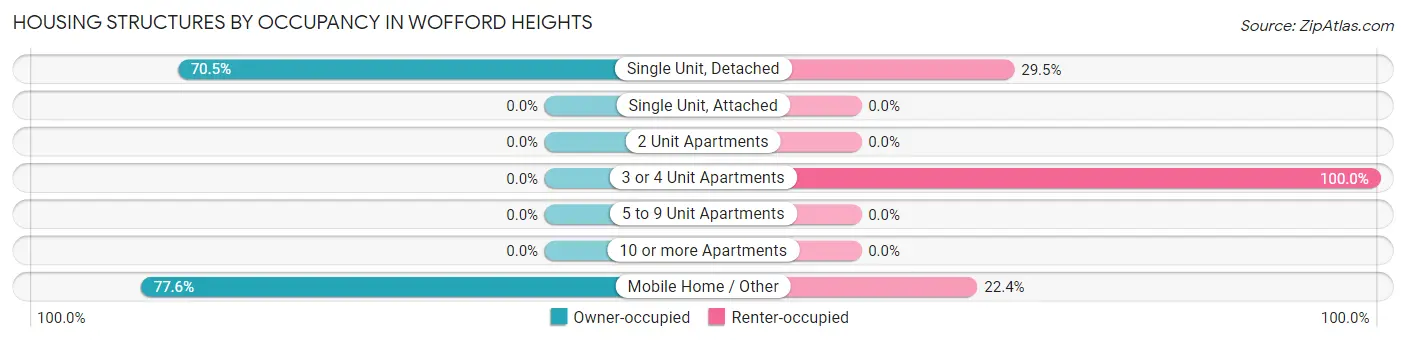
| Structure Type | Owner-occupied | Renter-occupied |
| Single Unit, Detached | 263 (70.5%) | 110 (29.5%) |
| Single Unit, Attached | 0 (0.0%) | 0 (0.0%) |
| 2 Unit Apartments | 0 (0.0%) | 0 (0.0%) |
| 3 or 4 Unit Apartments | 0 (0.0%) | 16 (100.0%) |
| 5 to 9 Unit Apartments | 0 (0.0%) | 0 (0.0%) |
| 10 or more Apartments | 0 (0.0%) | 0 (0.0%) |
| Mobile Home / Other | 638 (77.6%) | 184 (22.4%) |
| Total | 901 (74.4%) | 310 (25.6%) |
Housing Structures by Number of Rooms in Wofford Heights
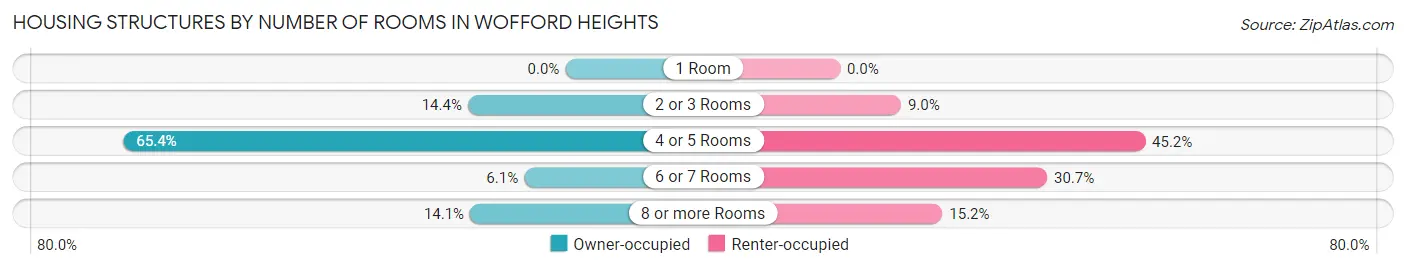
| Number of Rooms | Owner-occupied | Renter-occupied |
| 1 Room | 0 (0.0%) | 0 (0.0%) |
| 2 or 3 Rooms | 130 (14.4%) | 28 (9.0%) |
| 4 or 5 Rooms | 589 (65.4%) | 140 (45.2%) |
| 6 or 7 Rooms | 55 (6.1%) | 95 (30.6%) |
| 8 or more Rooms | 127 (14.1%) | 47 (15.2%) |
| Total | 901 (100.0%) | 310 (100.0%) |
Housing Structure by Heating Type in Wofford Heights
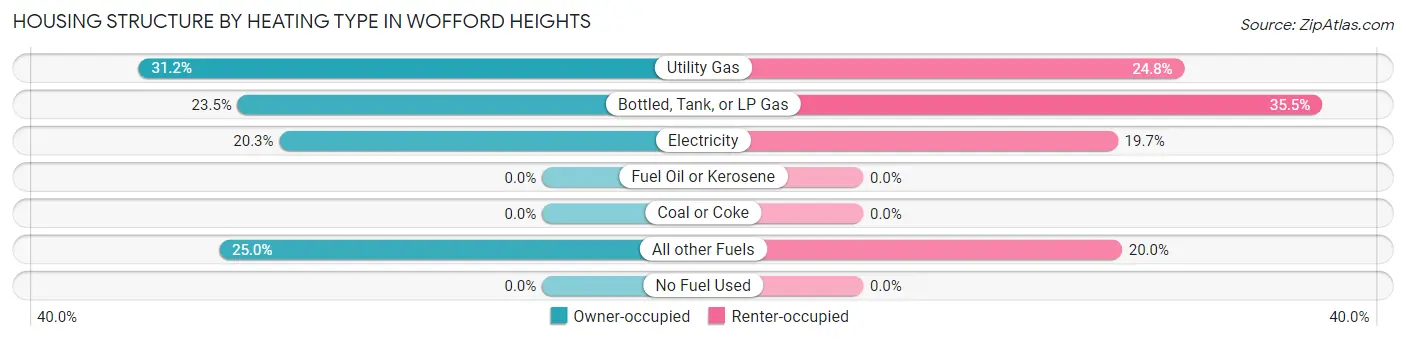
| Heating Type | Owner-occupied | Renter-occupied |
| Utility Gas | 281 (31.2%) | 77 (24.8%) |
| Bottled, Tank, or LP Gas | 212 (23.5%) | 110 (35.5%) |
| Electricity | 183 (20.3%) | 61 (19.7%) |
| Fuel Oil or Kerosene | 0 (0.0%) | 0 (0.0%) |
| Coal or Coke | 0 (0.0%) | 0 (0.0%) |
| All other Fuels | 225 (25.0%) | 62 (20.0%) |
| No Fuel Used | 0 (0.0%) | 0 (0.0%) |
| Total | 901 (100.0%) | 310 (100.0%) |
Household Vehicle Usage in Wofford Heights
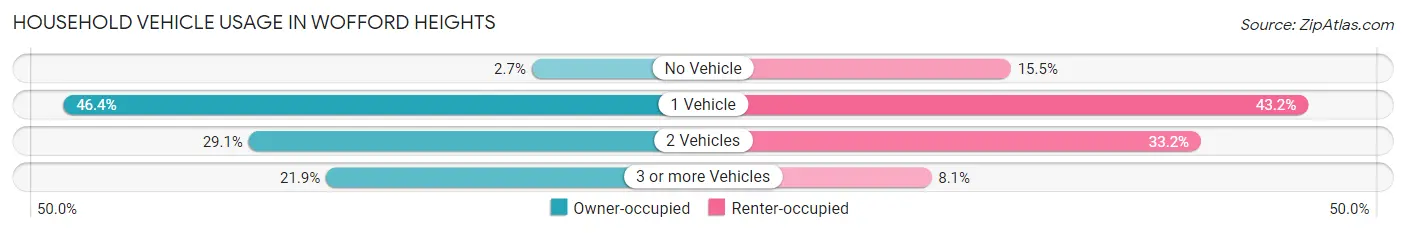
| Vehicles per Household | Owner-occupied | Renter-occupied |
| No Vehicle | 24 (2.7%) | 48 (15.5%) |
| 1 Vehicle | 418 (46.4%) | 134 (43.2%) |
| 2 Vehicles | 262 (29.1%) | 103 (33.2%) |
| 3 or more Vehicles | 197 (21.9%) | 25 (8.1%) |
| Total | 901 (100.0%) | 310 (100.0%) |
Real Estate & Mortgages in Wofford Heights
Real Estate and Mortgage Overview in Wofford Heights
| Characteristic | Without Mortgage | With Mortgage |
| Housing Units | 621 | 280 |
| Median Property Value | $120,600 | $269,000 |
| Median Household Income | $32,607 | $12 |
| Monthly Housing Costs | $483 | $0 |
| Real Estate Taxes | $1,185 | $48 |
Property Value by Mortgage Status in Wofford Heights
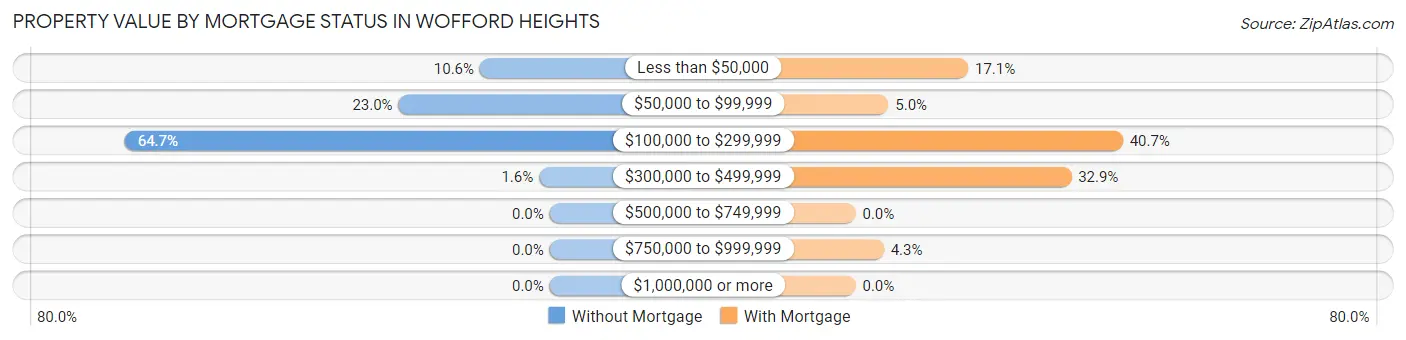
| Property Value | Without Mortgage | With Mortgage |
| Less than $50,000 | 66 (10.6%) | 48 (17.1%) |
| $50,000 to $99,999 | 143 (23.0%) | 14 (5.0%) |
| $100,000 to $299,999 | 402 (64.7%) | 114 (40.7%) |
| $300,000 to $499,999 | 10 (1.6%) | 92 (32.9%) |
| $500,000 to $749,999 | 0 (0.0%) | 0 (0.0%) |
| $750,000 to $999,999 | 0 (0.0%) | 12 (4.3%) |
| $1,000,000 or more | 0 (0.0%) | 0 (0.0%) |
| Total | 621 (100.0%) | 280 (100.0%) |
Household Income by Mortgage Status in Wofford Heights
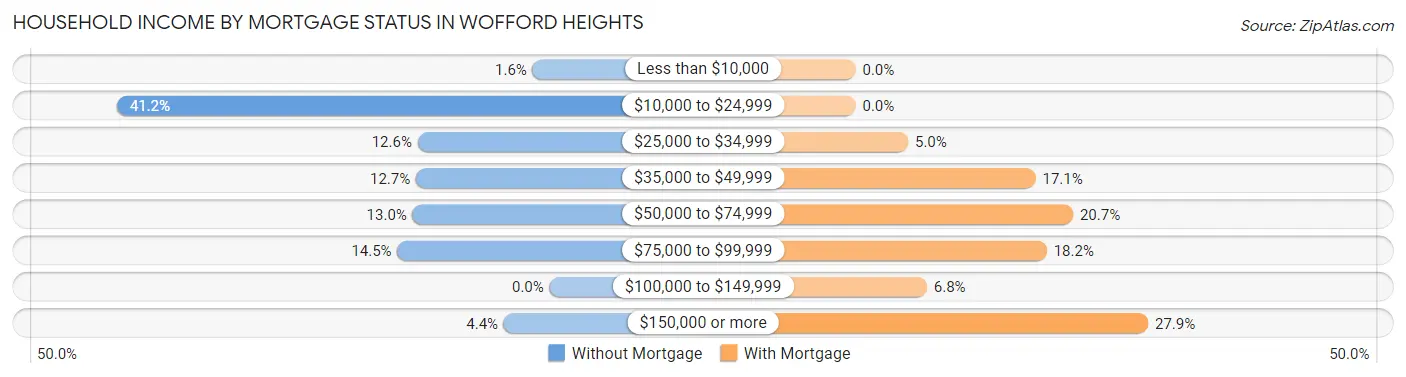
| Household Income | Without Mortgage | With Mortgage |
| Less than $10,000 | 10 (1.6%) | 0 (0.0%) |
| $10,000 to $24,999 | 256 (41.2%) | 0 (0.0%) |
| $25,000 to $34,999 | 78 (12.6%) | 14 (5.0%) |
| $35,000 to $49,999 | 79 (12.7%) | 48 (17.1%) |
| $50,000 to $74,999 | 81 (13.0%) | 58 (20.7%) |
| $75,000 to $99,999 | 90 (14.5%) | 51 (18.2%) |
| $100,000 to $149,999 | 0 (0.0%) | 19 (6.8%) |
| $150,000 or more | 27 (4.3%) | 78 (27.9%) |
| Total | 621 (100.0%) | 280 (100.0%) |
Property Value to Household Income Ratio in Wofford Heights
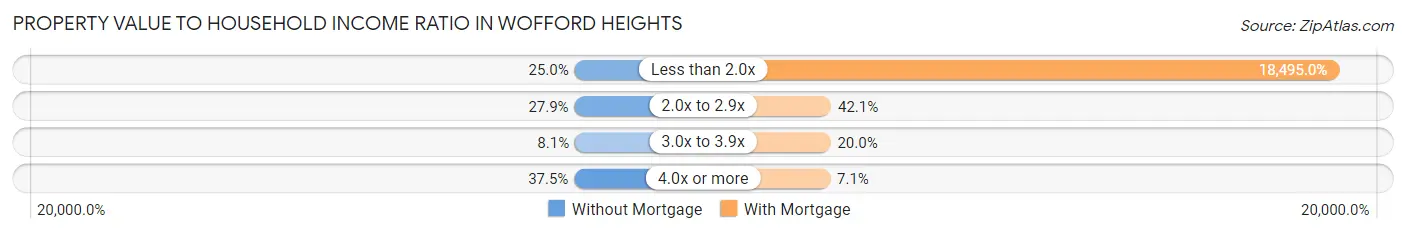
| Value-to-Income Ratio | Without Mortgage | With Mortgage |
| Less than 2.0x | 155 (25.0%) | 51,786 (18,495.0%) |
| 2.0x to 2.9x | 173 (27.9%) | 118 (42.1%) |
| 3.0x to 3.9x | 50 (8.1%) | 56 (20.0%) |
| 4.0x or more | 233 (37.5%) | 20 (7.1%) |
| Total | 621 (100.0%) | 280 (100.0%) |
Real Estate Taxes by Mortgage Status in Wofford Heights
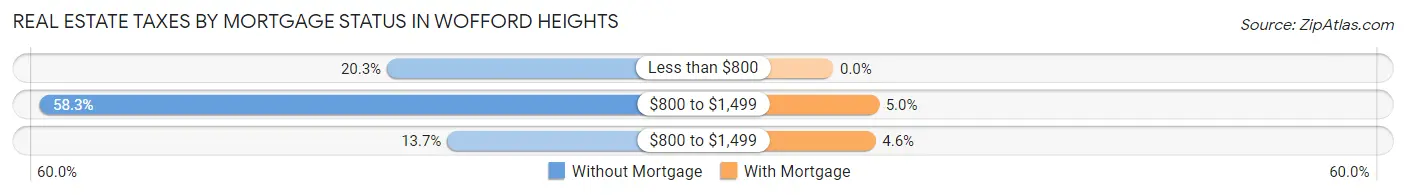
| Property Taxes | Without Mortgage | With Mortgage |
| Less than $800 | 126 (20.3%) | 0 (0.0%) |
| $800 to $1,499 | 362 (58.3%) | 14 (5.0%) |
| $800 to $1,499 | 85 (13.7%) | 13 (4.6%) |
| Total | 621 (100.0%) | 280 (100.0%) |
Health & Disability in Wofford Heights
Health Insurance Coverage by Age in Wofford Heights
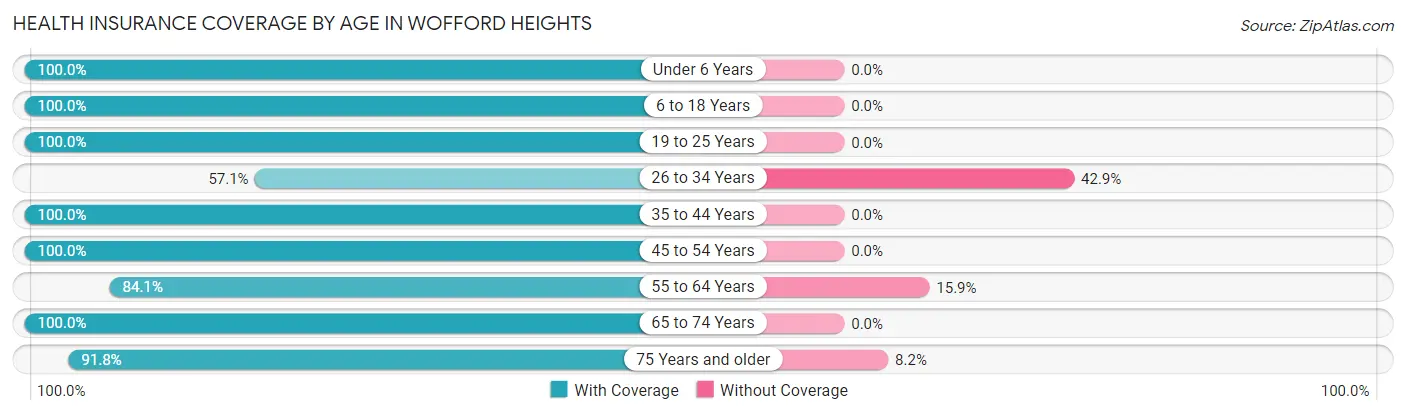
| Age Bracket | With Coverage | Without Coverage |
| Under 6 Years | 16 (100.0%) | 0 (0.0%) |
| 6 to 18 Years | 157 (100.0%) | 0 (0.0%) |
| 19 to 25 Years | 170 (100.0%) | 0 (0.0%) |
| 26 to 34 Years | 48 (57.1%) | 36 (42.9%) |
| 35 to 44 Years | 207 (100.0%) | 0 (0.0%) |
| 45 to 54 Years | 184 (100.0%) | 0 (0.0%) |
| 55 to 64 Years | 504 (84.1%) | 95 (15.9%) |
| 65 to 74 Years | 471 (100.0%) | 0 (0.0%) |
| 75 Years and older | 348 (91.8%) | 31 (8.2%) |
| Total | 2,105 (92.8%) | 162 (7.1%) |
Health Insurance Coverage by Citizenship Status in Wofford Heights
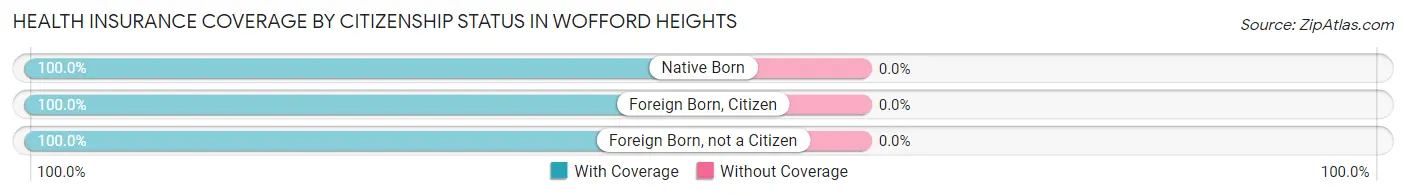
| Citizenship Status | With Coverage | Without Coverage |
| Native Born | 16 (100.0%) | 0 (0.0%) |
| Foreign Born, Citizen | 157 (100.0%) | 0 (0.0%) |
| Foreign Born, not a Citizen | 170 (100.0%) | 0 (0.0%) |
Health Insurance Coverage by Household Income in Wofford Heights
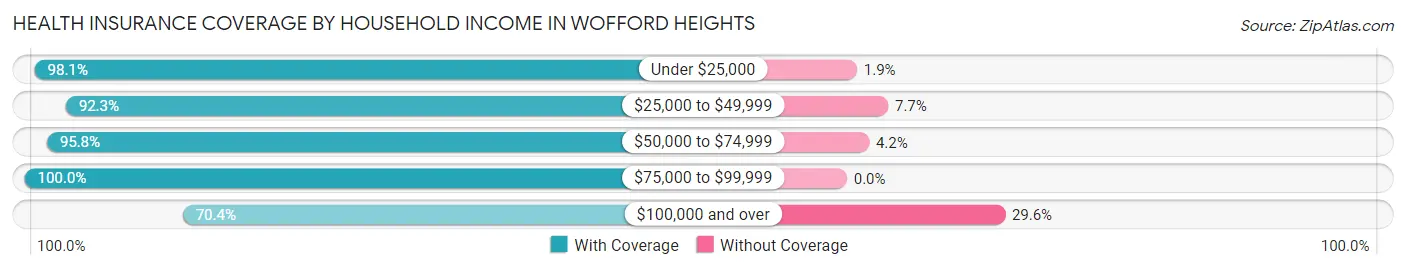
| Household Income | With Coverage | Without Coverage |
| Under $25,000 | 627 (98.1%) | 12 (1.9%) |
| $25,000 to $49,999 | 573 (92.3%) | 48 (7.7%) |
| $50,000 to $74,999 | 507 (95.8%) | 22 (4.2%) |
| $75,000 to $99,999 | 208 (100.0%) | 0 (0.0%) |
| $100,000 and over | 190 (70.4%) | 80 (29.6%) |
Public vs Private Health Insurance Coverage by Age in Wofford Heights
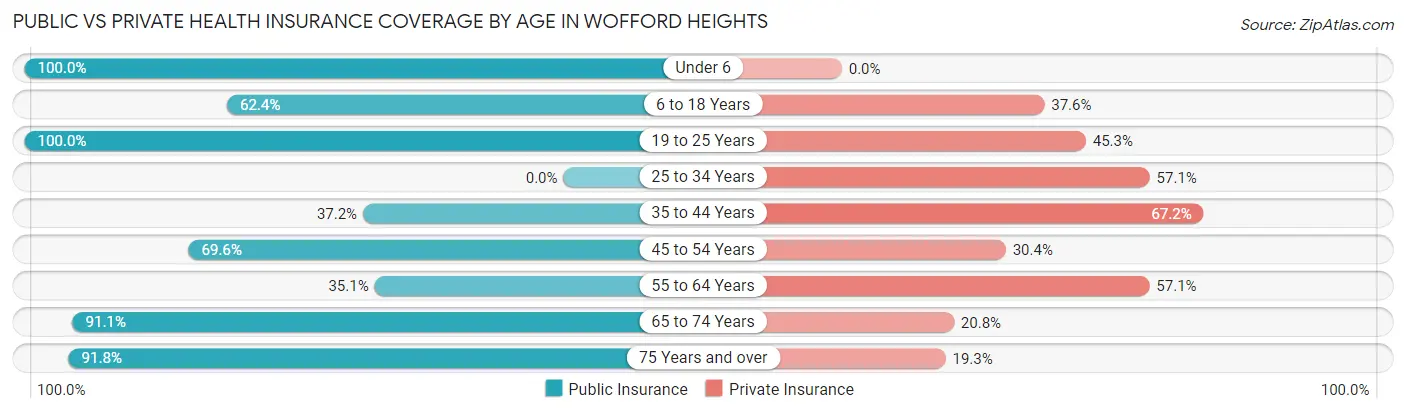
| Age Bracket | Public Insurance | Private Insurance |
| Under 6 | 16 (100.0%) | 0 (0.0%) |
| 6 to 18 Years | 98 (62.4%) | 59 (37.6%) |
| 19 to 25 Years | 170 (100.0%) | 77 (45.3%) |
| 25 to 34 Years | 0 (0.0%) | 48 (57.1%) |
| 35 to 44 Years | 77 (37.2%) | 139 (67.1%) |
| 45 to 54 Years | 128 (69.6%) | 56 (30.4%) |
| 55 to 64 Years | 210 (35.1%) | 342 (57.1%) |
| 65 to 74 Years | 429 (91.1%) | 98 (20.8%) |
| 75 Years and over | 348 (91.8%) | 73 (19.3%) |
| Total | 1,476 (65.1%) | 892 (39.4%) |
Disability Status by Sex by Age in Wofford Heights
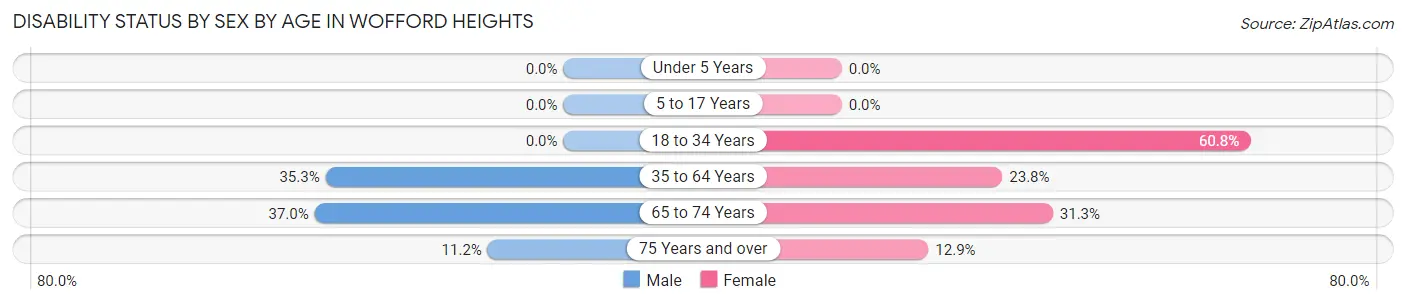
| Age Bracket | Male | Female |
| Under 5 Years | 0 (0.0%) | 0 (0.0%) |
| 5 to 17 Years | 0 (0.0%) | 0 (0.0%) |
| 18 to 34 Years | 0 (0.0%) | 48 (60.8%) |
| 35 to 64 Years | 160 (35.3%) | 128 (23.8%) |
| 65 to 74 Years | 75 (36.9%) | 84 (31.3%) |
| 75 Years and over | 19 (11.2%) | 27 (12.9%) |
Disability Class by Sex by Age in Wofford Heights
Disability Class: Hearing Difficulty
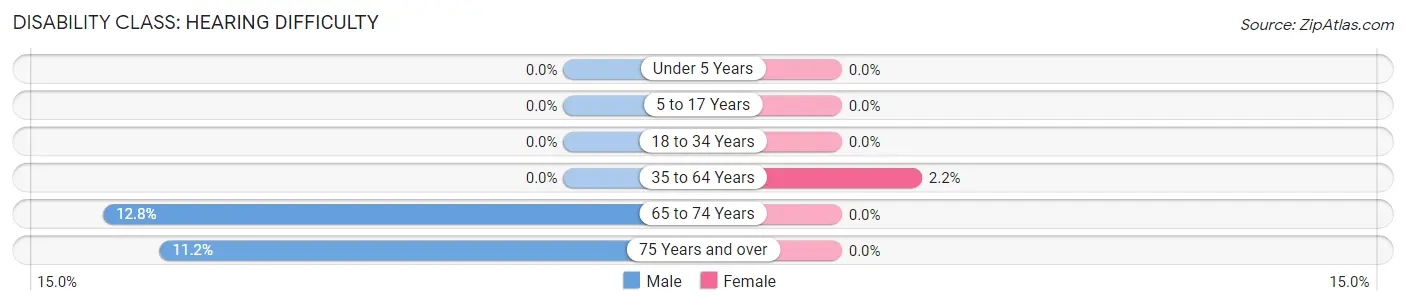
| Age Bracket | Male | Female |
| Under 5 Years | 0 (0.0%) | 0 (0.0%) |
| 5 to 17 Years | 0 (0.0%) | 0 (0.0%) |
| 18 to 34 Years | 0 (0.0%) | 0 (0.0%) |
| 35 to 64 Years | 0 (0.0%) | 12 (2.2%) |
| 65 to 74 Years | 26 (12.8%) | 0 (0.0%) |
| 75 Years and over | 19 (11.2%) | 0 (0.0%) |
Disability Class: Vision Difficulty
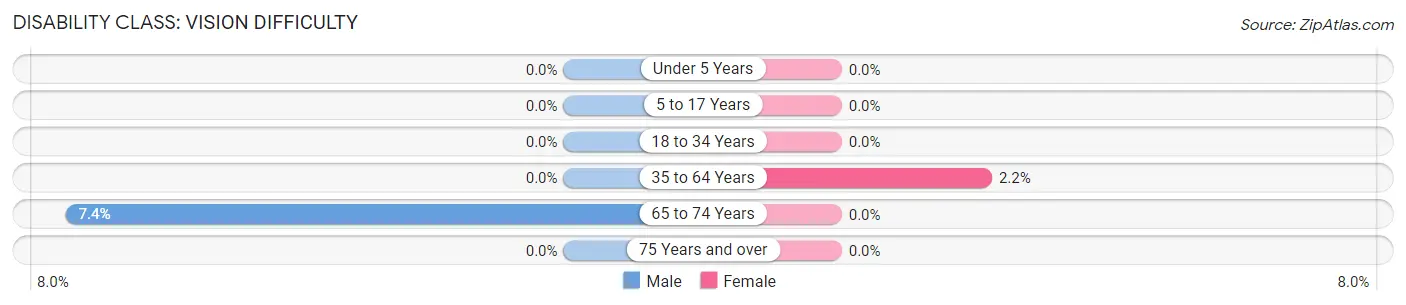
| Age Bracket | Male | Female |
| Under 5 Years | 0 (0.0%) | 0 (0.0%) |
| 5 to 17 Years | 0 (0.0%) | 0 (0.0%) |
| 18 to 34 Years | 0 (0.0%) | 0 (0.0%) |
| 35 to 64 Years | 0 (0.0%) | 12 (2.2%) |
| 65 to 74 Years | 15 (7.4%) | 0 (0.0%) |
| 75 Years and over | 0 (0.0%) | 0 (0.0%) |
Disability Class: Cognitive Difficulty
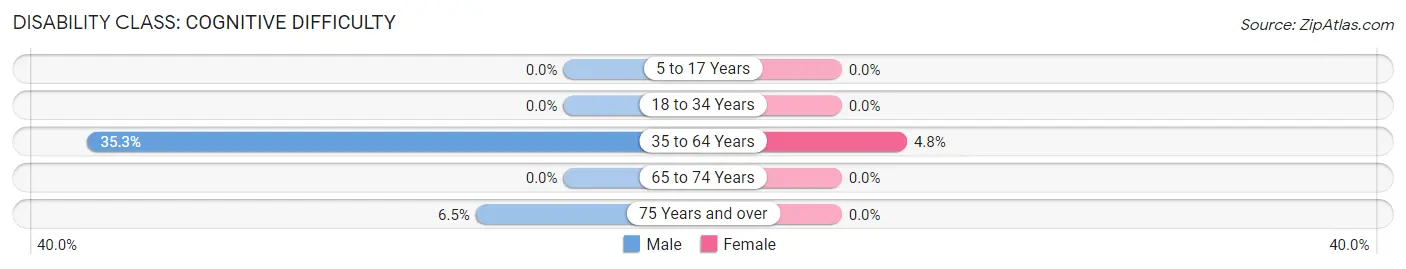
| Age Bracket | Male | Female |
| 5 to 17 Years | 0 (0.0%) | 0 (0.0%) |
| 18 to 34 Years | 0 (0.0%) | 0 (0.0%) |
| 35 to 64 Years | 160 (35.3%) | 26 (4.8%) |
| 65 to 74 Years | 0 (0.0%) | 0 (0.0%) |
| 75 Years and over | 11 (6.5%) | 0 (0.0%) |
Disability Class: Ambulatory Difficulty
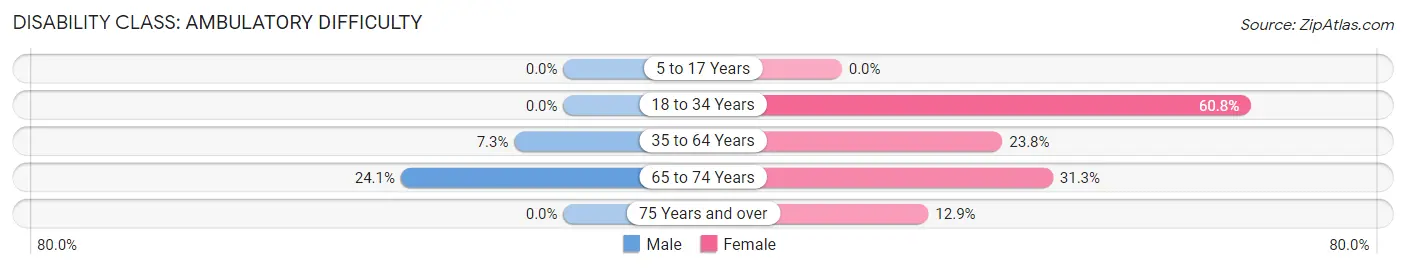
| Age Bracket | Male | Female |
| 5 to 17 Years | 0 (0.0%) | 0 (0.0%) |
| 18 to 34 Years | 0 (0.0%) | 48 (60.8%) |
| 35 to 64 Years | 33 (7.3%) | 128 (23.8%) |
| 65 to 74 Years | 49 (24.1%) | 84 (31.3%) |
| 75 Years and over | 0 (0.0%) | 27 (12.9%) |
Disability Class: Self-Care Difficulty
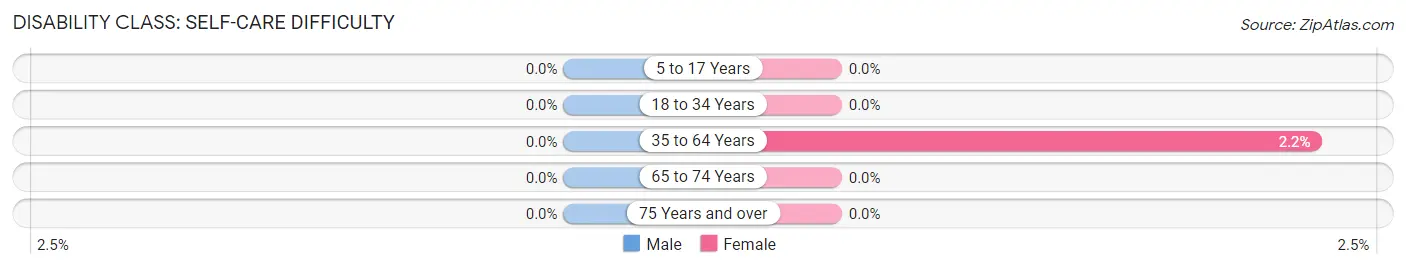
| Age Bracket | Male | Female |
| 5 to 17 Years | 0 (0.0%) | 0 (0.0%) |
| 18 to 34 Years | 0 (0.0%) | 0 (0.0%) |
| 35 to 64 Years | 0 (0.0%) | 12 (2.2%) |
| 65 to 74 Years | 0 (0.0%) | 0 (0.0%) |
| 75 Years and over | 0 (0.0%) | 0 (0.0%) |
Technology Access in Wofford Heights
Computing Device Access in Wofford Heights
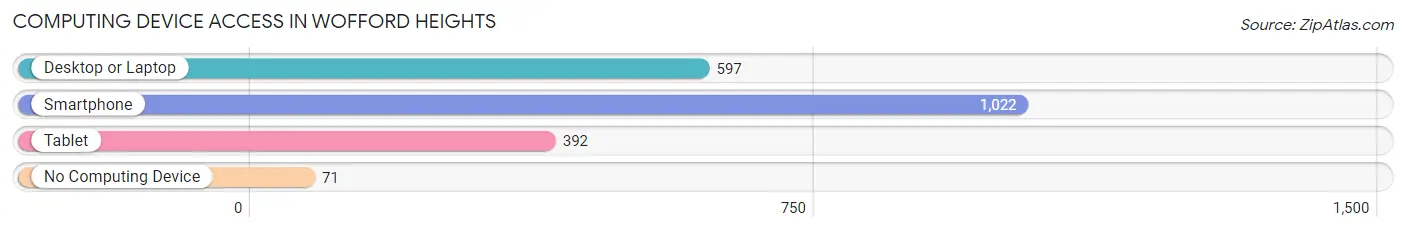
| Device Type | # Households | % Households |
| Desktop or Laptop | 597 | 49.3% |
| Smartphone | 1,022 | 84.4% |
| Tablet | 392 | 32.4% |
| No Computing Device | 71 | 5.9% |
| Total | 1,211 | 100.0% |
Internet Access in Wofford Heights
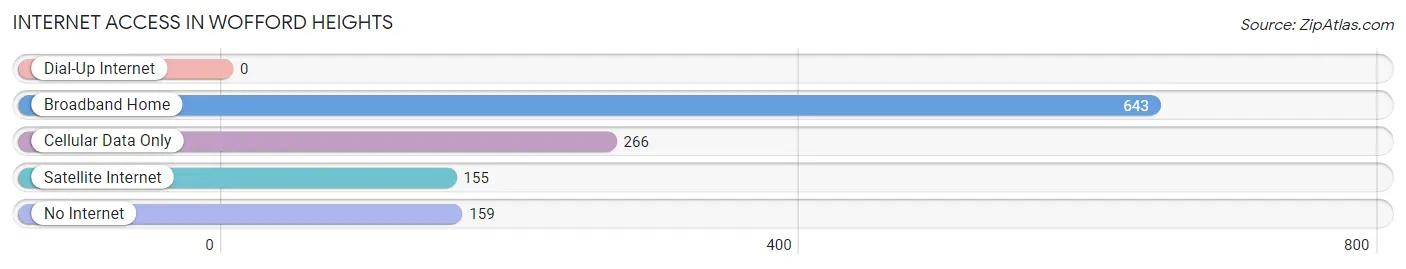
| Internet Type | # Households | % Households |
| Dial-Up Internet | 0 | 0.0% |
| Broadband Home | 643 | 53.1% |
| Cellular Data Only | 266 | 22.0% |
| Satellite Internet | 155 | 12.8% |
| No Internet | 159 | 13.1% |
| Total | 1,211 | 100.0% |
Wofford Heights Summary
Wofford Heights is a small unincorporated community located in the Kern River Valley of Kern County, California. It is situated at an elevation of 2,743 feet (836 m) and is located along the western shore of Lake Isabella, a large reservoir created by the Isabella Dam. The population of Wofford Heights was 1,717 at the 2010 census.
History
The area that is now Wofford Heights was originally inhabited by the Yokuts and Tubatulabal Native American tribes. The first non-native settlers arrived in the area in the late 1800s, and the town was officially founded in the early 1900s. The town was named after William Wofford, a local rancher who owned much of the land in the area.
In the early 1900s, the town was a popular destination for tourists and vacationers, who came to enjoy the area’s natural beauty and recreational activities. The town was also home to a number of resorts, including the Wofford Heights Resort, which was built in the 1920s.
Geography
Wofford Heights is located in the Kern River Valley, which is part of the Sierra Nevada mountain range. The town is situated at an elevation of 2,743 feet (836 m) and is located along the western shore of Lake Isabella, a large reservoir created by the Isabella Dam. The town is surrounded by the Sequoia National Forest and is located approximately 30 miles (48 km) east of Bakersfield.
The climate in Wofford Heights is semi-arid, with hot summers and mild winters. The average annual temperature is 64°F (18°C), and the average annual precipitation is 8.5 inches (21.6 cm).
Economy
The economy of Wofford Heights is largely based on tourism and recreation. The town is home to a number of resorts, campgrounds, and other recreational facilities, which attract visitors from all over the country. The town is also home to a number of small businesses, including restaurants, shops, and other services.
Demographics
As of the 2010 census, the population of Wofford Heights was 1,717. The racial makeup of the town was 87.3% White, 0.9% African American, 0.7% Native American, 0.3% Asian, 0.1% Pacific Islander, 8.2% from other races, and 2.5% from two or more races. Hispanic or Latino of any race were 16.2% of the population.
The median income for a household in Wofford Heights was $35,938, and the median income for a family was $41,250. The per capita income for the town was $17,845. About 11.2% of families and 14.2% of the population were below the poverty line, including 19.2% of those under age 18 and 8.3% of those age 65 or over.
Common Questions
What is Per Capita Income in Wofford Heights?
Per Capita income in Wofford Heights is $30,853.
What is the Median Family Income in Wofford Heights?
Median Family Income in Wofford Heights is $35,068.
What is the Median Household income in Wofford Heights?
Median Household Income in Wofford Heights is $36,614.
What is Inequality or Gini Index in Wofford Heights?
Inequality or Gini Index in Wofford Heights is 0.51.
What is the Total Population of Wofford Heights?
Total Population of Wofford Heights is 2,267.
What is the Total Male Population of Wofford Heights?
Total Male Population of Wofford Heights is 1,060.
What is the Total Female Population of Wofford Heights?
Total Female Population of Wofford Heights is 1,207.
What is the Ratio of Males per 100 Females in Wofford Heights?
There are 87.82 Males per 100 Females in Wofford Heights.
What is the Ratio of Females per 100 Males in Wofford Heights?
There are 113.87 Females per 100 Males in Wofford Heights.
What is the Median Population Age in Wofford Heights?
Median Population Age in Wofford Heights is 59.8 Years.
What is the Average Family Size in Wofford Heights
Average Family Size in Wofford Heights is 2.4 People.
What is the Average Household Size in Wofford Heights
Average Household Size in Wofford Heights is 1.9 People.
How Large is the Labor Force in Wofford Heights?
There are 520 People in the Labor Forcein in Wofford Heights.
What is the Percentage of People in the Labor Force in Wofford Heights?
24.2% of People are in the Labor Force in Wofford Heights.
What is the Unemployment Rate in Wofford Heights?
Unemployment Rate in Wofford Heights is 6.0%.