Hopewell, TN Map & Demographics
Hopewell Map
Hopewell Overview
$31,456
PER CAPITA INCOME
$91,947
AVG FAMILY INCOME
$90,601
AVG HOUSEHOLD INCOME
0.34
INEQUALITY / GINI INDEX
2,619
TOTAL POPULATION
1,212
MALE POPULATION
1,407
FEMALE POPULATION
86.14
MALES / 100 FEMALES
116.09
FEMALES / 100 MALES
37.8
MEDIAN AGE
3.4
AVG FAMILY SIZE
2.9
AVG HOUSEHOLD SIZE
1,335
LABOR FORCE [ PEOPLE ]
66.0%
PERCENT IN LABOR FORCE
3.1%
UNEMPLOYMENT RATE
Income in Hopewell
Income Overview in Hopewell
Per Capita Income in Hopewell is $31,456, while median incomes of families and households are $91,947 and $90,601 respectively.
| Characteristic | Number | Measure |
| Per Capita Income | 2,619 | $31,456 |
| Median Family Income | 705 | $91,947 |
| Mean Family Income | 705 | $93,616 |
| Median Household Income | 895 | $90,601 |
| Mean Household Income | 895 | $90,446 |
| Income Deficit | 705 | $0 |
| Wage / Income Gap (%) | 2,619 | 0.00% |
| Wage / Income Gap ($) | 2,619 | 100.00¢ per $1 |
| Gini / Inequality Index | 2,619 | 0.34 |
Earnings by Sex in Hopewell
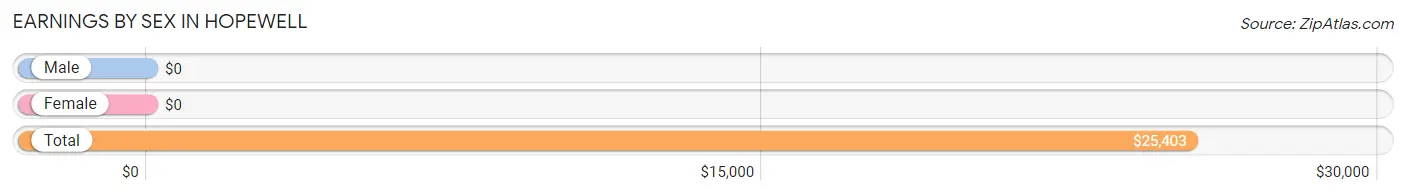
| Sex | Number | Average Earnings |
| Male | 754 (52.2%) | $0 |
| Female | 690 (47.8%) | $0 |
| Total | 1,444 (100.0%) | $25,403 |
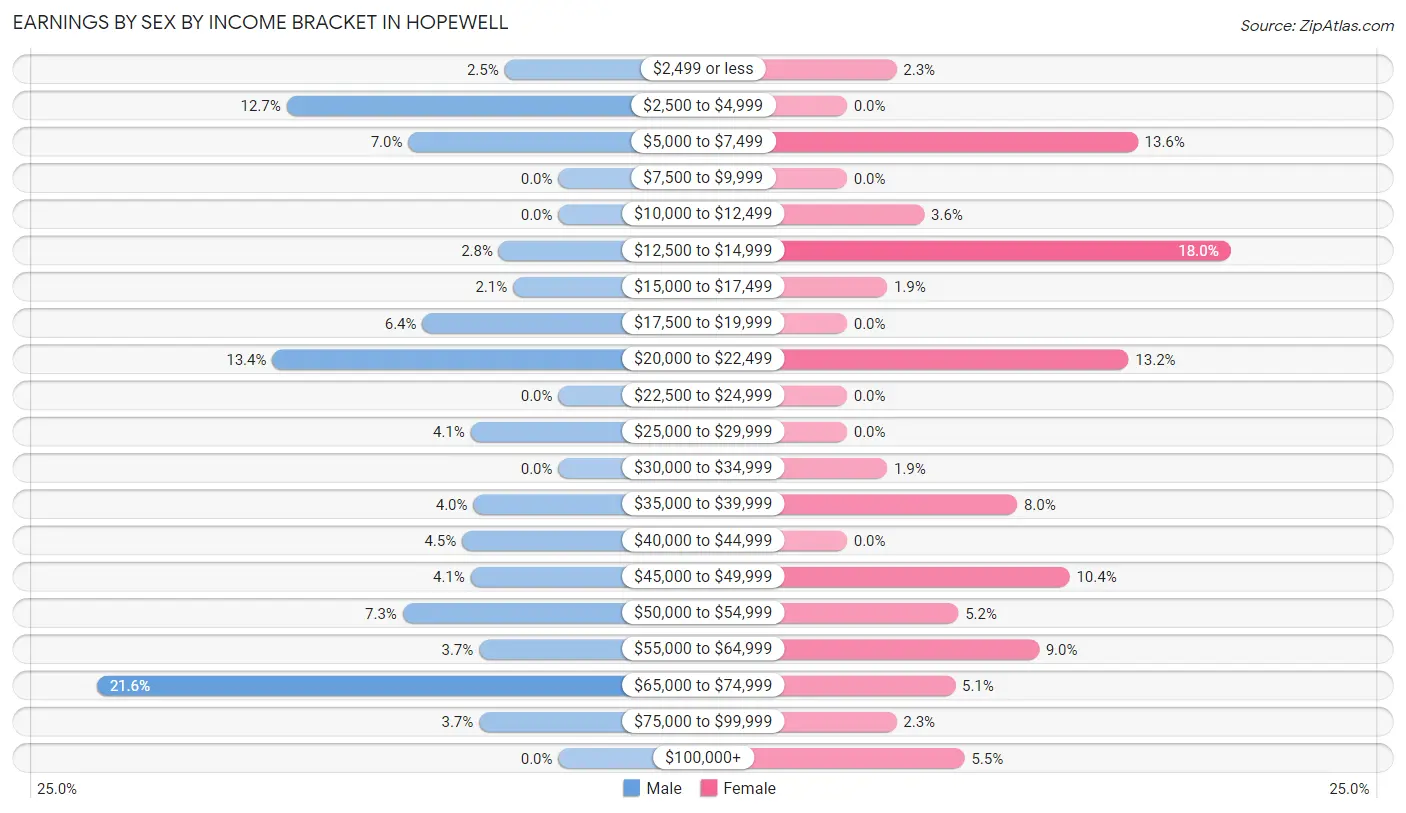
Earnings by Sex by Income Bracket in Hopewell
The most common earnings brackets in Hopewell are $65,000 to $74,999 for men (163 | 21.6%) and $12,500 to $14,999 for women (124 | 18.0%).
| Income | Male | Female |
| $2,499 or less | 19 (2.5%) | 16 (2.3%) |
| $2,500 to $4,999 | 96 (12.7%) | 0 (0.0%) |
| $5,000 to $7,499 | 53 (7.0%) | 94 (13.6%) |
| $7,500 to $9,999 | 0 (0.0%) | 0 (0.0%) |
| $10,000 to $12,499 | 0 (0.0%) | 25 (3.6%) |
| $12,500 to $14,999 | 21 (2.8%) | 124 (18.0%) |
| $15,000 to $17,499 | 16 (2.1%) | 13 (1.9%) |
| $17,500 to $19,999 | 48 (6.4%) | 0 (0.0%) |
| $20,000 to $22,499 | 101 (13.4%) | 91 (13.2%) |
| $22,500 to $24,999 | 0 (0.0%) | 0 (0.0%) |
| $25,000 to $29,999 | 31 (4.1%) | 0 (0.0%) |
| $30,000 to $34,999 | 0 (0.0%) | 13 (1.9%) |
| $35,000 to $39,999 | 30 (4.0%) | 55 (8.0%) |
| $40,000 to $44,999 | 34 (4.5%) | 0 (0.0%) |
| $45,000 to $49,999 | 31 (4.1%) | 72 (10.4%) |
| $50,000 to $54,999 | 55 (7.3%) | 36 (5.2%) |
| $55,000 to $64,999 | 28 (3.7%) | 62 (9.0%) |
| $65,000 to $74,999 | 163 (21.6%) | 35 (5.1%) |
| $75,000 to $99,999 | 28 (3.7%) | 16 (2.3%) |
| $100,000+ | 0 (0.0%) | 38 (5.5%) |
| Total | 754 (100.0%) | 690 (100.0%) |
Earnings by Sex by Educational Attainment in Hopewell
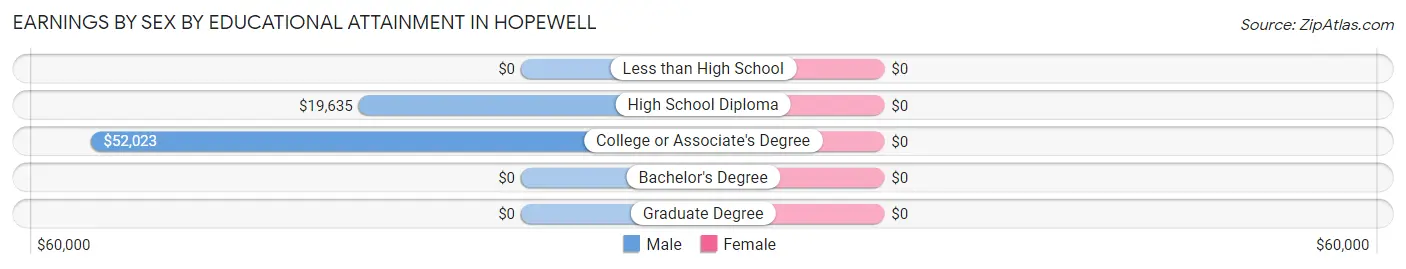
| Educational Attainment | Male Income | Female Income |
| Less than High School | - | - |
| High School Diploma | $19,635 | $0 |
| College or Associate's Degree | $52,023 | $0 |
| Bachelor's Degree | - | - |
| Graduate Degree | - | - |
| Total | - | - |
Family Income in Hopewell
Family Income Brackets in Hopewell
According to the Hopewell family income data, there are 307 families falling into the $100,000 to $149,999 income range, which is the most common income bracket and makes up 43.5% of all families.
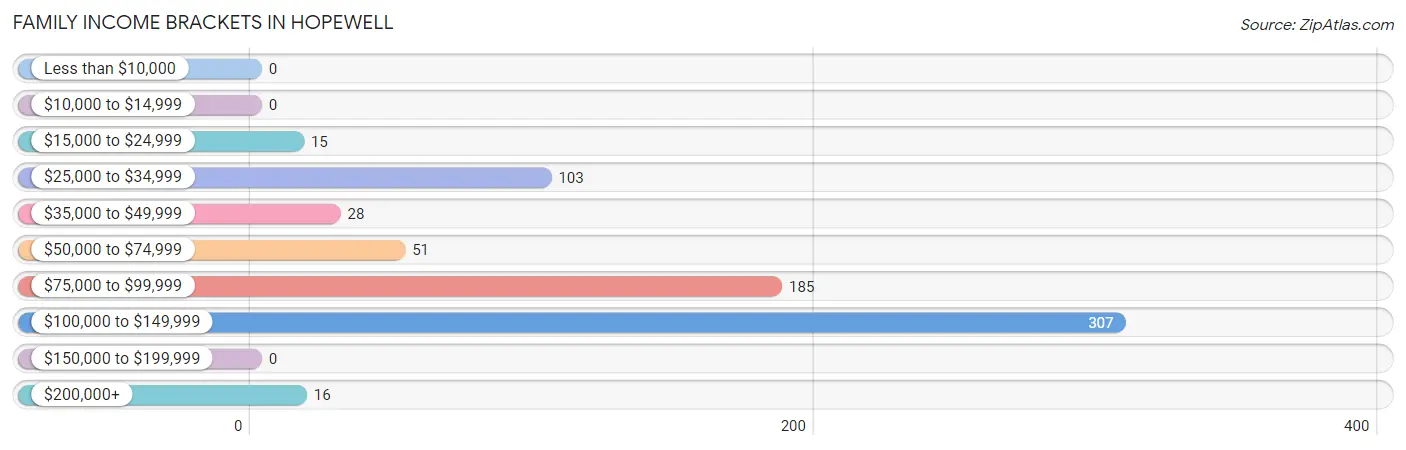
| Income Bracket | # Families | % Families |
| Less than $10,000 | 0 | 0.0% |
| $10,000 to $14,999 | 0 | 0.0% |
| $15,000 to $24,999 | 15 | 2.1% |
| $25,000 to $34,999 | 103 | 14.6% |
| $35,000 to $49,999 | 28 | 4.0% |
| $50,000 to $74,999 | 51 | 7.2% |
| $75,000 to $99,999 | 185 | 26.2% |
| $100,000 to $149,999 | 307 | 43.5% |
| $150,000 to $199,999 | 0 | 0.0% |
| $200,000+ | 16 | 2.3% |
Family Income by Famaliy Size in Hopewell
3-person families (181 | 25.7%) account for the highest median family income in Hopewell with $135,313 per family, while 2-person families (250 | 35.5%) have the highest median income of $45,577 per family member.
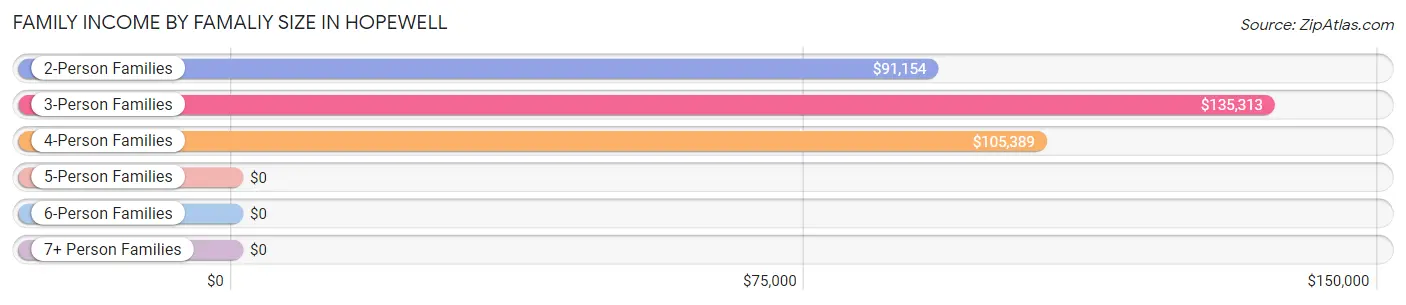
| Income Bracket | # Families | Median Income |
| 2-Person Families | 250 (35.5%) | $91,154 |
| 3-Person Families | 181 (25.7%) | $135,313 |
| 4-Person Families | 129 (18.3%) | $105,389 |
| 5-Person Families | 88 (12.5%) | $0 |
| 6-Person Families | 51 (7.2%) | $0 |
| 7+ Person Families | 6 (0.9%) | $0 |
| Total | 705 (100.0%) | $91,947 |
Family Income by Number of Earners in Hopewell
The median family income in Hopewell is $91,947, with families comprising 3+ earners (202) having the highest median family income of $106,557, while families with 1 earner (166) have the lowest median family income of $78,333, accounting for 28.6% and 23.5% of families, respectively.
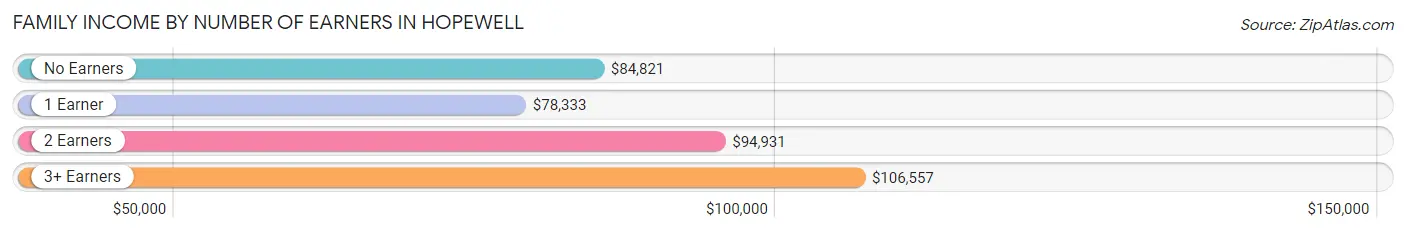
| Number of Earners | # Families | Median Income |
| No Earners | 80 (11.4%) | $84,821 |
| 1 Earner | 166 (23.5%) | $78,333 |
| 2 Earners | 257 (36.4%) | $94,931 |
| 3+ Earners | 202 (28.6%) | $106,557 |
| Total | 705 (100.0%) | $91,947 |
Household Income in Hopewell
Household Income Brackets in Hopewell
With 345 households falling in the category, the $100,000 to $149,999 income range is the most frequent in Hopewell, accounting for 38.6% of all households.
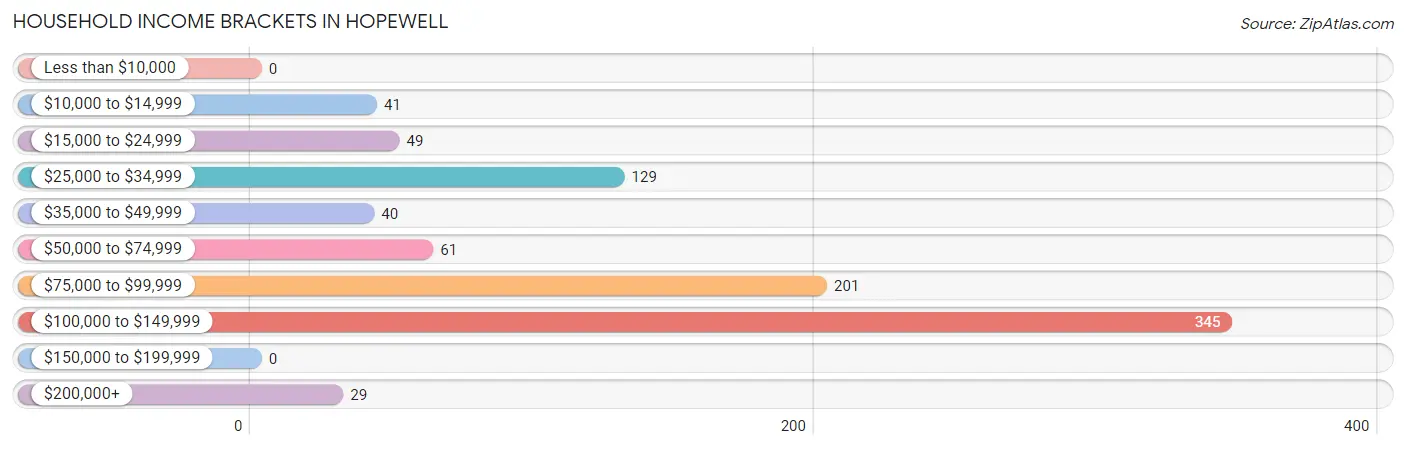
| Income Bracket | # Households | % Households |
| Less than $10,000 | 0 | 0.0% |
| $10,000 to $14,999 | 41 | 4.6% |
| $15,000 to $24,999 | 49 | 5.5% |
| $25,000 to $34,999 | 129 | 14.4% |
| $35,000 to $49,999 | 40 | 4.5% |
| $50,000 to $74,999 | 61 | 6.8% |
| $75,000 to $99,999 | 201 | 22.5% |
| $100,000 to $149,999 | 345 | 38.5% |
| $150,000 to $199,999 | 0 | 0.0% |
| $200,000+ | 29 | 3.2% |
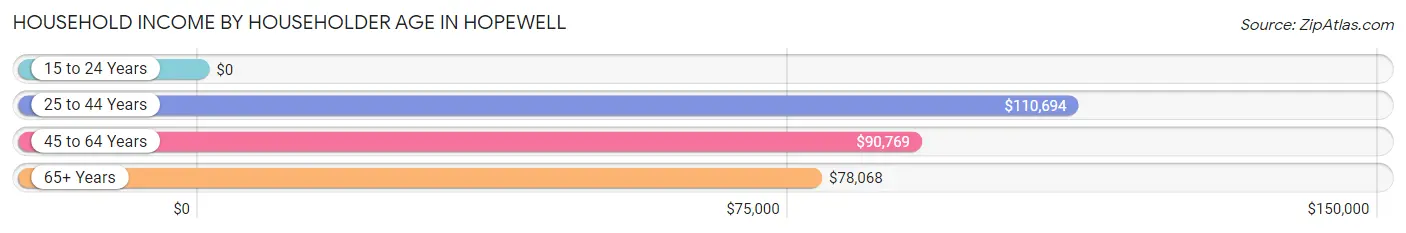
Household Income by Householder Age in Hopewell
The median household income in Hopewell is $90,601, with the highest median household income of $110,694 found in the 25 to 44 years age bracket for the primary householder. A total of 204 households (22.8%) fall into this category. Meanwhile, the 15 to 24 years age bracket for the primary householder has the lowest median household income of $0, with 28 households (3.1%) in this group.
| Income Bracket | # Households | Median Income |
| 15 to 24 Years | 28 (3.1%) | $0 |
| 25 to 44 Years | 204 (22.8%) | $110,694 |
| 45 to 64 Years | 404 (45.1%) | $90,769 |
| 65+ Years | 259 (28.9%) | $78,068 |
| Total | 895 (100.0%) | $90,601 |
Poverty in Hopewell
Income Below Poverty by Sex and Age in Hopewell
With 22.5% poverty level for males and 32.6% for females among the residents of Hopewell, under 5 year old males and 12 to 14 year old females are the most vulnerable to poverty, with 1 males (100.0%) and 93 females (100.0%) in their respective age groups living below the poverty level.
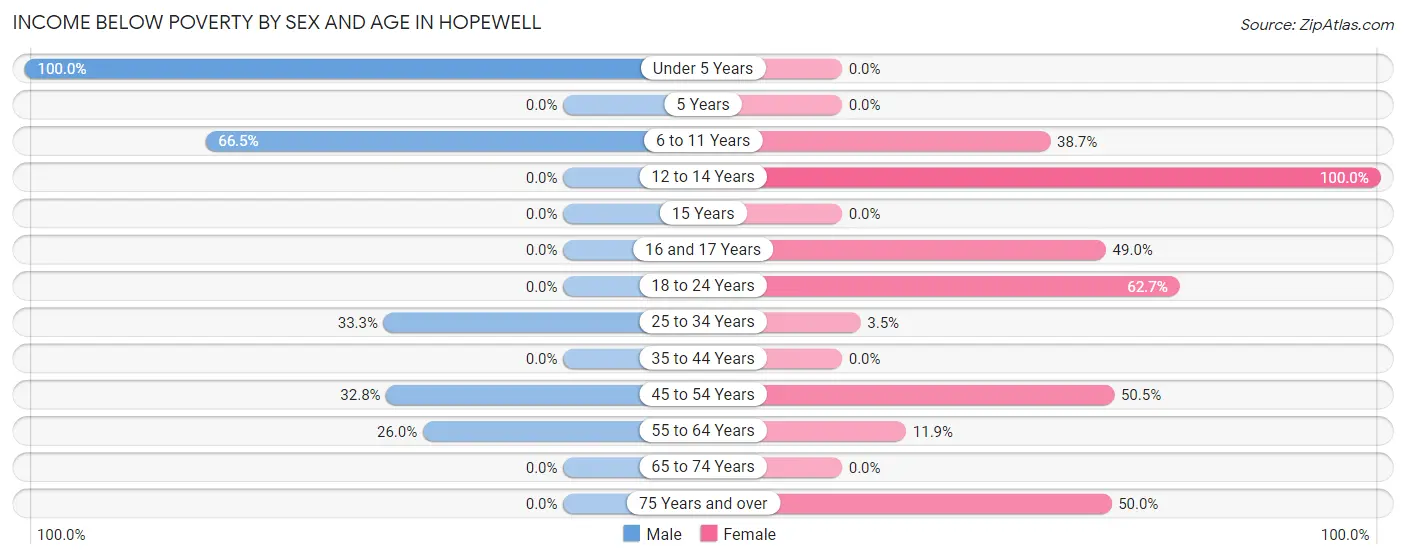
| Age Bracket | Male | Female |
| Under 5 Years | 1 (100.0%) | 0 (0.0%) |
| 5 Years | 0 (0.0%) | 0 (0.0%) |
| 6 to 11 Years | 109 (66.5%) | 87 (38.7%) |
| 12 to 14 Years | 0 (0.0%) | 93 (100.0%) |
| 15 Years | 0 (0.0%) | 0 (0.0%) |
| 16 and 17 Years | 0 (0.0%) | 48 (49.0%) |
| 18 to 24 Years | 0 (0.0%) | 42 (62.7%) |
| 25 to 34 Years | 45 (33.3%) | 6 (3.5%) |
| 35 to 44 Years | 0 (0.0%) | 0 (0.0%) |
| 45 to 54 Years | 66 (32.8%) | 98 (50.5%) |
| 55 to 64 Years | 50 (26.0%) | 17 (11.9%) |
| 65 to 74 Years | 0 (0.0%) | 0 (0.0%) |
| 75 Years and over | 0 (0.0%) | 67 (50.0%) |
| Total | 271 (22.5%) | 458 (32.6%) |
Income Above Poverty by Sex and Age in Hopewell
According to the poverty statistics in Hopewell, males aged 12 to 14 years and females aged under 5 years are the age groups that are most secure financially, with 100.0% of males and 100.0% of females in these age groups living above the poverty line.
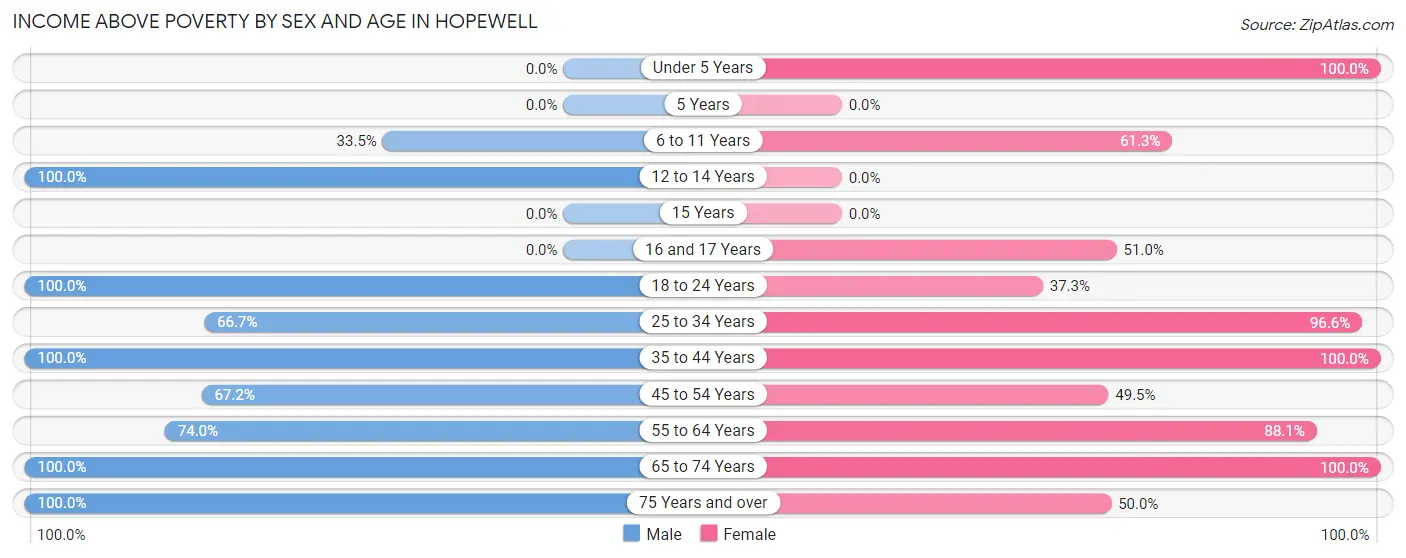
| Age Bracket | Male | Female |
| Under 5 Years | 0 (0.0%) | 60 (100.0%) |
| 5 Years | 0 (0.0%) | 0 (0.0%) |
| 6 to 11 Years | 55 (33.5%) | 138 (61.3%) |
| 12 to 14 Years | 52 (100.0%) | 0 (0.0%) |
| 15 Years | 0 (0.0%) | 0 (0.0%) |
| 16 and 17 Years | 0 (0.0%) | 50 (51.0%) |
| 18 to 24 Years | 133 (100.0%) | 25 (37.3%) |
| 25 to 34 Years | 90 (66.7%) | 168 (96.6%) |
| 35 to 44 Years | 138 (100.0%) | 39 (100.0%) |
| 45 to 54 Years | 135 (67.2%) | 96 (49.5%) |
| 55 to 64 Years | 142 (74.0%) | 126 (88.1%) |
| 65 to 74 Years | 114 (100.0%) | 176 (100.0%) |
| 75 Years and over | 73 (100.0%) | 67 (50.0%) |
| Total | 932 (77.5%) | 945 (67.4%) |
Income Below Poverty Among Married-Couple Families in Hopewell
The poverty statistics for married-couple families in Hopewell show that 8.0% or 46 of the total 576 families live below the poverty line. Families with 3 or 4 children have the highest poverty rate of 56.1%, comprising of 46 families. On the other hand, families with no children have the lowest poverty rate of 0.0%, which includes 0 families.
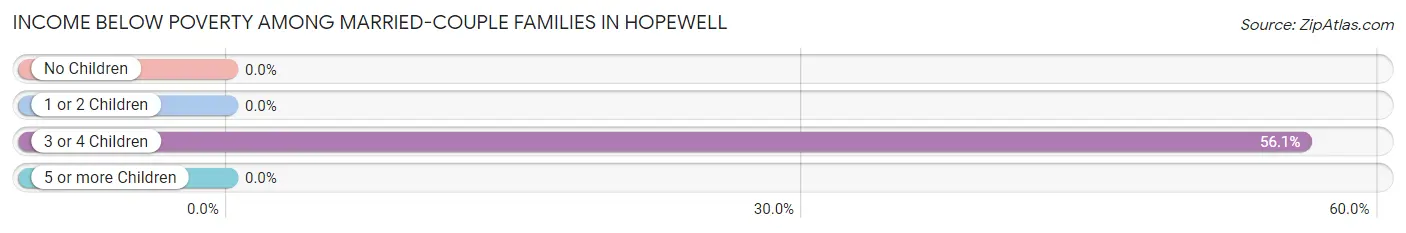
| Children | Above Poverty | Below Poverty |
| No Children | 309 (100.0%) | 0 (0.0%) |
| 1 or 2 Children | 185 (100.0%) | 0 (0.0%) |
| 3 or 4 Children | 36 (43.9%) | 46 (56.1%) |
| 5 or more Children | 0 (0.0%) | 0 (0.0%) |
| Total | 530 (92.0%) | 46 (8.0%) |
Income Below Poverty Among Single-Parent Households in Hopewell
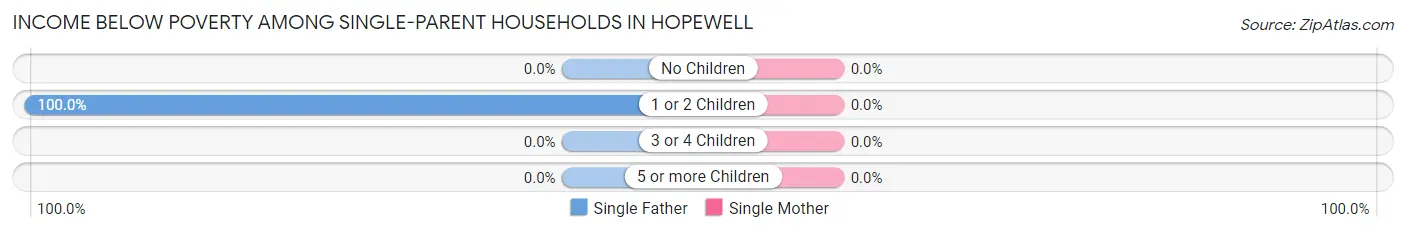
| Children | Single Father | Single Mother |
| No Children | 0 (0.0%) | 0 (0.0%) |
| 1 or 2 Children | 63 (100.0%) | 0 (0.0%) |
| 3 or 4 Children | 0 (0.0%) | 0 (0.0%) |
| 5 or more Children | 0 (0.0%) | 0 (0.0%) |
| Total | 63 (54.8%) | 0 (0.0%) |
Income Below Poverty Among Married-Couple vs Single-Parent Households in Hopewell
The poverty data for Hopewell shows that 46 of the married-couple family households (8.0%) and 63 of the single-parent households (48.8%) are living below the poverty level. Within the married-couple family households, those with 3 or 4 children have the highest poverty rate, with 46 households (56.1%) falling below the poverty line. Among the single-parent households, those with 1 or 2 children have the highest poverty rate, with 63 household (100.0%) living below poverty.
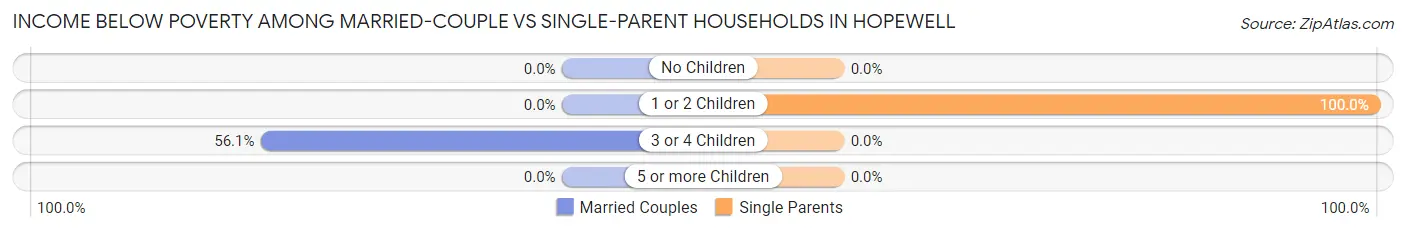
| Children | Married-Couple Families | Single-Parent Households |
| No Children | 0 (0.0%) | 0 (0.0%) |
| 1 or 2 Children | 0 (0.0%) | 63 (100.0%) |
| 3 or 4 Children | 46 (56.1%) | 0 (0.0%) |
| 5 or more Children | 0 (0.0%) | 0 (0.0%) |
| Total | 46 (8.0%) | 63 (48.8%) |
Race in Hopewell
The most populous races in Hopewell are White / Caucasian (2,298 | 87.7%), Hispanic or Latino (248 | 9.5%), and Two or more Races (228 | 8.7%).
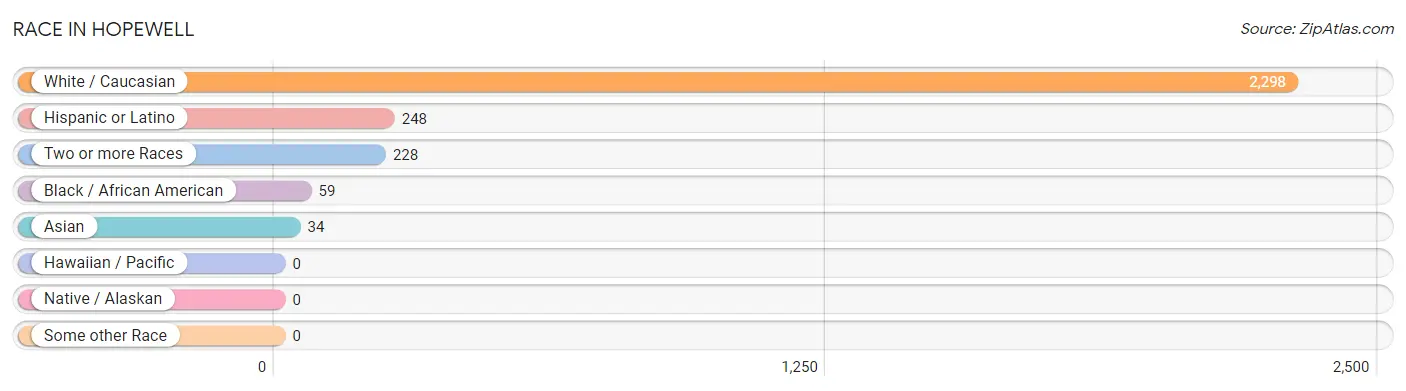
| Race | # Population | % Population |
| Asian | 34 | 1.3% |
| Black / African American | 59 | 2.2% |
| Hawaiian / Pacific | 0 | 0.0% |
| Hispanic or Latino | 248 | 9.5% |
| Native / Alaskan | 0 | 0.0% |
| White / Caucasian | 2,298 | 87.7% |
| Two or more Races | 228 | 8.7% |
| Some other Race | 0 | 0.0% |
| Total | 2,619 | 100.0% |
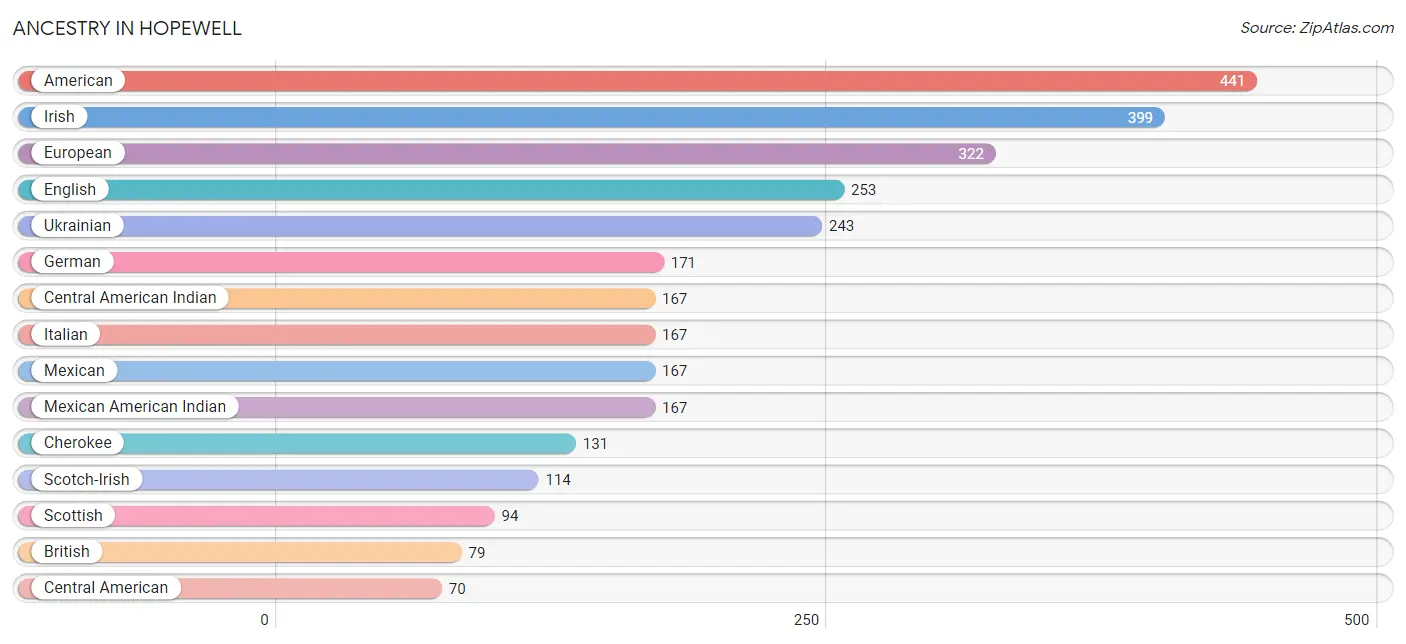
Ancestry in Hopewell
The most populous ancestries reported in Hopewell are American (441 | 16.8%), Irish (399 | 15.2%), European (322 | 12.3%), English (253 | 9.7%), and Ukrainian (243 | 9.3%), together accounting for 63.3% of all Hopewell residents.
| Ancestry | # Population | % Population |
| American | 441 | 16.8% |
| British | 79 | 3.0% |
| Central American | 70 | 2.7% |
| Central American Indian | 167 | 6.4% |
| Cherokee | 131 | 5.0% |
| English | 253 | 9.7% |
| European | 322 | 12.3% |
| Finnish | 14 | 0.5% |
| French | 24 | 0.9% |
| German | 171 | 6.5% |
| Honduran | 70 | 2.7% |
| Irish | 399 | 15.2% |
| Italian | 167 | 6.4% |
| Korean | 65 | 2.5% |
| Mexican | 167 | 6.4% |
| Mexican American Indian | 167 | 6.4% |
| Scotch-Irish | 114 | 4.3% |
| Scottish | 94 | 3.6% |
| Spaniard | 11 | 0.4% |
| Ukrainian | 243 | 9.3% | View All 20 Rows |
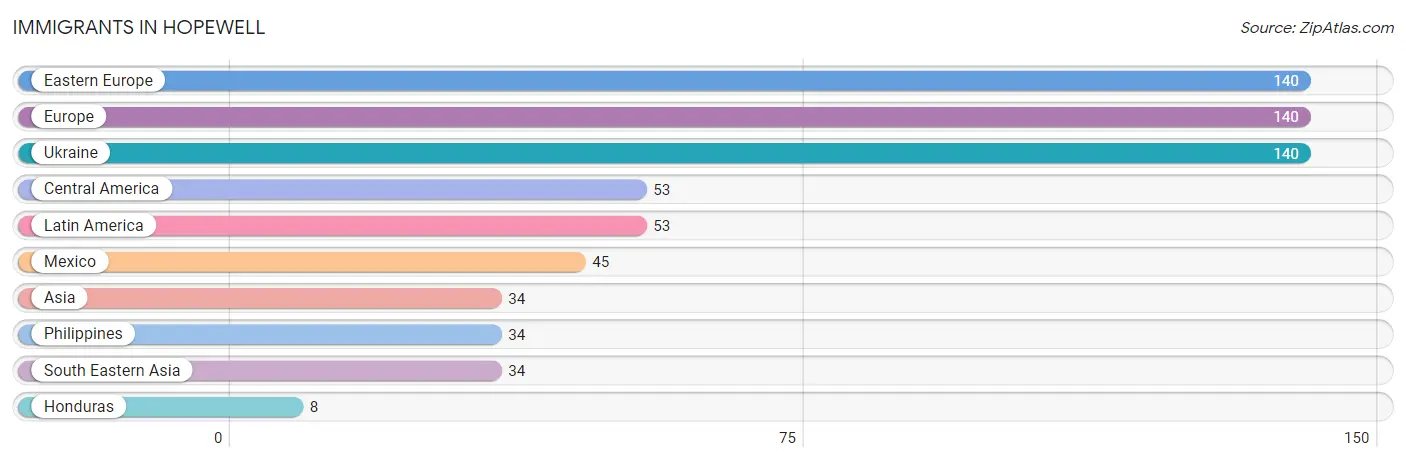
Immigrants in Hopewell
The most numerous immigrant groups reported in Hopewell came from Eastern Europe (140 | 5.3%), Europe (140 | 5.3%), Ukraine (140 | 5.3%), Central America (53 | 2.0%), and Latin America (53 | 2.0%), together accounting for 20.1% of all Hopewell residents.
| Immigration Origin | # Population | % Population |
| Asia | 34 | 1.3% |
| Central America | 53 | 2.0% |
| Eastern Europe | 140 | 5.3% |
| Europe | 140 | 5.3% |
| Honduras | 8 | 0.3% |
| Latin America | 53 | 2.0% |
| Mexico | 45 | 1.7% |
| Philippines | 34 | 1.3% |
| South Eastern Asia | 34 | 1.3% |
| Ukraine | 140 | 5.3% | View All 10 Rows |
Sex and Age in Hopewell
Sex and Age in Hopewell
The most populous age groups in Hopewell are 55 to 59 Years (181 | 14.9%) for men and 5 to 9 Years (184 | 13.1%) for women.
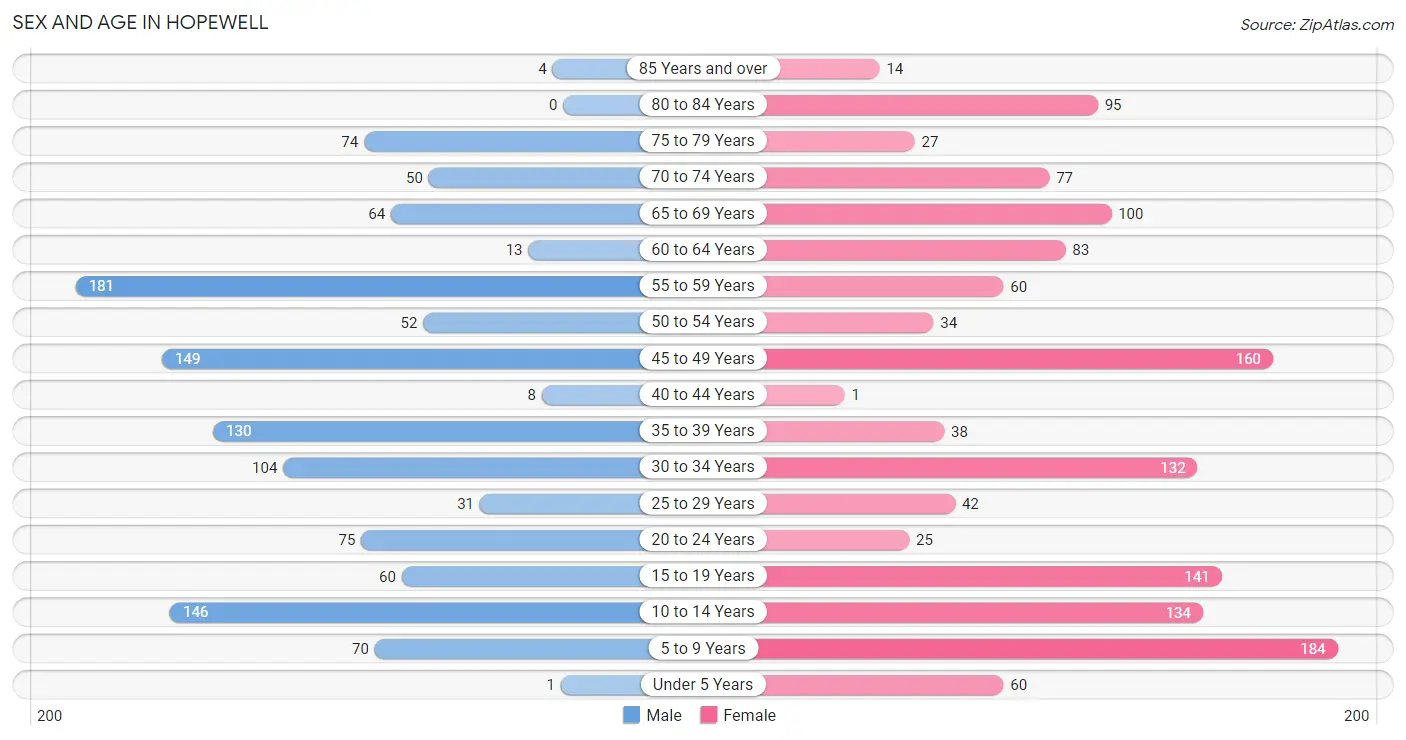
| Age Bracket | Male | Female |
| Under 5 Years | 1 (0.1%) | 60 (4.3%) |
| 5 to 9 Years | 70 (5.8%) | 184 (13.1%) |
| 10 to 14 Years | 146 (12.0%) | 134 (9.5%) |
| 15 to 19 Years | 60 (5.0%) | 141 (10.0%) |
| 20 to 24 Years | 75 (6.2%) | 25 (1.8%) |
| 25 to 29 Years | 31 (2.6%) | 42 (3.0%) |
| 30 to 34 Years | 104 (8.6%) | 132 (9.4%) |
| 35 to 39 Years | 130 (10.7%) | 38 (2.7%) |
| 40 to 44 Years | 8 (0.7%) | 1 (0.1%) |
| 45 to 49 Years | 149 (12.3%) | 160 (11.4%) |
| 50 to 54 Years | 52 (4.3%) | 34 (2.4%) |
| 55 to 59 Years | 181 (14.9%) | 60 (4.3%) |
| 60 to 64 Years | 13 (1.1%) | 83 (5.9%) |
| 65 to 69 Years | 64 (5.3%) | 100 (7.1%) |
| 70 to 74 Years | 50 (4.1%) | 77 (5.5%) |
| 75 to 79 Years | 74 (6.1%) | 27 (1.9%) |
| 80 to 84 Years | 0 (0.0%) | 95 (6.8%) |
| 85 Years and over | 4 (0.3%) | 14 (1.0%) |
| Total | 1,212 (100.0%) | 1,407 (100.0%) |
Families and Households in Hopewell
Median Family Size in Hopewell
The median family size in Hopewell is 3.42 persons per family, with married-couple families (576 | 81.7%) accounting for the largest median family size of 3.52 persons per family. On the other hand, single female/mother families (14 | 2.0%) represent the smallest median family size with 2.79 persons per family.
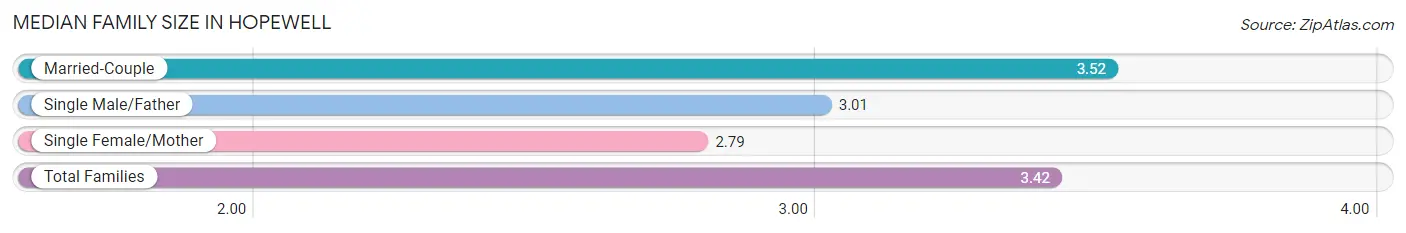
| Family Type | # Families | Family Size |
| Married-Couple | 576 (81.7%) | 3.52 |
| Single Male/Father | 115 (16.3%) | 3.01 |
| Single Female/Mother | 14 (2.0%) | 2.79 |
| Total Families | 705 (100.0%) | 3.42 |
Median Household Size in Hopewell
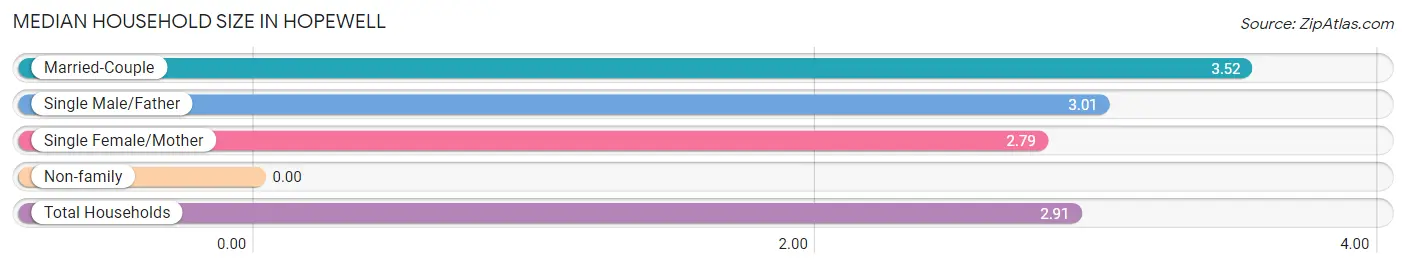
| Household Type | # Households | Household Size |
| Married-Couple | 576 (64.4%) | 3.52 |
| Single Male/Father | 115 (12.9%) | 3.01 |
| Single Female/Mother | 14 (1.6%) | 2.79 |
| Non-family | 190 (21.2%) | - |
| Total Households | 895 (100.0%) | 2.91 |
Household Size by Marriage Status in Hopewell
Out of a total of 895 households in Hopewell, 705 (78.8%) are family households, while 190 (21.2%) are nonfamily households. The most numerous type of family households are 2-person households, comprising 250, and the most common type of nonfamily households are 1-person households, comprising 190.
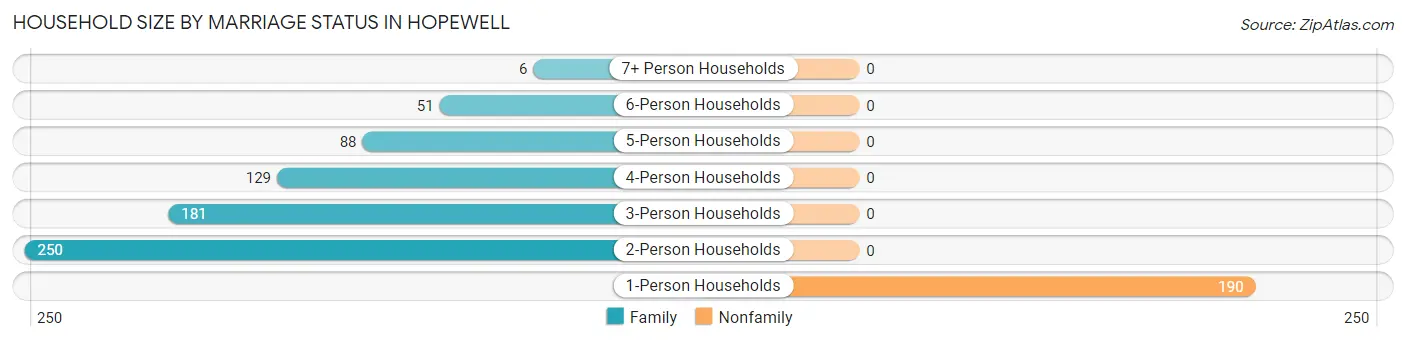
| Household Size | Family Households | Nonfamily Households |
| 1-Person Households | - | 190 (21.2%) |
| 2-Person Households | 250 (27.9%) | 0 (0.0%) |
| 3-Person Households | 181 (20.2%) | 0 (0.0%) |
| 4-Person Households | 129 (14.4%) | 0 (0.0%) |
| 5-Person Households | 88 (9.8%) | 0 (0.0%) |
| 6-Person Households | 51 (5.7%) | 0 (0.0%) |
| 7+ Person Households | 6 (0.7%) | 0 (0.0%) |
| Total | 705 (78.8%) | 190 (21.2%) |
Female Fertility in Hopewell
Fertility by Age in Hopewell
Average fertility rate in Hopewell is 43.0 births per 1,000 women. Women in the age bracket of 20 to 34 years have the highest fertility rate with 116.0 births per 1,000 women. Women in the age bracket of 20 to 34 years acount for 100.0% of all women with births.
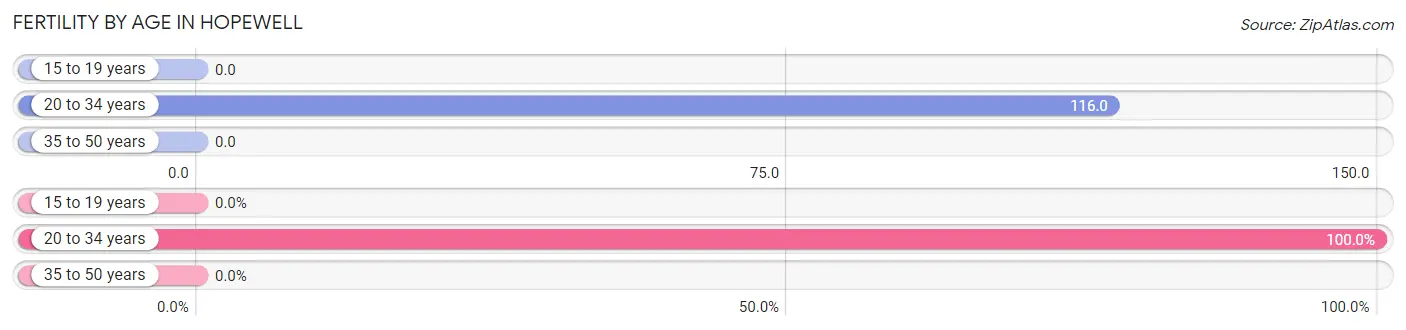
| Age Bracket | Women with Births | Births / 1,000 Women |
| 15 to 19 years | 0 (0.0%) | 0.0 |
| 20 to 34 years | 23 (100.0%) | 116.0 |
| 35 to 50 years | 0 (0.0%) | 0.0 |
| Total | 23 (100.0%) | 43.0 |
Fertility by Age by Marriage Status in Hopewell
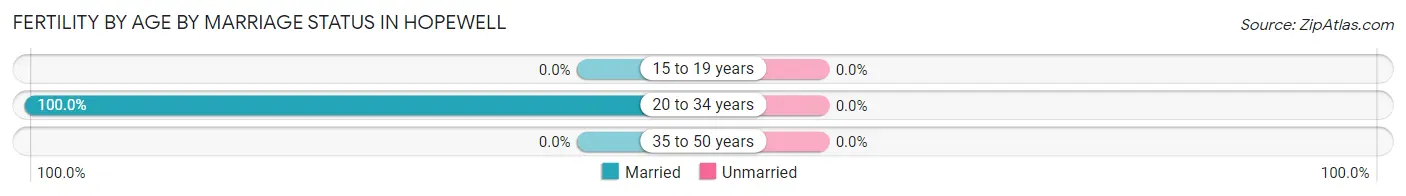
| Age Bracket | Married | Unmarried |
| 15 to 19 years | 0 (0.0%) | 0 (0.0%) |
| 20 to 34 years | 23 (100.0%) | 0 (0.0%) |
| 35 to 50 years | 0 (0.0%) | 0 (0.0%) |
| Total | 23 (100.0%) | 0 (0.0%) |
Fertility by Education in Hopewell
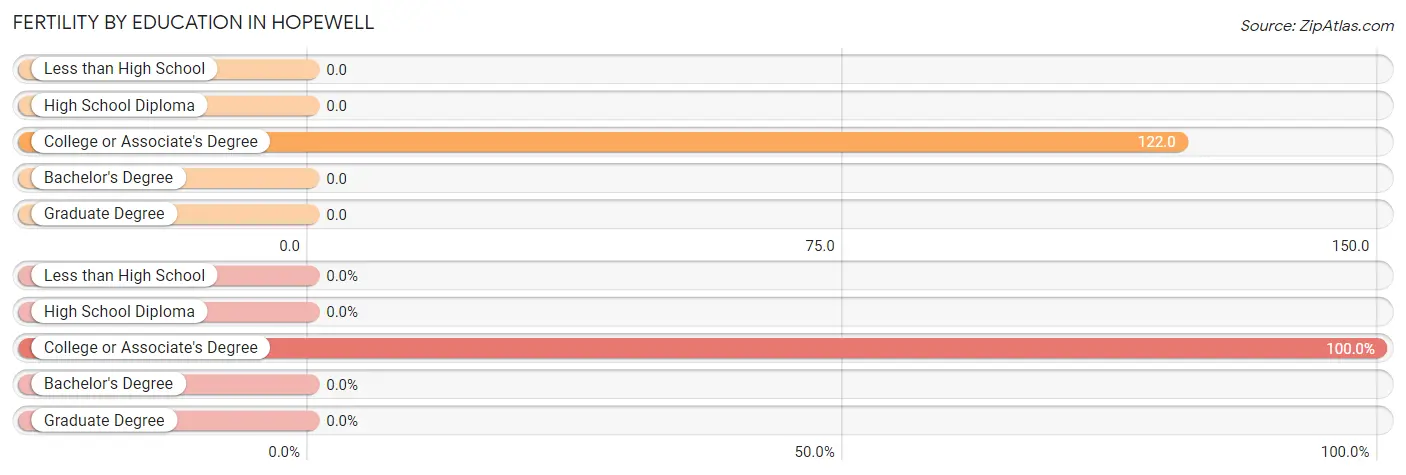
| Educational Attainment | Women with Births | Births / 1,000 Women |
| Less than High School | 0 (0.0%) | 0.0 |
| High School Diploma | 0 (0.0%) | 0.0 |
| College or Associate's Degree | 23 (100.0%) | 122.0 |
| Bachelor's Degree | 0 (0.0%) | 0.0 |
| Graduate Degree | 0 (0.0%) | 0.0 |
| Total | 23 (100.0%) | 43.0 |
Fertility by Education by Marriage Status in Hopewell
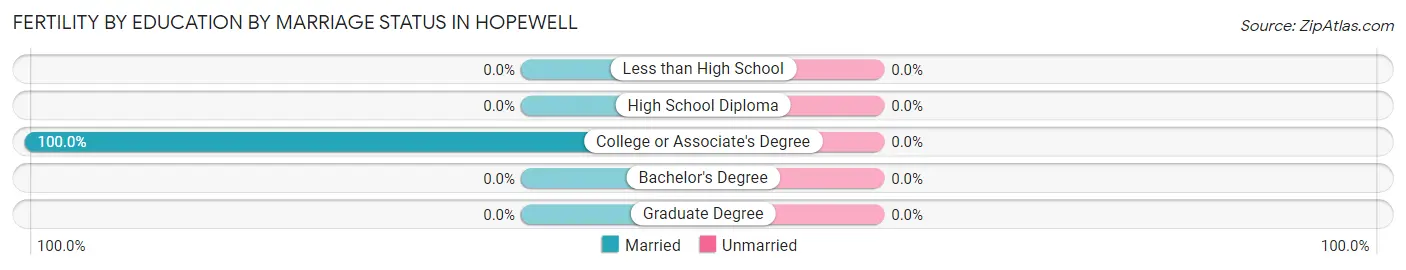
| Educational Attainment | Married | Unmarried |
| Less than High School | 0 (0.0%) | 0 (0.0%) |
| High School Diploma | 0 (0.0%) | 0 (0.0%) |
| College or Associate's Degree | 23 (100.0%) | 0 (0.0%) |
| Bachelor's Degree | 0 (0.0%) | 0 (0.0%) |
| Graduate Degree | 0 (0.0%) | 0 (0.0%) |
| Total | 23 (100.0%) | 0 (0.0%) |
Employment Characteristics in Hopewell
Employment by Class of Employer in Hopewell
Among the 1,293 employed individuals in Hopewell, private company employees (815 | 63.0%), not-for-profit organizations (166 | 12.8%), and local government employees (135 | 10.4%) make up the most common classes of employment.
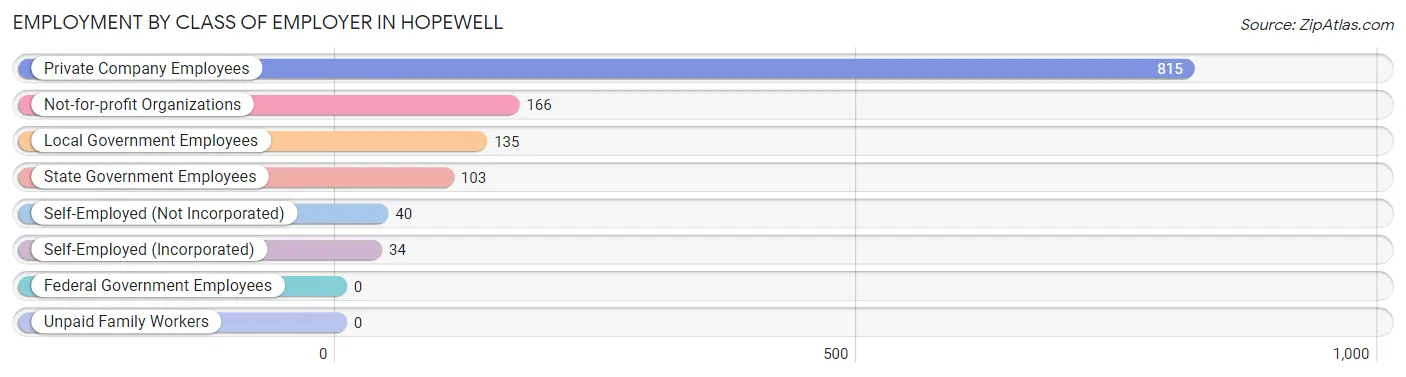
| Employer Class | # Employees | % Employees |
| Private Company Employees | 815 | 63.0% |
| Self-Employed (Incorporated) | 34 | 2.6% |
| Self-Employed (Not Incorporated) | 40 | 3.1% |
| Not-for-profit Organizations | 166 | 12.8% |
| Local Government Employees | 135 | 10.4% |
| State Government Employees | 103 | 8.0% |
| Federal Government Employees | 0 | 0.0% |
| Unpaid Family Workers | 0 | 0.0% |
| Total | 1,293 | 100.0% |
Employment Status by Age in Hopewell
According to the labor force statistics for Hopewell, out of the total population over 16 years of age (2,023), 66.0% or 1,335 individuals are in the labor force, with 3.1% or 41 of them unemployed. The age group with the highest labor force participation rate is 20 to 24 years, with 100.0% or 100 individuals in the labor force. Within the labor force, the 16 to 19 years age range has the highest percentage of unemployed individuals, with 28.0% or 42 of them being unemployed.
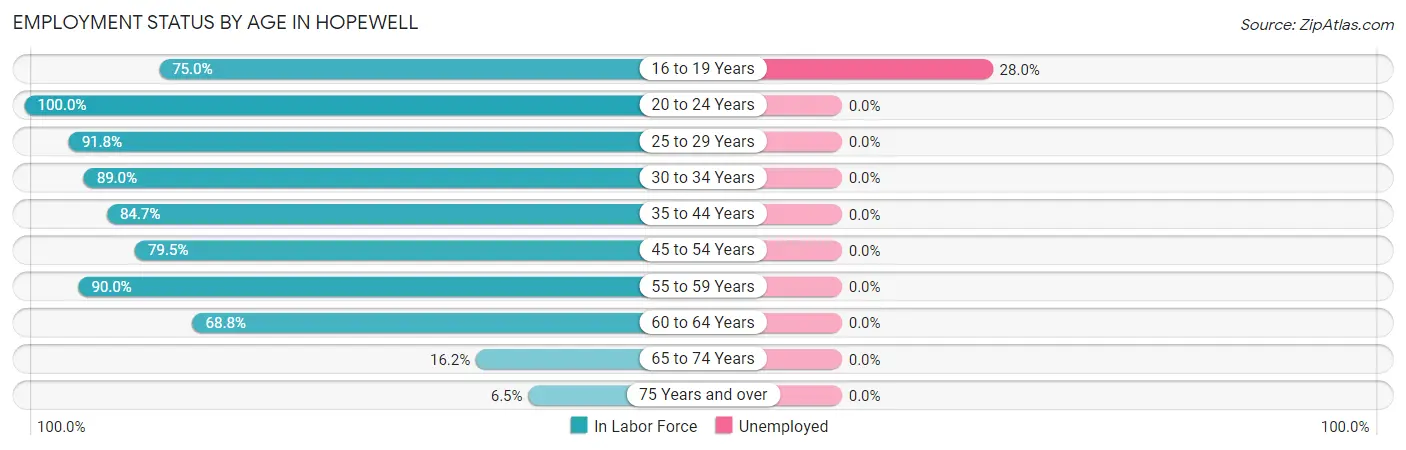
| Age Bracket | In Labor Force | Unemployed |
| 16 to 19 Years | 150 (75.0%) | 42 (28.0%) |
| 20 to 24 Years | 100 (100.0%) | 0 (0.0%) |
| 25 to 29 Years | 67 (91.8%) | 0 (0.0%) |
| 30 to 34 Years | 210 (89.0%) | 0 (0.0%) |
| 35 to 44 Years | 150 (84.7%) | 0 (0.0%) |
| 45 to 54 Years | 314 (79.5%) | 0 (0.0%) |
| 55 to 59 Years | 217 (90.0%) | 0 (0.0%) |
| 60 to 64 Years | 66 (68.8%) | 0 (0.0%) |
| 65 to 74 Years | 47 (16.2%) | 0 (0.0%) |
| 75 Years and over | 14 (6.5%) | 0 (0.0%) |
| Total | 1,335 (66.0%) | 41 (3.1%) |
Employment Status by Educational Attainment in Hopewell
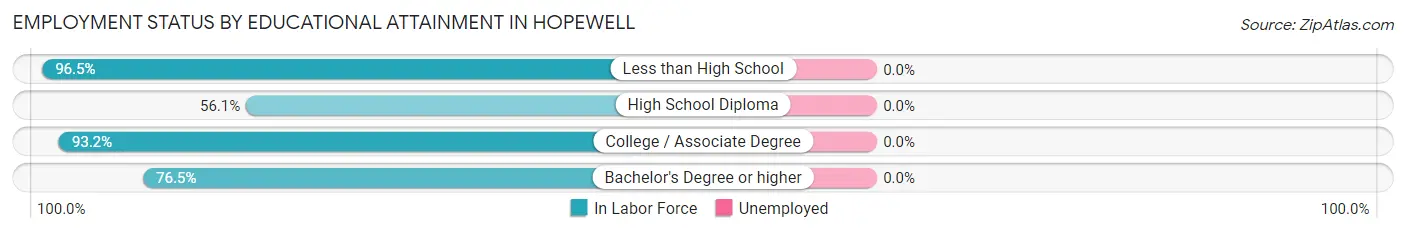
| Educational Attainment | In Labor Force | Unemployed |
| Less than High School | 136 (96.5%) | 0 (0.0%) |
| High School Diploma | 125 (56.1%) | 0 (0.0%) |
| College / Associate Degree | 613 (93.2%) | 0 (0.0%) |
| Bachelor's Degree or higher | 150 (76.5%) | 0 (0.0%) |
| Total | 1,024 (84.1%) | 0 (0.0%) |
Employment Occupations by Sex in Hopewell
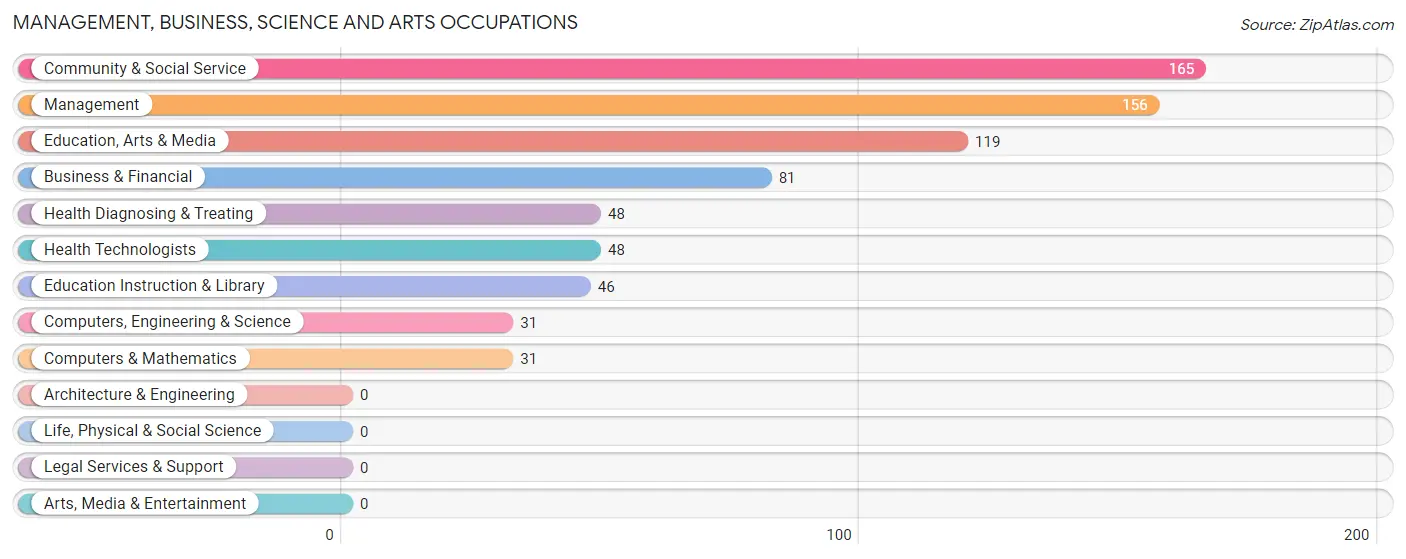
Management, Business, Science and Arts Occupations
The most common Management, Business, Science and Arts occupations in Hopewell are Community & Social Service (165 | 12.8%), Management (156 | 12.1%), Education, Arts & Media (119 | 9.2%), Business & Financial (81 | 6.3%), and Health Diagnosing & Treating (48 | 3.7%).
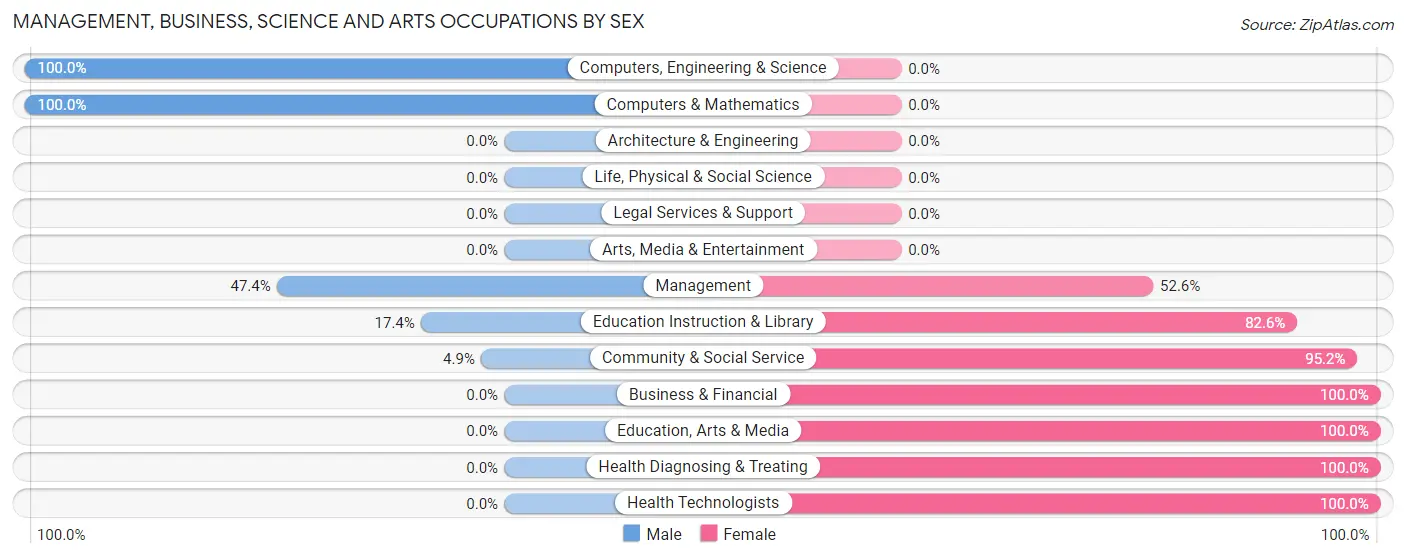
Management, Business, Science and Arts Occupations by Sex
Within the Management, Business, Science and Arts occupations in Hopewell, the most male-oriented occupations are Computers, Engineering & Science (100.0%), Computers & Mathematics (100.0%), and Management (47.4%), while the most female-oriented occupations are Business & Financial (100.0%), Education, Arts & Media (100.0%), and Health Diagnosing & Treating (100.0%).
| Occupation | Male | Female |
| Management | 74 (47.4%) | 82 (52.6%) |
| Business & Financial | 0 (0.0%) | 81 (100.0%) |
| Computers, Engineering & Science | 31 (100.0%) | 0 (0.0%) |
| Computers & Mathematics | 31 (100.0%) | 0 (0.0%) |
| Architecture & Engineering | 0 (0.0%) | 0 (0.0%) |
| Life, Physical & Social Science | 0 (0.0%) | 0 (0.0%) |
| Community & Social Service | 8 (4.9%) | 157 (95.2%) |
| Education, Arts & Media | 0 (0.0%) | 119 (100.0%) |
| Legal Services & Support | 0 (0.0%) | 0 (0.0%) |
| Education Instruction & Library | 8 (17.4%) | 38 (82.6%) |
| Arts, Media & Entertainment | 0 (0.0%) | 0 (0.0%) |
| Health Diagnosing & Treating | 0 (0.0%) | 48 (100.0%) |
| Health Technologists | 0 (0.0%) | 48 (100.0%) |
| Total (Category) | 113 (23.5%) | 368 (76.5%) |
| Total (Overall) | 695 (53.7%) | 598 (46.3%) |
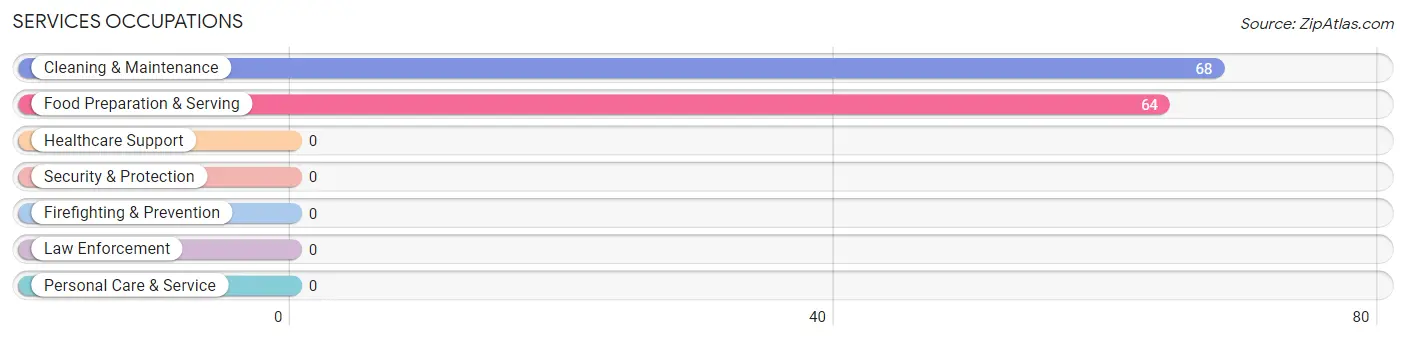
Services Occupations
The most common Services occupations in Hopewell are Cleaning & Maintenance (68 | 5.3%), and Food Preparation & Serving (64 | 5.0%).
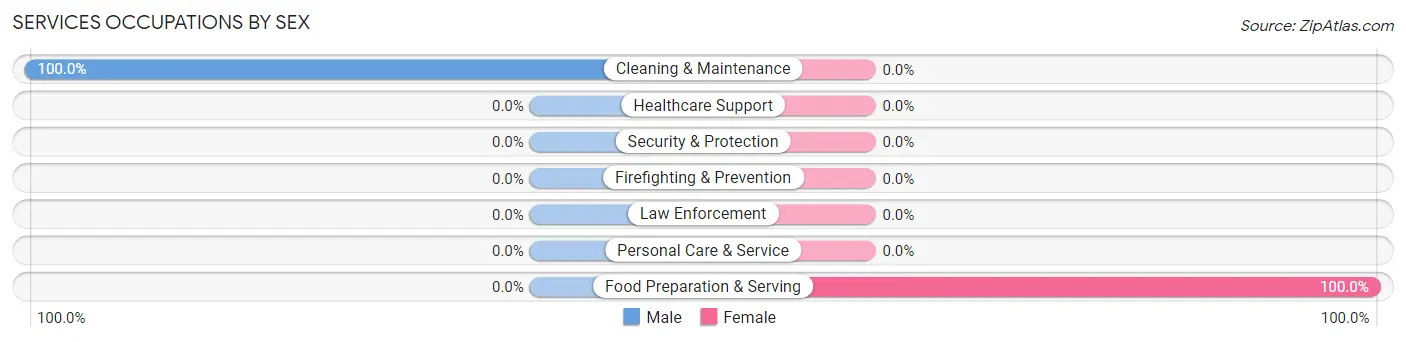
Services Occupations by Sex
| Occupation | Male | Female |
| Healthcare Support | 0 (0.0%) | 0 (0.0%) |
| Security & Protection | 0 (0.0%) | 0 (0.0%) |
| Firefighting & Prevention | 0 (0.0%) | 0 (0.0%) |
| Law Enforcement | 0 (0.0%) | 0 (0.0%) |
| Food Preparation & Serving | 0 (0.0%) | 64 (100.0%) |
| Cleaning & Maintenance | 68 (100.0%) | 0 (0.0%) |
| Personal Care & Service | 0 (0.0%) | 0 (0.0%) |
| Total (Category) | 68 (51.5%) | 64 (48.5%) |
| Total (Overall) | 695 (53.7%) | 598 (46.3%) |
Sales and Office Occupations
The most common Sales and Office occupations in Hopewell are Office & Administration (169 | 13.1%), and Sales & Related (52 | 4.0%).
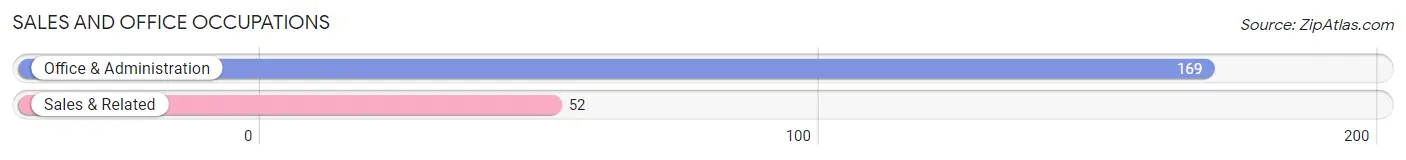
Sales and Office Occupations by Sex

| Occupation | Male | Female |
| Sales & Related | 52 (100.0%) | 0 (0.0%) |
| Office & Administration | 34 (20.1%) | 135 (79.9%) |
| Total (Category) | 86 (38.9%) | 135 (61.1%) |
| Total (Overall) | 695 (53.7%) | 598 (46.3%) |
Natural Resources, Construction and Maintenance Occupations
The most common Natural Resources, Construction and Maintenance occupations in Hopewell are Construction & Extraction (115 | 8.9%), and Installation, Maintenance & Repair (83 | 6.4%).
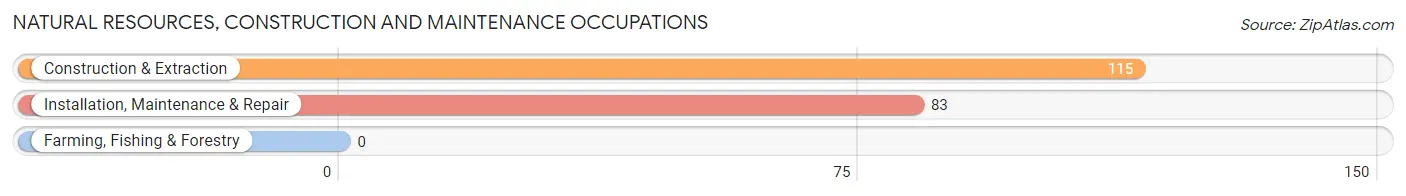
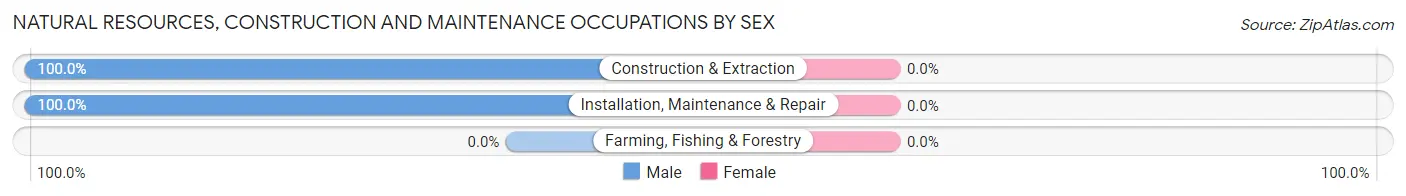
Natural Resources, Construction and Maintenance Occupations by Sex
| Occupation | Male | Female |
| Farming, Fishing & Forestry | 0 (0.0%) | 0 (0.0%) |
| Construction & Extraction | 115 (100.0%) | 0 (0.0%) |
| Installation, Maintenance & Repair | 83 (100.0%) | 0 (0.0%) |
| Total (Category) | 198 (100.0%) | 0 (0.0%) |
| Total (Overall) | 695 (53.7%) | 598 (46.3%) |
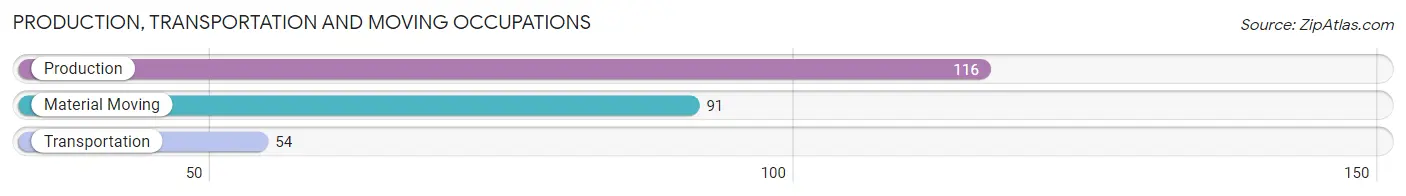
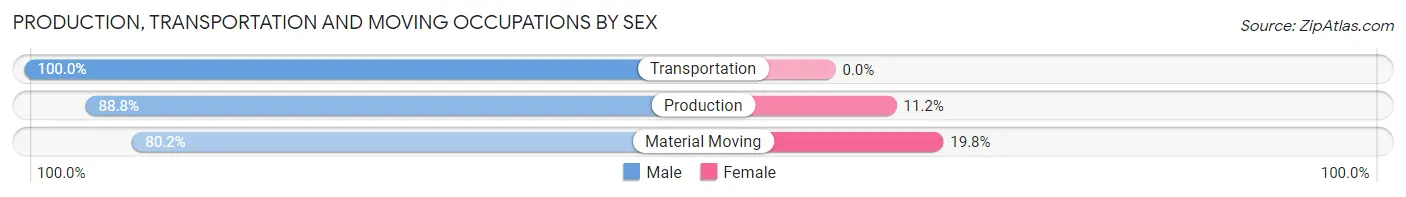
Production, Transportation and Moving Occupations
The most common Production, Transportation and Moving occupations in Hopewell are Production (116 | 9.0%), Material Moving (91 | 7.0%), and Transportation (54 | 4.2%).
Production, Transportation and Moving Occupations by Sex
| Occupation | Male | Female |
| Production | 103 (88.8%) | 13 (11.2%) |
| Transportation | 54 (100.0%) | 0 (0.0%) |
| Material Moving | 73 (80.2%) | 18 (19.8%) |
| Total (Category) | 230 (88.1%) | 31 (11.9%) |
| Total (Overall) | 695 (53.7%) | 598 (46.3%) |
Employment Industries by Sex in Hopewell
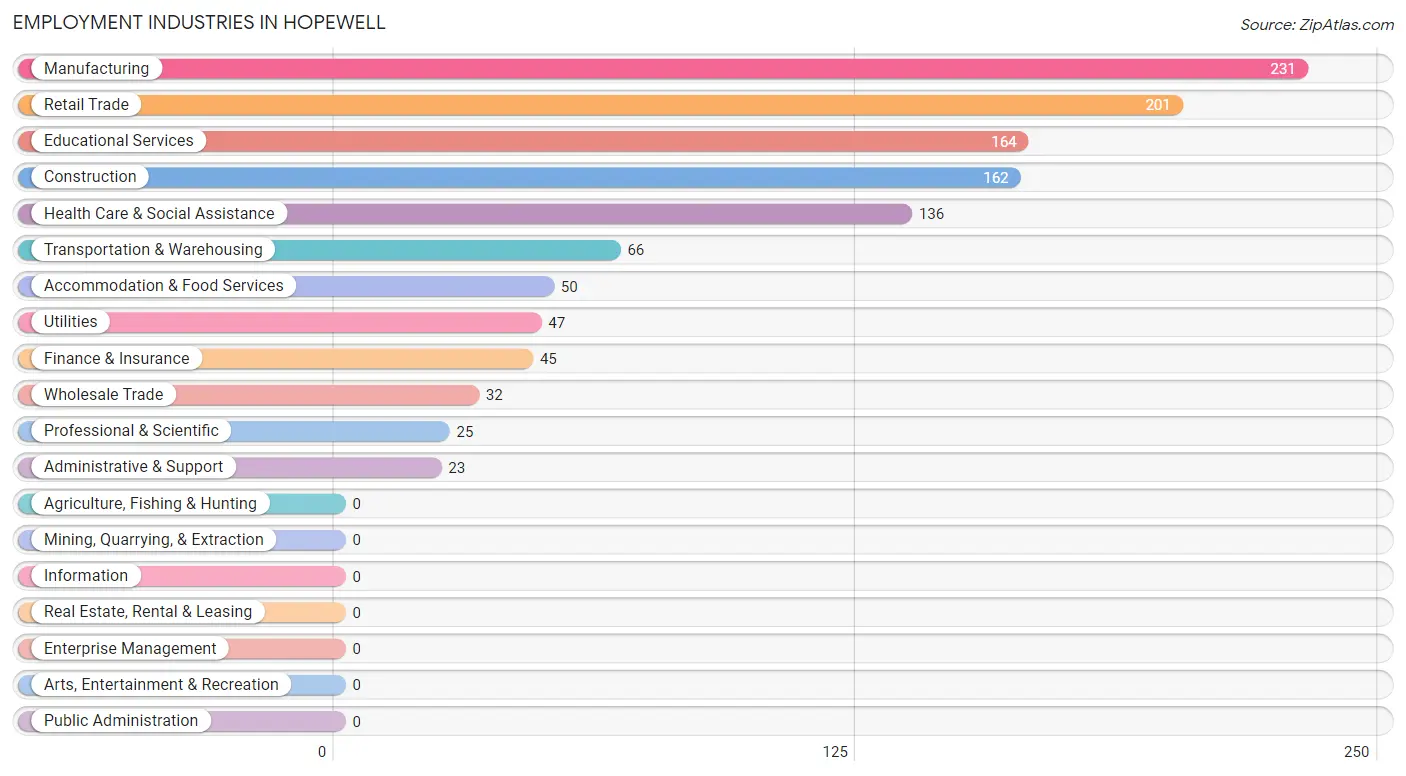
Employment Industries in Hopewell
The major employment industries in Hopewell include Manufacturing (231 | 17.9%), Retail Trade (201 | 15.5%), Educational Services (164 | 12.7%), Construction (162 | 12.5%), and Health Care & Social Assistance (136 | 10.5%).
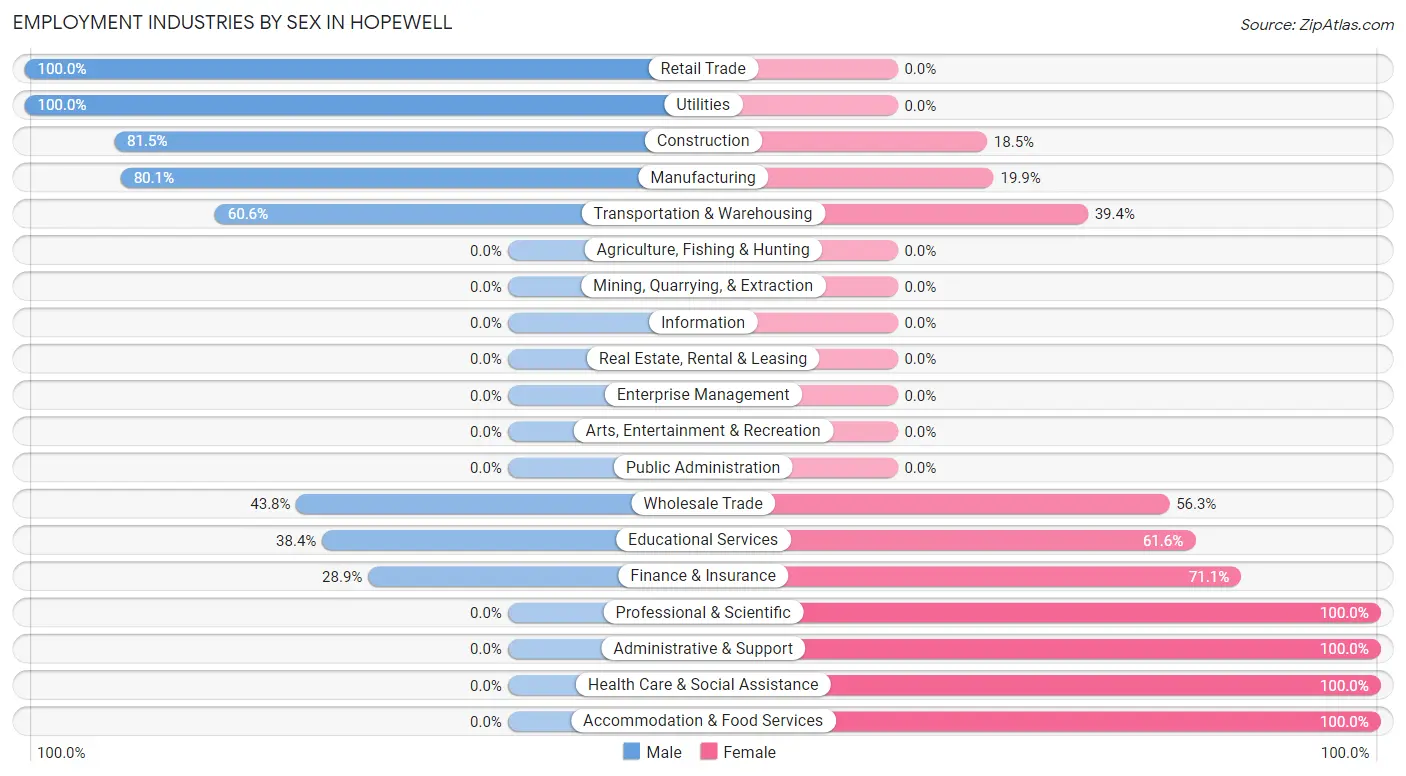
Employment Industries by Sex in Hopewell
The Hopewell industries that see more men than women are Retail Trade (100.0%), Utilities (100.0%), and Construction (81.5%), whereas the industries that tend to have a higher number of women are Professional & Scientific (100.0%), Administrative & Support (100.0%), and Health Care & Social Assistance (100.0%).
| Industry | Male | Female |
| Agriculture, Fishing & Hunting | 0 (0.0%) | 0 (0.0%) |
| Mining, Quarrying, & Extraction | 0 (0.0%) | 0 (0.0%) |
| Construction | 132 (81.5%) | 30 (18.5%) |
| Manufacturing | 185 (80.1%) | 46 (19.9%) |
| Wholesale Trade | 14 (43.8%) | 18 (56.2%) |
| Retail Trade | 201 (100.0%) | 0 (0.0%) |
| Transportation & Warehousing | 40 (60.6%) | 26 (39.4%) |
| Utilities | 47 (100.0%) | 0 (0.0%) |
| Information | 0 (0.0%) | 0 (0.0%) |
| Finance & Insurance | 13 (28.9%) | 32 (71.1%) |
| Real Estate, Rental & Leasing | 0 (0.0%) | 0 (0.0%) |
| Professional & Scientific | 0 (0.0%) | 25 (100.0%) |
| Enterprise Management | 0 (0.0%) | 0 (0.0%) |
| Administrative & Support | 0 (0.0%) | 23 (100.0%) |
| Educational Services | 63 (38.4%) | 101 (61.6%) |
| Health Care & Social Assistance | 0 (0.0%) | 136 (100.0%) |
| Arts, Entertainment & Recreation | 0 (0.0%) | 0 (0.0%) |
| Accommodation & Food Services | 0 (0.0%) | 50 (100.0%) |
| Public Administration | 0 (0.0%) | 0 (0.0%) |
| Total | 695 (53.7%) | 598 (46.3%) |
Education in Hopewell
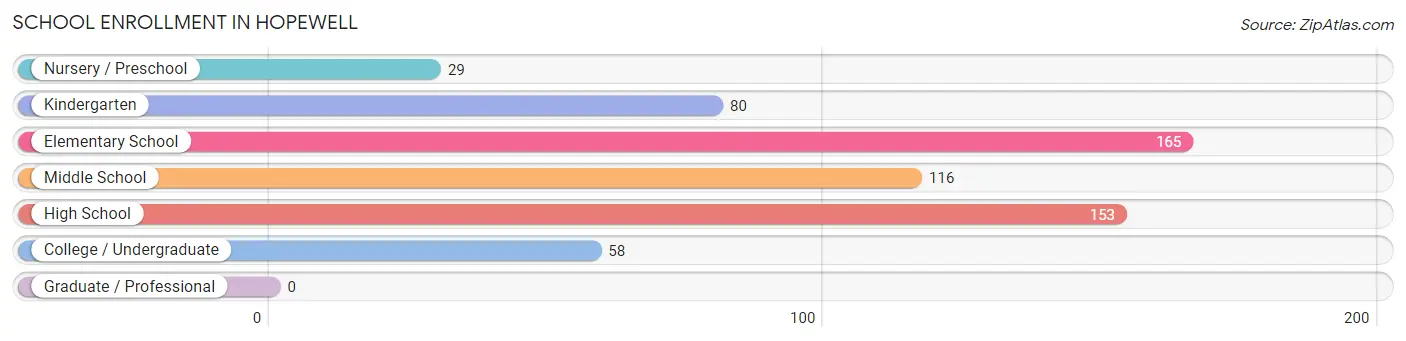
School Enrollment in Hopewell
The most common levels of schooling among the 601 students in Hopewell are elementary school (165 | 27.5%), high school (153 | 25.5%), and middle school (116 | 19.3%).
| School Level | # Students | % Students |
| Nursery / Preschool | 29 | 4.8% |
| Kindergarten | 80 | 13.3% |
| Elementary School | 165 | 27.5% |
| Middle School | 116 | 19.3% |
| High School | 153 | 25.5% |
| College / Undergraduate | 58 | 9.7% |
| Graduate / Professional | 0 | 0.0% |
| Total | 601 | 100.0% |
School Enrollment by Age by Funding Source in Hopewell
Out of a total of 601 students who are enrolled in schools in Hopewell, 44 (7.3%) attend a private institution, while the remaining 557 (92.7%) are enrolled in public schools. The age group of 3 to 4 year olds has the highest likelihood of being enrolled in private schools, with 18 (62.1% in the age bracket) enrolled. Conversely, the age group of 10 to 14 year olds has the lowest likelihood of being enrolled in a private school, with 205 (100.0% in the age bracket) attending a public institution.
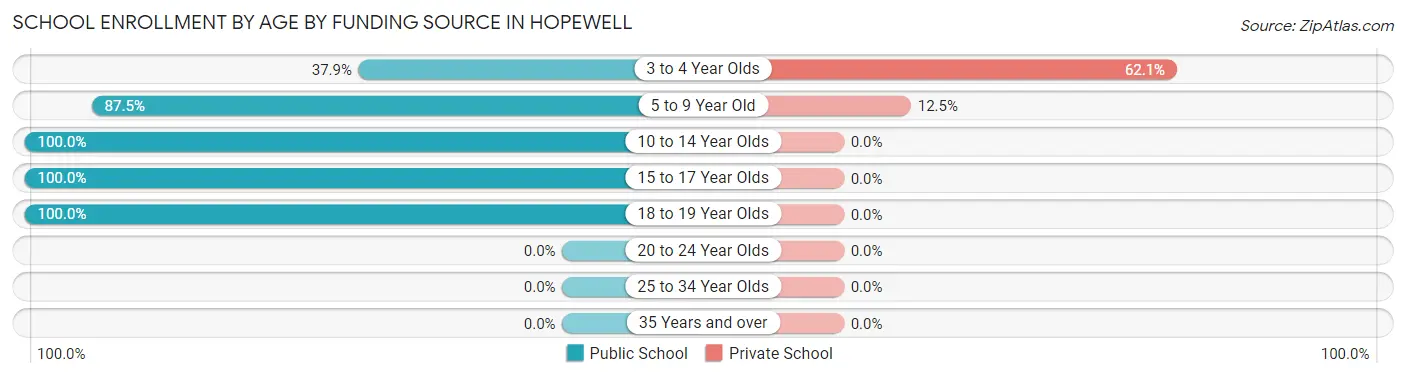
| Age Bracket | Public School | Private School |
| 3 to 4 Year Olds | 11 (37.9%) | 18 (62.1%) |
| 5 to 9 Year Old | 182 (87.5%) | 26 (12.5%) |
| 10 to 14 Year Olds | 205 (100.0%) | 0 (0.0%) |
| 15 to 17 Year Olds | 101 (100.0%) | 0 (0.0%) |
| 18 to 19 Year Olds | 58 (100.0%) | 0 (0.0%) |
| 20 to 24 Year Olds | 0 (0.0%) | 0 (0.0%) |
| 25 to 34 Year Olds | 0 (0.0%) | 0 (0.0%) |
| 35 Years and over | 0 (0.0%) | 0 (0.0%) |
| Total | 557 (92.7%) | 44 (7.3%) |
Educational Attainment by Field of Study in Hopewell
Business (61 | 16.5%), science & technology (60 | 16.3%), social sciences (46 | 12.5%), education (45 | 12.2%), and engineering (41 | 11.1%) are the most common fields of study among 369 individuals in Hopewell who have obtained a bachelor's degree or higher.
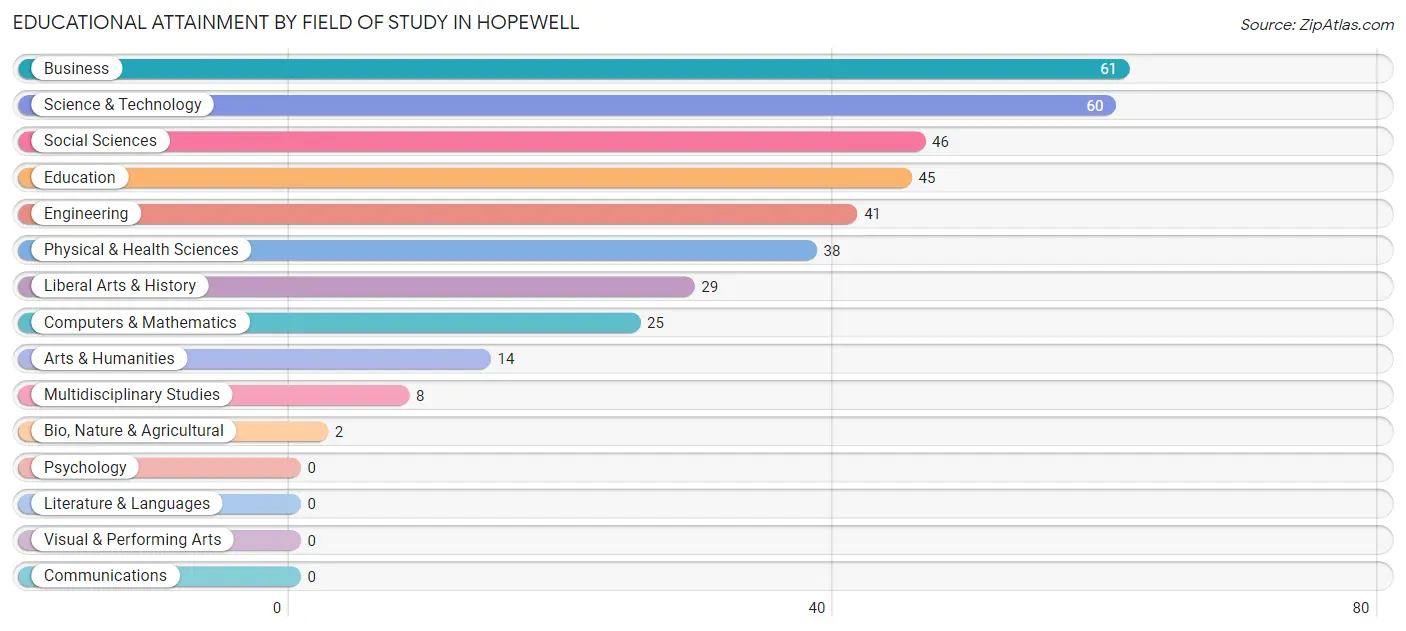
| Field of Study | # Graduates | % Graduates |
| Computers & Mathematics | 25 | 6.8% |
| Bio, Nature & Agricultural | 2 | 0.5% |
| Physical & Health Sciences | 38 | 10.3% |
| Psychology | 0 | 0.0% |
| Social Sciences | 46 | 12.5% |
| Engineering | 41 | 11.1% |
| Multidisciplinary Studies | 8 | 2.2% |
| Science & Technology | 60 | 16.3% |
| Business | 61 | 16.5% |
| Education | 45 | 12.2% |
| Literature & Languages | 0 | 0.0% |
| Liberal Arts & History | 29 | 7.9% |
| Visual & Performing Arts | 0 | 0.0% |
| Communications | 0 | 0.0% |
| Arts & Humanities | 14 | 3.8% |
| Total | 369 | 100.0% |
Transportation & Commute in Hopewell
Vehicle Availability by Sex in Hopewell
The most prevalent vehicle ownership categories in Hopewell are males with 3 vehicles (266, accounting for 38.3%) and females with 3 vehicles (227, making up 44.5%).
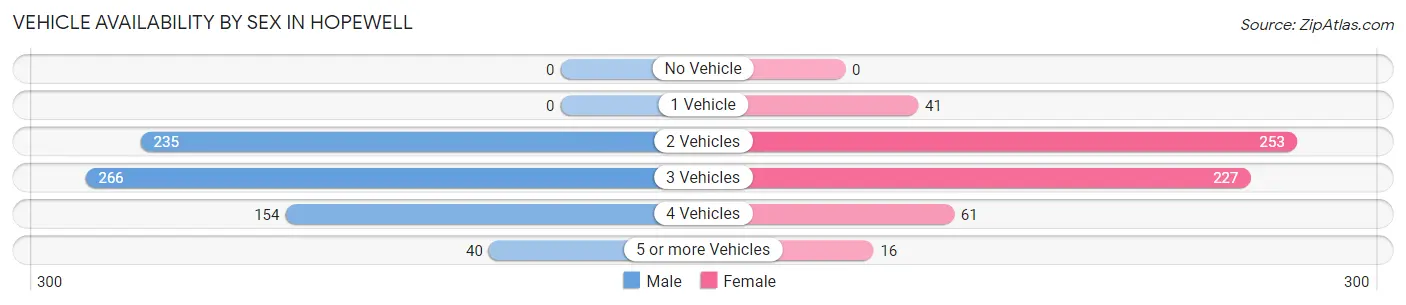
| Vehicles Available | Male | Female |
| No Vehicle | 0 (0.0%) | 0 (0.0%) |
| 1 Vehicle | 0 (0.0%) | 41 (6.9%) |
| 2 Vehicles | 235 (33.8%) | 253 (42.3%) |
| 3 Vehicles | 266 (38.3%) | 227 (38.0%) |
| 4 Vehicles | 154 (22.2%) | 61 (10.2%) |
| 5 or more Vehicles | 40 (5.8%) | 16 (2.7%) |
| Total | 695 (100.0%) | 598 (100.0%) |
Commute Time in Hopewell
The most frequently occuring commute durations in Hopewell are 10 to 14 minutes (384 commuters, 31.1%), 15 to 19 minutes (226 commuters, 18.3%), and 20 to 24 minutes (207 commuters, 16.8%).
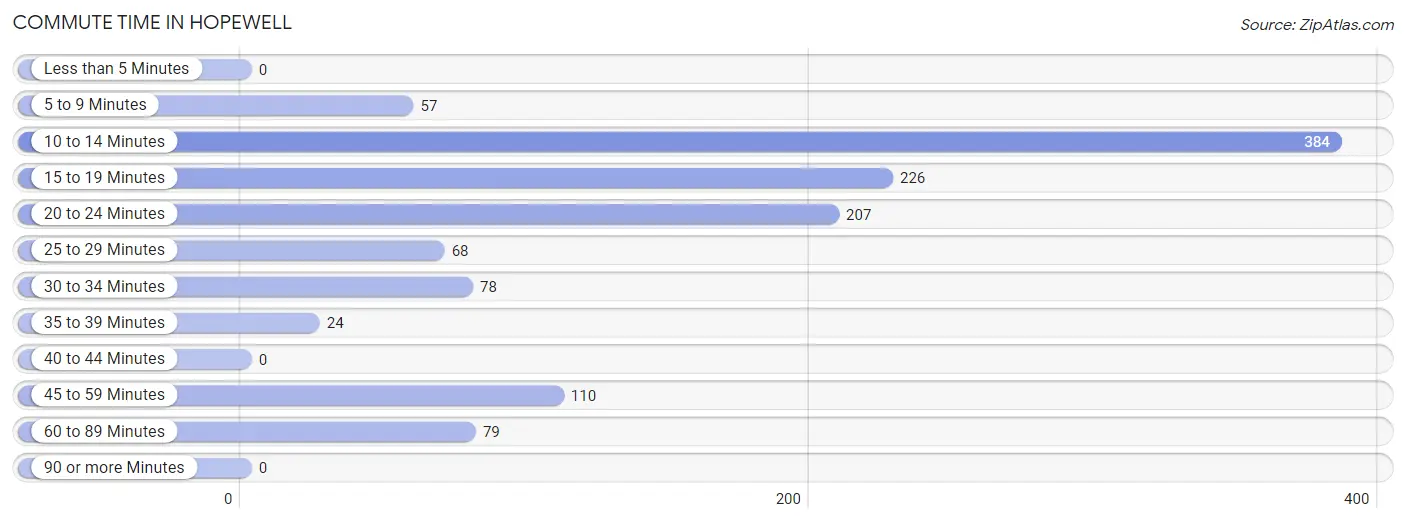
| Commute Time | # Commuters | % Commuters |
| Less than 5 Minutes | 0 | 0.0% |
| 5 to 9 Minutes | 57 | 4.6% |
| 10 to 14 Minutes | 384 | 31.1% |
| 15 to 19 Minutes | 226 | 18.3% |
| 20 to 24 Minutes | 207 | 16.8% |
| 25 to 29 Minutes | 68 | 5.5% |
| 30 to 34 Minutes | 78 | 6.3% |
| 35 to 39 Minutes | 24 | 1.9% |
| 40 to 44 Minutes | 0 | 0.0% |
| 45 to 59 Minutes | 110 | 8.9% |
| 60 to 89 Minutes | 79 | 6.4% |
| 90 or more Minutes | 0 | 0.0% |
Commute Time by Sex in Hopewell
The most common commute times in Hopewell are 10 to 14 minutes (216 commuters, 31.9%) for males and 10 to 14 minutes (168 commuters, 30.2%) for females.
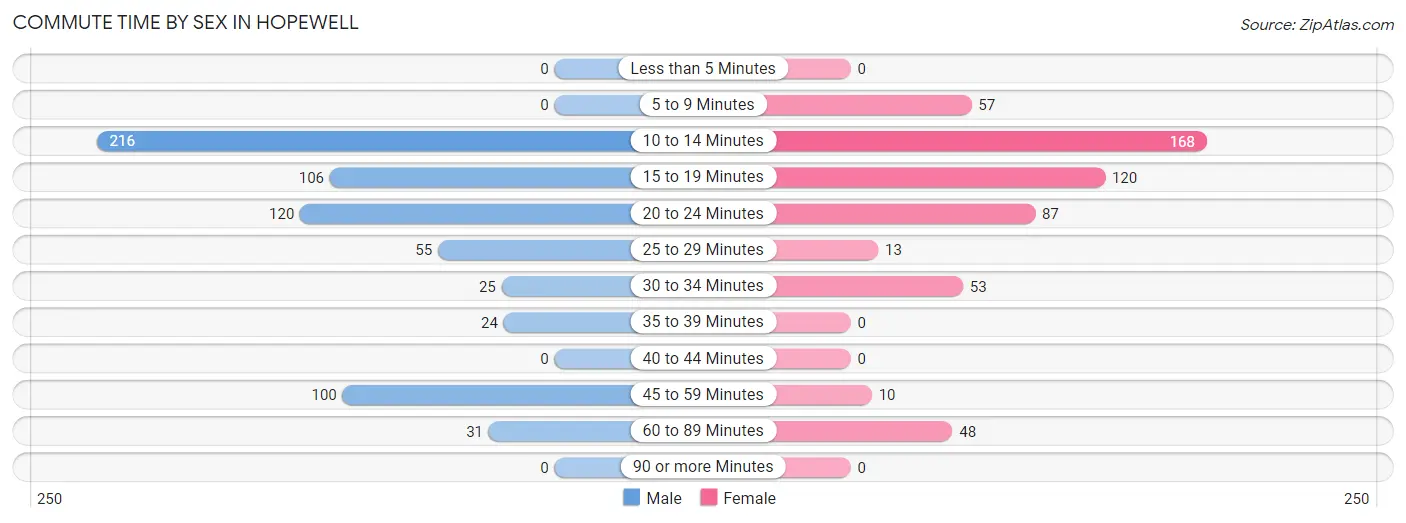
| Commute Time | Male | Female |
| Less than 5 Minutes | 0 (0.0%) | 0 (0.0%) |
| 5 to 9 Minutes | 0 (0.0%) | 57 (10.2%) |
| 10 to 14 Minutes | 216 (31.9%) | 168 (30.2%) |
| 15 to 19 Minutes | 106 (15.7%) | 120 (21.6%) |
| 20 to 24 Minutes | 120 (17.7%) | 87 (15.7%) |
| 25 to 29 Minutes | 55 (8.1%) | 13 (2.3%) |
| 30 to 34 Minutes | 25 (3.7%) | 53 (9.5%) |
| 35 to 39 Minutes | 24 (3.5%) | 0 (0.0%) |
| 40 to 44 Minutes | 0 (0.0%) | 0 (0.0%) |
| 45 to 59 Minutes | 100 (14.8%) | 10 (1.8%) |
| 60 to 89 Minutes | 31 (4.6%) | 48 (8.6%) |
| 90 or more Minutes | 0 (0.0%) | 0 (0.0%) |
Time of Departure to Work by Sex in Hopewell
The most frequent times of departure to work in Hopewell are 7:30 AM to 7:59 AM (114, 16.8%) for males and 7:00 AM to 7:29 AM (140, 25.2%) for females.
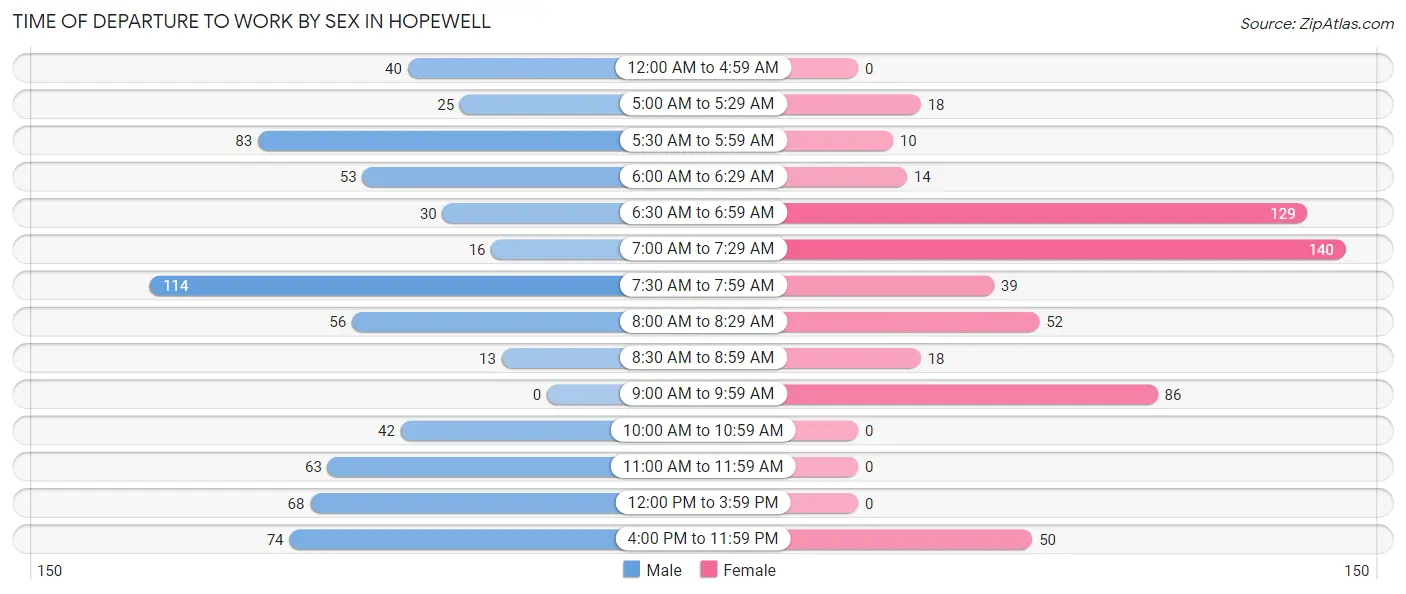
| Time of Departure | Male | Female |
| 12:00 AM to 4:59 AM | 40 (5.9%) | 0 (0.0%) |
| 5:00 AM to 5:29 AM | 25 (3.7%) | 18 (3.2%) |
| 5:30 AM to 5:59 AM | 83 (12.3%) | 10 (1.8%) |
| 6:00 AM to 6:29 AM | 53 (7.8%) | 14 (2.5%) |
| 6:30 AM to 6:59 AM | 30 (4.4%) | 129 (23.2%) |
| 7:00 AM to 7:29 AM | 16 (2.4%) | 140 (25.2%) |
| 7:30 AM to 7:59 AM | 114 (16.8%) | 39 (7.0%) |
| 8:00 AM to 8:29 AM | 56 (8.3%) | 52 (9.3%) |
| 8:30 AM to 8:59 AM | 13 (1.9%) | 18 (3.2%) |
| 9:00 AM to 9:59 AM | 0 (0.0%) | 86 (15.5%) |
| 10:00 AM to 10:59 AM | 42 (6.2%) | 0 (0.0%) |
| 11:00 AM to 11:59 AM | 63 (9.3%) | 0 (0.0%) |
| 12:00 PM to 3:59 PM | 68 (10.0%) | 0 (0.0%) |
| 4:00 PM to 11:59 PM | 74 (10.9%) | 50 (9.0%) |
| Total | 677 (100.0%) | 556 (100.0%) |
Housing Occupancy in Hopewell
Occupancy by Ownership in Hopewell
Of the total 895 dwellings in Hopewell, owner-occupied units account for 688 (76.9%), while renter-occupied units make up 207 (23.1%).
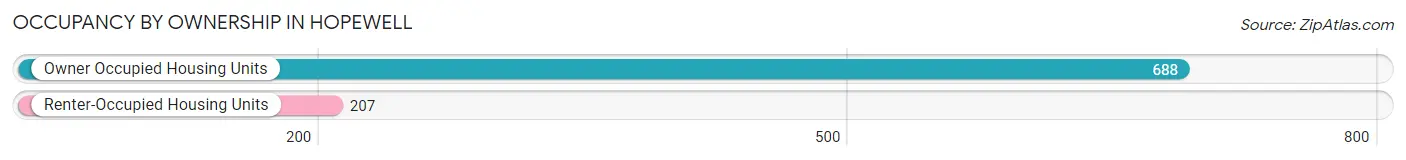
| Occupancy | # Housing Units | % Housing Units |
| Owner Occupied Housing Units | 688 | 76.9% |
| Renter-Occupied Housing Units | 207 | 23.1% |
| Total Occupied Housing Units | 895 | 100.0% |
Occupancy by Household Size in Hopewell
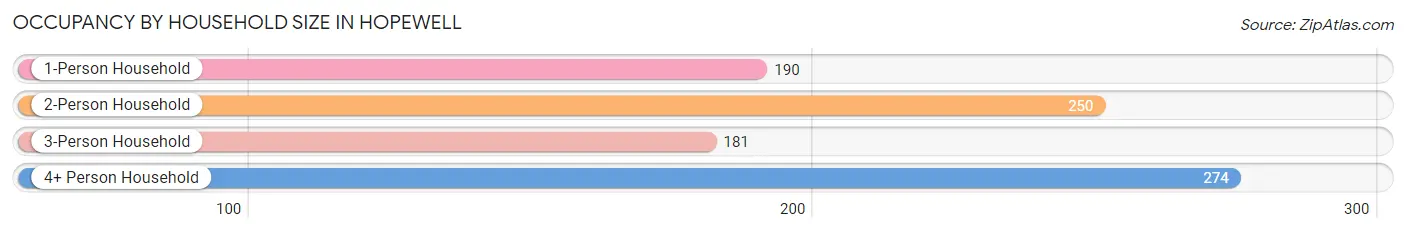
| Household Size | # Housing Units | % Housing Units |
| 1-Person Household | 190 | 21.2% |
| 2-Person Household | 250 | 27.9% |
| 3-Person Household | 181 | 20.2% |
| 4+ Person Household | 274 | 30.6% |
| Total Housing Units | 895 | 100.0% |
Occupancy by Ownership by Household Size in Hopewell
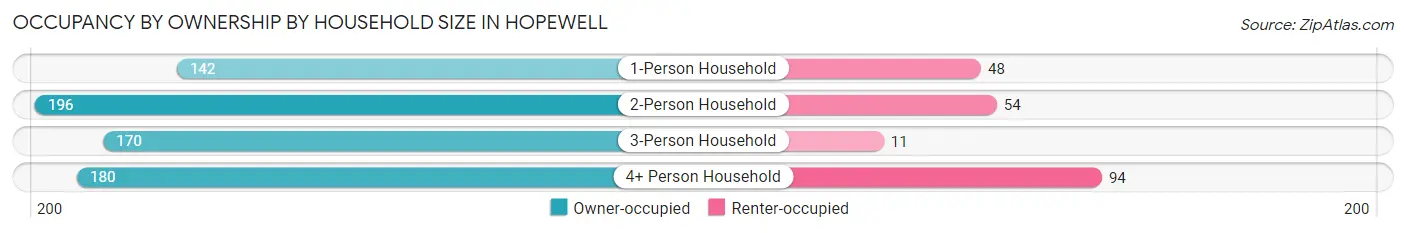
| Household Size | Owner-occupied | Renter-occupied |
| 1-Person Household | 142 (74.7%) | 48 (25.3%) |
| 2-Person Household | 196 (78.4%) | 54 (21.6%) |
| 3-Person Household | 170 (93.9%) | 11 (6.1%) |
| 4+ Person Household | 180 (65.7%) | 94 (34.3%) |
| Total Housing Units | 688 (76.9%) | 207 (23.1%) |
Occupancy by Educational Attainment in Hopewell
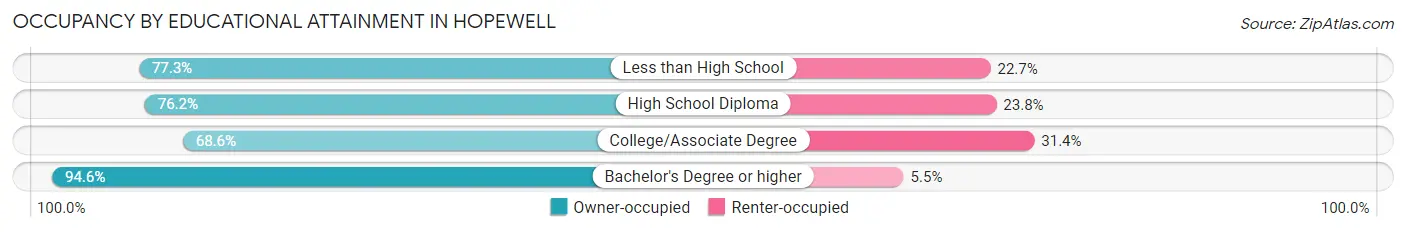
| Household Size | Owner-occupied | Renter-occupied |
| Less than High School | 75 (77.3%) | 22 (22.7%) |
| High School Diploma | 131 (76.2%) | 41 (23.8%) |
| College/Associate Degree | 291 (68.6%) | 133 (31.4%) |
| Bachelor's Degree or higher | 191 (94.6%) | 11 (5.4%) |
Occupancy by Age of Householder in Hopewell
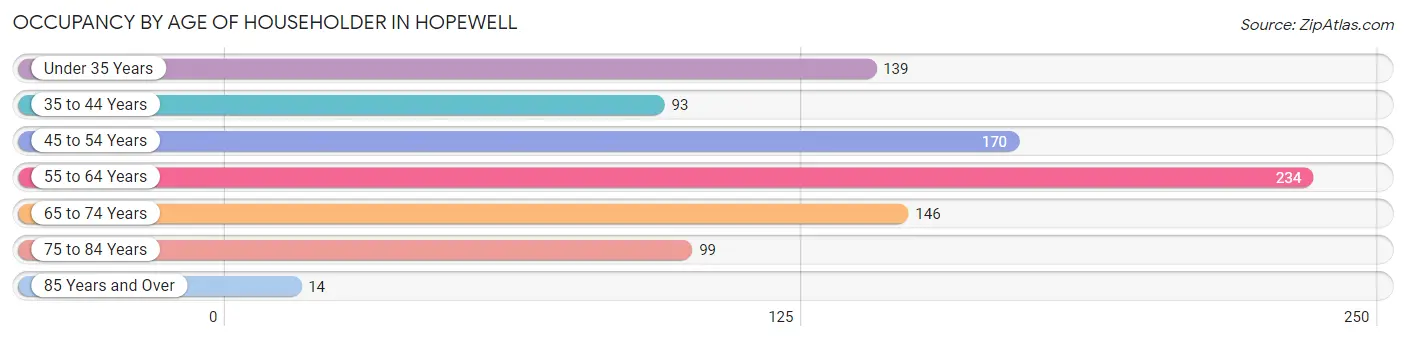
| Age Bracket | # Households | % Households |
| Under 35 Years | 139 | 15.5% |
| 35 to 44 Years | 93 | 10.4% |
| 45 to 54 Years | 170 | 19.0% |
| 55 to 64 Years | 234 | 26.2% |
| 65 to 74 Years | 146 | 16.3% |
| 75 to 84 Years | 99 | 11.1% |
| 85 Years and Over | 14 | 1.6% |
| Total | 895 | 100.0% |
Housing Finances in Hopewell
Median Income by Occupancy in Hopewell
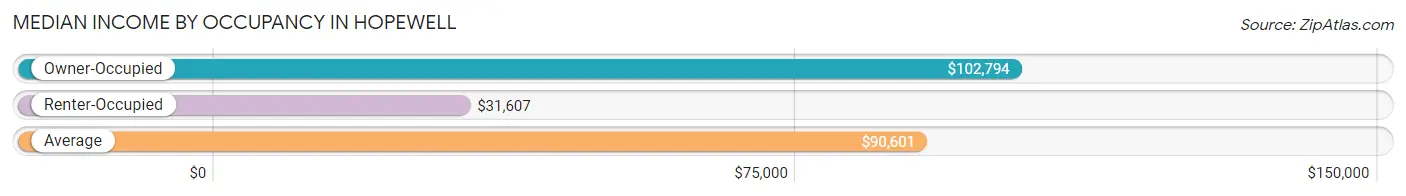
| Occupancy Type | # Households | Median Income |
| Owner-Occupied | 688 (76.9%) | $102,794 |
| Renter-Occupied | 207 (23.1%) | $31,607 |
| Average | 895 (100.0%) | $90,601 |
Occupancy by Householder Income Bracket in Hopewell
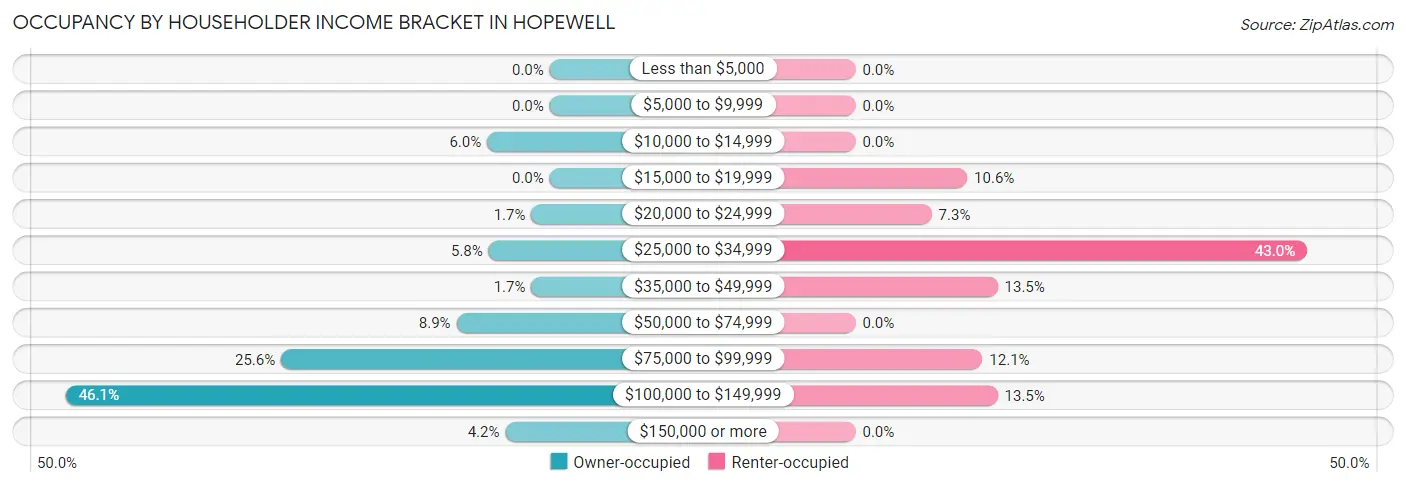
| Income Bracket | Owner-occupied | Renter-occupied |
| Less than $5,000 | 0 (0.0%) | 0 (0.0%) |
| $5,000 to $9,999 | 0 (0.0%) | 0 (0.0%) |
| $10,000 to $14,999 | 41 (6.0%) | 0 (0.0%) |
| $15,000 to $19,999 | 0 (0.0%) | 22 (10.6%) |
| $20,000 to $24,999 | 12 (1.7%) | 15 (7.2%) |
| $25,000 to $34,999 | 40 (5.8%) | 89 (43.0%) |
| $35,000 to $49,999 | 12 (1.7%) | 28 (13.5%) |
| $50,000 to $74,999 | 61 (8.9%) | 0 (0.0%) |
| $75,000 to $99,999 | 176 (25.6%) | 25 (12.1%) |
| $100,000 to $149,999 | 317 (46.1%) | 28 (13.5%) |
| $150,000 or more | 29 (4.2%) | 0 (0.0%) |
| Total | 688 (100.0%) | 207 (100.0%) |
Monthly Housing Cost Tiers in Hopewell
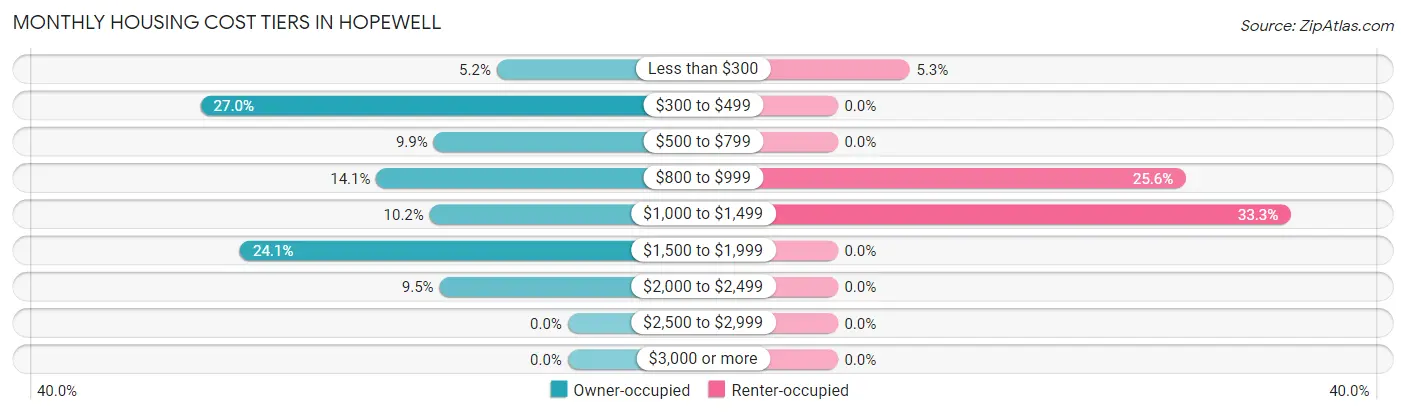
| Monthly Cost | Owner-occupied | Renter-occupied |
| Less than $300 | 36 (5.2%) | 11 (5.3%) |
| $300 to $499 | 186 (27.0%) | 0 (0.0%) |
| $500 to $799 | 68 (9.9%) | 0 (0.0%) |
| $800 to $999 | 97 (14.1%) | 53 (25.6%) |
| $1,000 to $1,499 | 70 (10.2%) | 69 (33.3%) |
| $1,500 to $1,999 | 166 (24.1%) | 0 (0.0%) |
| $2,000 to $2,499 | 65 (9.5%) | 0 (0.0%) |
| $2,500 to $2,999 | 0 (0.0%) | 0 (0.0%) |
| $3,000 or more | 0 (0.0%) | 0 (0.0%) |
| Total | 688 (100.0%) | 207 (100.0%) |
Physical Housing Characteristics in Hopewell
Housing Structures in Hopewell
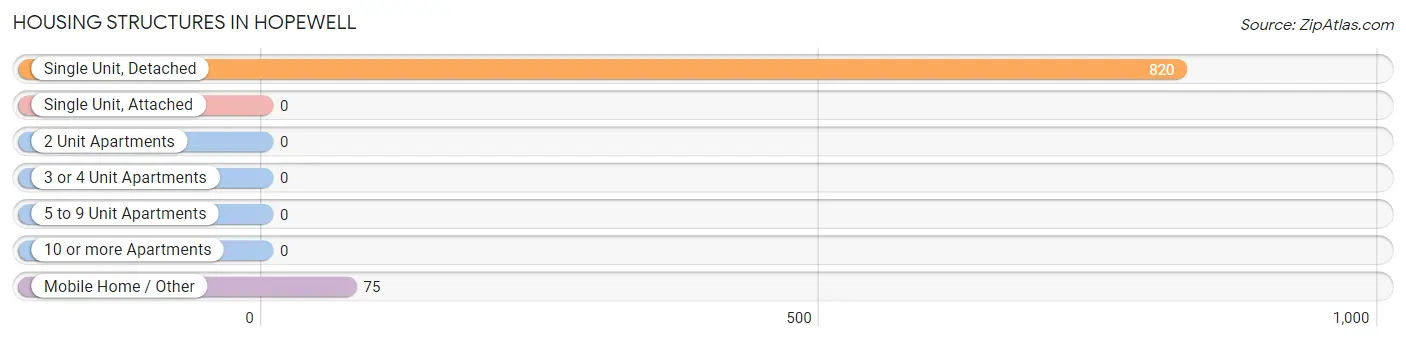
| Structure Type | # Housing Units | % Housing Units |
| Single Unit, Detached | 820 | 91.6% |
| Single Unit, Attached | 0 | 0.0% |
| 2 Unit Apartments | 0 | 0.0% |
| 3 or 4 Unit Apartments | 0 | 0.0% |
| 5 to 9 Unit Apartments | 0 | 0.0% |
| 10 or more Apartments | 0 | 0.0% |
| Mobile Home / Other | 75 | 8.4% |
| Total | 895 | 100.0% |
Housing Structures by Occupancy in Hopewell
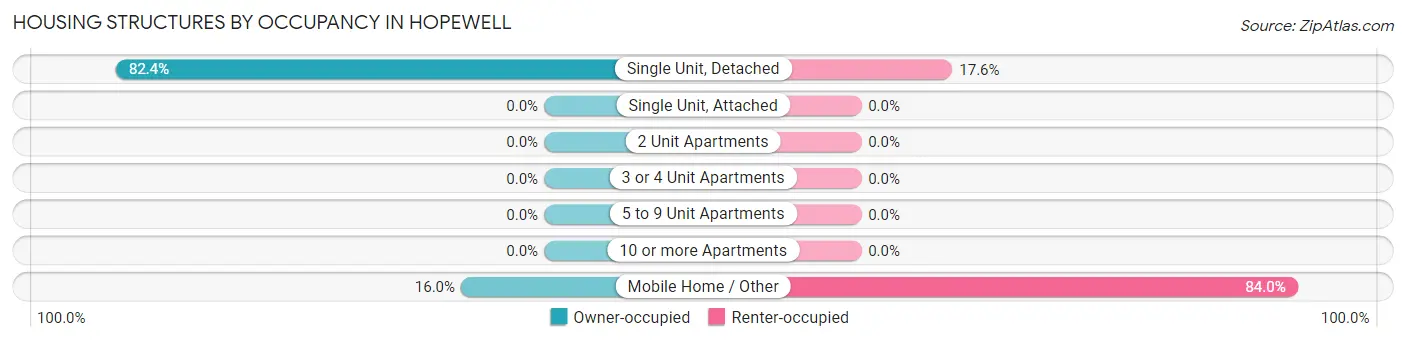
| Structure Type | Owner-occupied | Renter-occupied |
| Single Unit, Detached | 676 (82.4%) | 144 (17.6%) |
| Single Unit, Attached | 0 (0.0%) | 0 (0.0%) |
| 2 Unit Apartments | 0 (0.0%) | 0 (0.0%) |
| 3 or 4 Unit Apartments | 0 (0.0%) | 0 (0.0%) |
| 5 to 9 Unit Apartments | 0 (0.0%) | 0 (0.0%) |
| 10 or more Apartments | 0 (0.0%) | 0 (0.0%) |
| Mobile Home / Other | 12 (16.0%) | 63 (84.0%) |
| Total | 688 (76.9%) | 207 (23.1%) |
Housing Structures by Number of Rooms in Hopewell
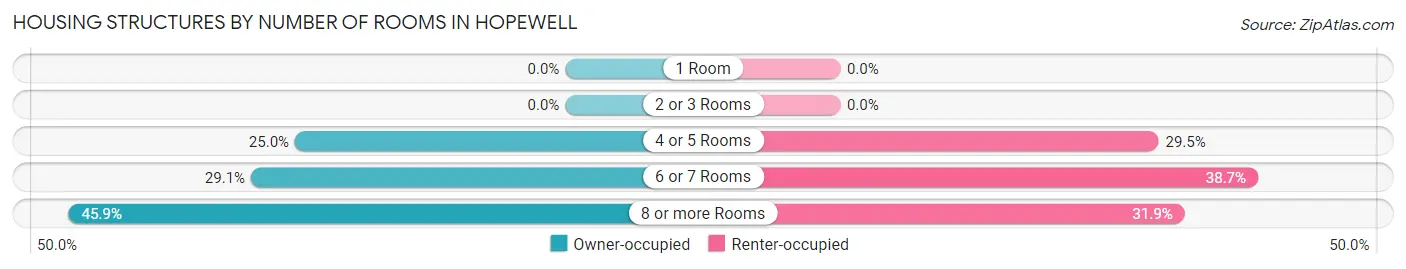
| Number of Rooms | Owner-occupied | Renter-occupied |
| 1 Room | 0 (0.0%) | 0 (0.0%) |
| 2 or 3 Rooms | 0 (0.0%) | 0 (0.0%) |
| 4 or 5 Rooms | 172 (25.0%) | 61 (29.5%) |
| 6 or 7 Rooms | 200 (29.1%) | 80 (38.7%) |
| 8 or more Rooms | 316 (45.9%) | 66 (31.9%) |
| Total | 688 (100.0%) | 207 (100.0%) |
Housing Structure by Heating Type in Hopewell
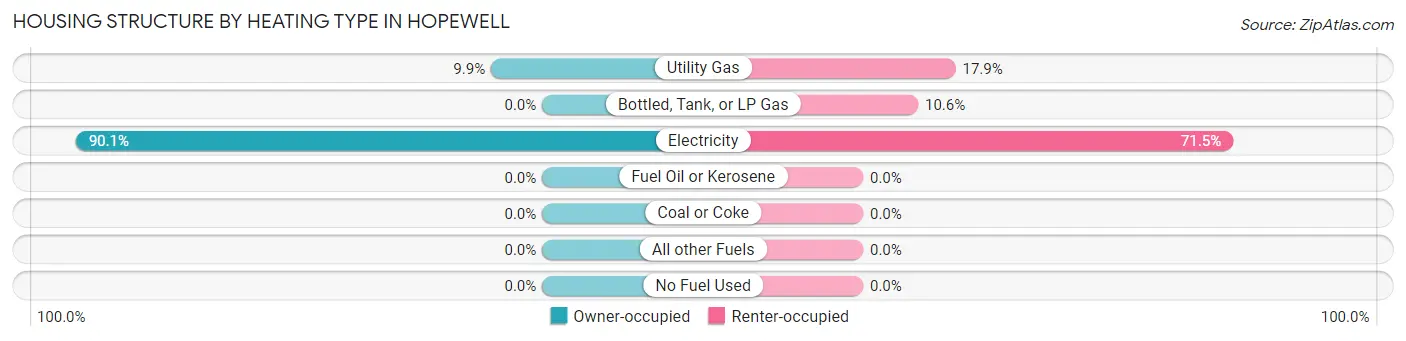
| Heating Type | Owner-occupied | Renter-occupied |
| Utility Gas | 68 (9.9%) | 37 (17.9%) |
| Bottled, Tank, or LP Gas | 0 (0.0%) | 22 (10.6%) |
| Electricity | 620 (90.1%) | 148 (71.5%) |
| Fuel Oil or Kerosene | 0 (0.0%) | 0 (0.0%) |
| Coal or Coke | 0 (0.0%) | 0 (0.0%) |
| All other Fuels | 0 (0.0%) | 0 (0.0%) |
| No Fuel Used | 0 (0.0%) | 0 (0.0%) |
| Total | 688 (100.0%) | 207 (100.0%) |
Household Vehicle Usage in Hopewell
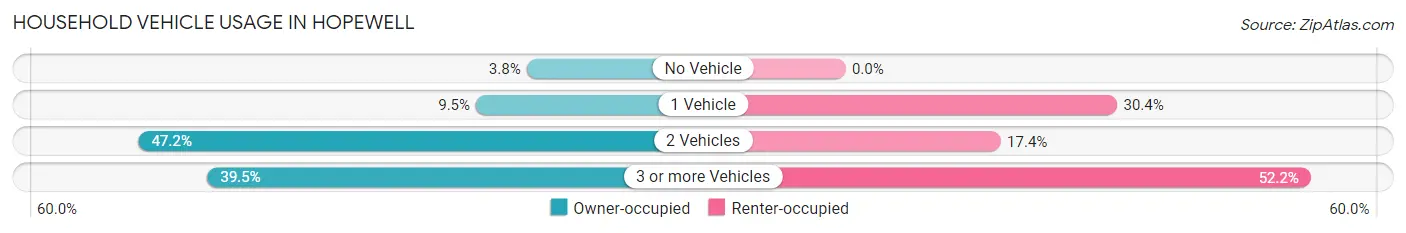
| Vehicles per Household | Owner-occupied | Renter-occupied |
| No Vehicle | 26 (3.8%) | 0 (0.0%) |
| 1 Vehicle | 65 (9.5%) | 63 (30.4%) |
| 2 Vehicles | 325 (47.2%) | 36 (17.4%) |
| 3 or more Vehicles | 272 (39.5%) | 108 (52.2%) |
| Total | 688 (100.0%) | 207 (100.0%) |
Real Estate & Mortgages in Hopewell
Real Estate and Mortgage Overview in Hopewell
| Characteristic | Without Mortgage | With Mortgage |
| Housing Units | 221 | 467 |
| Median Property Value | $307,400 | $262,300 |
| Median Household Income | $83,482 | $16 |
| Monthly Housing Costs | $439 | $0 |
| Real Estate Taxes | $1,173 | $0 |
Property Value by Mortgage Status in Hopewell
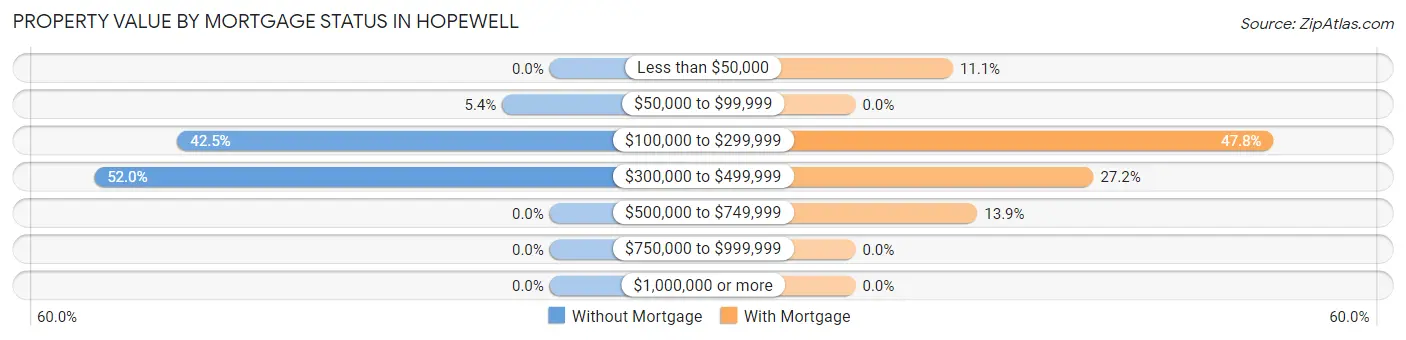
| Property Value | Without Mortgage | With Mortgage |
| Less than $50,000 | 0 (0.0%) | 52 (11.1%) |
| $50,000 to $99,999 | 12 (5.4%) | 0 (0.0%) |
| $100,000 to $299,999 | 94 (42.5%) | 223 (47.7%) |
| $300,000 to $499,999 | 115 (52.0%) | 127 (27.2%) |
| $500,000 to $749,999 | 0 (0.0%) | 65 (13.9%) |
| $750,000 to $999,999 | 0 (0.0%) | 0 (0.0%) |
| $1,000,000 or more | 0 (0.0%) | 0 (0.0%) |
| Total | 221 (100.0%) | 467 (100.0%) |
Household Income by Mortgage Status in Hopewell
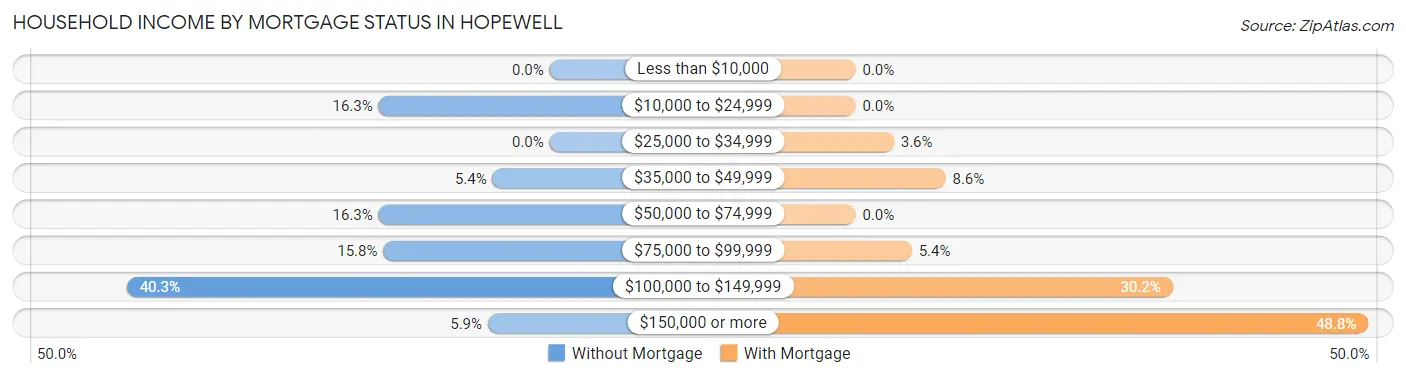
| Household Income | Without Mortgage | With Mortgage |
| Less than $10,000 | 0 (0.0%) | 0 (0.0%) |
| $10,000 to $24,999 | 36 (16.3%) | 0 (0.0%) |
| $25,000 to $34,999 | 0 (0.0%) | 17 (3.6%) |
| $35,000 to $49,999 | 12 (5.4%) | 40 (8.6%) |
| $50,000 to $74,999 | 36 (16.3%) | 0 (0.0%) |
| $75,000 to $99,999 | 35 (15.8%) | 25 (5.3%) |
| $100,000 to $149,999 | 89 (40.3%) | 141 (30.2%) |
| $150,000 or more | 13 (5.9%) | 228 (48.8%) |
| Total | 221 (100.0%) | 467 (100.0%) |
Property Value to Household Income Ratio in Hopewell
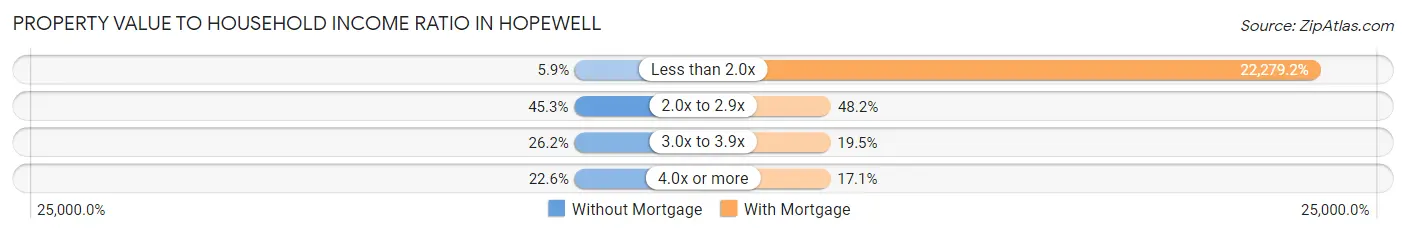
| Value-to-Income Ratio | Without Mortgage | With Mortgage |
| Less than 2.0x | 13 (5.9%) | 104,044 (22,279.2%) |
| 2.0x to 2.9x | 100 (45.3%) | 225 (48.2%) |
| 3.0x to 3.9x | 58 (26.2%) | 91 (19.5%) |
| 4.0x or more | 50 (22.6%) | 80 (17.1%) |
| Total | 221 (100.0%) | 467 (100.0%) |
Real Estate Taxes by Mortgage Status in Hopewell
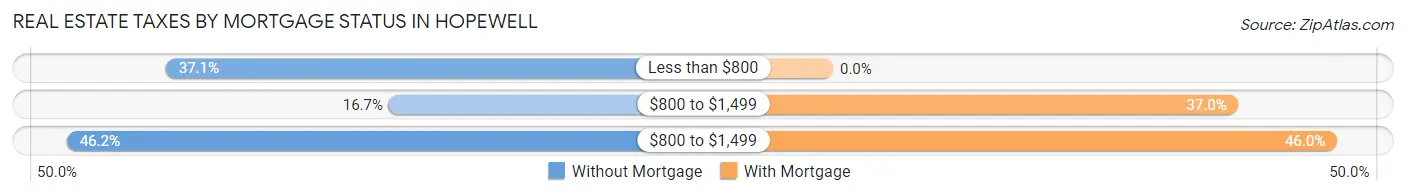
| Property Taxes | Without Mortgage | With Mortgage |
| Less than $800 | 82 (37.1%) | 0 (0.0%) |
| $800 to $1,499 | 37 (16.7%) | 173 (37.0%) |
| $800 to $1,499 | 102 (46.2%) | 215 (46.0%) |
| Total | 221 (100.0%) | 467 (100.0%) |
Health & Disability in Hopewell
Health Insurance Coverage by Age in Hopewell
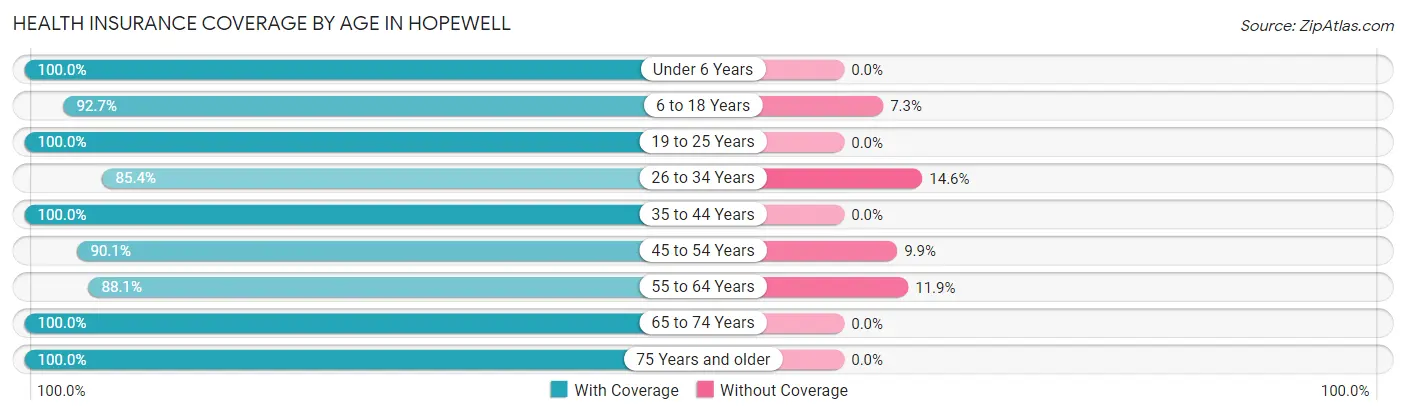
| Age Bracket | With Coverage | Without Coverage |
| Under 6 Years | 61 (100.0%) | 0 (0.0%) |
| 6 to 18 Years | 664 (92.7%) | 52 (7.3%) |
| 19 to 25 Years | 116 (100.0%) | 0 (0.0%) |
| 26 to 34 Years | 264 (85.4%) | 45 (14.6%) |
| 35 to 44 Years | 177 (100.0%) | 0 (0.0%) |
| 45 to 54 Years | 356 (90.1%) | 39 (9.9%) |
| 55 to 64 Years | 295 (88.1%) | 40 (11.9%) |
| 65 to 74 Years | 290 (100.0%) | 0 (0.0%) |
| 75 Years and older | 207 (100.0%) | 0 (0.0%) |
| Total | 2,430 (93.2%) | 176 (6.8%) |
Health Insurance Coverage by Citizenship Status in Hopewell
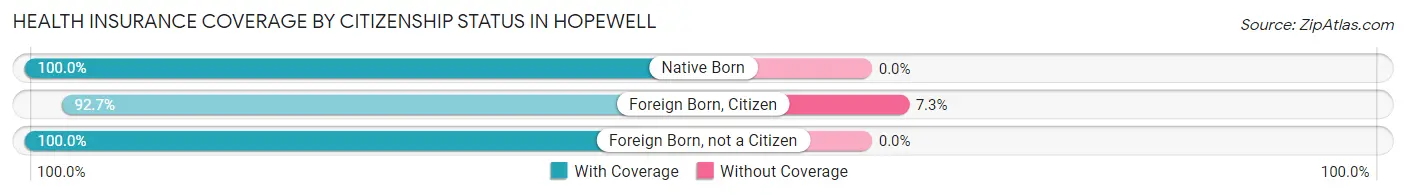
| Citizenship Status | With Coverage | Without Coverage |
| Native Born | 61 (100.0%) | 0 (0.0%) |
| Foreign Born, Citizen | 664 (92.7%) | 52 (7.3%) |
| Foreign Born, not a Citizen | 116 (100.0%) | 0 (0.0%) |
Health Insurance Coverage by Household Income in Hopewell
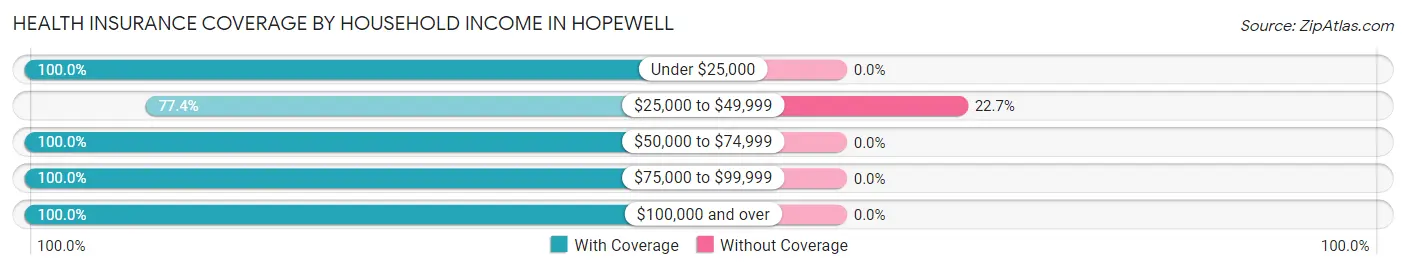
| Household Income | With Coverage | Without Coverage |
| Under $25,000 | 104 (100.0%) | 0 (0.0%) |
| $25,000 to $49,999 | 601 (77.3%) | 176 (22.7%) |
| $50,000 to $74,999 | 172 (100.0%) | 0 (0.0%) |
| $75,000 to $99,999 | 561 (100.0%) | 0 (0.0%) |
| $100,000 and over | 988 (100.0%) | 0 (0.0%) |
Public vs Private Health Insurance Coverage by Age in Hopewell
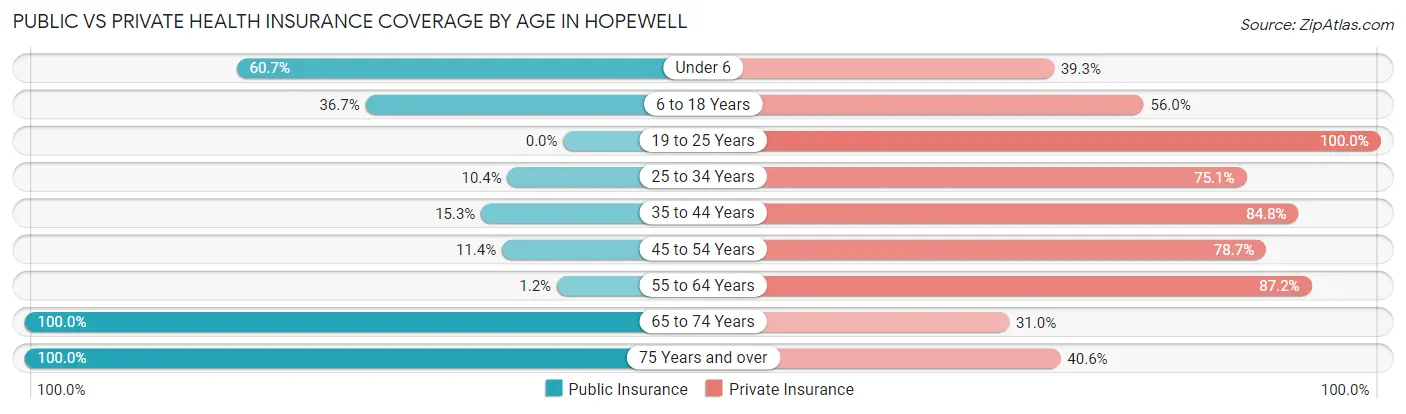
| Age Bracket | Public Insurance | Private Insurance |
| Under 6 | 37 (60.7%) | 24 (39.3%) |
| 6 to 18 Years | 263 (36.7%) | 401 (56.0%) |
| 19 to 25 Years | 0 (0.0%) | 116 (100.0%) |
| 25 to 34 Years | 32 (10.4%) | 232 (75.1%) |
| 35 to 44 Years | 27 (15.2%) | 150 (84.8%) |
| 45 to 54 Years | 45 (11.4%) | 311 (78.7%) |
| 55 to 64 Years | 4 (1.2%) | 292 (87.2%) |
| 65 to 74 Years | 290 (100.0%) | 90 (31.0%) |
| 75 Years and over | 207 (100.0%) | 84 (40.6%) |
| Total | 905 (34.7%) | 1,700 (65.2%) |
Disability Status by Sex by Age in Hopewell
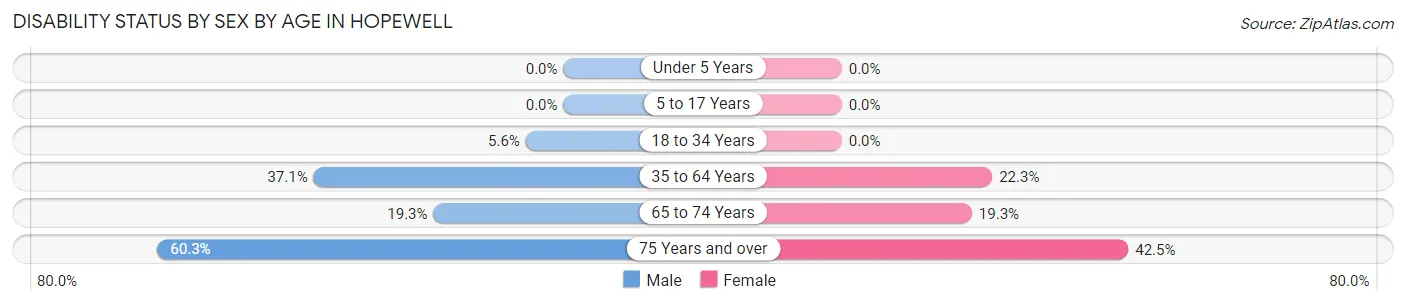
| Age Bracket | Male | Female |
| Under 5 Years | 0 (0.0%) | 0 (0.0%) |
| 5 to 17 Years | 0 (0.0%) | 0 (0.0%) |
| 18 to 34 Years | 15 (5.6%) | 0 (0.0%) |
| 35 to 64 Years | 197 (37.1%) | 84 (22.3%) |
| 65 to 74 Years | 22 (19.3%) | 34 (19.3%) |
| 75 Years and over | 44 (60.3%) | 57 (42.5%) |
Disability Class by Sex by Age in Hopewell
Disability Class: Hearing Difficulty
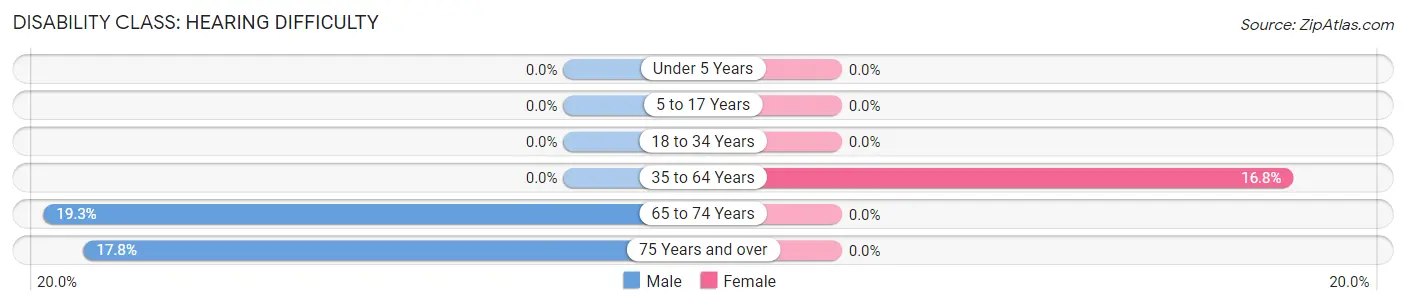
| Age Bracket | Male | Female |
| Under 5 Years | 0 (0.0%) | 0 (0.0%) |
| 5 to 17 Years | 0 (0.0%) | 0 (0.0%) |
| 18 to 34 Years | 0 (0.0%) | 0 (0.0%) |
| 35 to 64 Years | 0 (0.0%) | 63 (16.8%) |
| 65 to 74 Years | 22 (19.3%) | 0 (0.0%) |
| 75 Years and over | 13 (17.8%) | 0 (0.0%) |
Disability Class: Vision Difficulty
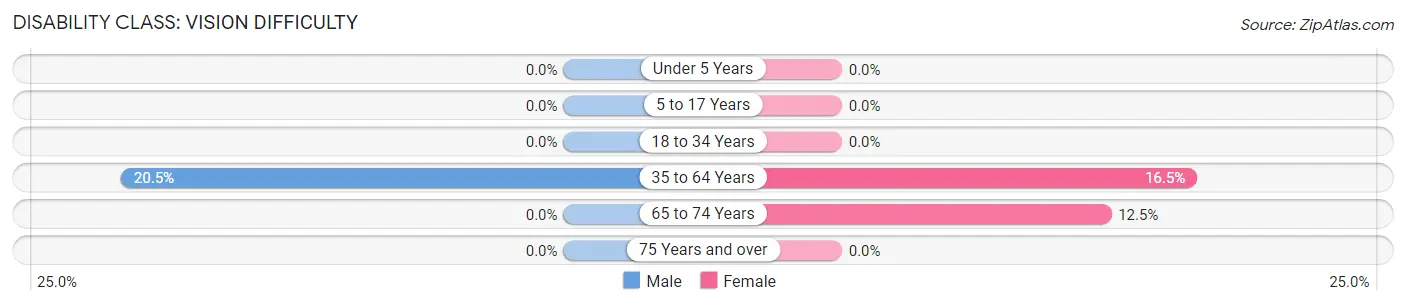
| Age Bracket | Male | Female |
| Under 5 Years | 0 (0.0%) | 0 (0.0%) |
| 5 to 17 Years | 0 (0.0%) | 0 (0.0%) |
| 18 to 34 Years | 0 (0.0%) | 0 (0.0%) |
| 35 to 64 Years | 109 (20.5%) | 62 (16.5%) |
| 65 to 74 Years | 0 (0.0%) | 22 (12.5%) |
| 75 Years and over | 0 (0.0%) | 0 (0.0%) |
Disability Class: Cognitive Difficulty
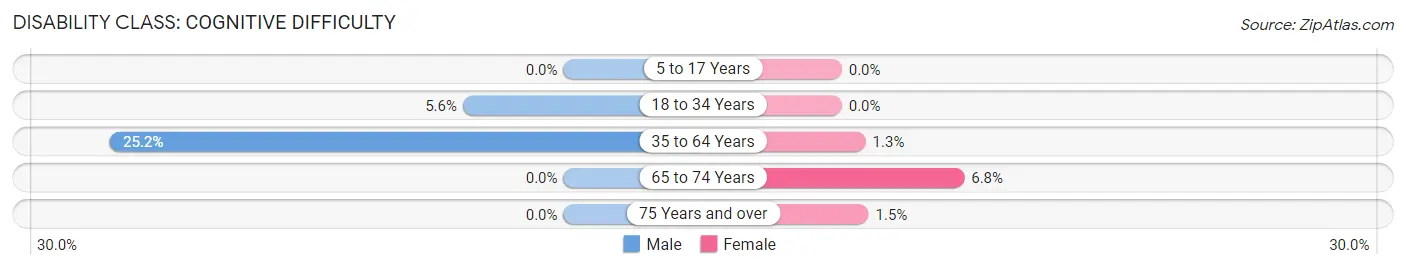
| Age Bracket | Male | Female |
| 5 to 17 Years | 0 (0.0%) | 0 (0.0%) |
| 18 to 34 Years | 15 (5.6%) | 0 (0.0%) |
| 35 to 64 Years | 134 (25.2%) | 5 (1.3%) |
| 65 to 74 Years | 0 (0.0%) | 12 (6.8%) |
| 75 Years and over | 0 (0.0%) | 2 (1.5%) |
Disability Class: Ambulatory Difficulty
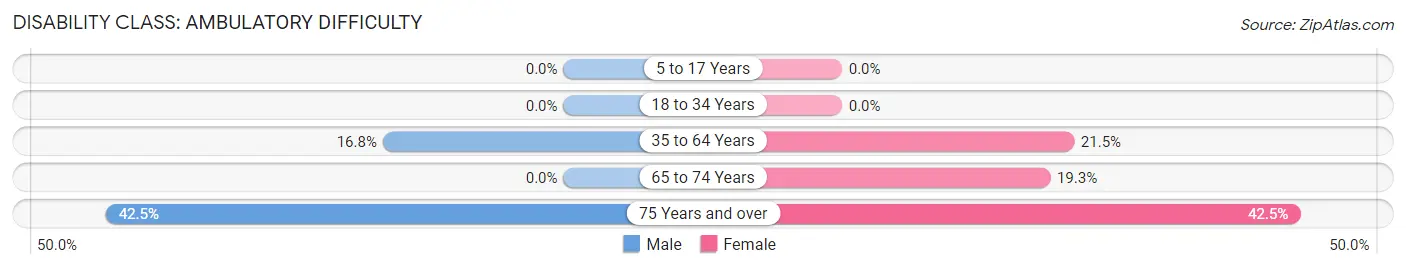
| Age Bracket | Male | Female |
| 5 to 17 Years | 0 (0.0%) | 0 (0.0%) |
| 18 to 34 Years | 0 (0.0%) | 0 (0.0%) |
| 35 to 64 Years | 89 (16.8%) | 81 (21.5%) |
| 65 to 74 Years | 0 (0.0%) | 34 (19.3%) |
| 75 Years and over | 31 (42.5%) | 57 (42.5%) |
Disability Class: Self-Care Difficulty
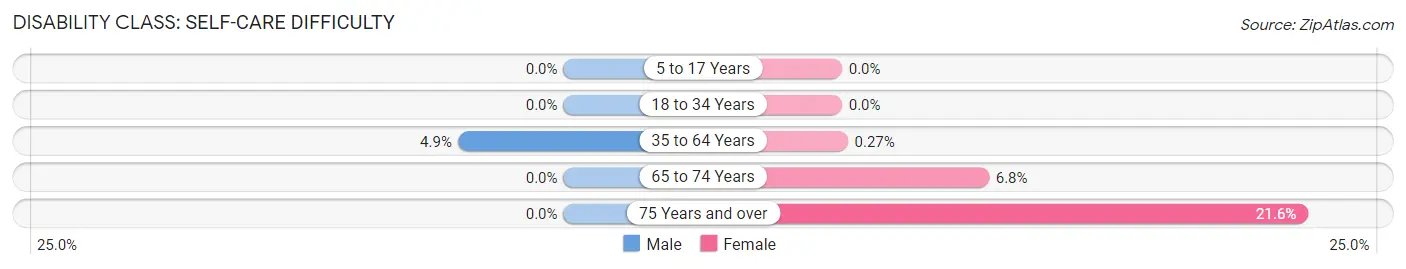
| Age Bracket | Male | Female |
| 5 to 17 Years | 0 (0.0%) | 0 (0.0%) |
| 18 to 34 Years | 0 (0.0%) | 0 (0.0%) |
| 35 to 64 Years | 26 (4.9%) | 1 (0.3%) |
| 65 to 74 Years | 0 (0.0%) | 12 (6.8%) |
| 75 Years and over | 0 (0.0%) | 29 (21.6%) |
Technology Access in Hopewell
Computing Device Access in Hopewell
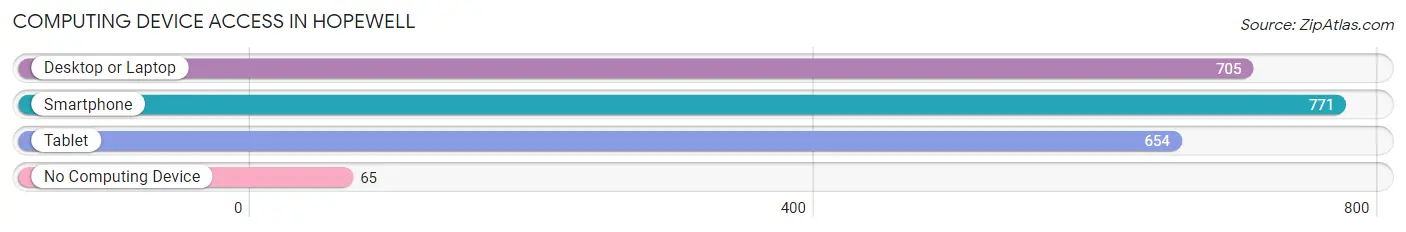
| Device Type | # Households | % Households |
| Desktop or Laptop | 705 | 78.8% |
| Smartphone | 771 | 86.2% |
| Tablet | 654 | 73.1% |
| No Computing Device | 65 | 7.3% |
| Total | 895 | 100.0% |
Internet Access in Hopewell
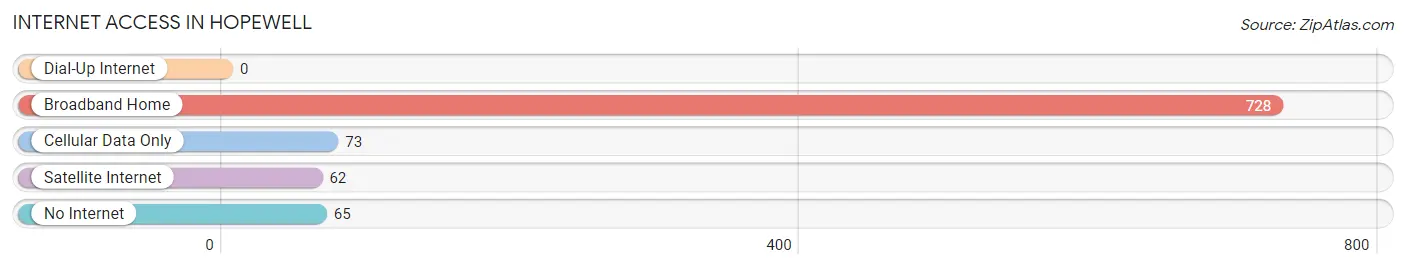
| Internet Type | # Households | % Households |
| Dial-Up Internet | 0 | 0.0% |
| Broadband Home | 728 | 81.3% |
| Cellular Data Only | 73 | 8.2% |
| Satellite Internet | 62 | 6.9% |
| No Internet | 65 | 7.3% |
| Total | 895 | 100.0% |
Hopewell Summary
HopeWell, Tennessee is a small town located in the western part of the state, about an hour and a half from Nashville. It is a rural community with a population of just over 1,000 people. The town is situated in a valley surrounded by rolling hills and is home to a variety of businesses, including a few small manufacturing companies.
The history of HopeWell dates back to the early 1800s when the area was first settled by pioneers. The town was originally known as “Hope’s Well” after the well that was dug by the settlers. The town was officially incorporated in 1845 and has remained a small, rural community ever since.
Geographically, HopeWell is located in the western part of Tennessee, about an hour and a half from Nashville. The town is situated in a valley surrounded by rolling hills and is home to a variety of businesses, including a few small manufacturing companies. The town is also home to a few small lakes, which provide recreational opportunities for residents and visitors alike.
The economy of HopeWell is largely based on agriculture and manufacturing. The town is home to several small manufacturing companies, which produce a variety of products, including furniture, clothing, and automotive parts. Agriculture is also an important part of the local economy, with many of the town’s residents working in the farming industry.
The demographics of HopeWell are largely made up of white, non-Hispanic residents. The town has a median household income of $37,000, which is slightly lower than the state average. The town also has a higher than average poverty rate, with nearly 20% of the population living below the poverty line.
HopeWell is a small, rural community with a rich history and a strong sense of community. The town is home to a variety of businesses, including a few small manufacturing companies, and is surrounded by rolling hills and small lakes. The town’s economy is largely based on agriculture and manufacturing, and the town’s demographics are largely made up of white, non-Hispanic residents. Despite its small size, HopeWell is a vibrant community with a strong sense of pride and a bright future.
Common Questions
What is Per Capita Income in Hopewell?
Per Capita income in Hopewell is $31,456.
What is the Median Family Income in Hopewell?
Median Family Income in Hopewell is $91,947.
What is the Median Household income in Hopewell?
Median Household Income in Hopewell is $90,601.
What is Inequality or Gini Index in Hopewell?
Inequality or Gini Index in Hopewell is 0.34.
What is the Total Population of Hopewell?
Total Population of Hopewell is 2,619.
What is the Total Male Population of Hopewell?
Total Male Population of Hopewell is 1,212.
What is the Total Female Population of Hopewell?
Total Female Population of Hopewell is 1,407.
What is the Ratio of Males per 100 Females in Hopewell?
There are 86.14 Males per 100 Females in Hopewell.
What is the Ratio of Females per 100 Males in Hopewell?
There are 116.09 Females per 100 Males in Hopewell.
What is the Median Population Age in Hopewell?
Median Population Age in Hopewell is 37.8 Years.
What is the Average Family Size in Hopewell
Average Family Size in Hopewell is 3.4 People.
What is the Average Household Size in Hopewell
Average Household Size in Hopewell is 2.9 People.
How Large is the Labor Force in Hopewell?
There are 1,335 People in the Labor Forcein in Hopewell.
What is the Percentage of People in the Labor Force in Hopewell?
66.0% of People are in the Labor Force in Hopewell.
What is the Unemployment Rate in Hopewell?
Unemployment Rate in Hopewell is 3.1%.