Cities with the Highest Percentage of Immigrants from Ukraine in Connecticut
RELATED REPORTS & OPTIONS
Ukraine
Connecticut
Compare Cities
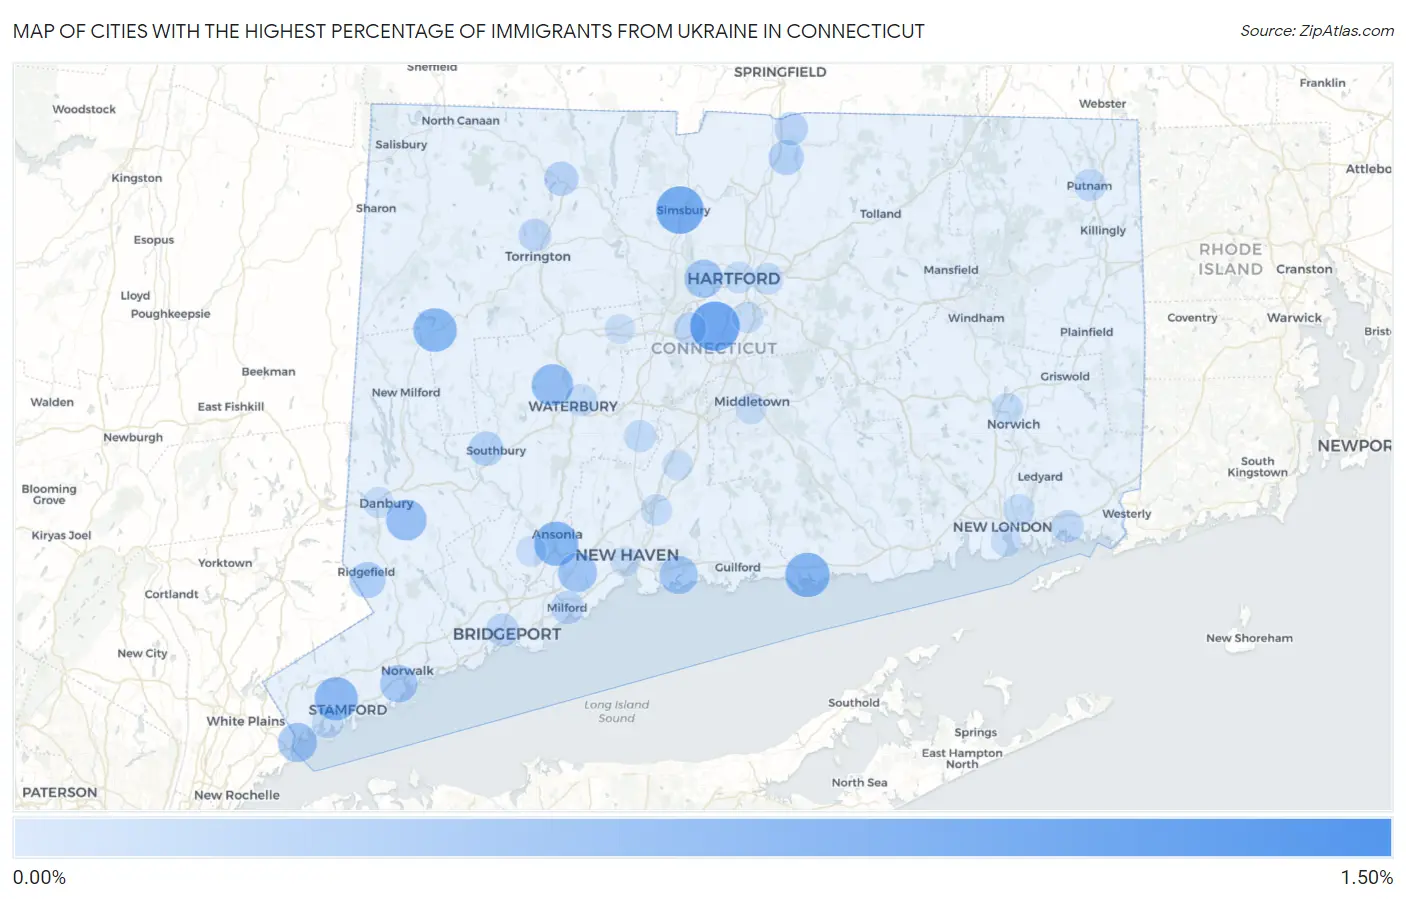
Map of Cities with the Highest Percentage of Immigrants from Ukraine in Connecticut
0.00%
1.50%
Cities with the Highest Percentage of Immigrants from Ukraine in Connecticut
| City | Ukraine | vs State | vs National | |
| 1. | Route 7 Gateway | 1.39% | 0.14%(+1.25)#1 | 0.12%(+1.27)#239 |
| 2. | Newington | 0.99% | 0.14%(+0.854)#2 | 0.12%(+0.879)#357 |
| 3. | Darien Downtown | 0.93% | 0.14%(+0.794)#3 | 0.12%(+0.819)#381 |
| 4. | Simsbury Center | 0.90% | 0.14%(+0.759)#4 | 0.12%(+0.784)#391 |
| 5. | Sandy Hook | 0.80% | 0.14%(+0.661)#5 | 0.12%(+0.686)#443 |
| 6. | Clinton | 0.74% | 0.14%(+0.598)#6 | 0.12%(+0.623)#480 |
| 7. | Derby | 0.72% | 0.14%(+0.578)#7 | 0.12%(+0.604)#494 |
| 8. | New Preston | 0.68% | 0.14%(+0.541)#8 | 0.12%(+0.566)#530 |
| 9. | Stamford | 0.66% | 0.14%(+0.524)#9 | 0.12%(+0.549)#543 |
| 10. | Oakville | 0.59% | 0.14%(+0.445)#10 | 0.12%(+0.470)#620 |
| 11. | Stepney | 0.57% | 0.14%(+0.431)#11 | 0.12%(+0.456)#635 |
| 12. | Bethel | 0.55% | 0.14%(+0.405)#12 | 0.12%(+0.430)#663 |
| 13. | Oronoque | 0.52% | 0.14%(+0.376)#13 | 0.12%(+0.401)#700 |
| 14. | Northford | 0.48% | 0.14%(+0.344)#14 | 0.12%(+0.369)#737 |
| 15. | Daniels Farm | 0.46% | 0.14%(+0.321)#15 | 0.12%(+0.346)#777 |
| 16. | Orange | 0.46% | 0.14%(+0.316)#16 | 0.12%(+0.341)#781 |
| 17. | Trumbull Center | 0.45% | 0.14%(+0.314)#17 | 0.12%(+0.339)#784 |
| 18. | Byram | 0.45% | 0.14%(+0.313)#18 | 0.12%(+0.338)#785 |
| 19. | Lakes West | 0.44% | 0.14%(+0.301)#19 | 0.12%(+0.326)#808 |
| 20. | Branford Center | 0.42% | 0.14%(+0.278)#20 | 0.12%(+0.304)#842 |
| 21. | West Hartford | 0.41% | 0.14%(+0.273)#21 | 0.12%(+0.298)#856 |
| 22. | Westport | 0.37% | 0.14%(+0.234)#22 | 0.12%(+0.259)#931 |
| 23. | Norwalk | 0.37% | 0.14%(+0.225)#23 | 0.12%(+0.250)#956 |
| 24. | Ridgefield | 0.30% | 0.14%(+0.160)#24 | 0.12%(+0.185)#1,092 |
| 25. | Southwood Acres | 0.25% | 0.14%(+0.111)#25 | 0.12%(+0.136)#1,210 |
| 26. | Woodmont Borough | 0.25% | 0.14%(+0.106)#26 | 0.12%(+0.131)#1,234 |
| 27. | Heritage Village | 0.23% | 0.14%(+0.086)#27 | 0.12%(+0.111)#1,308 |
| 28. | Winsted | 0.20% | 0.14%(+0.063)#28 | 0.12%(+0.088)#1,396 |
| 29. | Sherwood Manor | 0.17% | 0.14%(+0.034)#29 | 0.12%(+0.059)#1,521 |
| 30. | Milford City Balance | 0.15% | 0.14%(+0.011)#30 | 0.12%(+0.036)#1,624 |
| 31. | Bridgeport | 0.15% | 0.14%(+0.009)#31 | 0.12%(+0.034)#1,632 |
| 32. | New Britain | 0.14% | 0.14%(+0.003)#32 | 0.12%(+0.028)#1,662 |
| 33. | Torrington | 0.13% | 0.14%(-0.009)#33 | 0.12%(+0.017)#1,718 |
| 34. | Mystic | 0.11% | 0.14%(-0.028)#34 | 0.12%(-0.003)#1,834 |
| 35. | Putnam | 0.11% | 0.14%(-0.030)#35 | 0.12%(-0.005)#1,855 |
| 36. | Cheshire Village | 0.10% | 0.14%(-0.039)#36 | 0.12%(-0.014)#1,919 |
| 37. | Waterbury | 0.096% | 0.14%(-0.045)#37 | 0.12%(-0.020)#1,958 |
| 38. | New Canaan | 0.087% | 0.14%(-0.053)#38 | 0.12%(-0.028)#2,018 |
| 39. | Staples | 0.083% | 0.14%(-0.058)#39 | 0.12%(-0.032)#2,049 |
| 40. | East Hartford | 0.082% | 0.14%(-0.058)#40 | 0.12%(-0.033)#2,061 |
| 41. | Riverside | 0.077% | 0.14%(-0.064)#41 | 0.12%(-0.039)#2,113 |
| 42. | Hartford | 0.076% | 0.14%(-0.065)#42 | 0.12%(-0.040)#2,118 |
| 43. | Conning Towers Nautilus Park | 0.072% | 0.14%(-0.069)#43 | 0.12%(-0.044)#2,148 |
| 44. | Norwich | 0.070% | 0.14%(-0.071)#44 | 0.12%(-0.046)#2,166 |
| 45. | North Haven | 0.066% | 0.14%(-0.075)#45 | 0.12%(-0.050)#2,204 |
| 46. | Wethersfield | 0.055% | 0.14%(-0.086)#46 | 0.12%(-0.061)#2,307 |
| 47. | Danbury | 0.051% | 0.14%(-0.090)#47 | 0.12%(-0.065)#2,341 |
| 48. | Middletown | 0.050% | 0.14%(-0.091)#48 | 0.12%(-0.066)#2,358 |
| 49. | New London | 0.043% | 0.14%(-0.097)#49 | 0.12%(-0.072)#2,418 |
| 50. | Wallingford Center | 0.032% | 0.14%(-0.109)#50 | 0.12%(-0.084)#2,556 |
| 51. | Shelton | 0.027% | 0.14%(-0.114)#51 | 0.12%(-0.089)#2,616 |
| 52. | New Haven | 0.0088% | 0.14%(-0.132)#52 | 0.12%(-0.107)#2,808 |
| 53. | Bristol | 0.0082% | 0.14%(-0.133)#53 | 0.12%(-0.108)#2,815 |
1
2Common Questions
What are the Top 10 Cities with the Highest Percentage of Immigrants from Ukraine in Connecticut?
Top 10 Cities with the Highest Percentage of Immigrants from Ukraine in Connecticut are:
#1
0.99%
#2
0.90%
#3
0.74%
#4
0.72%
#5
0.68%
#6
0.66%
#7
0.59%
#8
0.55%
#9
0.46%
#10
0.45%
What city has the Highest Percentage of Immigrants from Ukraine in Connecticut?
Newington has the Highest Percentage of Immigrants from Ukraine in Connecticut with 0.99%.
What is the Percentage of Immigrants from Ukraine in the State of Connecticut?
Percentage of Immigrants from Ukraine in Connecticut is 0.14%.
What is the Percentage of Immigrants from Ukraine in the United States?
Percentage of Immigrants from Ukraine in the United States is 0.12%.